JOINT SMALL BUSINESS CREDIT SURVEY … Victoria Williams, Washington, D.C.: U.S. Small Business...
37
JOINT SMALL BUSINESS CREDIT SURVEY REPORT, 2014 Federal Reserve Banks of New York, Atlanta, Cleveland and Philadelphia 3-C
Transcript of JOINT SMALL BUSINESS CREDIT SURVEY … Victoria Williams, Washington, D.C.: U.S. Small Business...

JOINT SMALL BUSINESS CREDIT SURVEY REPORT, 2014 Federal Reserve Banks of New York, Atlanta, Cleveland and Philadelphia
3-C

2Joint Small Business Credit Survey Report, 2014 | Federal Reserve Banks of New York, Atlanta, Cleveland and Philadelphia.
TABLE OF CONTENTS
3 ACKNOWLEDGEMENTS
4 EXECUTIVE SUMMARY
5 RESPONDENT DEMOGRAPHICS
6 SMALL BUSINESS SNAPSHOT— EAST, SOUTHEAST, MIDWEST REGIONS
7 SMALL BUSINESS PERFORMANCE
8 EMPLOYMENT GROWTH
9 BUSINESS CHALLENGES
10 FINANCING AND DEBT
11 CREDIT APPLICATIONS
12 CREDIT SEARCH
13 CREDIT SOURCES
14 APPLICATION OUTCOMES
15 CREDIT PROFILES BY FIRM DEVELOPMENT STAGE
16 UNSUCCESSFUL APPLICANTS
17 FUTURE DEMAND
18 APPENDIX
18 METHODOLOGY
19 A. SELECTED CHARACTERISTICS OF FIRMS IN THE SURVEY SAMPLE
20 B. CREDIT APPLICANT CHARACTERISTICS
21 C. SELECTED DATA FOR ALL FIRMS
24 D. SELECTED DATA BY STATE
27 E. SELECTED DATA BY INDUSTRY
30 F. SELECTED DATA BY SIZE
33 G. SELECTED DATA BY FIRM DEVELOPMENT STAGE
36 H. PARTNER ORGANIZATIONS

3Joint Small Business Credit Survey Report, 2014 | Federal Reserve Banks of New York, Atlanta, Cleveland and Philadelphia.
ACKNOWLEDGEMENTS
The Federal Reserve Banks of New York, Atlanta, Cleveland and Philadelphia would like to thank the civic and community partners in our Districts that assist in distributing the Small Business Credit Survey (SBCS). For a complete list of partners, please see the Appendix. We also wish to thank the National Opinion Research Center (NORC) at the University of Chicago for its review of the SBCS survey questionnaire and its assistance in the weighting methodology that is used to make the SBCS statistically representative. Further information about the survey methodology is available in the Appendix.
4Joint Small Business Credit Survey Report, 2014 | Federal Reserve Banks of New York, Atlanta, Cleveland and Philadelphia.
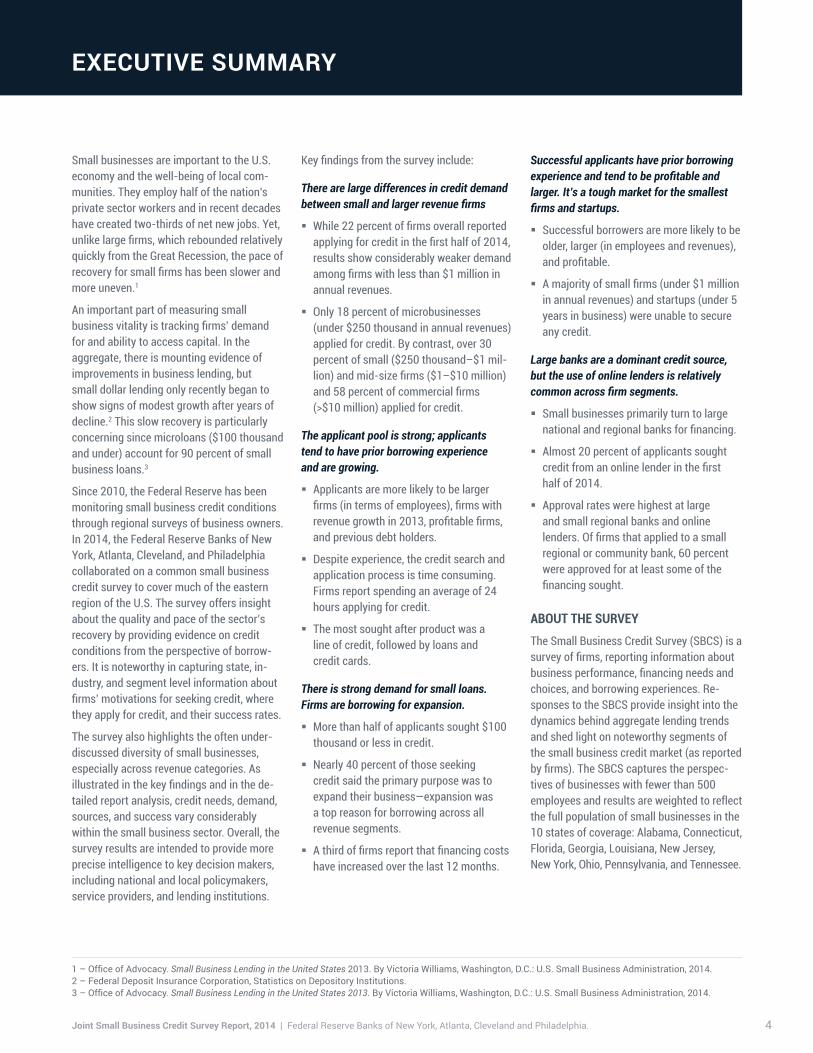
EXECUTIVE SUMMARY
Small businesses are important to the U.S. economy and the well-being of local com-munities. They employ half of the nation’s private sector workers and in recent decades have created two-thirds of net new jobs. Yet, unlike large firms, which rebounded relatively quickly from the Great Recession, the pace of recovery for small firms has been slower and more uneven.1
An important part of measuring small business vitality is tracking firms’ demand for and ability to access capital. In the aggregate, there is mounting evidence of improvements in business lending, but small dollar lending only recently began to show signs of modest growth after years of decline.2 This slow recovery is particularly concerning since microloans ($100 thousand and under) account for 90 percent of small business loans.3
Since 2010, the Federal Reserve has been monitoring small business credit conditions through regional surveys of business owners. In 2014, the Federal Reserve Banks of New York, Atlanta, Cleveland, and Philadelphia collaborated on a common small business credit survey to cover much of the eastern region of the U.S. The survey offers insight about the quality and pace of the sector’s recovery by providing evidence on credit conditions from the perspective of borrow-ers. It is noteworthy in capturing state, in-dustry, and segment level information about firms’ motivations for seeking credit, where they apply for credit, and their success rates.
The survey also highlights the often under-discussed diversity of small businesses, especially across revenue categories. As illustrated in the key findings and in the de-tailed report analysis, credit needs, demand, sources, and success vary considerably within the small business sector. Overall, the survey results are intended to provide more precise intelligence to key decision makers, including national and local policymakers, service providers, and lending institutions.
Key findings from the survey include:
There are large differences in credit demand between small and larger revenue firms
� While 22 percent of firms overall reported applying for credit in the first half of 2014, results show considerably weaker demand among firms with less than $1 million in annual revenues.
� Only 18 percent of microbusinesses (under $250 thousand in annual revenues) applied for credit. By contrast, over 30 percent of small ($250 thousand–$1 mil-lion) and mid-size firms ($1–$10 million) and 58 percent of commercial firms (>$10 million) applied for credit.
The applicant pool is strong; applicants tend to have prior borrowing experience and are growing.
� Applicants are more likely to be larger firms (in terms of employees), firms with revenue growth in 2013, profitable firms, and previous debt holders.
� Despite experience, the credit search and application process is time consuming. Firms report spending an average of 24 hours applying for credit.
� The most sought after product was a line of credit, followed by loans and credit cards.
There is strong demand for small loans. Firms are borrowing for expansion.
� More than half of applicants sought $100 thousand or less in credit.
� Nearly 40 percent of those seeking credit said the primary purpose was to expand their business—expansion was a top reason for borrowing across all revenue segments.
� A third of firms report that financing costs have increased over the last 12 months.
Successful applicants have prior borrowing experience and tend to be profitable and larger. It’s a tough market for the smallest firms and startups.
� Successful borrowers are more likely to be older, larger (in employees and revenues), and profitable.
� A majority of small firms (under $1 million in annual revenues) and startups (under 5 years in business) were unable to secure any credit.
Large banks are a dominant credit source, but the use of online lenders is relatively common across firm segments.
� Small businesses primarily turn to large national and regional banks for financing.
� Almost 20 percent of applicants sought credit from an online lender in the first half of 2014.
� Approval rates were highest at large and small regional banks and online lenders. Of firms that applied to a small regional or community bank, 60 percent were approved for at least some of the financing sought.
ABOUT THE SURVEY The Small Business Credit Survey (SBCS) is a survey of firms, reporting information about business performance, financing needs and choices, and borrowing experiences. Re-sponses to the SBCS provide insight into the dynamics behind aggregate lending trends and shed light on noteworthy segments of the small business credit market (as reported by firms). The SBCS captures the perspec-tives of businesses with fewer than 500 employees and results are weighted to reflect the full population of small businesses in the 10 states of coverage: Alabama, Connecticut, Florida, Georgia, Louisiana, New Jersey, New York, Ohio, Pennsylvania, and Tennessee.
1 – Office of Advocacy. Small Business Lending in the United States 2013. By Victoria Williams, Washington, D.C.: U.S. Small Business Administration, 2014.2 – Federal Deposit Insurance Corporation, Statistics on Depository Institutions.3 – Office of Advocacy. Small Business Lending in the United States 2013. By Victoria Williams, Washington, D.C.: U.S. Small Business Administration, 2014.

5Joint Small Business Credit Survey Report, 2014 | Federal Reserve Banks of New York, Atlanta, Cleveland and Philadelphia.
RESPONDENT DEMOGRAPHICS
GEOGRAPHIC DISTRIBUTION
State Respondents Small business population*
Alabama 4% 4%Connecticut 5% 4%Florida 7% 22%Georgia 12% 10%Louisiana 1% 4%New Jersey 6% 9%New York 33% 21%Ohio 11% 10%Pennsylvania 19% 11%Tennessee 3% 6%Total 100% 100%
AGE
40%
30
20
10
YEARS0–5 6–10 11–20 20+
0
80%
60
40
20
SELF-EMPLOYED 1–9 10–49 50–4990
EMPLOYEES
EMPLOYER FIRMS
INDUSTRY
20%151050
Leisure and Hospitality
Other
Education/Healthcare and Social Assistance
Personal Services
Professional and Business Services
Finance/Insurance/ Real Estate
Information/Media/ Telecommunications
Wholesale/ Transportation
Retail
Manufacturing
Construction
Agriculture
Respondents Small business population
N=2014
* Small Business Population Source: Age data are from the US Census Business Dynamics Statistics, 2012. All other data are from US Census Bureau Survey of Business Owners, 2007. Coverage area includes Alabama, Connecticut, Florida, Georgia, Louisiana, New Jersey, New York, Ohio, Pennsylvania and Tennessee.

6Joint Small Business Credit Survey Report, 2014 | Federal Reserve Banks of New York, Atlanta, Cleveland and Philadelphia.
SMALL BUSINESS SNAPSHOT— EAST, SOUTHEAST, MIDWEST REGIONS
Profitable
Increasing revenues
BUSINESS CONDITIONS
Top business challenge
23% difficulty attracting customers
18% lack of credit availability
18% uneven cash flow
13% increasing costs of running business
54% were approved
33% were fully funded
Top reason given for credit denial:
45% low credit score
APPLICATION OUTCOMES
22% applied for credit, of those:
72% sought less than $250K
28% sought more than $250K
24 average number of hours researching and completing financing applications
20% were too discouraged to apply
CREDIT APPLICATIONS
Top 3 primary funding types:
29% personal savings
23% retained business earnings
19% credit cards
42% had outstanding debt
FINANCING CONDITIONS
35% of firms
35% of firms
Application rate
Approval rate
Large national bank
35%
31%
Large regional bank
41%
45%
Small regional or community bank
34%
59%
Online lender 18% 38%
CREDIT SOURCES

7Joint Small Business Credit Survey Report, 2014 | Federal Reserve Banks of New York, Atlanta, Cleveland and Philadelphia.
SMALL BUSINESS PERFORMANCE
REVENUE CHANGE (% of firms) N=1994
How did revenue change over the past 12 months?
35%Increased
30%Decreased
35%No change
PROFITABILITY (% of firms) N=1987
In the first half of 2014, did your business operate at a profit, break even, or at a loss?
35%Operated at a profit
26%Broke even
39%Operated at a loss

8Joint Small Business Credit Survey Report, 2014 | Federal Reserve Banks of New York, Atlanta, Cleveland and Philadelphia.
EMPLOYMENT GROWTH
FULL-TIME AND PART-TIME EMPLOYEES (% of firms) N=1380
How did employment change over the past 12 months?
GROWTH BY PROFITABILITY N=419
Profitability status % Added full-time employees
Operated at a profit 33%
Broke even 25%
Operated at a loss 11%
No change
58%
15%
27%Increased
Decreased
No change
63%
13%24%
IncreasedDecreased
Part-time employeesFull-time employees

9Joint Small Business Credit Survey Report, 2014 | Federal Reserve Banks of New York, Atlanta, Cleveland and Philadelphia.
BUSINESS CHALLENGES
TOP CHALLENGE (% of firms) N=1923
Rank Challenge % of firms
1 Difficulty attracting customers 23%
2 Lack of credit availability 18%
3 Uneven cash flow 18%
4 Increased costs of running business 13%
5 Complying with government regulations 8%
Which TOP challenge, if any, did your business experience in the first half of 2014?
TOP CHALLENGE BY FIRM DEVELOPMENT STAGE*
Which TOP challenge, if any, did your business experience in the first half of 2014?
Startups <5 years in business
Growers Profitable and increased revenues
Mature >5 years in business, 10+ employees, holds debt
1. Lack of credit availability2. Difficulty attracting customers3. Uneven cash flow
1. Uneven cash flow2. Lack of credit availability3. Difficulty hiring and/or
retaining employees
1. Uneven cash flow2. Increased costs of
running business3. Lack of credit availability
N=598 N=550 N=431
* Not mutually exclusive

10Joint Small Business Credit Survey Report, 2014 | Federal Reserve Banks of New York, Atlanta, Cleveland and Philadelphia.
FINANCING AND DEBT
FINANCING CONDITIONS BY FIRM SIZE N=1931
All firms Microbusiness (<$250K)
Small ($250K–$1M)
Mid-size ($1–$10M)
Commercial (>$10M)
Primary funding type* Select the primary type of funding used by your business in 2013
Personal savings
Personal savings
Retained business earnings
Line of credit
Retained business earnings
Increased financing costsHow have your business’s financing costs changed over the past 12 months?
32% 33% 35% 15% 25%
* Denotes mode
3% were unsure
AMOUNT OF DEBT(% firms with outstanding debt) N=1131
How much total debt did your business have as of December 31, 2013?
< $10k $10–25K $25–50K $50–100K $100–250K $250–500K $500K–$1M $1M–$2M >$2M
18%
23%20%
10%6%
10%6%
1%3%
of firms had outstanding debt42%

11Joint Small Business Credit Survey Report, 2014 | Federal Reserve Banks of New York, Atlanta, Cleveland and Philadelphia.
CREDIT APPLICATIONS
CREDIT APPLICATION RATE BY FIRM SIZE (% of firms) N=1910
Did your business APPLY for any financing during the first half of 2014?
Microbusiness (<$250K)
Small($250k–$1M)
Mid-size ($1M–$10M)
Commercial (>$10M)
18% 32% 31% 58%
AMOUNT OF FINANCING SOUGHT BY FIRM SIZE* (% of applicants) N=587
How much total financing did your business apply for in the first half of 2014?
Microbusiness (<$250k) 80% 6% 4% 9%
Small ($250k–$1M)
Commercial (>$10M) 17% 4% 5% 43% 31%
Mid-size ($1M–$10M) 24% 18% 31% 24% 3%
All firms
47% 25% 18% 8% 1%
62% 11% 10% 13% 3% 2%
<$100K $100–250K $250K–500K $500K–2M Over $2M Not sure
* Values may not sum to 100% because of rounding
of all firms applied for credit22%

12Joint Small Business Credit Survey Report, 2014 | Federal Reserve Banks of New York, Atlanta, Cleveland and Philadelphia.
CREDIT SEARCH
TOP 3 PRIMARY REASONS FOR SEEKING FINANCING N=588
For what primary purpose was your business seeking financing in the first half of 2014?
Microbusiness (<$250K) Small ($250k–$1M) Mid-size ($1M–$10M) Commercial (>$10M)
1. Expand business2. Fund day-to-day
operations3. Refinance or pay
down debt
1. Refinance or pay down debt
2. Replace capital assets3. Expand business
1. Expand business2. Fund day-to-day
operations3. Refinance or pay
down debt
1. Expand business2. Replace capital assets3. Fund day-to-day
operations
CREDIT PRODUCTS SOUGHT—ALL FIRMS* (% of applicants) N=598
Which types of financing products did your business apply for in the first half of 2014? Select all that apply.
Line of credit 46%
Credit card 27%
SBA loan 23%
Commercial mortgage 18%
Debt consolidation loan or refinance 15%
12%Trade credit
Leasing 10%
SBA line of credit 10%
Equity investment 4%
34%Business loan
* Percentages add up to >100% because firms apply to more than one product.
hours spent researching and applying for credit on average24

13Joint Small Business Credit Survey Report, 2014 | Federal Reserve Banks of New York, Atlanta, Cleveland and Philadelphia.
CREDIT SOURCES
CREDIT SOURCES APPLIED TO BY FIRM SIZE* (% of applicants) N=588
Select the credit source(s) your business submitted an application to.
Large national bank Large regional bank Small regional or community bank
Online lender
All firms
35%41%
34%18%
Mid-size ($1M–$10M)
23%43%
42%1%
Commercial (>$10M)
32%17%
44%18%
Microbusiness (<$250k)
33%37%
30%18%
Small ($250k–$1M)
53%60%
36%19%
* For loans, lines of credit, debt consolidation loans or refinancing, and commercial mortgages only. Percentages add up to >100% because firms apply to more than one source.

14Joint Small Business Credit Survey Report, 2014 | Federal Reserve Banks of New York, Atlanta, Cleveland and Philadelphia.
How much of the financing your business applied for in the first half of 2014 was approved?
APPLICATION OUTCOMES
APPROVAL RATE BY PRODUCT FOR ALL FIRMS– N=598 RECEIVED AT LEAST SOME CREDIT (% of applicants)
61%Loan
50%Trade credit
50%Credit card
49%Leasing
46%Debt consolidation loan or refinance
36%Commercial mortgage
33%SBA loan
28%SBA line of credit
8%Equity Investment
53%Line of credit
CREDIT APPLICATION OUTCOMES (% of applicants) N=598
All firms Microbusiness (<$250K)
Small ($250K–$1M)
Mid-size* ($1–$10M)
Commercial (>$10M)
Received all 33% 25% 36% 60% 70%
Received most (>=50%) 9% 11% 4% 6% 10%
Received some (<50%) 12% 11% 10% 12% 0%
Received none 44% 52% 50% 14% 20%
Values may not sum to 100% because of rounding
* 7% of mid-size applicants were unsure

15Joint Small Business Credit Survey Report, 2014 | Federal Reserve Banks of New York, Atlanta, Cleveland and Philadelphia.
All firms Startups <5 years in business
Growers Profitable and
increased revenues
Mature >5 years in business,
10+ employees, holds debt
N=1286 N=594 N=552 N=430
CREDIT APPLICATION RATE BY SOURCE (% of applicants)
Large bank 35% 36% 29% 34%
Regional bank 41% 41% 48% 44%
Small regional or community bank 34% 31% 41% 25%
Online lender 18% 22% 8% 3%
APPROVAL RATE BY SOURCE— RECEIVED AT LEAST SOME CREDIT (% of applicants by source)
Large bank 31% N/A** 53% 87%
Regional bank 45% N/A** 51% 94%
Small regional or community bank 59% N/A** 90% 85%
Online lender 38% N/A** 46% 48%
CREDIT PROFILES BY FIRM DEVELOPMENT STAGE
SOURCE OF CREDIT*
* For loans, lines of credit, debt consolidation loans or refinancing, and commercial mortgages only.
** Too few observations to calculate Startups’ approval rate.

16Joint Small Business Credit Survey Report, 2014 | Federal Reserve Banks of New York, Atlanta, Cleveland and Philadelphia.
UNSUCCESSFUL APPLICANTS
REASON FOR DENIAL (% of applicants not receiving full amount) N=335
What were the likely reasons your business did not receive the full amount of financing it applied for in the first half of 2014?
1. Low credit score 45%
2. Insufficient collateral 30%
3. Weak business performance 23%
4. Weak/missing financial documents 14%
5. No relationship with lender 14%
IMPACT OF DENIAL (% of applicants not receiving full amount) N=326
What was the most important business impact, if any, of not receiving the full amount of financing for which your business applied?
1. Delayed business expansion 47%
2. Used personal sources of funding 20%
3. Prevented ability to fulfill existing orders 12%
4. Did not hire new employees 6%
5. No impact 3%
ACTIONS TAKEN TO IMPROVE CREDIT WORTHINESS N=335 (% of applicants not receiving full amount)
What, if anything, did your business do to improve its ability to obtain financing in the first half of 2014?
1. Contacted new/more financial institutions 57%
2. Paid down debt 41%
3. Explored online financing sources 33%
4. Consulted business advisor 32%
5. Did not take any actions 7%
17Joint Small Business Credit Survey Report, 2014 | Federal Reserve Banks of New York, Atlanta, Cleveland and Philadelphia.
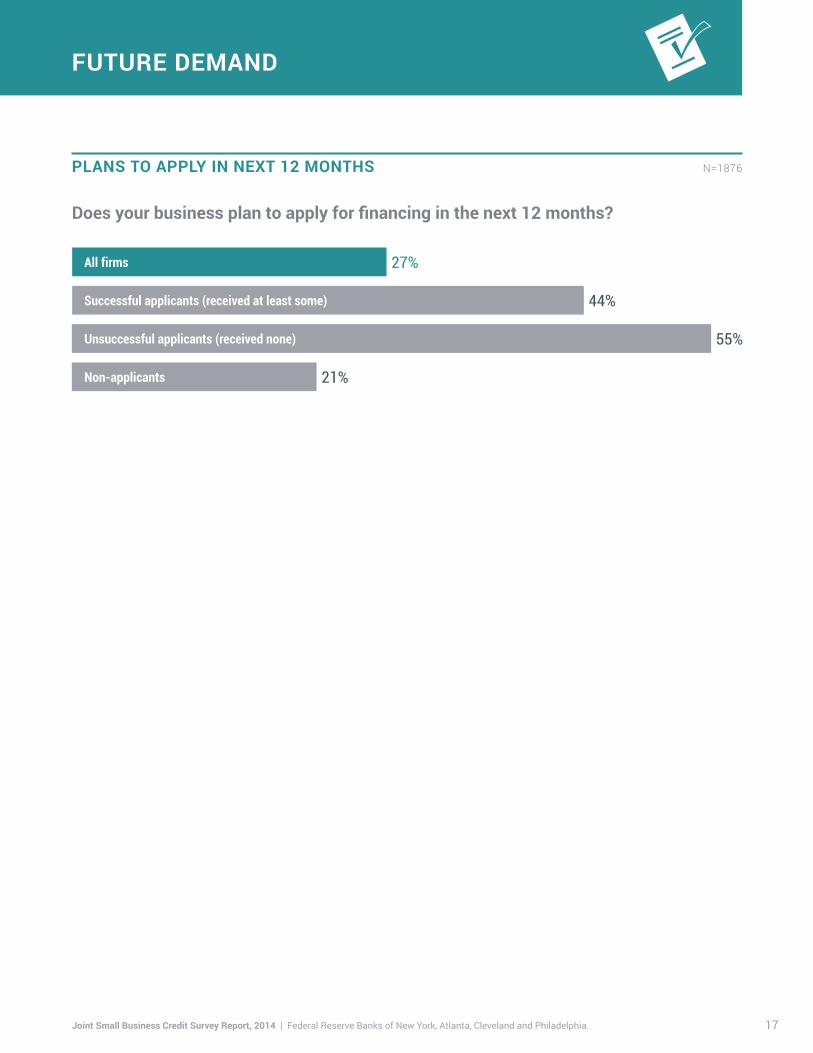
FUTURE DEMAND
PLANS TO APPLY IN NEXT 12 MONTHS N=1876
Does your business plan to apply for financing in the next 12 months?
All firms 27%
Unsuccessful applicants (received none) 55%
Non-applicants 21%
44%Successful applicants (received at least some)
18Joint Small Business Credit Survey Report, 2014 | Federal Reserve Banks of New York, Atlanta, Cleveland and Philadelphia.
APPENDIX
METHODOLOGY
OVERVIEW
The Small Business Credit Survey (SBCS) is an establishment convenience survey conducted by the Federal Reserve Banks of New York, Atlanta, Cleveland, and Philadelphia. The SBCS captures the per-spectives of businesses with fewer than 500 employees in Alabama, Connecticut, Florida, Georgia, Louisiana, New Jersey, New York, Ohio, Pennsylvania, and Tennessee. The SBCS reports information
needs and choices, and borrowing experiences.
survey between September 9, 2014 and November 7, 2014. The number of responses to each individual question varied depending on relevance. We weighted results to rthe full population of small businesses in the 10 states of coverage along the dimensions of industry, age, employee size, and geography.
SAMPLE DESIGN
The SBCS questionnaire is an online survey distributed by more than 80 partner organizations. Partners contact businesses on their membership lists, asking them to participate in the survey provided through a URL address. The SBCS is not a random sample; therefore results should not be interpreted as a statistical representation of small businesses in the coverage area or the nation. Rather, the results should be viewed as suggestive and analyzed with awareness of potential methodological biases.
WEIGHTING
To reduce coverage bias, we use data from the US Census Bureau4 to weight responses along the dimensions of industry, age, employee size, and geography. Survey weights are derived to allow estimates to be generated from the sample so as to represent the true small business population. For example, by reweighting our data, we correct for the overrepresentation of older
-butions of the 2014 SBCS after weighting.
4 – Age data from US Census Business Dynamics Statistics, 2012. All other data from US Census Bureau Survey of Business Owners, 2007.

19Joint Small Business Credit Survey Report, 2014 | Federal Reserve Banks of New York, Atlanta, Cleveland and Philadelphia.
APPENDIX (CONTINUED)
A. SELECTED CHARACTERISTICS OF FIRMS IN THE SURVEY SAMPLE
Sample size Sample distribution after weighting
Percentage of total for weighted sample
FIRM AGE0–5 years 626 3,556,014 39%6–10 years 341 1,892,736 21%11–20 years 405 2,090,607 23%20+ years 642 1,592,438 17%All firm ages 2,014 9,131,796 100%ALL FIRM AGESSelf-employed 628 7,207,554 79%1–9 employees 715 1,519,265 17%10–49 employees 513 323,056 4%50–499 employees 158 81,920 1%All firm sizes 2,014 9,131,796 100%GEOGRAPHY Alabama 79 380,125 4%Connecticut 105 330,150 4%Florida 139 2,005,285 22%Georgia 234 897,238 10%Louisiana 25 373,793 4%New Jersey 114 778,443 9%New York 656 1,952,566 21%Ohio 231 894,247 10%Pennsylvania 380 977,567 11%Tennessee 51 542,382 6%All geographies 2,014 9,131,796 100%INDUSTRY Agriculture 12 65,673 1%Construction 235 1,124,833 12%Manufacturing 230 192,790 2%Retail 206 875,987 10%Wholesale/Transportation 122 719,244 8%Information/Media/Telecommunications 74 127,137 1%Finance/Insurance/Real Estate 159 1,251,566 14%Professional and Business Services 398 1,244,764 14%Personal Services 106 1,061,183 12%Education/Healthcare and Social Assistance 154 1,003,811 11%Leisure and Hospitality 158 684,321 7%Other 160 780,488 9%All industries 2,014 9,131,796 100%

20Joint Small Business Credit Survey Report, 2014 | Federal Reserve Banks of New York, Atlanta, Cleveland and Philadelphia.
B. CREDIT APPLICANT CHARACTERISTICS
Credit applicants All firms Applicants Successful applicants Received at least some
Unsuccessful applicants
Received none
Non-applicants
N =1912 N=598 N=384 N=191 N=1288
AGE0–5 38% 39% 27% 51% 39%6–10 21% 23% 28% 19% 20%11–20 22% 22% 21% 24% 22%20+ 18% 16% 24% 6% 19%
100% 100% 100% 100% 100%
EMPLOYEESSelf employed 78% 67% 54% 80% 81%1–9 employees 17% 22% 27% 19% 16%10–49 employees 4% 8% 15% 1% 3%49+ employees 1% 3% 5% 0% 1%
100% 100% 100% 100% 100%PROFITABILITY
Operated at a profit 35% 49% 65% 27% 31%Broke even 26% 24% 16% 37% 27%Operated at a loss 39% 27% 19% 36% 42%
100% 100% 100% 100% 100%REVENUE CHANGEIncreased 35% 52% 64% 35% 31%No change 35% 26% 23% 28% 37%Decreased 30% 22% 13% 36% 32%
100% 100% 100% 100% 100%FULL TIME EMPLOYEE CHANGEIncreased 27% 40% 39% 46% 22%No change 58% 45% 50% 31% 63%Decreased 15% 15% 12% 24% 15%
100% 100% 100% 100% 100%HAS OUTSTANDING DEBT 42% 60% 60% 61% 37%PLAN TO APPLY IN NEXT 12 MONTHS 27% 49% 44% 55% 21%
Number of observations are unweighted counts. All other values are weighted. See SBCS methodology for details. Values may not sum to 100% due to rounding.
APPENDIX (CONTINUED)
21Joint Small Business Credit Survey Report, 2014 | Federal Reserve Banks of New York, Atlanta, Cleveland and Philadelphia.
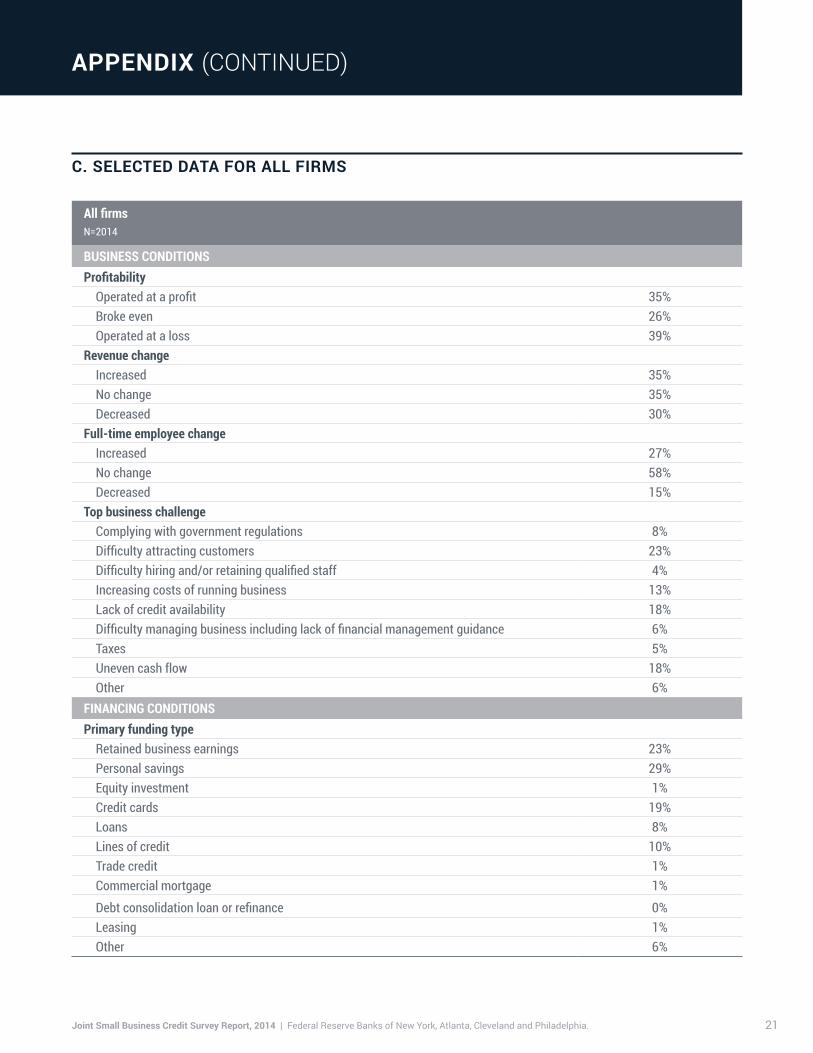
C. SELECTED DATA FOR ALL FIRMS
All firmsN=2014
BUSINESS CONDITIONSProfitability
Operated at a profit 35%Broke even 26%Operated at a loss 39%
Revenue changeIncreased 35%No change 35%Decreased 30%
Full-time employee changeIncreased 27%No change 58%Decreased 15%
Top business challengeComplying with government regulations 8%Difficulty attracting customers 23%Difficulty hiring and/or retaining qualified staff 4%Increasing costs of running business 13%Lack of credit availability 18%Difficulty managing business including lack of financial management guidance 6%Taxes 5%Uneven cash flow 18%Other 6%
FINANCING CONDITIONSPrimary funding type
Retained business earnings 23%Personal savings 29%Equity investment 1%Credit cards 19%Loans 8%Lines of credit 10%Trade credit 1%Commercial mortgage 1%
Debt consolidation loan or refinance 0%Leasing 1%Other 6%
APPENDIX (CONTINUED)

22Joint Small Business Credit Survey Report, 2014 | Federal Reserve Banks of New York, Atlanta, Cleveland and Philadelphia.
C. SELECTED DATA FOR ALL FIRMS (CONTINUED)
All firmsN=2014
FINANCING CONDITIONS (CONTINUED)Change in debt financing costs
Lower 6%Stayed the same 41%Higher 32%Business does not use external financing 21%
Has outstanding debt Yes 42%No 57%Not sure 1%
Amount of outstanding debt <$250k 77%>$250k 20%Not sure 3%
CREDIT DEMANDApplied for financing (first half of 2014)
Applied 22%Did not apply 77%Not sure 1%
Application rate by product Loan 34%SBA loan 23%Line of credit 46%SBA line of credit 10%Equity investment 4%Credit cards 27%Commercial mortgage 18%Debt consolidation loan or refinance 15%Trade credit 12%Leasing 10%Other 10%
Application rate by sourceLarge national bank 35%Large regional bank 41%Small regional or community bank 34%Online lender 18%Other 18%
APPENDIX (CONTINUED)
23Joint Small Business Credit Survey Report, 2014 | Federal Reserve Banks of New York, Atlanta, Cleveland and Philadelphia.
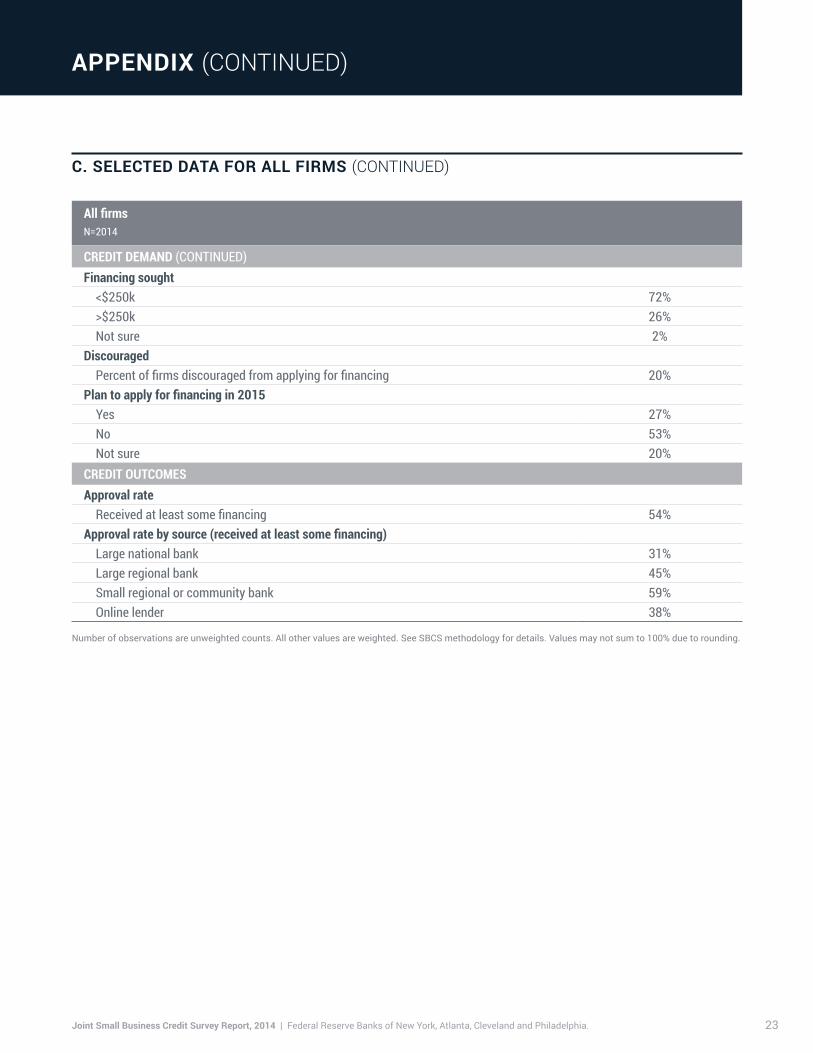
C. SELECTED DATA FOR ALL FIRMS (CONTINUED)
All firmsN=2014
CREDIT DEMAND (CONTINUED)Financing sought
<$250k 72%>$250k 26%Not sure 2%
DiscouragedPercent of firms discouraged from applying for financing 20%
Plan to apply for financing in 2015Yes 27%No 53%Not sure 20%
CREDIT OUTCOMESApproval rate
Received at least some financing 54%Approval rate by source (received at least some financing)
Large national bank 31%Large regional bank 45%Small regional or community bank 59%Online lender 38%
Number of observations are unweighted counts. All other values are weighted. See SBCS methodology for details. Values may not sum to 100% due to rounding.
APPENDIX (CONTINUED)

24Joint Small Business Credit Survey Report, 2014 | Federal Reserve Banks of New York, Atlanta, Cleveland and Philadelphia.
D. SELECTED DATA BY STATE
State GA NY OH PAN=234 N=656 N=231 N=380
BUSINESS CONDITIONSProfitability
Operated at a profit 28% 32% 50% 47%Broke even 31% 20% 22% 20%Operated at a loss 41% 48% 28% 33%
Revenue changeIncreased 37% 33% 55% 48%No change 32% 32% 21% 32%Decreased 31% 35% 25% 21%
Full-time employee changeIncreased 30% 26% 21% 24%No change 53% 58% 66% 62%Decreased 17% 16% 13% 14%
Top business challengeComplying with government regulations 2% 10% 4% 6%Difficulty attracting customers 16% 25% 26% 19%Difficulty hiring and/or retaining qualified staff 4% 10% 7% 6%Increasing costs of running business 16% 11% 14% 10%Lack of credit availability 31% 15% 9% 23%Difficulty managing business including lack of financial management guidance 7% 3% 11% 4%Taxes 8% 4% 8% 8%Uneven cash flow 13% 19% 16% 15%Other 4% 3% 5% 8%
FINANCING CONDITIONSPrimary funding type
Retained business earnings 24% 27% 24% 21%Personal savings 36% 29% 29% 24%Equity investment 3% 3% 1% 4%Credit cards 14% 16% 14% 17%Loans 6% 8% 10% 7%Lines of credit 3% 13% 10% 17%Trade credit 6% 2% 4% 1%Commercial mortgage 2% 0% 2% 4%Debt consolidation loan or refinance 1% 0% 0% 0%Leasing 0% 0% 4% 0%Other 5% 1% 3% 6%
APPENDIX (CONTINUED)

25Joint Small Business Credit Survey Report, 2014 | Federal Reserve Banks of New York, Atlanta, Cleveland and Philadelphia.
D. SELECTED DATA BY STATE (CONTINUED)
State GA NY OH PAN=234 N=656 N=231 N=380
FINANCING CONDITIONS (CONTINUED)Change in debt financing costs
Lower 8% 4% 2% 7%Stayed the same 27% 31% 47% 41%Higher 36% 44% 18% 30%Business does not use external 29% 21% 32% 22%
Has outstanding debt Yes 30% 37% 43% 48%No 68% 56% 57% 51%Not sure 2% 7% 0% 2%
Amount of outstanding debt <$250k 83% 87% 89% 74%>$250k 13% 11% 10% 24%Not sure 4% 2% 1% 2%
CREDIT DEMANDApplied for financing (first half of 2014)
Applied 25% 25% 21% 33%Did not apply 73% 74% 75% 67%Not sure 2% 1% 4% 1%
Application rate by product Loan 32% 33% 46% 35%SBA loan 36% 15% 12% 13%Line of credit 53% 49% 42% 50%SBA line of credit 8% 13% 17% 15%Equity investment 3% 3% 3% 6%Credit cards 37% 31% 27% 28%Commercial mortgage 9% 7% 18% 20%Debt consolidation loan or refinance 6% 8% 12% 23%Trade credit 17% 7% 7% 7%Leasing 16% 2% 15% 7%Other 6% 9% 2% 9%
Application rate by sourceLarge national bank 41% 36% 35% 30%Large regional bank 50% 16% 33% 37%Small regional or community bank 47% 25% 38% 47%Online lender 38% 15% 9% 29%Other 38% 26% 20% 26%
APPENDIX (CONTINUED)

26Joint Small Business Credit Survey Report, 2014 | Federal Reserve Banks of New York, Atlanta, Cleveland and Philadelphia.
D. SELECTED DATA BY STATE (CONTINUED)
State GA NY OH PAN=234 N=656 N=231 N=380
CREDIT DEMAND (CONTINUED)Financing sought
<$250k 86% 90% 91% 84%>$250k 14% 10% 8% 16%Not sure 0% 0% 0% 0%
DiscouragedPercent of firms discouraged from applying for financing 22% 26% 11% 16%
Plan to apply for financing in 2015Yes 32% 40% 30% 32%No 37% 40% 51% 48%Not sure 31% 20% 19% 21%
CREDIT OUTCOMESApproval rate
Received at least some financing 37% 60% 61% 56%Approval rate by source (received at least some financing)
Large national bank 31% 47% 72% 20%Large regional bank 52% 28% 54% 27%Small regional or community bank 30% 38% 68% 31%Online lender 28% 77% 4% 17%
Number of observations are unweighted counts. All other values are weighted. See SBCS methodology for details. Values may not sum to 100% due to rounding.
APPENDIX (CONTINUED)

27Joint Small Business Credit Survey Report, 2014 | Federal Reserve Banks of New York, Atlanta, Cleveland and Philadelphia.
E. SELECTED DATA BY INDUSTRY
Industry Construction Manufacturing Professional and business
services
Retail
N=235 N=230 N=398 N=206
BUSINESS CONDITIONSProfitability
Operated at a profit 41% 51% 45% 27%Broke even 24% 10% 18% 15%Operated at a loss 35% 39% 36% 59%
Revenue changeIncreased 27% 49% 40% 35%No change 38% 29% 22% 25%Decreased 35% 22% 37% 40%
Full-time employee changeIncreased 42% 13% 31% 10%No change 42% 77% 63% 86%Decreased 35% 22% 37% 40%
Top business challengeComplying with government regulations 7% 14% 8% 2%Difficulty attracting customers 10% 7% 26% 27%Difficulty hiring and/or retaining qualified staff 7% 2% 5% 2%Increasing costs of running business 27% 14% 8% 15%Lack of credit availability 18% 38% 10% 16%Difficulty managing business including lack of financial management guidance 5% 3% 1% 4%Taxes 3% 14% 4% 11%Uneven cash flow 17% 7% 36% 21%Other 6% 0% 3% 2%
FINANCING CONDITIONSPrimary funding type
Retained business earnings 27% 7% 33% 10%Personal savings 17% 29% 35% 31%Equity investment 3% 2% 1% 0%Credit cards 19% 15% 11% 32%Loans 8% 16% 5% 10%Lines of credit 10% 23% 10% 10%Trade credit 9% 2% 0% 2%Commercial mortgage 1% 0% 0% 1%Debt consolidation loan or refinance 0% 4% 1% 0%Leasing 2% 0% 0% 0%Other 5% 1% 4% 4%
APPENDIX (CONTINUED)

28Joint Small Business Credit Survey Report, 2014 | Federal Reserve Banks of New York, Atlanta, Cleveland and Philadelphia.
E. SELECTED DATA BY INDUSTRY (CONTINUED)
Industry Construction Manufacturing Professional and business
services
Retail
N=235 N=230 N=398 N=206
FINANCING CONDITIONS (CONTINUED)Change in debt financing costs
Lower 9% 11% 10% 2%Stayed the same 37% 46% 46% 50%Higher 33% 23% 25% 30%Business does not use external 21% 21% 19% 17%
Has outstanding debt Yes 50% 65% 27% 40%No 49% 35% 73% 58%Not sure 1% 0% 0% 2%
Amount of outstanding debt <$250k 74% 79% 96% 96%>$250k 26% 21% 4% 3%Not sure 0% 1% 0% 0%
CREDIT DEMANDApplied for financing (first half of 2014)
Applied 30% 26% 10% 19%Did not apply 70% 74% 90% 81%Not sure 0% 0% 0% 0%
Application rate by product Loan 47% 37% 24% 45%SBA loan 11% 59% 15% 27%Line of credit 64% 26% 67% 55%SBA line of credit 5% 0% 16% 4%Equity investment 0% 0% 8% 5%Credit cards 18% 23% 15% 10%Commercial mortgage 10% 5% 10% 2%Debt consolidation loan or refinance 9% 22% 9% 10%Trade credit 24% 0% 0% 30%Leasing 2% 2% 0% 4%Other 35% 13% 4% 20%
Application rate by sourceLarge national bank 36% 56% 23% 40%Large regional bank 49% 21% 62% 18%Small regional or community bank 46% 32% 26% 42%Online lender 20% 6% 19% 15%Other 16% 15% 14% 15%
APPENDIX (CONTINUED)

29Joint Small Business Credit Survey Report, 2014 | Federal Reserve Banks of New York, Atlanta, Cleveland and Philadelphia.
E. SELECTED DATA BY INDUSTRY (CONTINUED)
Industry Construction Manufacturing Professional and business
services
Retail
N=235 N=230 N=398 N=206
CREDIT DEMAND (CONTINUED)Financing sought
<$250k 52% 65% 89% 83%>$250k 48% 34% 11% 16%Not sure 0% 0% 0% 1%
DiscouragedPercent of firms discouraged from applying for financing 35% 19% 23% 27%
Plan to apply for financing in 2015Yes 44% 30% 28% 22%No 47% 39% 41% 66%Not sure 9% 31% 31% 11%
CREDIT OUTCOMESApproval rate
Received at least some financing 66% 42% 64% 52%Approval rate by source (received at least some financing)
Large national bank 29% 29% 14% 77%Large regional bank 40% 73% 70% 18%Small regional or community bank 80% 32% 34% 77%Online lender 39% 1% 23% 8%
Number of observations are unweighted counts. All other values are weighted. See SBCS methodology for details. Values may not sum to 100% due to rounding.
APPENDIX (CONTINUED)
30Joint Small Business Credit Survey Report, 2014 | Federal Reserve Banks of New York, Atlanta, Cleveland and Philadelphia.
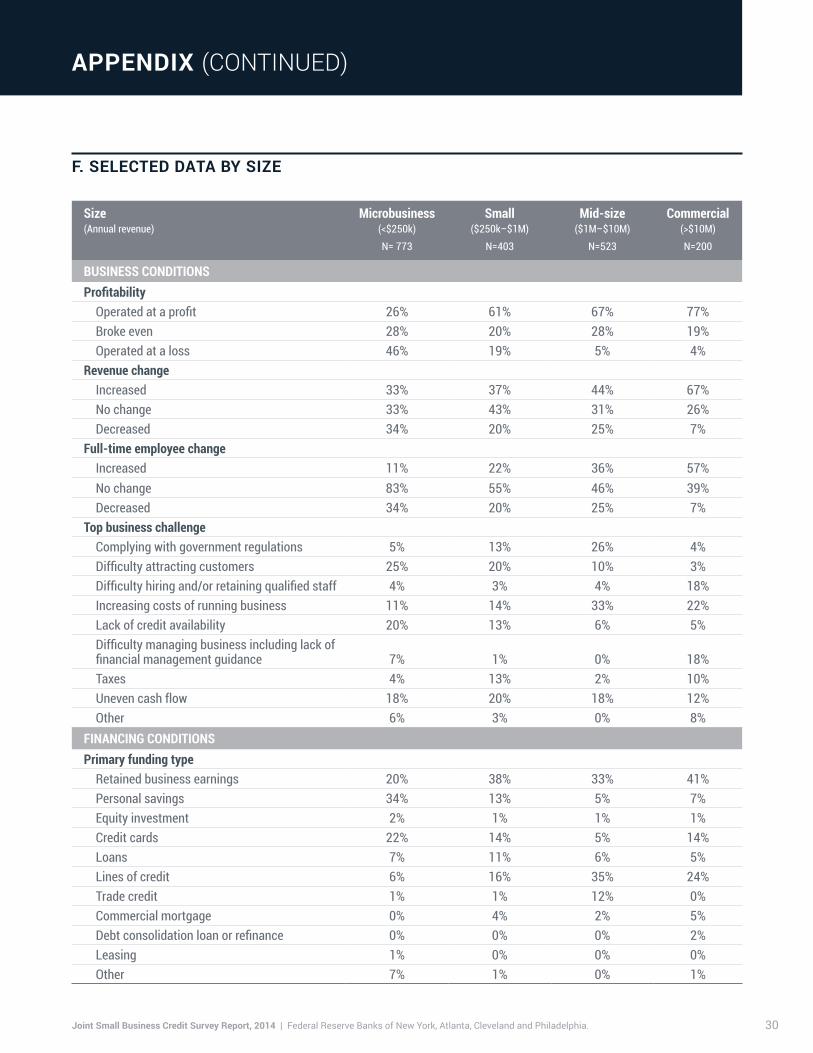
F. SELECTED DATA BY SIZE
Size (Annual revenue)
Microbusiness (<$250k)
Small ($250k–$1M)
Mid-size ($1M–$10M)
Commercial (>$10M)
N= 773 N=403 N=523 N=200
BUSINESS CONDITIONSProfitability
Operated at a profit 26% 61% 67% 77%Broke even 28% 20% 28% 19%Operated at a loss 46% 19% 5% 4%
Revenue changeIncreased 33% 37% 44% 67%No change 33% 43% 31% 26%Decreased 34% 20% 25% 7%
Full-time employee changeIncreased 11% 22% 36% 57%No change 83% 55% 46% 39%Decreased 34% 20% 25% 7%
Top business challengeComplying with government regulations 5% 13% 26% 4%Difficulty attracting customers 25% 20% 10% 3%Difficulty hiring and/or retaining qualified staff 4% 3% 4% 18%Increasing costs of running business 11% 14% 33% 22%Lack of credit availability 20% 13% 6% 5%Difficulty managing business including lack of financial management guidance 7% 1% 0% 18%Taxes 4% 13% 2% 10%Uneven cash flow 18% 20% 18% 12%Other 6% 3% 0% 8%
FINANCING CONDITIONSPrimary funding type
Retained business earnings 20% 38% 33% 41%Personal savings 34% 13% 5% 7%Equity investment 2% 1% 1% 1%Credit cards 22% 14% 5% 14%Loans 7% 11% 6% 5%Lines of credit 6% 16% 35% 24%Trade credit 1% 1% 12% 0%Commercial mortgage 0% 4% 2% 5%Debt consolidation loan or refinance 0% 0% 0% 2%Leasing 1% 0% 0% 0%Other 7% 1% 0% 1%
APPENDIX (CONTINUED)

31Joint Small Business Credit Survey Report, 2014 | Federal Reserve Banks of New York, Atlanta, Cleveland and Philadelphia.
F. SELECTED DATA BY SIZE (CONTINUED)
Size (Annual revenue)
Microbusiness (<$250k)
Small ($250k–$1M)
Mid-size ($1M–$10M)
Commercial (>$10M)
N= 773 N=403 N=523 N=200
FINANCING CONDITIONS (CONTINUED)Change in debt financing costs
Lower 6% 6% 7% 10%Stayed the same 40% 43% 66% 49%Higher 33% 35% 15% 25%Business does not use external 22% 15% 12% 17%
Has outstanding debt Yes 39% 60% 50% 47%No 60% 40% 49% 53%Not sure 1% 0% 1% 0%
Amount of outstanding debt <$250k 88% 54% 53% 27%>$250k 8% 46% 47% 72%Not sure 4% 1% 0% 1%
CREDIT DEMANDApplied for financing (first half of 2014)
Applied 18% 32% 31% 58%Did not apply 80% 67% 69% 42%Not sure 1% 0% 0% 0%
Application rate by product Loan 31% 42% 26% 46%SBA loan 26% 28% 7% 6%Line of credit 46% 27% 63% 84%SBA line of credit 11% 11% 3% 1%Equity investment 5% 1% 1% 0%Credit cards 37% 10% 6% 6%Commercial mortgage 13% 42% 5% 26%Debt consolidation loan or refinance 13% 28% 4% 8%Trade credit 12% 12% 5% 33%Leasing 8% 18% 16% 3%Other 10% 3% 6% 33%
Application rate by sourceLarge national bank 33% 53% 23% 32%Large regional bank 37% 60% 43% 17%Small regional or community bank 30% 36% 42% 44%Online lender 18% 19% 1% 18%Other 19% 12% 21% 1%
APPENDIX (CONTINUED)

32Joint Small Business Credit Survey Report, 2014 | Federal Reserve Banks of New York, Atlanta, Cleveland and Philadelphia.
F. SELECTED DATA BY SIZE (CONTINUED)
Size (Annual revenue)
Microbusiness (<$250k)
Small ($250k–$1M)
Mid-size ($1M–$10M)
Commercial (>$10M)
N= 773 N=403 N=523 N=200
CREDIT DEMAND (CONTINUED)Financing sought
<$250k 86% 73% 42% 21%>$250k 14% 27% 58% 79%Not sure 0% 0% 0% 0%
DiscouragedPercent of firms discouraged from applying for financing 23% 13% 13% 1%
Plan to apply for financing in 2015Yes 26% 24% 41% 27%No 53% 63% 48% 53%Not sure 21% 12% 11% 20%
CREDIT OUTCOMESApproval rate
Received at least some financing 47% 49% 79% 80%Approval rate by source (received at least some financing)
Large national bank 28% 27% 22% 80%Large regional bank 41% 33% 93% 97%Small regional or community bank 61% 40% 67% 94%Online lender 41% 9% 28% 68%
Number of observations are unweighted counts. All other values are weighted. See SBCS methodology for details. Values may not sum to 100% due to rounding.
APPENDIX (CONTINUED)

33Joint Small Business Credit Survey Report, 2014 | Federal Reserve Banks of New York, Atlanta, Cleveland and Philadelphia.
G. SELECTED DATA BY FIRM DEVELOPMENT STAGE
Firm development stage Startup <5 years in business
Grower Profitable and
increasing revenues
Mature >5 years in business,
10+ employees, holds debtNote: Firm segments are not mutually exclusive. N=598 N=650 N=431
BUSINESS CONDITIONSProfitability
Operated at a profit 26% 100% 69%Broke even 25% 0% 23%Operated at a loss 49% 0% 8%
Revenue changeIncreased 42% 100% 64%No change 36% 0% 24%Decreased 22% 0% 12%
Full-time employee changeIncreased 38% 49% 63%No change 44% 49% 25%Decreased 18% 2% 11%
Top business challengeComplying with government regulations 4% 3% 11%Difficulty attracting customers 27% 16% 3%Difficulty hiring and/or retaining qualified staff 2% 10% 7%Increasing costs of running business 10% 14% 33%Lack of credit availability 26% 18% 6%Difficulty managing business including lack of financial management guidance 10% 6% 1%Taxes 3% 12% 10%Uneven cash flow 12% 18% 29%Other 6% 4% 1%
FINANCING CONDITIONSPrimary funding type
Retained business earnings 18% 27% 10%Personal savings 43% 16% 4%Equity investment 2% 1% 0%Credit cards 17% 17% 3%Loans 8% 12% 13%Lines of credit 4% 21% 53%Trade credit 2% 1% 2%Commercial mortgage 0% 2% 10%Debt consolidation loan or refinance 0% 0% 4%Leasing 0% 2% 1%Other 6% 1% 0%
APPENDIX (CONTINUED)
34Joint Small Business Credit Survey Report, 2014 | Federal Reserve Banks of New York, Atlanta, Cleveland and Philadelphia.
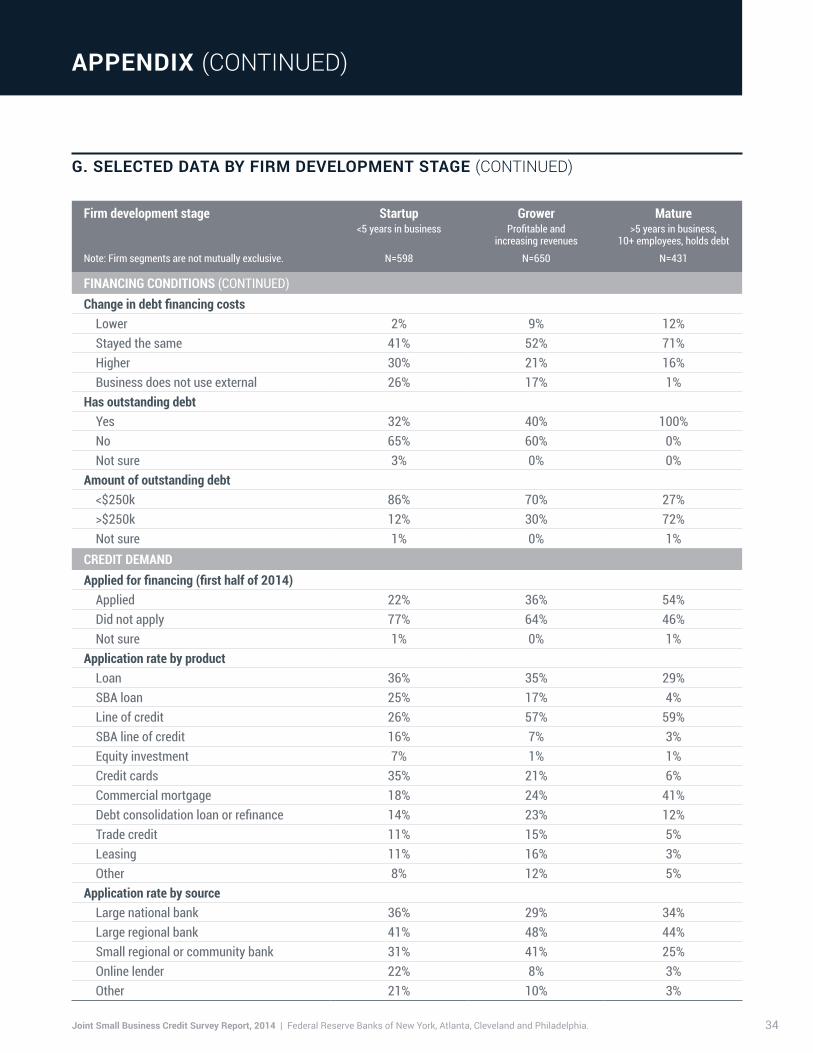
G. SELECTED DATA BY FIRM DEVELOPMENT STAGE (CONTINUED)
Firm development stage Startup <5 years in business
Grower Profitable and
increasing revenues
Mature >5 years in business,
10+ employees, holds debtNote: Firm segments are not mutually exclusive. N=598 N=650 N=431
FINANCING CONDITIONS (CONTINUED)Change in debt financing costs
Lower 2% 9% 12%Stayed the same 41% 52% 71%Higher 30% 21% 16%Business does not use external 26% 17% 1%
Has outstanding debt Yes 32% 40% 100%No 65% 60% 0%Not sure 3% 0% 0%
Amount of outstanding debt <$250k 86% 70% 27%>$250k 12% 30% 72%Not sure 1% 0% 1%
CREDIT DEMANDApplied for financing (first half of 2014)
Applied 22% 36% 54%Did not apply 77% 64% 46%Not sure 1% 0% 1%
Application rate by product Loan 36% 35% 29%SBA loan 25% 17% 4%Line of credit 26% 57% 59%SBA line of credit 16% 7% 3%Equity investment 7% 1% 1%Credit cards 35% 21% 6%Commercial mortgage 18% 24% 41%Debt consolidation loan or refinance 14% 23% 12%Trade credit 11% 15% 5%Leasing 11% 16% 3%Other 8% 12% 5%
Application rate by sourceLarge national bank 36% 29% 34%Large regional bank 41% 48% 44%Small regional or community bank 31% 41% 25%Online lender 22% 8% 3%Other 21% 10% 3%
APPENDIX (CONTINUED)

35Joint Small Business Credit Survey Report, 2014 | Federal Reserve Banks of New York, Atlanta, Cleveland and Philadelphia.
G. SELECTED DATA BY FIRM DEVELOPMENT STAGE (CONTINUED)
Firm development stage Startup <5 years in business
Grower Profitable and
increasing revenues
Mature >5 years in business,
10+ employees, holds debtNote: Firm segments are not mutually exclusive. N=598 N=650 N=431
CREDIT DEMAND (CONTINUED)Financing sought
<$250k 82% 78% 23%>$250k 14% 21% 77%Not sure 4% 2% 0%
DiscouragedPercent of firms discouraged from applying for financing 22% 4% 4%
Plan to apply for financing in 2015Yes 33% 33% 45%No 46% 51% 51%Not sure 22% 16% 4%
CREDIT OUTCOMESApproval rate
Received at least some financing 38% 74% 93%Approval rate by source (received at least some financing)
Large national bank N/A** 53% 87%Large regional bank N/A** 51% 94%Small regional or community bank N/A** 90% 85%Online lender N/A** 46% 49%
* Too few observations to calculate Startups’ approval rate.
Number of observations are unweighted counts. All other values are weighted. See SBCS methodology for details. Values may not sum to 100% due to rounding.
APPENDIX (CONTINUED)

36Joint Small Business Credit Survey Report, 2014 | Federal Reserve Banks of New York, Atlanta, Cleveland and Philadelphia.
H. PARTNER ORGANIZATIONS
FEDERAL RESERVE BANK OF NEW YORK � Accion East � African American Chamber of Commerce of Westchester
& Rockland Counties � Binghamton Chamber of Commerce � Bronx Chamber of Commerce � Brooklyn Chamber of Commerce � Business Council of Fairfield � Chamber of Schenectady County � Connecticut Business and Industry Association � Connecticut Economic Resource Center, Inc. � Connecticut Small Business Development Centers � Development Authority of the North Country � Dutchess County Regional Chamber of Commerce � Empire State Development Corporation � Erie County Medical Center � Greater Newark Enterprises Corporation � Jefferson County Industrial Development Agency � Long Island Association � Manhattan Chamber of Commerce � Metro Hartford Alliance � New York City Department of Consumer Affairs � New York City Department of Small Business Services � New York City Economic Development Corporation � Pace University Small Business Development Center � Queens Chamber of Commerce � Queens Economic Development Corporation � Somerset County Business Partnership � Staten Island Chamber of Commerce � Union County Economic Development Corporation � VEDC � Women Presidents’ Organization � Yates County Chamber of Commerce
FEDERAL RESERVE BANK OF ATLANTA � Accion—Delta region � Alabama Microenterprise Network � Alabama Office of Minority Business Enterprise � Alabama Small Business Development Center Network � Albany Community Together, Inc. � Atlanta branch � Atlanta Metropolitan Black Chamber of Commerce � Auburn University SBDC � Birmingham Business Alliance � Birmingham Business Alliance, AL � Blairsville-Union County Chamber of Commerce � Chamber of Commerce of the Palm Beaches � Chamber of Southwest Florida � Dahlonega-Lumpkin County Chamber of Commerce � Fayette Chamber of Commerce � Florida Business Development Corporation � Florida First Capital Finance Corporation � Florida Minority Business Opportunity Center � Georgia Small Business Development Center,
University of Georgia � Georgia Tech Minority Business Development Center � Greater Columbus Georgia Chamber of Commerce � Greater Fort Lauderdale Chamber � Greene County Partnership � GrowFL � Gulf Coast Mississippi Small Business
Development Center � Indian River County Chamber of Commerce � Jacksonville State University SBDC � Johnson City/Jonesborough/Washington County
Chamber of Commerce � Knoxville Chamber of Commerce � Lanier Technical College, Business Incubator � Launch Chattanooga � Metro Broward Small Business Success Center
APPENDIX (CONTINUED)

37Joint Small Business Credit Survey Report, 2014 | Federal Reserve Banks of New York, Atlanta, Cleveland and Philadelphia.
H. PARTNER ORGANIZATIONS (CONTINUED)
FEDERAL RESERVE BANK OF ATLANTA (CONTINUED) � Mobile Area Chamber of Commerce � Montgomery Area Chamber of Commerce � Montgomery Area Chamber of Commerce, AL � Nashville Biz Incubation Center � Pathway Lending � Pell City Chamber of Commerce � Pensacola Bay Area Chamber � Regional Loan Corporation � Savannah Area Chamber of Commerce � SCORE Atlanta � SCORE Tennessee � Small Business Development Center,
University of West Alabama � Small Business Development Centers of Tennessee � South Florida Community Development Coalition � South Florida Regional Planning Council � Southern Region Minority Supplier Development Council � Southern University at New Orleans SBDC
Management Institute � Southwest Florida Enterprise Center � Startup Miami � SunBiz Showcase Alliance � Tampa Bay Black Business Investment Corporation, Inc. � Tennessee BERO Office � The Chamber/Southwest Louisiana � The EDGE Center for Entrepreneurship and Innovation � U.S. SBA Alabama District Office � University of Louisiana at Lafayette � West Volusia Regional Chamber of Commerce � Women’s Business Enterprise Council South
FEDERAL RESERVE BANK OF CLEVELAND � Canton Chamber of Commerce � Columbus Chamber of Commerce � Council of Smaller Enterprises (COSE) � Cuyahoga Community College Small Business Center � Cuyahoga County � Economic Growth Connection of Westmoreland County � Erie Manufacturer and Business Association � Gannon University Small Business Development Center � Greater Pittsburgh Chamber of Commerce � Home Builders Association of Greater Cleveland � Indiana County Chamber of Commerce � Northwest Industrial Resource Center � Ohio Development Services Agency � Toledo Regional Chamber of Commerce � Youngstown Warren Regional Chamber
FEDERAL RESERVE BANK OF PHILADELPHIA � Pennsylvania Small Business Development Center � Philadelphia Industrial Development Corporation � Sustainable Business Network of Greater Philadelphia � United Bank of Philadelphia
APPENDIX (CONTINUED)