Slow Crack Growth of Brittle Materials With Exponential ... · Slow Crack Growth of Brittle...
28
f NASA / TM--2002-2 t 1153 / PART1 Slow Crack Growth of Brittle Materials With Exponential Crack-Velocity Formulation_ Part 1: Analvsis Sung R. Choi Ohio Aerospace Institute, Brook Park, Ohio Noel N. Nemeth and Jol in P. Gyekenyesi Glenn Research Center, Cleveland, Ohio June 2002 https://ntrs.nasa.gov/search.jsp?R=20020061355 2018-08-19T07:58:31+00:00Z
Transcript of Slow Crack Growth of Brittle Materials With Exponential ... · Slow Crack Growth of Brittle...
f
NASA / TM--2002-2 t 1153 / PART1
Slow Crack Growth of Brittle Materials With
Exponential Crack-Velocity Formulation_Part 1: Analvsis
Sung R. Choi
Ohio Aerospace Institute, Brook Park, Ohio
Noel N. Nemeth and Jol in P. Gyekenyesi
Glenn Research Center, Cleveland, Ohio
June 2002
https://ntrs.nasa.gov/search.jsp?R=20020061355 2018-08-19T07:58:31+00:00Z
The NASA STI Program Office... in Profile
Since its founding, NASA has been dedicated to
the advancement of aeronautics and spacescience. The NASA Scientific and Technical
Information (STI) Program Office plays a key part
in helping NASA maintain this important role.
The NASA STI Program Office is operated by
Langley Research Center, the Lead Center forNASA's scientific and technical information. The
NASA STI Program Office provides access to the
NASA STI Database, the largest collection of
aeronautical and space science STI in the world.
The Program Office is also NASA's institutional
mechanism for disseminating the results of its
research and development activities. These results
are published by NASA in the NASA STI Report
Series, which includes the following report types:
TECHNICAL PUBLICATION. Reports of
completed research or a major significant
phase of research that present the results of
NASA programs and include extensive data
or theoretical analysis. Includes compilations
of significant scientific and technical data and
information deemed to be of continuing
reference value. NASA's counterpart of peer-
reviewed formal professional papers but
has less stringent limitations on manuscript
length and extent of graphic presentations.
TECHNICAL MEMORANDUM. Scientific
and technical findings that are preliminary or
of specialized interest, e.g., quick release
reports, working papers, and bibliographiesthat contain minimal annotation. Does not
contain extensive analysis.
CONTRACTOR REPORT. Scientific and
technical findings by NASA-sponsored
contractors and grantees.
CONFERENCE PUBLICATION. Collected
papers from scientific and technical
conferences, symposia, seminars, or other
meetings sponsored or cosponsored byNASA.
SPECIAL PUBLICATION. Scientific,
technical, or historical information from
NASA programs, projects, and missions,
often concerned with subjects having
substantial public interest.
TECHNICAL TRANSLATION. English-
language translations of foreign scientific
and technical material pertinent to NASA'smission.
Specialized services that complement the STI
Program Office's diverse offerings include
creating custom thesauri, building customized
data bases, organizing and publishing research
results.., even providing videos.
For more information about the NASA STI
Program Office, see the following:
• Access the NASA STI Program Home Page
at http:Hwww.sti.nasa.gov
• E-mail your question via the Intemet to
• Fax your question to the NASA Access
Help Desk at 301-621-0134
• Telephone the NASA Access Help Desk at301-621-0390
Write to:
NASA Access Help Desk
NASA Center for AeroSpace Information7121 Standard Drive
Hanover, MD 21076
NASA / TMm2002-211153 / PART1
Slow Crack Growth of Brittle Materials With
Exponential Crack-Velocity Formulation_Part 1: Analvsis
Sung R. Choi
Ohio Aerospace Institut_, Brook Park, Ohio
Noel N. Nemeth and John P. GyekenyesiGlenn Research Center, Cleveland, Ohio
National Aeronautics an J
Space Administration
Glenn Research Center
June 2002
This report is a formal draft or working
paper, intended to solicit comments and
ideas from a technical peer group.
The Aerospace Propulsion and Power Program at
NASA Glenn Research Center sponsored this work.
NASA Center for Aerospace Information7121 Standard Drive
Hanover, MD 21076
Available from
National Technical Information Service
5285 Port Royal Road
Springfield, VA 22100
Available electronically at http://gltrs.grc.nasa.gov/GLTRS
Slow Crack Growth of Brittle Materials With Exponential
Crack-Velocity Formulation--Part 1: Analysis
Sung R. Choi
Ohio Aerospace InstituteBrook Park, Ohio 44142
Noel N. Nemeth and John P. Gyekenyesi
National Aeronautics and Space AdministrationGlenn Research Center
Cleveland, Ohio 44135
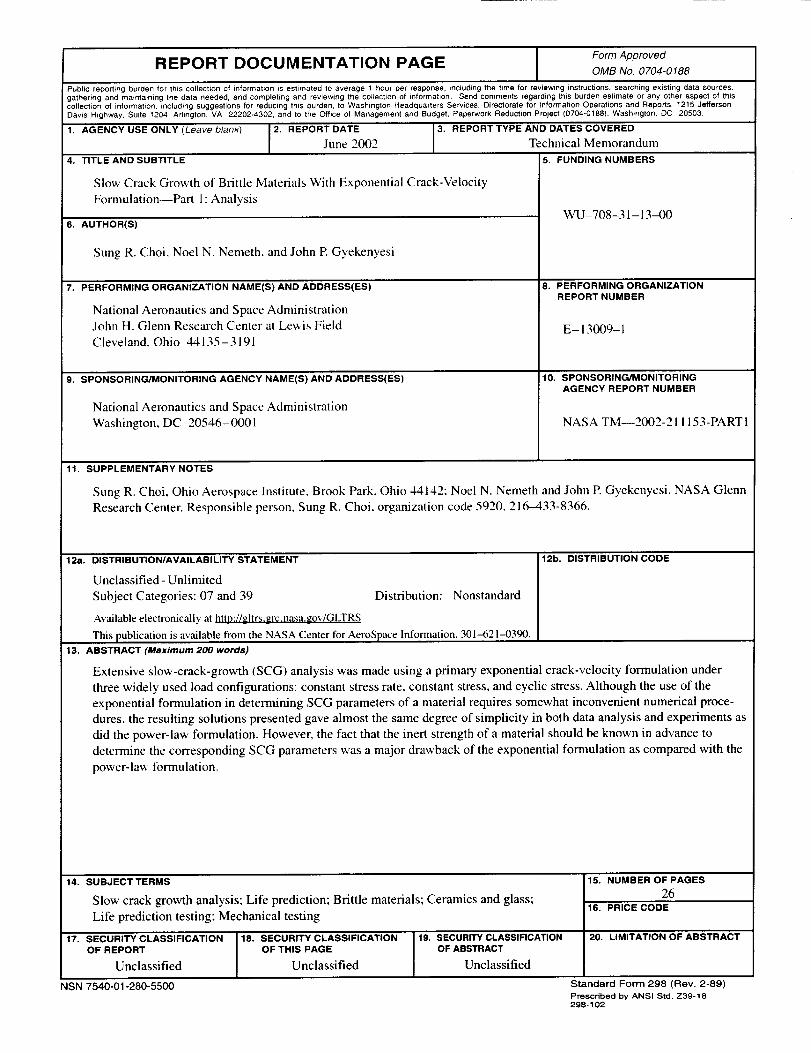
Summary
Extensive slow-crack-growth (SCG) analysis was made u_ing a primary, exponential crack-velocity
formulation under three widel _ used load configurations: constant stress rate, constant stress, and cyclic
stress. Although the use of thc exponential formulation in determining SCG parameters of a material
requires somewhat inconveni_ nt numerical procedures, the resulting solutions presented gave almost
the same degree of simplicity in both data analysis and experiments as did the power-law formulation.However, the fact that the ineLt strength of a material should be known in advance to determine the
corresponding SCG parameters was a major drawback of the exponential formulation as compared with
the power-law formulation.
Introduction
Advanced ceramics are c_,ndidate materials for structural applications in advanced heat engines and
heat recovery systems. The major limitation of these materials in hostile environments, particularly at
elevated temperatures, is slo_-crack-growth (SCG)-associated failure, where slow crack growth ofinherent defects or flaws can q_ccur until a critical size for catastrophic failure is reached. To ensure
accurate life prediction of ceramic components, it is important to accurately evaluate the SCG parameters
of a material with specified loading and environmental conditions.
Life prediction (or SCG) parameters of a material depend on what type of crack-velocity formulation
is used to determine them. Th,,_ power-law crack-velocity formulation has been used for several decades
to describe SCG behavior of z_variety of brittle materials ranging from glass and glass ceramics to
advanced structural ceramics. The main advantage of the power-law formulation over other crack-
velocity formulations lies in the simplicity in its mathematical expression for lifetime analysis. It has
also been observed that the power-law formulation has described adequately the SCG behavior of manybrittle materials. Because of these merits, the power-law formulation has been used in two recent ASTM
test standards (refs. I and 2) to determine SCG parameters of advanced ceramics in constant stress rate
testing at both ambient and elevated temperatures. Alternative crack-velocity formulations take exponen-tial forms to account for the hfluence of other phenomena (such as a corrosion reaction, diffusion control,
thermal activation, etc.). Hovv_-ver, these exponential forms generally do not result in simple mathematical
expressions of life prediction "ormulation. although the forms might better represent the actual SCGbehavior of some materials. Because of this mathematical inconvenience, the exponential crack-velocity
formulation has rarely been u,.ed for brittle materials as a means of life prediction methodology in testing
or analysis.
NASA/TM--2002-211153/PAR]'1 1
In thisreport,theexponentialcrack-velocityformulationwasanalyzedto achieveamoreconvenientandsimplifiedlife predictionanalysiscomparedwiththepreviousexponentialcrack-velocity-basedanalyses.Thenumericalanalysispresentedherewasmadeforthreewidelyutilizedloadconfigurations:constantstressrate(dynamicfatigue),constantstress(staticfatigueorstressrupture),andcyclicstress(cyclicfatigue).Theresultinganalysisobtainedwith theexponentialformulationwascomparedwiththatof thepower-lawformulationtoassesswhichwouldyieldabetterlifepredictionmethodologyin termsof accuracyandconveniencein testingandanalysis.To theauthors'bestknowledge,noanalyticalstudyonslowcrackgrowthhasbeendonepreviouslyusingtheexponentialformulationundercyclicloading.In thefollowingreports(parts2and3of thisseries)themeritsandlimitationsof theexponentialformula-tionwill befurtherdescribedin detailusingavarietyof SCGdatadeterminedfor manyglassesandadvancedceramicsatbothambientandelevatedtemperatures.
All symbolsusedin thisreportarelistedin theappendix.ThisworkwassponsoredinpartbytheHOT/PCandtheZCETprojectsattheNASAGlennResearch
Center,Cleveland,Ohio.
Theoretical Background
Power-Law Formulation
The widely utilized empirical power-law crack-velocity term for above the fatigue limit is expressedin the form (ref. 3)
da t" K _n
d t KIc(1)
where
o
t
KI
A,n
crack velocitycrack size
time
mode I stress intensity factor
mode I critical stress intensity factor (or fracture toughness)
material- and environment-dependent SCG parameters
Typically, SCG testing to determine related SCG parameters is performed by applying constant stress
rate, constant stress, or cyclic stress loading to ground-test specimens. Constant stress rate testing deter-
mines strength as a function of applied stress rate, whereas constant stress and cyclic stress testing mea-
sure time to failure as a function of applied stress. The strength in constant stress rate and the time to
failure in constant stress and cyclic stress tests can be analytically derived to give the following relations(refs. 4 and 5):
(If = Od(Y l/(n+l) (2)
t fs = Ds_ -n (3)
NASA/TM--2002-211153/PART 1 2
--I1
tfi. = D c_ max (4)
where _f is the fracture stre_,._ corresponding to the applied stress rate _ in constant stress rate testing,
tf_. is the time to failure subjected to a constant applied stress c; in constant stress testing, and tf, is thetime to failure subjected to c3 :lic loading with a maximum stress (Ymax in cyclic stress testing. The pa-
rameters represented by D's are expressed as follows (refs. 4 and 5):
'"''+l' (5)
Ds = BS: 7-2 (6)
(gs:'-2) (v}
where B = 2KIc/[Ay2(n - 2)] where Y is the crack geometry factor in the relation K 1 = Y(Y al/2; S i is the
inert strength at which no slow crack growth occurs; the function fit) is a periodic function in cyclic
loading specified in _(t) = 6n,axf(t) in a range of 0 <fit) < 1; and "_is the period. The SCG parameters i1and D (and B or A) can be obtained by a linear regression analysis with experimental data in conjunc-
tion with the corresponding equation, either (2), (3), or (4), depending on the type of loading. Hence, it is
straightforward to determine SCG parameters n and D by least-squares fitting of the data, which is themost advantageous feature of the power-law crack-velocity formulation. This convenience and merit in
mathematical simplicity in addition to the use of routine test techniques have led for several decades to
the almost exclusive use of the power-law crack-velocity formulation in life prediction analysis and test-
ing for many brittle materials over a wide range of temperatures.
Exponential Formulation
Fracture-mechanics-based modeling typically offers a framework in which lifing can be made.
However, long-term life prediction is sensitive to the relation between the slow crack velocity and the
stress intensity factor, which depends on many factors itself. As a result, several different exponential
crack-velocity formulations that have been previously proposed are based on these other factors, which
include the presence of a chelnically assisted corrosion reaction (ref. 6), diffusion-controlled stress
rupture (ref. 7), a thermally activated process (ref. 8), a chemical reaction with constant crack-tip
configuration (ref. 9), kinetic crack growth Iref. 10), and others (ref. 11). The generalized exponential
crack-velocity forms thus proposed are
v= Aexpfn( KI ]]
L _KIc IJ
(8)
v=A( KI ]exp[n( KI ]1
K,c ) L K,c )](9)
NASA/TM--2002-211153/PARTI 3
v=A( KIC]exp[n( KI ]] (1o)
(11)
_K1c ) [ _ K1C ) ](12)
where A and 11 are SCG parameters and are different from those used in the power-law formulation.
Unlike the power-law crack-velocity formulation, the exponential crack-velocity forms do not yield
simple, analytical expressions of either the resulting strength as a function of applied stress rate in con-
stant stress rate testing or of the resulting time to failure as a function of applied stress in constant stress
testing or maximum applied stress ill cyclic stress testing. Several attempts have been made under both
constant stress rate and constant stress loading to obtain corresponding lifetime expressions through nu-
merical integration incorporating linear (refs. 12 and 13) or nonlinear (ref. 14) regression analysis.
However, this approach still involves complexity in regression technique as compared with the simple
least-squares approach in the power-law formulation.
Slow-crack-growth analyses of three load configurations of constant stress rate, constant stress, andcyclic stress were made in this section to obtain simpler, representative equations through numerical
solution, which in turn makes the use of regression analysis easier to determine corresponding SCG
parameters comparable to the case of the power-law formulation. Trantina (ref. 12) used the exponential
crack-velocity forms (eqs. (8) to (10)) to determine the approximate time-to-failure equations under con-
stant stress rate and constant stress loading and showed that the coefficients of the exponential equations
(8) to (10) were insignificant except at very low fracture stress. Ritter et al. (ref. 13) used the exponentialform (eq. (8)) to determine the relation of strength versus stress rate in constant stress rate loading via a
numerical method for indentation cracks that possess a residual stress field around the indent. For the pur-
pose of simplicity and generalization, equation (8) was chosen for the present analysis. This equation was
taken from Wiederhorn and Bolz (ref. 9), who modified the original Hillig and Charles (ref. 6) exponen-
tial formulation. An additional analysis using other crack-velocity forms (eqs. (9) to ( 11)) was also made
and the results will be discussed in the section Other Exponential Formulations.
To minimize the number of parameters to be specified (such as A, a, o, S i, KIC, and t), it is con-venient to use a normalized scheme, as used previously for the power-law velocity formulation (refs. 15to 17):
K* KI T* A C* a * 0 . . = o_o._. • _ _max=--;KIc =--t;ai =--;ai (3 =--;Si o T* , (Ymax ---Si (13)
where
K* stress intensity factor (SIF)T* time
C* crack size
NASA/TM--2002-211153/PART 1 4
appliedstress•* appliedstressratea
max* maximum applied stress
in cyclic loading, and a i is the critical crack size in the inert condition or is the initial crack size. Usingthese variables, the exponential crack-velocity equation (8) can be normalized as follows:
dC g ..ilk _¸
-e (14)dT*
The corresponding normalize, t SIF h"_ is expressed in load configurations of constant stress rate. con-
stant stress, and cyclic sinuso,dal stress, respectively, as
x"= (15/
K"=
/_': = {1+9_ + -_2 R sin[(-_J-)7-* ]}Gmax (C*)'/2 (17)
where R is the stress (or load) ratio, defined as R = (Yrnin/(Ymax, in which Omin and (Yma_x are the mini-mum and maximum applied stresses, respectively, applied in cyclic loading; and o9 is the angularvelocity• As typical for ceran_ics, the crack size at instability in either an inert or fatigue environment
was assumed to be small compared with the body of the specimens or components (i.e., an infinite-body
assumption). Differential equation (14) was solved numerically using a fourth-order Runge-Kutta methodfor each respective loading c(,nfiguration. The initial condition was C* = 1.0 at T* = 0, and the instability
conditions were K* = 1.0 and dK*/dC" > 0. In cyclic loading, the frequency was taken as arbitrary values
of oIai/A > 10 8, depending ol_ the values of maximum applied stress and n. The effect of frequency onthe solution is discussed in th: section Cyclic Stress Loading.
Results of Numerical Analysis
Constant Stress Rate Loading
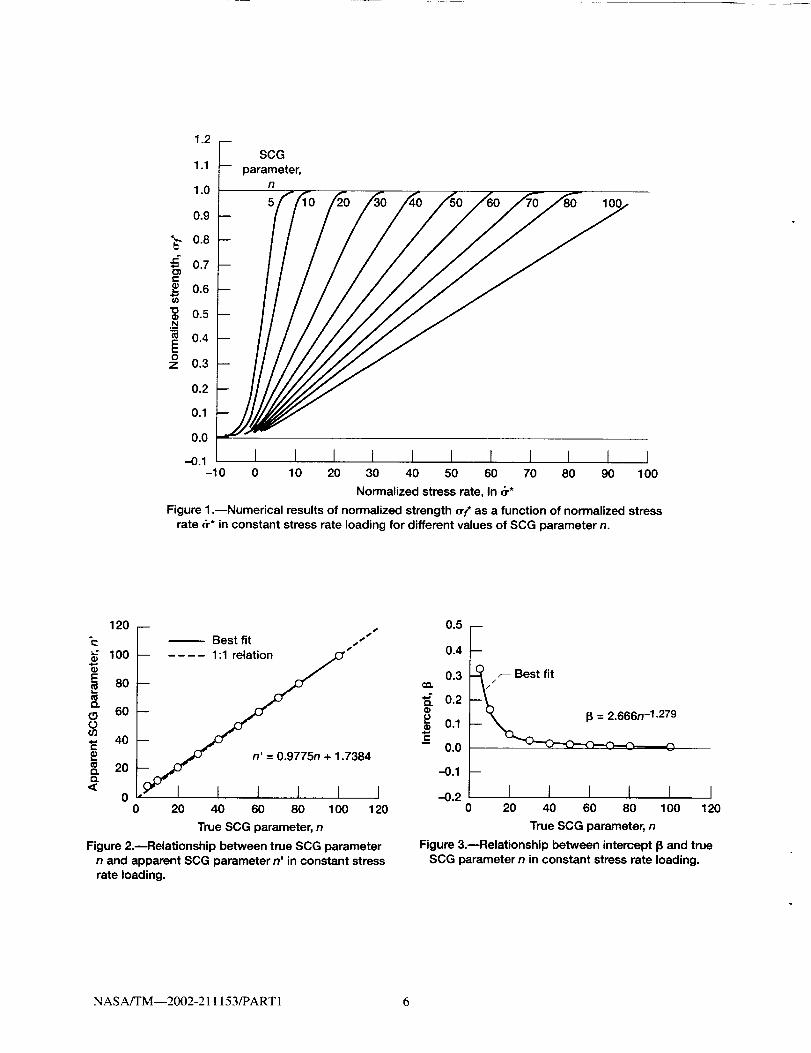
The results of the numeri :al solution of normalized fracture stress (strength) (Yf as a function ofnormalized stress rate _* at: shown in figure 1 for values of n ranging from 5 to 100. As seen in the
figure, for a given n, strength decreases with decreasing stress rate and represents the susceptibility to
slow crack growth• The rate ()l•decrease in strength with decreasing stress rate becomes more significant
with lower n values, analogous to the case for the power-law formulation, indicating that the lower n
gives rise to the greater SCG susceptibility and vice versa. The strength approaches its corresponding
inert strength as stress rate increases to a certain value at which no slow crack growth occurs. Likewise,
the strength converges close _c)zero as the stress rate approaches In d* = 0. A linear relationship between
I_f and In holds for m:)st of n values within the rang(; of (Yf = 0.2 tO 0.9 with correlationcoefficients of r2 > 0•9975•
NASA/TM--2002-211153/PM,:I" 1 5
1.2
1.1
1.0
0.9
*_ 0.8
0o7
0.6
0.5
_ 0.4
z 0.3
0.2
0.1
0.0
-0.1
SCG
-- parameter,n
I I I I I I I I I I I-10 0 10 20 30 40 50 60 70 80 90 100
Normalized stress rate, In _*
Figure 1 .mNumerical results of normalized strength off* as a function of normalized stress
rate _r* in constant stress rate loading for different values of SCG parameter n.
120 --
"¢: _ Best fit • S•
0__:100 -- 1:1relation _Cf •
80i -_ 60
_ 40
,¢_ i_). i i i II_" 200 __J n' = 0.9775n + 1.7384 I
0 20 40 60 80 100 120
True SCG parameter, n
Figure 2.mRelationship between true SCG parameter
n and apparent SCG parameter n' in constant stressrate loading.
0o5 B
¢z(9
_c
0.4
0.3
0.2
0.1
0.0
-0.1
-0.2
B
----_j-- Best fit
D
I0 20
I I I I I40 60 80 100 120
True SCG parameter, n
Figure 3.nRelationship between intercept 13 and true
SCG parameter n in constant stress rate loading.
NASA/TM--2002-211153/PART1 6
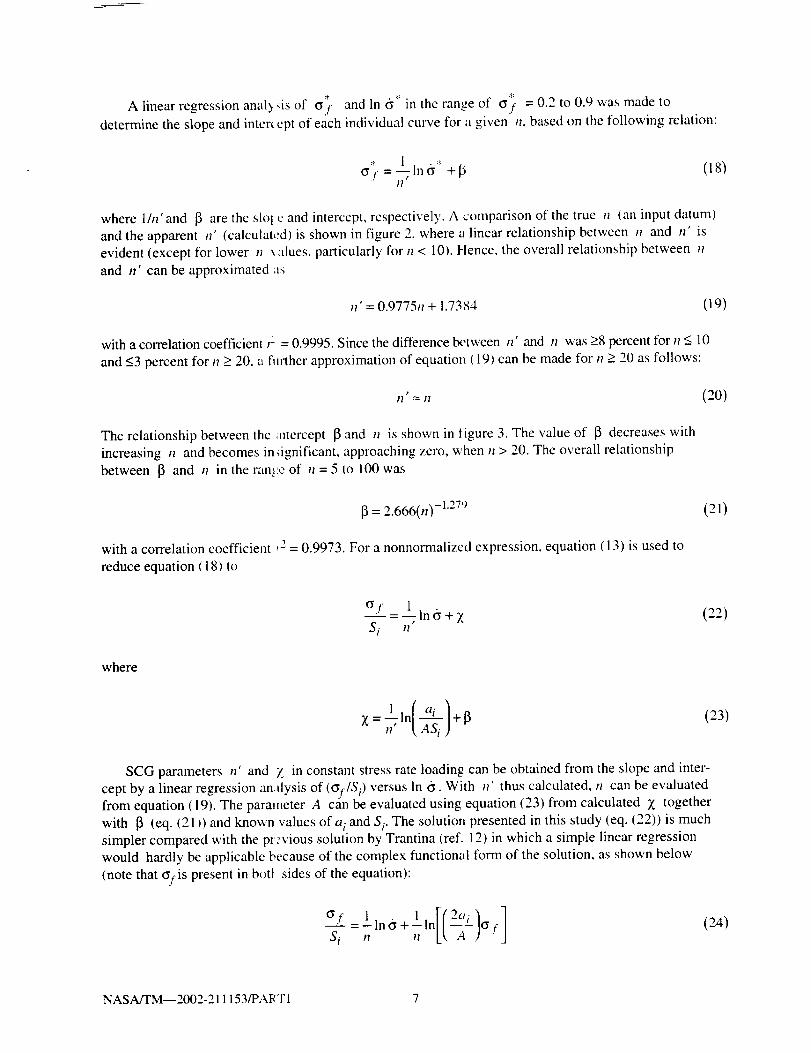
A linear regression anal)_is of 61f and In d* in the range of 61t = 0.2 to 0.9 was made to
determine the slope and inter< opt of each individual curve for a given n, based on the following relation:
• I°t = -7 In d* + I_ (185
11
where 1/n' and [3 are the slo I c and intercept, respectively. A comparison of the true _z (an input datum)and the apparent n' (calculat,,'d) is shown in figure ,.,"_ where a linear relationship between n and 11' is
evident (except for lower n \ alues, particularly for n < 10). Hence, the overall relationship between n
and n' can be approximated as
pn =0.9775n + 1.7384 (19)
with a correlation coefficient r = 0.9995. Since the difference between n' and 11 was >8 percent for i1< 10
and <3 percent for n > 20, a further approximation of equation (19) can be made for n > 20 as follows:
I1 -'_ 11 (20)
The relationship between the _ntercept 13and n is shown in figure 3. The value of [_ decreases with
increasing n and becomes in dgnificant, approaching zero, when n > 20. The overall relationship
between [3 and i+ in the ran_'.c of n = 5 to 100 was
ff = 2.666(n5 -1"27'_ (215
with a correlation coefficient ,2 = 0.9973. For a nonnormalized expression, equation (13) is used to
reduce equation (18) to
_,I 1- ,in_+ X
S i n(225
where
l ln( ai ]+13Z n' [_AS i J
(23)
SCG parameters n' and 7, in constant stress rate loading can be obtained from the slope and inter-
cept by a linear regression analysis of ((yflS i) versus In d. With n' thus calculated, n can be evaluatedfrom equation (19). The parameter A can be evaluated using equation (23) from calculated Z together
with [3 (eq. (21)) and known values ofa i and S i. The solution presented in this study (eq. (22)) is much
simpler compared with the previous solution by Trantina (ref. 12) in which a simple linear regression
would hardly be applicable because of the complex functional form of the solution, as shown below
(note that (_fis present in boti sides of the equation):
OSl >1Si n
(245
NASA/TM--2002-211153/PAFTI 7
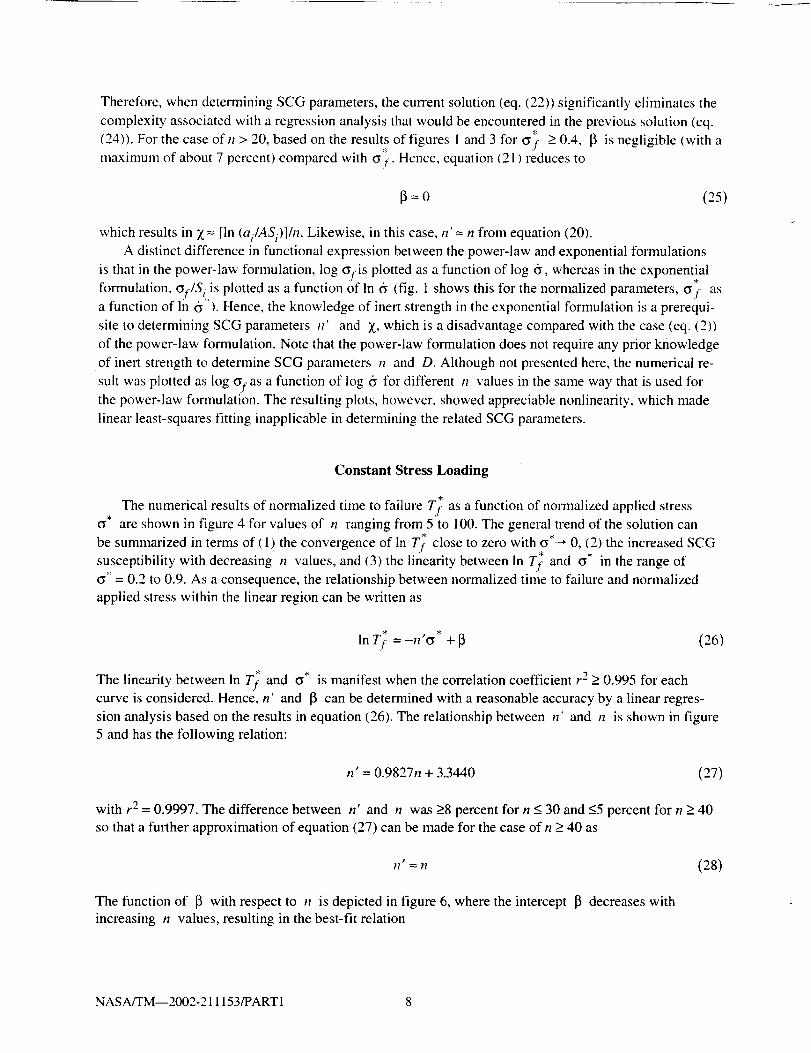
Therefore,whendeterminingSCGparameters,thecurrentsolution(eq.(22))significantlyeliminatesthecomplexityassociatedwitharegressionanalysisthatwouldbeencounteredin theprevioussolution(eq.(24)).Forthecaseofn > 20, based on the results of figures 1 and 3 for _yf > 0.4, 13 is negligible (with a
maximum of about 7 percent) compared with cyi_. Hence, equation (21) reduces to
13---0 (25)
which results in X- [In (ai/ASi)]/n. Likewise, in this case, ii' ---n from equation (20).
A distinct difference in functional expression between the power-law and exponential formulations
is that in the power-law formulation, log of is plotted as a function of log 6, whereas in the exponential
formulation, of/S i is plotted as a function of In t_ (fig. 1 shows this for the normalized parameters, cyf asa function of In _ ). Hence, the knowledge of inert strength in the exponential formulation is a prerequi-
site to determining SCG parameters t7' and Z, which is a disadvantage compared with the case (eq. (2))
of the power-law formulation. Note that the power-law formulation does not require any prior knowledge
of inert strength to determine SCG parameters n and D. Although not presented here, the numerical re-
sult was plotted as log of as a function of log 6 for different i1 values in the same way that is used forthe power-law formulation. The resulting plots, however, showed appreciable nonlinearity, which made
linear least-squares fitting inapplicable in determining the related SCG parameters.
Constant Stress Loading
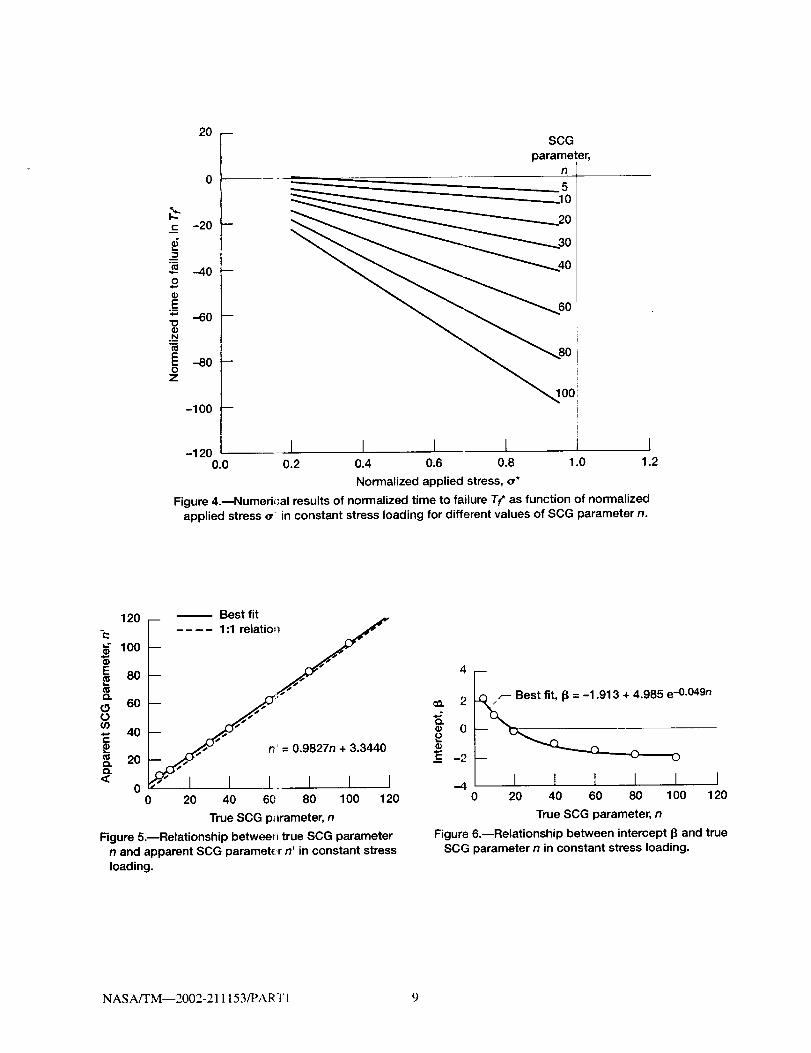
The numerical results of normalized time to failure Tf as a function of normalized applied stress_* are shown in figure 4 for values of n ranging from 5 to 100. The general trend of the solution can
be summarized in terms of (1) the convergence of in T; close to zero with c*_ 0, (2) the increased SCG
susceptibility with decreasing 11 values, and (3) the linearity between In Tf and c* in the range of* = 0.2 consequence, the relationship between normalized time to failure and normalized_y to 0.9. As a
applied stress within the linear region can be written as
In Tf = -n'o* + _ (26)
The linearity between In Tf and c is manifest when the correlation coefficient r 2 > 0.995 for each
curve is considered. Hence, n' and [3 can be determined with a reasonable accuracy by a linear regres-
sion analysis based on the results in equation (26). The relationship between n' and n is shown in figure
5 and has the following relation:
n' = 0.9827n + 3.3440 (27)
with r 2 = 0.9997. The difference between n' and n was >8 percent for n < 30 and <5 percent for n > 40
so that a further approximation of equation (27) can be made for the case of n > 40 as
n' = n (28)
The function of [3 with respect to n is depicted in figure 6, where the intercept 13 decreases with
increasing n values, resulting in the best-fit relation
NASA/TM--2002-211153/PART1 8
_=
"O
.N
Oz
20 --
0
-20 -
-40 --
-60 --
-'80 --
-100 --
SCG
parameter,n
_5_10
..20
_100
-120 I I I I0.0 0.2 0.4 0.6 0.8 1.0 1.2
Normalized applied stress, or*
Figure 4.--Numeri,:al results of normalized time to failure Tf* as function of normalized
applied stress _' in constant stress loading for different values of SCG parameter n.
Best fit120 -- -- _,
-=: 1:1 relatio+l" 100
i+0+S+/+._ 6(1
o_ 40 --
_. 20 J" n'=0.9827n+3.3440
< t- I 1 L I I I00 20 40 60 80 100 120
True SCG parameter, n
Figure 5.--Relationship betweet_ true SCG parametern and apparent SCG parameter n' in constant stress
loading.
2
O.0
.o
_ -2
F. Best fit, 13= -1.91 3 + 4.985 e -0.049n
..4/ I I I I I I0 20 40 60 80 100 120
True SCG parameter, n
Figure 6.--Relationship between intercept 13 and true
SCG parameter n in constant stress loading.
NASA/TM--2002-211153/PARFl 9
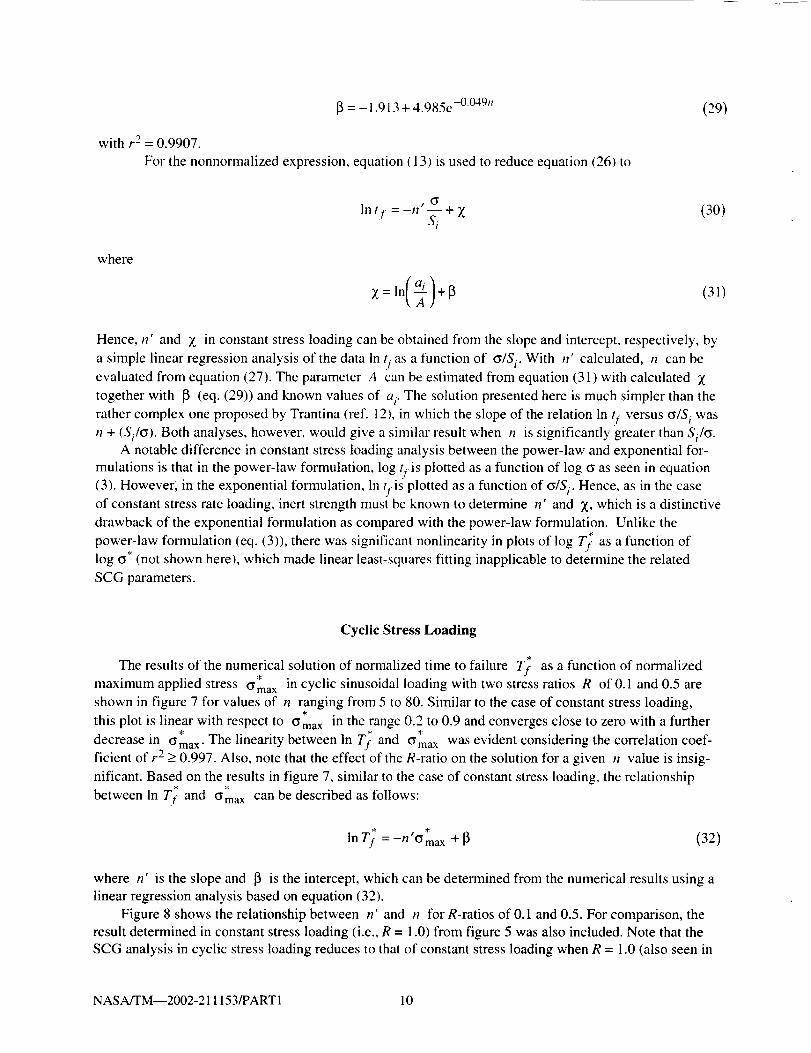
[3= - 1.913 + 4.985e -0'049n
with r 2 = 0.9907.
For the nonnormalized expression, equation (13) is used to reduce equation (26) to
(29)
where
In t t = -17 Z (30)Si
Hence, n' and )_ in constant stress loading can be obtained from the slope and intercept, respectively, by
a simple linear regression analysis of the data In !/.as a function of c/S i. With 17' calculated, n can beevaluated from equation (27). The parameter A can be estimated from equation (31) with calculated X
together with [3 (eq. (29)) and known values of a i. The solution presented here is much simpler than the
rather complex one proposed by Trantina (ref. 12), in which the slope of the relation In !f versus o/S i wasn + (Si/c). Both analyses, however, would give a similar result when t+ is significantly greater than Si/o.
A notable difference in constant stress loading analysis between the power-law and exponential for-
mulations is that in the power-law formulation, log !f is plotted as a function of log o as seen in equation
(3). However, in the exponential formulation, in tfis plotted as a function of _/S i. Hence, as in the caseof constant stress rate loading, inert strength must be known to determine n' and Z, which is a distinctive
drawback of the exponential formulation as compared with the power-law formulation. Unlike the
power-law formulation (eq. (3)), there was significant nonlinearity in plots of log T; as a function oflog o* (not shown here), which made linear least-squares fitting inapplicable to determine the related
SCG parameters.
Cyclic Stress Loading
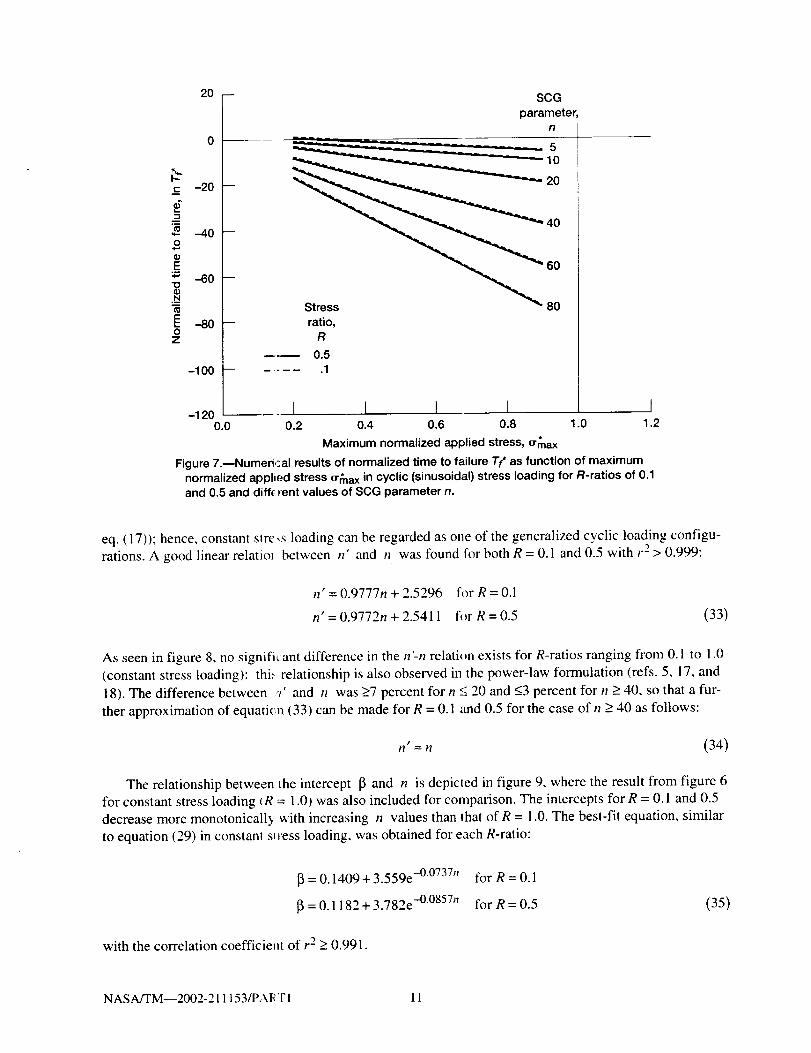
The results of the numerical solution of normalized time to failure T; as a function of normalized
maximum applied stress Oma x in cyclic sinusoidal loading with two stress ratios R of 0.1 and 0.5 are
shown in figure 7 for values of n ranging from 5 to 80. Similar to the case of constant stress loading,
this plot is linear with respect to Oma x in the range 0.2 to 0.9 and converges close to zero with a further
decrease in °max" The linearity between In Tf and Omax was evident considering the correlation coef-ficient of r 2 ->0.997. Also, note that the effect of the R-ratio on the solution for a given 17 value is insig-
nificant. Based on the results in figure 7, similar to the case of constant stress loading, the relationship
between In T; and °max can be described as follows:
ln Tf " *=-n O max + [3 (32)
where n' is the slope and [3 is the intercept, which can be determined from the numerical results using a
linear regression analysis based on equation (32).
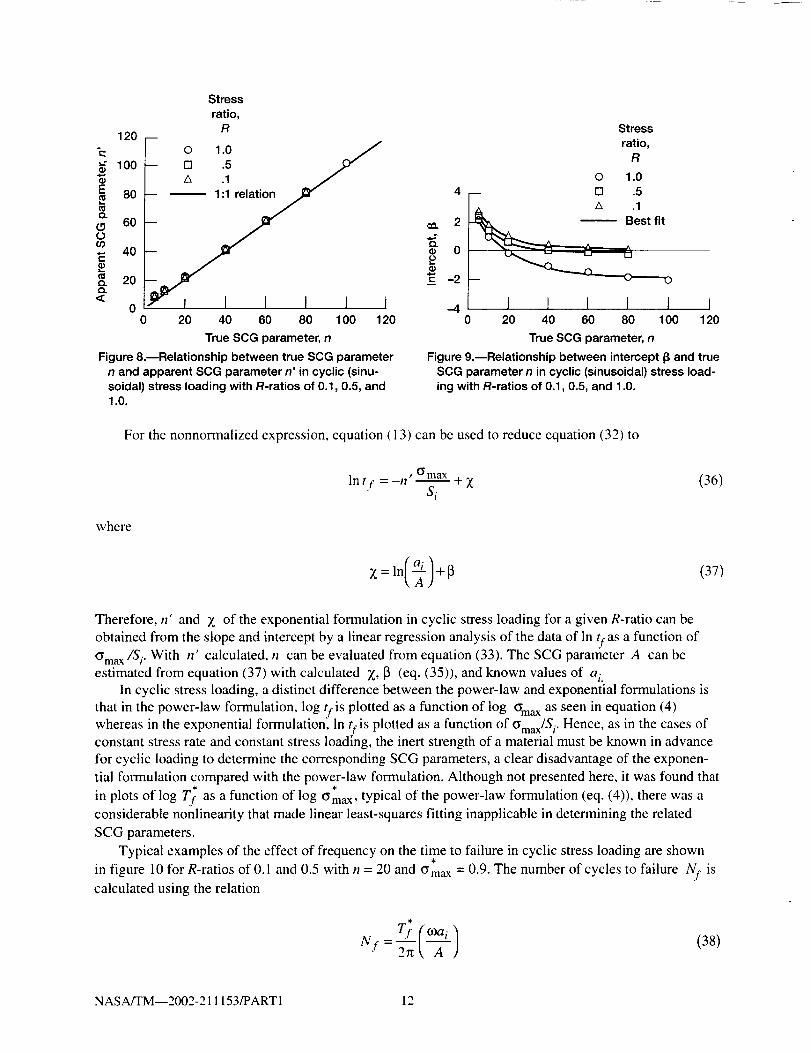
Figure 8 shows the relationship between n' and n for R-ratios of 0.1 and 0.5. For comparison, the
result determined in constant stress loading (i.e., R = 1.0) from figure 5 was also included. Note that the
SCG analysis in cyclic stress loading reduces to that of constant stress loading when R = 1.0 (also seen in
NASA/TM--2002-211153/PART1 10
_=
o
E,t,,a
"O
._N
Oz
2O
-20
-40
--60
-8O
-1 O0
SCG
parametern
---2O
4O
6O
8O
-120 I I I I I0.0 0.2 0.4 0.6 0.8 1.0 1.2
tMaximum normalized applied stress, Crmax
Figure 7.mNumerical results of normalized time to failure Tf* as function of maximumnormalized applied stress cr_naxin cyclic (sinusoidal) stress loading for R-ratios of 0.1and 0.5 and diff¢_rent values of SCG parameter n.
eq. (17)); hence, constant sire _s loading can be regarded as one of the generalized cyclic loading configu-
rations. A good linear relatio_ between n' and n was found for both R = 0.1 and 0.5 with 1.2> 0.999:
17' = 0.9777n + 2.5296 for R = 0.1
17' = 0.977217 + 2.5411 for R = 0.5 (33)
As seen in figure 8, no signifi_:ant difference in the n'-n relation exists for R-ratios ranging from 0.1 to 1.0
(constant stress loading): thi,, relationship is also observed in the power-law formulation (refs. 5, 17, and
18). The difference between ,_' and n was >7 percent for n "__'-20 and <3 percent for n > 40, so that a fur-
ther approximation of equati( n (33) can be made for R = 0.1 and 0.5 for the case ofn > 40 as follows:
' (34)17 = /l
The relationship between the intercept [3 and n is depicted in figure 9, where the result from figure 6
for constant stress loading (R = 1.0) was also included for comparison. The intercepts for R = 0.1 and 0.5
decrease more monotonicall2_ with increasing n values than ihat of R = 1.0. The best-fit equation, similar
to equation (29) in constant s_ tess loading, was obtained for each R-ratio:
[3 = 0.1409 + 3.559e --00737_ for R = 0.1
13= 0.1182 + 3.782e --00857'7 for R = 0.5 (35)
with the correlation coefficiem of r 2 > 0.991.
NASA/TM--2002-211153/PA_ TI 11
e-_
Stress
ratio,R
120
-- 0 1.0 _ /100 -- [] .5
A .1
8O
60
20
o I I I I I I0 20 40 60 80 100 120
True SCG parameter, n
Figure 8.--Relationship between true SCG parameter
n and apparent SCG parameter n' in cyclic (sinu-
soidal) stress loading with R-ratios of 0.1,0.5, and1.0.
Stress
ratio,R
0 1.0
4 -- [] .5
A .1
_. 2 J_ _ Best fit
E).
_ -2 --
-4 I I I I I I0 20 40 60 80 100 120
True SCG parameter, n
Figure 9.--Relationship between intercept I} and true
SCG parameter n in cyclic (sinusoidal) stress load-
ing with R-ratios of 0.1,0.5, and 1.0.
For the nonnormalized expression, equation (13) can be used to reduce equation (32) to
in tf = --tl' (Ymax + )_ (36)S i
where
Therefore, n' and Z of the exponential formulation in cyclic stress loading for a given R-ratio can be
obtained from the slope and intercept by a linear regression analysis of the data of In tfas a function of
(Ym,ax/Si" With n' calculated, n can be evaluated from equation (33). The SCG parameter A can beestimated from equation (37) with calculated Z, 13 (eq. (35)), and known values of ai.
In cyclic stress loading, a distinct difference between the power-law and exponential formulations is
that in the power-law formulation, log tf is plotted as a function of log Omaxas seen in equation (4)
whereas in the exponential formulation, In _is plotted as a function of (Ymax/S i. Hence, as in the cases ofconstant stress rate and constant stress loadmg, the inert strength of a material must be known in advance
for cyclic loading to determine the corresponding SCG parameters, a clear disadvantage of the exponen-
tial formulation compared with the power-law formulation. Although not presented here, it was found that
in plots of log Tf as a function of log Cma x, typical of the power-law formulation (eq. (4)), there was aconsiderable nonlinearity that made linear least-squares fitting inapplicable in determining the related
SCG parameters.
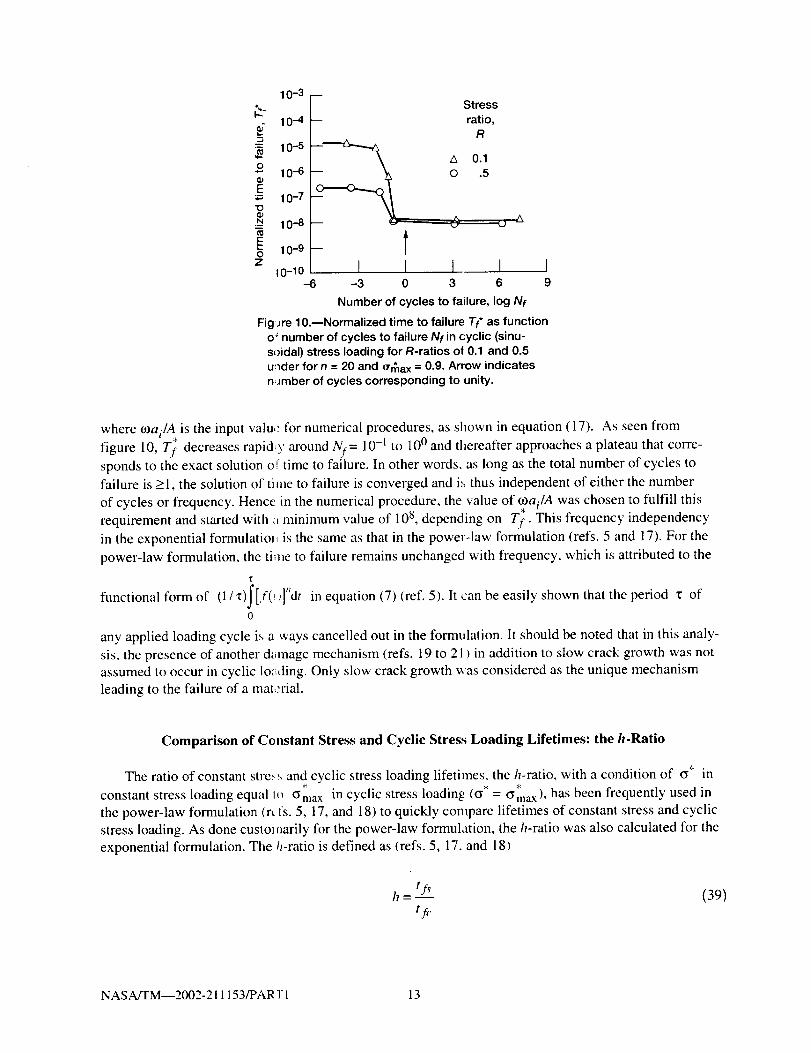
Typical examples of the effect of frequency on the time to failure in cyclic stress loading are shown
in figure 10 for R-ratios of 0.1 and 0.5 with n = 20 and (Ymax = 0.9. The number of cycles to failure Nf iscalculated using the relation
Nf =_--_-_n
NASA/TM--2002-211153/PART 1 12
.a
E
Eo
Z
10 .3 --Stress
10 -4 -- ratio,
R
10-5 --'---_ A 0.1
10"-6 !O_ O .510-7
10-8 _,_ u _A
10 -9 _ T10-10 I I I I I
-6 -3 0 3 6 9
Number of cycles to failure, log Nf
Fig Jre 10.mNormalized time to failure Tf* as functiono; number of cycles to failure Nf in cyclic (sinu-soidal) stress loading for R-ratios of 0.1 and 0.5u_der for n = 20 and (rr_ax = 0.9. Arrow indicatesn Jmber of cycles corresponding to unity.
where o)ai/A is the input valu" for numerical procedures, as shown in equation (17). As seen from:¢
figure 10, Tf decreases rapid y around N)= 10 -1 to 100 and thereafter approaches a plateau that corre-
sponds to the exact solution oi time to failure. In other words, as long as the total number of cycles to
failure is >1, the solution of time to failure is converged and i'_ thus independent of either the number
of cycles or frequency. Hence in the numerical procedure, the value of olai/A was chosen to fulfill this
requirement and started with _t minimum value of 108, depending on Tf. This frequency independency
in the exponential formulatioJ, is the same as that in the power-law formulation (refs. 5 and 17). For the
power-law formulation, the tithe to failure remains unchanged with frequency, which is attributed to the
T
functional form of (1/'t)J'[f(, )]"dt in equation (7)(ref. 5). It can be easily shown that the period z of0
any applied loading cycle is a ways cancelled out in the formulation. It should be noted that in this analy-
sis, the presence of another d_mage mechanism (refs. 19 to 21 ) in addition to slow crack growth was not
assumed to occur in cyclic lo;,ding. Only slow crack growth was considered as the unique mechanism
leading to the failure of a mat :rial.
Comparison of Constant Stress and Cyclic Stress Loading Lifetimes: the h-Ratio
The ratio of constant stre,_ _ and cyclic stress loading lifetimes, the h-ratio, with a condition of (y* inw. *
constant stress loading equal Io (Ymax in cyclic stress loading (_* = (_max), has been frequently used in
the power-law formulation (rt fs. 5, 17, and 18) to quickly compare lifetimes of constant stress and cyclic
stress loading. As done custoJtmrily for the power-law formulation, the h-ratio was also calculated for the
exponential formulation. The h-ratio is defined as (refs. 5, 17, and 18)
h =_tf_ (39)
tf_
NASA/TM--2002-211153/PAR 1"1 13
Stress
ratio,
1 1.0
0.9 o.1_ :[
.3
.1
0.01 Itl I I I J I_ l_l10 100
SCG parameter, n
Figure 11 .mRatio of constant stress to cyclic stress
loading lifetimes, h-ratio, as function of SCG param-
eter n for different R-ratios in cyclic (sinusoidal,
_ax = 0.7) loading. Each line represents best fit.
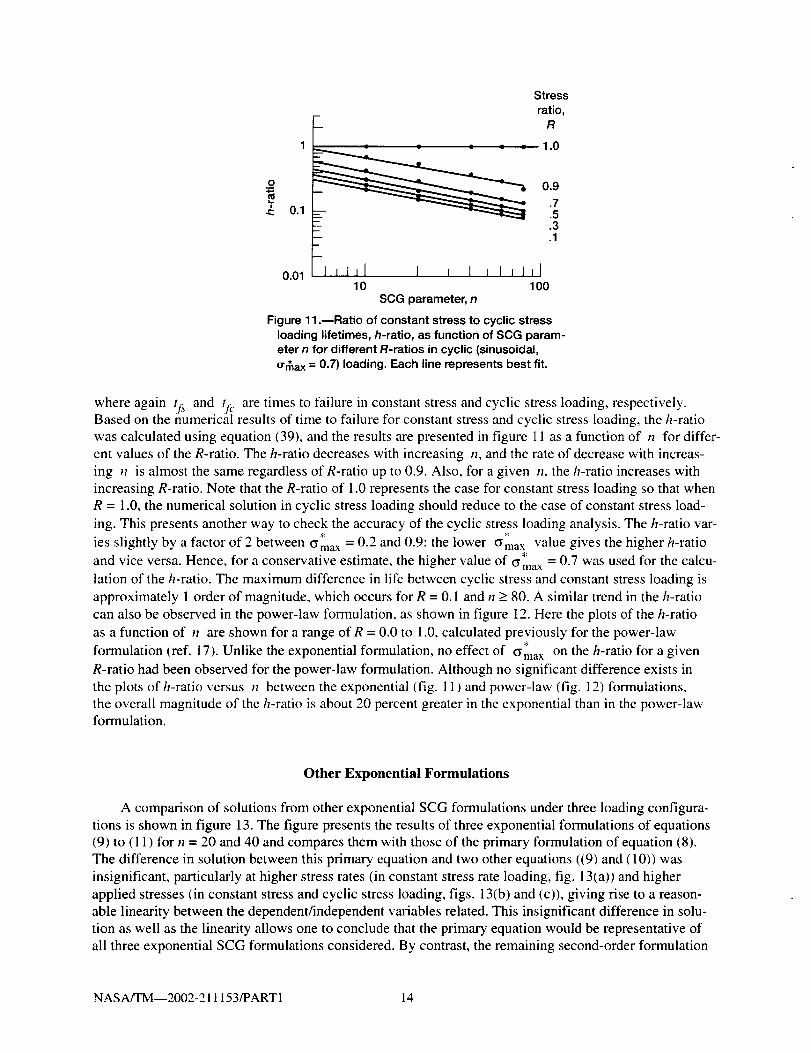
where again tfs and !/_. are times to failure in constant stress and cyclic stress loading, respectively.Based on the numerical results of time to failure for constant stress and cyclic stress loading, the h-ratio
was calculated using equation (39), and the results are presented in figure 11 as a function of n for differ-
ent values of the R-ratio. The h-ratio decreases with increasing n, and the rate of decrease with increas-
ing n is almost the same regardless of R-ratio up to 0.9. Also, for a given n, the h-ratio increases with
increasing R-ratio. Note that the R-ratio of 1.0 represents the case for constant stress loading so that when
R = 1.0, the numerical solution in cyclic stress loading should reduce to the case of constant stress load-
ing. This presents another way to check the accuracy of the cyclic stress loading analysis. The h-ratio var-
ies slightly by a factor of 2 between (Ymax = 0.2 and 0.9: the lower Orma x value gives the higher h-ratio
and vice versa. Hence, for a conservative estimate, the higher value of c max = 0.7 was used for the calcu-lation of the h-ratio. The maximum difference in life between cyclic stress and constant stress loading is
approximately 1 order of magnitude, which occurs for R = 0.1 and n > 80. A similar trend in the h-ratio
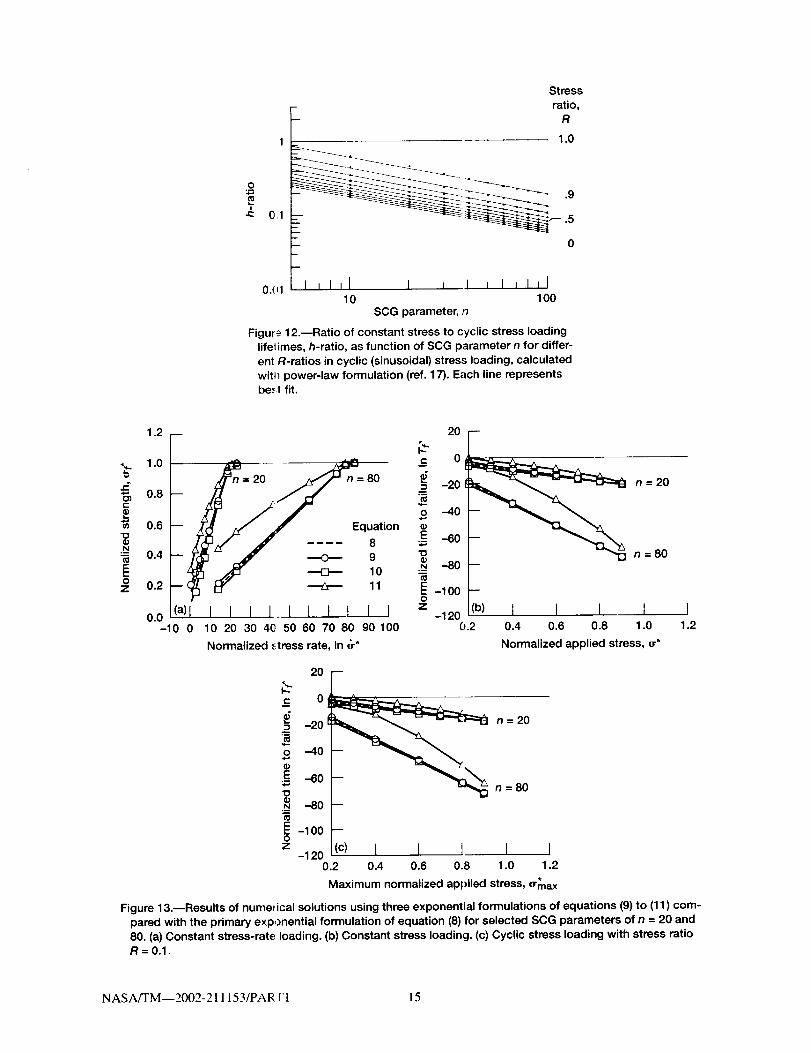
can also be observed in the power-law formulation, as shown in figure 12. Here the plots of the h-ratio
as a function of n are shown for a range of R = 0.0 to 1.0, calculated previously for the power-law
formulation (ref. 17). Unlike the exponential formulation, no effect of _max on the h-ratio for a given
R-ratio had been observed for the power-law formulation. Although no significant difference exists in
the plots of h-ratio versus n between the exponential (fig. 11) and power-law (fig. 12) formulations,the overall magnitude of the h-ratio is about 20 percent greater in the exponential than in the power-lawformulation.
Other Exponential Formulations
A comparison of solutions from other exponential SCG formulations under three loading configura-tions is shown in figure 13. The figure presents the results of three exponential formulations of equations
(9) to (11) for n = 20 and 40 and compares them with those of the primary formulation of equation (8).
The difference in solution between this primary equation and two other equations ((9) and (10)) was
insignificant, particularly at higher stress rates (in constant stress rate loading, fig. 13(a)) and higher
applied stresses (in constant stress and cyclic stress loading, figs. 13(b) and (c)), giving rise to a reason-able linearity between the dependent/independent variables related. This insignificant difference in solu-
tion as well as the linearity allows one to conclude that the primary equation would be representative of
all three exponential SCG formulations considered. By contrast, the remaining second-order formulation
NASA/TM--2002-211153/PART1 14
o
01
Stress
ra; o1.0
j
I I I I II I I I , I i I II0.0110 100
SCG parameter, n
Figul_ 12.--Ratio of constant stress to cyclic stress loading
lifetimes, h-ratio, as function of SCG parameter n for differ-
ent R-ratios in cyclic (sinusoidal) stress loading, calculatedwitll power-law formulation (ref. 17). Each line representsbe,' t fit.
1.2
•,_ 1.0
:_ 0.8
0.6
0,4
z 0.2
0.0-10 0
= 20 80
-- tion
-f_ _#" ---o-- 9.N
_ + 10 Z
--(_ br" _ 11 E
(a)l I I I _L I I I I I I z10 20 30 40 50 60 70 80 90 100
Normalized ._tress rate, In _r*
n =20
n =80
20[--20
--40
-60 --
-80 --
-100 --
(b) I I I I I-1200.2 0.4 0.6 0.8 1.0 1.2
Normalized applied stress, _r*
2O
__ 0
= -20
2 -40
E -6O
"o-80
(0
-100oz
-120
n= 20
n =80
(c) I I I I I0.2 0.4 0.6 0.8 1.0 1.2
Maximum normalized applied stress, _max
Figure 13.--Results of nume_ ical solutions using three exponential formulations of equations (9) to (11) com-pared with the primary exponential formulation of equation (8) for selected SCG parameters of n = 20 and
80. (a) Constant stress-rate loading. (b) Constant stress loading. (c) Cyclic stress loading with stress ratioR= 0.1.
NASA/TM--2002-211153/PAR "F1 15
(eq. (11 )) showed an appreciable deviation and a notable nonlinearity. Therefore, the determination of
corresponding SCG parameters in this case differs from that of the primary equation and should only
be attempted under appropriate circumstances so that a simple lineal" regression could be applied with
reasonable accuracy. It is expected that considering its functional form, equation (12) also would yield
results similar to those of equation ( 11 ).
Although the use of the exponential formulations to determine the SCG parameters of a material
requires somewhat inconvenient numerical procedures, the resulting solutions given in this report would
have almost the same degree of simplicity in both data analysis and experiments as the power-law
formulation in constant stress rate, constant stress, or cyclic stress loading configurations. However,
the knowledge of inert strength of a material should be known beforehand so that the corresponding SCG
parameters (particularly n) can be determined, which could be a major drawback of the exponential for-
mulation. In parts 2 and 3 of this report series, a variety of experimental data from various glasses and
advanced ceramics at both ambient and elevated temperatures will be used to verify the solutions givenherein.
Conclusions
Based on the numerical solutions of life prediction parameters obtained with exponential formula-
tions, the following conclusions were made:
1. In constant stress rate (dynamic fatigue) loading, slow-crack-growth (SCG) parameters can be
determined by a linear regression analysis of the data of (fracture stress/inert strength) as a function of
applied stress rate, cf/S i versus In 8, together with the appropriate relations provided.2. In constant stress (static fatigue or stress rupture) and cyclic stress (cyclic fatigue) loading, the
corresponding SCG parameters can be evaluated by a linear regression analysis of the data of time to fail-
ure as a function of (maximum applied stress/inert strength), In !f versus (Ymax/Si, in conjunction with thepertinent relations provided.
3. No frequency effect on life and no dependency of SCG parameter n on the R-ratio, the ratio of
minimum to maximum applied stress, was observed in cyclic stress loading, much the same as that
observed for the power-law formulation. The difference in the ratio of constant stress to cyclic stress load-
ing lifetimes, the h-ratio, between the exponential and power-law formulations was minimal with a maxi-mum difference of about 20 percent.
4. While the numerical solutions using the exponential formulation require somewhat inconvenient
numerical procedures, they provide almost the same level of simplicity in both data analysis and experi-
ments as the power-law formulation. However, requiring the knowledge of the inert strength of a material
to determine corresponding SCG parameters (particularly n) would make the exponential formulation
more difficult to use in comparison with the power-law formulation.5. There is no appreciable difference in solutions between the primary exponential SCG equation
(used in this analysis) and two other exponential expressions analyzed in this study, so the primary equa-
tion would be considered representative of all the first-order exponential formulations.
NASA/TM--2002-211153/PART 1 16
A
a
B
C
D
fit)
h
K
N
II
R
I-
S
T
t
v
Y
X
IJ
d
T
0)
Appendix Symbols
slow-crack-growth p;_rameter defined in equations (1 J and (8)
crack size
"_" [Ay2(n - 2)1slow-crack-growth pz rameter. B = .KIC/
crack size in normali,:ed scheme of references 15 to 17
slow-crack-growth p, rameter defined in equations (5J to (7)
periodic function, cy_ lic loading
ratio of constant to c_ clic stress loading lifetimes
stress intensity factor
number of cycles
slow-crack-growth p_rameter defined in equations (I i and (8)
stress ratio
correlation coefficient
strength
time in normalized st heine of references 15 to 17
time
crack velocity
crack geometry facto_
intercept of curve in linear regression analysis defined in equations (18), (26), and (32)
slow-crack-growth p_rameter defined in equations (23). (31 ), and (37)
applied stress
applied stress rate
period
angular velocity
NASA/TM--2002-211153/PAR['l 17
Subscripts:
C critical
c cyclic stress
d constant stress rate
f fracture
I mode I
i inert or initial condition
max maximum
min minimum
s constant stress
Superscripts:
* normalized
' apparent (calculated)
NASA/TM--2002-211153/PARTI 18
References
1. Standard Test Method 12,r Determination of Slow Crack Growth Parameters of Advanced Ceramics
by Constant Stress-Ratc Flexural Testing at Ambient Temperature. Annual Book of ASTM Stan-
dards 2000, ASTM De ;ignation: C 1368-00, sec. 15, vol. 15.01, ASTM, West Conshohocken, PA,
2001, pp. 626-634.2. Standard Test Method lar Determination of Slow Crack Growth Parameters of Advanced Ceramics
by Constant Stress-Rau Flexural Testing at Elevated Temperatures. Annual Book of ASTM Stan-
dards 2001, ASTM De;ignation: C 1465-00, sec. 15, vol. 15.01, ASTM, West Conshohocken, PA,
2001, pp. 703-716.3. Wiederhom, S.M.: Subcritical Crack Growth in Ceramics. Fracture Mechanics of Ceramics,
R.C. Bradt, D.P.H. Has ;elman, and F.F. Lange, eds., vol. 2, Plenum Press, New York, NY, 1974,
pp. 613-646.4. Ritter, John E., Jr.: Eng neering Design and Fatigue Failure of Brittle Materials. Fracture Mechan-
ics of Ceramics, R.C. Bradt, D.P.H. Hassehnan, and F.F. Lange, eds., vol. 4, Plenum Press, New
York, NY, 1978, pp. 667-686.5. Evans, A.G.; and Fullm, E.R.: Crack Propagation in Ceramic Materials Under Cyclic Loading
Conditions. Metall. Tra as., vol. 5, no. 1, 1974, pp. 27-33.
6. Hillig, W.B.; and Charl,zs, R.J.: Surfaces, Stress-Dependent Surface Reactions, and Strength. High-
Strength Materials, Vic_,)r F. Zackay, ed., ch. 17, John Wiley & Sons, Inc., New York, NY, 1965,
pp. 682-705.7. Charles, R.J.: Diffusion Controlled Stress Rupture ofPolycl-ystalline Materials. Metall. Trans. A,
vol. 7A, no. 8, 1976, pp. 1081-1089.8. Pollet, J.-C.; and Burns S.J.: Thermally Activated Crack Propagation--Theory. hat. J. Fracture, vol.
13, no. 5, 1977, pp. 667--679.9. Wiederhorn, S.M.: and Bolz, L.H.: Stress Corrosion and Static Fatigue of Glass. J. Am. Ceram.
Soc., vol. 53, no. 10, 1970, pp. 543--548.10. Lawn, B.R.: An Atomistic Model of Kinetic Crack Growth in Brittle Solids. J. Mater. Sci., vol. 10,
1975, pp. 469-480.11. Lenoe, E.M.; and Neal, D.M.: Assessment of Strength-Probability-Time Relationships in Ceramics.
ARPA Order 2181, AM MRC-TR-75-13, 1975.
12. Trantina, G.G.: Strength and Life Prediction for Hot-Pressed Silicon Nitride. J. Am. Cer. Soc.,
vol. 62, no. 7-8, 1979, pp. 377-380.13. Ritter, John E., et al.: Dynamic Fatigue Analysis of Indentation Flaws Using an Exponential-Law
Crack Velocity Functio a. Commun. Am. Ceram. Soc., 1984, pp. C-198--C-199.14. Ritter, John E., Jr.; Jakl_s, Karl; and Cooke, David S.: Predicting Failure of Optical Glass Fibers.
Environmental Degra&,tion of Engineering Materials in Aggressive Environments, Proceedings ofSecond International C, reference on Environmental Degradation of Engineering Materials, 1981,
pp. 565-575.15. Lawn, B.R., et al.: Fatigue Analysis of Brittle Materials Using Indentation Flaws. J. Mat. Sci., pt. 1,
vol. 16, 1981, pp. 2846-2854.16. Choi, S.R.; Ritter, J.E.; and Jakus, K.: Failure of Glass With Subthreshold Flaws. J. Am. Ceram.
Soc., vol. 73, no. 9, 19:0, pp. 268-274.
17. Choi, Sung R.; and Sahm, Jonathan A.: Cyclic Fatigue of Brittle Materials With _m Indentation-
Induced Flaw System. Mater. Sci. Eng., vol. A208, no. 1, 1996, pp. 126-130.
NASA/TM--2002-211153/PARl'l 19
18. Kawakubo,Takashi;andKomeya,K.:StaticandCyclicFatigueBehaviorof aSinteredSiliconNitrideatRoomTemperature.J.Am.Ceram.Soc.,vol.70,no.6, 1987,pp.400-405.
19. Horibe,S.;andHirahara,R.:CyclicFatigueof CeramicMaterials:Influenceof CrackPathandFatigueMechanisms.Acta.Metall.Mater.,vol.39,no.6, 1991,pp.1309-1317.
20. Ewart,L.; andSuresh,S.:CrackPropagationinCeramicsUnderCyclicLoads.J.Mater.Sci.,vol.22, no.4, 1987,pp.1173-1192.
21. Dauskardt,ReinholdH.;Marshall,DavidB.;andRitchie,RobertO.:CyclicFatigue-CrackPropa-gationinMagnesia-Partially-StabilizedZirconiaCeramics.J.Am.Ceram.Soc.,vol.73,no.4,1990,pp.893-903.
NASA/TM--2002-211153/PART1 20

REPORT DOCUMENTATION PAGE FormApprovedOMB No. 0704-0188
Public reporting burden for this collection of information is estimated to average 1 hour per response, including the time for reviewing instructions, searching existing data sources,
gathering and maintaining the data needed, and completing and reviewing the collection of information. Send comments regarding this burden estimate or any other aspect of this
collection of information, including suggestions for reducing this burden, to Washington Headquarters Services, Directorate for _nformation Operations and Reports, 1215 Jefferson
Davis Highway, Suite 1204, Arlington, VA 22202-4302, and to the Office of Management and Budget, Paperwork Reduction Projecf (0704-0188). Washington, DC 20503.
1. AGENCY USE ONLY (Leave blank) 2. REPORT DATE 3. REPORT TYPE AND DATES COVERED
June 2002 Technical Memorandum
4. TITLE AND SUBTITLE
Slow Crack Growth of Brittle Materials With Exponential Crack-Velocity
Formulation--Part 1: Analysis
6. AUTHOR(S)
Sung R. Choi, Noel N. Nemeth, and John E Gyekenyesi
7. PERFORMING ORGANIZATION NAME(S) AND ADDRESS(ES)
National Aeronautics and Space Administration
John H. Glenn Research Center at Lewis Field
Cleveland, Ohio 44135 - 3191
9. SPONSORING/MONITORING AGENCY NAME(S) AND ADDRESS(ES)
National Aeronautics and Space Administration
Washington, DC 20546-0001
5. FUNDING NUMBERS
WU-708-31-13-00
8. PERFORMING ORGANIZATIONREPORT NUMBER
E- 13009-1
10. SPONSORING/MONITORINGAGENCY REPORT NUMBER
NASA TM--2002-2 ! I 153-PART l
11. SUPPLEMENTARY NOTES
Sung R. Choi, Ohio Aerospace Institute, Brook Park. Ohio 44142: Noel N. Nemeth and John P. Gyekenyesi, NASA Glenn
Research Center. Responsible person. Sung R. Choi, organization code 5920, 216--433-8366.
12a. DISTRIBUTION/AVAILABILITY STATEMENT
Unclassified - Unlimited
Subject Categories: 07 and 39 Distribution: Nonstandard
Available electronically at httD:/h, ltrs._rc.nasa._ov/GLTRS
This publication is available from the NASA Center for AeroSpace Information. 301-621-0390.
12b. DISTRIBUTION CODE
13. ABSTRACT (Maximum 200 words)
Extensive slow-crack-growth (SCG) analysis was made using a primary exponential crack-velocity formulation under
three widely used load configurations: constant stress rate. constant stress, and cyclic stress. Although the use of the
exponential formulation in determining SCG parameters of a material requires somewhat inconvenient numerical proce-
dures, the resulting solutions presented gave almost the same degree of simplicity in both data analysis and experiments as
did the power-law formulation. However, the fact that the inert strength of a material should be "known in advance to
determine the corresponding SCG parameters was a major drawback of the exponential formulation as compared with the
power-law formulation.
14. SUBJECT TERMS
Slow crack growth analysis; Life prediction; Brittle materials; Ceramics and glass;
Life prediction testing; Mechanical testing
17. SECURITY CLASSIFICATION 18. SECURITY CLASSIFICATIONOF REPORT OF THIS PAGE
Unclassified Unclassified
NSN 7540-01-280-5500
19. SECURITY CLASSIRCA_ONOFABSTRACT
Unclassified
15. NUMBER OF PAGES
2616. PRICE CODE
20. LIMITATION OF ABSTRACT
Standard Form 298 (Rev. 2-89)Prescribed by ANSI Std. Z39-18298-102