Slide-in Electric Road System - RISE Viktoria · This is a progress report in the Slide-in project...
63
Viktoria Swedish ICT, Lindholmspiren 3A, SE-417 56 Gothenburg, www.viktoria.se, Phone: +46 31 772 48 08, Fax +46 31 772 89 63, [email protected] Gothenburg: 2013-10-18 Report draft from project Phase 1 Slide-in Electric Road System Conductive project report This report is compiled and edited by Viktoria Swedish ICT on behalf of Volvo GTT and Scania CV and is partly financed by the: In this project, the following companies and organizations are participating:
Transcript of Slide-in Electric Road System - RISE Viktoria · This is a progress report in the Slide-in project...

Viktoria Swedish ICT, Lindholmspiren 3A, SE-417 56 Gothenburg, www.viktoria.se, Phone: +46 31 772 48 08, Fax +46 31 772 89 63, [email protected]
Gothenburg: 2013-10-18
Report draft from project Phase 1
Slide-in Electric Road System
Conductive project report
This report is compiled and edited by Viktoria Swedish ICT on behalf of Volvo GTT and Scania CV and is partly financed by the:
In this project, the following companies and organizations are participating:

Slide-in Electric Road System Viktoria Swedish ICT Conductive project report Date: 2013-10-18
Page 2 of 63
Document title: Slide-in Electric Road System, Conductive project report
Created by: Viktoria Swedish ICT on behalf of Volvo GTT and Scania CV.
Document created: 2013-10-18
Document type: Report draft
Publication number: 2013:02
Version: 0.10.18.1
Publication date: October 23 2013
Publisher: Volvo GTT
Edited by: Oscar Olsson
Contact details: [email protected]
Assignment responsible: Richard Sebestyén,
Distributor: Volvo Global Trucks Technology, SE-405 08 Göteborg, www.volvotrucks.com, [email protected]

Slide-in Electric Road System Viktoria Swedish ICT Conductive project report Date: 2013-10-18
Page 3 of 63
SAMMANFATTNING Att elektrifiera fordon ses av många som en möjlig lösning för att minska miljöutsläppen och beroendet av fossilt bränsle. Dessvärre innebär de flesta miljövänliga energilagringssystem, såsom batterier, en lägre energidensitet jämfört med fossilbränsle vilket har stor påverkan på fordonets räckvidd. Ett tillräckligt stort batteri för långväga transporter är ofta kombinerat med en väsentlig ökning av kostnad och vikt vilket därmed innebär en minskad möjlig transportvolym. Ett alternativ, till exempelvis batteridrift, skulle kunna vara att överföra energin kontinuerligt från vägen till fordonet för såväl framdrift som laddning. En utbyggnad av ett elektrifierat vägnät (”Electrified Road Systems”, ERS) mellan städer skulle innebära att merparten av sträckan kunde köras på el från vägnätet och resterande sträcka kan köras på energi från potentiellt mindre batterier optimerade för stadsrutter.
Detta är en delrapport i projektet Slide-in där det slutliga syftet är att utvärdera tekniken för att konduktivt överföra energi från vägen till fordonet baserat på kostnad, energieffektivitet och rimlighet. Rapporten innefattar såväl en bakgrund med affärsmodeller samt vilken teknik som skulle krävas på fordonen, i vägen samt omkringliggande infrastruktur för en storskalig utbyggnad. Rapporten avslutas med en kostnadsuppskattning för en full utbyggnad av en väg mellan Stockholm och Göteborg samt en bedömning av hur implementationen bör genomföras.
ABSTRACT Electrifying vehicles is seen by many as a possible solution to reduce environmental emissions and the dependence on fossil fuel. Unfortunately, most environmentally friendly energy storage systems, such as batteries, have less energy density compared to fossil fuel, which will have a negative impact on the vehicle range. A battery with enough capacity for long distance transports will therefore often imply a substantial increase in cost and weight, and reduced transport volume. An alternative would be to continuously transfer energy from the road to the vehicle both for propulsion and charging. A development of an electrified road system (ERS) between cities would mean that most of the route could be driven on electricity from the road and the remaining distance can be driven on energy from potentially smaller batteries optimized for city routes.
This is a progress report in the Slide-in project where the final objective is to evaluate the technology to conductively transfer energy from the road to the vehicle based on cost, efficiency and feasibility. The report includes both a background with a business model as well as a description of the technology that would be required on the vehicles, in road and in the surrounding infrastructure for a large-scale implementation. The report also includes a cost estimate for a full deployment of a road between Stockholm and Gothenburg and an assessment of how implementation should be carried out.

Slide-in Electric Road System Viktoria Swedish ICT Conductive project report Date: 2013-10-18
Page 4 of 63
VOCABULARY AND ABBREVIATIONS
AC Alternating current
APS Aesthetic Power Supply ( Alimentation Par le Sol )
CAMS Computerized Aided Maintenance System
DC Direct current
ERS Electric Road System
EV Electric vehicle
ICE Internal combustion engine
MFC Multi Function Cable
OCL Overhead Contact Line
PB Power Box
AUTHORS
Chapter 1. An electric road system. Viktoria Swedish ICT and KTH
Chapter 2. ERS – A New Technological Paradigm. KTH
Chapter 3. Simulation of gereic ERS. Lund University
Chapter 4. Generic scenario description. Scania CV and Volvo GTT
Chapter 5. Details of conductive system. Alstom
Chapter 6. Details of vehicle. Volvo GTT
Chapter 7. Details of power supply system from energy provider to the conductive system. Vattenfall
Chapter 8. Implementation concept. The Swedish Transport Administration
Chapter 11. ERS reference case based on overhead lines. Svenska Elvägar
In this report 1 Euro corresponds to 8.63 Swedish kronor.

Slide-in Electric Road System Viktoria Swedish ICT Conductive project report Date: 2013-10-18
Page 5 of 63
TABLE OF CONTETNS 1 AN ELECTRIC ROAD SYSTEM ............................................................................................................. 7
1.1 BACKGROUND ...................................................................................................................................................... 7 1.2 PROJECT GOALS ................................................................................................................................................... 8 1.3 PROJECT OBJECTIVES AND SCOPE ................................................................................................................... 8 1.4 PROJECT PARTICIPANTS AND RESPONSIBILITIES ........................................................................................ 9 1.5 TARGETED AUDIENCE .................................................................................................................................... 10 1.6 TIME PLAN ......................................................................................................................................................... 10
2 ERS – A NEW TECHNOLOGICAL PARADIGM ............................................................................. 11 2.1 STAKEHOLDER IMPLICATIONS ...................................................................................................................... 13 2.2 A BUSINESS MODEL PERSPECTIVE ............................................................................................................... 15
3 SIMULATION OF GENERIC ERS ....................................................................................................... 16 3.1 SIMULATED ERS EXAMPLE ........................................................................................................................... 16 3.2 TRAFFIC SIMULATION .................................................................................................................................... 17 3.3 ELECTRIC POWER SYSTEM SIMULATION ................................................................................................... 18 3.4 THERMAL POWER SYSTEM SIMULATION ................................................................................................... 18 3.5 RESULT SUMMARY ........................................................................................................................................... 20 3.6 RECOMMENDATIONS ....................................................................................................................................... 20
4 GENERIC SCENARIO DESCRIPTION .............................................................................................. 21 4.1 HEAVY VEHICLE DEFINITIONS: .................................................................................................................... 21 4.2 PASSENGER CAR DEFINITIONS: ..................................................................................................................... 21 4.3 ROUTE TOPOLOGY ........................................................................................................................................... 22 4.4 ROAD AND EMBANKMENT PARAMETERS: .................................................................................................. 23 4.5 ENVIRONMENTAL CONDITIONS: ................................................................................................................... 23 4.6 TRAFFIC CONDITIONS IN THE ELECTRIC LANE ........................................................................................ 24
5 DETAILS OF CONDUCTIVE SYSTEM ............................................................................................. 25 5.1 SYSTEM OVERVIEW ......................................................................................................................................... 25 5.2 APS PRINCIPLE ................................................................................................................................................. 25 5.3 DIFFERENCES ERS – APS .............................................................................................................................. 30 5.4 ADAPTATIONS OF APS TO ERS .................................................................................................................... 31 5.5 SAFETY ............................................................................................................................................................... 31 5.6 ARCHITECTURE ................................................................................................................................................ 32 5.7 ERS POWER CALCULATION ........................................................................................................................... 33 5.8 EFFICIENCY OF THE ERS ............................................................................................................................... 35 5.9 COST .................................................................................................................................................................... 36 5.10 MAINTENANCE ............................................................................................................................................... 37 5.11 LIMITATIONS .................................................................................................................................................. 37 5.12 FLEXIBILITY .................................................................................................................................................... 37
6 DETAILS OF VEHICLE .......................................................................................................................... 38 6.1 OVERVIEW OF TEST VEHICLE FOR CONDUCTIVE ERS SYSTEM ........................................................... 38 6.2 TEST VEHICLE FOR CONDUCTIVE ERS SYSTEM ....................................................................................... 38 6.3 RESISTOR BANK FOR CONDUCTIVE ERS SYSTEM .................................................................................... 39 6.4 PICKUP’S FOR CONDUCTIVE ERS SYSTEM ................................................................................................. 40 6.5 RESULTS FROM VEHICLE TEST FOR CONDUCTIVE ERS SYSTEM ......................................................... 41
6.5.1 Added cost to vehicle system ........................................................................................................................ 41 6.6 MAINTENANCE ................................................................................................................................................. 41 6.7 SAFETY ............................................................................................................................................................... 42 6.8 EFFICIENCY ....................................................................................................................................................... 42 6.9 WEIGHT ............................................................................................................................................................. 42
7 DETAILS OF POWER SUPPLY SYSTEM FROM ENERGY PROVIDER TO CONDUCTIVE SYSTEM ............................................................................................................................................................ 43
7.1 SYSTEM OVERVIEW ......................................................................................................................................... 43 7.2 INFRASTRUCTURE LOAD ................................................................................................................................ 47

Slide-in Electric Road System Viktoria Swedish ICT Conductive project report Date: 2013-10-18
Page 6 of 63
7.2.1 Maximum load case ..................................................................................................................................... 47 7.2.2 Average load case ......................................................................................................................................... 47
7.3 MAINTENANCE AND SAFETY ........................................................................................................................ 48 7.4 EFFICIENCY OF DISTRIBUTION GRID .......................................................................................................... 48 7.5 COST CALCULATION ........................................................................................................................................ 49
7.5.1 Cost of 130 kV infrastructure ..................................................................................................................... 49 7.5.2 Cost of 30 kV infrastructure ........................................................................................................................ 49 7.5.3 Total infrastructure cost per km ................................................................................................................. 50
7.6 COPPER PRICE ................................................................................................................................................... 50 8 IMPLEMENTATION CONCEPT ......................................................................................................... 51
8.1 IMPLEMENTATION IN POINT TO POINT TRAFFIC .................................................................................... 51 8.2 STAGE TWO AND STANDARDIZATION ........................................................................................................ 51 8.3 MAINTENANCE ASPECTS ................................................................................................................................ 52 8.4 ASSOCIATED INFRASTRUCTURE ................................................................................................................... 53 8.5 LEGAL ASPECTS ................................................................................................................................................ 53
9 DISCUSSION OF RESULTS .................................................................................................................. 54 9.1 WHAT IS THE DIFFERENCE BETWEEN A PLUG-IN HYBRID TRUCK AND AN ERS TRUCK WITH APS TECHNOLOGY? ................................................................................................................................................... 54 9.2 DISCUSSIONS REGARDING THE ALSTOM APS ERS. ................................................................................ 54 9.3 DISCUSSIONS REGARDING THE ELECTRICITY DISTRIBUTION SOLUTION FOR AN ERS BETWEEN STOCKHOLM AND GOTHENBURG. .......................................................................................................................... 55 9.4 HOW DOES THE TRAFFIC SITUATION AND INTENSITY EFFECT THE REQUIREMENTS OF THE GRID? ............................................................................................................................................................................. 56 9.5 A SUMMARY OF THE ESTIMATED TOTAL SYSTEM EFFICIENCY ........................................................... 56
10 FUTURE WORK ....................................................................................................................................... 57 11 ERS REFERENCE CASE BASED ON OVERHEAD LINES ............................................................ 58
11.1 OVERVIEW ....................................................................................................................................................... 58 11.2 OVERHEAD LINE SYSTEMS FOR RUBBER TIRE VEHICLES LIKE FOR BUSES AND TRUCKS ............. 58 11.3 TROLLEY TRUCK SYSTEMS .......................................................................................................................... 59 11.4 CHALLENGES FOR TROLLEY VEHICLES SYSTEM .................................................................................... 59 11.5 SIEMENS EHIGHWAY SYSTEM .................................................................................................................... 59 11.6 ADVANTAGES OF OVERHEAD LINE SYSTEMS .......................................................................................... 60 11.7 DISADVANTAGES OF OVERHEAD LINE SYSTEMS .................................................................................... 60 11.8 COST ESTIMATE OF OVERHEAD LINE SYSTEMS ..................................................................................... 60 11.9 STANDARD FOR OVERHEAD LINES ............................................................................................................. 61
12 WORKS CITED ......................................................................................................................................... 62
Slide-in Electric Road System Viktoria Swedish ICT Conductive project report Date: 2013-10-18
Page 7 of 63
1 AN ELECTRIC ROAD SYSTEM A brief background description of an Electric Road System and the purpose, goal and participants of this project.
1.1 Background
Increasing global pollution and with Peak-oil approaching or possibly even reached calls for new means of transport, non-dependent on fossil fuels. The huge power capacity, enabled by the energy density in the oil, has accustomed and spoiled the automotive-world and raised the competition for new competing technologies, such as the Electric Vehicle (EV).
There is a major challenge to meet the demands placed on a new vehicle such as regarding cost, efficiency, range, and functionality. Great resources are spent to increase the EV range by increasing the vehicle efficiencies and the battery capabilities. Despite this, the energy storage capacity of the batteries is not enough for long-distance transport of EVs and even output power could be a limiting factor. Larger batteries are not necessarily the solution since they require a longer time to recharge or access to charging stations with extreme charge capabilities. Moreover, the battery is a substantial part of the total cost and weight of the EV, which reduces the cargo load capacity, and thereby also the monetary gain for the otherwise less energy-demanding vehicle. To make the EV less dependent on the battery, especially for long distance heavy transport, and at the same time reduce the vehicle cost, a possible solution could be to transfer power to the vehicle from the roadway.
Electric Road Systems (ERS) can be defined as roads supporting dynamic power transfer to the vehicles from the roads they are driving on. An ERS could connect cities and allow the bulk distance to be driven on external electric power instead of using fossil fuels. The propulsion of the short remaining distance outside the ERS network could either be based on internal combustion engine (ICE), or on energy stored in small, on-board batteries optimized for city routes. With this solution, both the costs and the weight of the batteries can be kept small. In addition, there is no need to stop and recharge since this is possible while driving.
Theoretically, ERS could be based on energy transmission to the vehicle from above, from the side, or from under the vehicles. The idea of transmitting energy from above is the most mature technology, it has been used in e.g. trolley buses for many decades. Such a solution is suitable for the heavy transport segment but it excludes passenger vehicles since the current collector would be unrealistically long. Transmitting energy from the side of the road would be suitable for most kinds of vehicles but the potential number of lanes to be electrified would be limited. Electricity transferred from the roadside would also cause increased danger to vehicles in an accident or to people and animals on the side of the road. Consequently, this report addresses the solution of transmitting energy from the road below the vehicle. This solution could have a high potential, as it could be viable for both heavy duty and passenger vehicles and thus sharing infrastructure costs.
Furthermore, there are different ways to transmit energy from an ERS to the vehicles and two of the more commonly discussed solutions are conductively and inductively. In a conductive system, energy is transferred by establishing a physical contact between the vehicle and a conductor built into the road. Consequently, the technology requires a current collector, also known as a pick-up, which follows the electrified road and acts as the interface between the road and the vehicle. With the flexible highway vehicles, unlike trains that are bound to follow the rails, the pick-up needs to be active and capable of following the ERS with the ability to connect and disconnect depending on the driving behaviour and road conditions. With inductive technology, the energy is transferred wireless through a magnetic field and no physical connection between the road and the vehicle is required. Instead of rails in the road, a conductor (comparable to the primary side of a transformer) inside the road generates a magnetic field that

Slide-in Electric Road System Viktoria Swedish ICT Conductive project report Date: 2013-10-18
Page 8 of 63
can be obtained in the vehicle and converted into electrical current. To enable the transmission also this solution requires a type of pick-up, corresponding to the second side of the transformer. To ensure high energy efficiency, the transmission distance and flexibility to follow the road collector are important issues.
From an industrial perspective, the transition towards ERS will significantly affect the business models of most stakeholders involved in road transportation. The existing road transportation system has evolved organically over the last Century, and is today constituted by actors developing technologies and operation subsystems according to an overall technological system logic. Since ERS constitutes a completely new technological system, it entails no predefined interfaces between actors or existing standards between technological subsystems. Compared to the conventional road system, the subsystems of ERS are closely integrated, which affects both future industry structure and future business models. How the technological development of ERS affect business models has to be investigated further to ensure the viability of ERS.
Solving the energy transfer to the EV, an EV has a “tank-to-wheel” efficiency that is significantly higher than a vehicle with an internal combustion engine. From the energy used, there are also no tailpipe emissions or emissions from the energy generation as long as the energy come from renewable energy sources and no energy is wasted when the vehicle is stationary and the engine is idling. Furthermore, an ERS based on a fixed grid for power supply could entail a simplified and more effective way to use renewable energy sources. The energy could also be transferred directly from an efficient large-scale power grid through the road directly to the vehicle engine without passing though the battery and thereby avoid the battery wear and losses.
Despite the increased efficiency of the EV, an increased number of vehicles abandoning fossil fuels for electricity as energy source require increased energy to be generated. If all vehicles in Sweden were electrified it would result in an increase of Sweden’s total electricity consumption. Today, Sweden has relatively low CO2 emissions from energy generation due to usage of nuclear-, hydro- and wind-power plants. To avoid emissions worse than today’s fossil fuels it is important that the generated power comes from renewable resources. If the energy is originally generated from coal or oil, emissions from the vehicle is indeed avoided but the problem is moved elsewhere.
Vehicle emissions affect globally but roads with heavy traffic are in general also a dangerous place to visit. Adopting an ERS should not make it even more dangerous for people and animals on the road regarding road properties and from an electrical point of view. For example both friction properties and driving behaviour due to a rail in the centre of the road and electric magnetic field due to the high voltages in the road must be monitored and considered. It is also of importance that the ERS is not affected or does not negatively affect the roads ability to withstand the prevailing weather conditions.
1.2 Project goals
The experience of continuously transmit electrical energy from a highway road to a vehicle is limited. The project aims to fill this lack of knowledge and experience, especially when it comes to energy efficiencies, installation costs, maintenance costs and safety.
1.3 Project objectives and scope
The project is managed by Volvo GTT and partly financed by the Swedish Energy Agency through the program Fordonsstrategisk Forskning och Innovation (FFI). Volvo GTT is also together with Alstom responsible for the development of a conductive energy transfer solution while Scania and Bombardier together are responsible for the development of the inductive energy transfer solution. Additional partners in the project are Vattenfall, the Swedish

Slide-in Electric Road System Viktoria Swedish ICT Conductive project report Date: 2013-10-18
Page 9 of 63
Transport Administration, Svenska Elvägar, Lund University and the Royal Institute of Technology (KTH).
Both solutions are to be demonstrated and compared in full-scale tests in a realistic environment why two test tracks are being built. In order for the solutions to be comparable, measurements are made during similar conditions and with settings from a common scenario. As no solutions for ERS with energy transmitted from the road are commercially available, similar existing solutions used within other transport sections, such as the tram industry, has been adapted for road vehicles. Most of the adaptations concern the pick-ups, which are specially designed within the project. Also the vehicles have been adapted to be able to connect to the ERS and utilize the energy transferred. A description including cost figures for an ERS with energy transmitted from above the vehicle are included in the report as a reference case.
An increased proportion of vehicles utilizing an ERS would demand new infrastructure to supply the electricity. Computer models have therefore been made by the Lund University to simulate the energy demand for a technical solution and thus being able to estimate cost of the extending infrastructure required. Vattenfall has also analysed and proposed a solution for the distribution grid connection of a “Slide-in road” between Stockholm and Gothenburg and together with the project partners estimated the total investment cost for the required grid infrastructure. KTH has furthermore studied how business models and stakeholders are affected by the ERS.
The proposed solutions are also discussed with the Swedish Transport Administration and other relevant administrative authorities, to jointly reach a solution that to a least possible extent affect the road's function and durability, and also meet the future requirements that will be placed on an ERS.
1.4 Project participants and responsibilities Table 1 Project partners and titles
Organization Person Title
Volvo GTT Richard Sebestyén Project leader and project leader of the conductive subproject
Scania Håkan Gustavsson Project leader of the inductive subproject
Alstom Jean-Luc Hourtane APS product engineering manager Vattenfall Lennart Spante Operational project manager
Vattenfall Swedish Transport Administration Mats Andersson
Projektengagemang (Svenska Elvägar AB)
Per Ranch Project leader of overhead line subproject
Lund University Mats Alaküla Professor KTH Royal Institute of Technology
Mats Engwall Stefan Tongur
Professor Ph.D Canditate
Chalmers Jonas Sjöberg Professor

Slide-in Electric Road System Viktoria Swedish ICT Conductive project report Date: 2013-10-18
Page 10 of 63
Table 2 Slide in project steering committee.
Organization Person Alstom Patrick Duprat Bombardier Christian Köbel Chalmers Jonas Sjöberg KTH Mats Engwall Lund Olof Samuelsson Scania CV Nils-Gunnar Vågstedt Svenska Elvägar Anders Nordqvist Swedish Transport Administration Mats Andersson Vattenfall Johan Tollin Volvo GTT Henrik Svenningstorp
Table 3 Responsibility areas and commitments
Item Description Responsibility Rail for conductive energy transfer
Construction of a solution implemented in the roadbed used for conductively transfer energy to vehicles on the highway.
Alstom
Vehicle movement simulations
Requirements of how a vehicle movement behaves in comparison to road surface lane.
Chalmers
Business model and stakeholders
Defining and analysing the transition to the ERS from a business model and stakeholder perspective.
KTH Royal Institute of Technology
Generic ERS-simulation
Simulation of a generic ERS involving distribution network power flow and thermal loading of network components, all based on a detailed time domain traffic model.
Lund University
Reference case for an ERS
Description of a reference case for an ERS with energy transmitted from above the vehicle
Svenska Elvägar AB
Road construction, maintenance and standards
Specifications of a highway between Stockholm and Gothenburg and the requirements demands on an ERS. Development of an ERS future implementation concept.
Swedish Transport Administration
Road energy supply (e.g. transformer stations and rectifiers)
Technical requirements for the "Slide-in road" power supply system (Stockholm-Gothenburg); analyses of needed power supply, system design and cost analyses for the total electrical distribution system.
Vattenfall
Vehicle adaption, conductive
Development of a pick-up to enable a conductive transfer of energy. Adapt the vehicle to enable a safe consumption of the energy.
Volvo GTT
1.5 Targeted audience
This report intends to describe a technology that enables continuous conductive energy transfer from the road to the vehicles thus allow for a fossil independent transport system. Vehicles intended to utilize this technology ranges from heavy-duty timber transport to lighter personal vehicles and building this system concerns both road constructers, power suppliers and the community structure.
Targeted audience therefore includes both decision-makers within these fields as well as the general public interested in the discussion about creating an ERS that is available for the majority of vehicles.
1.6 Time plan
Project start: October 4, 2010
Delivery of the first edition of the report for the first phase of the project: October 18th, 2013
Delivery of the final edition of the report for the first phase of the project: December 2013

Slide-in Electric Road System Viktoria Swedish ICT Conductive project report Date: 2013-10-18
Page 11 of 63
2 ERS – A NEW TECHNOLOGICAL PARADIGM This chapter describes the transition to the ERS as a new technological paradigm. It defines the general principle of ERS, different ongoing ERS initiatives and the barriers for the implementation of ERS.
Electric Road Systems (ERS) can be described as electrified roads that support dynamic power transfer to the vehicles from the roads they are driving on. The basic principle is to power an electric engine within the vehicle from an external power source that is built into the road infrastructure, see Figure 1. The electrical power is transmitted while the vehicle is in motion, through a pick-up assembled to the vehicle in a similar way as for a trolley bus. The roads would be accessible for both vehicles with ERS-propulsion as well as conventional fossil fuelled vehicles. Further on, the ERS-vehicles would be equipped with a small battery and a potentially smaller internal combustion engine (ICE), which allows the vehicles to drive also on conventional roads outside the ERS network.
Figure 1 Principal design of an Electric Road System (ERS)
Today, there is a common notion among key actors in the industry that ERS technology is technologically feasible and a way to reduce fossil fuel dependency and emissions in the road system (in spite of huge infrastructure investments required for the technology). There are disagreements among the experts whether the transformation from the diesel engine regime to ERS will be realized within 10, 20 or 50 years, but there is a consensus that this transition is possible to come. However, the change is expected to take place gradually, from smaller demonstrations and systems, via closed systems (e.g. mining transportation or city bus loops), to major networks of regional and international highways. Hence, there are several ERS-projects going on around the world at the moment, exploring and evaluating the technology and the possibilities of deploying this prospective system on commercial basis (e.g. Pajala (Trafikverket, 2012); Los Angeles and Long Beach, California (Green Car Congress [1], 2012); Arlanda, Sweden (Elways, 2012); Bordeaux, France; McAllen, Texas (OLEV Technologies, 2011); Lommel, Belgium (Bombardier Transportation, 2012); and Stanford University, California (Green Car Congress [2], 2012)).
Originally, it was actors from the railway industry who developed the ERS based technologies. There are different technological solutions available; the power could be transferred to the vehicle by overhead transmissions or through power sources built into the ground (road). The overhead transmission technology is conductive-based and the vehicle connects to the transmission lines by a type of pantograph, see Figure 2. The ground-based solution could be

Slide-in Electric Road System Viktoria Swedish ICT Conductive project report Date: 2013-10-18
Page 12 of 63
either conductive or inductive. If conductive, the vehicle uses a physical pick-up to connect to an electrified rail in the road; if inductive, there is a wireless power transfer from a coil in the road to a pick-up in the vehicle. Technologically, the overhead line solution is a more mature than the ground-based alternatives.
Figure 2 Technological Alternatives of Electric Road Systems (Wiberg & Rådahl 2012)
ERS technology is already feasible for railroad applications. Deployment on road transportation requires huge investments in the physical infrastructure, but if implemented on full scale, it has significant potential advantages in relation to the existing fossil dependent transportation system; it is fossil independent and emission free1; it is more energy efficient and reduces operation costs (electricity is cheaper than fossil fuel); it reduces noise problems allowing vehicle operations at off-traffic hours, which decreases congestion and even out the energy demands. In addition, it has the potential to reduce vehicle maintenance costs since an electric engine is simpler and lighter than a traditional internal combustion engine although this might not be the case in the short term with different powertrains.
However, the main barriers for implementation of an ERS are related to increased complexities on the system level. The conventional transportation system has evolved organically over more than 100 years and constitutes today an open socio-technological system with different standards and regulations and constituted by different, more or less, autonomous and complementary subsystem. These subsystems – the truck, road, and fuel – are today produced and operated autonomously by different actors, e.g. truck manufacturers, construction companies, road authorities, and oil companies. Initially at least, the ERS-technology requires a more closed system-design, where the subsystems are tightly coupled together. The power train of the ERS-truck needs to be tightly integrated with the power transfer technology, which needs to be integrated with the electric road design, which in its turn needs to be integrated with the regional power grid.
Consequently, there are a number of actors from different industries owning strong interests in the different ERS-technologies, e.g. manufacturers concerning the vehicle and its power-train; railroad manufacturers concerning the power transfer technology and electric roads technology; construction firms concerning the physical infrastructure; and power utilities concerning the electric power supply and operations of the power grid. In addition, there are several new services required in order to manage ERS, e.g. payment systems, logistics, driver management, electricity metering, and safety, Furthermore, software management services are needed to reduce the complexities of the technological interfaces between ERS and its customers.
1 Depending on the energy balance, electricity is not necessary always to prefer from an environmental perspective. However, by pushing for more sustainable technologies in the vehicles, actors of public policy try to increase demand in order to create a pull for greener produced electricity.

Slide-in Electric Road System Viktoria Swedish ICT Conductive project report Date: 2013-10-18
Page 13 of 63
2.1 Stakeholder implications
Based on the observations from the Slide-In project, the primary subsystems of ERS will probably be delivered by firms mainly coming from railway manufacturing industry and by electric utilities that could produce, distribute, and sell electricity. In the following sections, the different actors will be discussed in terms of their role in the conventional road system compared to in the ERS. A comparison could be seen in Figure 3.
Figure 3 Stakeholder transition from the conventional road system towards the ERS.
For the truck manufacturers, power electrification could be seen as a body builder (building application on the truck chassis). This means that the truck should manage electrification independent of which power transfer technology that becomes the standard. However the vehicle will be more integrated with the infrastructure in the new system compared to the conventional road system, as it needs to be developed and connected with the other subsystems. In the beginning of the ERS deployment, ERS could mature in a niche market for different applications (such as mining and bus system). However, in the long term, ERS could come in to mainstream markets of the truck manufacturers (such as long haulage). The role and value of the core competence for the truck manufacturers, currently being the diesel engine, could change with a switch to the ERS. This would also affect the customer value and service network. Thus, a shift to ERS would require the truck manufacturers to acquire new competencies and new business models.
Petroleum firms will most probably continue to play a significant role with ERS (electrified roads and batteries would not be able to supply the whole road transportation system). The role of these firms could however change, from being the dominating fuel supplier, to a secondary fuel supplier. If vehicles do not need to tank as frequently as today, petroleum companies will lose their sale volumes and the number of customers would decrease. This might turn the petroleum firms into new businesses, and the established tank-station networks might complement their current businesses with new applications, such as quick charging and battery swapping.
One of the main implications for construction firms is to ensure safety and durance in controlling the construction and properties of the electric roads. As an actor with experience of large projects, construction firms could take the role of integrating the transfer technologies as well as the electric grid into the road construction. Furthermore, the issue of financing new ERS projects might open a new market for public-private partnerships, where construction firms (or
Slide-in Electric Road System Viktoria Swedish ICT Conductive project report Date: 2013-10-18
Page 14 of 63
other private real estate owners), build and operate electric roads on contracts for public agencies.
The main motivations behind the ERS for the state and agencies is to reduce environmental impacts, oil imports and increase energy efficiency by switching from fossil to electric fuel. All other stakeholders have pointed out that the state and agencies have a key role as facilitators when it comes to investing in infrastructure. The loss in oil taxes and currency savings from oil imports could require new national and international policies. The transition to the ERS might change the financing and owning structure of these roads in order to share the risks and opportunities with private actors that will benefit of new system. The ERS could also be developed as a new export industry in countries that have come far in their development of this technology, such as Sweden, Germany and Korea. Hence, investing in the development of the ERS could result in a new market and thus increased income for states and agencies.
The users of the ERS could benefit from higher energy efficiency in the vehicles compared to diesel engine trucks and thus potentially lower fuel costs (although the electricity prices are expected to rise). ERS could also constitute an image and brand value to be more environmental friendly than other alternatives. Despite this, cargo firms might be reluctant to change to ERS vehicles if the infrastructure is undeveloped in the sense that flexibility and uptime is still better in the conventional road system. It is yet unclear how much the vehicle prices could be affected due to the ERS equipment and new powertrain technology. There are also uncertainties concerning how and to whom the customer should pay for the usage of the ERS.
Road power technology firms could be firms in the railway industry or entrepreneurs. Railway companies have long experience of designing, producing and delivering complete railway systems, including infrastructure and intelligence. Trams in urban transportation are one of the main markets for these firms. Since the past couple of years railway companies have introduced different technologies for power transfer from roads to vehicles. These firms are now trying to broaden the scope for respective technology, to include urban transportation such as busses and cars, but also trucks and cars on highways. This creates a situation were different technologies are competing with each other. Proponents of the inductive and conductive technologies are pushing for their solution and it is uncertain which solution that will win in the end. In addition, there are several unclear issues concerning how the system will evolve: Will these actors become systems or component providers? Will they sell licenses of their components to other actors or will it be exclusive roads? Will they develop alliances with partners to deliver a complete ERS or will they provide generic technologies? And how should the revenues within the new value network be shared?
Power companies produce electricity through different energy sources, e.g. fossil fuels, nuclear and renewables. The traditional way of making money is to sell electric power per kWh to households and companies. In the ERS scenario, electricity will be the new primary vehicle fuel, which opens a new market for the power companies. Designing and delivering power station in connection to the power transfer technology and the road is a potential business of the power companies. The power grid and stations need to be dimensioned based on the amount of power required for the vehicles at the particular road section. The main question for the power companies is: Who will finance the investments in the power subsystem and how should the revenues from the vehicle ́s electricity consumption be captured?

Slide-in Electric Road System Viktoria Swedish ICT Conductive project report Date: 2013-10-18
Page 15 of 63
2.2 A Business model Perspective
In Figure 4 the issues related to the transformation to ERS are summarized from a business model perspective. The model is constituted by the three main business model components Value Proposition (what the selling points are for the actor to its customer/user), Value Creation (technologies, core competencies, alliances, etc), and Value Capture (how to charge for the value provided). As shown in the figure, the most significant barriers holding back a systemic change to ERS are institutional, rather than purely technological, and related to issues such as standardization, competition, core competencies, infrastructure deployment, financing, and solutions for value capture for the different stakeholders.
Figure 4 Business model for an ERS

Slide-in Electric Road System Viktoria Swedish ICT Conductive project report Date: 2013-10-18
Page 16 of 63
3 SIMULATION OF GENERIC ERS In order to understand the effects and requirements from an ERS, an ERS simulation system has been developed at Lund University within the project. The system simulates a simple road with no intersections and is implemented in MATLAB. Three different types of simulations are integrated into the system:
1. Traffic simulation
2. Electric simulation of the power system
3. Thermal simulation of the power system
An illustrative animation tool has also been developed to conveniently visualize the results from the simulations. The core is the traffic simulation, which has explicit representation of all vehicles and uses a fixed time step of one second. To illustrate general behaviour of the system and the capability of the software tools, an ERS example has also been composed at Lund University.
3.1 Simulated ERS example
The illustrations hereon are all based on a synthetic road example with information from a Nordic road. It is a two-lane highway with a length of 20 km and altitude profile as shown in Figure 5, with a maximum slope of 7 %.
Figure 5 The relative altitudes along the road.
The simulated traffic is about 1450 cars and 230 trucks per hour. This is a realistic dimensioning traffic for an average daily traffic of 16000 cars and 3500 trucks. (Hydén, 2008) (Vägverket, 1998) (Vägverket, 2004) Four different vehicle types are defined; car, distribution truck, light loaded long haul truck and heavy loaded long haul truck see Table 4.
Table 4 Specifications for the different vehicle classes.
Car Distribution truck
Lightly loaded long haul truck
Heavy loaded long haul truck
Vehicles/km 15 1 1 1 Mass (kg) 1500 22000 20000 50000 Max power (kW) 100 200 350 350 V max (km/h) 110 92 82 82 V max std. dev. (km/h) 7 2 2 2
The cars have an average power consumption of approximately 20 kW while the trucks consume approximately 120 kW on average. All vehicles are assumed to use the ERS if available; otherwise they run on battery power. Regenerative braking charges the battery, but power flow from vehicle to the ERS is not allowed. When running on ERS the battery is charged or discharged with a proportional controller to keep the battery’s state of charge close to the optimal level. The initial states of charge are chosen so that no significant net battery charging or discharging occurs when averaged over all vehicles.
The road is electrified in 100 m segments in the right lane in each direction. An overview of the power distribution system is shown in Figure 6. It is assumed that the thermal behaviour of all

Slide-in Electric Road System Viktoria Swedish ICT Conductive project report Date: 2013-10-18
Page 17 of 63
components can be modelled as a first order time constant of 1800 seconds and that the losses at 100 % load rises the temperature to the rated temperature in steady state, see section 3.4.
Figure 6 An overview of the simulated power system. All components are three phase components.
3.2 Traffic simulation
The main goal of the traffic simulation is to properly reflect how the ERS loads the power system. This load needs to have realistic correlations in time and space along the road. The load profile for the synthetic road example is given in Figure 7. The color of each pixel in this image represents the power drawn from a 100 m section of the road in both travel directions. The higher power levels indicated by red or yellow are often the result of one or more heavy vehicles. The inclined lines indicate one or more vehicle moving along the road. More inclined lines indicate slower moving vehicles, this is for instance seen around the 11 km mark where heavy vehicles slow down in the steep hill. The higher power levels indicated by red or yellow are often the result of one or more heavy vehicle. The cars show up as less inclined light blue lines if at all. Vehicles moving uphill uses more power and are most clearly visible. Some vehicles moving downhill do not use any power from the road at all and are therefore not visible. The bunching of lines indicates some level of traffic congestion. Vehicles in the left lane of each direction do not show up at all since they have no access to power from the road. The parts of the road with higher inclination and higher altitude compared to the surrounding parts of the road are heavier loaded than average. The increased load at the tops of the hills is due to less charged batteries and acceleration after slowing down in the up hills. This would probably change if the vehicles had more intelligent battery charging control that took the expected regenerative braking on the approaching downhill slope into consideration.
Figure 7 The power consumption per segment as a function of time and position along the road.
The road is divided in to 100 m sections that include the right lane of both travel directions.

Slide-in Electric Road System Viktoria Swedish ICT Conductive project report Date: 2013-10-18
Page 18 of 63
The traffic model is based on the intelligent driver model (IDM) and the Lane-change Model MOBIL. (Treiber, Hennecke, & Helbing, 2000), (Helberg & Treiber, 2002), (Treiber M. , 2011) These have been adapted to fit the simple fixed step solver used in this simulation. A typical traffic situation is shown in Figure 8.
Figure 8 A typical traffic situation on 2 km of the road. The road has four lanes. The larger rectangles represent trucks and the
rest represent cars.
3.3 Electric power system simulation
The main goal of the electric power system simulation is to calculate the voltage drops and the losses in the different components. The electric simulation consists of calculating a static power flow for each time step. The power system used is shown in Figure 6 and the resulting voltages to the ERS can be seen in Figure 9.
The voltages are given in per unit (p.u.), where nominal voltage is 1 p.u. Normally in industrial applications the voltage level should be kept above 0.85 p.u. This level is violated here for short periods at specific locations. What voltage levels that will be acceptable in the respective system solution need to be specified. A control system that slightly reduces the load at low voltages could be part of the solution. The spacing of the transformers along the road could also be adjusted to better match the average local power consumption of the traffic.
Figure 9 The voltage in the low voltage system along the road over time in per unit. The position of the feeding transformers
can clearly be seen. The lowest voltage is 0.81 p.u. The 99 % percentile of the voltages is 0.93 p.u.
3.4 Thermal power system simulation
An ERS gives a very fluctuating load locally, and in order to get an optimized power distribution system this must be taken into consideration. The main limiting factor for the current capability of electrical components is overheating. Therefore a very simple thermal simulation of the power system has been implemented. Each component is modelled by a single

Slide-in Electric Road System Viktoria Swedish ICT Conductive project report Date: 2013-10-18
Page 19 of 63
thermal mass with a cooling time constant of 1800 seconds. This can be described by the equation:
Where t is the time, T(t) is normalised temperature of the component at time t, tc is the time constant of 1800 seconds, Ploss(t) is the losses in the component at time t and Ploss_rated is the losses in the component at rated power. The behaviour of the thermal model can be seen in Figure 10.
Figure 10 The blue line shows the cooling of an unloaded component. The green line shows the temperature of a component
that is unloaded until t=900 s and then loaded at rated power. The red line shows the temperature of a component loaded at 71 % of rated power.
This is a very conservative thermal model. It is assumed that the steady state temperature of the components at rated current and voltage will be the rated temperature. The temperatures are initiated to the worst possible valid value, which is 100 % of rated temperature for each component; this ensures that the temperatures are not underestimated. The result from such a simulation can be seen in Figure 11. The transformers around the 10 km mark need reinforcements the other transformers are able to handle the load. Similar calculations are done for all cables as well; the result for the 400 V cables can be seen in Figure 12.
Figure 11 Temperatures of the 22/0.4 kV transformers along the road over time. Temperatures are given as percent of the
allowed temperature rise. Ambient temperature corresponds to 0 % and rated temperature corresponds to 100%. Observe that the time axis start 900 seconds after the simulation starts. The components are initiated at 100 % temperature at the beginning
of the simulation.
⎟⎟⎠
⎞⎜⎜⎝
⎛−= )(
)(1)(
_
tTP
tPtdt
tdT
ratedLoss
Loss
c

Slide-in Electric Road System Viktoria Swedish ICT Conductive project report Date: 2013-10-18
Page 20 of 63
Figure 12 Temperatures of the 400 V cables along the road over time. Temperatures are given as percent of the allowed
temperature rise. Ambient temperature corresponds to 0 % and rated temperature corresponds to 100%. Observe that the time axis start 900 seconds after the simulation starts. The components are initiated at 100 % temperature at the beginning of the
simulation. As can bee seen all the 400 V cables operate below the rated temperature.
3.5 Result summary
The total average power consumed was 14 MW or 700 kW/km. The losses in the system are given in the Table 5 below:
Table 5 The losses in different classes of components as percent of the total power consumption.
Losses Total 6.4 % 130/22 kV transformer 0.4 %
22/0.4 kV transformers 1.3 %
22 kV cables 2.0 %
0.4 kV cables 2.7 %
Statistics for simulated temperatures are given in Table 6. The values are given for the last 900 seconds of the simulation. As noted before, temperatures are given as percent of the allowed temperature rise. Ambient temperature corresponds to 0 % and rated temperature corresponds to 100%.
Table 6 The average and maximum temperatures for different classes of components as percent of the rated temperature rise. The 130/22 kV transformer is slightly overloaded in this scenario, the rest of the components are below rated temperatures.
Component category Average temperature Max Temperature 130/22 kV transformer 100 % 103 % 22/0.4 kV transformers 81 % 103 % 22 kV cables 61 % 90 % 0.4 kV cables 56 % 91 %
When interpreting these values it is important to remember that the system is initiated to 100 % and a component with no losses will have an average temperature of 48 % and a max temperature of 61 % since the simulation does not run to a (quasi) steady state.
3.6 Recommendations
The developed simulation tool is useful when investigating different design rules for the power distribution system for an ERS and is a good starting point for developing a simulation tool for actual roads with intersections and so on. The simulation routines can thus serve as a starting point for future development.

Slide-in Electric Road System Viktoria Swedish ICT Conductive project report Date: 2013-10-18
Page 21 of 63
4 GENERIC SCENARIO DESCRIPTION A fixed generic scenario was defined within the project in order to allow calculations and demonstration to be comparable both within the project and for other system solutions. The figures used below were also used to estimate the requirements for the ERS infrastructure, maintenance and also the total cost of ownership.
The generic scenario description includes the main parameters required to calculate or simulate the:
• Energy demand per road km, • Infrastructure required to supply the demanded energy, • Energy transfer efficiency from road to vehicle, • ERS construction and safety • Vehicle demands required to be able to utilize the ERS and • Total ERS solution costs.
Described below are the values for the vehicles, route, route topology, environmental conditions and traffic conditions.
4.1 Heavy Vehicle definitions: Length: 16,5 m Weight: 40 tons Front size: 10 m2 (0.53 drag coefficient) Rolling resistance coefficient: 0,5
Diesel engine power: 500 hp / 368 kW Diesel engine efficiency: 42 % Diesel engine characteristics: See reference: (Scania, 2012) Electric motor power: 120 kW continuous. Battery charging is included. Electric motor efficiency: 95 % Energy storage capacity: 250 kWh Auxiliary’s power: None Back charging to battery: Yes
4.2 Passenger car definitions: Length: 4.6 m Weight: 1.65 tons Front size: 2.28 m2 (0.29 drag coefficient) Diesel engine power: 215 hp / 158 kW Diesel engine efficiency: 42 % Diesel engine characteristics: See reference: (Polestar, 2012) Electric motor power: 20 kW continuous, battery charging is included. Electric motor efficiency: 95 % Energy storage capacity: 11.2 kWh Auxiliary’s power: None Back charging to battery: Yes
Figure 13 Typical long haulage truck

Slide-in Electric Road System Viktoria Swedish ICT Conductive project report Date: 2013-10-18
Page 22 of 63
Vehicle lateral behaviour: The vehicles are assumed not to deviate more than 50 cm from the middle of the lane. During 90 % of the time they are assumed not to deviate more than 20 cm from the middle of the lane.
For simplification of the simulations all vehicle components are 20 °C at start of the route and the energy storage is fully charged.
4.3 Route topology
The highway, Figure 14, between Stockholm and Gothenburg via Jönköping is used as the reference distance.
Figure 14 The highway from Stockholm to Gothenburg via Jönköping.
Distance: 447 km Inclination: 0-1 % = 57,5 % of the distance
1-2 % = 22,5 % of the distance > 2 % = 20 % of the distance
Speed: 90 km/h Figure 15 below describes the topology of the route.
Figure 15 The topology of the road between Stockholm and Gothenburg.
0
50
100
150
200
250
300
350
0 50 100 150 200 250 300 350 400 450Distance [km]
Altitude [m]

Slide-in Electric Road System Viktoria Swedish ICT Conductive project report Date: 2013-10-18
Page 23 of 63
Road% !!!!!!!!!!!!!!!!!!!!!!!!!!!!!!!!!!!!1 Wearing!course!!
(Slitlager)!40!mm!!
2 Asphalt!bound!gravel!(Asfaltsbundet!grus,!AG)!
150!mm!
3 Unbound!base!material!!Gravel!size!0D45!mm!
80!mm!
4 Reinforcing!layer!!Gravel!size!0D90!mm!
480!mm!
Roadside%
5 Wearing!course!(Slitlager)!
40!mm!
6 Asphalt!bound!gravel!(Asfaltsbundet!grus,!AG)!
100!mm!
7 Unbound!base!material!!Gravel!size!0D45!mm!
130!mm!
8 Reinforcing!layer!!Gravel!size!0D90!mm!
480!mm!
0.5 m
2.0 m 3.50 m 3.50m 1.25 m
Roadside Road
1!
2!
3!
4!
5!6!
7!8!
4.4 Road and embankment parameters: Type of road: Swedish highway, see Figure 5.1 in (Vägverket, 2004) and
Figure 16 below. Emergency lanes: No Number of electrified lanes: 1 in each direction Distance to embankment from road: 10, 9 or 6 m depending on the speed limit 110, 90 or 70
km/h. See chapter 7 in (Vägverket, 2001). Depth of roadside equipment: Unlimited Underground conditions: Dirt Level of exposure to frost damage: 2 on a scale 1-4 see (Statens geotekniska intitut, 2008) Estimates of construction and design methods are based on the information in Figure 16.
Figure 16 Cross section of a typical Swedish highway construction.
4.5 Environmental conditions:
The ERS must withstand the Nordic weather conditions, which are described in average in Table 7 and along the defined route between Stockholm and Gothenburg, Table 8. The average humidity fluctuations in Sweden used as reference in this report are presented inTable 9.
Table 7 Average monthly surface temperatures.
Average monthly air temperature variation over the year in Celsius degrees: Jan Feb Mar Apr May Jun Jul Aug Sep Oct Nov Dec Max. -1 0 3 9 15 20 21 20 15 10 4 1 Min. -6 -7 -4 -1 4 8 10 9 6 4 -1 -5
Table 8 Road surface temperature variation over the year.
Surface temperature variation over the year in Celsius degrees: Jan Feb Mar Apr May Jun Jul Aug Sep Oct Nov Dec
Gothenburg -1.1 -1.2 1.6 5.8 11.6 15.6 17 16.2 12.7 8.9 4.2 0.8
Jönköping -2.6 -2.7 0.3 4.7 10 14.5 15.9 15 11.3 7.5 2.8 -0.7
Stockholm -2.8 -3 0.1 4.6 10.7 15.6 17.2 16.2 11.9 7.5 2.6 -1

Slide-in Electric Road System Viktoria Swedish ICT Conductive project report Date: 2013-10-18
Page 24 of 63
Table 9 Humidity variation over the year.
Humidity variation over the year in percent: Jan Feb Mar Apr May Jun Jul Aug Sep Oct Nov Dec
Göteborg 85 82 77 71 66 69 73 74 79 81 86 86
Jönköping 84 80 71 62 59 60 65 66 70 73 83 86
Stockholm 85 81 78 72 65 66 72 75 81 84 88 87
Increased level of road surface due to frost: Between 10mm to 80mm, see Table A4-11 in chapter A4.5.3 in (Vägverket, 2009).
4.6 Traffic conditions in the electric lane
Figures of traffic intensity in both driving directions are measured with hourly resolution provided to the project by the Swedish Transport Administration at two points, one east of Jönköping and one west of Jönköping. Roughly 21 500 vehicles travel on the road each day east of Jönköping and around 12 800 vehicles travel on the road west of Jönköping. An example of the measurements is seen in Table 10 from the city of Rångedala near Borås.
Table 10 The mean traffic flow in the city of Rångedala, Monday-Friday 2012-01-01 to 2012-10-23 (Vehicles per hour)
The mean traffic flow in the city of Rångedala Direction of traffic
Westward Eastward Time Trucks Small vehicles Total Trucks Small vehicles Total 01:00 20 24 44 14 36 50 02:00 16 14 30 8 15 23 03:00 11 11 22 7 12 19 04:00 12 17 29 7 15 22 05:00 13 42 55 7 19 26 06:00 22 104 126 16 67 83 07:00 36 330 366 37 192 229 08:00 40 443 483 54 312 366 09:00 46 330 376 71 322 393 10:00 49 277 326 64 303 367 11:00 52 260 312 64 304 368 12:00 60 260 320 63 318 381 13:00 68 273 341 58 320 378 14:00 74 314 388 56 333 389 15:00 75 358 433 57 367 424 16:00 77 410 487 63 460 523 17:00 72 492 564 64 595 659 18:00 63 414 477 63 491 554 19:00 48 311 359 60 335 395 20:00 41 215 256 58 214 272 21:00 32 177 209 50 152 202 22:00 27 128 155 24 97 121 23:00 23 87 110 24 97 121 00:00 22 51 73 12 58 70 Total number 999 5342 6341 1013 5458 6471
Time between vehicles at flat road: 1s, measured back to front Time between vehicles going uphill: 1s, measured back to front

Slide-in Electric Road System Viktoria Swedish ICT Conductive project report Date: 2013-10-18
Page 25 of 63
5 DETAILS OF CONDUCTIVE SYSTEM The chapter describes and discusses the Alstom APS conductive power transfer solution for electrifying roadways. It includes a description of the general concept, safety, power calculations and efficiency.
5.1 System overview
Since 2003, a conductive system at ground level called Aesthetic Power Supply (APS), developed by Alstom is in Service for feeding the tramway in Bordeaux city in France. This solution was developed to supersede the overhead line for aesthetic reasons and to offer an alternative solution to the cumbersome installation of poles in the crowded subsoil in the city centres.
This system is now a proven design system. The APS system is implemented in 3 other cities in France: Reims, Angers and Orléans. The tramways run already more than 12,5 millions km on APS track.
With the projects under construction in Tours, new constructions in Bordeaux and Dubaï, the APS will equip 188 tramways and 63 km of single track.
5.2 APS principle
System
The basic principle is a segmented power supply rail, which is fully integrated into the track platform. The Aesthetic Power Supply presents no danger to persons or equipment. The principle consists of only supplying voltage to that section of the rail that is physically enclosed within the area occupied by the vehicle.
This system is designed to deliver the same power supply as an OCL does, delivering to a running tramway a power of 1,1MW with a voltage of 750VDC and a current of 1500A. The system is compatible with all existing tram lines including crossings and turnouts and it may be combined with classic OCL power supply equipment.
The power boxes (PB), supplying energy to the APS tracks, are fed from 900kW substations installed every 2km as can be seen in Figure 17.
Figure 17 APS principle
Track 1
Track 2
~2km
~1km ~3min
Substation750VDC 900kW
Substation750VDC 900kW
Substation750VDC 900kW
Substation750VDC 900kW
Substation750VDC 900kW
Supervision
Ethernet LAN or MAN
PowerSupplynetwork
PowerSupplynetwork
PowerSupplynetwork
PowerSupplynetwork
PowerSupplynetwork
Headway

Slide-in Electric Road System Viktoria Swedish ICT Conductive project report Date: 2013-10-18
Page 26 of 63
Current collection
The tramway is equipped with 2 collector shoes sliding on the same segment, spaced more than 3m in order to ensure than at least one collector shoe collects the power if the second one is above a neutral zone.
On board equipment
The on board equipment for APS compatibility is made of:
• 2 collector shoes • The APS switching & control unit. • A battery to provide on-board autonomy while no power is delivered from the collector
shoe.
Figure 18 On board APS equipment
Infrastructure
The APS infrastructure is embedded in the track and is composed of power rail segments and power boxes manholes, see Figure 19. The power to the tram is activated only when a connection between the tram and APS power box is established.
Figure 19 APS infrastructure components
The power rail segments have a maximum length of 11m. It is located in the centre of the track, between the running rails. Each segment is made of a conductive section of 8m and an isolating section of 3m, see Figure 20. The length of the isolating section allows crossing of specific zones like crossing the running rail in turnouts or crossing switching mechanisms with an uninterrupted supply of energy. The infrastructure is fitted with a loop for tramway presence detection. The power rail delivers a segmented live polarity of the DC power source through the surface conductive layer, see Figure 21, and the other polarity is given through the running rail at a voltage very close to the earth voltage.
APSBattery
APS Swithing& control unit
APSCollector shoes
APSDriver console
APSDriver console

Slide-in Electric Road System Viktoria Swedish ICT Conductive project report Date: 2013-10-18
Page 27 of 63
Figure 20 Description of the APS rail
Figure 21 Cross section of the APS rail
The power boxes are located in manholes between tracks, between rails or beside the tracks underground every two segments (22m) along the line. Each power box contains all upstream and downstream segment switching and supply devices, as described in Figure 22, and is mainly composed of:
• Watertight envelope for protection of the electronic and power equipment from dust and liquids. It also protects the outside environment from electrical hazard.
• Power contactors (Co) to deliver the energy to each segment
• Contactor (Cm) to connect the segment to the 0Vr per segment
• Electronic unit to manage the safety line between power boxes
• Isolating switch (IS) to set the power box in an “isolated” status using redundant components, allowing continuously checking of the voltage of the APS segments. In the isolated status, the PB does not deliver power to the tramway anymore and must be physically replaced to recover the full service.
• Communication unit reporting the box’s status to the sub-station and transmitting remote control for box isolation or inhibition.
APS contact rail area
APS rail isolation areas
3 m 8 m (min 5m) 11m APS rail monoblock segment APS (min 8m)

Slide-in Electric Road System Viktoria Swedish ICT Conductive project report Date: 2013-10-18
Page 28 of 63
Figure 22 Power box
The box design is called intrinsic safety: Any breakdown leads to the system being in a safe condition due to the absence of energy. Moreover, equipment on standby is safe and only active circuits may supply voltage to power segments.
The trams have dual collector shoes to collect current from the APS system. When one collector shoe enters a neutral area or an isolated PB, the power is drawn form the second collector shoe, see Figure 23. Co contactors only operate when the collector shoe is in the neutral area. This means that the Co contactor does not switch during a high charge to reduce the strain on the components.
Figure 23 Current drawn from multiple collector shoes
The PB continuously transmits a safety signal to the substation. If the safety signal is not received, the APS equipment at the substation will immediately open the traction circuit breaker and close a short-circuit, ensuring safety for a whole section (2km), see Figure 24.
KOOKOKOK OK OK OK OK
Live conductive segment
Power transfer
IS
Earthed segment
Communication Bus CAN
Co
Cm
Detection loops
Co
Cm
Safety line logic control
Contactors Co, Cm or isolation management Safety line
logic control
Earthing verification
Earthing verification
D 2oo2 reception
modules
D 2oo2 reception
modules
Feeder 0Vr Feeder +Va
230V electronic 230V contactors 230V isolation
Safety line communication bus CAN
Safety and functional logic
Fuse

Slide-in Electric Road System Viktoria Swedish ICT Conductive project report Date: 2013-10-18
Page 29 of 63
Figure 24 Function of the safety signal
Real time supervision
Supervision equipment (APS CAMS) offers to the maintenance a facility to easily identify failed equipment, see Figure 25. It is also used for: · Data logging of APS information; · Issuing commands to the APS equipment for PB inhibition or isolation; · Provides graphical and interactive views of APS information; · Archiving of APS information for potential post-treatment; · An ergonomic real time or historical monitoring of the APS data; · An interface to the SCADA system.
Figure 25 APS CAMS system
KOOKOKOK OK OK OKKO
An on-‐board autonomywith batteries while no power
from the collector shoe

Slide-in Electric Road System Viktoria Swedish ICT Conductive project report Date: 2013-10-18
Page 30 of 63
5.3 Differences ERS – APS
There are some significant differences between the APS system, designed for tramway in a cityscape, and an ERS. Some of the major differences are that different vehicles are utilizing the ERS and the amount of traffic on the road.
Different vehicle sizes
In contrast to a tram system, where the vehicles are strictly controlled, there will be several different vehicles utilizing an ERS. These vehicles, such as trucks and cars, have different lengths and the APS segments would be too long to be covered by the vehicle when alive, see Figure 26.
Figure 26 A car is significantly shorter than a tram and will not cover a whole APS segment.
With shorter vehicles the safety protection of the segment must be considered, for example like virtual zones in front of and behind the vehicle. Another implication is that it is impractical to have 2 collector shoes spaced with 3m for small cars. Other differences between a tramway system and a roadway are described in Table 11.
Table 11 Differences between tramway and road
Tramway Road Pickup fixed on the car body and cantered on the APS track thanks to the running rail, guiding the tramway.
Pickup lateral positioning autonomy required.
Current collection for one polarity. Return current on the running wheels.
Current collection for at least 2 polarities.
Current collection max power = 1000kW. Current collection max power = 120kW.
The different traffic conditions also imply additional challenges, see Table 12. Table 12 Challenges caused by different traffic conditions between a tramway and a roadway
Tramway Road 1 tramway every 3 minutes 1 car every 2 seconds 2 tracks Several tracks Power 0,5MW / km Power 2 to 10MW / km Max power per segment: 1,1MW Max power per segment : 120kW

Slide-in Electric Road System Viktoria Swedish ICT Conductive project report Date: 2013-10-18
Page 31 of 63
5.4 Adaptations of APS to ERS
The APS technology or principle is here adapted to the ERS as can be seen in Figure 27. The sizing of existing components, designed for tramway should be optimized to match the actual ERS requirements. The power box switching technology must consider the number of switching which is much greater for ERS and a maximum power, which is much lower for ERS.
Figure 27 APS technology adapted to an ERS
5.5 Safety The basic safety principle is based on a virtual moving zone in front of and behind the vehicle. « As it is dangerous to stay in front of a running car, the energization of the platform in the dangerous zone does not change the level of the risk. » The minimum speed for energization is a key for the calculation of the segments length. The power will be delivered only to vehicle having a speed between 60km/h and 100km/h. A Road Safety Assessment is required.
Assumptions: • Min speed = 60km/h (17m/s) • Human time to escape = 1sec • Min Distance between collector shoe and front / rear : Lc = 2m • Sf = Sr ~ 17m • Result : Segment length = Sf + Lc = 19m
Figure 28 Description of the Danger size and an assumed safe segment length.
Sf = Danger zone ~ 17mmin 60km/h
Sr = Inaccessible zone = 17m min 60km/h
Lc=2m
Lc=2m

Slide-in Electric Road System Viktoria Swedish ICT Conductive project report Date: 2013-10-18
Page 32 of 63
The speed detection in the ERS is located in a specific loop upstream the segment to energize and it is only activated by a vehicle capable of receiving the energy from the road in the correct speed, see Figure 29.
Figure 29 Energy activated by a capable vehicle within the correct speed limits.
Below in Figure 30 is a description of how the system could detect both the vehicle speed and direction to verify if the energy should be activated.
Figure 30 Detection of a ERS vehicle’s speed and direction
5.6 Architecture
Substations with 750VDC are located every 968 meters to feed the ERS. Dual APS cabinets are used to monitor and redundantly control the 22 power boxes in each direction, see Figure 31. In each direction of the track, 210 mm2 copper cable is required for 750VDC and additionally 210 mm2 copper cable with 0 VDC for return current.
Segm
ent 2.Up
SD 2.Up
Segm
ent 1.Dn
Segm
ent 2.Dn
Segm
ent 3.Up
Segm
ent 3.Dn
Segm
ent 4.Up
Segm
ent 4.Dn
Segm
ent 5.Up
Segm
ent 5.Dn
Segm
ent 6.Up
Segm
ent 6.Dn
SD 2.Dn SD 3.Up SD 3.Dn SD 4.Up SD 4.Dn SD 5.Up SD 5.Dn SD 6.Up SD 6.Dn
SD : Oriented speed Detection
P1P2P3N

Slide-in Electric Road System Viktoria Swedish ICT Conductive project report Date: 2013-10-18
Page 33 of 63
Figure 31 Alstom ERS system architecture
5.7 ERS Power calculation
The Power calculation is considered at maximum load in order to evaluate the minimum voltage available at the truck level.
The cable sizing is mainly due to the thermal sizing at nominal power, as a consequence of the required cable section, the voltage drop is lower than 60V, which is reasonable for the on board traction equipment and for the voltage difference between the 0V and the earth.
Maximum load assumptions:
• A set of trucks are running in a line, each consuming the maximum power of 120kW with an intermediate time between truck fronts of 1.66sec. This is equal to 1 second measured between truck rear and front as in the generic scenario. With a speed of 90km/h, then the distance between the trucks is 41.5m. The power distribution is authorized by the system up to 100km/h. Nevertheless the electric sizing is based on trucks having the highest required power (120kW) but with speed limited to 90km/h.
• PB spacing is 44m and the max power per power box is assimilated to a max power of 127 000W ( 120kW / 41.5m x 44m).
• 210mm² cable is used for feeding one lane and additionally 210mm2 for return current. One section of 210mm² could preferably be realized with 3 x 70mm² cables in parallel.
• The total length of 70mm2 conductor in the feeder cables will be roughly 6300km. (6 conductors per lane, two lanes and 40 meters of extra 70mm2 cable for various connections to/from the PB ́s on every 44 meters of road)
• 22PB between 2 substations (968m) • The sub-station delivers an output voltage of 750V even at max load.
The maximum load configuration gives the following Table 13 and the voltage drop in each PB can be seen in the Figure 32 and Table 14.
OV OV OV OV
Track 1
Track 2
22 Power boxes
750VDC 750VDC
ALSTOM
210mm² copper cable (3 cables 70mm² in parallel for each track)
22 x 44m = 968m for 1,5MW/km (or longer if only 1MW per km)
22 Power boxes
APS Cabinet APS Cabinet APS Cabinet APS Cabinet
Two 210mm2 copper cables for each lane

Slide-in Electric Road System Viktoria Swedish ICT Conductive project report Date: 2013-10-18
Page 34 of 63
Table 13 The configuration as result of the maximum load case
Designation Symbol Value Number of PB per 1/2 section per track n 11 Power per truck PT 120 000W Power per pb every 44m P 127 229W Resistance Cable inter-PB R 3.35mOhm Distance inter-PB L 44m Distance inter-truck LT 41.5m Distance inter sub-stations LSST 968m Res Cu 20°C Ro 1.610-8Ohm.m Cable section S 210mm² Power requested by the trucks PuserMax 1 400 kW Power delivered by 1/4 substation P1DepMax 1 510 kW Efficiency at max power due to cables Efficiency 92.7% Sub Station max power (4 departures) PSSTTot 6 040kW PB1 is the first power box closest to the sub-station while PB11 is the power box located in the
middle of the section where the voltage drop is the most severe due to redundant feeders from two directions.
Figure 32 Voltage drop at each PB during maximum load case
Table 14 Voltage drop visualized with truck position during maximum load case
Node Voltage Track Position
Track Current
Feeder Current
PB1 737,5V 44m 173A 2013A
PB2 725,9V 88m 175A 1841A
PB3 715,3V 132m 178A 1666A
PB4 705,8V 176m 180A 1488A
PB5 697,3V 220m 182A 1307A
PB6 690,0V 264m 184A 1125A
PB7 683,8V 308m 186A 941A
PB8 678,8V 352m 187A 755A
PB9 675,1V 396m 188A 567A
PB10 672,5V 440m 189A 379A
671.3V
600V
650V
700V
750V
800V
PB 0 PB 1 PB 2 PB 3 PB 4 PB 5 PB 6 PB 7 PB 8 PB 9 PB 10 PB 11

Slide-in Electric Road System Viktoria Swedish ICT Conductive project report Date: 2013-10-18
Page 35 of 63
Average load assumptions:
• An average load of 1 500 kW per km for 2 tracks (up and down). • Consequently an average of 33 kW per power box every 44m. • A maximum current density of 2,3 A/mm² in the cable.
The average load configuration gives the following Table 15 and the voltage drop in each PB can be seen in the Table 16.
Table 15 The configuration as result of the average load case
Designation Symbol Value Average power per km 2 tracks P 1 500 000W
Average power per pb P 33 000W
Current density J 2.3A/mm²
Average Power requested by the traffic 2 tracks 1 section
PuserMean 1 452kW
Average Power delivered by the substation P1DepMean 1 479kW
Efficiency at average power due to cables Efficiency 98.2%
Average nb of trucks per section 2 tracks nbTrucks 22
Table 16 Voltage drop visualized with truck position during average load case
Node Voltage Track position
Truck Current
Feeder Current
0 750.0V 0m 493A
PB1 746.8V 44m 44A 493A
PB2 743.8V 88m 44A 449A
PB3 741.1V 132m 45A 404A
PB4 738.7V 176m 45A 360A
PB5 736.6V 220m 45A 315A
PB6 734.8V 264m 45A 270A
PB7 733.3V 308m 45A 226A
PB8 732.1V 352m 45A 181A
PB9 731.2V 396m 45A 135A
PB10 730.6V 440m 45A 90A
PB11 730.3V 484m 45A 45A
5.8 Efficiency of the ERS
Estimating the efficiency of the ERS system is more complex than measuring the difference between the amount power transferred to the vehicle and what is actually received. The efficiency measurement depends on several different independent dynamic factors that make it difficult to give a definite correct value in this report. One example is the cable material used and the amount of ERS vehicles and as a result the voltage drop in the cables that is not linear with the power transferred. In this report copper cables are used and the cable losses estimated to 1.8%. Another example is that a large proportion of the efficiency losses depend on the friction between the pick-up and the road, which is highly dependent on the road conditions, force applied, the vehicle speed and specific to the materials used. To give a preliminary example, measurements from the tram industry were adapted to the ERS circumstances earlier described in the generic scenario description and presented below in Table 17. The material used in the pick-up shoes is cast iron, which approximately results in 20 % losses of the vertical force. The force applied on the collector shoe on an APS tramway is 150N. This corresponding

Slide-in Electric Road System Viktoria Swedish ICT Conductive project report Date: 2013-10-18
Page 36 of 63
force on the APS ERS shoes is not known and will probably be lower than 4 times 150N used in the calculation.
Table 17 Scenario description for APS-ERS efficiency calculations
Designation Symbol Value Section length d 1 000m Max number of vehicles per hour ( See Table 9) NbV 659 Force per shoe (20% of 150N) f 30N Energy for 1000m section: E = f * d E 30 000J Energy loss in 4 shoes multiplied with vehicles, NbV 79 080 000J Average loss per 1000m section (E*4*NbV / 3600s) 21 967W
Given the total power requirement 1478kW per km, the total loss in the collector shoes is estimated to 1.5%.
The global efficiency, excluding the voltage drop and current losses, calculated from the 750V transformers to the vehicle onboard converter is calculated to 96.7%.
Table 18 Global efficiency calculation for APS-ERS
Designation %Loss Loss Power Comment Total "User" power for 1 section (at trackside level)
NA 1 452 000W Power at the on board traction equipment upstream the converter
Sub-station rectifier (transformer + rectifier)
Sub-station rectifier (transformer + rectifier) excluded
Cable losses 1.8% 26 582W Refer to previous section Total required power at trackside level
1 478 582W Sub-station power
Collector shoe 1.5% 21 967W Mechanical losses of sliding contacts, based on 20% of vertical force (150N) on each collector shoe, 4 shoes. 22 trucks at 100km/h
On board converter On board converter excluded Power available for on board traction
1 430 033W
Total 3.3% 48 549W 1 478 582W Global Efficiency 96.7%
It is important to note that this is an early estimation in a certain scenario. It is based on the available technology for trams and the figures used are best guesses and estimations. Future tests will provide more information and an accurate efficiency measurement.
5.9 Cost
The estimated cost for the Alstom ERS system is based on the APS technology delivered for the test track. It includes the procurement costs of the APS Beams (including branching boxes), APS Power Boxes, APS Cabinets, MFC cables and antenna cables for detecting the vehicles.
Nevertheless it should be noted that the costing of the ERS does not include any installation costs, engineering costs or safety studies.
A separate cost estimation has been done regarding the feeder cables specified in chapter 5.7. The cost for such a cable is mainly governed by the copper price2 which means that the cost
2 Within this project the copper price is fixed at 54,2 sek/kg. See chapter 7.6.

Slide-in Electric Road System Viktoria Swedish ICT Conductive project report Date: 2013-10-18
Page 37 of 63
could be assumed to scale roughly linear with the amount of copper and therefore also with the transferred power.
The cost estimated for the Alstom ERS double track based on an average load case is about 8.63 MSEK/ km. The 5760km of 70mm2 feeder cable is estimated to cost around 0,54MSEK/km in the average load case and 2,4MSEK/km in the maximum load case.
It is important to note that the APS technology or principle is here adapted to the ERS. The sizing of existing components, designed for tramway should be optimized to match the actual ERS requirements, as described in chapter 5.3. For example the power box switching technology must consider the number of switches, which is much greater for ERS, and a maximum power that is much lower for ERS.
5.10 Maintenance
The PB faults are tolerated by the system thanks to on board autonomy. PB replacement can be scheduled by maintenance. PB faults are identified on the Computerized Aided Maintenance System (CAMS).
The conductive ERS must be free of ice or snow in order to allow an electrical contact with the collector shoes. How this is done and other maintenance issues will be addressed more thoroughly in the work to be done.
5.11 Limitations
The safety principle delivering the voltage at ground level in front of and behind a running vehicle prevents hazards for pedestrians, nevertheless, motor bikers may follow cars as close as they could access to the live voltage. Consequently, the principle does not protect reckless motor bikers.
5.12 Flexibility The current design limitation of the APS switching is 1MW per vehicle, which is much more than what is required by trucks today (120kW), providing flexibility in 10 to 15 years if the ERS demanded power increases. It will also be possible to upgrade to a higher power switching capabilities. If the system was originally designed for a limited power (120kW) at level of power boxes, or cables, or substations, a power increase is possible with a step by step upgrade of HV distribution (30kV), substations upgrade (every km), additional cables and power boxes upgrade without traffic interruption. During the transition, the power distribution will be interrupted by sections of 1km, which has almost no impact on the operation with hybrids cars.

Slide-in Electric Road System Viktoria Swedish ICT Conductive project report Date: 2013-10-18
Page 38 of 63
6 DETAILS OF VEHICLE An ERS vehicle must be slightly modified to allow connection to the ERS. This chapter describes the vehicle setup that has been used in the project and the expected impact on future ERS vehicles in terms of efficiency, safety, weight and cost.
6.1 Overview of test vehicle for conductive ERS system
Principle of truck for ERS system is generally to add new interface components to vehicle hybrid system, thus enabling electrical energy transmission between a conductive road and the vehicle high voltage propulsion system.
As an example the base for such a vehicle system should be a hybrid drivetrain, i.e., a truck equipped with both a diesel combustion engine, and an electrical motor, driven with electrical power from a voltage source, such as an on-board high voltage battery system.
Below in Figure 33 is a principle illustration of an available Volvo hybrid configuration, showing the main components of a split driveline in a hybrid with two torque sources.
Figure 33 Hybrid vehicle illustration
For a complete system test, it will be mandatory to equip the vehicle with an EM, and some kind of suitable energy layer to facilitate transition between EM mode and the ICE mode, but during development phase of the interface components to ERS, this is not necessary.
Thus, the slide-in project has designed a specific diesel engine truck, that facilitates tests of the new components (pick-up, power to vehicle adapter), without actually performing complete system tests on a hybrid truck.
The conductive project will perform tests on a FH diesel combustion truck, equipped with a resistor bank for electrical energy dissipation, and with test equipment and extra battery source for component development. As the vehicle is not equipped with an EM, the electrical power that is transmitted from road to vehicle, must be dissipated, and that is reason why vehicle is equipped with a resistor bank system.
6.2 Test vehicle for conductive ERS system
Below in Figure 34 is given a system overview of the test vehicle used in the project:
Added new subsystems for the test vehicle are:
• Extra 24 V battery for pick-up control • Resistor bank for power dissipation • Power to vehicle adapter • Camera + display for driver support

Slide-in Electric Road System Viktoria Swedish ICT Conductive project report Date: 2013-10-18
Page 39 of 63
• Cameras for logging • Pick-up mechanical component • Pick-up control box • Radio emitter (including antenna) for ERS
Figure 34 Test vehicle (system overview)
6.3 Resistor bank for conductive ERS system
In order to be able to dissipate the expected electrical power from the ERS system, the project designed a separate resistor bank for the test vehicle. Principle of resistor bank is to use a large water container (~1m3) equipped with 12*18 kW heater elements for energy dissipation.
The water tank was produced, in a machine shop, from graphical drawings so that it later easily could be attached to the vehicle chassie of the FH test truck shown in Figure 35.

Slide-in Electric Road System Viktoria Swedish ICT Conductive project report Date: 2013-10-18
Page 40 of 63
Figure 35 Test vehicle (resistor bank)
6.4 Pickup’s for conductive ERS system
The project has designed two pick-up prototypes to enable physical contact between the vehicle and the road rails, installed onto the road surface at the test track.
Principles of the pickups are based upon the mechanical movements of these and their control capabilities.
First, the project designed a pickup that lately has been named the “turning pickup”, meaning that pickup lateral movement is controlled by a turning, rotational movement, facilitated by an electrical motor that is attached to the vehicle body. The vertical movement of this turning pickup prototype is enabled by a linear electrical motor, which is a part of the pick-up moving body.
Secondly, the project has also designed a 2nd pickup, that has been given the name “linear pickup”, meaning that lateral movement is controlled by a linear movement, along a straight axis between the 2 main frames of the vehicle body. The vertical movement of this linear pickup prototype is enabled by a pneumatic actuator, which is supplied with (high pressure) compressed air from the vehicle pneumatic system.
Both pickups, seen in Figure 36, have been developed by Volvo in cooperation with universities in Sweden, where Volvo has defined main design, performance and installation requirements, while the universities (including students), have designed details of the motor controls and the general mechanics function.
Figure 36 Conductive project pickup prototypes

Slide-in Electric Road System Viktoria Swedish ICT Conductive project report Date: 2013-10-18
Page 41 of 63
Both of these pickups have been installed onto the FH test truck, and both of them have been tested. During early development, in the project, the pickups are tested mounted at the rear of the truck. However, the turning pickup has been designed according to installation requirements, so that it can be installed under the vehicle, and positioned safely (in a home position), securing vehicle 25cm of ground clearance, when it is not in operating mode.
6.5 Results from vehicle test for conductive ERS system
Test results show that pickups can support physical contact between vehicle collector shoes, and ERS conductive rails, when vehicle is operated in normal manner. The “wiggling” movement of the vehicle (of approximately +/- 50 cm), during tests up to 70km/h, was a behaviour that the pickups could manage. In early phase, it has been the linear pick-up, that has shown the most rigid behaviour, but at this stage it is too early to conclude anything, due to the differences in design, and due to too few vehicle tests so far.
Proper electrical tests, of the conductive efficiency has not yet been made, so for the time being, it can (at least) be said that pickup can keep position onto the rails in speed ranges tested of 0 - 70km/h, but results indicate that higher speeds can also be supported.
Future tests will evaluate the possible efficiency of the electrical transmission of the conductive ERS. These tests will be made during first quarter of 2013.
6.5.1 Added cost to vehicle system
Today the expectance of added/reduced cost to the ERS vehicle compared to base system, a 40 ton hybrid, is:
• Pickup cost (+ 30kSEK) o Either two electrical motors or combination of electrical motor and pneumatic
actuator with corresponding controls (+ 15kSEK) o Mechanical design and components, springs, joints, belts (+ 15kSEK)
• Power converter cost (+20kSEK) o Grid power and voltage can vary, so vehicle needs power electronics, to stabilize
voltage and power to the expected and to be able to control current and voltage o This added cost is due to acceptance of voltage drops in road grid. With less
allowed tolerances of grid voltage drops, technically this component could be avoided.
• Battery cost (-) o When ERS is available, it will be likely that battery capacity should be
significantly reduced, only to facilitate state transmission between ICE drive and EM drive, without torque interruptions. However, with no known data of ERS infrastructure, it is not possible to decide what battery type that would be selected.
These estimates are not definite as it is difficult to estimate costs dependant of future volumes, and dependencies of available ERS infrastructure.
6.6 Maintenance
The collector shoes are components that will experience “wear and tear” from mileage usage. These must be included in future cost estimates as these will most likely be a part of the vehicle that will be replaced during service intervals.
Experience from tram industry, at much higher transmitted power, is that collector shoes, are replaced every 20.000 km of usage.
Other added components, shall be designed so that these do not need service intervals.

Slide-in Electric Road System Viktoria Swedish ICT Conductive project report Date: 2013-10-18
Page 42 of 63
6.7 Safety
Components that are added into the hybrid vehicle system will be electrically monitored for proper function. This will be included in the system design of the ERS vehicle system.
6.8 Efficiency
No measurements have been made yet of the conductive ERS. There are also components that have not yet been fitted to the vehicle. Expectance is that there will be measurable losses at:
• Power management in DC/DC power electronics on-board with expected (not confirmed) efficiency of 95%.
• Other losses on board the vehicle of 98 % including for example resistive losses within power electronics.
• Electric motor 95 %.
6.9 Weight
Estimate of added components and weights are:
• Pickup (+80kg) • Power converter (+40kg) • Reduced battery size (-), will be significant, probably larger than sum of added weight of
pickup and power converter.
These weights are with today’s prototype available designs. In future, these are likely to be reduced significantly.

Slide-in Electric Road System Viktoria Swedish ICT Conductive project report Date: 2013-10-18
Page 43 of 63
7 DETAILS OF POWER SUPPLY SYSTEM FROM ENERGY PROVIDER TO CONDUCTIVE SYSTEM
In order to propel electric vehicles on the road the electrical infrastructure along the road has to be greatly expanded and this chapter will present and discuss one alternative solution on how this infrastructure can be designed.
7.1 System overview
The planned route of the ERS within this project stretches some 447 kilometres between Stockholm and Gothenburg, see Figure 14. The regional power grid, 130 kV, along the same route is owned and operated by Vattenfall. The 130 kV grid is stable and meshed which means that a single fault doesn’t cause an outage for the substations connected to it. This make the existing 130 kV grid well suited for additional loading which is favourable from an ERS perspective, all that is needed is some additional transformers in order to get the right voltage to the ERS. The regional grid is also well suited for a gradual expansion/reinforcement as the number of ERS-connected vehicles increases which of course means that the initial investment can be limited.

Slide-in Electric Road System Viktoria Swedish ICT Conductive project report Date: 2013-10-18
Page 44 of 63
Figure 37 The first two road section from Stockholm towards Jönköping. The red arrows illustrate available connection points
within the 130 kV grid.
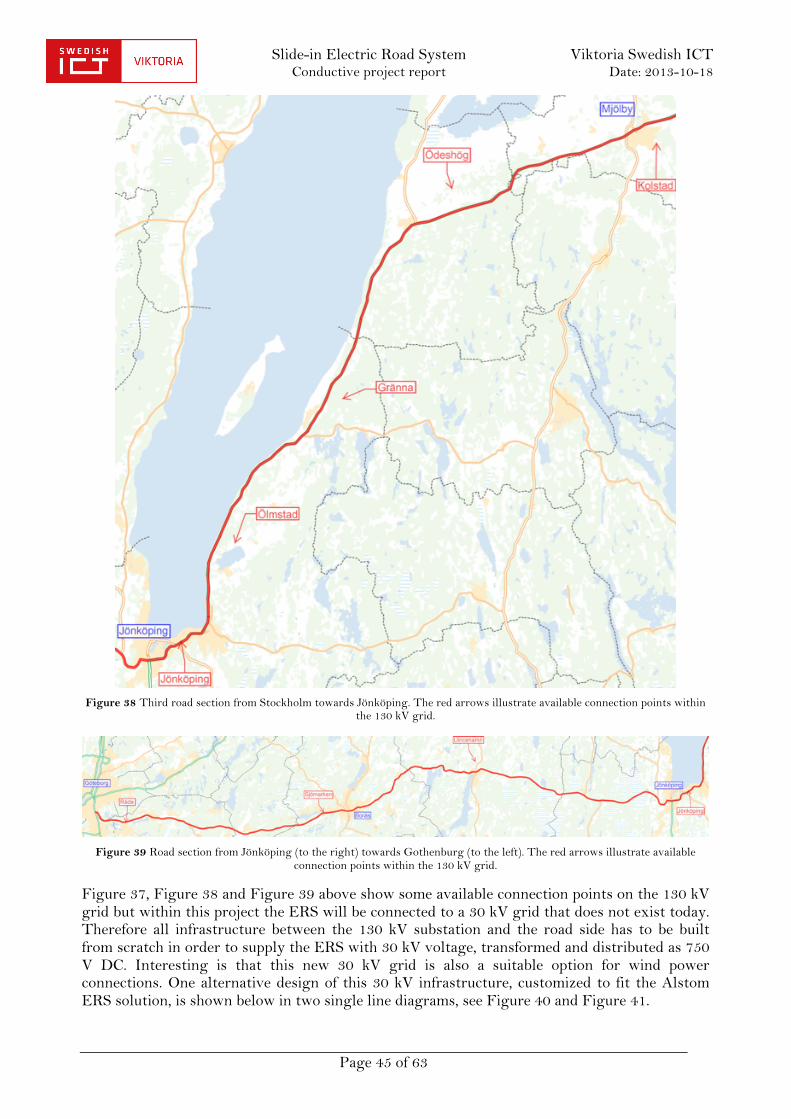
Slide-in Electric Road System Viktoria Swedish ICT Conductive project report Date: 2013-10-18
Page 45 of 63
Figure 38 Third road section from Stockholm towards Jönköping. The red arrows illustrate available connection points within
the 130 kV grid.
Figure 39 Road section from Jönköping (to the right) towards Gothenburg (to the left). The red arrows illustrate available
connection points within the 130 kV grid.
Figure 37, Figure 38 and Figure 39 above show some available connection points on the 130 kV grid but within this project the ERS will be connected to a 30 kV grid that does not exist today. Therefore all infrastructure between the 130 kV substation and the road side has to be built from scratch in order to supply the ERS with 30 kV voltage, transformed and distributed as 750 V DC. Interesting is that this new 30 kV grid is also a suitable option for wind power connections. One alternative design of this 30 kV infrastructure, customized to fit the Alstom ERS solution, is shown below in two single line diagrams, see Figure 40 and Figure 41.

Slide-in Electric Road System Viktoria Swedish ICT Conductive project report Date: 2013-10-18
Page 46 of 63
Figure 40 Principle single line diagram showing the power grid design from 130 kV down to the distribution substations, also
known as traction substations, along the road. The diagram is based upon the Alstom ERS.
Figure 41 A principle single line diagram showing the power grid design from the 30 kV distribution substations down to the
road integrated 750 VDC distribution system. The diagram is based upon the Alstom ERS and the interface lines are a suggestion of how the delivery could be divided between different actors.

Slide-in Electric Road System Viktoria Swedish ICT Conductive project report Date: 2013-10-18
Page 47 of 63
7.2 Infrastructure load
The cost of the needed infrastructure is mainly dependent on the distance between the road and the connection points in the 130 kV grid and the component cost of the ERS along the road. In order to pinpoint the exact connection points on the 130 kV grid and identify the needed grid reinforcements one needs to know the expected maximum load of the particular ERS. This project has approached this in two different ways. One scenario is called the “maximum load case” while the other is called the “average load case” and a short description of them both follow below.
7.2.1 Maximum load case
This scenario assumes that the road is heavily trafficked with trucks and that two very long truck convoys (~1000 m) travel with 1 second between each vehicle in both directions at the same time. This load case will most likely never occur in reality and should therefor only be interpreted as a reference case that indicates how infrastructure costs scale with the dimensioning power. Assuming this scenario will occur, the Alstom ERS will need to deliver approximately 6 MW of power for each kilometer of road, including both directions. One should however also bear in mind that this maximum power case does not include any losses in the system which means that the “real” load on the regional grid will be even higher than 6 MW. In order to simplify calculations Vattenfall made an assumption, in an early stage of the project, that this scenario corresponds to a maximum load of 400 kW per 60 meters of road or 6,7 MW per kilometer. This means that all the calculations made, regarding the maximum load case design of the power grid, are based upon the an maximum load of 6,7 MW per kilometer and which probably corresponds well to the 6 MW load case if losses would be included.
7.2.2 Average load case
In the average load case the maximum load of the 130 kV grid have been estimated using the traffic flow intensities of 2012 with hourly resolution provided by the Swedish Transport Administration at two points, one east of Jönköping and one west of Jönköping. Roughly 21 500 vehicles travel on the road each day east of Jönköping and around 12 800 vehicles travel on the road west of Jönköping and 100 % of these vehicles are assumed to be connected to the ERS, see example of data in Table 10.
From these figures, together with the vehicle parameters specified in the generic scenario description in chapter 4, and losses from chapter 5.8 and 6.8, the maximum average load during one hour (at 16:30-17:30) was extracted and then multiplied by a so called safety factor3 set to 2. With this doubled maximum average power the average load case presents a dimensioning load for the ERS far below the maximum load case. With the average load case the dimensioning load for the ERS sums up to 0,96 MW per kilometer west of Jönköping and 1,4 MW per kilometer east of Jönköping. Note that these results also include all losses from the shaft of the electric motor on the vehicle up until the 30 kV connection point on the power grid according to Table 19 below. Since the efficiency of the transmission in the ERS has not yet been tested it was set to 90% in this calculation despite earlier estimations.
3 The safety factor is used to take into account a needed over capacity of the system. It is chosen freely but within the project group the value 2 was considered reasonable.

Slide-in Electric Road System Viktoria Swedish ICT Conductive project report Date: 2013-10-18
Page 48 of 63
Table 19 Total ERS efficiency up to the 30 kV-grid, all figures will be verified in a later stage within the project when it is possible to measure different system parameters.
System efficiency of ERS up to the 30kV grid, relevant for the average load case Electric motor 95 % Inverter supplying the electric motor 95 % Other losses on board the vehicle 98 % For example resistive losses within power electronics. Transmission through the ERS 90 % Estimate of the ERS solution Traction substation 99 % Including transformer and rectifier Total efficiency 78.8 %
The two above cases have been analyzed from a cost perspective in order to estimate the total investment needed in order to realize the infrastructure for the proposed ERS and the results are shown in chapter 7.5 Cost calculation. The analysis is divided between the cost of the 130 kV infrastructure and the cost of the 30 kV infrastructure and then presented as a fixed cost per kilometer of road.
7.3 Maintenance and safety
When building new power transmission infrastructure the maintenance and safety issues are tricky to predict and this project is no different. A rule of thumb surrounding maintenance is that the total cost of the maintenance per year during the calculated lifespan of the equipment is around 1-2 % of the total investment. This rough estimate of the maintenance cost is relevant for the high voltage infrastructure with 130 kV. However it is probably not such a good measure of the maintenance cost within the medium/low voltage level as most of the installed components will be designed to be maintenance free and only require periodic checkups, maybe once every 6 years followed by the needed reinvestments. Therefore it is very hard to predict any average yearly maintenance cost of the complete system.
The safety issues related to this project can be divided into two parts. The first issue is regarding the infrastructure that will be installed in the vicinity of the road and the second issue concerns all the other electrical installations needed. To solve these issues the infrastructure needed near the road have to be installed with a necessary safety distance from the roadside and also be protected from the unlikely event of a vehicle impact. What the necessary distance is for an ERS will need to be analyzed and decided by the appropriate authorities in a later stage of the project but existing information is described in chapter 4.4 The second safety issue concerning all other electrical installations is no different in this project compared to any other high/medium/low voltage installations which means that all installations are regulated by existing rules and guidelines provided by the electrical safety authority.
7.4 Efficiency of distribution grid
The distribution of electric power is not possible without losses and the goal is always to minimize the losses as much as possible. When the Alstom ERS is operating at nominal power in accordance to what has been described in this report the efficiency of the suggested 30 kV distribution network has been calculated to lie in between 99,09 % and 99,42 %. A detailed presentation of how the losses on the 30 kV grid is distributed is shown in Table 20 below. The losses have only been calculated for the use of PEX-cables as it is unlikely that OHTL-would be used in the real installations and also because the OHTL losses would lie in the same magnitude.
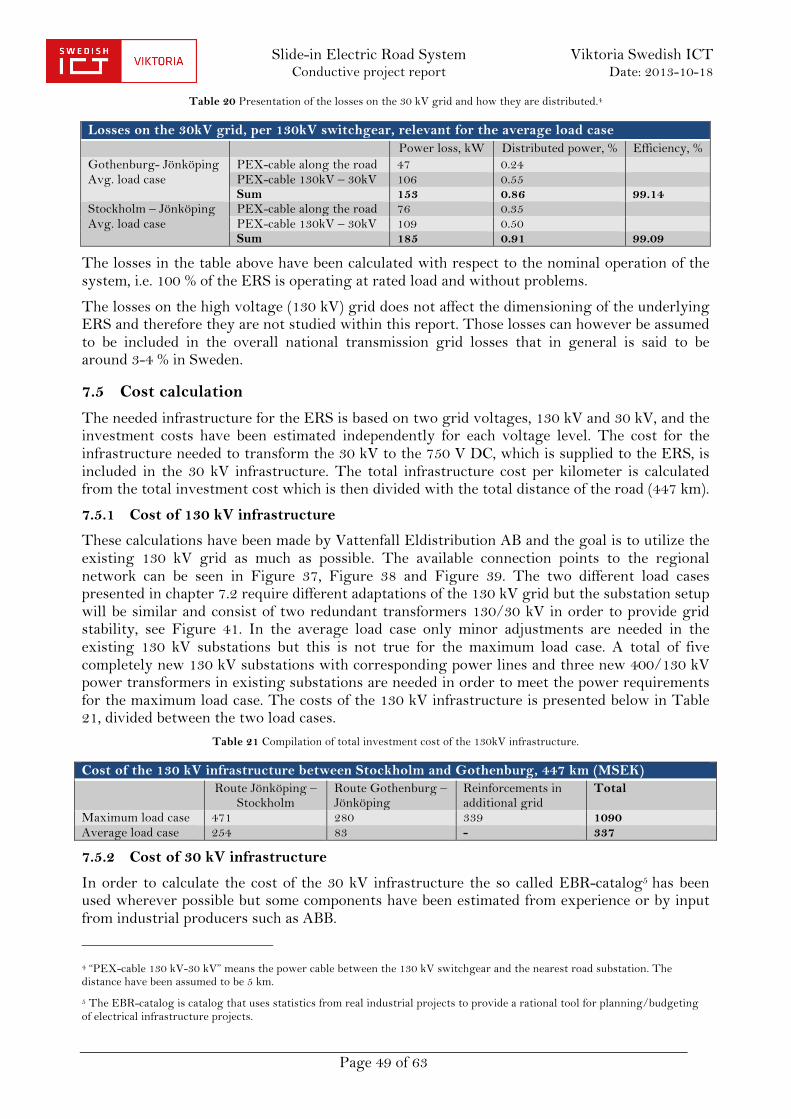
Slide-in Electric Road System Viktoria Swedish ICT Conductive project report Date: 2013-10-18
Page 49 of 63
Table 20 Presentation of the losses on the 30 kV grid and how they are distributed.4
Losses on the 30kV grid, per 130kV switchgear, relevant for the average load case Power loss, kW Distributed power, % Efficiency, % Gothenburg- Jönköping Avg. load case
PEX-cable along the road 47 0.24 PEX-cable 130kV – 30kV 106 0.55 Sum 153 0.86 99.14
Stockholm – Jönköping Avg. load case
PEX-cable along the road 76 0.35 PEX-cable 130kV – 30kV 109 0.50 Sum 185 0.91 99.09
The losses in the table above have been calculated with respect to the nominal operation of the system, i.e. 100 % of the ERS is operating at rated load and without problems.
The losses on the high voltage (130 kV) grid does not affect the dimensioning of the underlying ERS and therefore they are not studied within this report. Those losses can however be assumed to be included in the overall national transmission grid losses that in general is said to be around 3-4 % in Sweden.
7.5 Cost calculation
The needed infrastructure for the ERS is based on two grid voltages, 130 kV and 30 kV, and the investment costs have been estimated independently for each voltage level. The cost for the infrastructure needed to transform the 30 kV to the 750 V DC, which is supplied to the ERS, is included in the 30 kV infrastructure. The total infrastructure cost per kilometer is calculated from the total investment cost which is then divided with the total distance of the road (447 km).
7.5.1 Cost of 130 kV infrastructure
These calculations have been made by Vattenfall Eldistribution AB and the goal is to utilize the existing 130 kV grid as much as possible. The available connection points to the regional network can be seen in Figure 37, Figure 38 and Figure 39. The two different load cases presented in chapter 7.2 require different adaptations of the 130 kV grid but the substation setup will be similar and consist of two redundant transformers 130/30 kV in order to provide grid stability, see Figure 41. In the average load case only minor adjustments are needed in the existing 130 kV substations but this is not true for the maximum load case. A total of five completely new 130 kV substations with corresponding power lines and three new 400/130 kV power transformers in existing substations are needed in order to meet the power requirements for the maximum load case. The costs of the 130 kV infrastructure is presented below in Table 21, divided between the two load cases.
Table 21 Compilation of total investment cost of the 130kV infrastructure.
Cost of the 130 kV infrastructure between Stockholm and Gothenburg, 447 km (MSEK) Route Jönköping –
Stockholm Route Gothenburg – Jönköping
Reinforcements in additional grid
Total
Maximum load case 471 280 339 1090 Average load case 254 83 - 337
7.5.2 Cost of 30 kV infrastructure
In order to calculate the cost of the 30 kV infrastructure the so called EBR-catalog5 has been used wherever possible but some components have been estimated from experience or by input from industrial producers such as ABB.
4 “PEX-cable 130 kV-30 kV” means the power cable between the 130 kV switchgear and the nearest road substation. The distance have been assumed to be 5 km.
5 The EBR-catalog is catalog that uses statistics from real industrial projects to provide a rational tool for planning/budgeting of electrical infrastructure projects.

Slide-in Electric Road System Viktoria Swedish ICT Conductive project report Date: 2013-10-18
Page 50 of 63
Some basic assumptions have also been made in order to simplify the calculations such as:
- The distance from the 130 kV substations up to the nearest 30 kV substation is assumed to be 5 km.
- The stretch of road that is supplied by each 130 kV substation is calculated as the average distance between all 130 kV substations on the specified route and with respect to the different load cases.
- Each 30 kV roadside substation is assumed to occupy an area of 20x10 meter and the cost for civil works is set to be 500 kSEK per substation, regardless of its power.
The total investment cost of the 30 kV infrastructure is summed up in Table 22 below. Table 22: Compilation of total investment costs of the 30kV infrastructure.
Cost of the 30 kV infrastructure between Stockholm and Gothenburg, 447 km (MSEK) With PEX-cables,
total per km With OHTL,
total per km Of which traction substations cost
Maximum load case 8160 18,2 6690 15 6050 Average load case 2870 6,4 2600 5,8 2290
The total investment for the 30 kV infrastructures presented in Table 22 above should only be considered as a rough estimation of the infrastructure costs as all the figures are uncertain until a real quotation have been made. As can be seen in the table, all traction substations represent a very large portion of the total costs of the 30 kV infrastructure and therefore it is important to mention that the prices of the traction substations are especially hard to estimate at this early stage of the project. One 1,5 MW6 traction substation is estimated to cost around 500 kEUR (~ 4,4 MSEK), and a 6,7 MW around 12,4 MSEK. These prices are a result of estimations from, and discussions with, experts within ABB but the margin for error is still rather large. However, if one should perform this project in reality, the large volume of equipment might help to lower the investment costs substantially. There are also other factors as raw material costs and exchange rates that could fluctuate over time.
7.5.3 Total infrastructure cost per km
The needed infrastructure for the ERS is based on two grid voltages, 130 kV and 30 kV, and the investment costs have been estimated independently for each voltage level. The later infrastructure also includes the transformation to 750 V DC supplied to the ERS. Therefore the total infrastructure cost per kilometer is calculated from the total investment cost which is then divided with the total distance of the road (447 km), se compilation below:
Table 23 Total cost of the infrastructure supplying the ERS
Total cost of the infrastructure between Stockholm and Gothenburg, 447 km in MSEK 130kV 30kV Total cost per km Maximum load case 1090 8160 (with PEX-cables) 20.7 Average load case 337 2870 (with PEX-cables) 7.2
7.6 Copper price
The cost of many components in the suggested ERS and the associated infrastructure is strongly dependent on the raw material price of copper. In order to ensure a fair comparison between the different ERS solutions the price of copper was locked on the 17th of September 2012 to 54,2 SEK/kg.
6 A 1 MW traction substation is assumed to cost the same.

Slide-in Electric Road System Viktoria Swedish ICT Conductive project report Date: 2013-10-18
Page 51 of 63
8 IMPLEMENTATION CONCEPT The commercially available technologies used for continuous electrification of road transport have not yet qualified for implementation in any significant extent. It still remains both a technical and juridical verification in Swedish climate conditions as well as a credible business model for implementation. There are also a number of techniques for the electrification of the road network that are still in a development stage. These should be given time to develop and mature before deciding if, when and to what extent the road network is electrified.
The different technologies must be qualified independently both regarding technical feasibility and market validation as well as in demonstration. The Swedish Transport Administration is until then not ready to decide on or recommend decisions on the wider implementation of ERS.
A construction of an ERS, including both installations in the road and power supply, for example along the distance Stockholm-Gothenburg, is expected to take a long time to implement. The Swedish Transport Administration believes that in order to get most benefits from the investment as early as possible, any initial implementation should be made on a stretch where traffic of local point-to-point character is larger than in general. When local vehicle owners see an economic benefit of investing in the technology, the ERS construction and usage can more quickly get implemented.
8.1 Implementation in point to point traffic
There are various ideas about how a technology can penetrate a market. The Swedish Transport Administration believes that it must prove commercially mature for success; and technical functionality in itself is not enough. There must also be a profitable business in mind to attract the capital needed to invest in infrastructure and to attract vehicle manufacturers to build the adapted vehicles. A few demonstrations of "showcase type", that shows the technology's abilities may be financed by public funds, but for wider implementation there must be profitability both for the society and the industry.
Successful implementation of new technology has often proved to require commitment and shared knowledge between community and industry for a long time. During this time the technologic functionality is verified, so the market and the future users, can rely on it. Once the technology is mature, it can be tested in smaller scale real life conditions. Before deciding about further large-scale tests any teething problems can be corrected both in the vehicles, road, surrounding infrastructure and the required communication in between these. In order not to delay the implementation process work with standardization and legal issues should also start at an early stage.
A study should be conducted to find a relatively short distance with high traffic flow that is appropriate for a first implementation. Such sections are often to be found in a fixed traffic relationship, a route, eg between a dry port and a shipping port, or between production and distribution facilities. Another option could be a highway for public transport in a major city. Meanwhile, potential customers, willing to switch to electrically powered vehicles and begin utilizing the new technology, should also be contacted. Implementation during the development stage should be prioritized based on where both the customer interest and road traffic are highest. A test or demonstration should preferably be commercially attractive. That is, there should be a revenue side that can help fund the demonstration. Market players venturing in a demonstration is one of the signs that technology is considered mature enough to implement.
8.2 Stage two and standardization
Once the trial period is over and evaluated the experiences that have emerged forms the new target for further expansion. If the trial has been successful and positive feedback from those who used the road has been spread, the interest from new operators will increase and the

Slide-in Electric Road System Viktoria Swedish ICT Conductive project report Date: 2013-10-18
Page 52 of 63
expansion rate can accelerate. Based on the earlier inventory of local transport needs, new sections are built and deployed, and finally, tied together along the entire distance. Probably, it is relatively much more expensive per unit length to electrify various sections of the road than it is to electrify a longer continuous stretch. The benefits of doing it gradually are however still greater since such an implementation allows constant evaluation by the vehicles in service and corrections will not be as costly as they if the entire route needs to be adjusted. It is also natural to begin converting sections with high traffic loads where economic and environmental benefits can be achieved more easily.
Cooperation in the EU should also be initiated to standardize the various input parameters in the system to allow traffic across borders when the system reaches the higher level of deployment. The standardization work should begin early to follow, review and determine the most applicable interface between the pick-up and the vehicle to allow the pick-up to be easily mounted on different types of vehicles. It should also include the electrical interface between the pick-up, vehicle and the roadside infrastructure so the vehicle owner as well as both the vehicle and pick-up manufacturer only have one voltage level or voltage interval to relate to. Furthermore, the interface for transferring information between the vehicle and the roadside infrastructure, such as for communication and billing systems, must also be standardized.
8.3 Maintenance aspects
Maintenance costs for the infrastructure is currently unclear since the final concepts are not yet defined. This technique has not been verified by snow removal, de-icing and frost heave or maintenance coating of asphalt.
Maintenance pavement of asphalt
It is likely that new routines and new construction equipment are needed to perform the maintenance of the road with regards to the new electrical installations in the road segment. In order to verify the methods for maintenance, both a section of road and the machines must be developed and built. Electrification from below requires major interventions in the existing roadway, which will require a closure of the lanes. It is likely that the shutdown time will be more extensive compared to if the route is not electrified.
Rutting effect
Rutting effect, as a result from several vehicles driving in the same track, is considered to be greater if the route is electrified. Rutting implies that the road structure breaks down faster and maintenance is required more frequent to ensure that water cannot penetrate the structure and cause a rapid degradation of the same.
Winter road maintenance
A system for energy transfer placed in the road surface will require new routines and vehicles for winter road maintenance. This may involve, for example graders and plow trucks that do not damage any elevated road installation. Similar to the maintenance equipment, also these tools for deicing and snow removal requires testing before they can be deployed. There is also a risk that water can accumulate within the joints between the installation and the road surface and thereby cause frost damage. Normally, the water is drained but there is a risk that an elevated installation can be a barrier that hinders water to be drained from the road surface. Therefore tests to ensure problems with snow and ice does not prove to be particularly troublesome will be included in future evaluation of the solutions.

Slide-in Electric Road System Viktoria Swedish ICT Conductive project report Date: 2013-10-18
Page 53 of 63
Effects from climatic conditions
An additional uncertainty is how frost heaving affects the installations in the road. More specifically, how is the roadway raised compared to the electric road system and is insulation required to reduce the impact? During the spring thaw, a raised roadway could cause a so-called bathtub effect when the ground defrosts from the top and melt water cannot be drained. Furthermore, cracks may also occur in the top movable asphalt layer if other electric road components are built into the road structure and simultaneously attached deeply into frosted ground. Electric road systems built into the road structure must therefore be designed to move the same way as road structure in general and cope with movements both transversely and longitudinally. The magnitude of the frost heave is expected to vary more laterally than longitudinally and either can be prevented with proper design of the road construction. It might however be associated with a considerable cost if fixed during conversion of an existing road.
8.4 Associated infrastructure
The infrastructure required along the road in order to enable control, monitor and measure energy, need to be built before the first cars starts operating the road. How these systems interact with each other must also to be investigated. Similar systems exist along the railroad and experience from the sector could be the basis for how the infrastructure could be built. Maintenance required for the feeding stations differ between high and low voltage components. The high voltage system’s main components typically have high availability with relatively low maintenance. The maintenance required for the low voltage system is more difficult to assess, partly since it to some extent is new technology that will be used where experience from any longer tests not yet exits.
8.5 Legal aspects
The legal aspects and obstacles for an ERS on highways have not yet been defined. Such barriers may include electrical safety laws, environmental laws as well as land accesses. Some of these questions may be easy to solve, but other issues requires a real case to be tested and evaluated against the legislation. Therefore, it is important to early analyse where legal barriers may exist and start the legal testing based on a real scenario.

Slide-in Electric Road System Viktoria Swedish ICT Conductive project report Date: 2013-10-18
Page 54 of 63
9 DISCUSSION OF RESULTS A discussion of the preliminary results from the Slide-in project with a conductive system solution.
9.1 What is the difference between a plug-in hybrid truck and an ERS truck with APS technology?
An ERS truck with APS technology requires a pick-up to transfer energy from the road. The collector shoes on the pick-up are components that will experience “wear and tear” from mileage usage. These must be included in future cost estimates as these will most likely be a part of the vehicle that will be replaced during service intervals. It must also be fitted with components for communication and identification in order to facilitate electrical safety and a billing system. It is likely that the added weight from these components is similar to the reduced weight of energy storage system.
The added cost per vehicle for the pick-up and electronics, not including a battery that presumably could be made smaller than on a comparable hybrid truck, is estimated to 50 kSEk.
Vehicle tests show that it is possible to design a mechatronic solution to secure physical (conductive) contact between a heavy-duty truck, driving at various speeds, and an ERS highway.
Project has performed measurements at normal driving conditions, and at snowy and rainy conditions, and the pick-up mechatronics have during these conditions, shown a proper function that keeps the pick-up contactor onto the conductive ERS rail. The speed detection function and the rail segment switching function in the ERS road have also been tested with positive results, with the vehicle at various speeds.
The efficiency measurements for proper continuous high voltage transfer, still remains to be studied.
9.2 Discussions regarding the Alstom APS ERS.
Within the project a concept for an ERS has been presented, based on the existing Alstom APS system for trams, to demonstrate its feasibility for highway vehicles.
A setup of APS cabinets and Power boxes is the hardware in the system for communication and safety and these are monitored and controlled using the SCADA system. Much work still remains to optimize the system for highway usage to suit the need of the shorter, less energy demanding vehicles and the different traffic conditions. For example the Power box switching technology must consider the number of switchings, which is much greater for ERS, and a maximum power that is much lower for ERS.
The APS rail consists of segments with a specific length for safety and efficiency. The basic safety principle of the APS system is based on a virtual moving zone in front of and behind the vehicle. With vehicle speed detection capabilities in the ERS, the power will be delivered only to vehicle having a speed between 60km/h and 100km/h and with a capability of receiving energy from the road. The safety principle delivering the voltage at ground level only nearby a running vehicle prevents increased hazard for pedestrians.
The costs and efficiency measurements are based on the data from the generic scenario description combined with the APS technology delivered for the test track. Both are dependent on the load case and sizing of components, and these should therefore be optimized to match the actual ERS requirements. Due to the physical contact, the collector shoes are components that will experience “wear and tear” from mileage usage and will be included in future cost estimates, as these will most likely be a part of the vehicle that will be replaced during service intervals.

Slide-in Electric Road System Viktoria Swedish ICT Conductive project report Date: 2013-10-18
Page 55 of 63
Experience from tram industry is that collector shoes are replaced every 20.000 km of usage. Other added components, shall be designed so that these do not need service intervals.
9.3 Discussions regarding the electricity distribution solution for an ERS between Stockholm and Gothenburg.
The dimensioning load for the analyzed ERS has been set to 1,4 MW/km between Stockholm and Jönköping and 0.96 MW/km between Jönköping and Gothenburg, based on the Slide-In projects generic scenario description and on real traffic flow figures monitored by the Swedish Transport Administration.
An electricity distribution solution with a 30 kV grid along the ERS road with 1 - 1.5 MVA substations ("Traction substations") at every km has been proposed for the conductive ERS. The grid substation setup on the 130 kV regional grid level will consist of two redundant transformers 130/30 kV in order to meet the electric road system power requirements. Based on the dimensioning “average load” case there is no need for reinforcements of the 130 kV grid. The regional grid is well suited for a gradual expansion/reinforcement as the number of ERS-connected vehicles increases which means that the initial investment can be limited. There is also an additional option for wind power station connections to this new 30 kV grid. The expected up-time for the electricity distribution parts of the conductive ERS is > 99 %
The estimated cost for Alstom ERS double track based on an average load case is about 8.63 MSEK/km. The cost is based on the APS technology delivered for the test track and it includes the procurement costs of the APS Beams (including branching boxes), APS Power Boxes, APS Cabinets, MFC cables and antenna cables for detecting the vehicles. This total ERS cost only includes the components and excludes all installation.
The total investment cost for an ERS between Stockholm and Gothenburg, excluding installation of ERS and DC-distribution cables, is estimated below to 7304 MSEK and includes both the adoption of the regional grid and the road equipment. The investments for a complete control system and payment solutions are not included in this figure. The total cost of 16.3 MSEK/km for the Alstom APS track should mainly be seen as a cost estimation. The technology used is sized for trams in a city and not optimized for vehicles on a highway. Furthermore, the cost is based on the test track installation costs and does not accurately account for a large-scale purchase, which most likely would reduce the investment cost. Table 24 Total investment cost for conductive ERS between Stockholm and Gothenburg excluding road and DC-distribution
cable installation.
Estimated cost for an ERS between Stockholm and Gothenburg, relevant for the average load case
MSEK MSEK/km
Estimated cost for adoption of the regional grid substations and transformers (130/30 kV).
Road 40: Gothenburg – Jönköping (Dimensioning load = 1,0 MW / km) Road E4: Jönköping – Stockholm (Älvsjö) (Dimensioning load = 1,5 MW / km)
337 83 254
0.8 0.2 0.6
The cost for the 30 kV distribution (PEX-cables) from the 130/30 kV substations to the roadside "Traction substations" and along the road.
580
1.3
The cost for the "Traction substations" including installation. 2290
5.1
Total cost of DC-distribution cable along the road excluding installation 240 0.5 Alstom ERS system excluding installation 3857 8.6 Total investment cost for a complete conductive ERS between Stockholm and Gothenburg. Excluding ERS and DC-distribution cable installation.
7304 16.3

Slide-in Electric Road System Viktoria Swedish ICT Conductive project report Date: 2013-10-18
Page 56 of 63
9.4 How does the traffic situation and intensity effect the requirements of the grid?
According to simulations on the ERS in chapter 3 the variations due to traffic dynamics significantly (>10 %) increases the average losses at scales less than about 1 km, on larger scales the daily traffic variations are the dominating load variation. At roads with lower traffic intensity or lower penetration of ERS-vehicles the distance between the transformer stations can be increased. In these cases, the main concern is shifted from the thermal limits of the components to the voltage drop. The ERS described in chapter 3 has been simulated with 5 % of the vehicles using the ERS and with the same cables but with only 25 % of the transformer stations in the system installed. This system could handle the load with good margin but more simulations are needed to determine the maximum loading of such systems. Thus the system can be built in steps with transformer stations added over time as the proportion of ERS-vehicles on the road increases. Traffic jams could be a critical high load case due to the high density of vehicles. However since the APS ERS for safety reasons probably will not allow power transfer when vehicles travel at the low speed or with short intermediate distance, which is typical for traffic jam situations, this will probably not be an issue. According to simulations on the ERS in chapter 3 slopes on the road up to 3 % have a small impact on the total average power consumption of the ERS.
9.5 A summary of the estimated total system efficiency
The total ERS efficiency from 30 kV grid to the electric motor in the vehicle is estimated in this report to 84.6 %. Based on measurements from the Alstom´s APS system used in the tramway, the efficiency between the 30kV grid and the vehicle electronics is preliminary estimated to 96.7 %. The losses occur in the cables and in the mechanical connection between the ERS and the collector shoes on the pick-up. All figures will be verified in a later stage within the project when it is possible to measure different system parameters.
Table 25 Total efficiency of the energy distribution between the 30kV grid to the vehicle engine.
System efficiency of ERS up to the 30kV grid Electric motor 95 % Inverter supplying the electric motor 95 % Other losses on board the vehicle 98 % For example resistive losses within power electronics. Transmission through the ERS 96.7% Estimate of the Alstom APS solution Traction substation 99 % Including transformer and rectifier Total efficiency 84.6%

Slide-in Electric Road System Viktoria Swedish ICT Conductive project report Date: 2013-10-18
Page 57 of 63
10 FUTURE WORK The future work includes a thorough validation of the roadside ERS cost and efficiency figures estimated in this report. The planned demonstration site for the ERS system in place and properly working will provide a lot of information to the project that will require time to analyze and develop. Apart from being able to accurately measure the system efficiency, of interest is for example also to understand what is required to future expand the ERS and allow for increased vehicle power.
Additional questions to be answered are the affects on conventional traffic using the ERS and also the feasibility for passenger cars to use the technology.
A more in-depth analysis of the total lifecycle cost for the ERS system is furthermore also planned in the future work. These calculations will include a sensitivity analysis both regarding the cost and the technical components installed.

Slide-in Electric Road System Viktoria Swedish ICT Conductive project report Date: 2013-10-18
Page 58 of 63
11 ERS REFERENCE CASE BASED ON OVERHEAD LINES The chapter describes an ERS based on overhead lines as a reference case to the conductive ERS.
11.1 Overview
An overhead line, or overhead wire, is used to transmit electrical energy to trams, trolleybuses or trains at a distance from the energy supply point (Wikipedia, 2013 [1]). It is known variously as:
• Overhead contact system (OCS) • Overhead line equipment (OLE or OHLE) • Overhead equipment (OHE) • Overhead wiring (OHW) or overhead lines (OHL) • Catenary • Trolley Wire
In this paper the generic term overhead line is used. This is also the term used by the International Union of Railways. (Uic, 2013)
11.2 Overhead line systems for rubber tire vehicles like for buses and trucks An electrical circuit requires at least two conductors. Trams and railways use the overhead line as one side of the circuit and the steel rails as the other side of the circuit. For a trolleybus there are no rails to send the return current along—the vehicles use rubber tyres and the normal road surface. Trolleybuses use a second parallel overhead line for the return, and two trolley-poles, one contacting each overhead wire. The circuit is completed by using both wires. Parallel overhead wires are also used on railways equipped with three-phase AC railway electrification, which is a rare system nowadays.
Figure 42 Trolleybus in Switzerland, (Hess, 2012). Please note the unsupported “lose” trolleybus type overhead line. This type
restricts the vehicle speed and demands the typical trolley poles (fish-rods) for connecting electrically.

Slide-in Electric Road System Viktoria Swedish ICT Conductive project report Date: 2013-10-18
Page 59 of 63
11.3 Trolley truck systems Closed trolley truck systems have been around for a long time but have disappeared from the market, such as in Stockholm, see Figure 43. Cheap oil as well as being bound to closed systems made them unattractive. One application that survived is mines where these systems are used for powering haul trucks, see figure Figure 44.
Figure 43 Trolley truck in Stockholm
11.4 Challenges for trolley vehicles system The challenges for making trolley truck systems attractive again are:
• The ability to connect and disconnect vehicles at speed (dynamic plug in to wayside power)
• The ability to keep track and bill trolley vehicles using the system individually (similar to mobile phone systems)
• The ability for system speeds up to approximately 100 km/h (for handling long distance coach buses).
Such “modern trolley systems”, with vehicles enhanced with an intelligent/active current collector for dynamic plug in to wayside power, as well as a module for billing of energy was envisioned and described by Svenska Elvägar AB in 2010 (Elvag 2010).
11.5 Siemens eHighway system In 2012, Siemens AG, presented a complete solution including trucks and electric infrastructure, under the trademark eHighway, see Figure 45, (Siemens, 2013). The eHighway technology includes a catenary wire supporting the overhead contact wire, thus enabling higher speeds than traditional trolley technology, as well as supporting an intelligent current connector. eHighway uses a current of approximately 750 V DC, a widely used voltage for trams, trolleybuses and subways. The overhead line is placed 5.15 meters above ground and the distance between the lines are 1.35 meters. There are a European standard for overhead lines and a supplement for trolleybuses. This standard places the contact line at a height of 5.5 meters and a distance of 0.6 meters between the lines.
Figure 44 Trolley assisted haul truck

Slide-in Electric Road System Viktoria Swedish ICT Conductive project report Date: 2013-10-18
Page 60 of 63
Figure 45 Siemens eHighway test track. Please note the catenary wire supporting the overhead contact wire thus enabling
higher speeds than traditional trolleybus technology as well as supporting an intelligent current connector. (Siemens, 2012)
11.6 Advantages of overhead line systems • Open, not proprietary technology, ensures competitive market with several suppliers • Safe and well proven system technology implemented in more than 350 systems and
40000 vehicles worldwide • Existing European standard can be adapted for modern trolley systems.
11.7 Disadvantages of overhead line systems • Can not be used for passenger cars • Perceived as ugly and old-fashioned • Supporting vertical pole structure as well as downed wiring is a possible safety hazard
that needs to be addressed.
11.8 Cost estimate of overhead line systems Since overhead line systems exist as a commercial product on an open market there are a variety of suppliers. Overhead line systems targeting railway applications are by far the biggest compared to trolleybus applications. Trolleybus applications are city solutions with a cost-driving factor thus making them more expensive. Two contact lines together with the DC rectifier technology makes the infrastructure cost higher but the vehicle solution more cost efficient. Examples of cost estimates for overhead wire systems are presented in Table 26.

Slide-in Electric Road System Viktoria Swedish ICT Conductive project report Date: 2013-10-18
Page 61 of 63
Table 26 Cost comparisons between overhead wire systems
Type Description MSEK/km Railway system, 2 directions 15 kV 1-phase frequency 16 2/3 Hz 6 (Elvag, 2010) Trolley bus system, 2 directions 2 directions, 750 V DC 9 (1 MEUR/km)
(Wikipedia 2013 [2]) Svenska Elvägar, estimate 2010 2 directions, 750 V DC 10 (Elvag, 2010) Siemens eHighway, estimate 2012 2 directions, 750 V DC 7-35 (Gladstein, 2012),
(Los Angeles Times, 2012)
11.9 Standards for overhead lines
Since overhead line systems have been used worldwide for a long time, the standards have already been created and can be applied also for modern trolley systems. Below in Table 27 is a list of the European standards.
Table 27 European standards for overhead wire systems
Name Description EN 50119 European Standard EN 50119:2001 EN 50367 European Standard EN EN 50367: 2012 BVH 543.3501 Design of high voltage power lines, The Swedish
Transport Administration Contact Lines for Electric Railways Siemens AG
Slide-in Electric Road System Viktoria Swedish ICT Conductive project report Date: 2013-10-18
Page 62 of 63
12 WORKS CITED Bombardier Transportation. (2012). Bombardier Redefines e-mobility for Rail and Road with PRIMOVE Technology. Retrieved from http://www.bombardier.com/en/corporate/media-centre/press-releases/details?docID=0901260d80211dc3
Elvag. (2010) Förstudie Elektriska vägar - elektrifiering av tunga vägtransporter Retrieved from: http://www.elvag.se/blogg/om/elektriska-vagar-forstudie/
Elways. (2012). Tests lead the way for economic ling distance travel with electric car. Retrieved from http://elways.se/press-releases/tests-lead-the-way-for-economic-long-distance-travel-with-electric-car/?lang=en
Gladstein, Neandross & Associates (2012). Zero Emission Catenary Hybrid Truck Market Retrieved from: http://www.transpowerusa.com/wordpress/wp-content/uploads/2012/06/ZETECH_Market_Study_FINAL_2012_03_08.pdf
Green Car Congress [1] . (2012). CALSTART study concludes zero-emission I-710 freight corridor achievable; hybrid truck with catenary or in-road power most feasible option. Retrieved from http://www.greencarcongress.com/2012/07/calstart-20120712.html
Green Car Congress [2]. (2012). Stanford faculty awarded $2.2M for 9 energy research projects; high-performance batteries, promoting sustainable vehicles, wireless power transfer for moving vehicles. Retrieved from http://www.greencarcongress.com/2012/09/stanford-20120917.html
Helberg, D., & Treiber, M. (2002). Realistische Mikrosimulation von Strassenverkehr mit einem einfachen Modell., (pp. 514-520). Rostock.
Hess. (2012) LighTram, Retrieved from http://www.hess-ag.ch/de/busse/trolleybusse/lightram.php
Hydén, C. (2008). Trafiken i den hållbara staden. Lund: Studentlitteratur AB.
Los Angeles Times. (2012). An electrifying freight solution on the 710? Siemens working on it. Retrieved from. http://articles.latimes.com/2012/may/15/local/la-me-gs-an-electrifying-freight-solution-from-siemens-20120515
OLEV Technologies. (2011). OLEV™ (On Line Electric Vehicle) Technology To Demonstrate “Electronic Roadway” in McAllen, Texas. Retrieved from http://olevtech.com/wp-content/uploads/2011/12/2011.12.01_mcallen.pdf
Polestar. (2012). Volvo V60 D5. Retrieved from http://www.polestar.se/af/models/v60-d5-awd-automatic-2013/
Scania. (2012). 16-Litre Euro 5 Engine. Retrieved from http://www.scania.com/products-services/trucks/main-components/engines/euro-5/16-litre/500-hp.aspx
Siemens. (2012). Siemens tests electric-powered system for heavy good vehicles. Retrieved from: http://www.siemens.com/press/en/feature/2012/infrastructure-cities/mobility-logistics/2012-05-lkw.php
Siemens. (2013) Electric-Powered Road Freight Traffic. Retrieved from: http://www.mobility.siemens.com/mobility/global/en/interurban-mobility/road-solutions/electric-powered-hgv-traffic-ehighway/pages/electric-powered-hgv-traffic-ehighway.aspx
Statens geotekniska intitut. (2008). Jords egenskaper. Retrieved from http://www.swedgeo.se/upload/publikationer/Info/pdf/SGI-I1.pdf

Slide-in Electric Road System Viktoria Swedish ICT Conductive project report Date: 2013-10-18
Page 63 of 63
Trafikverket. (2012). Malmtransporter från Kaunisvaaraområdet och elektriskt drivna lastbilar. (Publication 2012:147 ) Retrieved from http://publikationswebbutik.vv.se/shopping/ShowItem____5732.aspx
Treiber, M. (2011). An illustrative animation (Java applet) and description of the used traffic models. Retrieved from http://www.traffic-simulation.de/
Treiber, M., Hennecke, A., & Helbing, D. (2000). Congested traffic states in empirical observations and microscopic simulations. . Physical Review E. 62 , 1805-1824.
Uic. (2013) International Union of Railways. http://www.uic.org/
Vägverket. (1998). Trafic measurement data. Retrieved 10 29, 2012, from Trafic measurement points: 438, S GRÄNNA M STHLM and 439, S GRÄNNA M JKÖP: http://www.trafikverket.se/Foretag/Trafikera-och-transportera/Trafikera-vag/Verktyg-e-tjanster-och-vagdata/Vagtrafik--och-hastighetsdata/Kartor-med-trafikfloden
Vägverket. (2004). Vägar och gators utformning, VGU. Retrieved from http://www.trafikverket.se/vgu
Vägverket. (2001). VU 94 Road design. Retrieved from http://www.trafikverket.se/PageFiles/23725/road_design_english_summary.pdf
Vägverket. (2009). Krav på vägkonstruktion, Bilaga A till IFS 2009: 2.
Wiberg, E., Rådahl, J., (2012). Different ERS alternatives, Energy outlook.
Wikipedia [1]. (2013). Overhead line. Retrieved from: http://en.wikipedia.org/wiki/Overhead_line
Wikipedia [2]. Oberleitungsbus. (2013) https://de.wikipedia.org/wiki/Oberleitungsbus