Organizing the Elements Organizing the Elements Chapter 4 Section 2.
Upload
raymond-jenningsCategory
view
213download
0
Slide 2-2Copyright © 2012, 2008, 2005 Pearson Education, Inc.
Chapter 2
Organizing Data
Slide 2-3Copyright © 2012, 2008, 2005 Pearson Education, Inc.
Section 2.1
Variables and Data

Slide 2-4Copyright © 2012, 2008, 2005 Pearson Education, Inc.
Definition 2.1Variables
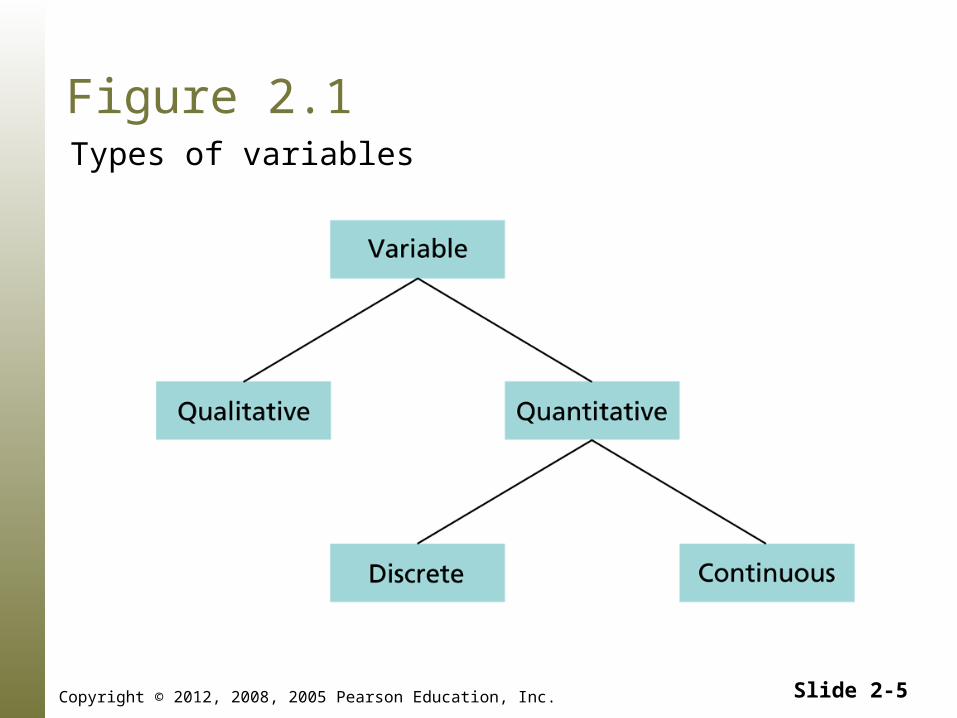
Variable: A characteristic that varies from one person orthing to another.
Qualitative variable: A nonnumerically valued variable.
Quantitative variable: A numerically valued variable.
Discrete variable: A quantitative variable whosepossible values can be listed.
Continuous variable: A quantitative variable whosepossible values form some interval of numbers.
Slide 2-5Copyright © 2012, 2008, 2005 Pearson Education, Inc.
Figure 2.1Types of variables
Slide 2-6Copyright © 2012, 2008, 2005 Pearson Education, Inc.
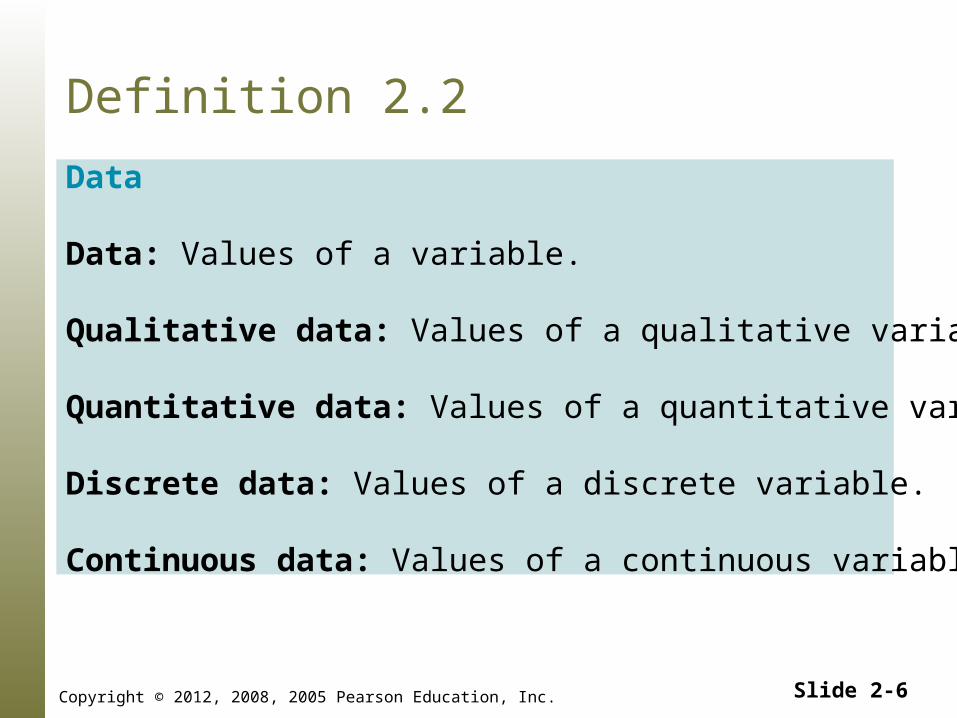
Definition 2.2
Data
Data: Values of a variable.
Qualitative data: Values of a qualitative variable.
Quantitative data: Values of a quantitative variable.
Discrete data: Values of a discrete variable.
Continuous data: Values of a continuous variable.

Slide 2-7Copyright © 2012, 2008, 2005 Pearson Education, Inc.
Section 2.2
Organizing Qualitative Data

Slide 2-8Copyright © 2012, 2008, 2005 Pearson Education, Inc.
Definition 2.3
Frequency Distribution of Qualitative Data
A frequency distribution of qualitative data is a listing of thedistinct values and their frequencies.
Slide 2-9Copyright © 2012, 2008, 2005 Pearson Education, Inc.
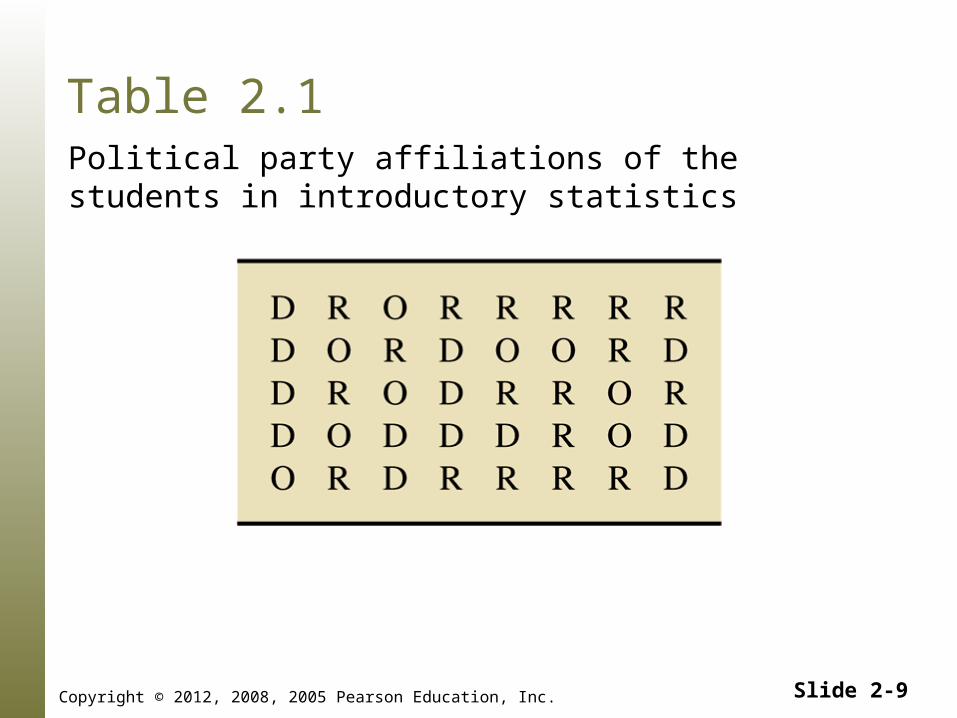
Table 2.1Political party affiliations of the students in introductory statistics
Slide 2-10Copyright © 2012, 2008, 2005 Pearson Education, Inc.
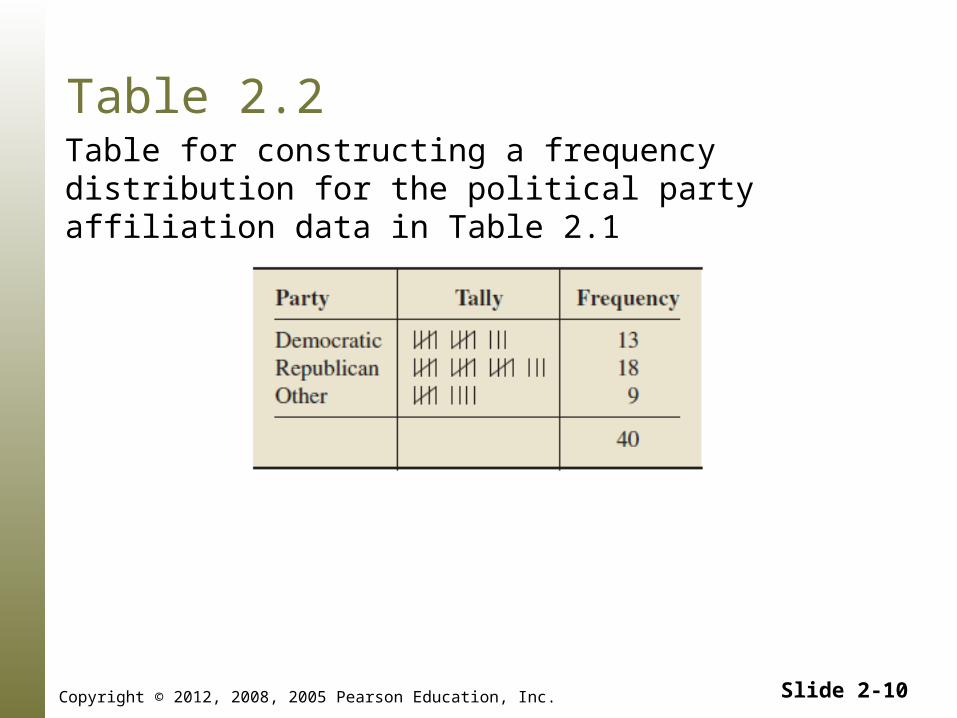
Table 2.2Table for constructing a frequency distribution for the political party affiliation data in Table 2.1

Slide 2-11Copyright © 2012, 2008, 2005 Pearson Education, Inc.
Definition 2.4
Relative-Frequency Distribution of Qualitative Data
A relative-frequency distribution of qualitative data is a listing of thedistinct values and their relative frequencies.

Slide 2-12Copyright © 2012, 2008, 2005 Pearson Education, Inc.
Table 2.3Relative-frequency distribution for the political party affiliation data in Table 2.1

Slide 2-13Copyright © 2012, 2008, 2005 Pearson Education, Inc.
Figure 2.2Pie chart of the political party affiliation data in Table 2.1
Slide 2-14Copyright © 2012, 2008, 2005 Pearson Education, Inc.
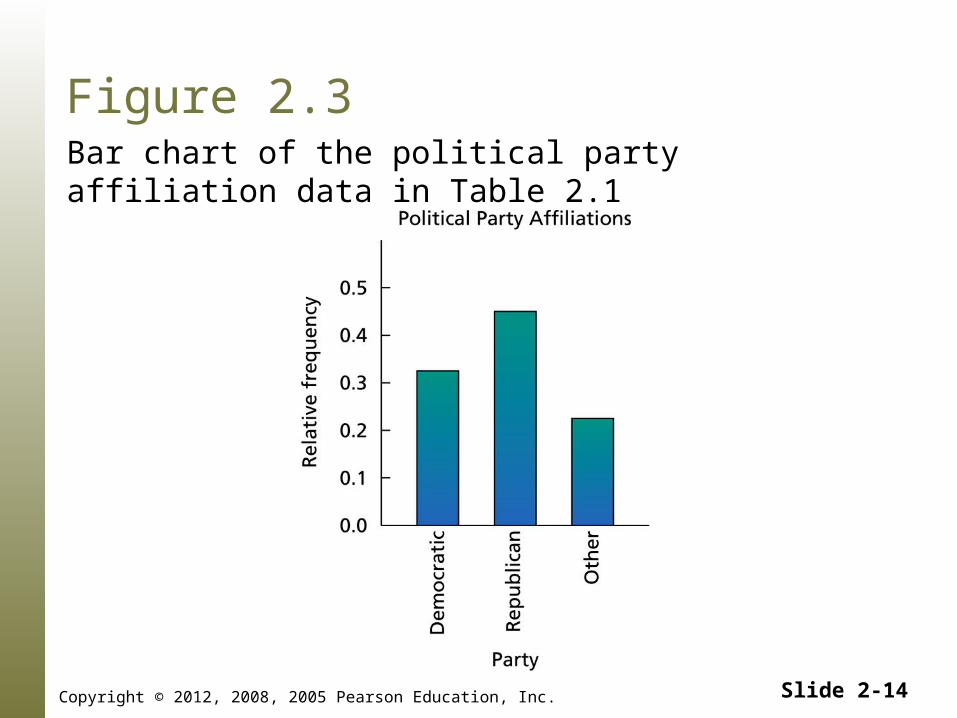
Figure 2.3Bar chart of the political party affiliation data in Table 2.1
Slide 2-15Copyright © 2012, 2008, 2005 Pearson Education, Inc.
Section 2.3
Organizing Quantitative Data
Slide 2-16Copyright © 2012, 2008, 2005 Pearson Education, Inc.
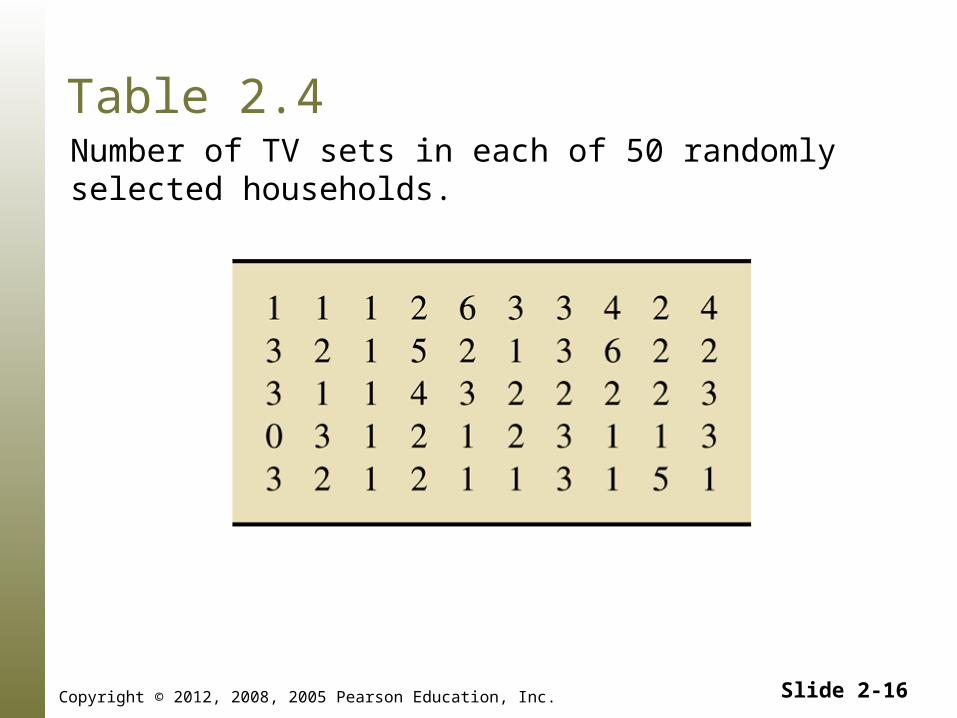
Table 2.4Number of TV sets in each of 50 randomly selected households.
Slide 2-17Copyright © 2012, 2008, 2005 Pearson Education, Inc.
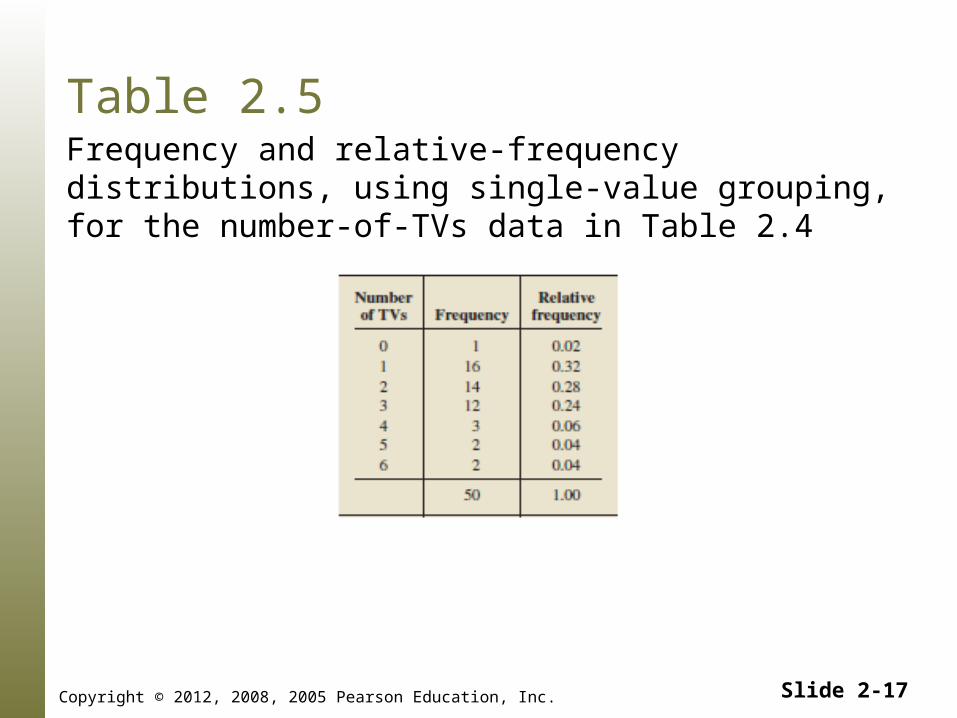
Table 2.5Frequency and relative-frequency distributions, using single-value grouping, for the number-of-TVs data in Table 2.4
Slide 2-18Copyright © 2012, 2008, 2005 Pearson Education, Inc.
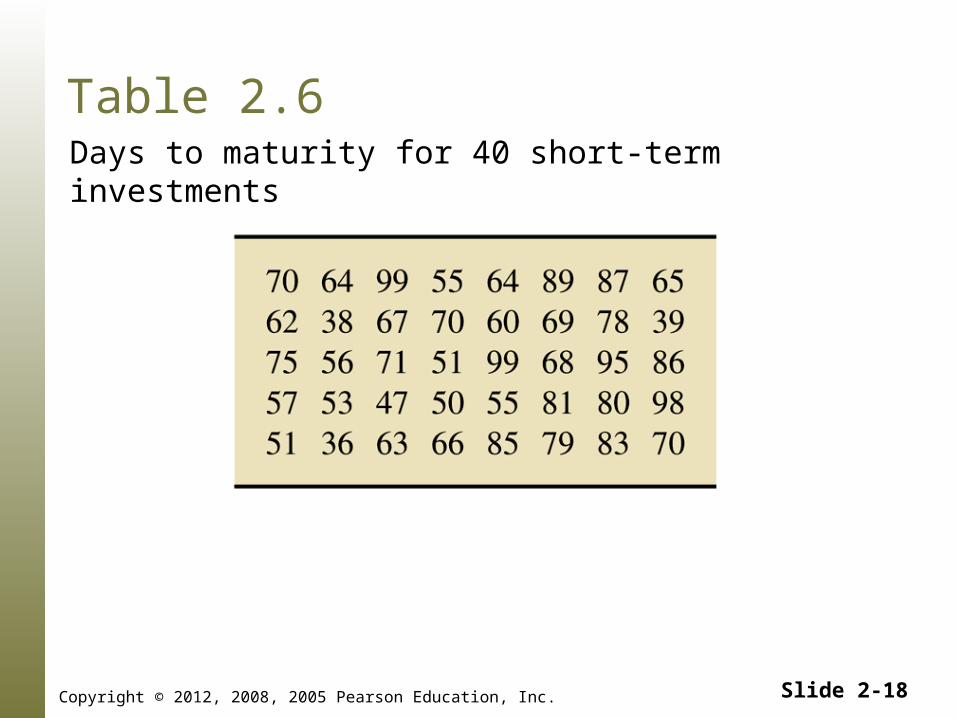
Table 2.6 Days to maturity for 40 short-term investments

Slide 2-19Copyright © 2012, 2008, 2005 Pearson Education, Inc.
Table 2.7Frequency and relative-frequency distributions, using limit grouping, for the days-to-maturity data in Table 2.6

Slide 2-20Copyright © 2012, 2008, 2005 Pearson Education, Inc.
Definition 2.7
Terms Used in Limit Grouping
Lower class limit: The smallest value that could go in a class.
Upper class limit: The largest value that could go in a class.
Class width: The difference between the lower limit of a class andthe lower limit of the next-higher class.
Class mark: The average of the two class limits of a class.
Slide 2-21Copyright © 2012, 2008, 2005 Pearson Education, Inc.
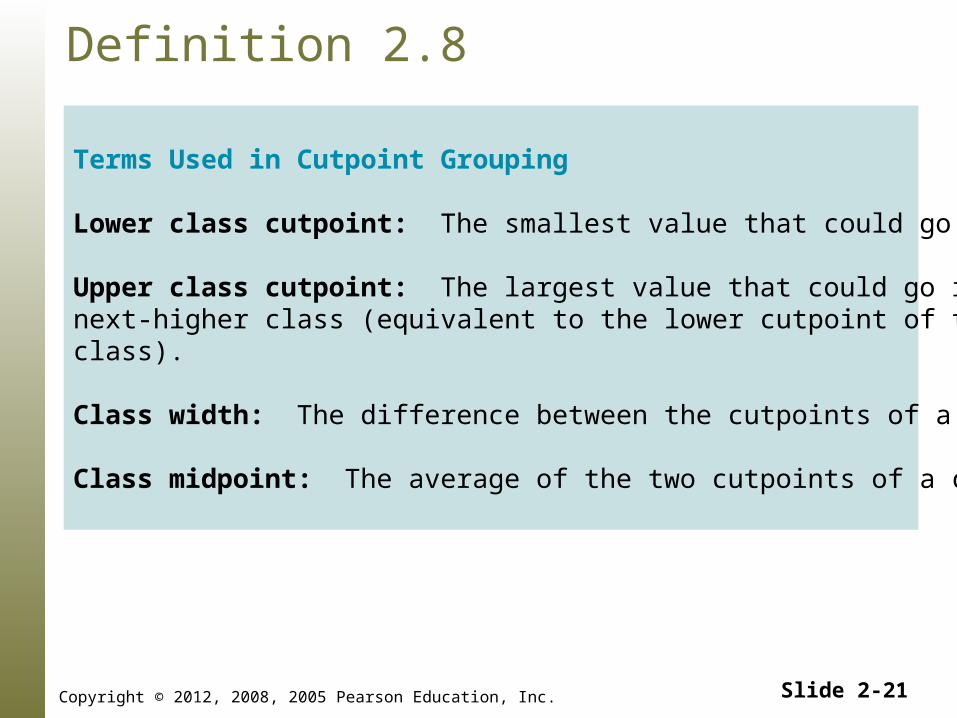
Definition 2.8
Terms Used in Cutpoint Grouping
Lower class cutpoint: The smallest value that could go in a class.
Upper class cutpoint: The largest value that could go in thenext-higher class (equivalent to the lower cutpoint of the next-higherclass).
Class width: The difference between the cutpoints of a class.
Class midpoint: The average of the two cutpoints of a class.
Slide 2-22Copyright © 2012, 2008, 2005 Pearson Education, Inc.
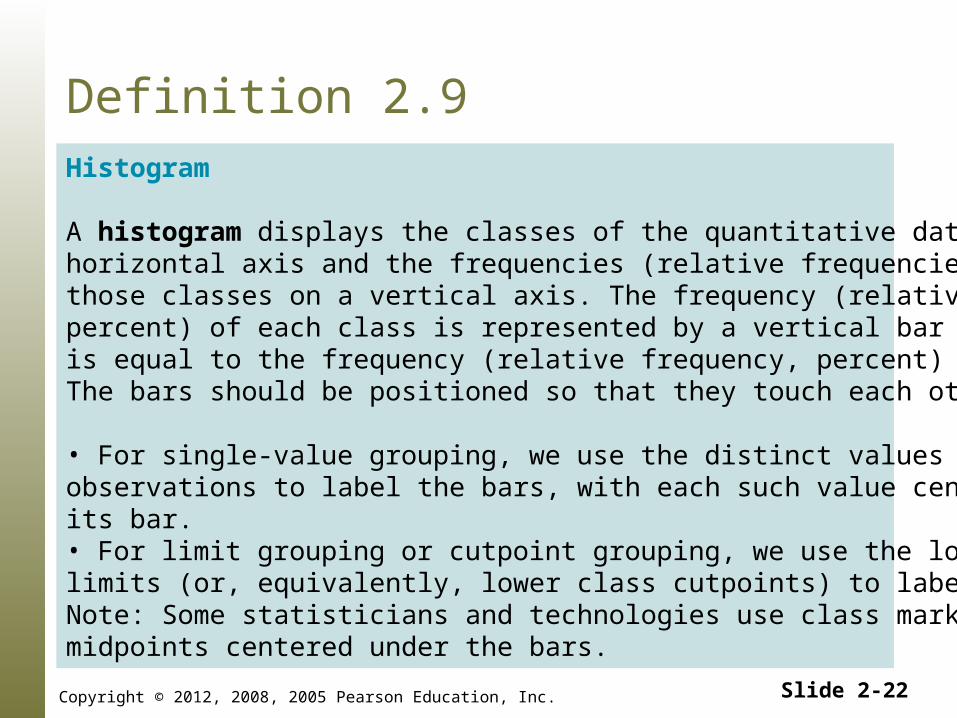
Definition 2.9Histogram
A histogram displays the classes of the quantitative data on a horizontal axis and the frequencies (relative frequencies, percents) of those classes on a vertical axis. The frequency (relative frequency, percent) of each class is represented by a vertical bar whose height is equal to the frequency (relative frequency, percent) of that class. The bars should be positioned so that they touch each other.
• For single-value grouping, we use the distinct values of the observations to label the bars, with each such value centered under its bar.• For limit grouping or cutpoint grouping, we use the lower class limits (or, equivalently, lower class cutpoints) to label the bars. Note: Some statisticians and technologies use class marks or class midpoints centered under the bars.
Slide 2-23Copyright © 2012, 2008, 2005 Pearson Education, Inc.
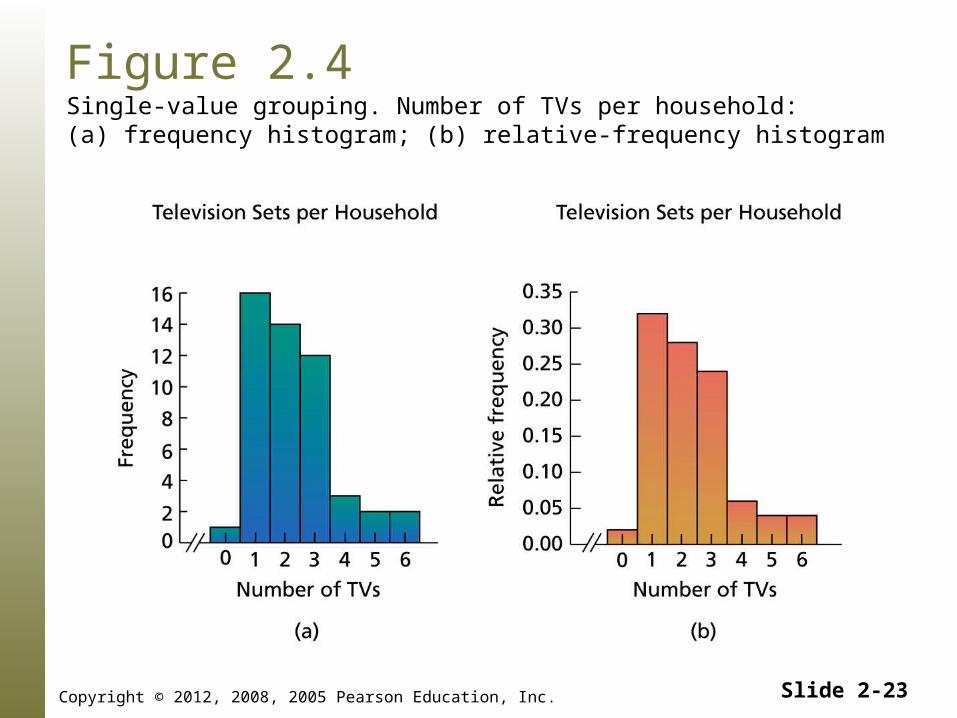
Figure 2.4Single-value grouping. Number of TVs per household:(a) frequency histogram; (b) relative-frequency histogram

Slide 2-24Copyright © 2012, 2008, 2005 Pearson Education, Inc.
Limit grouping. Days to maturity: (a) frequency histogram; (b) relative-frequency histogram
Figure 2.5
Slide 2-25Copyright © 2012, 2008, 2005 Pearson Education, Inc.
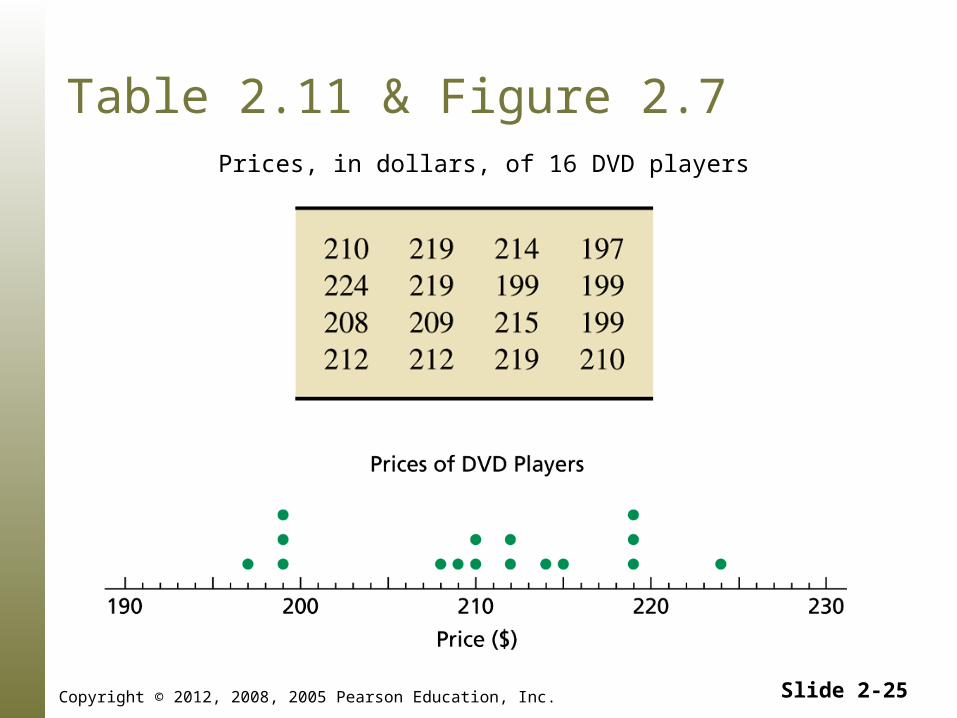
Table 2.11 & Figure 2.7Prices, in dollars, of 16 DVD players
Slide 2-26Copyright © 2012, 2008, 2005 Pearson Education, Inc.
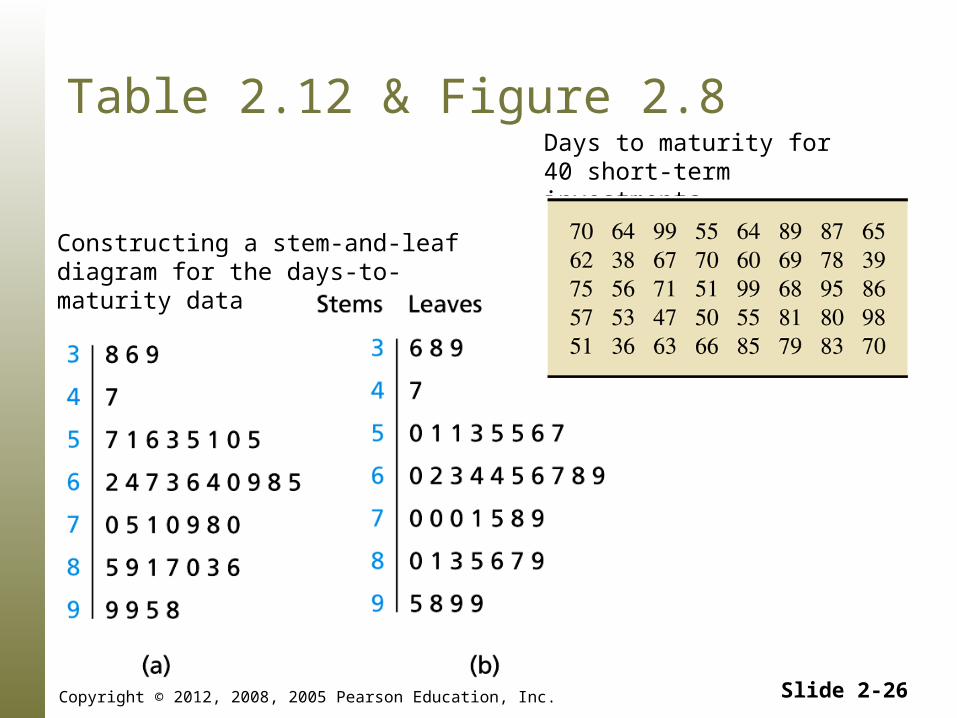
Table 2.12 & Figure 2.8Days to maturity for40 short-term investments
Constructing a stem-and-leaf diagram for the days-to-maturity data

Slide 2-27Copyright © 2012, 2008, 2005 Pearson Education, Inc.
Table 2.13 & Figure 2.9Cholesterol levelsfor 20 high-level patients Stem-and-leaf diagram for cholesterol
levels: (a) one line per stem; (b) two lines per stem

Slide 2-28Copyright © 2012, 2008, 2005 Pearson Education, Inc.
Section 2.4
Distribution Shapes
Slide 2-29Copyright © 2012, 2008, 2005 Pearson Education, Inc.
Definition 2.10
Distribution of a Data Set
The distribution of a data set is a table, graph, or formula that provides the values of the observations andhow often they occur.
Slide 2-30Copyright © 2012, 2008, 2005 Pearson Education, Inc.
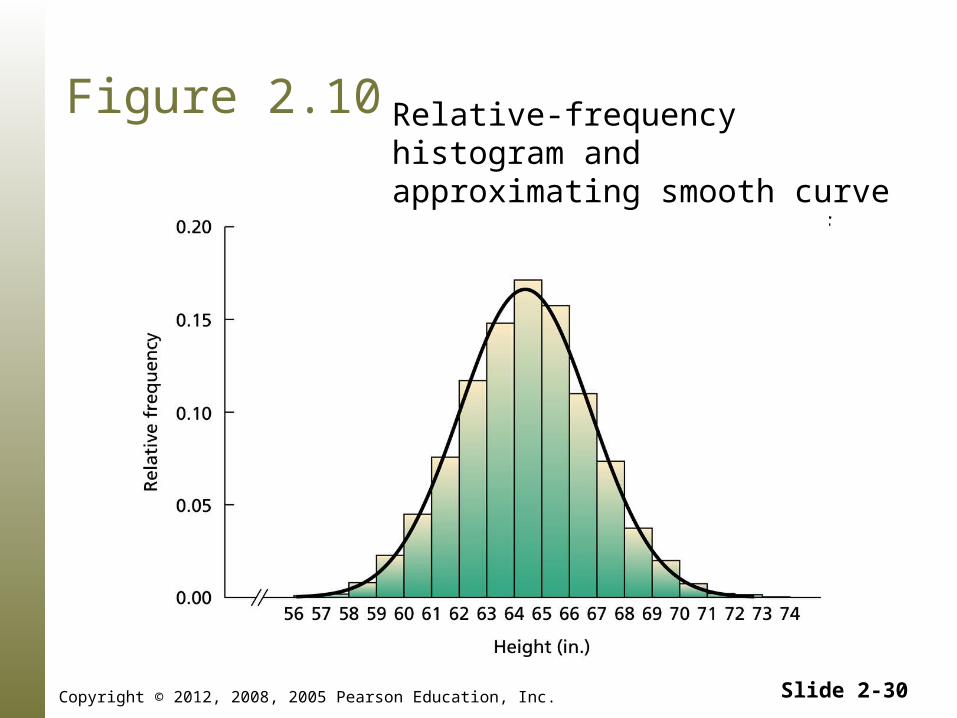
Figure 2.10 Relative-frequency histogram and approximating smooth curve for the distribution of heights
Slide 2-31Copyright © 2012, 2008, 2005 Pearson Education, Inc.
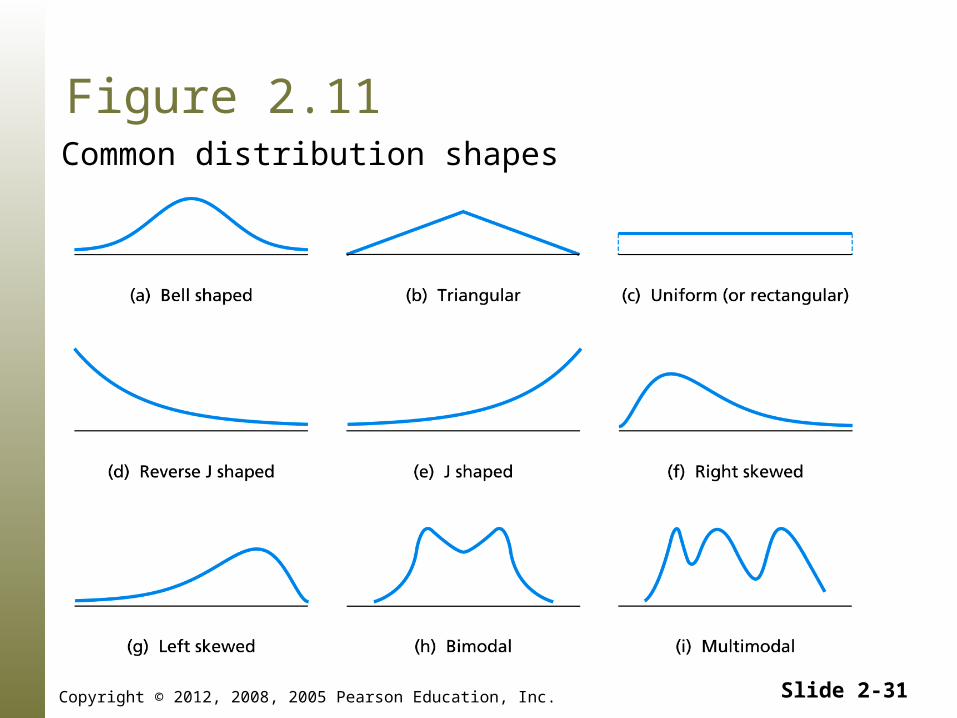
Figure 2.11Common distribution shapes
Slide 2-32Copyright © 2012, 2008, 2005 Pearson Education, Inc.
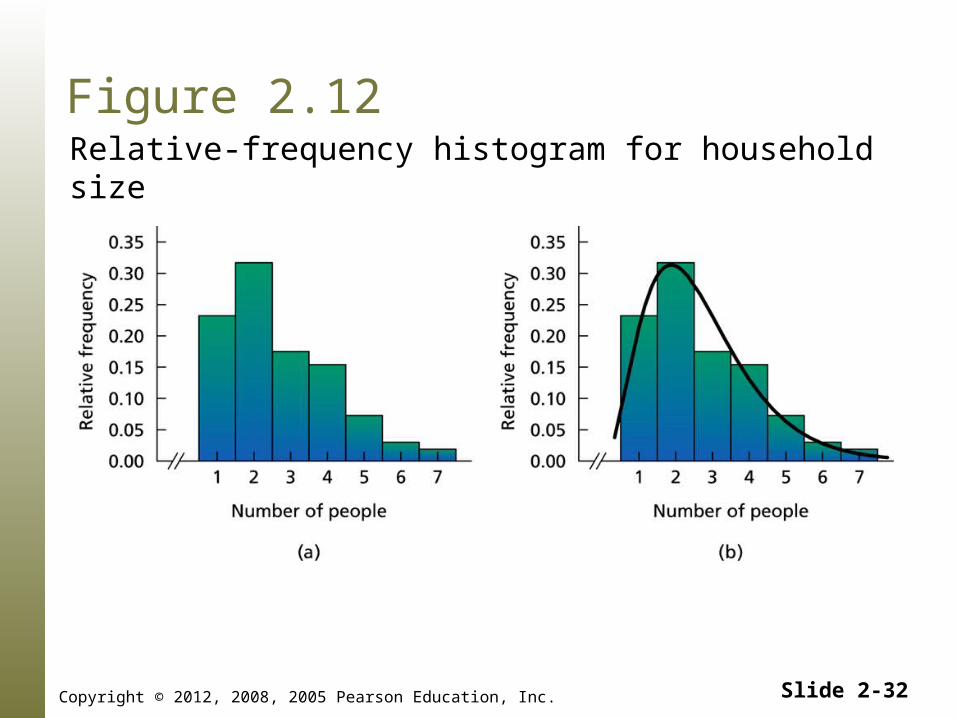
Figure 2.12Relative-frequency histogram for household size
Slide 2-33Copyright © 2012, 2008, 2005 Pearson Education, Inc.
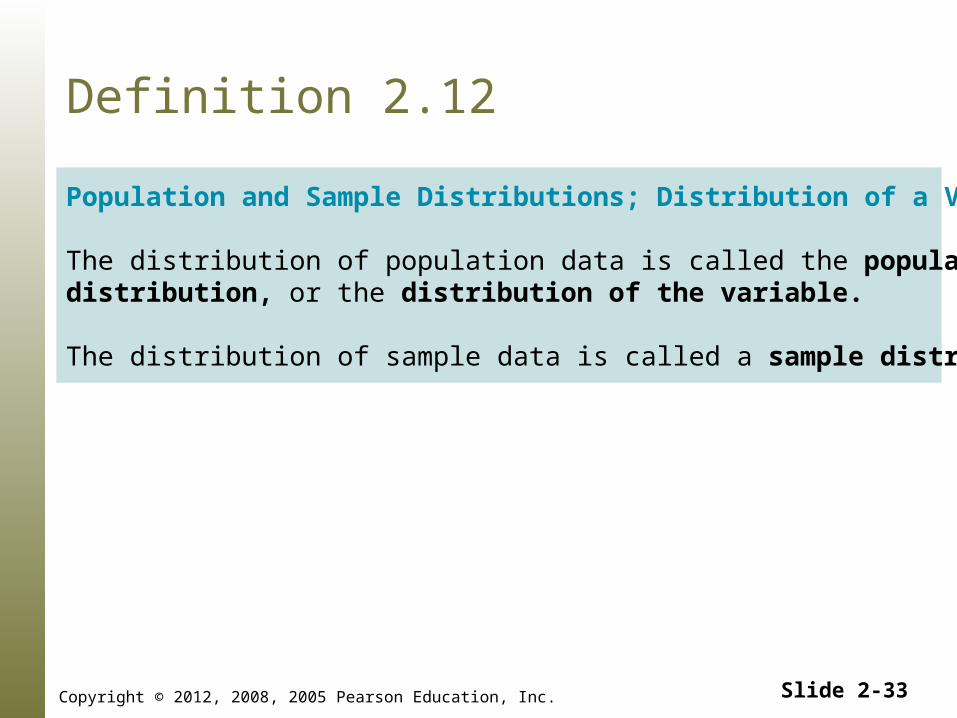
Definition 2.12
Population and Sample Distributions; Distribution of a Variable
The distribution of population data is called the population distribution, or the distribution of the variable.
The distribution of sample data is called a sample distribution.
Slide 2-34Copyright © 2012, 2008, 2005 Pearson Education, Inc.
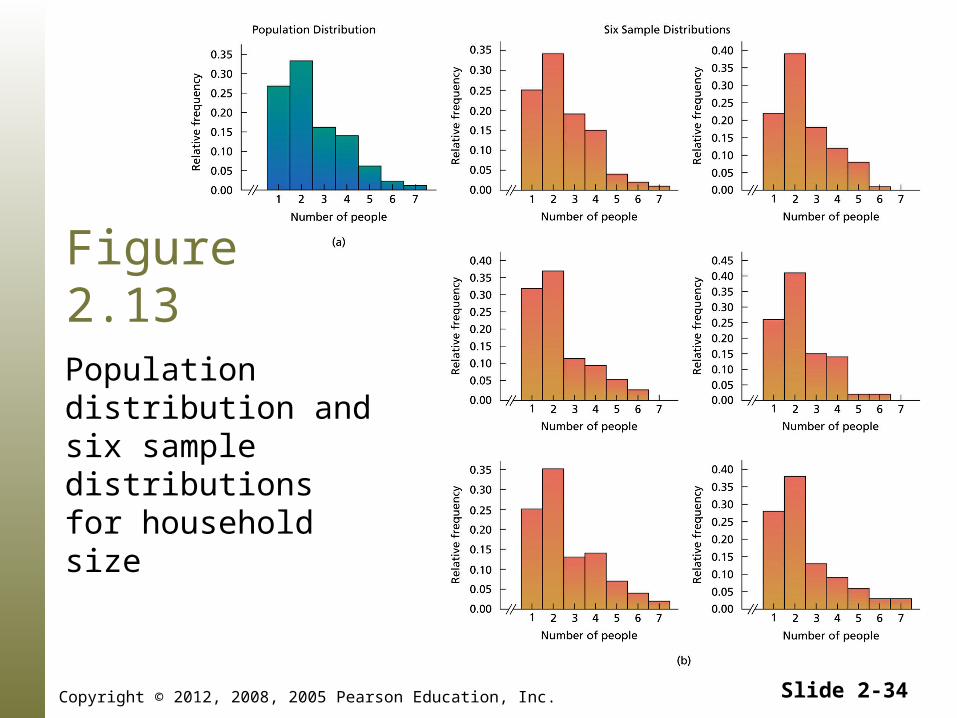
Figure 2.13Population distribution and six sample distributions for household size
Slide 2-35Copyright © 2012, 2008, 2005 Pearson Education, Inc.
Key Fact 2.1
Population and Sample Distributions
For a simple random sample, the sample distributionapproximates the population distribution (i.e., thedistribution of the variable under consideration). The larger the sample size, the better the approximationtends to be.