Slide 1 of 21 Levels of Organization Copyright Pearson Prentice Hall Ecosystem Community Population...
49
Slide 1 of 21 Levels of Organization Copyright Pearson Prentice Hall Ecosystem Community Population Individual Biome Biosphere
-
Upload
brooke-walsh -
Category
Documents
-
view
220 -
download
1
Transcript of Slide 1 of 21 Levels of Organization Copyright Pearson Prentice Hall Ecosystem Community Population...

Slide 1 of 21
Levels of Organization
Copyright Pearson Prentice Hall
Ecosystem
Community
Population
Individual
Biome
Biosphere

Figure 53.10 Examples of terrestrial and marine food chains

Figure 53.11 An antarctic marine food web

Figure 54.1 An overview of ecosystem dynamics

Slide 5 of 21
Copyright Pearson Prentice Hall
Producers
Photosynthesis is responsible for adding oxygen to—and removing carbon dioxide from—Earth's atmosphere.

Slide 6 of 21
Copyright Pearson Prentice Hall
Producers

Figure 54.10 Energy partitioning within a link of the food chain

Figure 54.11 An idealized pyramid of net production

Figure 54.12 Pyramids of biomass (standing crop)

Figure 54.13 A pyramid of numbers

Figure 54.14 Food energy available to the human population at different trophic levels

Figure 53.2 Testing a competitive exclusion hypothesis in the field

Figure 53.3a Resource partitioning in a group of lizards

Figure 53.4 Character displacement: circumstantial evidence for competition in nature

Figure 53.3bc Anolis distichus (left) and Anolis insolitus (right)

Figure 53.x2 Parasitic behavior: A female Nasonia vitripennis laying a clutch of eggs into the pupa of a blowfly (Phormia regina)

Figure 53.9 Mutualism between acacia trees and ants

Figure 53.x3 Commensalism between a bird and mammal

Figure 53.0 Lion with kill in a grassland community

Figure 54.25 Biological magnification of DDT in a food chain

Figure 54.15 A general model of nutrient cycling

Figure 54.17 The carbon cycle

Figure 54.16 The water cycle

Figure 54.18 The nitrogen cycle

Figure 54.19 The phosphorous cycle

Figure 54.20 Review: Generalized scheme for biogeochemical cycles

Figure 50.10 A climograph for some major kinds of ecosystems (biomes) in North America

Figure 50.24 The distribution of major terrestrial biomes

Figure 50.19 Freshwater biomes: Oligotrophic lake (left), eutrophic lake (top right), stream flowing into a river (bottom right)

Figure 50.25a Tropical forests

Figure 50.25b Savanna

Figure 50.25bx Savanna

Figure 50.25c Deserts

Figure 50.25d Chaparral

Figure 50.25dx Chaparral

Figure 50.25e Temperate grassland

Figure 20.25f Temperate deciduous forest

Figure 20.25g Coniferous forests
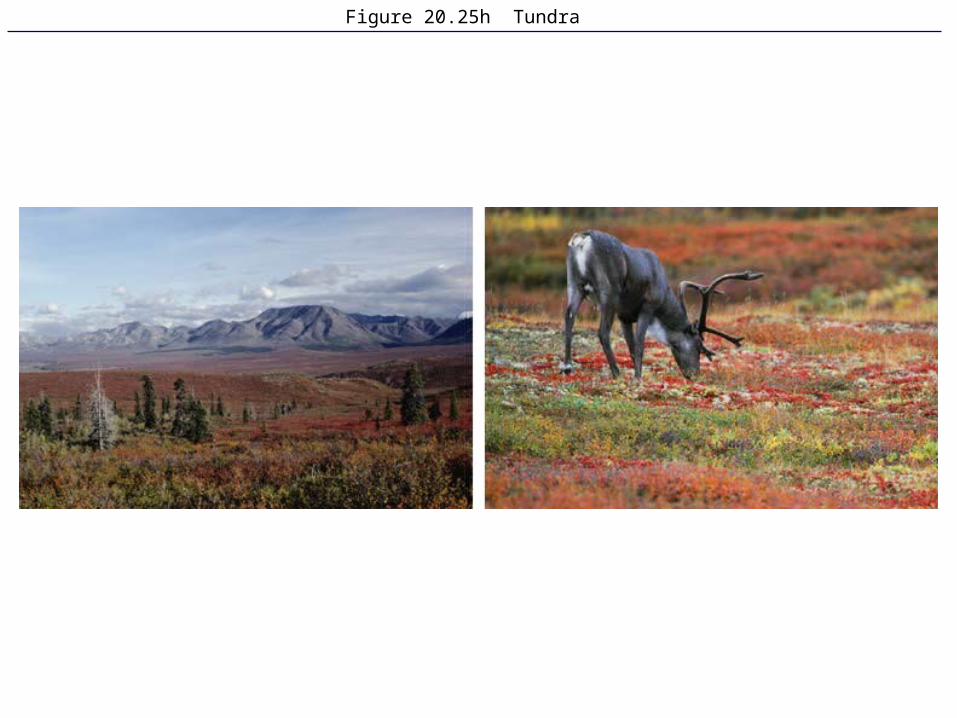
Figure 20.25h Tundra

Ecological Succession
Mosses soon appear, and grasses take root in the thin layer of soil.
Copyright Pearson Prentice Hall

Ecological Succession
Eventually, tree seedlings and shrubs sprout among the plant community.
Copyright Pearson Prentice Hall

Figure 52.11 Population growth predicted by the logistic model

Figure 52.12 How well do these populations fit the logistic population growth model?

Figure 52.18 Extreme population fluctuations

Figure 52.19 Population cycles in the snowshoe hare and lynx

Figure 52.20 Human population growth

Demographic transition

Figure 52.22 Age-structure pyramids for the human population of Kenya (growing at 2.1% per year), the United States (growing at 0.6% per year), and Italy (zero growth) for 1995

Figure 52.8 Population growth predicted by the exponential model