Slide 0 LECTURE 6 Unemployment BUS 530: ECONOMIC CONDITIONS ANALYSIS LECTURE 6: Unemployment.
66
slide 1 LECTURE 6 Unemployment BUS 530: ECONOMIC CONDITIONS ANALYSIS LECTURE 6: Unemployment
-
Upload
emerald-cooper -
Category
Documents
-
view
217 -
download
2
Transcript of Slide 0 LECTURE 6 Unemployment BUS 530: ECONOMIC CONDITIONS ANALYSIS LECTURE 6: Unemployment.

slide 1LECTURE 6 Unemployment
BUS 530: ECONOMIC CONDITIONS ANALYSIS
LECTURE 6: Unemployment

slide 2
Contents
Economic classification of population and measurement of unemployment
Working of the labor market
Natural rate of unemployment
Types of unemployment
Causes of unemployment and policy response

slide 3
Learning Objectives
Understand the working of the labor market and factors contributing to unemployment
Learn about macroeconomic policies for reducing unemployment
slide 4
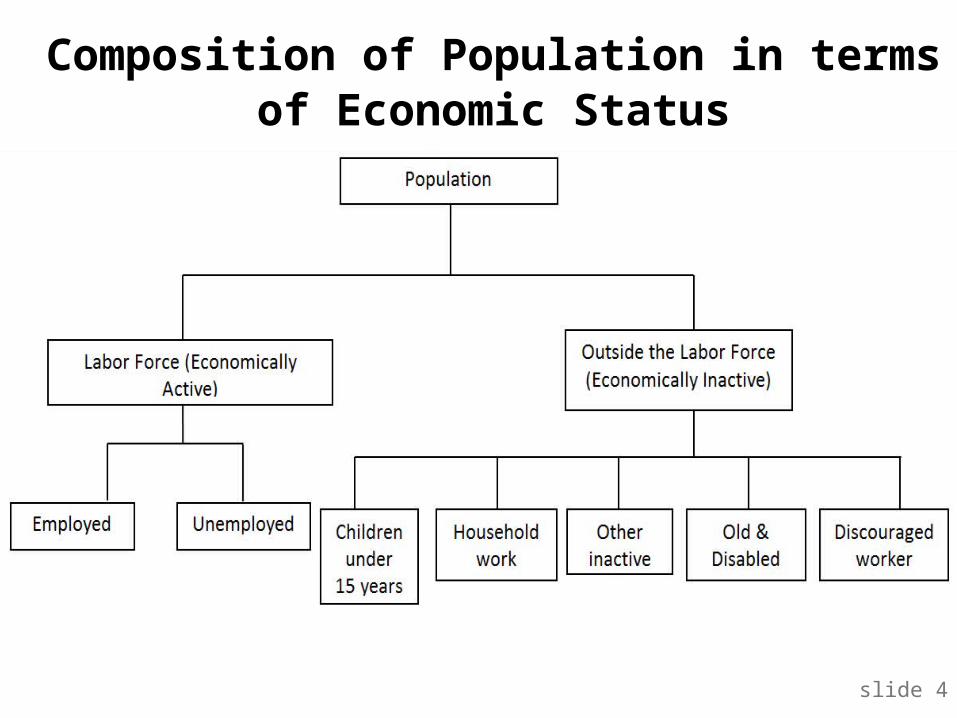
Composition of Population in terms of Economic Status

slide 5
Definitions used in Bangladesh
Employed: A person who was either working during the previous week for one or more hours for pay or profit or working without pay in a family farm or enterprise during the week or found not working but had a job or business from which he/she was temporarily absent during the week

slide 6
Definitions used in Bangladesh
Unemployed: A person who is involuntarily out of gainful employment during the reference period but either has been actively looking for a job or was willing to work but not looking for work because of illness
slide 7
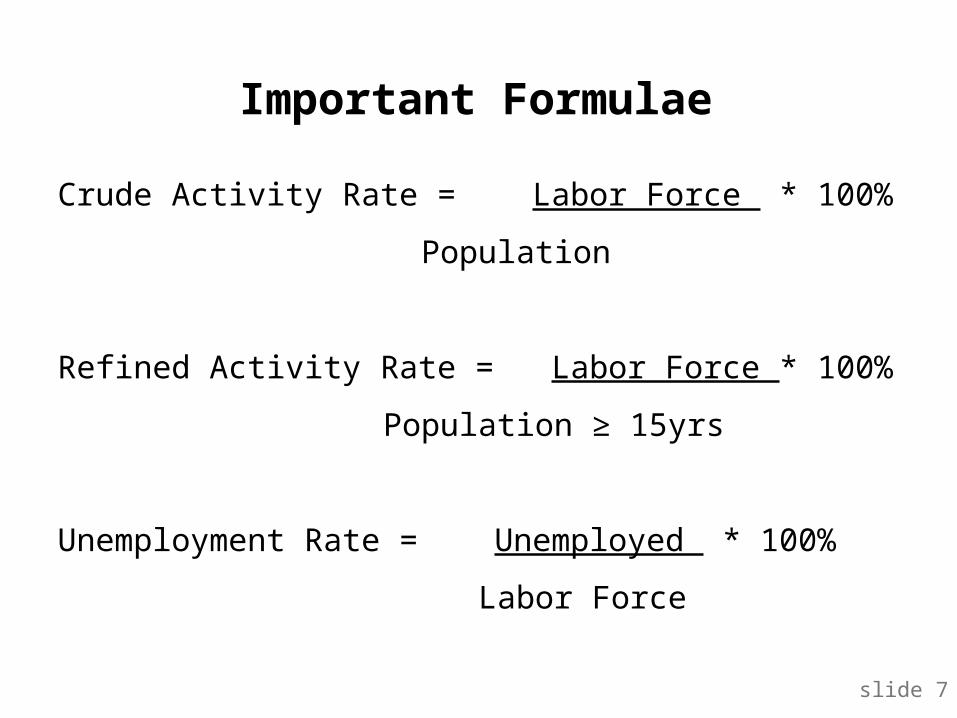
Important Formulae
Crude Activity Rate = Labor Force * 100%
Population
Refined Activity Rate = Labor Force * 100%
Population ≥ 15yrs
Unemployment Rate = Unemployed * 100%
Labor Force

slide 8
Labor Force Survey 2005-06
Items Number (in millions)
Population 148.8
Labor Force 56.7
Outside the Labor Force 92.1
Employed 54.1
Unemployed 2.6
Children below 15 years 53.2
Household work, other inactive, old & disabled, discouraged worker
38.9
Crude Activity Rate (%) 38.1
Refined Activity Rate (%) 59.3
Unemployment Rate (%) 4.5
slide 9LECTURE 6 Unemployment
Natural Rate of Unemployment
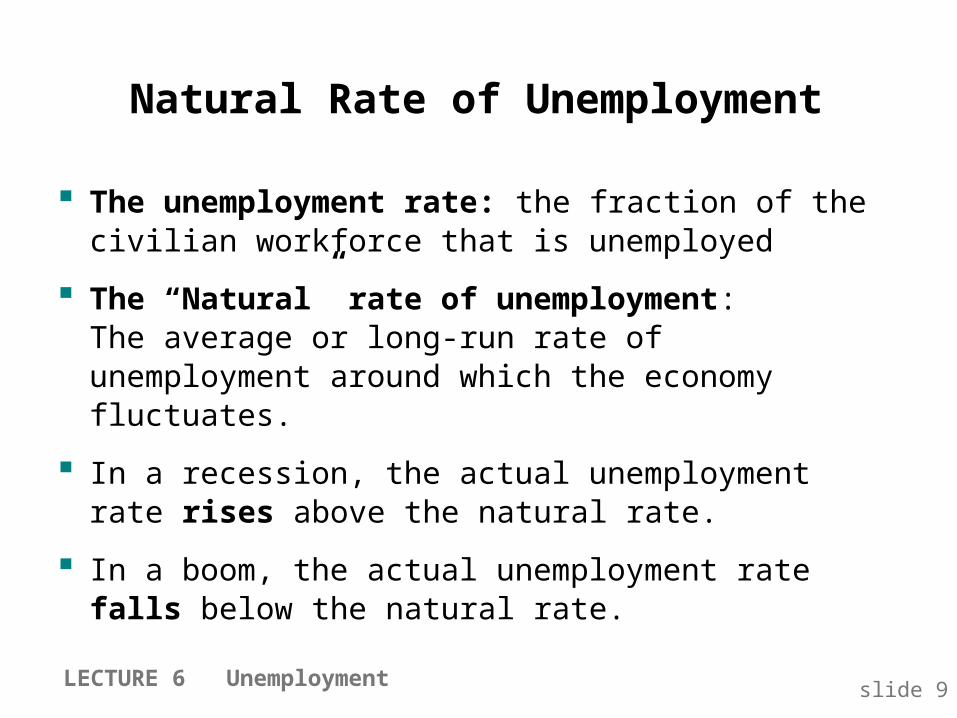
The unemployment rate: the fraction of the civilian workforce that is unemployed
The “Natural” rate of unemployment: The average or long-run rate of unemployment around which the economy fluctuates.
In a recession, the actual unemployment rate rises above the natural rate.
In a boom, the actual unemployment rate falls below the natural rate.

slide 10
Natural Rate of Unemployment
5-6% for the developed economies
Exists in the developing economies as well
Difficult to get rid of this type of unemployment
Thus when a country has 5-6% of unemployment, it is considered to be fully employed

slide 11LECTURE 6 Unemployment
Actual and Natural Rates of Unemployment in the U.S., 1960-2006
Per
cent
of l
abor
forc
e
0
2
4
6
8
10
12
1960 1965 1970 1975 1980 1985 1990 1995 2000 2005
Unemployment rate
Natural rate of unemployment

slide 12
Bangladesh Unemployment Rate
LECTURE 6 Unemployment

slide 13LECTURE 6 Unemployment
Labor Force and Unemployment Rate
Notation:
L = workers in labor force
E = employed workers
U = unemployed workers
U/L = unemployment rate

slide 14LECTURE 6 Unemployment
Assumptions:
1. L is exogenously fixed (no population growth).
2. During any given month,
s = fraction of employed workers that become separated from their jobs
s is called the rate of job separation
f = fraction of unemployed workers that find jobs
f is called the rate of job finding
s and f are exogenousexogenous

slide 15
The Transitions between Employment and Unemployment
LECTURE 6 Unemployment
Employed Unemployed
s E
f U

slide 16
The Steady State Condition
LECTURE 6 Unemployment
Definition: the labor market is in steady state, or long-run equilibrium, if the unemployment rate is constantconstant.
The steady-state condition is:
s E = f U
# of employed people who lose or leave their jobs
# of unemployed people who find jobs
slide 17LECTURE 6 Unemployment
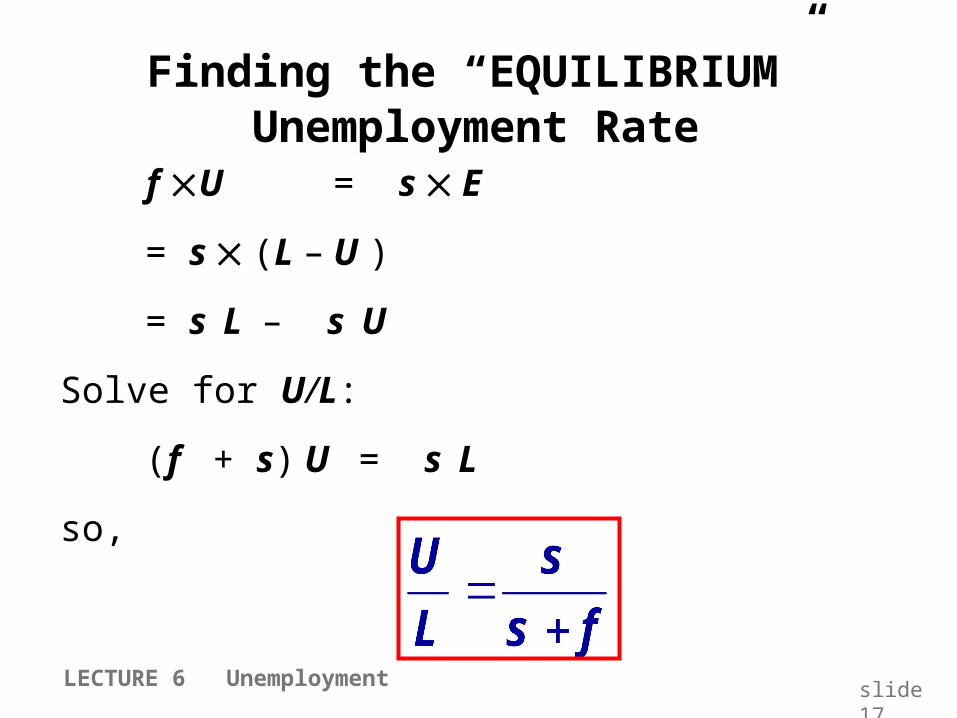
Finding the “EQUILIBRIUM” Unemployment Rate
f U = s E
= s (L – U )
= s L – s U
Solve for U/L:
(f + s) U = s L
so,

slide 18LECTURE 6 Unemployment
The “NATURAL” Rate of Unemployment
Therefore, the natural rate of unemployment is defined as:
Rate of job separation (s)
Rate of job separation (s) + Rate of job finding (f)

slide 19
Class Exercise
Suppose 1% of employed workers lose their jobs
19% of unemployed workers find jobs
Find the natural rate of unemployment
LECTURE 6 Unemployment

slide 20
Answer
Each month, 1% of employed workers lose their jobs
(s = 0.01) 19% of unemployed workers find jobs
(f = 0.19)
The natural rate of unemployment:
LECTURE 6 Unemployment
0 010 05, or 5%
0 01 0 19
U sL s f
..
. .

slide 21
Policy Implications
LECTURE 6 Unemployment
Any policy aimed at lowering the natural rate of unemployment must either reduce the rate of job separation (s) or increases the rate of job finding (f).
Similarly, any policy that affects the rate of job separation (s) or the rate of job finding (f) also changes the natural rate of unemployment, Because:

slide 22LECTURE 6 Unemployment
Why is there Unemployment?
If job finding were instantaneous (s = 0, f = 1), then all spells of unemployment would be brief, and the natural rate would be near zero.
There are two reasons why f < 1 and s > 0:
1. job search
2. wage rigidity

slide 23LECTURE 6 Unemployment
Job Search & Frictional Unemployment
Frictional unemployment: The unemployment caused by the time it takes workers to search for a job
Occurs even when wages are flexible and there are enough jobs to go around
Occurs because workers have different abilities, preferences jobs have different skill requirements geographic mobility of workers not instantaneous flow of information about vacancies and job
candidates is imperfect

slide 24LECTURE 6 Unemployment
Sectoral Shifts
defintion: Changes in the composition of demand among industries or regions.
example: Technological change more jobs repairing computers, fewer jobs repairing typewriters
example: A new international trade agreement labor demand increases in export sectors, decreases in import-competing sectors
Result: frictional unemployment

slide 25
Structural change over the long run -
US
LECTURE 6 Unemployment

slide 26
Structural Change in Employment: Bangladesh
LECTURE 6 Unemployment
slide 27LECTURE 6 Unemployment
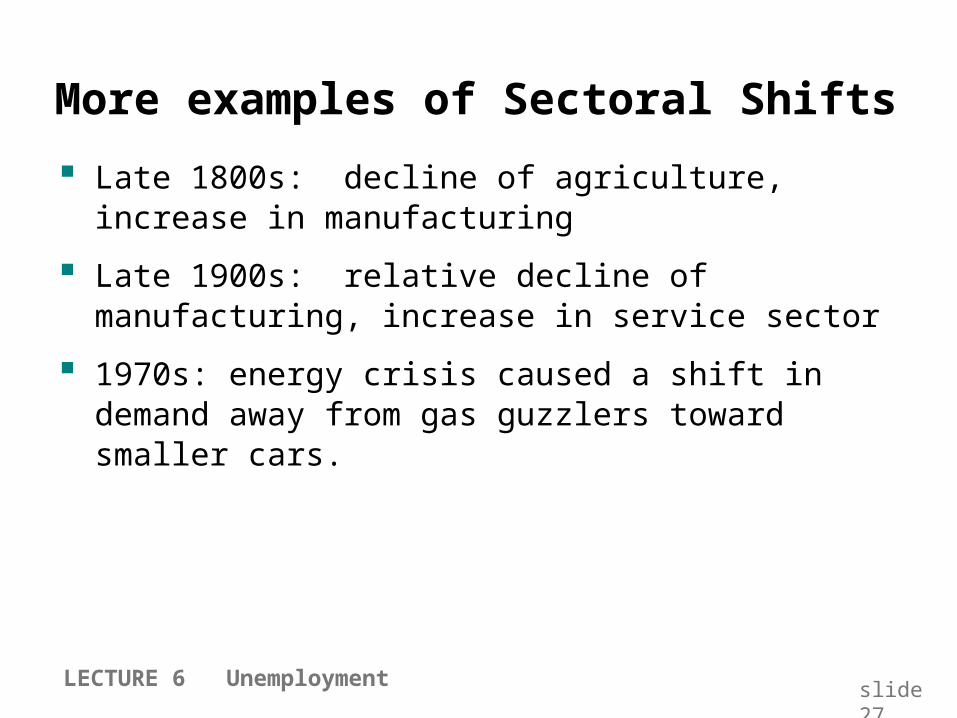
More examples of Sectoral Shifts
Late 1800s: decline of agriculture, increase in manufacturing
Late 1900s: relative decline of manufacturing, increase in service sector
1970s: energy crisis caused a shift in demand away from gas guzzlers toward smaller cars.
slide 28LECTURE 6 Unemployment
Public Policy and Job Search
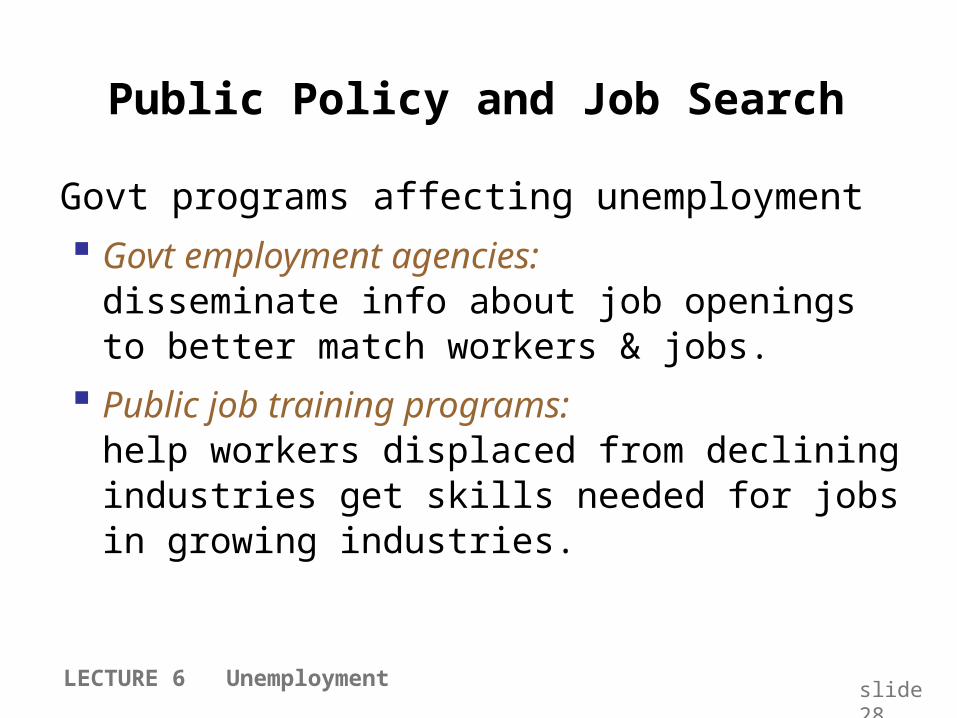
Govt programs affecting unemployment
Govt employment agencies:disseminate info about job openings to better match workers & jobs.
Public job training programs:help workers displaced from declining industries get skills needed for jobs in growing industries.
slide 29LECTURE 6 Unemployment
Unemployment insurance (UI)
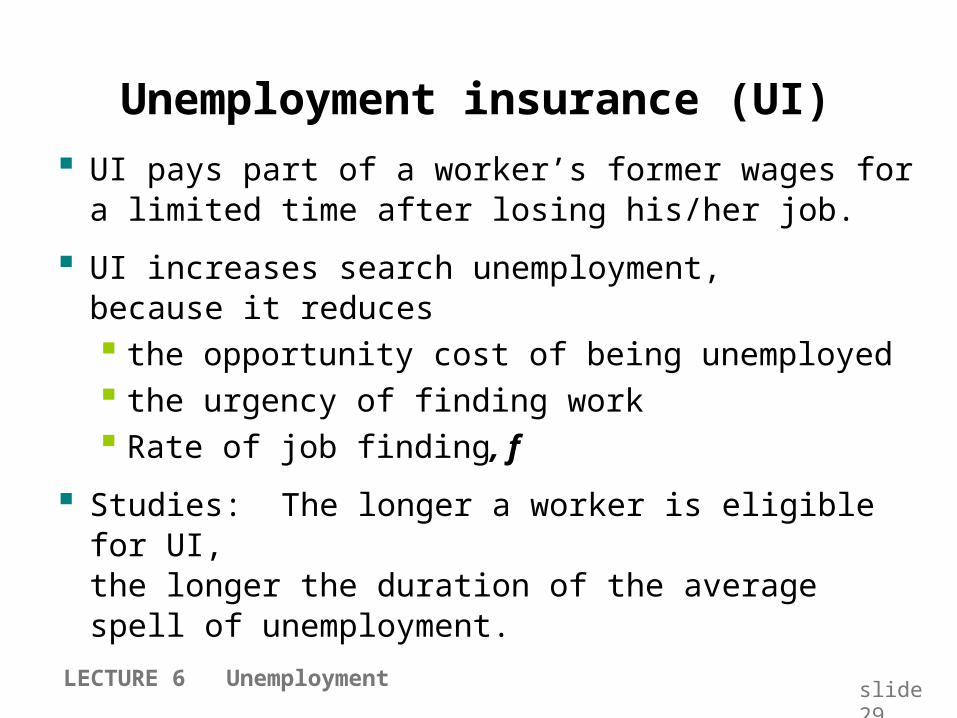
UI pays part of a worker’s former wages for a limited time after losing his/her job.
UI increases search unemployment, because it reduces the opportunity cost of being unemployed the urgency of finding work Rate of job finding, f
Studies: The longer a worker is eligible for UI, the longer the duration of the average spell of unemployment.

slide 30LECTURE 6 Unemployment
By allowing workers more time to search,
UI may lead to better matches between jobs and workers, which would lead to greater productivity and higher incomes.
Benefits of UI

slide 31
Unemployment Benefits
Provided in developed countries
Eligibility excludes new entrants to the labor force and those giving up job voluntarily
Raises aggregate demand and contributes toward early recovery of an economy from recession

slide 32LECTURE 6 Unemployment
Why is there Unemployment?
Two reasons why f < 1:
1. job search
2. wage rigidity
DONE Next
The natural rate of unemployment:

slide 33LECTURE 6 Unemployment
Unemployment from Real Wage Rigidity & Structural Unemployment
Labor
Real wage
Supply
Demand
Unemployment
Rigid
real wage
Amount of labor willing to work
Amount of labor hired
If real wage is stuck above its equilibrium level, then there aren’t enough jobs to go around.

slide 34LECTURE 6 Unemployment
Unemployment from Real Wage Rigidity
Then, firms must ration the scarce jobs among workers.
Then, firms must ration the scarce jobs among workers.
Structural unemployment: The unemployment resulting from real wage rigidity and job rationing.
Structural unemployment: The unemployment resulting from real wage rigidity and job rationing.
If real wage is stuck above its equilibrium level, then there aren’t enough jobs to go around.

slide 35LECTURE 6 Unemployment
Reasons for Wage Rigidity
1. Minimum wage laws
2. Labor unions
3. Efficiency wages

slide 36LECTURE 6 Unemployment
The Minimum Wage
The minimum wage may exceedexceed the equilibrium wage of unskilled workers, especially teenagers.
Studies: a 10% increase in min. wage reduces teen employment by 1-3%
Tendency for firms to substitute towards illegal workers (who are not bound by the min. wage)
But, the minimum wage cannot explain the majority of the natural rate of unemployment, as most workers’ wages are well above the minimum wage.
slide 37
Minimum Wage Law
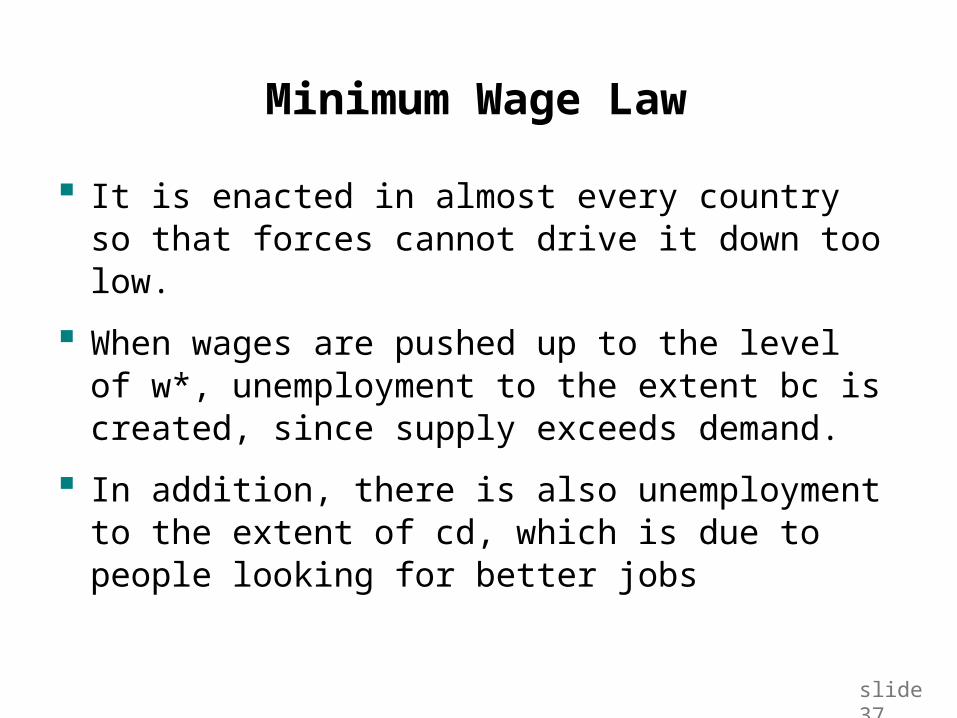
It is enacted in almost every country so that forces cannot drive it down too low.
When wages are pushed up to the level of w*, unemployment to the extent bc is created, since supply exceeds demand.
In addition, there is also unemployment to the extent of cd, which is due to people looking for better jobs

slide 38
Labor Market

slide 39LECTURE 6 Unemployment
Labor Unions
Unions exercise monopoly power to secure higher wages for their members (collective bargaining).
When the union wage exceeds the equilibrium wage, unemployment results.
Insiders: Employed union workers whose interest is to keep wages high.
Outsiders: Unemployed non-union workers who would be willing to work for lower wages, so there would be enough jobs for them.

slide 40
Collective Bargaining by Labor Union
Every country legalizes labor union activity to prevent excessive exploitation of labor by the employer
Experiences have shown that if politicization of labor union can be avoided and labor unions abide by the rules of the game then union activities can contribute towards congenial industrial relations

105,508Private sector (total)
20,381Government (total)
14,045Health care
3,312Education
10,951Professional services
6,304Finance, insurance
4,379Transportation
14,973Retail trade
15,518Manufacturing
600Mining
122.3
121.7
115.1
112.7
90.6
90.7
129.2
114.0
107.8
113.7
156.9
8.5%
40.5
8
15.4
3.1
2.1
24.4
5.8
13.7
9.5
13.88,053Construction
wage ratio
U % of total# employed
(1000s)industry
wage ratio = 100(union wage)/(nonunion wage) slide 41
Union Membership and Wage RATIOS by Industry, 2005
LECTURE 6 Unemployment

slide 42LECTURE 6 Unemployment
3. Efficiency Wage Theory IdeaIdea: higher wages increase worker productivity by:
Attracting higher quality job applicants
(“Adverse SelectionAdverse Selection” problem) Increasing worker effort, reducing “shirking”
(“Moral HazardMoral Hazard” problem) Reducing turnover, which is costly to firms Improving health of workers: better nutrition &
productivity (in developing countries)
Firms willingly pay above-equilibrium wages to raise productivity, causing structural unemployment.

slide 43LECTURE 6 Unemployment

slide 45
Other Types of Unemployment and Macroeconomic Policies
LECTURE 6 Unemployment

slide 46
Cyclical Unemployment
Y* represents full employment output level
Sometimes national output falls due to a fall in demand, this is called recession. Labor demand declines, additional unemployment to the extent of ee*
This is called cyclical unemployment

slide 47

slide 48
Stabilization Policy
Developed countries can stabilize cyclical unemployment through expansionary monetary or fiscal policies
Expansionary monetary policy increases credit supply which raises aggregate demand. An expansionary fiscal policy on the other hand reduces taxes

slide 49
Disguised Unemployment
Developing countries are generally not close to the full employment level. Here, unemployment does not occur due to periodic demand shortfall. These countries, like Bangladesh suffer from disguised unemployment.
slide 50
Structural Unemployment
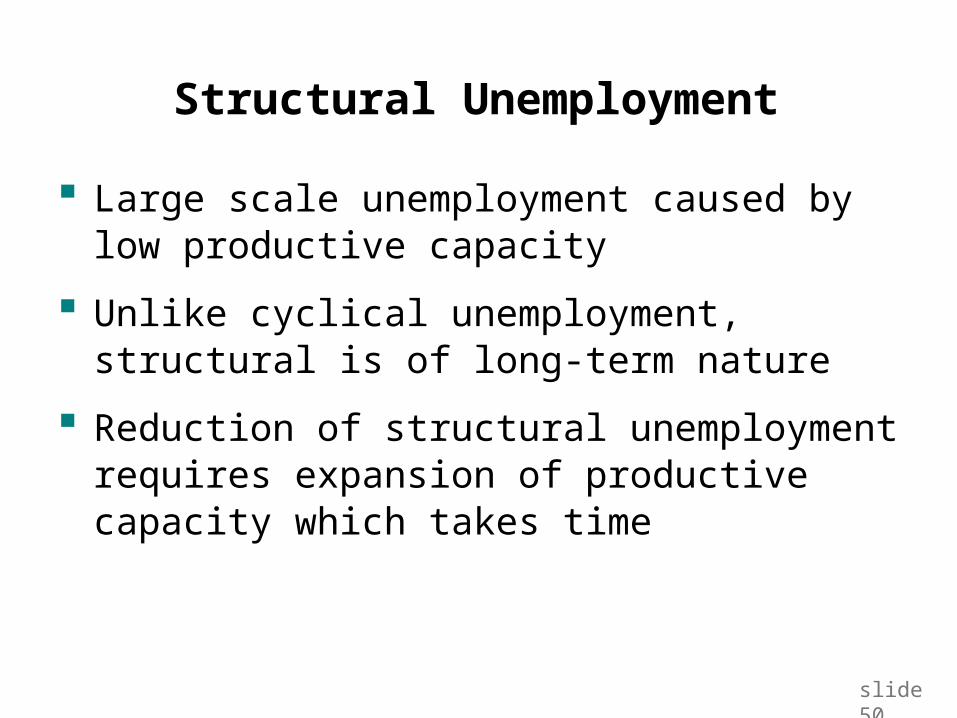
Large scale unemployment caused by low productive capacity
Unlike cyclical unemployment, structural is of long-term nature
Reduction of structural unemployment requires expansion of productive capacity which takes time

slide 51
Seasonal Unemployment
Periodic Unemployment
Agricultural workers suffer unemployment during agricultural lean seasons. Workers in developed countries can however easily switch skills to meet varying labor demands
Can also be countered through government intervention

Chapter Summary
1. The natural rate of unemployment the long-run average or “steady state” rate of
unemployment depends on the rates of job separation and job
finding
2. Frictional unemployment due to the time it takes to match workers with jobs may be increased by unemployment insurance
CHAPTER 6 Unemployment slide 52LECTURE 6 Unemployment

Chapter Summary
3. Structural unemployment results from wage rigidity: the real wage remains
above the equilibrium level caused by: minimum wage, unions, efficiency
wages4. Behavior of the natural rate in the U.S.
rose from 1960 to early 1980s, then fell possible explanations:
trends in real minimum wage, union membership, prevalence of sectoral shifts, and aging of the Baby Boomers
CHAPTER 6 Unemployment slide 53LECTURE 6 Unemployment

Chapter Summary
5. European unemployment has risen sharply since 1970 probably due to generous unemployment benefits,
strong union presence, and a technology-driven shift in demand away from unskilled workers
CHAPTER 6 Unemployment slide 54LECTURE 6 Unemployment

slide 55LECTURE 6 Unemployment
Sectoral Shifts
U.S. Auto Industry (Detroit): Struggling for many years: falling profits, increased foreign competition, insufficient R&D
- Recently, rising healthcare costs have caused significant increase in costs
-Auto workers have been leaving the industry to work in the services sector…healthcare (especially nursing) is an attractive option
-But transition can be painful (new skills, training, going back to school, etc)
In a dynamic economy, sectoral shifts occur frequently, contributing to frictional unemployment:
often referred to as the “cost” of economic development

slide 56LECTURE 6 Unemployment
Geography of a RecessionU.S. Housing and Labor Markets
January 2008

slide 59LECTURE 6 Unemployment
TREND: The Natural Rate rises during 1960-1984, then falls during 1985-2006

slide 60LECTURE 6 Unemployment
Explaining the Trend:
The Minimum Wage
0
1
2
3
4
5
6
7
8
9
1950 1955 1960 1965 1970 1975 1980 1985 1990 1995 2000 2005
Dol
lars
per
hou
r
minimum wage in current dollars
minimum wage in 2006 dollars
The trend in the real minimum wage is similar to that of the natural rate of unemployment.
The trend in the real minimum wage is similar to that of the natural rate of unemployment.

slide 61LECTURE 6 Unemployment
EXPLAINING THE TREND:Union membership
Since the early 1980s, the natural rate of unemploy-ment and union membership have both fallen.
But, from 1950s to about 1980, the natural rate rose while union membership fell.
Since the early 1980s, the natural rate of unemploy-ment and union membership have both fallen.
But, from 1950s to about 1980, the natural rate rose while union membership fell.
Union membershipselected years
year percent of labor force
1930 12%
1945 35%
1954 35%
1970 27%
1983 20.1%
2005 12.5%

slide 62LECTURE 6 Unemployment
EXPLAINING THE TREND:
Sectoral shifts
Price per barrel of oil,
in 2006 dollars
From mid 1980s to early 2000s, oil prices less volatile, so fewer sectoral shifts.
From mid 1980s to early 2000s, oil prices less volatile, so fewer sectoral shifts.
slide 63LECTURE 6 Unemployment
EXPLAINING THE TREND:Demographics
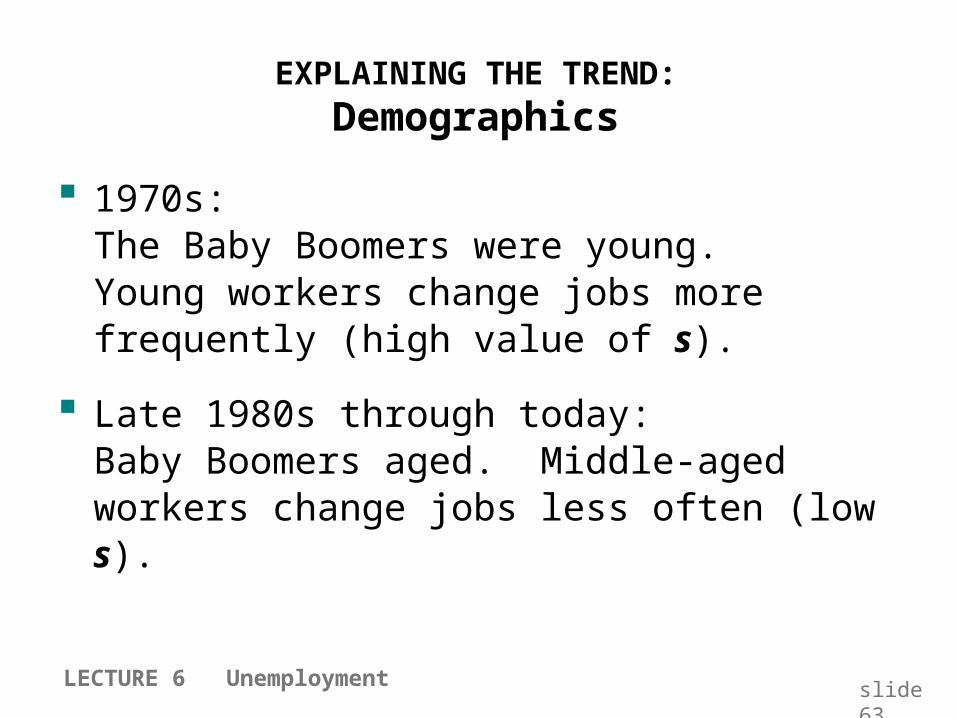
1970s: The Baby Boomers were young. Young workers change jobs more frequently (high value of s).
Late 1980s through today: Baby Boomers aged. Middle-aged workers change jobs less often (low s).

slide 64slide 64
Unemployment in Europe, 1960-2005
Per
cent
of l
abor
forc
e
Italy
Germany
France
U.K.
0
3
6
9
12
1960 1965 1970 1975 1980 1985 1990 1995 2000 2005LECTURE 6 Unemployment

slide 65LECTURE 6 Unemployment
The Rise in European Unemployment
Shock Technological progress has shifted labor demand from unskilled to skilled workers in recent decades.
An increase in the “skill premium” – the wage gap between skilled and unskilled workers.
Higher unemployment, due to generous govt benefits for unemployed workers
strong union presence.

slide 66LECTURE 6 Unemployment
Percent of workers covered by collective bargaining
United States 18%
United Kingdom 47
Switzerland 53
Spain 68
Sweden 83
Germany 90
France 92
Austria 98

slide 67
Structural Unemployment
Large scale unemployment caused by low productive capacity

slide 68
Structural Unemployment
Supply is relatively inelastic, thus stabilization measure aimed at raising aggregate demand will have less effect on aggregate demand and hence on demand for labor. Rather it will cause general price level to rise.

slide 69
Actual & Potential GDP
Potential GDP is when labor and all other productive assets are fully employed. The area between potential and actual GDP shows the cost of unemployment.