Sleep Deprivation Study Results
11
Final Project for Exploring Neural Data Abstract: A sleep EEG data set, with stages, is analyzed to determine differences between baseline and sleep deprivation recovery sleep among 4 subjects. Data and findings are described, including results of the analysis, with discussion of features of the programming and a problem with the data set as provided. It is concluded that recovery from sleep deprivation in these subjects primarily is reflected in time to sleep stages and total duration of the sleep period. Part 1: Description of the data The data set was from the sleep lab of Dr. Carskadon. The data was of four subjects, each of whom had EEG, chin muscle, and eye movement data recorded during two separate sleep periods: one as a ‘baseline,’ or control period, and the second as a ‘recovery’ sleep period after sleep deprivation. There were 8 data files, two per subject, one of baseline data and one of recovery data. Each data file contained a 9-channel EEG recording, a signal capture frequency rate (128 per second for all files), and a sleep staging data file, corresponding to sequential 30- second time segments, or epochs, of the EEG data file. The recordings began with subjects awake and continued while the subjects fell asleep. Different stages of waking and sleeping activity were rated in the sleep stages data from 0 (awake), through stages 1-4 of NREM sleep, and through stage 5 (REM) sleep. Stage 6 was periods of movement, and stage 7 was un-scored, non-sleep time. The EEG data and sleep stage data were synchronized so as to allow analysis to study EEG activity during the stages rated. Part 2: Questions addressed in the project Question 1: How did sleep deprivation recovery affect the frequency and number of different sleep stages? Question 2: How did sleep deprivation recovery affect the time to onset of various sleep stages? Question 3: How did sleep deprivation recovery affect the amplitudes of typical sleep EEG bands, such as slow wave, spindle, and beta components? Question 4: Do different subjects differ in their sleep stage profiles? Question 5: How much of the sleep stage change between baseline and recovery periods can be explained by the total duration of the sleep periods?
-
Upload
william-herrera -
Category
Documents
-
view
17 -
download
2
description
Results of a sleep lab study of recovery from sleep deprivation
Transcript of Sleep Deprivation Study Results
Final Project for Exploring Neural Data
Abstract: A sleep EEG data set, with stages, is analyzed to determine differences between baseline and sleep deprivation recovery sleep among 4 subjects. Data and findings are described, including results of the analysis, with discussion of features of the programming and a problem with the data set as provided. It is concluded that recovery from sleep deprivation in these subjects primarily is reflected in time to sleep stages and total duration of the sleep period.
Part 1: Description of the data
The data set was from the sleep lab of Dr. Carskadon. The data was of four subjects, each of whom had EEG, chin muscle, and eye movement data recorded during two separate sleep periods: one as a ‘baseline,’ or control period, and the second as a ‘recovery’ sleep period after sleep deprivation. There were 8 data files, two per subject, one of baseline data and one of recovery data. Each data file contained a 9-channel EEG recording, a signal capture frequency rate (128 per second for all files), and a sleep staging data file, corresponding to sequential 30-second time segments, or epochs, of the EEG data file.
The recordings began with subjects awake and continued while the subjects fell asleep. Differentstages of waking and sleeping activity were rated in the sleep stages data from 0 (awake), through stages 1-4 of NREM sleep, and through stage 5 (REM) sleep. Stage 6 was periods of movement, and stage 7 was un-scored, non-sleep time. The EEG data and sleep stage data were synchronized so as to allow analysis to study EEG activity during the stages rated.
Part 2: Questions addressed in the project
Question 1:How did sleep deprivation recovery affect the frequency and number of different sleep
stages?
Question 2:How did sleep deprivation recovery affect the time to onset of various sleep stages?
Question 3:How did sleep deprivation recovery affect the amplitudes of typical sleep EEG bands,
such as slow wave, spindle, and beta components?
Question 4:Do different subjects differ in their sleep stage profiles?
Question 5:How much of the sleep stage change between baseline and recovery periods can be
explained by the total duration of the sleep periods?
Part 3: Description of the findings
The study sleep stage data was analyzed by importation into a pandas DataFrame with rows the fields ‘baseline’, ‘recovery’, ‘sources’, and ‘study_identifiers’, and the DataFrames were then saved to disk as pickle files and re-loaded from disk for the analyses. Other fields wereadded to the DataFrame during analysis as needed for particular analyses. The sleep EEG data proved to be large, over 1.8 gigabytes in size uncompressed, which made loading all EEG data into a single DataFrame impractical under the Windows python version being used. EEG data was therefore loaded into a set of eight other DataFrames, one per EEG recording, and pickled todisk, then loaded only when analysis of that particular EEG file was needed.
Findings were graphed with the pyplot bar function for bar charts and the pyplot plot and subplot functions for the stages over time graphics. The mean and nanstd functions of numpy were used for means and standard deviation calculations, and the scipy stats package was used for other statistical analyses.
A. Description of results with figures.
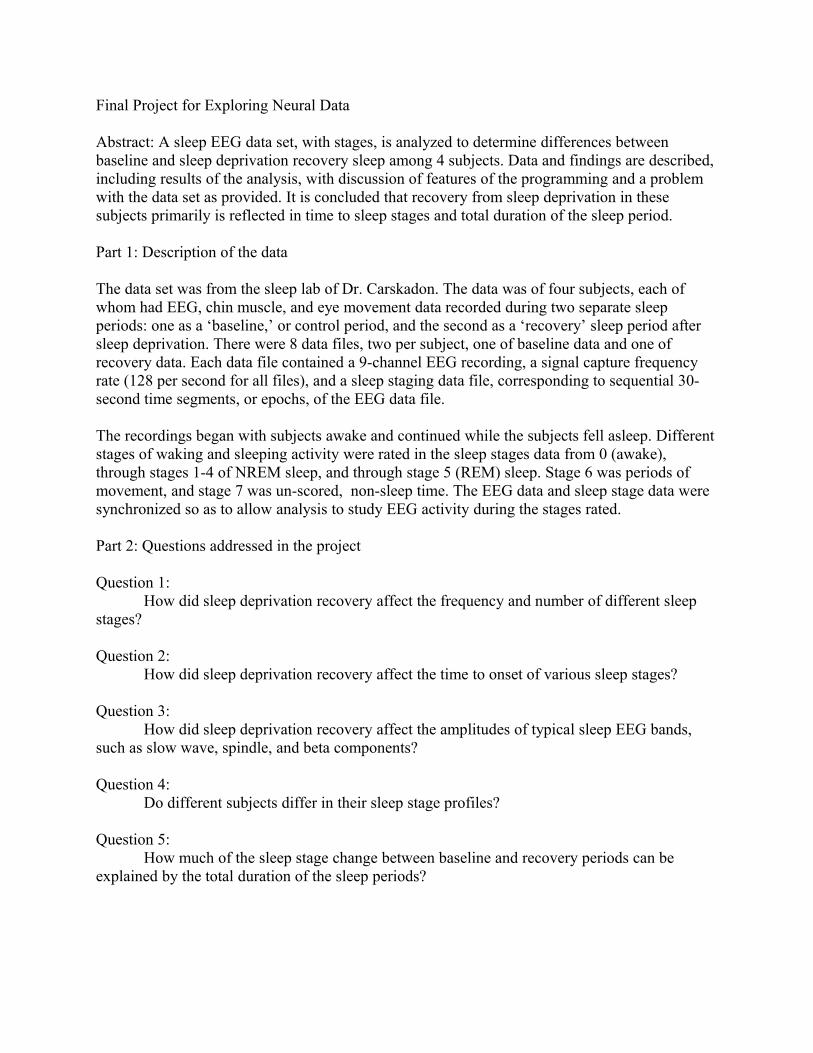
Sleep stage frequencies were measured as the number of 30-second time segments, or epochs, of a given type over each sleep period. “Frequency” here is epochs per sleep period. A bar chart for sleep stage frequencies is shown below:
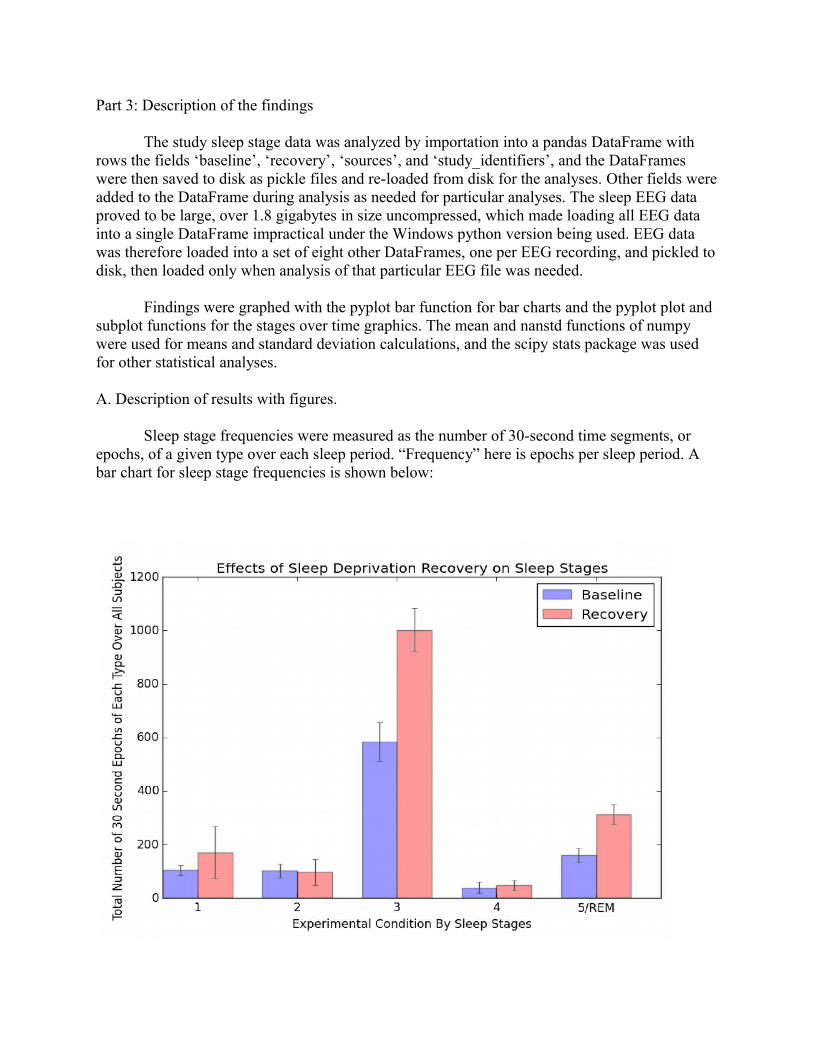
We also analyzed the time to a given sleep stage from the start of the recording period:

We also loaded the EEG data and computed the summed amplitudes of the EEG leads for each EEG. Note that investigation of alternative methods using each EEG lead separately did not seem to affect the analysis, so we used all EEG leads provided in the calculations:

We also calculated the sleep stage frequencies after normalizing the data for sleep stage duration.This involved multiplying each stage frequency by the multiplier below:
multiplier = (mean of all 8 sleep period durations) / (each individual file’s sleep period duration)
This made the stage frequencies translate to a measure of epochs per 13.8 hours (13.8 hours was the mean sleep period duration).
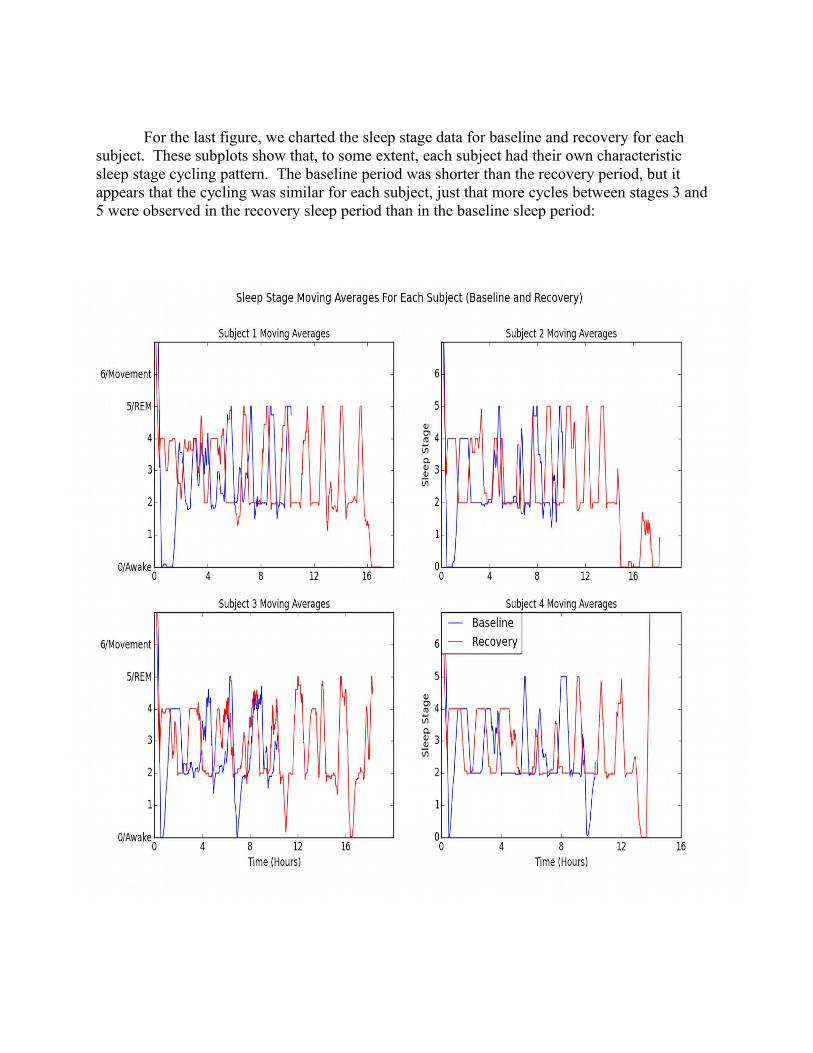
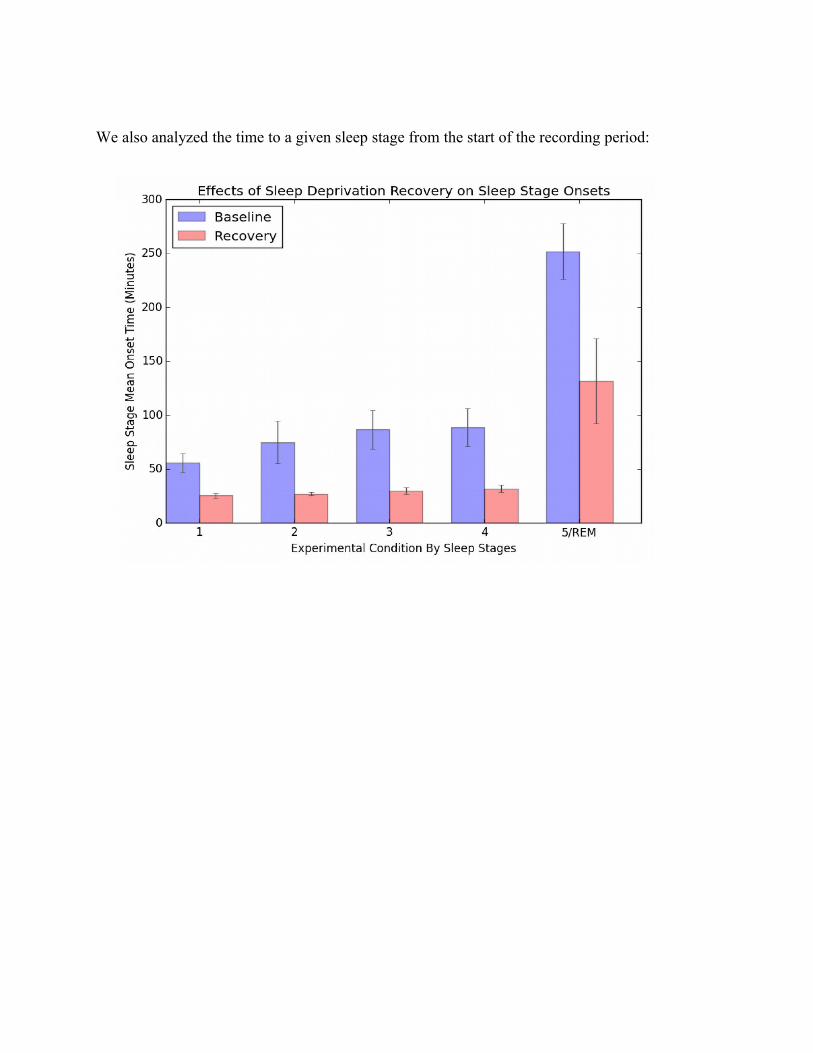
For the last figure, we charted the sleep stage data for baseline and recovery for each subject. These subplots show that, to some extent, each subject had their own characteristic sleep stage cycling pattern. The baseline period was shorter than the recovery period, but it appears that the cycling was similar for each subject, just that more cycles between stages 3 and 5 were observed in the recovery sleep period than in the baseline sleep period:
B. Statistical analysis.
Our statistical analysis used Fisher’s two tailed t tests for related data sets. The Fisher t test with related data is commonly used when subjects are repeatedly compared under two “before and after” conditions, such as the baseline and post sleep deprivation recovery conditionsin the current study.
Using the t test for related data sets (scipy.stats.ttest_rel), the sleep stage onset latencies for time to reach a given sleep stage was highly significant, even with our sample size of just 4 pairs of sleep periods! The t statistic was 4.11, with a 2-tailed probability of just 0.0146 (p < 0.015).
Because of our small sample size, the data did not fare as well when looking at the sleep epoch counts for sleep stage frequencies. Using the t test for related data sets, the sleep stage epoch counts for baseline versus recovery phases demonstrated a t statistic of only 1.64, with a 2-tailed probability of 0.17, not significant beyond a 17 out of 100 probability level, or merely about 1 in 6 that the results were different by chance alone. This lack of statistical significance, despite bar charts showing apparent differences, is likely due to the use of only 4 paired comparisons in this very limited sized sample. Likewise, the statistics for EEG amplitudes showed no significant differences: t statistic 1.65, 2-tailed p value 0.24. It’s also possible that a larger data set would have shown more significance in the amplitudes between baseline and recovery EEG data.
The statistics for the data after normalization for the duration of the sleep period, on the other hand, showed the samples to be almost statistically identical once differences due to sleep duration were accounted for: a t statistic of -0.10, with probability 0.92, which implies that the samples, after normalization for sleep period duration, show essentially no differences at any probability level.
Finally, looking only at the durations of the EEG data periods between the baseline and recovery data, which reflects the total duration of the sleep period, we once more obtained, with the Fisher two-tailed t test for related data sets, a highly significant result of t = 6.265 and p = 0.0083, which is a significance level of p < 0.01 for the fact that in all cases, the recovery duration of sleep was longer than the subject's baseline duration of sleep. This is a very reasonable result: we all have noted that we sleep longer, if allowed to do so, after we’ve been sleep deprived.
C. Interpreting the findings
How did sleep deprivation recovery affect the frequency and number of different sleep stages? All sleep stages, from stage 2 and 3/4 non-REM sleep and including stage 5 REM sleep, increased in number and frequency in all subjects from baseline to recovery sleep periods. The
findings failed to reach the p < 0.05 level, however, since the sleep durations also varied greatly between subjects and only 4 subjects were tested, resulting in low power for this study.
How did sleep deprivation recovery affect the time to onset of various sleep stages? All stages were reached significantly (p < 0.015) faster in their onset in the the recovery versus the baseline sleep periods.
How did sleep deprivation recovery affect the amplitudes of typical sleep EEG bands, such as slow wave, spindle, and beta components? The differences between recovery and baseline amplitudes of EEG bands did not reach statistical significance. A possible trend toward higher EEG amplitudes of some EEG frequency bands would require more subjects and a higher study statistical power to determine.
Do different subjects differ in their sleep stage profiles? From qualitative examination of our subjects, yes. A possible future direction here would be to determine sleep stage characteristics, such as the graphical slope of progress during sleep from stage 2 to 5, which might allow a “fingerprinting” of individual sleep profiles for a given subject. Time did not allowus to do this.
How much of the sleep stage change between baseline and recovery periods can be explained by the total duration of the sleep periods? Most or all of differences between baseline and recovery sleep frequencies are explained by the recovery sleep periods being longer then the baseline ones. However, the significant differences in sleep stage onset times would not be so explained. 4. A problem with the data set
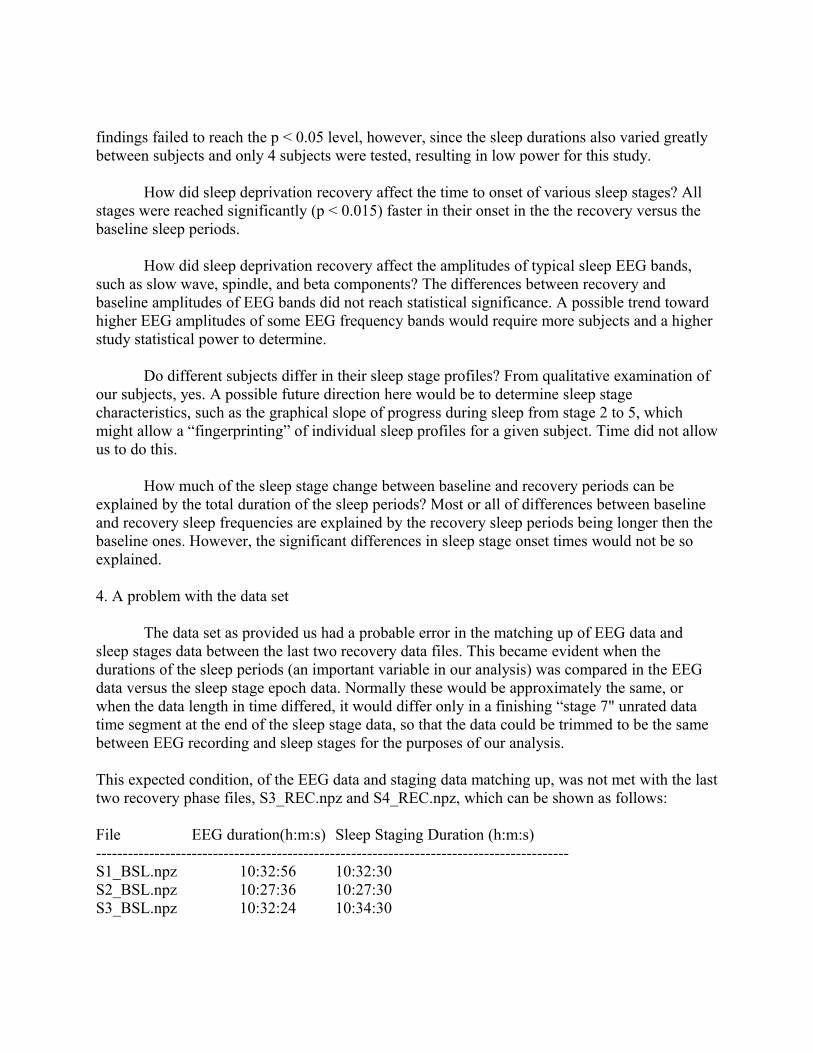
The data set as provided us had a probable error in the matching up of EEG data and sleep stages data between the last two recovery data files. This became evident when the durations of the sleep periods (an important variable in our analysis) was compared in the EEG data versus the sleep stage epoch data. Normally these would be approximately the same, or when the data length in time differed, it would differ only in a finishing “stage 7" unrated data time segment at the end of the sleep stage data, so that the data could be trimmed to be the same between EEG recording and sleep stages for the purposes of our analysis.
This expected condition, of the EEG data and staging data matching up, was not met with the lasttwo recovery phase files, S3_REC.npz and S4_REC.npz, which can be shown as follows:
File EEG duration(h:m:s) Sleep Staging Duration (h:m:s)----------------------------------------------------------------------------------------- S1_BSL.npz 10:32:56 10:32:30S2_BSL.npz 10:27:36 10:27:30S3_BSL.npz 10:32:24 10:34:30

S4_BSL.npz 10:34:20 10:31:30
S1_REC.npz 17:21:56 17:21:30S2_REC.npz 18:27:36 18:27:30S3_REC.npz 14:04:00 18:29:30S4_REC.npz 18:29:08 14:17:30It was noted that the last 10 minutes of the S4_REC.npz staging data was the “unrated” stage 7 value, so that the trimmed S4_REC.npz stage data corresponded well with the S3_REC.npz data,but did not correspond well with the S4_REC.npz file’s EEG data. This was solved by swapping the S3_REC and S4_REC EEG data, while leaving the sleep stage data unswapped:
S3_REC.npz 18:29:08 18:29:30S4_REC.npz 14:04:00 14:17:30
In addition, though less supported by a big gap in data recording duration, examination of the raw EEG and staging data and comparing baseline data (files S3_BSL.npz and S4_BSL.npz) for subjects 3 and 4 suggested that those two files were also switched:
We took care, by using the means of all subjects when possible in our analysis, to preventthis swap or swaps (taken or not) from affecting our analysis. Because our EEG amplitude data was taken as a mean of all 4 EEG data files, the glitch, corrected or not, should not affect our conclusions. The glitch would have affected our conclusions had we derived our own sleep stage data from the EEG data and compared it to the provided staging data, but we decided to avoid this potential source of error.

Part 5. A python programming trick: Avoiding python out-of-memory errors with manual garbage collection.
The EEG data set was almost 2 gigabytes in size. Unfortunately for creating a single python pandas DataFrame, neither the 32-bit nor the 64-bit Windows Python 2.7 versions seem to support single DataFrames over about 1.7 gigabytes in size. Therefore, when handling the EEG data, the EEG data files were loaded one per DataFrame.
Python tends to do automatic garbage collection, but after several such large data sets are repeatedly loaded for analysis, Python 2.7 on a Windows system tended to abort with memory errors. We found we could avoid such memory errors completely by loading each file in a function call which began also restored memory used in loading a large data file via a call to the “gc.collect()” python function. Because all processing of the EEG data is done within the function's local scope, with no reference to that memory returned by the function (we used deepcopy() when needed to prevent any reference to the larger data arrays from returning from the function), the memory allocated to the EEG data file we read goes ”out of scope” and is unneeded by the program. Then, that memory can be collected (we can de-reference it within the function by assigning the variable name to None, if desired) and immediately then re-used for thenext big data block the next time the function is called. No more python program aborts from memory errors! See below:
def load_eeg(filename, dirname=CDIR): """ load_eeg takes the file name and reads in the data. Returns: an array containing floating point EEG microvolt value data, the sampling rate for the data in Hz (samples per second), and an array of integers representing the stages felt to describe sequentioal 30 second epochs of the EEG data. """ gc.collect() data = np.load(dirname + filename) return data['DATA'], data['srate'], data['stages']
def pull_stage(filename): """ just get stage data from the big data file """ dat = load_eeg(filename) stage_data = deepcopy(dat[2]) dat = None # de-reference the big data array gc.collect() # recycle the big data array’s memory return stage_data

Our programming trick allowed us to run our data analysis as a single session, rather thanhaving to restart the python session repeatedly during analysis.
6. Follow-up analysis
Confining our conclusions to statistically significant ones for our 4-subject, two-trials-per-subject data set, we can conclude that sleep deprivation results in more rapid onset of sleep stages and a longer total duration of sleep. What of our individual sleep stage frequency count and EEG frequency band data amplitudes? These did not reach statistical significance, but further study, with more subjects, might provide power for further conclusions.
We identified a likely mismatch between EEG data and the sleep stage data between subjects 3 and 4. Once this consideration was addressed by reference to the original data, further analysis, including creating an automated sleep staging protocol for EEG data, could further proceed without doubts regarding proper organization of the data provided.