Six Months Later: Measuring Success AFTER Your … · Six Months Later: Measuring Success AFTER...
27
Six Months Later: Measuring Success AFTER Your Lean/Six Sigma Work Flow Redesign to Achieve Further Gains Allen A. Wozniak, Sr. Senior Laboratory Solutions Consultant © Sysmex America, Inc. All rights reserved. Not to be copied or distributed without expressed, written consent of Sysmex America, Inc.
Transcript of Six Months Later: Measuring Success AFTER Your … · Six Months Later: Measuring Success AFTER...

Six Months Later: Measuring Success
AFTER Your Lean/Six Sigma Work Flow
Redesign to Achieve Further Gains
Allen A. Wozniak, Sr.
Senior Laboratory Solutions Consultant
© Sysmex America, Inc. All rights reserved.
Not to be copied or distributed without expressed, written consent of Sysmex America, Inc.
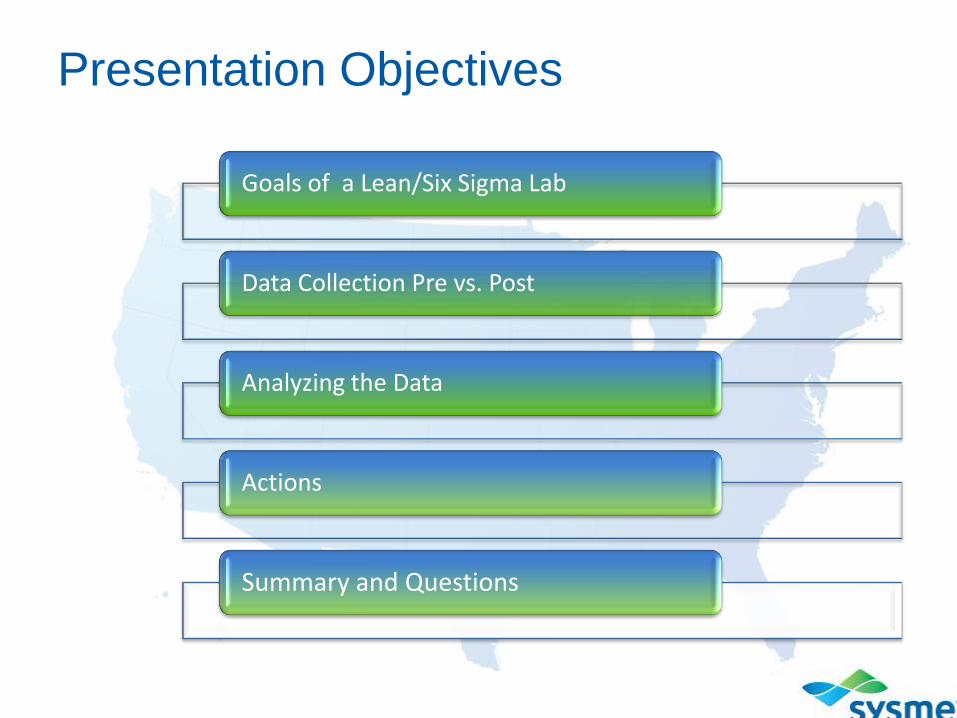
Goals of a Lean/Six Sigma Lab
Data Collection Pre vs. Post
Analyzing the Data
Actions
Summary and Questions
Presentation Objectives

LEAN in the Lab Operation Model
• Goals
– Meet or exceed customer demands of quality
test results by the most efficient, cost
effective means possible
• i.e. the elimination of waste, standardized work,
zero defects, on-piece flow
– Reduce human effort and interaction
– Utilize less inventory
– Take less time to produce test results
– Use less space

LEAN in the Lab Operation Model (continued)
• Basic Principles of a Lean Laboratory:
– All specimens analyzed as STAT – no waiting time
– Inventory of supplies kept to minimum - near zero
– Scheduling – to meet service level demands vs.
coverage
– Reduce or eliminate batch testing to flow testing (cut
batch sizes)
– Balance of testing to distribute over time and
instruments
– Decrease process times

Pre vs. Post Data

Basic Data Points
• Testing Volumes – Changes vs. Status Quo
• Annual billed volume
• Total testing cycles
• Volumes by day of the week
• Peak day volumes by hour of the day
• Staffing – Specific for Production of Billed Test
• Capture by hour of the day
• Include weekend staffing
• Minimum required staff vs. staffed positions
• Turn Around Times
• Goals
• STAT
• Routine

Analyze the Data
• Testing Volumes
• Did the claims meet the stated goals?
• Changes in test mix
• Billed vs. non-billed activity
• Is an increase in non-billed testing activity good?
• Has there been a change in patient acuity?

Analyze the Data
• Staffing vs. Productivity
• Did the claims meet the stated goals?
• Map staffing vs. testing volumes by hour
• Has the gap been closed for staffed vs. required positions?
• Management vs. Staff vs. Manufacturer
• Was the goal attainable?
• Staffing mix
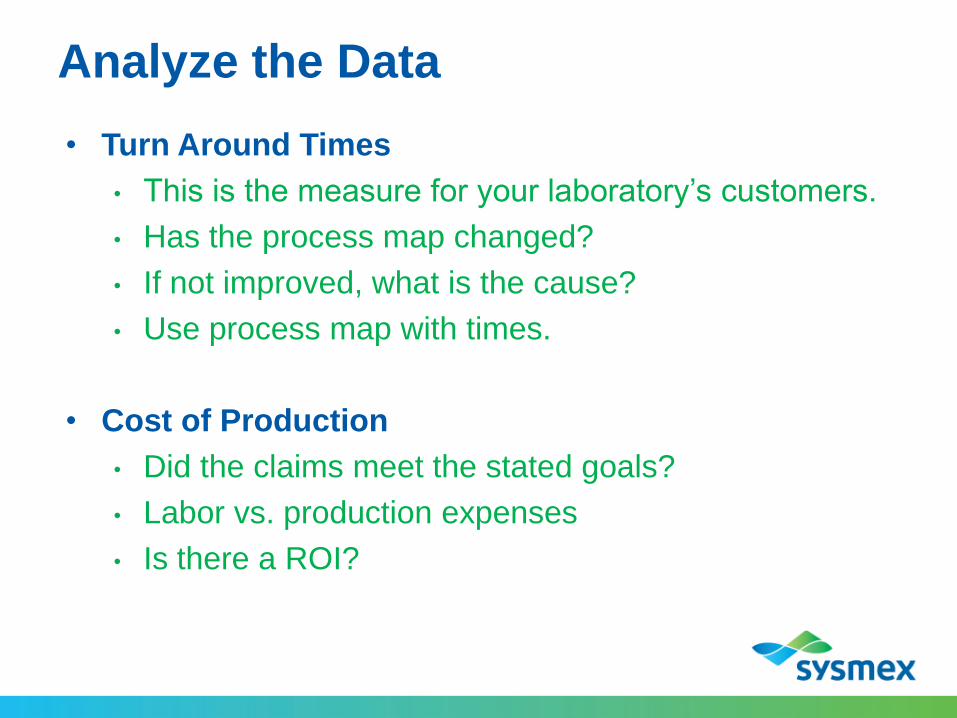
Analyze the Data
• Turn Around Times
• This is the measure for your laboratory’s customers.
• Has the process map changed?
• If not improved, what is the cause?
• Use process map with times.
• Cost of Production
• Did the claims meet the stated goals?
• Labor vs. production expenses
• Is there a ROI?

Reactions to Data: Ask “Why?” 5 Times
• Testing Volumes
• Expected changes – no action necessary for now
• Changes in test mix and billed vs. non-billed activity
• Did this decrease productivity?
• Did this increase TAT?
• Staffing vs. Productivity
• Expected changes – no action necessary for now
• Management vs. staff?
• Manufacturer training vs. end user success
• Manufacturer help

• Turn Around Times
• Meeting or exceeding require no changes for now
• If increased, use process map with times.
• Is labor being used effectively?
• Cost of Production
• Meeting or exceeding require no changes for now.
• Production costs should be proportional to billed
volumes:
• Lower cost is good; higher than expected needs evaluation
• Higher labor costs need to be assessed
– Staff management
– Process Management
– More hands on time required? Why?
Reactions to Data: Ask “Why?” 5 Times

Successful Reassessment - Hospital
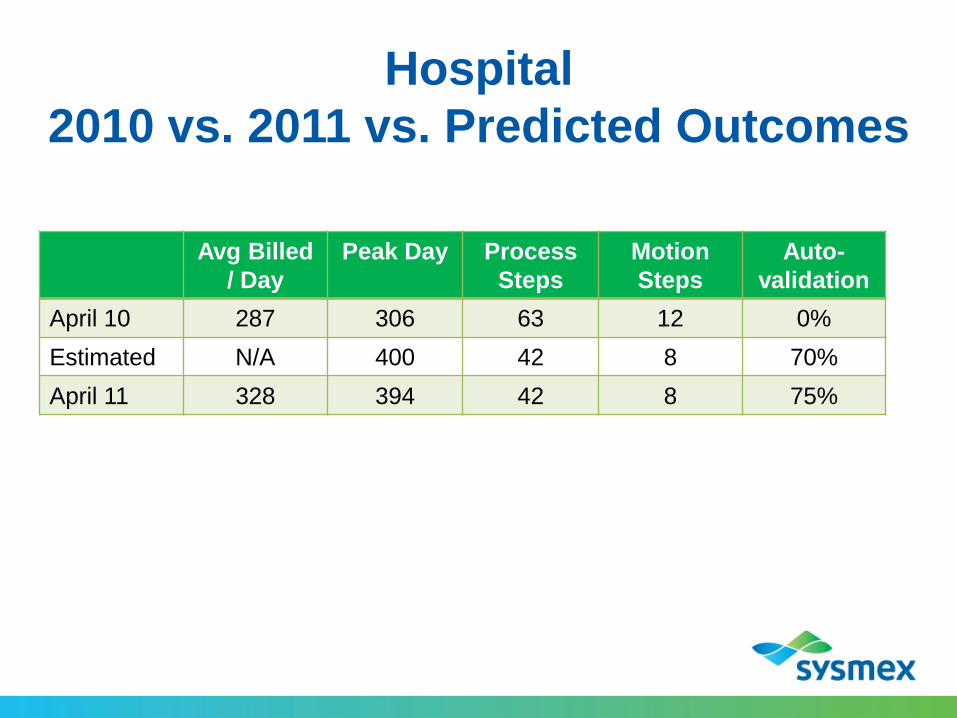
Hospital
2010 vs. 2011 vs. Predicted Outcomes
Avg Billed
/ Day
Peak Day Process
Steps
Motion
Steps
Auto-
validation
April 10 287 306 63 12 0%
Estimated N/A 400 42 8 70%
April 11 328 394 42 8 75%

Hospital
2010 vs. 2011 vs. Predicted Outcomes
Routine
(min)
STAT
(min)
Slide
Review
Rerun CBC FTE
April 10 50 60 40% 5.0% 6.6
Estimated 30 15 25% 3.5% 4.6
April 11 28 8 18% 3.0% 4.6

Health Network 2010 vs. 2011 vs. Predicted Outcomes

CBC Production 2009 Pre vs. 2011 Post Data Lab #1 M-F Ave Billed/Day Slide Review % Review % Rerun FTE % STAT
Pre 8-01-2009 843 362 43% 5% 9.0 N/A
Post 8-09-10 882 332 38% 17% 9.9 60-65%
Post 08-02-11 775 219 28% 7.6% 6.5 27.8
Proposed FTE 6.5
Lab #2 M-F Ave Billed/Day Slide Review % Review % Rerun FTE % STAT
Pre 8-01-2009 472 189 40% 5% 4.0 N/A
Post 8-09-10 414 68 16% 19% 3.7 25%
Post 08-02-11 261 55 21% 6% 3.5 40%
Proposed FTE 3.0
Lab #3 M-F Ave Billed/Day Slide Review % Review % Rerun FTE % STAT
Pre 8-01-2009 240 84 35% 5% 5.0 N/A
Post 8-09-10 219 66 30% 26% 3.0 25%
Post 08-02-11 242 32 13% 3% 3.0 41%
Proposed FTE 3.5
Lab #4 M-F Ave Billed/Day Slide Review % Review % Rerun FTE % STAT
Pre 8-01-2009 155 78 50% 10% 3.5 N/A
Post 8-09-10 136 40 29% 13% 2.1 25%
Post 08-02-11 144 32 22% 6% 2.1 38%
Proposed FTE 3.5

CBC Production TAT: 2010 Pre vs. 2011 Post Data Lab#1 TAT GOAL (min) % Achieved 60-65% STAT
ED 30 95%
STAT 45 100%
Routine 120 100%
Peds In by 5AM out by 8AM 100%
NIC In by 6AM out by 9AM 100%
Lab#2 TAT GOAL (min) % Achieved 25% STAT
ED 30 95%
STAT 30 100%
Routine 120 >95%
Lab#3 TAT GOAL (min) % Achieved 25% STAT
ED 30 95%
STAT 45 95%
Routine 120 ~100%
Lab#4 TAT GOAL (min) % Achieved 25% STAT
STAT 30 100% (20-30 min)
Routine 120 100%
Meeting Goals

Reassessment of Lab
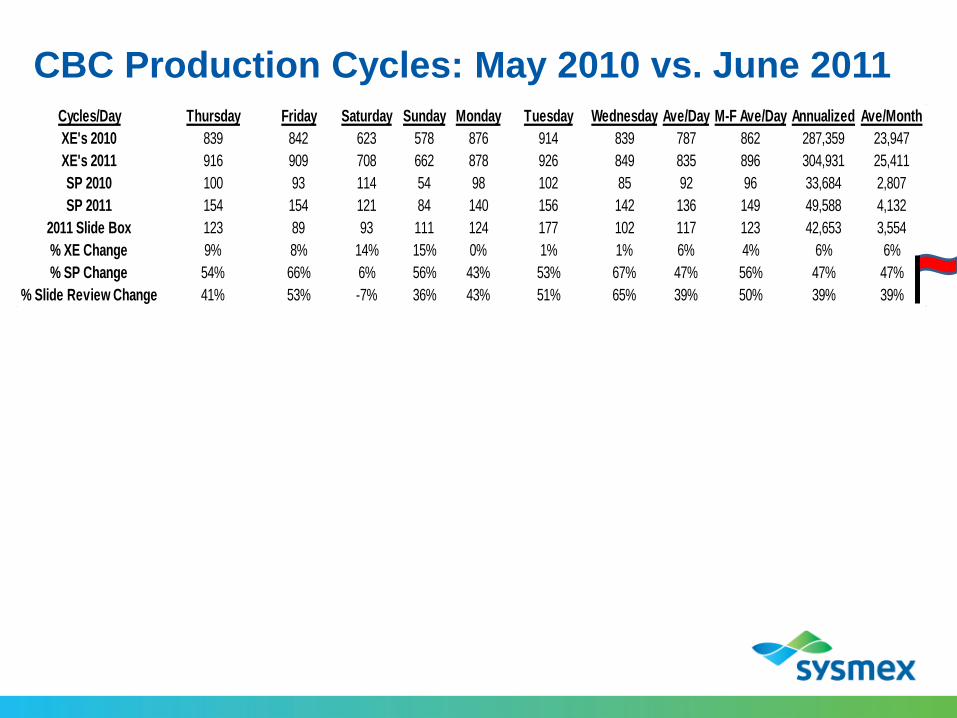
CBC Production Cycles: May 2010 vs. June 2011
Cycles/Day Thursday Friday Saturday Sunday Monday Tuesday Wednesday Ave/Day M-F Ave/Day Annualized Ave/Month
XE's 2010 839 842 623 578 876 914 839 787 862 287,359 23,947
XE's 2011 916 909 708 662 878 926 849 835 896 304,931 25,411
SP 2010 100 93 114 54 98 102 85 92 96 33,684 2,807
SP 2011 154 154 121 84 140 156 142 136 149 49,588 4,132
2011 Slide Box 123 89 93 111 124 177 102 117 123 42,653 3,554
% XE Change 9% 8% 14% 15% 0% 1% 1% 6% 4% 6% 6%
% SP Change 54% 66% 6% 56% 43% 53% 67% 47% 56% 47% 47%
% Slide Review Change 41% 53% -7% 36% 43% 51% 65% 39% 50% 39% 39%

CBC Production: Cycles vs. Staffing

Operating Parameters: 5/10/2010 vs. 6/8/2011 Monday Wednesday
Category 5/10/2010 6/8/2011 % Change from 2010
Total Cycles 876 849 NA
QC 20 18 -8%
Background 6 6 0%
Rerun 63 47 -24%
Patients 787 771 1%
<2 Years Age 12 11 -6%
Sampler 760 727 -2%
Manual 116 91 -20%
STAT 218 229 7%
Positive 315 342 11%
Negative 519 467 -8%
Analysis Error 16 10 -36%
No Patient ID 135 101 -24%
Positive (Diff) 19 17 -9%
Positive (Morph) 71 72 4%
Positive (Count) 72 71 1%
Positive (Diff+Count) 9 7 -21%
Positive (Diff+Morph) 22 21 -3%
Positive (Diff+Morph+Count) 48 49 4%
Positive (Morph+Count) 74 75 3%
CBC 28 37 35%
CBC+DIFF 329 273 -15%
CBC+DIFF+NRBC 36 28 -21%
CBC+DIFF+NRBC+RET 69 104 54%
CBC+DIFF+RET 12 10 -15%
CBC+NRBC 371 360 -1%
CBC+RET 2 3 53%
USER SELECT 3 3 2%
CBC+DIFF+NRBC No ID 21 2 -90%
CBC+DIFF+NRBC+RET No ID 68 66 -1%
StaffIng M-F 7.1 6.5 -7%
Staffing Sat & Sun 4.0 5.0 28%
Total FTE 8.7 8.5 -0.3%
Productivity 111 119 9.2%
STAT TAT 13 12 -6%
Routine TAT 29 28 -1%

Current - CBC TAT: Pre vs. Post
TAT STAT (Min) Routine (Min) % Change
Routine
Goal ≤30 ≤45
Jan-10 21 43 51%
May-10 13 29 55%
Jun-11 13 28 3%

Operating Parameters: May 2010 vs. June 2011
Performance Measure Change improvement?
Reruns ↓ 24% Yes
Manual Aspirations ↓ 16% Yes
Positives ↑ 11% Yes
Negatives ↓ 8% Yes
Positives (Diff Morph) ↑ 5.7% Yes
Positive Count ↑ 11% Yes
“No Patient ID” ↓ 24% Yes

Operating Parameters: May 2010 vs. June 2011
Performance Measure
Change
2010
2011
Staffing
FTE Total ↓ 0.3% 8.7 8.5
FTE: Mon – Fri 7.1 6.5
FTE: Sat & Sun 4.0 5.0
Total Productivity
CBC/FTE/Day ↑ 9.2% 111 119
Slide Review ↑ 131% 26 60
DM96 use (Day Shift) 50 60
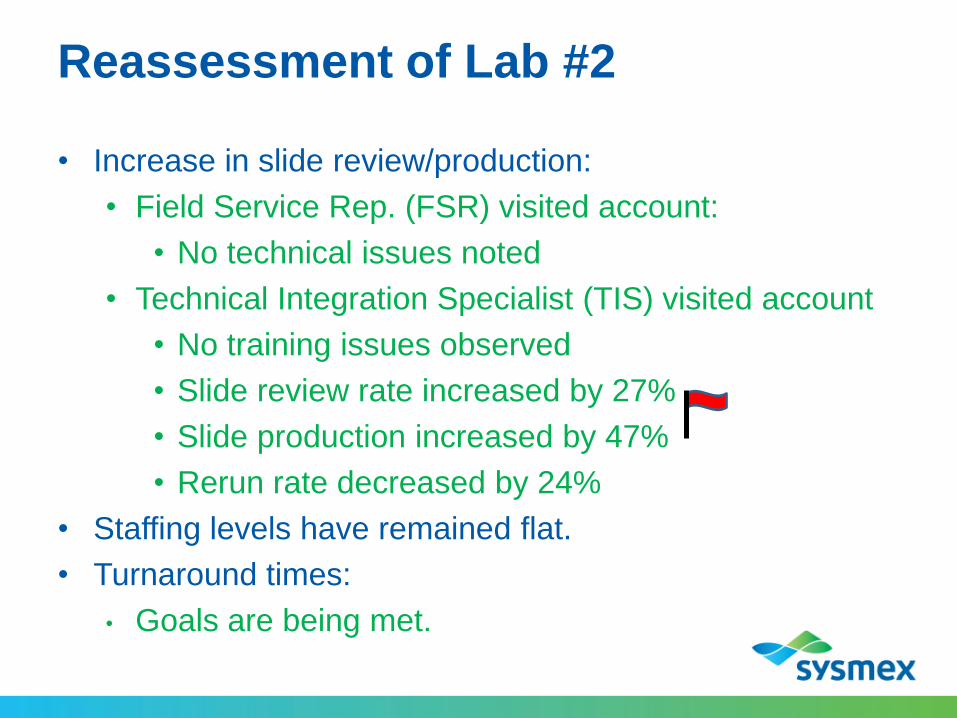
Reassessment of Lab #2
• Increase in slide review/production:
• Field Service Rep. (FSR) visited account:
• No technical issues noted
• Technical Integration Specialist (TIS) visited account
• No training issues observed
• Slide review rate increased by 27%
• Slide production increased by 47%
• Rerun rate decreased by 24%
• Staffing levels have remained flat.
• Turnaround times:
• Goals are being met.

Solutions for Reassessment of Lab #2
• Increase in slide review/production
• 100 samples through the system observed:
• Concerns were confirmed
• Supervisor made changes without TIS help.
• Staffing levels have remained Flat
• Laboratory union has agreed to changes in job
functions in new contract.
• 2.0 FTE less labor will be required for CBC production.
• Turn Around Times
• Goals are being met
• TAT improvement anticipated as less hands-on
required

Thank You.
Questions?