SIP 19: Ecological Infrastructure for Water Security · PDF fileSIP 19: Ecological...
100
SIP 19: Ecological Infrastructure for Water Security An overview of a proposed Strategic Integrated Project (SIP) aimed at improving South Africa's water resources and other environmental goods and services through the conservation, protection, restoration, rehabilitation andjor maintenance of key ecological infrastructure Minister's Approved Draft for Submission to the Presidential Infrastructure Coordinating Commission Revision 6.1, Friday 31 October 2014
Transcript of SIP 19: Ecological Infrastructure for Water Security · PDF fileSIP 19: Ecological...
SIP 19: Ecological Infrastructure for Water Security
An overview of a proposed Strategic Integrated Project (SIP) aimed at improving South Africa's water resources and other environmental goods and services through the conservation,
protection, restoration, rehabilitation andjor maintenance of key ecological infrastructure
Minister's Approved Draft for Submission to the Presidential Infrastructure Coordinating Commission
Revision 6.1, Friday 31 October 2014
SIP 19: Ecological Infrastructure for Water Security
October 31, 2014
Page 2 of 100
SIP19:EcologicalInfrastructurefor
WaterSecurity
An overview of a proposed Strategic Integrated Project (SIP) aimed at
improving South Africa’s water resources and other environmental goods and
services through the conservation, protection, restoration, rehabilitation
and/or maintenance of key ecological infrastructure
Minister’sApprovedDraft for Submission to thePresidential Infrastructure Coordinating
Commission
Revision6.1,Friday31October2014
TABLE OF CONTENTS
Table of Contents .................................................................................................................................... 2
Table of Figures ....................................................................................................................................... 5
Executive Summary ................................................................................................................................. 7
1. Background ................................................................................................................................... 10
2. Introduction .................................................................................................................................. 12
3. Ecological Infrastructure ............................................................................................................... 13
3.1 Ecosystem services ................................................................................................................ 13
3.2 Watershed services ............................................................................................................... 13
4. Problem Analysis ........................................................................................................................... 15
4.1 Water and water security ..................................................................................................... 15
4.1.1 Water quantity .............................................................................................................. 16
4.1.2 Surface water ................................................................................................................ 16
4.1.3 Groundwater ................................................................................................................. 17
4.1.4 Water resource quality ................................................................................................. 17
4.1.5 Shared water resources ................................................................................................ 18
4.1.6 Are we facing a water crisis? ......................................................................................... 18
4.2 The impact of climate change on South Africa’s water ........................................................ 19
4.2.1 Climate Trends and Scenarios for South Africa............................................................. 20
4.2.2 Implications for the Water Sector ................................................................................. 22
4.3 The destruction and/or degradation of ecological infrastructure ........................................ 24
4.3.1 Soil Erosion .................................................................................................................... 27

SIP 19: Ecological Infrastructure for Water Security
October 31, 2014
Page 3 of 100
4.3.2 Invasive Alien Plant Infestations ................................................................................... 30
4.3.3 Wetlands ....................................................................................................................... 30
5. Strategy Analysis ........................................................................................................................... 32
5.1 Natural Capital Versus Technological Investments ............................................................... 33
5.2 Case Study: New York City and the Catskills ......................................................................... 33
5.3 Investing in ecological infrastructure .................................................................................... 35
6. SIP 19 Goal .................................................................................................................................... 36
7. SIP 19 Purpose .............................................................................................................................. 36
7.1 SIP 19 and regulatory streamlining and intergovernmental coordination ........................... 38
8. SIP 19 and the requirements for strategic integrated projects .................................................... 39
9. SIP 19 Spatial Focus ....................................................................................................................... 41
9.1 South Africa’s “Water Factories” .......................................................................................... 41
9.2 The State of Ecological Infrastructure ................................................................................... 42
9.3 Degraded land and Alien Invasive Plants .............................................................................. 43
9.4 Key Quaternary Catchment Identification ............................................................................ 44
9.5 Poverty and Service Delivery ................................................................................................ 45
9.6 SIPs and especially SIP 18 ...................................................................................................... 46
9.7 The SIP 19 Spatial Priority Areas ........................................................................................... 47
10. Components .............................................................................................................................. 48
11. Status ........................................................................................................................................ 54
11.1 The Natural Resource Management (NRM) Programmes .................................................... 54
11.2 The National Freshwater Ecosystem Priority Areas (NFEPAs) .............................................. 56
11.3 Water security – The uMngeni ecological infrastructure partnership ................................. 57
11.4 Building climate change resilience in the greater uMngeni catchment ............................... 59
11.5 The Berg River Improvement Plan (BRIP), an inter-governmental relations partnership .... 60
11.6 National Protected Area Expansion Strategy for South Africa 2008 .................................... 64
12. Impact ....................................................................................................................................... 66
12.1 Job Creation .......................................................................................................................... 67
12.2 Addressing Spatial imbalances .............................................................................................. 71
12.3 Promoting rural development .............................................................................................. 71
12.3.1 Payments for catchment protection services (PCPS) .................................................... 71
12.4 Industrial development and localisation .............................................................................. 72
12.5 Economic performance of poorest provinces ....................................................................... 72
12.6 Greening economy ................................................................................................................ 72

SIP 19: Ecological Infrastructure for Water Security
October 31, 2014
Page 4 of 100
12.7 Regional integration .............................................................................................................. 74
13. Co-benefits ................................................................................................................................ 75
14. SIP 19 Inputs .............................................................................................................................. 76
14.1 Funding ................................................................................................................................. 76
14.1.1 Environmental Offsetting .............................................................................................. 76
14.2 Human Resources ................................................................................................................. 77
15. The Complementary Relationship between SIP 19 and Other SIPS, Especially SIP 18 ............. 77
16. Alignment with the National Development Plan (NDP 2030) ................................................... 81
17. SIP 19 Management and Implementation ................................................................................ 86
17.1 Overall SIP Governance Structures ....................................................................................... 86
17.1.1 The Presidential Infrastructure Coordinating Commission (PICC) Council ................... 86
17.1.2 The Presidential Infrastructure Coordinating Commission Management Committee
(PICC Manco) ................................................................................................................................. 86
17.1.3 The Presidential Infrastructure Coordinating Commission (PICC) Secretariat ............. 86
17.1.4 The Presidential Infrastructure Coordinating Commission Technical Task Team (PICC
TTT) 86
17.1.5 The Strategic Integrated Project (SIP) Inter Governmental Forum (IGF) ...................... 86
17.1.6 The Strategic Integrated Project (SIP) Coordinators ..................................................... 87
17.1.7 The Strategic Integrated Project (SIP) Steering Committee ......................................... 88
17.2 The SIP 19 Coordinator ......................................................................................................... 90
17.2.1 SIP 19 Coordination ....................................................................................................... 90
17.2.2 Monitoring and Reporting ............................................................................................ 92
17.2.3 Component Assistance and Support ............................................................................. 93
17.2.4 Information Sharing and Outreach ............................................................................... 93
17.2.5 Staffing .......................................................................................................................... 94
17.2.6 Budget ........................................................................................................................... 94
18. SIP 19 Implementation Plan ...................................................................................................... 94
19. SIP 19 Monitoring and Evaluation ............................................................................................. 95
19.1 Water quantity and quality indicators .................................................................................. 95
19.2 The River Health Programme (RHP) ...................................................................................... 96
19.2.1 River Health Indicators and Indices .............................................................................. 97
20. SIP 19 Challenges ...................................................................................................................... 99
20.1 Resistance to change ............................................................................................................ 99
20.2 Turf Battles and a “silo mentality” ...................................................................................... 100
SIP 19: Ecological Infrastructure for Water Security
October 31, 2014
Page 5 of 100
20.3 Competition for resources .................................................................................................. 100
20.4 Competition for profile ....................................................................................................... 100
20.5 Legislative constraints/restrictions ..................................................................................... 100
TABLE OF FIGURES
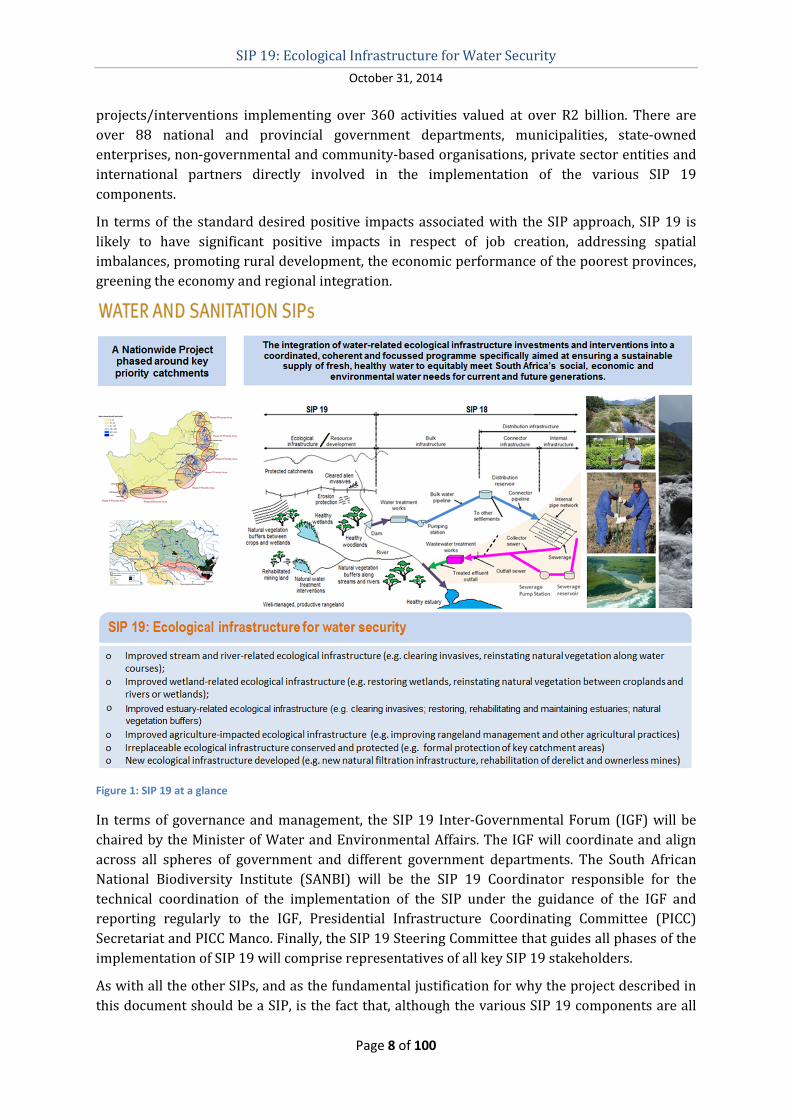
Figure 1: SIP 19 at a glance ..................................................................................................................... 8
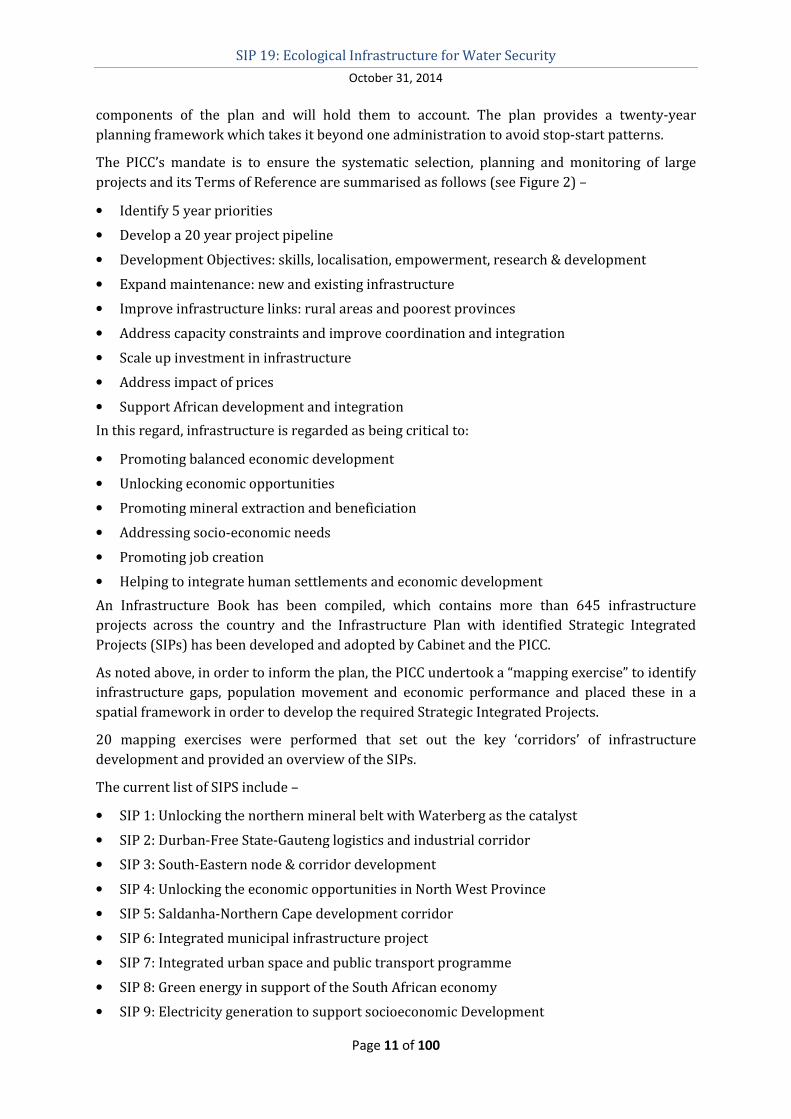
Figure 2: Summary of the Terms of Reference of the Presidential Infrastructure Coordinating
Commission (PICC) ................................................................................................................................ 10
Figure 3: LTAS aims to provide national and sub-national adaptation scenarios for South Africa under
future climates. At sub-national level the LTAS process covers the six hydrological zones in South
Africa developed for use by the National Water Adaptation Strategy process. .................................. 20
Figure 4: Recent rainfall modelling results should current levels of greenhouse gas emissions persist
.............................................................................................................................................................. 26
Figure 5: The SIP 19 Problem Tree - the problem cause and effect relationships that SIP 19 is
designed to address to some degree. ................................................................................................... 27
Figure 6: Simplified Problem Tree in respect of soil erosion ................................................................ 29
Figure 7: Excavation of terraces in Tanzania......................................................................................... 32
Figure 8: Beans being grown on Fanya juu terraces ............................................................................. 32
Figure 9: Graphical representation of the types of interventions falling under SIP 19 and their
possible positive impacts on ecosystem services and human well-being. ........................................... 37
Figure 10: South Africa's "Water Factories" - the strategic water source areas that comprise 8% of
our land area that provides over 50% of our surface water resources. ............................................... 41
Figure 11: The State of South Africa's rivers, wetlands and estuaries. ................................................. 42
Figure 12: Degraded land and priority catchments for invasive alien plant control interventions. ..... 43
Figure 13: Key quaternary catchments that could greatly benefit from ecological infrastructure
interventions. ........................................................................................................................................ 44
Figure 14: Correlation between Key SIP 19 Quaternary Catchments, poorly serviced areas and
poverty levels. ....................................................................................................................................... 45
Figure 15: Correlation between Key SIP 19 Quaternary Catchments and the other SIPs and SIP-
related activities. ................................................................................................................................... 46
Figure 16: Correlation between Key SIP 19 Quaternary Catchments and key SIP 18 components. .... 46
Figure 17: The SIP 19 Spatial Priority Areas .......................................................................................... 47
Figure 19: Investment in the Working for Water and sub-programmes since its inception in 1995. .. 54
Figure 20: Investments in the Working for Wetlands Programme since 2004. .................................... 55
Figure 21: Annual Investment in Integrated Veld and Forest Fire Management between 2007/08 and
2012/13 ................................................................................................................................................. 55
Figure 23: Map of Strategic Water Source Areas. These are the areas shaded in blue (i.e. with a mean
annual runoff of ≥ 135 mm/year), which contribute 50% of the region’s mean annual runoff and
occupy about 8% of the land area. .......................................................... Error! Bookmark not defined.
Figure 24: An overview of the envisaged interventions, resources and benefits associated with the
uMngeni ecological infrastructure partnership. ................................................................................... 58
SIP 19: Ecological Infrastructure for Water Security
October 31, 2014
Page 6 of 100
Figure 25: Map of the area that is the focus of the uMngeni ecological infrastructure partnership. .. 59
Figure 26: The Berg River catchment. ................................................................................................... 61
Figure 27: An overview of the envisaged management actions, tasks and benefits associated with the
Berg River Improvement Plan partnership (TWQR = Target Water Quality Range). ............................ 63
Figure 28: Alignment of new BRIP projects (green) and existing Departmental projects (blue) to Tasks
1 – 6. ...................................................................................................................................................... 64
Figure 29: A graphical representation of the focus of SIP 18 ............................................................... 78
Figure 30: Graphical representation of the relationship between SIP 19 and SIP 18........................... 80
Figure 31: Overall SIP Governance Structures ...................................................................................... 86
Figure 32: The River Health Programme (RHP) River Health Indices. ................................................... 96
Figure 33: The River Health iconography .............................................................................................. 97
Figure 34: River Health categories ........................................................................................................ 98
SIP 19: Ecological Infrastructure for Water Security
October 31, 2014
Page 7 of 100
EXECUTIVE SUMMARY
The Strategic Integrated Project known as SIP 19: Ecological Infrastructure for Water Security is
the proposed second water-related SIP and provides a framework for the integration of a
number of impactful water-related ecological infrastructure investments and interventions into
a coordinated, coherent and focussed project specifically aimed at improving South Africa’s
water resource quality and quantity. Thus, the purpose of SIP 19 is to make a significant
contribution to the overall goal of ensuring a sustainable supply of fresh, healthy water to
equitably meet South Africa’s social, economic and environmental water needs for current and
future generations through the integrated implementation of projects within identified priority
water catchments.
Although, the concept of ecological infrastructure is not very well known in traditional
infrastructure sectors, the essential life-supporting and life-enhancing ecosystem goods and
services that are generated by this infrastructure are universally experienced (e.g. nutrient
dispersal and cycling; seed dispersal; food (e.g. seafood, fresh-water fish and game); crops; wild
foods; spices; water; minerals; medicinal plants; pharmaceuticals; bio-chemicals; industrial
products; energy (hydropower, biomass fuels); carbon sequestration and climate regulation;
waste decomposition and detoxification; purification of water and air; crop pollination; pest and
disease control; cultural, intellectual and spiritual inspiration; recreational experiences
(including ecotourism) and scientific discovery).
Thus, as infrastructure is often broadly defined as the substructure or underlying foundation on
which the continuance or growth of a community or state depends, similarly, ecological
infrastructure is the networks of natural lands, working landscapes and other open spaces that
are the substructure or underlying foundation on which the continuance or growth of
ecosystem goods and services depends.
As a water-poor country where water is an acknowledged challenge in respect to the country’s
growth and development, in line with the National Water Resource Strategy, SIP 19
compliments SIP 18 in addressing this challenge. As illustrated in Figure 1, SIP 19’s “upstream”
interventions add value, utility and cost-effective benefits to water quantity and quality in
general, and to SIP 18 in particular.
As with the majority of other SIPs, SIP 19’s geographical focussing into priority areas is based on
a detailed mapping exercise that considered water-related threats and vulnerability, levels of
service delivery and poverty and potential alignment with other SIPs. This exercise resulted in
the following SIP 19 priority areas being identified: (I) Quaternary catchment/s associated with
the Orange-Vaal-Thukela and/or uMngeni-Mooi-Thukela Strategic Water Source Areas; (II)
Olifants-Doring-Berg and/or Berg-Breede; (III) Langeberg-Gouritz and/or Gouritz and/or
Kromme-Gouritz and/or Gamtoos-Gouritz and/or Tsitsikamma; (IV) Vaal-Thukela-Phongola
and/or Inkomati-Phongola-Usutu and/or Crocodile-Olifants; and (V) Quaternary catchment/s
associated with the remaining Strategic Water Source Areas including: Letaba-Olifants and/or
Luvubu-Mutale and/or Mfolozi-Phongola and/or Zululand Coast and/or Great Kei-Great Fish
and/or Mzimvubu-Orange and/or Pondoland Coast.
As summarised in Table 1, SIP 19 components comprise well defined ecological infrastructure
interventions that are broadly grouped into specific intervention focus areas or categories. The
current components of SIP 19 comprise over 140 short-, medium- and long-term
SIP 19: Ecological Infrastructure for Water Security
October 31, 2014
Page 8 of 100
projects/interventions implementing over 360 activities valued at over R2 billion. There are
over 88 national and provincial government departments, municipalities, state-owned
enterprises, non-governmental and community-based organisations, private sector entities and
international partners directly involved in the implementation of the various SIP 19
components.
In terms of the standard desired positive impacts associated with the SIP approach, SIP 19 is
likely to have significant positive impacts in respect of job creation, addressing spatial
imbalances, promoting rural development, the economic performance of the poorest provinces,
greening the economy and regional integration.
Figure 1: SIP 19 at a glance
In terms of governance and management, the SIP 19 Inter-Governmental Forum (IGF) will be
chaired by the Minister of Water and Environmental Affairs. The IGF will coordinate and align
across all spheres of government and different government departments. The South African
National Biodiversity Institute (SANBI) will be the SIP 19 Coordinator responsible for the
technical coordination of the implementation of the SIP under the guidance of the IGF and
reporting regularly to the IGF, Presidential Infrastructure Coordinating Committee (PICC)
Secretariat and PICC Manco. Finally, the SIP 19 Steering Committee that guides all phases of the
implementation of SIP 19 will comprise representatives of all key SIP 19 stakeholders.
As with all the other SIPs, and as the fundamental justification for why the project described in
this document should be a SIP, is the fact that, although the various SIP 19 components are all

SIP 19: Ecological Infrastructure for Water Security
October 31, 2014
Page 9 of 100
going projects at various stages of development and implementation, their positive impacts can
be substantially increased, fast-tracked, replicated, duplicated and generally made more
immediately impactful through efficient and effective integration. This integration includes the
key general SIP focus of governance integration (e.g. aligned, coordinated, coherent and
consistent authorisation processes) as well as the integration of traditional sector-based
initiatives (e.g. land management, conservation, human settlements, rural development, town
planning, eco-tourism, agriculture, water, mining, etc.).
Table 1: Summary of SIP 19 Components/Projects per Priority Area
SIP 19 Intervention SIP 19 Priority Area
Total I II III IV V
A. Improved stream and river-related ecological infrastructure – 26 29 28 17 42 142
A.1 Clearing invasive alien plant infestations, especially in mountain catchments and riparian areas
20 25 23 13 32 113
A.2 The reinstatement, restoration, rehabilitation and/or maintenance of buffers of natural vegetation along streams and rivers
6 4 5 4 10 29
B. Improved wetland-related ecological infrastructure – 13 9 8 11 18 59
B.1 The restoration, rehabilitation and/or maintenance of wetlands 6 5 5 7 8 31
B.2 The reinstatement, restoration, rehabilitation and/or maintenance of buffers of natural vegetation between agricultural crops and rivers or wetlands
7 4 3 4 10 28
C. Improved estuary-related ecological infrastructure – 6 0 0 0 3 9
C.1 Clearing invasive alien plant infestations 2 0 0 0 1 3
C.2 The restoration, rehabilitation and/or maintenance of estuaries 2 0 0 0 1 3
C.3 The reinstatement, restoration, rehabilitation, establishment and/or maintenance of buffers of natural vegetation along estuaries
2 0 0 0 1 3
D. Improved agriculture-impacted ecological infrastructure – 14 6 5 6 11 42
D.1 The improvement in rangeland management practices (e.g. grazing regime and improved fire management)
8 3 3 3 6 23
D.2 The improvement of agricultural practices (e.g. improved tillage, contour ploughing, organic agriculture, etc.)
6 3 2 3 5 19
E. The conservation and protection of irreplaceable ecological infrastructure –
26 12 9 12 19 78
E.1 The formal protection of key catchment areas as part of the expansion of South Africa’s conservation estate
10 4 3 5 6 28
E.2 The reinstatement, restoration, rehabilitation and/or maintenance of grass- and wood-lands, especially in upper-catchment areas
8 4 2 4 10 28
E.3 Clearing invasive alien plant infestations in protected catchment areas 8 4 4 3 3 22
F. The reinstatement and/or development of new ecological infrastructure –
2 2 0 3 3 10
F.1 The establishment of natural filtration infrastructure, i.e. built wetlands, to purify various small sources of polluted inflows into streams and rivers (e.g. acid mine drainage (AMD) from old mining works, livestock farms, waste dumps, etc.)
2 2 0 2 2 8
F.2 The rehabilitation of land affected by derelict and ownerless mines 0 0 0 1 1 2
G. Ecological infrastructure for water security research and development
6 4 1 3 6 20
Totals 93 62 51 52 102 360

SIP 19: Ecological Infrastructure for Water Security
October 31, 2014
Page 10 of 100
1. BACKGROUND
Government has adopted an Infrastructure Plan that is intended to transform the economic
landscape of South Africa, create a significant numbers of new jobs, strengthen the delivery of
basic services to the people of South Africa and support the integration of African economies.
To this end, Cabinet established a body to integrate and coordinate the long term infrastructure
build, namely the Presidential Infrastructure Coordinating Commission (PICC), along with its
various supporting management structures.
The PICC assessed South Africa’s infrastructure gaps through a spatial mapping exercise which
analysed future population growth, projected economic growth and areas of the country which
are not served with water, electricity, roads, sanitation and communication. Based on this work,
a number of Strategic Integrated Projects (SIPs) were developed and approved to support
economic development and address service delivery in the poorest provinces.
Each SIP comprises of a large number of specific infrastructure components and programmes.
In formulating the National Infrastructure Plan, the New Growth Path (NGP) was taken as a
starting point. In this regard, although the NGP sets a goal of 5 million new jobs by 2020, it also
identifies structural problems in the economy
that need to be overcome and also points to
opportunities in specific sectors and markets (the
so-called “jobs drivers”).
Significantly, infrastructure is identified in the
NGP as the 1st jobs driver by laying the basis for
higher growth, inclusivity and job creation.
However, it was also recognised that the pace of
infrastructure development and spending on
infrastructure was projected to fall from 9,1% of
GDP in 2012 to 8,1% in 2013.
With this, there was also the recognition that
there were various infrastructure development
blockages including weak implementation
capacity in parts of the state (with unspent
monies) and poor project development planning.
The fact that projects are not always strategic,
integrated or aligned with national priorities was
also acknowledged as was poor coordination that
slowed projects and limited their impact.
In response, the PICC is supposed to address
these challenges through coordination,
integration and accelerated implementation. A
single common Infrastructure Plan was
developed that is being monitored and centrally
driven. The PICC has identified who is
responsible for implementing the various
Figure 2: Summary of the Terms of Reference of the
Presidential Infrastructure Coordinating Commission
(PICC)
SIP 19: Ecological Infrastructure for Water Security
October 31, 2014
Page 11 of 100
components of the plan and will hold them to account. The plan provides a twenty-year
planning framework which takes it beyond one administration to avoid stop-start patterns.
The PICC’s mandate is to ensure the systematic selection, planning and monitoring of large
projects and its Terms of Reference are summarised as follows (see Figure 2) –
• Identify 5 year priorities
• Develop a 20 year project pipeline
• Development Objectives: skills, localisation, empowerment, research & development
• Expand maintenance: new and existing infrastructure
• Improve infrastructure links: rural areas and poorest provinces
• Address capacity constraints and improve coordination and integration
• Scale up investment in infrastructure
• Address impact of prices
• Support African development and integration
In this regard, infrastructure is regarded as being critical to:
• Promoting balanced economic development
• Unlocking economic opportunities
• Promoting mineral extraction and beneficiation
• Addressing socio-economic needs
• Promoting job creation
• Helping to integrate human settlements and economic development
An Infrastructure Book has been compiled, which contains more than 645 infrastructure
projects across the country and the Infrastructure Plan with identified Strategic Integrated
Projects (SIPs) has been developed and adopted by Cabinet and the PICC.
As noted above, in order to inform the plan, the PICC undertook a “mapping exercise” to identify
infrastructure gaps, population movement and economic performance and placed these in a
spatial framework in order to develop the required Strategic Integrated Projects.
20 mapping exercises were performed that set out the key ‘corridors’ of infrastructure
development and provided an overview of the SIPs.
The current list of SIPS include –
• SIP 1: Unlocking the northern mineral belt with Waterberg as the catalyst
• SIP 2: Durban-Free State-Gauteng logistics and industrial corridor
• SIP 3: South-Eastern node & corridor development
• SIP 4: Unlocking the economic opportunities in North West Province
• SIP 5: Saldanha-Northern Cape development corridor
• SIP 6: Integrated municipal infrastructure project
• SIP 7: Integrated urban space and public transport programme
• SIP 8: Green energy in support of the South African economy
• SIP 9: Electricity generation to support socioeconomic Development
SIP 19: Ecological Infrastructure for Water Security
October 31, 2014
Page 12 of 100
• SIP 10: Electricity transmission and distribution for all
• SIP 11: Agri-logistics and rural Infrastructure
• SIP 12: Revitalisation of public hospitals and other health facilities
• SIP 13: National school build programme
• SIP 14: Higher education infrastructure
• SIP 15: Expanding access to communication Technology
• SIP 16: SKA & Meerkat
• SIP 17: Regional integration for African cooperation and development
• SIP 18: Water and sanitation infrastructure
2. INTRODUCTION
Sip 19, the Ecological Infrastructure for Water Security SIP, is a proposed Strategic Integrated
Project aimed at improving South Africa’s water resources and other environmental goods and
services through the conservation, protection, restoration, rehabilitation and/or maintenance of
key ecological infrastructure.
Water is a critical strategic natural resource1. It is essential for growth and development, the
environment, as well as the health and well-being of the people of South Africa. Although this
principle is generally accepted, it is not always well understood or appreciated. Despite the fact
that South Africa is a naturally water stressed country, further challenged by the need to
support growth and development as well as potential climate change impacts, the resource is
not receiving the priority status and attention it deserves. This situation is reflected in the
manner by which this scarce resource is wasted (more than 37% water losses), polluted,
degraded, inadequately financed and inappropriately strategically positioned. Paradoxically
South Africa has a fairly well developed water management and infrastructure framework
which has resulted in a perceived sense of water security (particularly in urban and growth
areas), as well as a lack of appreciation and respect for a critical strategic resource.
South Africa is facing a number of water challenges and concerns, including security of supply,
environmental degradation and resource pollution. The sustainability of our fresh water
resources has reached a critical point and its associated management is now at a crossroads. It
is now of paramount importance that the status of South Africa’s water is elevated to the core of
the public agenda and that advanced management practices are applied and implemented to
address an increasingly complex business. It is also becoming increasingly recognised that
water crises are not only about water, but are interconnected with other social, political,
economic and environmental factors. More integrated and sophisticated approaches are
therefore required than simply concentrating on supply-side solutions, as has frequently been
the case historically in water sectors across the world.
1 This section is taken from the Executive Statement in the 2012 National Water Resource Strategy to ensure
full and unambiguous alignment between this strategy and SIP 19.
SIP 19: Ecological Infrastructure for Water Security
October 31, 2014
Page 13 of 100
3. ECOLOGICAL INFRASTRUCTURE
Infrastructure is often broadly defined as the substructure or underlying foundation on which
the continuance or growth of a community or state depends. Similarly, ecological infrastructure
is the networks of natural lands, working landscapes and other open spaces that are the
substructure or underlying foundation on which the continuance or growth of essential life-
supporting and life-enhancing ecosystem goods and services depends.
Ecological infrastructure refers to naturally functioning ecosystems that deliver valuable
services to people, such as fresh water, climate regulation, soil formation and disaster risk
reduction. It is the nature-based equivalent of built or hard infrastructure, and may be just as
important for providing services and underpinning socio-economic development. Ecological
infrastructure includes, for instance, healthy mountain catchments, rivers, wetlands, coastal
dunes, and nodes and corridors of natural habitat, which together form a network of
interconnected structural elements in the landscape.
3.1 Ecosystem services
Ecosystem services include:
• Supporting services like nutrient dispersal and cycling, seed dispersal and primary
production;
• Provisioning services like food (e.g. seafood, fresh-water fish and game), crops, wild foods,
spices, water, minerals (including diatomite), medicinal plants, pharmaceuticals, bio-
chemicals, industrial products, energy (hydropower, biomass fuels);
• Regulating services like carbon sequestration and climate regulation, waste decomposition
and detoxification, purification of water and air, crop pollination, pest and disease control;
and
• Cultural services like cultural, intellectual and spiritual inspiration, recreational
experiences (including ecotourism) and scientific discovery.
Globally, it is estimated that ecological infrastructure underpins the delivery of ecosystem
services worth between US$21-72 trillion a year as compared to the 2008 World Gross National
Income of US$58 trillion.
3.2 Watershed services
With respect to SIP 19, the focus is specifically on the ecological infrastructure that underpins
water-related ecosystem services commonly known as watershed services.
In essence, the sound ecological infrastructure that underpins healthy watersheds does much
the same work as a water treatment plant and other built water quality infrastructure, but
without the expensive equipment and associated operating costs and with added benefits like
protection of wildlife habitats and carbon sequestration.
Watershed-related ecological infrastructure can filter out water pollution, regulate stream
flows, recharge aquifers, and absorb flooding. These benefits are collectively known as
“watershed services,” and society can't do without them2.
2 See more at: http://www.watershedconnect.com/pages/primer#sthash.yRPHOWB7.dpuf
SIP 19: Ecological Infrastructure for Water Security
October 31, 2014
Page 14 of 100
Watershed services provided by, for example, mountain grasslands, fynbos, indigenous forest
and woodland ecological infrastructure, include –
• Water Quality: Intact natural vegetation such as healthy grasslands, fynbos, woodlands and
forests act as natural filters and can provide high water quality supplies that have low levels
of both nutrients and chemicals.
• Flow Regulation: Healthy natural vegetation cover helps regulate surface and groundwater
flow, providing a natural buffer to flooding and landslides often linked to heavily degraded
land.
• Water Supply: Healthy natural vegetation acts as a regulator of water during both dry and
wet seasons, leading to an increase in minimum flows during the dry seasons.
• Aquatic Productivity: The quality of fisheries is closely linked to the conditions of adjacent
upstream watersheds
Because these are effectively “free services”, we tend to take these benefits for granted. Indeed,
few, if any, water authorities or utilities list watersheds as assets anywhere on their books, and
landowners aren't rewarded for good management practices that result in downstream users
receiving clean, ample water.
Fortunately this is beginning to change. Leaders and communities around the world are moving
to recognise the ways in which we depend on natural systems and how we need to incorporate
those values into our economic decisions.
Watershed-related ecological infrastructure investments aimed at improving and/or
maintaining watershed services put this concept into action through interventions that have the
potential to produce a range of benefits, including:
• lengthening the lifespan of existing built infrastructure, thereby reducing or delaying the
need for additional built infrastructure – often with significant cost savings;
• buffering human settlements and built infrastructure against extreme events like floods and
drought, thus playing a crucial and cost effective role in disaster risk reduction;
• creating new employment opportunities for the maintenance and rehabilitation of
ecological infrastructure, which usually entails labour-intensive activities;
• supporting rural development by diversifying rural livelihood options, on one hand through
direct job creation (since key elements of ecological infrastructure are located in rural
areas), and on the other by strengthening economic sectors such as sustainable farming and
ecotourism; and
• providing opportunities for adapting to the negative impacts of climate change.
This approach is thus also a powerful tool for funding conservation and is often more cost-
effective than traditional large engineering solutions to water problems, and can provide new
revenue streams to rural and often poor communities in resource-rich areas around the world.
SIP 19: Ecological Infrastructure for Water Security
October 31, 2014
Page 15 of 100
4. PROBLEM ANALYSIS
4.1 Water and water security3
South Africa has low levels of rainfall relative to the world average with high variability as well
as high levels of evaporation due to the hot climate, and increasing challenges from water
pollution. All of these pose constraints on the amount and quality of water available for use.
Although the regulatory framework and the institutional arrangements have changed since the
advent of democracy, one aspect remains constant: water scarcity – whether quantitative,
qualitative or both – which originates as much from inefficient use and poor management as
from real physical limits. South Africa is the 30th driest country in the world and has less water
per person than countries widely considered to be much drier, such as Namibia and Botswana.
Water run-off is highly variable and unevenly spread in space and time. High variability of water
flow is the norm, and the base flow varies from very low to zero. At present, there is a well-
developed infrastructure, with more than 4 395 registered dams in South Africa, of which 2 528
are water supply related. However, in many parts of the country we have either reached or are
fast approaching the point at which all of our financially viable freshwater resources are fully
utilised.
Despite the good infrastructure, the occurrence of floods and droughts are part of the “normal”
water cycle and water restrictions and flood management are a critical part of the water
business. And despite the good infrastructure, the poor and marginalised experience water
scarcity most intensely, particularly in under-developed rural areas and areas such as the
former homelands.
In many parts of the country, we are fast approaching the point at which all of our easily
accessible freshwater resources are fully utilised. All South Africans must recognise this
situation so that necessary steps are taken to assess current and future demands for water. In
this regard it must be acknowledged that, although restoring and maintaining intact watersheds
may not solve all the water demand challenges it does make a significant contribution to
securing a sustainable supply of clean water. Watershed services can be seen as the upper end
of the water value chain that includes watersheds, storage schemes, distribution, purification,
reticulation and sanitation (treatment of return flows).
Although dealing with our current water predicament will not be an easy task, with the
necessary resolve to plan and implement the required interventions, a secure water future can
be achieved.
It is important to recognise, however, that there are very different experiences of water scarcity
for different groups in South Africa. In particular, water scarcity is experienced on a daily basis
by the rural poor, many of whom still do not have access to potable water supply, and who also
do not have access to reliable water supply for productive purposes. These communities are
also the most vulnerable to droughts and floods. When dealing with water scarcity, therefore,
the plight of those who experience water scarcity most intensely must take priority. It is also
these communities who are often directly reliant on ecological infrastructure for goods and
3 Based on, or extracted from the 2012 National Water Resource Strategy, Chapter 2, Section 2.3 – Facts about
South African Water.

SIP 19: Ecological Infrastructure for Water Security
October 31, 2014
Page 16 of 100
services, for example by drawing their drinking water directly from rivers, and tend to be most
immediately and severely affected when ecosystems become degraded.
The present water supply situation has created a false sense of water security within the
privileged sectors of South African society. Marginalised and poor communities have, on the
other hand, always experienced high levels of water insecurity.
It must be noted that, as at 2012, South Africa has had 16 consecutive years of above average
rainfall in the majority of summer rainfall areas and in these areas the last major drought was
more than two decades ago. This trend is unlikely to continue. Other areas such as the Western
Cape and parts of the Eastern Cape suffered from drought. The potential for drought in other
areas and the impacts of climate change place a particular imperative on the effective
management of water resources.
4.1.1 Water quantity
The South African water situation is characterised by highly variable rainfall, erratic runoff, high
levels of evaporation due to high temperatures and shallow dam basins as well as
sedimentation problems and large-scale inter-basin water transfers.
South Africa’s first National Water Resource Strategy (NWRS-1) in 2004 showed that the
majority of the water management areas (WMA) have water deficits (i.e. the water
requirements exceed availability with current infrastructure) despite significant transfers from
other catchments. Only a few selected WMAs such as parts of the Eastern Cape had surplus
water. There were, already, concerns that more WMAs would have fresh water deficits by the
year 2025.
There are a number of options for reconciling water requirements and availability, which are
dealt with in the technical strategies detailed in the 2012 National Water Resource Strategy
(NWRS-2), including improved water use efficiency, development of new infrastructure, re-use
and recycling, desalination, and the removal of water hungry alien invasive plants.
However, although the removal of alien invasive plants is an extremely important ecological
infrastructure intervention, it is only one of many such interventions that can have a positive
impact on both water quantity and quality. For example, recent studies and anecdotal evidence
have shown that desertification has significant negative impacts on utilizable water. For one it
increases high flows as a result of water not infiltrating the soil which leads to faster runoff and
increased flooding. This leads to reduced dry season flows which are critical for, especially,
rural communities. If streams dry up during the dry season alternative options for access to
water must be created which, more often than not, means additional infrastructure. It is
however not only dry season flows that are being negatively impacted upon but also existing
water storage infrastructure. The same studies have shown that the rates of sedimentation are
exponentially higher in degraded catchments than intact catchments.
4.1.2 Surface water
For the purpose of water planning, the Department of Water Affairs and Sanitation (DWAS)
plans with ‘available water’ and uses a 98% assurance of supply. This means that water can be
abstracted at the determined ‘yield’, 98 out of 100 years on average. There is about 10 000
million cubic metres per year available with this level of assurance. In most areas where there
are water deficits or where the system is considered ‘in balance’, the probability is that water
SIP 19: Ecological Infrastructure for Water Security
October 31, 2014
Page 17 of 100
shortages are experienced more than 2 out of 100 years. Water shortages have become part of
life in South Africa.
Approximately 25% of the mean annual runoff (MAR) of 49 000 million cubic meters per annum
needs to remain in the rivers and estuaries to support the ecological functioning of the
catchments, depending on the specific river systems. In many water management areas the
ecological portion of the Reserve is not yet fully implemented.
Most of the economically available yield from surface water resources over large parts of the
country has been fully developed and utilised. More than two thirds of the country’s MAR is
already stored in dams. Where additional water is still available, such as in the uThukela,
Mzimvubu and Pongola basins, it is located in relatively remote areas far from existing centres
of demand. Opportunities for economically viable new dams are few and far between, and the
costs of transfer of water per cubic metre to locations where water is needed are also rising
with longer distances.
Surface water from dams and direct abstraction from rivers, accounted for 9 500 million cubic
metres per annum, with a significant volume of the surface water yield (3 000 million cubic
metres per annum) moved via inter-basin transfers to areas in the country where requirements
exceed supply. An example is the Lesotho Highlands Water Scheme which supplies water to
Gauteng through transfers from Katse and Mohale Dams in Lesotho to the Vaal WMA.
Many dams and associated water resources infrastructure were built more than 40 years ago.
While the main structures may have an extremely long life, spillways, gates, pumps, pipelines
and canals and associated infrastructure, need regular maintenance and occasional major
rehabilitation to extend the lifespan of these assets for which funding is required.
There are also considerable backlogs in the rehabilitation of water infrastructure owned by the
municipalities.
4.1.3 Groundwater
Groundwater is a significant resource in many parts of the country although local yields are
usually quite low. The most recent estimate of sustainable potential yield of groundwater
resources at high assurance is 7 500 million cubic metres per annum, while current
groundwater use is estimated at around 2 000 million cubic metres per annum. Allowing for an
underestimation on groundwater use, potentially about 3 500 million cubic metres per annum
is available for further development. This resource is, however, sparsely distributed and often
not readily available at points of demand. This is exacerbated by the levels of knowledge and
information on the groundwater resource.
Some of the most favourable areas/aquifers regarding groundwater availability include: the
Dolomites of the West and Far West Rand; Table Mountain Group Aquifers of the Western and
Eastern Cape; Coastal sand aquifers in the Western and Eastern Cape, and northern KwaZulu-
Natal. Other high yielding aquifers include basement granites in the Polokwane-Dendron-
Coetzerdam area, alluvial deposits along sections of major rivers such as the Limpopo, and parts
of the Karoo Sequence associated with dolerite dykes and ring structures.
4.1.4 Water resource quality
There are significant water quality challenges in South Africa. The main contributors to water
quality problems are mining (acidity and increased metals content); urban development
SIP 19: Ecological Infrastructure for Water Security
October 31, 2014
Page 18 of 100
(salinity, nutrients, microbiological); industries (chemicals, toxins); and agriculture (sediment,
nutrients, agro-chemicals, salinity through irrigation return flows). Rural communities in parts
of the country that are dependent on ground water are negatively affected because of the
natural mineral content exceeding recommended levels. Untreated or poorly treated waste
water is severely affecting the quality of water in many areas.
Water resource quality and water quantity issues and solutions are interrelated and need to be
addressed in an integrated manner. Although it is technically possible to treat water of poor
quality to a potable standard, this can be very costly and usually results in concentration of
hazardous waste requiring containment. Water of bad quality also impacts negatively on
farming, recreation, ecosystems and the economy. One single intervention will never address all
water quality challenges. By arguing that more and more water purification plants need to be
built is not only unaffordable but also impractical. Water purification infrastructure can to some
extent address point source pollution but will never be able to deal with non-point source
pollution. To deal with the latter, land use practices need to change and wetland and riparian
zones need to be restored in order to improve the quality of return flows into our river systems.
This can be seen as the contribution that investments in watershed services can make at the
lower end of the water value chain.
4.1.5 Shared water resources
South Africa shares four major river systems with six neighbouring states (Zimbabwe,
Botswana, Mozambique, Swaziland, Lesotho and Namibia). Trans-boundary institutional
structures for all of the shared basins are in place to deal with water matters and international
agreements on water sharing are in place in two of these river basins, namely the Inkomati and
Maputo basins, in line with the Revised SADC Protocol on Shared Watercourses. These shared
river basins raise the importance of water in the regional integration agenda in SADC.
South Africa’s policy and legislation recognises international obligations in allocation protocol.
4.1.6 Are we facing a water crisis?
The NWRS-2 notes that there are, in principle, two answers to the question of whether South
Africa is facing a water crisis or not. In terms of “crisis” being defined as a disaster, a
catastrophe, or an emergency, there is no immediate water crisis. However, in terms of “crisis”
meaning a situation having a negative impact on economic, political, societal or environmental
goals, there is a potential crisis.
In terms of water resource availability, there is no crisis. There are theoretically sufficient water
resources available to meet our demands, especially if we include the sea.
The challenge and risk lies in:
• the water resource choice, its location and the associated cost, technology and effort to
develop it;
• the ability to ensure timeous access to these resources;
• the ability to ensure functionality and sustainability of the water delivery systems;
• the ability to secure life cycle financing, from planning to implementation, to operations &
maintenance;
• the viability of schemes and associated services in terms of sector related affordability;

SIP 19: Ecological Infrastructure for Water Security
October 31, 2014
Page 19 of 100
• the ability to protect the water resource in terms of quality and habitat for sustained use
and re-use;
• the spatial context within the physical, economic and hydrological environment; and,
• The potential skill shortage as well as the capacity and ability to manage the various water
challenges.
In the short- to medium-term, a potential water crisis will not be the result of water resources
per se, but rather due to a lack of appropriate institutional arrangements, skills and capacity,
financing and financial management, effective water management and poor governance. In
selected areas the reality of water resource challenges, the present economic climate as well as
potential climate variation, will dictate the possibility of water crisis.
This notwithstanding, the following provides a quick reality check on the likelihood, or
otherwise, of a water crisis in the short- to medium-term –
• Poor functionality of existing water supply infrastructure and inadequate management
thereof due to a lack of investment in and focus on operation and maintenance, is a current
reality;
• Fresh water deficits already occur in the majority of water management areas, and water
allocation challenges are a reality;
• All existing water reconciliation studies, with associated development proposals, are based
on the principle (and assumption) that water conservation and demand management
(WCDM) will effectively be implemented. Failing to implement WCDM will result in local
and regional water crises. This is already a reality in the Western Cape, the KwaZulu-Natal
metropolitan area and the Upper-Vaal system;
• Deteriorating water quality with associated socio-economic impacts is already evident in
key river catchments such as the Vaal River, Crocodile River and Upper-Olifants River. This
situation, together with the failure to address poor wastewater treatment, mine water
pollution and poor land use management effectively, is already a major risk area;
• Although the investment framework for new infrastructure development is well advanced, a
delay in its timeous implementation will result in potential water crises. With present
funding levels less than 50% of what is required, delays of some projects are imminent;
• Societal and political expectations from intended economic development and job creation
programmes, which depend on water availability, may not be realized. In many cases, water
may not be readily available due to high development costs, with associated implications.
4.2 The impact of climate change on South Africa’s water4
Government’s Long-Term Adaptation Scenario Research Flagship Programme (LTAS) aims to
respond to the South African National Climate Change Response White Paper (NCCRP,
paragraph 8.8) by developing national and sub-national adaptation scenarios for South Africa
under plausible future climate conditions and development pathways. This is a complex task
which requires the projection of climate change impacts for key sectors and an evaluation of
their socio-economic implications, in the context of development needs and aspirations of these
4 The following section is an edited extract from the draft Summary for Policy-Makers of government’s Long-
Term Adaptation Scenarios (LTAS), Phase I, dated 06/08/2013.
SIP 19: Ecological Infrastructure for Water Security
October 31, 2014
Page 20 of 100
sectors. This process is being followed in two major phases to build a sub-national and national
‘scenarioscape’ within which adaptation to climate change will occur.
During its first phase which was concluded in June 2013, summarized here, the LTAS process
developed a consensus view of climate change trends and projections, summarized key impacts
and identified potential response options in so-called primary sectors as defined by the NCCRP
and stakeholders, namely water, agriculture and forestry, human health, marine fisheries, and
biodiversity.
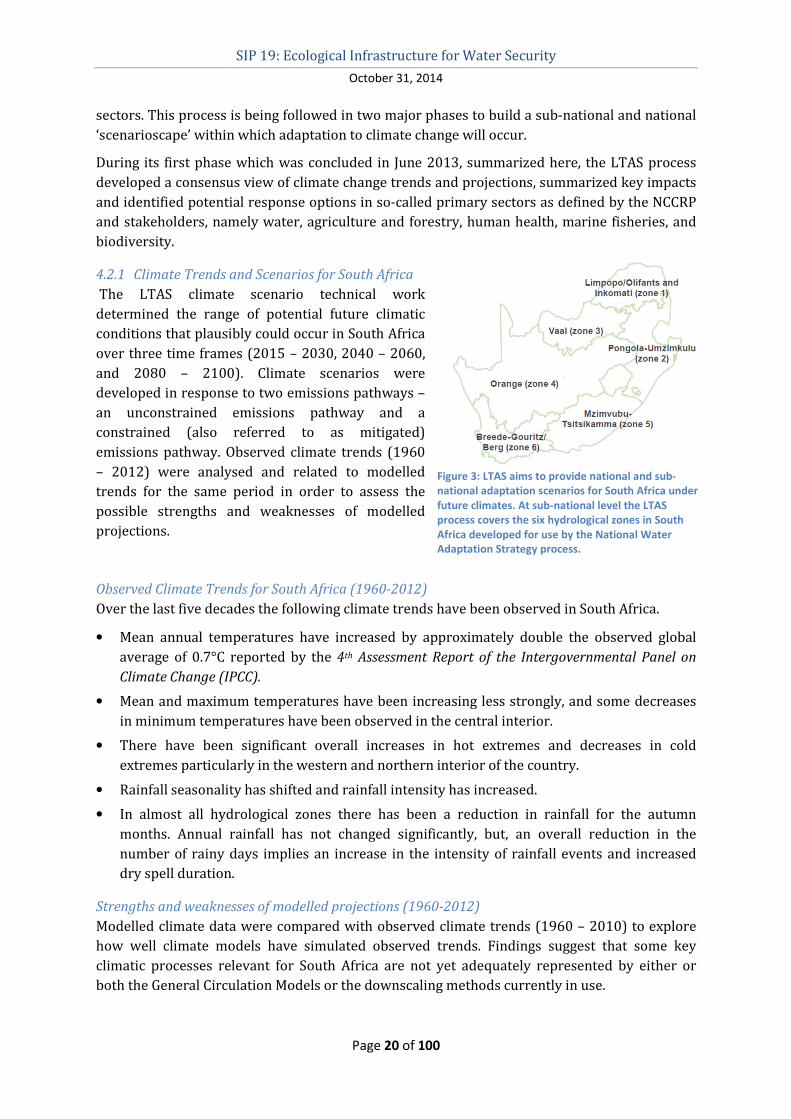
4.2.1 Climate Trends and Scenarios for South Africa
The LTAS climate scenario technical work
determined the range of potential future climatic
conditions that plausibly could occur in South Africa
over three time frames (2015 – 2030, 2040 – 2060,
and 2080 – 2100). Climate scenarios were
developed in response to two emissions pathways –
an unconstrained emissions pathway and a
constrained (also referred to as mitigated)
emissions pathway. Observed climate trends (1960
– 2012) were analysed and related to modelled
trends for the same period in order to assess the
possible strengths and weaknesses of modelled
projections.
Observed Climate Trends for South Africa (1960-2012)
Over the last five decades the following climate trends have been observed in South Africa.
• Mean annual temperatures have increased by approximately double the observed global
average of 0.7°C reported by the 4th Assessment Report of the Intergovernmental Panel on
Climate Change (IPCC).
• Mean and maximum temperatures have been increasing less strongly, and some decreases
in minimum temperatures have been observed in the central interior.
• There have been significant overall increases in hot extremes and decreases in cold
extremes particularly in the western and northern interior of the country.
• Rainfall seasonality has shifted and rainfall intensity has increased.
• In almost all hydrological zones there has been a reduction in rainfall for the autumn
months. Annual rainfall has not changed significantly, but, an overall reduction in the
number of rainy days implies an increase in the intensity of rainfall events and increased
dry spell duration.
Strengths and weaknesses of modelled projections (1960-2012)
Modelled climate data were compared with observed climate trends (1960 – 2010) to explore
how well climate models have simulated observed trends. Findings suggest that some key
climatic processes relevant for South Africa are not yet adequately represented by either or
both the General Circulation Models or the downscaling methods currently in use.
Figure 3: LTAS aims to provide national and sub-
national adaptation scenarios for South Africa under
future climates. At sub-national level the LTAS
process covers the six hydrological zones in South
Africa developed for use by the National Water
Adaptation Strategy process.
SIP 19: Ecological Infrastructure for Water Security
October 31, 2014
Page 21 of 100
• Observed temperature trends are more closely matched by modelled simulations than are
rainfall trends.
• Observed trends since 2000 have not increased as steeply as projected by model
simulations.
• The observed reductions in autumn rainfall are not reproduced by the models, and the
models tend to show opposite trends.
• In spring, where observed trends are weak, models show a tendency for reduced rainfall
projections in all hydrological zones.
Projected rainfall and temperature changes for South Africa (to 2050 and beyond)
Climate projections were simulated over southern Africa using both statistical and dynamic
downscaling of various future energy pathways modelled by the Intergovernmental Panel on
Climate Change (IPCC) and models such as those developed by the Massachusetts Institute of
Technology (MIT) Integrated Global System Model.
From this work, climate change projections for South Africa up to 2050 and beyond under
unmitigated emission scenarios include:
• All modelling approaches project warming trends until the end of this century, but most
approaches project the possibility of both drying and wetting trends in almost all parts of
South Africa.
• Very significant warming, as high as 5–8°C, over the South African interior by the end of this
century. Warming would be somewhat reduced over coastal zones.
• A general pattern of a risk of drier conditions to the west and south of the country and a risk
of wetter conditions over the east of the country.
• Many of the projected changes are within the range of historical natural variability, and
uncertainty in the projections is high.
• Effective global mitigation action is projected to reduce the risk of extreme warming trends,
and to reduce the likelihood of extreme wetting and drying outcomes by at least mid-
century.
• High resolution regional modelling suggests even larger benefits of effective global
mitigation by the end of this century, when regional warming of 5–8°C could be more than
halved to 2.5–3°C.
• Overall, there is far greater certainty in temperature than in rainfall projections.
Projected climate futures for South Africa (2015–2035, 2040–2060 and 2070–2090)
Four broad climate scenarios could usefully represent plausible climate outcomes over the
coming century given the two main groups of emissions scenarios namely unmitigated
(unconstrained) and mitigated (constrained) future energy pathways.
South Africa’s climate future from 2025 and beyond can be described using four broad climate
scenarios at national scale, with different degrees of change and likelihood that capture the
results of global mitigation action and the passing of time:
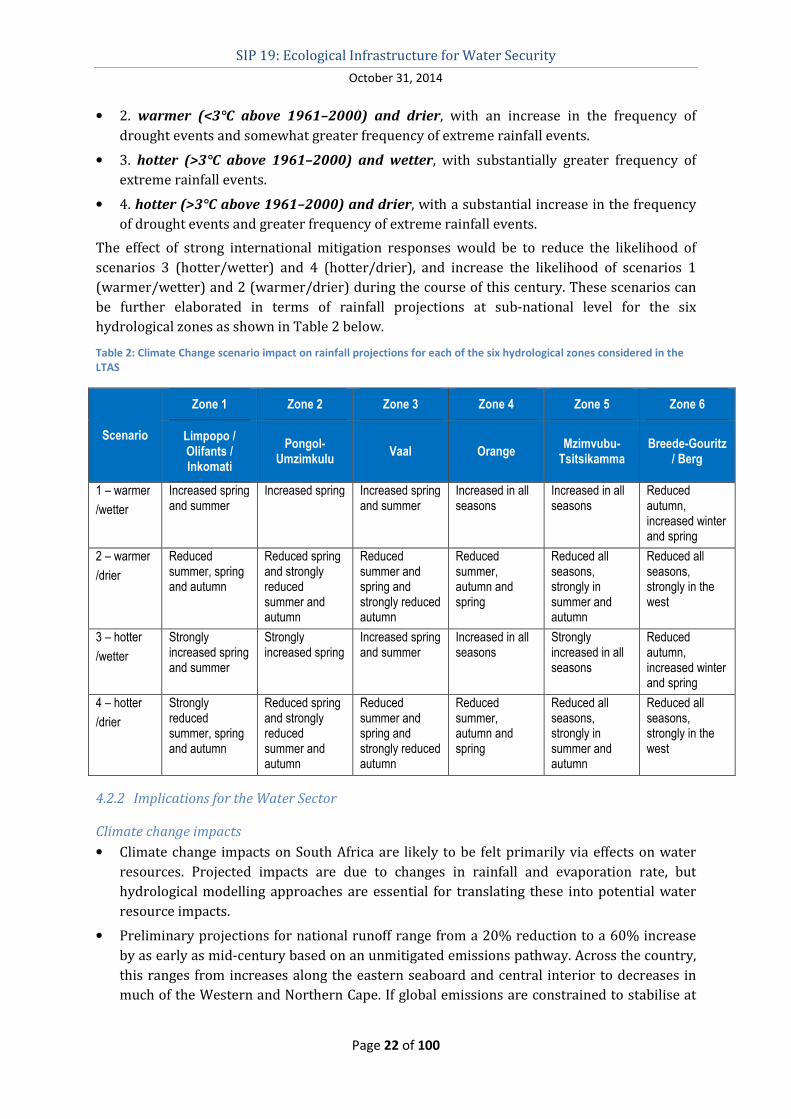
• 1. warmer (<3°C above 1961–2000) and wetter, with greater frequency of extreme rainfall
events.
SIP 19: Ecological Infrastructure for Water Security
October 31, 2014
Page 22 of 100
• 2. warmer (<3°C above 1961–2000) and drier, with an increase in the frequency of
drought events and somewhat greater frequency of extreme rainfall events.
• 3. hotter (>3°C above 1961–2000) and wetter, with substantially greater frequency of
extreme rainfall events.
• 4. hotter (>3°C above 1961–2000) and drier, with a substantial increase in the frequency
of drought events and greater frequency of extreme rainfall events.
The effect of strong international mitigation responses would be to reduce the likelihood of
scenarios 3 (hotter/wetter) and 4 (hotter/drier), and increase the likelihood of scenarios 1
(warmer/wetter) and 2 (warmer/drier) during the course of this century. These scenarios can
be further elaborated in terms of rainfall projections at sub-national level for the six
hydrological zones as shown in Table 2 below.
Table 2: Climate Change scenario impact on rainfall projections for each of the six hydrological zones considered in the
LTAS
Scenario
Zone 1 Zone 2 Zone 3 Zone 4 Zone 5 Zone 6
Limpopo / Olifants / Inkomati
Pongol-Umzimkulu
Vaal Orange Mzimvubu-Tsitsikamma
Breede-Gouritz / Berg
1 – warmer
/wetter
Increased spring and summer
Increased spring Increased spring and summer
Increased in all seasons
Increased in all seasons
Reduced autumn, increased winter and spring
2 – warmer
/drier
Reduced summer, spring and autumn
Reduced spring and strongly reduced summer and autumn
Reduced summer and spring and strongly reduced autumn
Reduced summer, autumn and spring
Reduced all seasons, strongly in summer and autumn
Reduced all seasons, strongly in the west
3 – hotter
/wetter
Strongly increased spring and summer
Strongly increased spring
Increased spring and summer
Increased in all seasons
Strongly increased in all seasons
Reduced autumn, increased winter and spring
4 – hotter
/drier
Strongly reduced summer, spring and autumn
Reduced spring and strongly reduced summer and autumn
Reduced summer and spring and strongly reduced autumn
Reduced summer, autumn and spring
Reduced all seasons, strongly in summer and autumn
Reduced all seasons, strongly in the west
4.2.2 Implications for the Water Sector
Climate change impacts
• Climate change impacts on South Africa are likely to be felt primarily via effects on water
resources. Projected impacts are due to changes in rainfall and evaporation rate, but
hydrological modelling approaches are essential for translating these into potential water
resource impacts.
• Preliminary projections for national runoff range from a 20% reduction to a 60% increase
by as early as mid-century based on an unmitigated emissions pathway. Across the country,
this ranges from increases along the eastern seaboard and central interior to decreases in
much of the Western and Northern Cape. If global emissions are constrained to stabilise at
SIP 19: Ecological Infrastructure for Water Security
October 31, 2014
Page 23 of 100
450 ppm CO2, these changes are projected to lie between a 5% decrease and a 20% increase
in annual runoff.
• Under all four future climate scenarios, a higher frequency of flooding and drought extremes
is projected, with the range of extremes exacerbated significantly under the unconstrained
global emissions scenario. Under a wetter future climate scenario, significant increases in
runoff would result in increased flooding, human health risks, ecosystem disturbance and
aesthetic impacts. Drier future climate scenarios would result in reduced surface water
availability, but would not exclude the risk of extreme flooding events.
• Areas showing highest risks in extreme runoff related events (and flooding conditions)
include KwaZulu-Natal, parts of southern Mpumalanga and the Eastern Cape. Specific areas
at risk to increased evaporation, decreased rainfall and decreased runoff include the south-
west and western regions, and to some extent the central region and the extreme north-east.
Adaptation Responses and Research Requirements
• Because of the critical importance of water in the South African economy, the country has a
sophisticated water resources technical and planning capacity which has been founded on a
good understanding of the rainfall variability. This capacity is a key capability for adaptation
planning going forward.
• At present, specific provisions for climate change adaptation have been made in very few of
the water resources planning tools. There are some early attempts that have simulated
simple scenarios of changed surface water supply in reconciliation studies.
• Development aspirations in South Africa will likely be influenced by opportunities and
constraints that arise from climate change impacts on the water sector. Key decisions would
benefit from considering the implications of a range of possible climate-water futures facing
South Africa. This is because the current modelling of future climate is uncertain with
respect to rainfall variability and seasonality change, but more certain with regard to
warming projections.
• A scenario-based approach is therefore a viable way forward with respect to exploring
adaptation options for the water sector. Given the substantial uncertainty over rainfall
scenarios neither drier nor wetter scenarios can be excluded.
• Under a wetter future scenario, trade-offs in water allocation between sectors are likely to
be less restrictive, providing greater scope for urban-industrial economic growth and water
provision for an intensive agricultural production model.
• Under a drier future scenario, significant trade-offs are likely to occur between
developmental aspirations, particularly in terms of the allocation between agricultural and
urban/industrial water use, linked to the marginal costs of enhancing water supply. These
constraints are most likely to be experienced in central, northern and south-western parts
of South Africa, with significant social, economic and ecological consequences through
restricting the range of viable national development pathways.
• Adaptation response strategies for the water sector could be usefully identified at distinct
governance levels. At national scale the development of a strategic intent and an enabling
framework for adaptation would help to ensure a coherent national response. At sub-
national or system scale key institutions could usefully engage in prioritising and allocating
resources to interventions that take cognisance of adaptation imperatives. At sub-catchment

SIP 19: Ecological Infrastructure for Water Security
October 31, 2014
Page 24 of 100
or municipal scale the design of local implementation actions would be facilitated by
responding to local challenges, resources and capacities.
• The following priority functions would be beneficial to the Department of Water Affairs and
Sanitation (own emphasis):
o policy review for enabling flexible frameworks;
o flexible and robust infrastructure planning;
o resources directed at maintaining critical ecological infrastructure in vulnerable systems;
o institutional oversight to ensure water related institutions build adaptive management
capacity;
o effective information management and maintenance of monitoring and evaluation
systems; and
o sustainable and locally accessible financial management.
• Research and focused monitoring would be valuable for:
o supporting the development of tools, approaches and case studies of the way in which
water planning may consider long-term climate change;
o understanding the way in which climate driven changes in water resources availability or
demand may constrain or enable different development pathways in different parts of
South Africa, particularly for agricultural production and energy generation; and
o exploring the implications of long-term hydrological change on the ecological reserve
(including the appropriate definition of the reserve) and associated issues of catchment
management approaches that are needed to maintain the ecological reserves in different
systems so that it continues to provide clean water and other ecosystem services to
society.
4.3 The destruction and/or degradation of ecological infrastructure
As mentioned above, although ecological infrastructure underpins the delivery of life-giving
ecological services, our global stocks of natural capital, including our ecological infrastructure, is
being drastically depleted and is in urgent need of restoration.
In 2010, nearly two-thirds of the globe’s ecosystems were considered degraded as a result of
damage, mismanagement and a failure to invest and reinvest in their productivity, health and
sustainability.
In this regard, water-related ecosystems are of particular importance to water-poor South
Africa and, thus, water ecosystems are regarded as a priority performance area by the
Department of Water Affairs and Sanitation. This indivisibility of water is a cornerstone of the
National Water Policy, to the extent that water ecosystems are not seen as users of water in
competition with other users, but as the base from which the resource is derived, without
which, growth and development cannot be sustainable. This is legislated in the National Water
Act through Resource Directed Measures, which include the Ecological Reserve, Water Resource
Classification and Resource Quality Objectives.
South Africa’s ecosystems range from sub-tropical in the north-eastern part of the country, to
semi-arid and arid in the interior, to the cool and temperate rivers of the fynbos. This diversity
is a result of a geologically and climatically complex country, giving rise to a diverse range of
ecosystems. Keeping an adequate number of these river and wetland ecosystems in a good
SIP 19: Ecological Infrastructure for Water Security
October 31, 2014
Page 25 of 100
condition (so-called A or B ecological category) helps to support the ecological functioning of
catchments and the sustainable development of water resources.
The recent National Biodiversity Assessment 20115 identified 223 river ecosystem types that
are representative of the diversity of rivers in South Africa, based on soil, geology, vegetation,
climate, flow and the slope of the river channel. In addition, 792 wetland ecosystem types were
identified in a similar manner to describe wetland diversity across the country.
Consistent with global trends, this assessment found that freshwater ecosystems in South Africa
are highly threatened, much more so than terrestrial ecosystems. Almost 60% of river
ecosystem types are threatened, with 25% of these critically endangered. Wetland ecosystem
types are of even more concern with 65% identified as threatened, including a staggering 48%
critically endangered. This is of enormous concern given the crucial role of wetlands in
delivering ecosystem services such as water purification, flood regulation and drought
mitigation.
High levels of threat are also documented for freshwater fauna: 31% of freshwater fish
indigenous to South Africa are threatened, and a recent southern African study on the
conservation status of major freshwater-dependent taxonomic groups (fishes, molluscs,
dragonflies, crabs and vascular plants) reported far higher levels of threat in South Africa than
in the rest of the region.
South Africa’s system of protected areas shows significant gaps in conserving freshwater
ecosystems, and less than 15% of the river ecosystems assessed can be considered moderately-
to well-represented within protected areas. Moreover, inclusion in protected areas does not
guarantee conservation: almost half of the large river systems that are incorporated into
protected areas have been degraded by upstream human activities before entering the
protected area. Despite these deficiencies in protection levels, rivers inside protected areas are
in better condition compared to those outside, emphasizing the positive role protected areas
can have through appropriate land management strategies.
5 Driver A., Sink, K.J., Nel, J.N., Holness, S., Van Niekerk, L., Daniels, F., Jonas, Z., Majiedt, P.A., Harris, L.
and Maze, K. 2012. National Biodiversity Assessment 2011: An assessment of South Africa’s biodiversity and
ecosystems. Synthesis Report. South African National Biodiversity Institute and Department of Environmental
Affairs. Pretoria
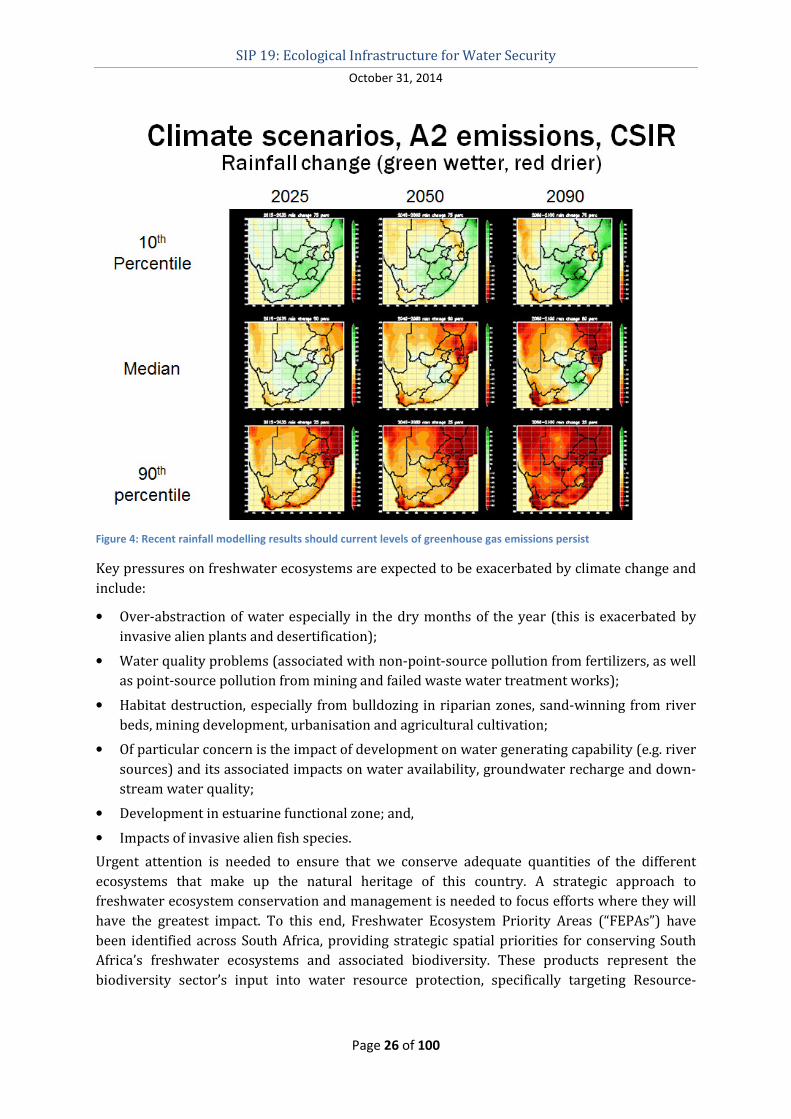
SIP 19: Ecological Infrastructure for Water Security
October 31, 2014
Page 26 of 100
Figure 4: Recent rainfall modelling results should current levels of greenhouse gas emissions persist
Key pressures on freshwater ecosystems are expected to be exacerbated by climate change and
include:
• Over-abstraction of water especially in the dry months of the year (this is exacerbated by
invasive alien plants and desertification);
• Water quality problems (associated with non-point-source pollution from fertilizers, as well
as point-source pollution from mining and failed waste water treatment works);
• Habitat destruction, especially from bulldozing in riparian zones, sand-winning from river
beds, mining development, urbanisation and agricultural cultivation;
• Of particular concern is the impact of development on water generating capability (e.g. river
sources) and its associated impacts on water availability, groundwater recharge and down-
stream water quality;
• Development in estuarine functional zone; and,
• Impacts of invasive alien fish species.
Urgent attention is needed to ensure that we conserve adequate quantities of the different
ecosystems that make up the natural heritage of this country. A strategic approach to
freshwater ecosystem conservation and management is needed to focus efforts where they will
have the greatest impact. To this end, Freshwater Ecosystem Priority Areas (“FEPAs”) have
been identified across South Africa, providing strategic spatial priorities for conserving South
Africa’s freshwater ecosystems and associated biodiversity. These products represent the
biodiversity sector’s input into water resource protection, specifically targeting Resource-
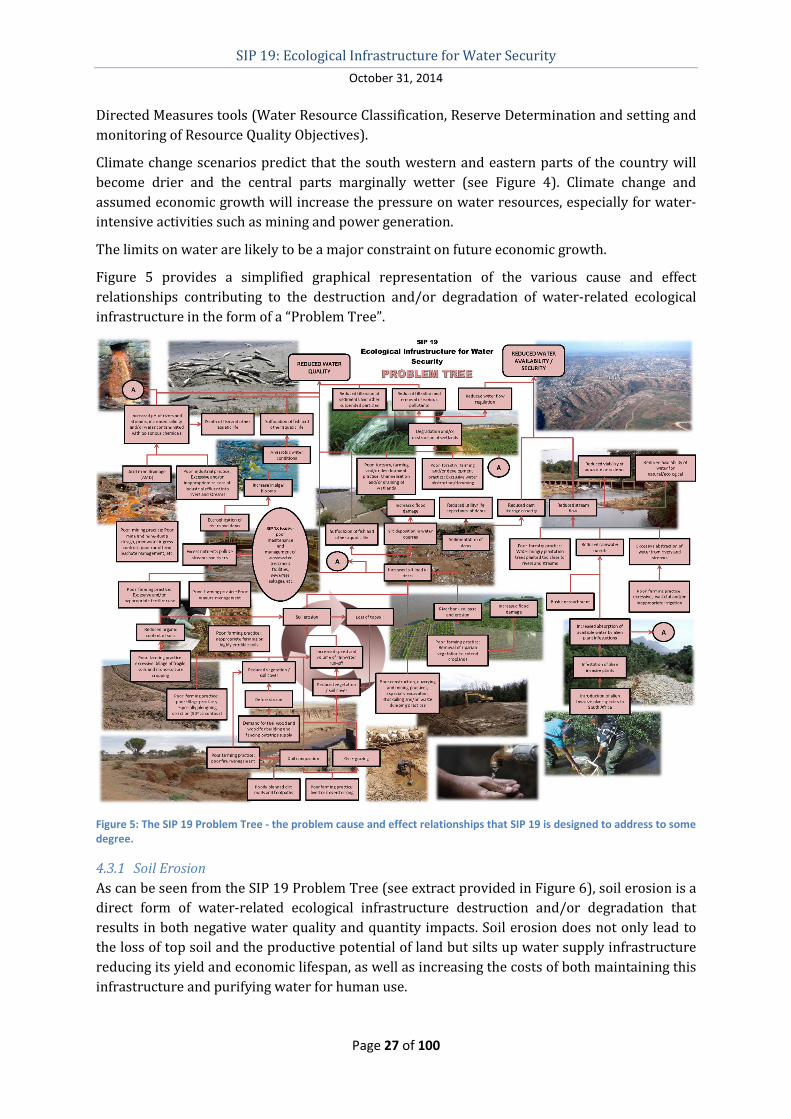
SIP 19: Ecological Infrastructure for Water Security
October 31, 2014
Page 27 of 100
Directed Measures tools (Water Resource Classification, Reserve Determination and setting and
monitoring of Resource Quality Objectives).
Climate change scenarios predict that the south western and eastern parts of the country will
become drier and the central parts marginally wetter (see Figure 4). Climate change and
assumed economic growth will increase the pressure on water resources, especially for water-
intensive activities such as mining and power generation.
The limits on water are likely to be a major constraint on future economic growth.
Figure 5 provides a simplified graphical representation of the various cause and effect
relationships contributing to the destruction and/or degradation of water-related ecological
infrastructure in the form of a “Problem Tree”.
Figure 5: The SIP 19 Problem Tree - the problem cause and effect relationships that SIP 19 is designed to address to some
degree.
4.3.1 Soil Erosion
As can be seen from the SIP 19 Problem Tree (see extract provided in Figure 6), soil erosion is a
direct form of water-related ecological infrastructure destruction and/or degradation that
results in both negative water quality and quantity impacts. Soil erosion does not only lead to
the loss of top soil and the productive potential of land but silts up water supply infrastructure
reducing its yield and economic lifespan, as well as increasing the costs of both maintaining this
infrastructure and purifying water for human use.

SIP 19: Ecological Infrastructure for Water Security
October 31, 2014
Page 28 of 100
Poor Farming Practice
The following poor farming practices contribute to soil erosion –
• Livestock overstocking – exceeding the land’s livestock carrying capacity leads to
overgrazing and the compaction of the soil. Both of these effects then result in reduced
vegetation or soil cover which results in the increased speed and volume of rainwater run-
off. This, in turn, erodes the soil.
• Poorly planned roads and footpaths – the construction and use of roads and paths that do
not take account of storm-water flow (e.g. follow a line that is at right-angles to steep
slopes), often results in soil compaction as well as the increased speed and volume of
rainwater run-off. This, in turn, erodes the soil.
• Poor fire management – having too frequent veld fire or having veld fires during the wrong
season combined with unsustainable grazing regimes leads to the compaction of the soil and
reduced vegetation or soil cover which results in the increased speed and volume of
rainwater run-off. This, in turn, erodes the soil.
• Exhausting the soil – excessive tillage of fragile soils, tillage of highly erodible soils and
continuous mono-culture cropping without crop rotation reduces the organic content of
soils which make them more erodible. This again results in the increased speed and volume
of rainwater run-off. This, in turn, erodes the soil.
Demand for natural products exceeding supply
In relatively dense, often poor, rural communities, the demand for “free” natural fuel, building
and fencing materials in the form of indigenous wood from natural woodlands often exceeds the
supply of these resources. This leads to deforestation which may result in reduced vegetation or
soil cover which results in the increased speed and volume of rainwater run-off. This, in turn,
erodes the soil.
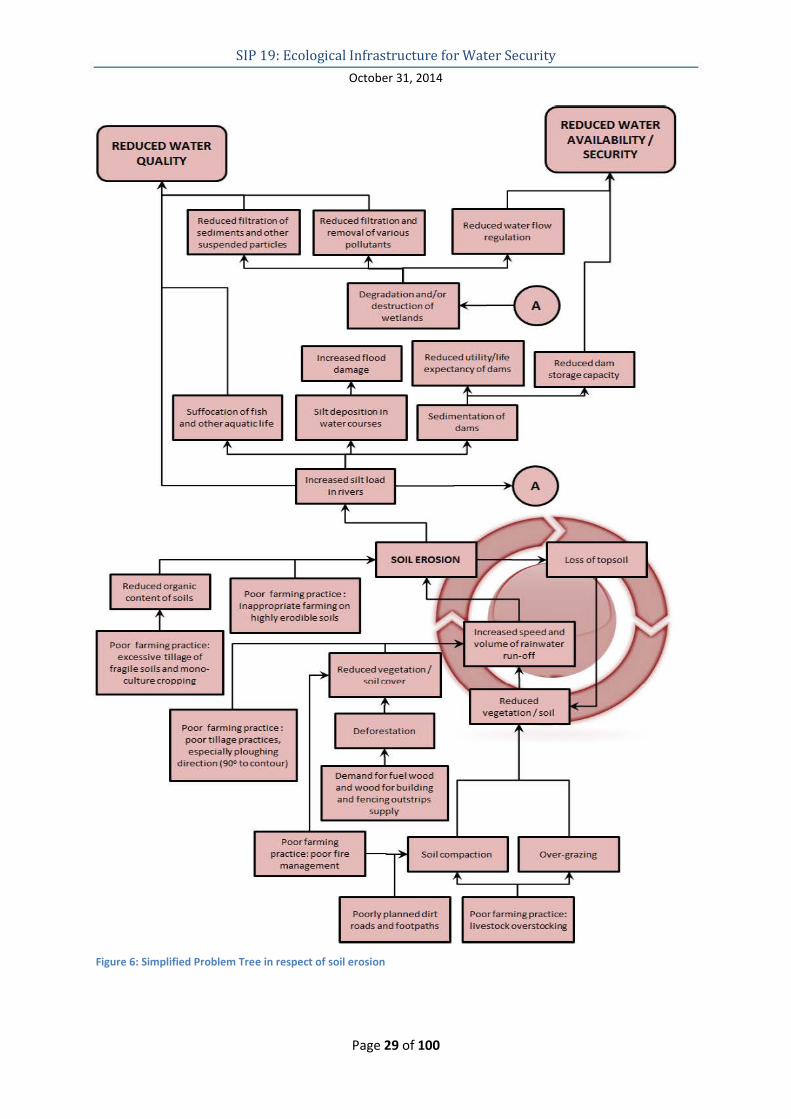
SIP 19: Ecological Infrastructure for Water Security
October 31, 2014
Page 29 of 100
Figure 6: Simplified Problem Tree in respect of soil erosion
REDUCED WATER
REDUCED WATER AVAILABILITY/
QUALITY SECURITY
I I I Reduced filtration of Reduced f iltration and Reduced water flow sediments and other removal of various regulation suspended particles pollutants
-t -t 1' -I
Degradation and/ or destruction of A
wetlands
I Increased flood Reduced utility/life
I Reduced dam I damage expectancy of dams storage capacity
1' .-f!. A<.
Suffocation of fish Silt deposition in
I Sedimentation of and other aquatic life water courses
dams
1' 1' 1'
Increased silt load A in rivers
t >~
I SOIL EROSION -I
I Reduced organic I Poor farming practice : content o f soils Inappropriate farming on
t highly erodible soils
(" Increased speed and )
Poor fa rming practice: , volumeofrainwater I excessive tillage of
I~ run-off
fragile soils and mono-~
Reduced vegetation I '-i'
:;!../ culture cropping c;oil r:ovpr
"""""' I f Reduced
I I vegetation/ soil
Poor farming practice: Deforestation poor tillage practices, especia lly ploughing t d irection (90" to contour)
Demand for fuel wood and wood f orbuilding and fencing outstrips
supply
Poor farming
I I practice: poor f ire Soil compaction Over-grazing management
-t -t I
Poorly p lanned dirt Poor farming practice: roads and footpaths livestock overstocking
SIP 19: Ecological Infrastructure for Water Security
October 31, 2014
Page 30 of 100
Gully-erosion – the vicious cycle
As illustrated in Figure 6, once soil erosion reaches a stage when all the available topsoil is
washed away, no plants can grow in the eroded area and so a vicious cycle of erosion starts that
gouges deep gulleys into the landscape making the land completely unproductive.
Impact on Water
Apart from severely reducing the productivity of the affected land, soil erosion increases the silt
load in rainwater run-off, streams and rivers. This silt clogs up and suffocates wetlands, leads to
the sedimentation of dams and water courses, damages hydropower clean energy generation
facilities and suffocates fish and other aquatic life. These impacts then have the knock-on effects
of wetland degradation and destruction (see 4.3.3), increased flood damage reduced dam utility,
storage capacity and life expectancy. The extra silt directly impacts water quality, which in turn
results in higher costs in treating the water to the required standard for human consumption.
Ultimately these costs are passed on to consumers. The abrasive effect of water-borne silt also
reduces the lifespan of components such as valves, pumps and turbines, thereby increasing
maintenance costs. These impacts on dams thus directly affect water availability and water
security. In 2010, the average cost to create one cubic meter of storage space was in the order of
R20. If allowed to silt up, it will cost a further R8 per cubic meter to dredge this clogged up
storage space.
4.3.2 Invasive Alien Plant Infestations
There is a strong relationship between invasive alien infestations and reduced aquatic
ecosystem integrity and hydrological yield, including:
• Reduction in mean annual runoff and particularly dry season low flows;
• Reduction in utilisable yield from dams;
• Alteration of the key hydrological cues that define the nature of stream biota;
• Increases in catchment sediment supply, through the effects of “hot fires” and bank erosion;
• Reach- and biome-specific alteration in geomorphological processes, with resulting effects
on channel geometry and in-stream habitat quality;
• Reduction in riparian and wetland plant and invertebrate (for example dragon flies)
biodiversity, through competitive displacement, shading and changes in fire regime;
• Changes in the supply and timing of food sources, water chemistry and fire regime in aquatic
ecosystems; and
• Threats to aquatic fauna and biodiversity through the combined effects of the above on the
extent, distribution and quality of micro- and macro-habitats comprising freshwater
ecosystems.
• Increase in the intensity of fires and exacerbation of environmental damage due to
increased fuel loads.
4.3.3 Wetlands
Wetlands (vleis, bogs, swamps, sponges and/or marshes) are vital ecosystems, which have been
described as some of the most productive ecosystems in the world. Apart from wetlands
providing habitat for a variety of plant and animal species, wetlands are important elements of
ecological infrastructure that provide key watershed services including the moderation of water
flow and the regulation of water quality. They may act as sponges during wet periods, thereby
SIP 19: Ecological Infrastructure for Water Security
October 31, 2014
Page 31 of 100
attenuating the destructive energy of floodwaters and maintaining streamflow during dry
periods. They slow down the flow of water, causing suspended matter (e.g. silt) to settle out or
to be absorbed by wetland plants. The ability of wetlands to transform, sequester or remove
certain pollutants, especially nutrients originating from sewage or fertiliser, heavy metals and
sediment, is well known, to the extent that constructed wetlands that mimic these natural
processes are increasingly being employed as passive water treatment systems. Wetland plants
are specifically adapted to flourish in areas of higher than average concentrations of certain
elements.
Despite providing these benefits, wetlands were identified by the 2011 National Biodiversity
Assessment as the most threatened ecosystem type in South Africa. Although no systematic
national survey of wetland loss has been undertaken, studies in several major catchments have
revealed that between 35% and 60% of the wetlands, and the benefits they provide, have been
lost or severely degraded. It is likely that the extent of wetland loss for the country as a whole
lies within this range.
Threats to wetlands include human activities, such as channelization, drainage, crop production,
effluent disposal and water abstraction. Loss of wetlands leads to a reduction or loss in
biodiversity, as the plants and animals that are adapted to wetland habitats are often unable to
adapt to new environmental conditions, or to move to more suitable ones. Loss of harvestable
resources also occurs when wetlands are lost. For example reeds and grasses are important
materials in traditional construction, and reduction in these resources creates a dependence on
other materials such as wood, plastics, and metals, which have negative environmental impacts.
Loss of water quality and flow regulation is a further consequence of loss of wetlands, and may
result in greater extent or severity of flooding. Consequences of wetland loss thus include
reduced food security, desertification, lost livelihoods, diminished water security, increased
vulnerability to floods and droughts and reduction in biodiversity. It is also important not to
overlook the connection between poverty and environmental degradation – poverty is a
consequence as well as a driver of environmental degradation.
The national wetland inventory maintained by SANBI has to date mapped in excess of 100,000
wetlands that together cover 2,9 million hectares, or 2,4% of South Africa’s surface area. The
vast majority of these are found outside formal protected areas. The National Biodiversity
Assessment found that Only 11% of wetland ecosystem types are well protected, with 71% not
protected at all, reflecting the fact that wetlands have not been systematically taken into
account in establishing and expanding land-based protected areas.
South Africa currently has 21 wetlands designated as Wetlands of International Importance in
accordance with the Ramsar Convention.

SIP 19: Ecological Infrastructure for Water Security
October 31, 2014
Page 32 of 100
5. STRATEGY ANALYSIS6
Water planners have recognized the importance
of preserving key watershed7 lands for some
time. For example, when the United States
Congress formally authorised the creation of
national forests in their Organic Administration
Act of 1897, although they naturally hoped that
national forests would provide a "continuous
supply of timber for the use and necessities" of
the nation, their first purpose envisaged for
national forests was "securing favourable
conditions of water flows." When U.S. cities
began to import water in the 19th and early 20th
centuries, they frequently, and for good reason,
chose areas that were protected from logging
and other forms of development (e.g. San
Francisco's choice of the Hetch Hetchy Valley in
Yosemite National Park as the site of its major
water reservoir) or took active steps to protect
the land (e.g. creating the Adirondacks "forever
wild" preserve in New York).
Watershed preservation remains of importance
today to both water quantity and water quality.
On the water quantity front, watershed
preservation can help ensure a steadier, and
thus more readily captured and stored, supply
of water in surface waterways. Conversely,
watershed degradation can increase
sedimentation that in turn can reduce the
storage capacity of existing surface reservoirs.
Recent years have seen growing interest in the
importance of watershed preservation for
water quality. When land in the vicinity of a
surface waterway is developed, the uses to
which the land is put frequently add
contaminants to the waterway. Non-point
pollution, in the form of runoff from agriculture,
livestock operations, construction sites, mines,
parking lots, roads, and other uses, as well as
6 The following section is taken from a paper by Barton H. Thompson, Jr. of the Stanford Law School entitled
“Watersheds, Natural Capital, and Water” presented at the 2003 John M. Olin Conference on Watershed
Management. 7 It should be noted that in South Africa the term ‘catchment’ is used in preference to the term ‘watershed’
which is used in the US.
Significant Cost-Savings: Watershed Restoration for Large Urban Centres
Restoring degraded ecosystems has been an
important tool for economic recovery and
improving the quality of life in many large urban
centres. Many cities throughout the United States
have invested in municipal watershed restoration,
New York being notable among them. In the
1990s, deterioration of adjoining watersheds in
the Catskills Mountains negatively impacted the
quality of water flowing to New York City. A
subsequent cost-benefit analysis revealed that the
restoration of these watersheds would provide
economic and social benefits to rural areas, and
save the US$6-8 billion dollars that would have
been required for a new water filtration plant.
Similar successes in watershed restoration -
investing in our ecological infrastructure instead of
built infrastructure - have taken place in other
large urban centres around the world, including
Jakarta, Quito, and Beijing.
Ecosystem restoration activities can significantly
increase job opportunities and improve livelihoods
in rural areas, and play an essential role in
mitigating and adapting to the impacts of
anthropogenic climate change. Effective natural
resource management and restoration can also
contribute to reduced vulnerabilities because
healthy and resilient ecosystems are better able
to mitigate the impact of natural hazards, such as
landslides, hurricanes and tsunamis, and they
represent important assets for people and
communities after a disaster or extreme event has
occurred.
The Society for Ecological Restoration (SER)
Kenya, Uganda and Tanzania’s Ecological Infrastructure Investments for Water Security
For the last couple of years Kenyan flower growers along the shore of Lake Naivasha have been paying upstream farmers in the hills 40 kilometres away to adopt sustainable agriculture practices aimed at improving water quality and quantity to the lake. This investment in ecological infrastructure for watershed services is not only improving the quality of the lake and the livelihoods of the flower growers, but is also helping farmers lift themselves out of poverty (see www.ecosystemmarketplace.com.)
Figure 7: Excavation of terraces in Tanzania
In Tanzania’s Mfizigo River sub-catchment, the industrial water supply and sewerage corporation (DAWASCO) and Coca Cola have entered into a deal with the farmers of the Lukenge, Kibungo, Lanzi, Dimilo and Nyingwa villages in which the farmers receive payment for the adoption of agricultural practices aimed at controlling runoff and soil erosion, while improving their crop production.
Figure 8: Beans being grown on Fanya juu terraces
A combined approach is being implemented that includes structural interventions (bench terraces and, so-called fanya juu terraces), ecological infrastructure interventions (e.g. reforestation, agroforestry and grass strips) and agronomic measures (intercropping crops with fruit trees, mulching and fertilising with animal manure) to limit runoff, combat soil erosion and increase soil moisture and productivity (see Weadapt.org/the equitable payments-for-watershed-service-epws).
In Uganda, a brewer is paying for the protection of wetlands to retain their valuable capacity to maintain a steady and abundant supply of clean water. A similar project is in development in Zambia, funded in part by the SABMiller subsidiary Zambian Breweries PLC.
SIP 19: Ecological Infrastructure for Water Security
October 31, 2014
Page 33 of 100
the leaching of waste from septic tanks, landfill sites and pit latrines often present significant
threats to our surface waterways.
Undeveloped land, moreover, frequently helps to reduce contamination. Both wetlands and soils
filter out nutrients and other contamination from runoff before the runoff reaches the main
course of a waterway. Vegetation slows down runoff, permitting solid pollutants to settle out,
and stabilizes soil, thus reducing contamination from siltation. Land preservation thus performs
a double duty in protecting surface water quality: it eliminates a major source of contamination,
while also protecting the waterway from those non-point sources of contamination that do
exist.
5.1 Natural Capital Versus Technological Investments
There are technological fixes to the various problems that result from watershed degradation. If
sedimentation reduces surface storage capacity, for example, government can dredge the
reservoir, raise the dam wall, or turn to other water sources like groundwater or the
desalination of seawater. If groundwater recharge drops, water users can mine the aquifer by
pumping to ever greater depths or again seek out alternative water supplies. If watershed
degradation leads to water contamination, water suppliers can filter the water.
Yet these technological fixes often prove to be inferior in many respects to the "natural services"
that intact watersheds provide –
• Limitations - Firstly, the technological fixes often do not solve the entire problem. Filtration
systems, for example, do not treat all contaminants.
• Cost - Secondly, technological solutions typically are often very expensive both in terms of
capital costs and running costs. Based on the experience of a number of U.S. cities, it is
estimated that every dollar used to protect existing watersheds can save anywhere from
$7.50 to $200 in water treatment costs. Dredging, dam expansion, and water importation
are all similarly costly.
• Environmental impact - Thirdly, technological fixes frequently raise serious environmental
concerns. Groundwater mining will not only ultimately exhaust the resource, but in the
interim can lead to subsidence, desertification, salt water intrusion, spreading contaminant
plumes, and biodiversity loss. Dam expansion can lead to further land loss and stream
modification, while new water imports bring all of the traditional environmental problems
of water supply projects.
• Limited co-benefits - Finally, watershed preservation can provide a variety of positive
externalities such as biodiversity protection, open space, and even carbon sequestration.
In summary, natural capital (in the form of watershed services) and technological investments
(in filtration facilities and other engineering solutions) are substitutes and, despite their
ascendancy in the 20th century, technological investments in many cases are not always the
most efficient and effective means of providing water supply and quality.
5.2 Case Study: New York City and the Catskills
In recent years, a number of ecologists and economists have touted New York City's efforts to
preserve the Catskills watershed, one of three major basins from which the city obtains its
water supply, as a key example of the benefits of effective watershed management.

SIP 19: Ecological Infrastructure for Water Security
October 31, 2014
Page 34 of 100
The first settlers on the island of Manhattan in the early 17th century drew their drinking water
from private wells. For the next three centuries, the City’s water supply system grew from a
series of simple local reservoirs to complex aqueducts systems that carried water to the City
from several kilometres away. At the turn of the 20th century, faced with growing demands for
reliable water, the city’s Board of Water Supply decided to look to watersheds in upstate New
York to supplement existing water supplies. Construction on an increasing number of reservoirs
and aqueducts continued until the 1960’s. Gradually, the upstate system of reservoirs and aque-
ducts became the primary source of drinking water for one of the largest cities in the world.
Today, the New York City (NYC) water supply system is still largely derived from surface water
north of the metropolitan area. The surface water network consists of three watersheds: the
Catskill and Delaware watersheds about 160 kilometres north of the city in the Catskill
Mountains and the Croton watershed about 80 kilometres north of the city and east of the
Hudson River. The system encompasses over 5 000 square kilometres. The system stretches
downstate to NYC via a complex of aqueducts and tunnels to supply 5.3 billion litters of safe
drinking water per day to millions of customers including residents, businesses, commuters,
and tourists. In fact, the system supplies water to nearly half of the population of New York
State. In addition, excess water from upstate reservoirs not used for drinking water is released
to the Delaware River to sustain adequate flow in the lower Delaware for New Jersey and other
downstream users. The reliable function and safety of this water supply was and is absolutely
essential to the existence of NYC.
As New York City and upstate communities have grown, pressures from two different sides have
impacted the water supply. Increasing human population and development in watershed
communities exerts pressure on natural water flows that supply the water supply system. In
addition, expanding populations in New York City exert pressure on the system in order to
supply a growing downstate need. The human presence at both ends of the water supply system
creates tensions that affect the decisions that must be made to satisfy needs of all stakeholders.
Prior to the 1980s, drinking water from the Catskill/Delaware watersheds and the Croton water
supply system was unfiltered as appropriate management of watershed lands had ensured that
water quality had been consistently good and there was no perceived need for a filtration
facility.
However, by the late 1990s changing laws and land-use impacts prompted NYC to embark on a
$250 million program to acquire and preserve up to 350,000 acres of land in the Catskills
watershed. A combination of federal regulation and cost realities drove NYC to this program.
Under the U.S. federal Safe Drinking Water Act, municipal and other water suppliers must filter
their water supplies unless they can demonstrate that they have taken other steps, including
watershed protection measures that protect their customers from harmful water
contamination. Presented with a choice between building a filtration plant and preserving the
watershed, New York City easily concluded that the latter was more cost effective. New York
City estimated that a filtration plant would cost between $4 billion and $8 billion to build and
another $300,000 annually to operate. By contrast, watershed protection efforts, which would
include not only the acquisition of critical watershed lands but also a variety of other programs
designed to reduce contamination sources in the watershed, would cost only about $1.5 billion.
In the late 1990s, the U.S. Environmental Protection Agency estimated that more than 140 cities
were considering watershed conservation as a means of ensuring high drinking water quality
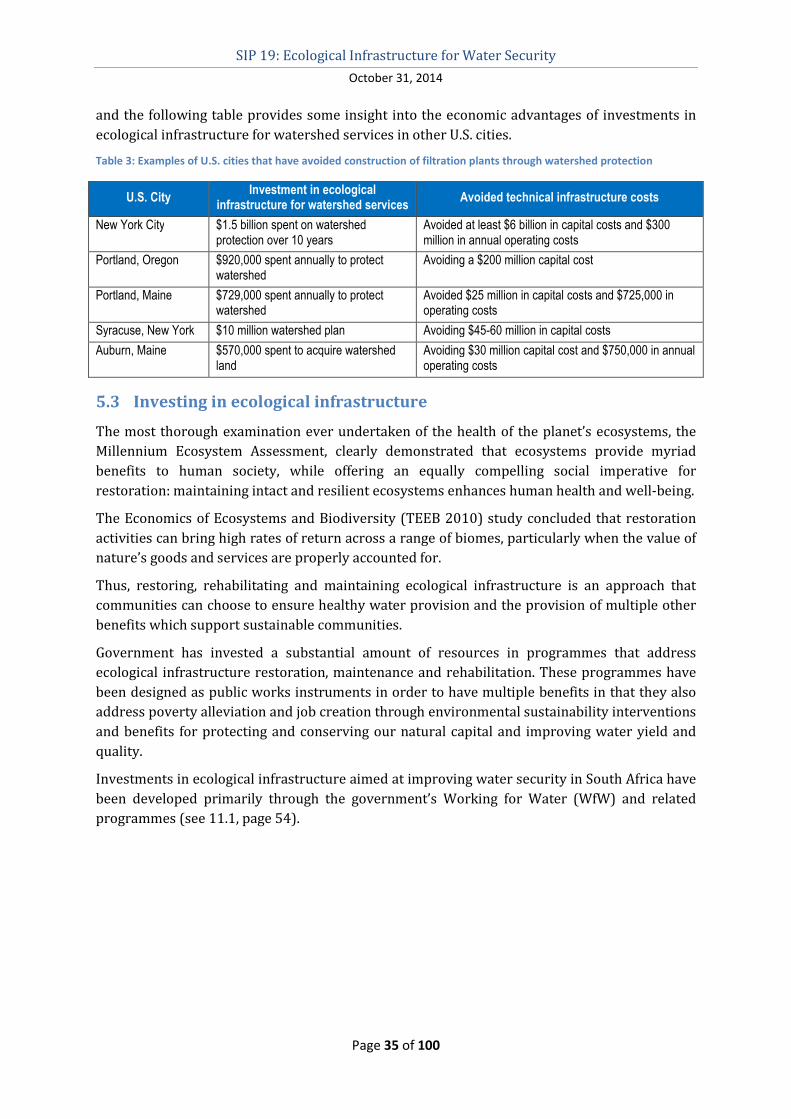
SIP 19: Ecological Infrastructure for Water Security
October 31, 2014
Page 35 of 100
and the following table provides some insight into the economic advantages of investments in
ecological infrastructure for watershed services in other U.S. cities.
Table 3: Examples of U.S. cities that have avoided construction of filtration plants through watershed protection
U.S. City Investment in ecological
infrastructure for watershed services Avoided technical infrastructure costs
New York City $1.5 billion spent on watershed protection over 10 years
Avoided at least $6 billion in capital costs and $300 million in annual operating costs
Portland, Oregon $920,000 spent annually to protect watershed
Avoiding a $200 million capital cost
Portland, Maine $729,000 spent annually to protect watershed
Avoided $25 million in capital costs and $725,000 in operating costs
Syracuse, New York $10 million watershed plan Avoiding $45-60 million in capital costs
Auburn, Maine $570,000 spent to acquire watershed land
Avoiding $30 million capital cost and $750,000 in annual operating costs
5.3 Investing in ecological infrastructure
The most thorough examination ever undertaken of the health of the planet’s ecosystems, the
Millennium Ecosystem Assessment, clearly demonstrated that ecosystems provide myriad
benefits to human society, while offering an equally compelling social imperative for
restoration: maintaining intact and resilient ecosystems enhances human health and well-being.
The Economics of Ecosystems and Biodiversity (TEEB 2010) study concluded that restoration
activities can bring high rates of return across a range of biomes, particularly when the value of
nature’s goods and services are properly accounted for.
Thus, restoring, rehabilitating and maintaining ecological infrastructure is an approach that
communities can choose to ensure healthy water provision and the provision of multiple other
benefits which support sustainable communities.
Government has invested a substantial amount of resources in programmes that address
ecological infrastructure restoration, maintenance and rehabilitation. These programmes have
been designed as public works instruments in order to have multiple benefits in that they also
address poverty alleviation and job creation through environmental sustainability interventions
and benefits for protecting and conserving our natural capital and improving water yield and
quality.
Investments in ecological infrastructure aimed at improving water security in South Africa have
been developed primarily through the government’s Working for Water (WfW) and related
programmes (see 11.1, page 54).
SIP 19: Ecological Infrastructure for Water Security
October 31, 2014
Page 36 of 100
6. SIP 19 GOAL
The overall goal of SIP 19 is –
To significantly contribute to ensuring a sustainable supply of
fresh, healthy water to equitably meet South Africa’s social,
economic and environmental water needs for current and future
generations.
7. SIP 19 PURPOSE
SIP 19 provides a framework for the integration of a number of impactful water-related
ecological infrastructure investments and interventions into a coordinated, coherent and
focussed project specifically aimed at improving South Africa’s water resource quality and
quantity.
Thus, the purpose of SIP 19 is to contribute to the overall goal of ensuring a sustainable supply
of fresh, healthy water to equitably meet South Africa’s social, economic and environmental
water needs for current and future generations through the integrated implementation of
projects within identified priority water catchments that measurably –
• Improve the quantity and/or quality of South Africa’s water resources;
• Reverse the destruction and/or degradation of the ecological infrastructure that provides
watershed services;
• Optimise the use of ecological infrastructure to provide improved watershed services;
• Provide cost effective and high quality alternatives and/or supplements to technological
solutions;
• Provide decent jobs to rural and other communities living close to ecological infrastructure
that provides watershed services;
• Provide appropriate compensation to people and communities that are the custodians of
the ecological infrastructure that provides watershed services;
• Ensure formal legal protection for irreplaceable ecological infrastructure that provides
watershed services;
• Test or pilot novel funding mechanisms, such as the concept of environmental offsetting, as
alternative sources of funding for the managing, maintaining and/or improving the
ecological infrastructure that provides watershed services; and
• Result in a net benefit to the scale and quality of South Africa’s ecological infrastructure that
provides watershed services.
To this end, SIP 19 component projects will focus on:
• Improving river flow –
o Decreasing flood/high flows;
o Improving low flows;
o Improving sustainable yield from existing and new water infrastructure, and

SIP 19: Ecological Infrastructure for Water Security
October 31, 2014
Page 37 of 100
o Improving the implementation of Resource Directed Measures, such as the Ecological
Reserve, through, among others, the restoration and improvement of land management
practices and the control of invasive alien plants.
• Reducing sediment loads
o Reducing siltation of rivers, dams and other infrastructure through, among others,
restoration, improvement of land management practices and the control of invasive alien
plants.
• Optimising Water quality
o Optimising water quality to minimize purification costs;
o Minimising waterweeds, and
o Optimising water quality in areas where water is extracted from rivers in order to
minimize health risks through restoration, improvement of land management practices
and the control of invasive alien plants.
In summary, as far as water related provisioning and regulating services are concerned, the
focus of SIP 19 is on investments in ecological infrastructure which regularise flows; decrease
floods; improve low flows (dry season flows); improve yield from existing and new water
infrastructure, and enable implementation of the Ecological Reserve (the portion of stream flow
which must remain in a river to ensure the sustainable and healthy functioning of the river and
its wetlands); reduce sediments and siltation of rivers, dams and other infrastructure; optimize
water quality for ecological functioning and human health considerations (including thermal
Figure 9: Graphical representation of the types of interventions falling under SIP 19 and their possible positive impacts
on ecosystem services and human well-being.
SIP 19: Ecological Infrastructure for Water Security
October 31, 2014
Page 38 of 100
pollution, eutrophication and turbidity); optimize water quality to minimize purification costs;
minimize the impact of waterweeds on water reticulation systems, and optimize water quality
in areas where water is extracted from rivers in order to minimize health risks.
7.1 SIP 19 and regulatory streamlining and intergovernmental
coordination
One of the explicit reasons for existence of the SIPs is to identify challenges impeding or
delaying implementation of the component projects, and identify associated remedial actions
required. This includes identifying, “any legislation and other regulatory measures that impede
or may impede infrastructure development, and advise the executive authority of the relevant
sphere of government” (Infrastructure Development Act, section 4(g)(ii)). Regulatory obstacles,
and lack of intergovernmental coordination to address these, is thus a specific focus of many
SIPs.
The same is true of SIP 19, which has the potential to play an immensely valuable role in
unblocking regulatory delays relating to typical activities undertaken by its component projects.
For example, many rehabilitation activities, especially those undertaken in wetlands, require
authorisation under both water and environmental legislation despite being activities that have
a net positive effect on the environment.
Compliance with the current regulatory regime has both cost and time implications, and while it
is necessary to undertake the necessary due diligence on rehabilitation activities, there is
further potential for regulatory decision-making to be streamlined and coordinated between the
relevant departments. This would have the effect of reducing the time and cost incurred in the
planning of rehabilitation interventions, thereby freeing up additional resources for
implementation and accelerating projects’ performance, without undermining legal compliance.
In the case of the EPWP-related projects, this often translates to the ability to create additional
work opportunities and to keep people employed for a longer duration.
A further key purpose for SIP 19 lies in its potential to improve intergovernmental coordination,
both horizontally between sector departments within spheres, as well as between all three
spheres of government. The Infrastructure Development Act (section 4(e)) emphasises the role
of the SIPs in ensuring “co-operation between organs of state affected by projects undertaken”.
The environment is assigned by the Constitution as functional areas of concurrent national and
provincial competence, thus requiring a high degree of political, administrative and technical
coordination between these spheres. Given the multi-faceted and cross-cutting nature of the
environment, governance in this sector must be strong and integrated if it is to be effective.
The implementation of emerging novel mechanisms for compensating for legally-sanctioned
unavoidable, residual environmental impacts of development activities will also benefit from
the governance-enhancing role played by SIP 19. Offsets are a potentially significant funding
stream for investing in ecological infrastructure, and policy development in the water and
environmental sectors in relation to these mechanisms is already at an advanced stage.
SIP 19: Ecological Infrastructure for Water Security
October 31, 2014
Page 39 of 100
8. SIP 19 AND THE REQUIREMENTS FOR STRATEGIC INTEGRATED
PROJECTS
Section 7 of the Infrastructure Development Act, 2014 (Act 23 of 2014) outlines the criteria that
a project or group of projects must comply with in order to qualify as a SIP. A project or group of
projects is eligible if:
(a) it comprises of one or more installation, structure, facility, system, service or process
relating to any matter specified in Schedule 1 if it ;
(b) it complies with any of the following criteria:
i. It would be of significant economic or social importance to the Republic;
ii. it would contribute substantially to any national strategy or policy relating to
infrastructure development; or
iii. it is above a certain monetary value determined by the Commission; and
(c) the Commission has included the project in the national infrastructure plan and has, in
terms of section 8, designated the project as a strategic infrastructure project.
In relation to criterion (a), there are a number of “matters” specified in Schedule 1 of the Act
that are directly supplemented, enhanced and sustained through the activites of SIP 19. These
include human settlements and related infrastructure and facilities; productive rural and
agricultural infrastructure; and water works and water infrastructure. In addition to these, the
role of healthy ecological infrastructure in disaster risk reduction will also be of direct relevance
to the lifespan and maintenance costs of other Schedule 1 matters like public roads, railways
and sewage works.
The Constitution asserts that everyone has the right to an environment that is not harmful to
their health or well-being; and to have the environment protected for the benefit of present and
future generations. In giving effect to these rights and principles, the National Environmental
Management Act (1998) states that “sustainable development requires the integration of social,
economic and environmental factors in the planning, implementation and evaluation of
decisions to ensure that development serves present and future generations”. Thinking around
sustainable development has evolved to the point where the traditional conception of
environment as a nested component within economy has been inverted and the environment is
now recognised as underpinning all social and economic development. In this respect, it can
certainly be argued that maintenance and rehabilitation of ecological infrastructure, and the
healthy environment this contributes to, is of “of significant economic or social importance to
the Republic”, as outlined in criterion (b) above.
The national strategy or policy relating to infrastructure development, referred to in criterion
(b), to which SIP 19 would most closely align is the recently published National Water
Resources Strategy (NWRS) 2 and its overarching policy framework. The NWRS 2 provides the
framework for the protection, use, development, conservation, management and control of
water resources for the country as a whole. It was also the first policy instrument in South
Africa to formally recognise the role and value of ecological infrastructure in supporting
developmental objectives. In her foreword, the Minister argues that, “There can be no growth
and development without water, so water must be at the heart of all our planning, financing and
governance frameworks.” An entire chapter of the NWRS 2 is dedicated to water resource
SIP 19: Ecological Infrastructure for Water Security
October 31, 2014
Page 40 of 100
protection as one of the mechanisms for ensuring that water contributes to on-going growth
and development. The restoration and maintenance of water-related ecological infrastructure is
explicitly recognised as a key component of this approach.
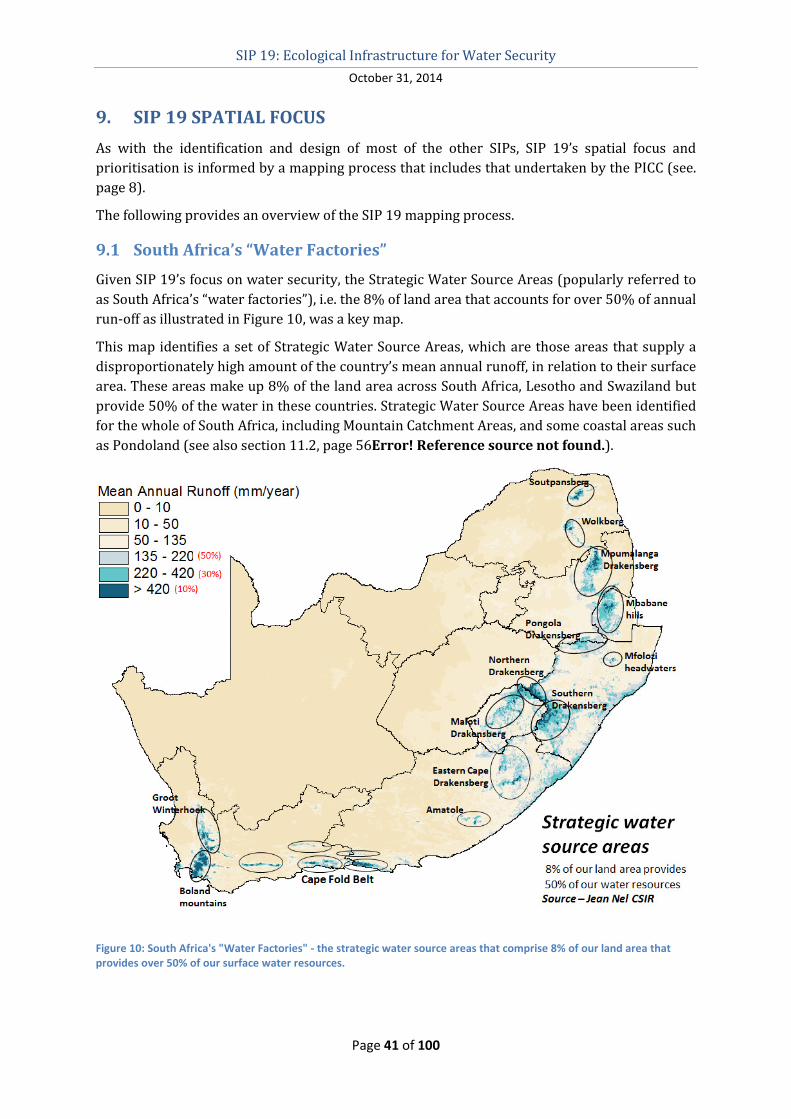
SIP 19: Ecological Infrastructure for Water Security
October 31, 2014
Page 41 of 100
9. SIP 19 SPATIAL FOCUS
As with the identification and design of most of the other SIPs, SIP 19’s spatial focus and
prioritisation is informed by a mapping process that includes that undertaken by the PICC (see.
page 8).
The following provides an overview of the SIP 19 mapping process.
9.1 South Africa’s “Water Factories”
Given SIP 19’s focus on water security, the Strategic Water Source Areas (popularly referred to
as South Africa’s “water factories”), i.e. the 8% of land area that accounts for over 50% of annual
run-off as illustrated in Figure 10, was a key map.
This map identifies a set of Strategic Water Source Areas, which are those areas that supply a
disproportionately high amount of the country’s mean annual runoff, in relation to their surface
area. These areas make up 8% of the land area across South Africa, Lesotho and Swaziland but
provide 50% of the water in these countries. Strategic Water Source Areas have been identified
for the whole of South Africa, including Mountain Catchment Areas, and some coastal areas such
as Pondoland (see also section 11.2, page 56Error! Reference source not found.).
Figure 10: South Africa's "Water Factories" - the strategic water source areas that comprise 8% of our land area that
provides over 50% of our surface water resources.
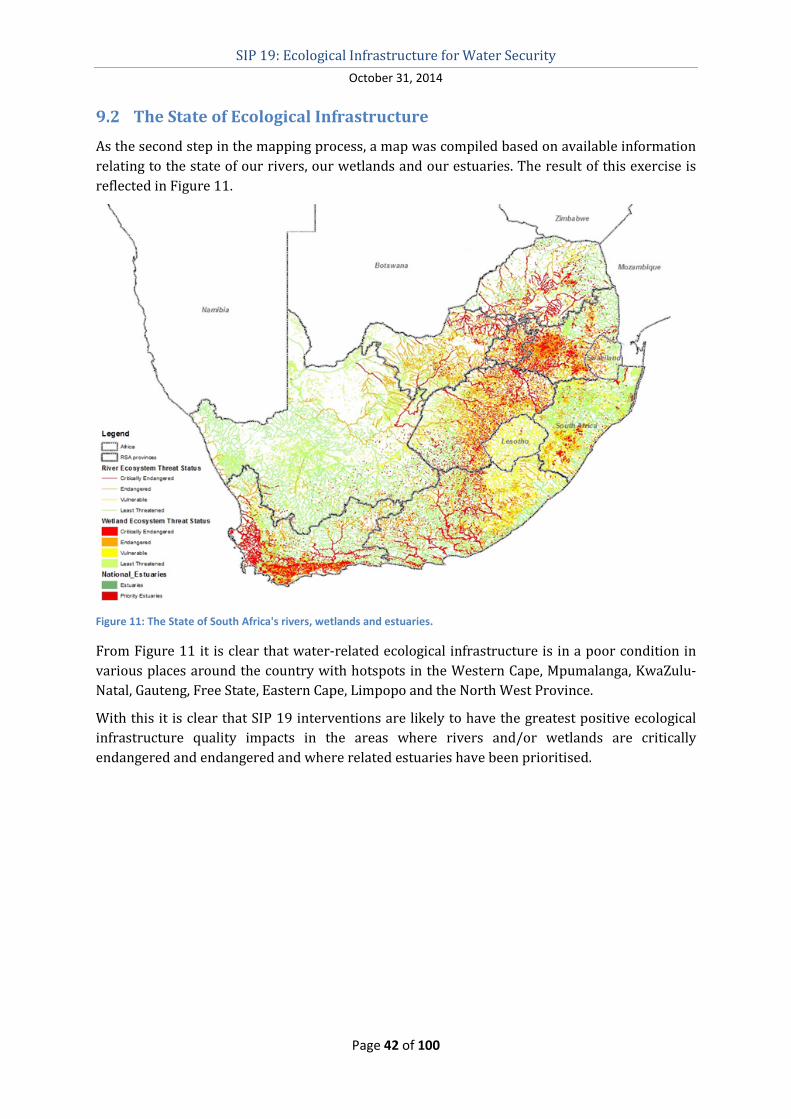
SIP 19: Ecological Infrastructure for Water Security
October 31, 2014
Page 42 of 100
9.2 The State of Ecological Infrastructure
As the second step in the mapping process, a map was compiled based on available information
relating to the state of our rivers, our wetlands and our estuaries. The result of this exercise is
reflected in Figure 11.
Figure 11: The State of South Africa's rivers, wetlands and estuaries.
From Figure 11 it is clear that water-related ecological infrastructure is in a poor condition in
various places around the country with hotspots in the Western Cape, Mpumalanga, KwaZulu-
Natal, Gauteng, Free State, Eastern Cape, Limpopo and the North West Province.
With this it is clear that SIP 19 interventions are likely to have the greatest positive ecological
infrastructure quality impacts in the areas where rivers and/or wetlands are critically
endangered and endangered and where related estuaries have been prioritised.
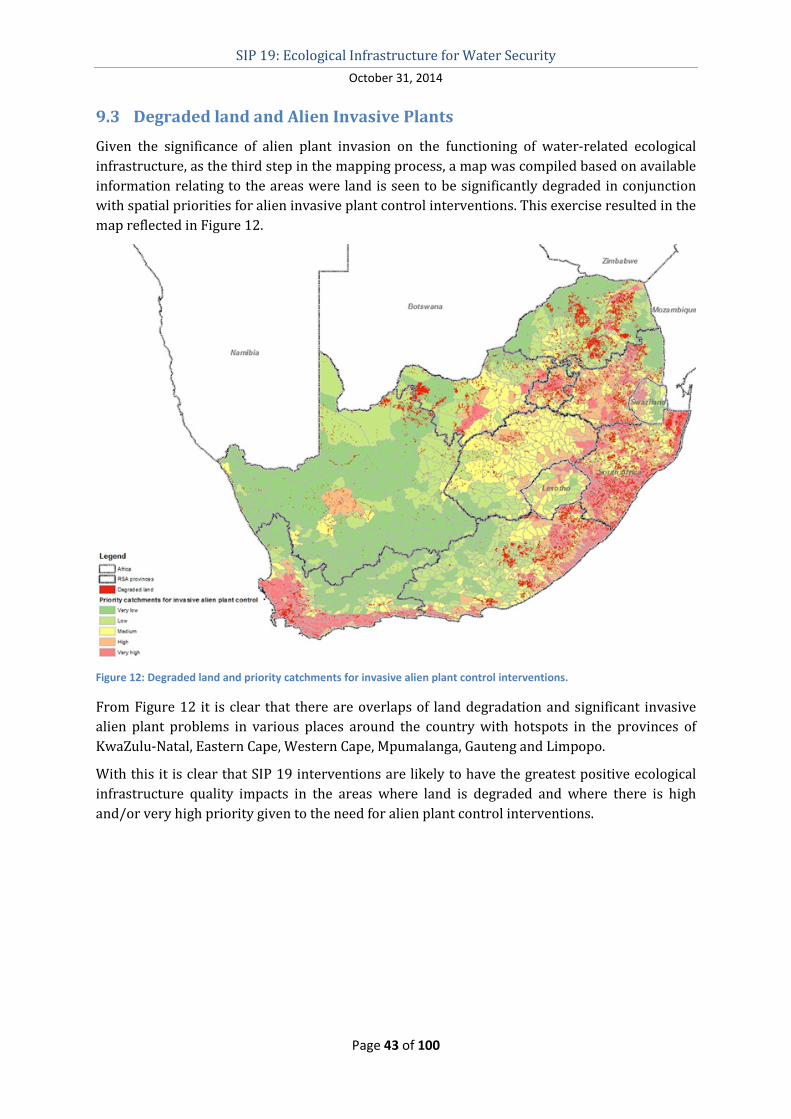
SIP 19: Ecological Infrastructure for Water Security
October 31, 2014
Page 43 of 100
9.3 Degraded land and Alien Invasive Plants
Given the significance of alien plant invasion on the functioning of water-related ecological
infrastructure, as the third step in the mapping process, a map was compiled based on available
information relating to the areas were land is seen to be significantly degraded in conjunction
with spatial priorities for alien invasive plant control interventions. This exercise resulted in the
map reflected in Figure 12.
Figure 12: Degraded land and priority catchments for invasive alien plant control interventions.
From Figure 12 it is clear that there are overlaps of land degradation and significant invasive
alien plant problems in various places around the country with hotspots in the provinces of
KwaZulu-Natal, Eastern Cape, Western Cape, Mpumalanga, Gauteng and Limpopo.
With this it is clear that SIP 19 interventions are likely to have the greatest positive ecological
infrastructure quality impacts in the areas where land is degraded and where there is high
and/or very high priority given to the need for alien plant control interventions.
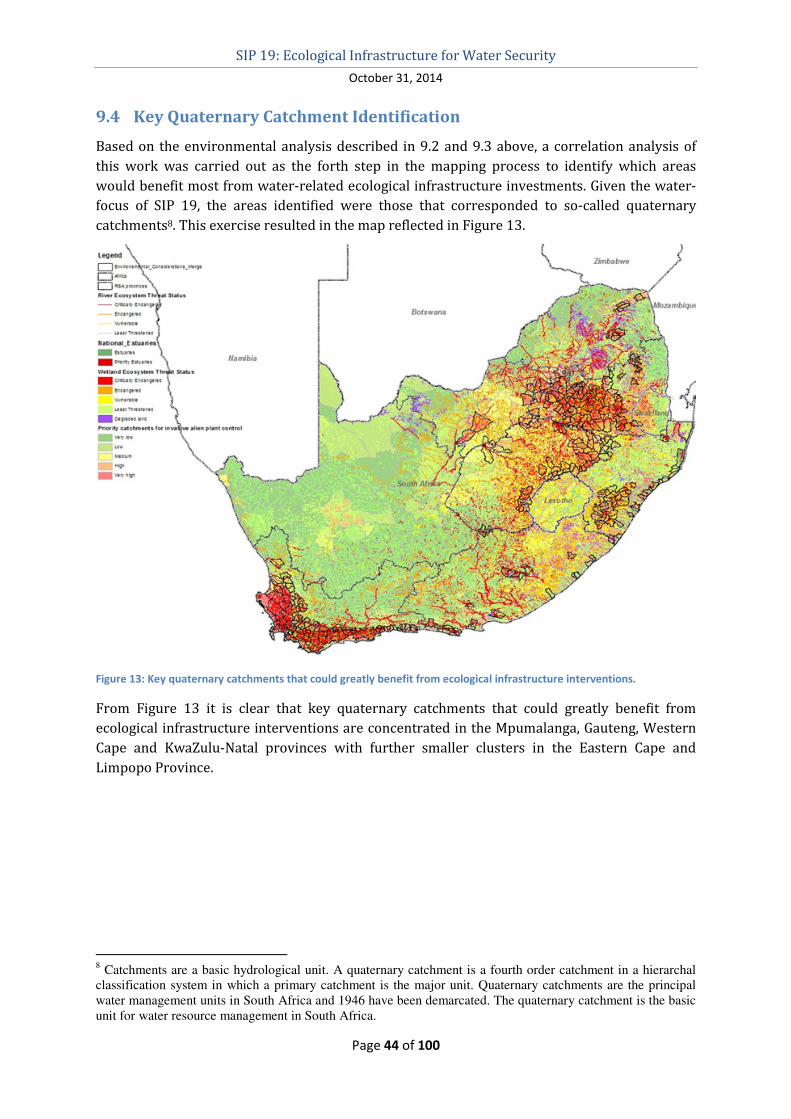
SIP 19: Ecological Infrastructure for Water Security
October 31, 2014
Page 44 of 100
9.4 Key Quaternary Catchment Identification
Based on the environmental analysis described in 9.2 and 9.3 above, a correlation analysis of
this work was carried out as the forth step in the mapping process to identify which areas
would benefit most from water-related ecological infrastructure investments. Given the water-
focus of SIP 19, the areas identified were those that corresponded to so-called quaternary
catchments8. This exercise resulted in the map reflected in Figure 13.
Figure 13: Key quaternary catchments that could greatly benefit from ecological infrastructure interventions.
From Figure 13 it is clear that key quaternary catchments that could greatly benefit from
ecological infrastructure interventions are concentrated in the Mpumalanga, Gauteng, Western
Cape and KwaZulu-Natal provinces with further smaller clusters in the Eastern Cape and
Limpopo Province.
8 Catchments are a basic hydrological unit. A quaternary catchment is a fourth order catchment in a hierarchal
classification system in which a primary catchment is the major unit. Quaternary catchments are the principal
water management units in South Africa and 1946 have been demarcated. The quaternary catchment is the basic
unit for water resource management in South Africa.

SIP 19: Ecological Infrastructure for Water Security
October 31, 2014
Page 45 of 100
9.5 Poverty and Service Delivery
With a view to addressing spatial imbalances, especially in relation to poverty and levels of
public services, as the fifth step in the mapping process, a map was compiled based on available
information from the general SIP mapping exercise relating to public service levels and
Minimum Living Levels9. These spatial variables were then correlated with the Key Quaternary
Catchments identified in 9.4. This exercise resulted in the map reflected in Figure 14.
Figure 14: Correlation between Key SIP 19 Quaternary Catchments, poorly serviced areas and poverty levels.
From Figure 14 it is clear that there are significant overlaps of key SIP 19 quaternary
catchments, poorly serviced areas and high levels of poverty in various places around the
country with hotspots in the KwaZulu-Natal, Gauteng, Eastern Cape, Western Cape,
Mpumalanga, and Limpopo Province.
9 The Minimum Living Level (MLL) reflects the minimum income required to sustain a household and varies in
accordance with household size – the larger the household, the larger the income required to keep its members
out of poverty. The MLL includes the following items: Food; Clothing; Compulsory payments to local
authorities in respect of rent, miscellaneous services, water and electricity; Fuel and light; Washing and cleaning
materials; Education; Transport; Contributions to medical funds and medical and dental expenses; Replacement
of household equipment; Taxes; and Support of relatives (applicable only to singles).
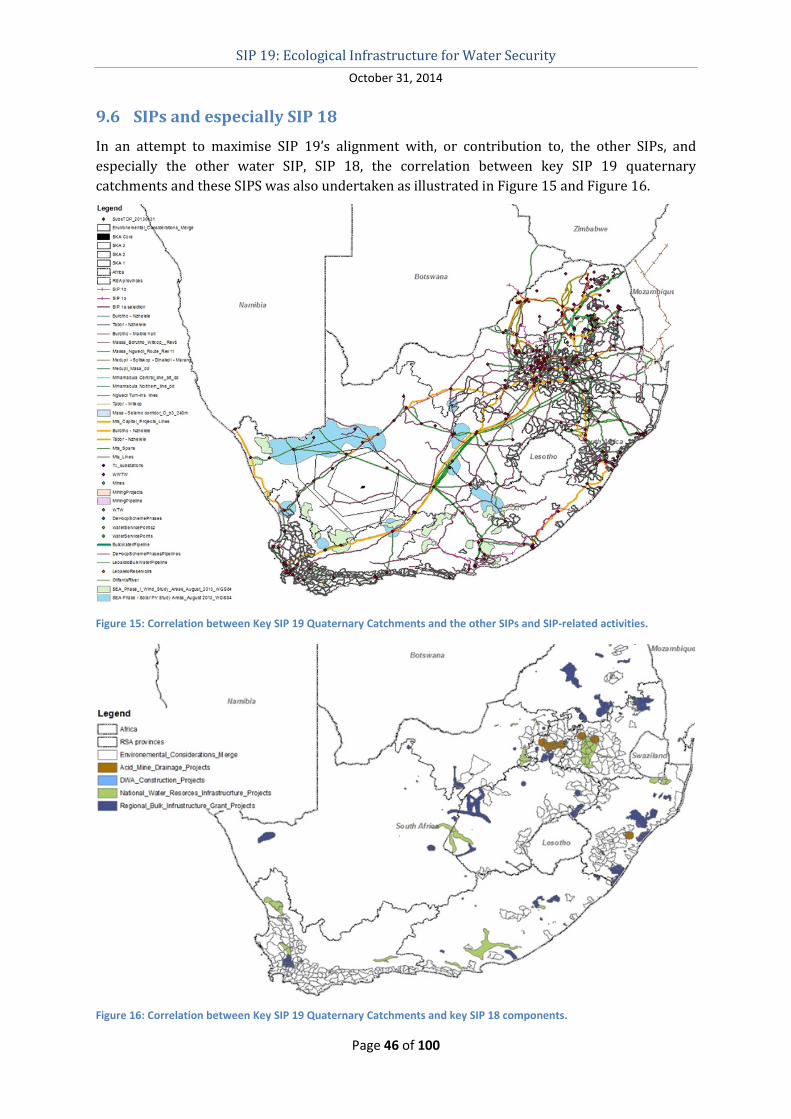
SIP 19: Ecological Infrastructure for Water Security
October 31, 2014
Page 46 of 100
9.6 SIPs and especially SIP 18
In an attempt to maximise SIP 19’s alignment with, or contribution to, the other SIPs, and
especially the other water SIP, SIP 18, the correlation between key SIP 19 quaternary
catchments and these SIPS was also undertaken as illustrated in Figure 15 and Figure 16.
Figure 15: Correlation between Key SIP 19 Quaternary Catchments and the other SIPs and SIP-related activities.
Figure 16: Correlation between Key SIP 19 Quaternary Catchments and key SIP 18 components.
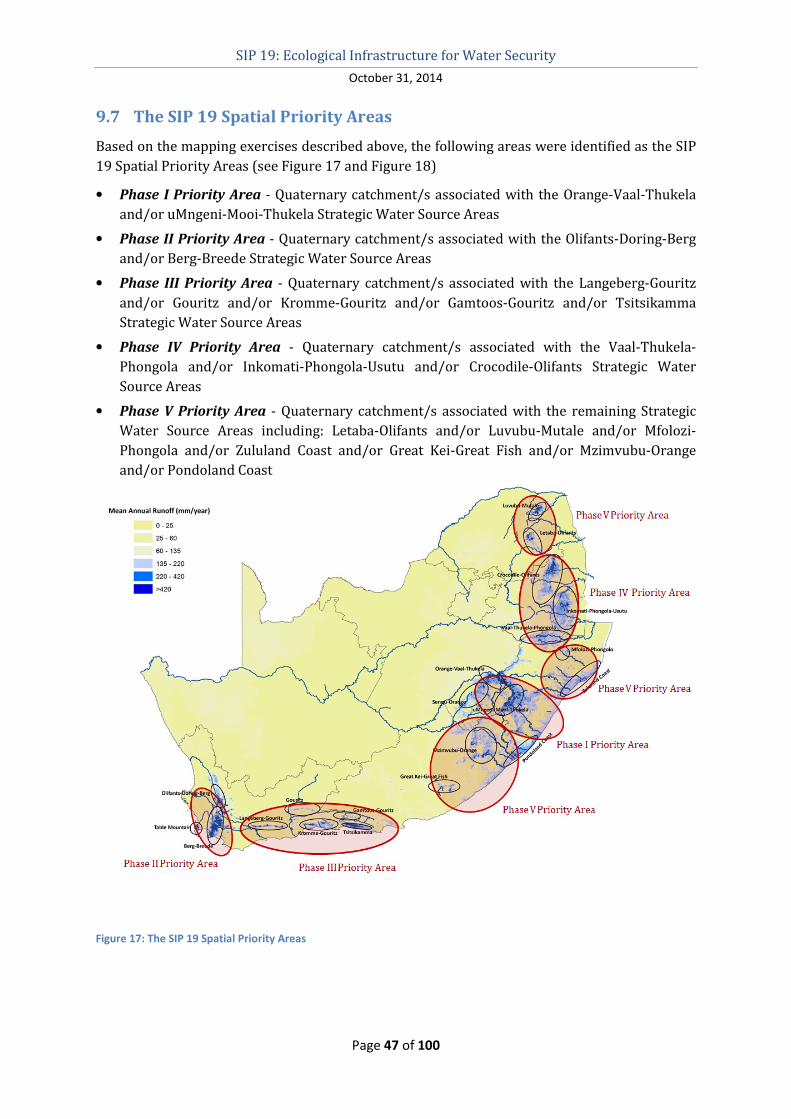
SIP 19: Ecological Infrastructure for Water Security
October 31, 2014
Page 47 of 100
9.7 The SIP 19 Spatial Priority Areas
Based on the mapping exercises described above, the following areas were identified as the SIP
19 Spatial Priority Areas (see Figure 17 and Figure 18)
• Phase I Priority Area - Quaternary catchment/s associated with the Orange-Vaal-Thukela
and/or uMngeni-Mooi-Thukela Strategic Water Source Areas
• Phase II Priority Area - Quaternary catchment/s associated with the Olifants-Doring-Berg
and/or Berg-Breede Strategic Water Source Areas
• Phase III Priority Area - Quaternary catchment/s associated with the Langeberg-Gouritz
and/or Gouritz and/or Kromme-Gouritz and/or Gamtoos-Gouritz and/or Tsitsikamma
Strategic Water Source Areas
• Phase IV Priority Area - Quaternary catchment/s associated with the Vaal-Thukela-
Phongola and/or Inkomati-Phongola-Usutu and/or Crocodile-Olifants Strategic Water
Source Areas
• Phase V Priority Area - Quaternary catchment/s associated with the remaining Strategic
Water Source Areas including: Letaba-Olifants and/or Luvubu-Mutale and/or Mfolozi-
Phongola and/or Zululand Coast and/or Great Kei-Great Fish and/or Mzimvubu-Orange
and/or Pondoland Coast
Figure 17: The SIP 19 Spatial Priority Areas
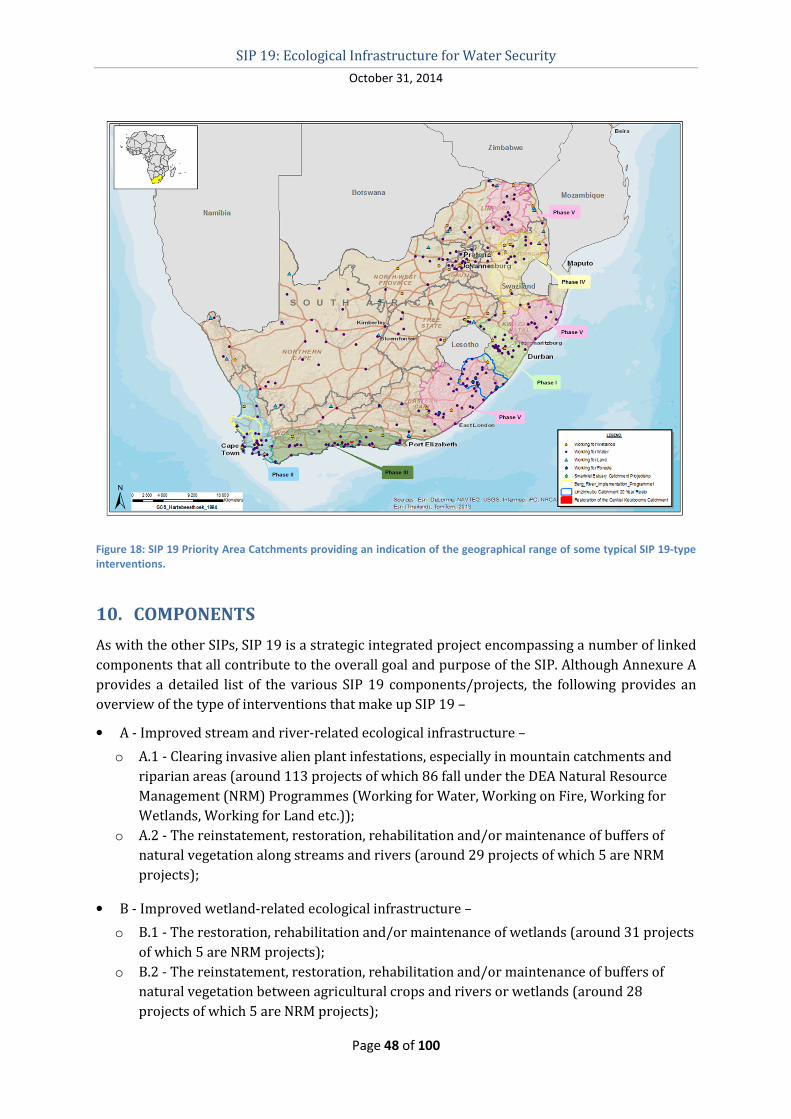
SIP 19: Ecological Infrastructure for Water Security
October 31, 2014
Page 48 of 100
Figure 18: SIP 19 Priority Area Catchments providing an indication of the geographical range of some typical SIP 19-type
interventions.
10. COMPONENTS
As with the other SIPs, SIP 19 is a strategic integrated project encompassing a number of linked
components that all contribute to the overall goal and purpose of the SIP. Although Annexure A
provides a detailed list of the various SIP 19 components/projects, the following provides an
overview of the type of interventions that make up SIP 19 –
• A - Improved stream and river-related ecological infrastructure –
o A.1 - Clearing invasive alien plant infestations, especially in mountain catchments and
riparian areas (around 113 projects of which 86 fall under the DEA Natural Resource
Management (NRM) Programmes (Working for Water, Working on Fire, Working for
Wetlands, Working for Land etc.));
o A.2 - The reinstatement, restoration, rehabilitation and/or maintenance of buffers of
natural vegetation along streams and rivers (around 29 projects of which 5 are NRM
projects);
• B - Improved wetland-related ecological infrastructure –
o B.1 - The restoration, rehabilitation and/or maintenance of wetlands (around 31 projects
of which 5 are NRM projects);
o B.2 - The reinstatement, restoration, rehabilitation and/or maintenance of buffers of
natural vegetation between agricultural crops and rivers or wetlands (around 28
projects of which 5 are NRM projects);
SIP 19: Ecological Infrastructure for Water Security
October 31, 2014
Page 49 of 100
• C - Improved estuary-related ecological infrastructure (around 3 specific projects)–
o C.1 - Clearing invasive alien plant infestations;
o C.2 - The restoration, rehabilitation and/or maintenance of estuaries;
o C.3 - The reinstatement, restoration, rehabilitation, establishment and/or maintenance of
buffers of natural vegetation along estuaries
• D - Improved agriculture-impacted ecological infrastructure –
o D.1 - The improvement in rangeland management practices (e.g. grazing regime and
improved fire management) (around 23 projects of which 4 are NRM projects);
o D.2 - The improvement of agricultural practices (e.g. improved tillage, contour ploughing,
organic agriculture, etc.) (around 19 projects of which none are NRM projects);
• E - The conservation and protection of irreplaceable ecological infrastructure –
o E.1 - The formal protection of key catchment areas as part of the expansion of South
Africa’s conservation estate (around 3 projects of which none are NRM projects);
o E.2 - The reinstatement, restoration, rehabilitation and/or maintenance of grass- and
wood-lands, especially in upper-catchment areas (around 8 projects of which 5 are NRM
projects);
o E.3 - Clearing invasive alien plant infestations in protected catchment areas (around 90
projects of which 86 are NRM projects);
• F - The rehabilitation of mining-impacted ecological infrastructure and/or development of
synthetic ecological10 infrastructure –
o F.1 - The establishment of natural filtration infrastructure, i.e. built wetlands, to purify
various small sources of polluted inflows into streams and rivers (e.g. acid mine drainage
(AMD) from old mining works, livestock farms, waste dumps, etc.) (around 8 projects of
which none are NRM projects);
o F.2 - The rehabilitation of land affected by derelict and ownerless mines (around 2
projects of which none are NRM projects)
• G - Ecological infrastructure for water security research and development (around 20
projects of which none are NRM projects).
Although South Africa has a lot of experience in implementing many of the specific interventions
listed above, the rehabilitation, reinstatement and/or restoration of natural ecological
infrastructure and/or the development of synthetic ecological infrastructure is a growing and
evolving area of interest. Hence, unlike the other SIPs, SIP 19 specifically contains a research
and development component aimed at continuously improving the efficiency and effectiveness
of SIP 19 interventions. In this regard, the Water Research Commission (WRC) has agreed to
play a leading role and has already made significant contributions in this regard (see below for
examples).
10
This is a form of built infrastructure that, for the purpose of this document, is distinguished from natural
ecological infrastructure through its use of biomimicry approaches that incorporate natural principles and
processes into technological solutions e.g. constructed/artificial wetlands that replicate physical and chemical
processes found in natural wetlands, in order to purify water.
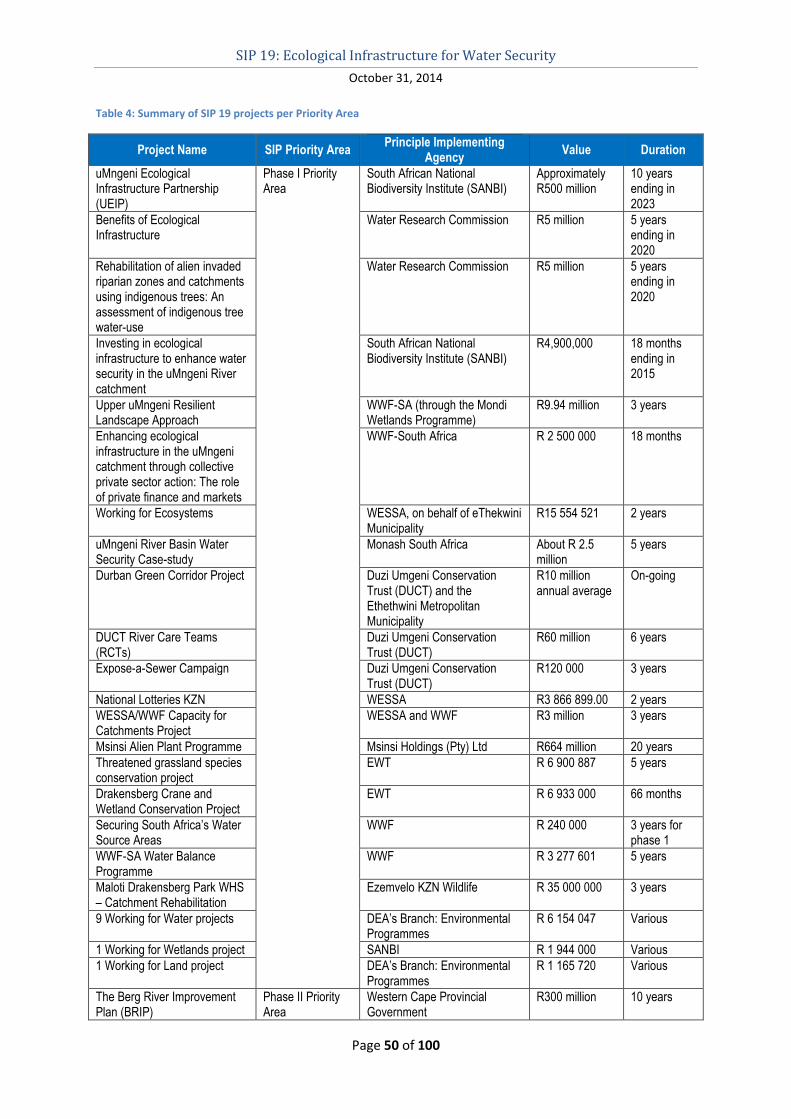
SIP 19: Ecological Infrastructure for Water Security
October 31, 2014
Page 50 of 100
Table 4: Summary of SIP 19 projects per Priority Area
Project Name SIP Priority Area Principle Implementing
Agency Value Duration
uMngeni Ecological Infrastructure Partnership (UEIP)
Phase I Priority Area
South African National Biodiversity Institute (SANBI)
Approximately R500 million
10 years ending in 2023
Benefits of Ecological Infrastructure
Water Research Commission R5 million 5 years ending in 2020
Rehabilitation of alien invaded riparian zones and catchments using indigenous trees: An assessment of indigenous tree water-use
Water Research Commission R5 million 5 years ending in 2020
Investing in ecological infrastructure to enhance water security in the uMngeni River catchment
South African National Biodiversity Institute (SANBI)
R4,900,000 18 months ending in 2015
Upper uMngeni Resilient Landscape Approach
WWF-SA (through the Mondi Wetlands Programme)
R9.94 million 3 years
Enhancing ecological infrastructure in the uMngeni catchment through collective private sector action: The role of private finance and markets
WWF-South Africa R 2 500 000 18 months
Working for Ecosystems WESSA, on behalf of eThekwini Municipality
R15 554 521 2 years
uMngeni River Basin Water Security Case-study
Monash South Africa About R 2.5 million
5 years
Durban Green Corridor Project Duzi Umgeni Conservation Trust (DUCT) and the Ethethwini Metropolitan Municipality
R10 million annual average
On-going
DUCT River Care Teams (RCTs)
Duzi Umgeni Conservation Trust (DUCT)
R60 million 6 years
Expose-a-Sewer Campaign Duzi Umgeni Conservation Trust (DUCT)
R120 000 3 years
National Lotteries KZN WESSA R3 866 899.00 2 years WESSA/WWF Capacity for Catchments Project
WESSA and WWF R3 million 3 years
Msinsi Alien Plant Programme Msinsi Holdings (Pty) Ltd R664 million 20 years Threatened grassland species conservation project
EWT R 6 900 887 5 years
Drakensberg Crane and Wetland Conservation Project
EWT R 6 933 000 66 months
Securing South Africa’s Water Source Areas
WWF R 240 000 3 years for phase 1
WWF-SA Water Balance Programme
WWF R 3 277 601 5 years
Maloti Drakensberg Park WHS – Catchment Rehabilitation
Ezemvelo KZN Wildlife R 35 000 000 3 years
9 Working for Water projects DEA’s Branch: Environmental Programmes
R 6 154 047 Various
1 Working for Wetlands project SANBI R 1 944 000 Various 1 Working for Land project DEA’s Branch: Environmental
Programmes R 1 165 720 Various
The Berg River Improvement Plan (BRIP)
Phase II Priority Area
Western Cape Provincial Government
R300 million 10 years
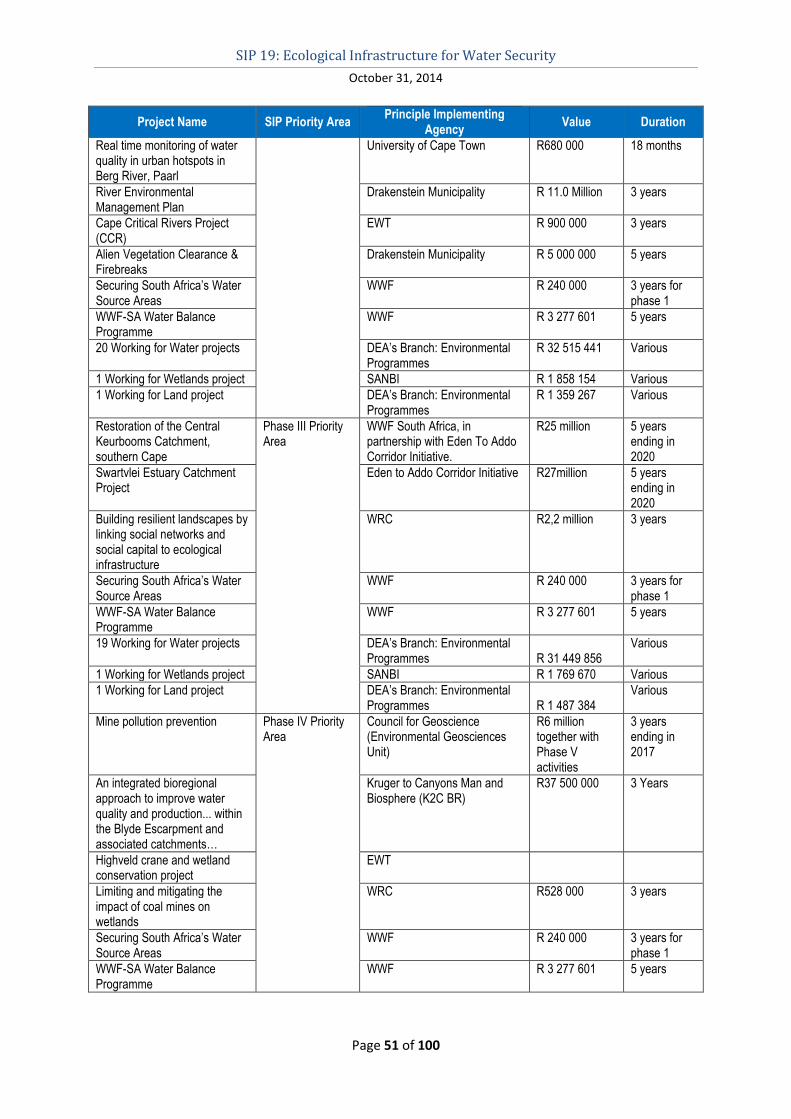
SIP 19: Ecological Infrastructure for Water Security
October 31, 2014
Page 51 of 100
Project Name SIP Priority Area Principle Implementing
Agency Value Duration
Real time monitoring of water quality in urban hotspots in Berg River, Paarl
University of Cape Town R680 000 18 months
River Environmental Management Plan
Drakenstein Municipality R 11.0 Million 3 years
Cape Critical Rivers Project (CCR)
EWT R 900 000 3 years
Alien Vegetation Clearance & Firebreaks
Drakenstein Municipality R 5 000 000 5 years
Securing South Africa’s Water Source Areas
WWF R 240 000 3 years for phase 1
WWF-SA Water Balance Programme
WWF R 3 277 601 5 years
20 Working for Water projects DEA’s Branch: Environmental Programmes
R 32 515 441 Various
1 Working for Wetlands project SANBI R 1 858 154 Various 1 Working for Land project DEA’s Branch: Environmental
Programmes R 1 359 267 Various
Restoration of the Central Keurbooms Catchment, southern Cape
Phase III Priority Area
WWF South Africa, in partnership with Eden To Addo Corridor Initiative.
R25 million 5 years ending in 2020
Swartvlei Estuary Catchment Project
Eden to Addo Corridor Initiative R27million 5 years ending in 2020
Building resilient landscapes by linking social networks and social capital to ecological infrastructure
WRC R2,2 million 3 years
Securing South Africa’s Water Source Areas
WWF R 240 000 3 years for phase 1
WWF-SA Water Balance Programme
WWF R 3 277 601 5 years
19 Working for Water projects DEA’s Branch: Environmental Programmes R 31 449 856
Various
1 Working for Wetlands project SANBI R 1 769 670 Various 1 Working for Land project DEA’s Branch: Environmental
Programmes R 1 487 384 Various
Mine pollution prevention Phase IV Priority Area
Council for Geoscience (Environmental Geosciences Unit)
R6 million together with Phase V activities
3 years ending in 2017
An integrated bioregional approach to improve water quality and production... within the Blyde Escarpment and associated catchments…
Kruger to Canyons Man and Biosphere (K2C BR)
R37 500 000 3 Years
Highveld crane and wetland conservation project
EWT
Limiting and mitigating the impact of coal mines on wetlands
WRC R528 000 3 years
Securing South Africa’s Water Source Areas
WWF R 240 000 3 years for phase 1
WWF-SA Water Balance Programme
WWF R 3 277 601 5 years
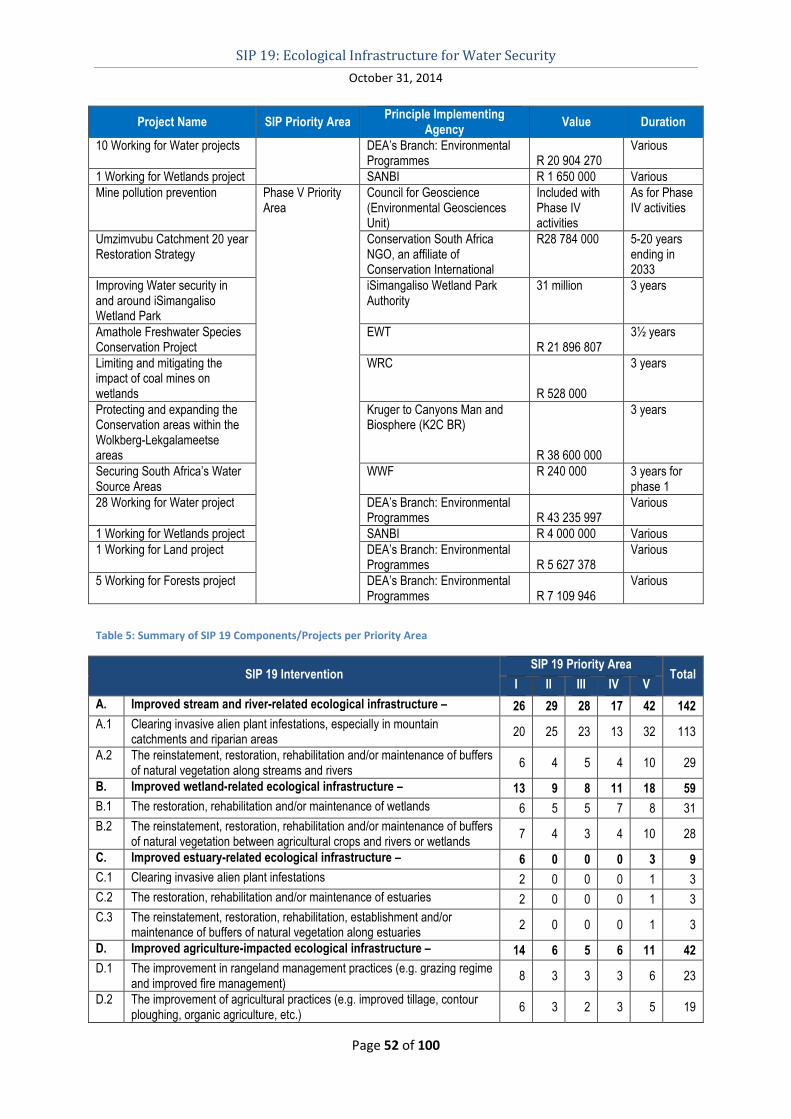
SIP 19: Ecological Infrastructure for Water Security
October 31, 2014
Page 52 of 100
Project Name SIP Priority Area Principle Implementing
Agency Value Duration
10 Working for Water projects DEA’s Branch: Environmental Programmes R 20 904 270
Various
1 Working for Wetlands project SANBI R 1 650 000 Various Mine pollution prevention Phase V Priority
Area Council for Geoscience (Environmental Geosciences Unit)
Included with Phase IV activities
As for Phase IV activities
Umzimvubu Catchment 20 year Restoration Strategy
Conservation South Africa NGO, an affiliate of Conservation International
R28 784 000 5-20 years ending in 2033
Improving Water security in and around iSimangaliso Wetland Park
iSimangaliso Wetland Park Authority
31 million 3 years
Amathole Freshwater Species Conservation Project
EWT R 21 896 807
3½ years
Limiting and mitigating the impact of coal mines on wetlands
WRC
R 528 000
3 years
Protecting and expanding the Conservation areas within the Wolkberg-Lekgalameetse areas
Kruger to Canyons Man and Biosphere (K2C BR)
R 38 600 000
3 years
Securing South Africa’s Water Source Areas
WWF R 240 000 3 years for phase 1
28 Working for Water project DEA’s Branch: Environmental Programmes R 43 235 997
Various
1 Working for Wetlands project SANBI R 4 000 000 Various 1 Working for Land project DEA’s Branch: Environmental
Programmes R 5 627 378 Various
5 Working for Forests project DEA’s Branch: Environmental Programmes R 7 109 946
Various
Table 5: Summary of SIP 19 Components/Projects per Priority Area
SIP 19 Intervention SIP 19 Priority Area
Total I II III IV V
A. Improved stream and river-related ecological infrastructure – 26 29 28 17 42 142
A.1 Clearing invasive alien plant infestations, especially in mountain catchments and riparian areas
20 25 23 13 32 113
A.2 The reinstatement, restoration, rehabilitation and/or maintenance of buffers of natural vegetation along streams and rivers
6 4 5 4 10 29
B. Improved wetland-related ecological infrastructure – 13 9 8 11 18 59
B.1 The restoration, rehabilitation and/or maintenance of wetlands 6 5 5 7 8 31
B.2 The reinstatement, restoration, rehabilitation and/or maintenance of buffers of natural vegetation between agricultural crops and rivers or wetlands
7 4 3 4 10 28
C. Improved estuary-related ecological infrastructure – 6 0 0 0 3 9
C.1 Clearing invasive alien plant infestations 2 0 0 0 1 3
C.2 The restoration, rehabilitation and/or maintenance of estuaries 2 0 0 0 1 3
C.3 The reinstatement, restoration, rehabilitation, establishment and/or maintenance of buffers of natural vegetation along estuaries
2 0 0 0 1 3
D. Improved agriculture-impacted ecological infrastructure – 14 6 5 6 11 42
D.1 The improvement in rangeland management practices (e.g. grazing regime and improved fire management)
8 3 3 3 6 23
D.2 The improvement of agricultural practices (e.g. improved tillage, contour ploughing, organic agriculture, etc.)
6 3 2 3 5 19
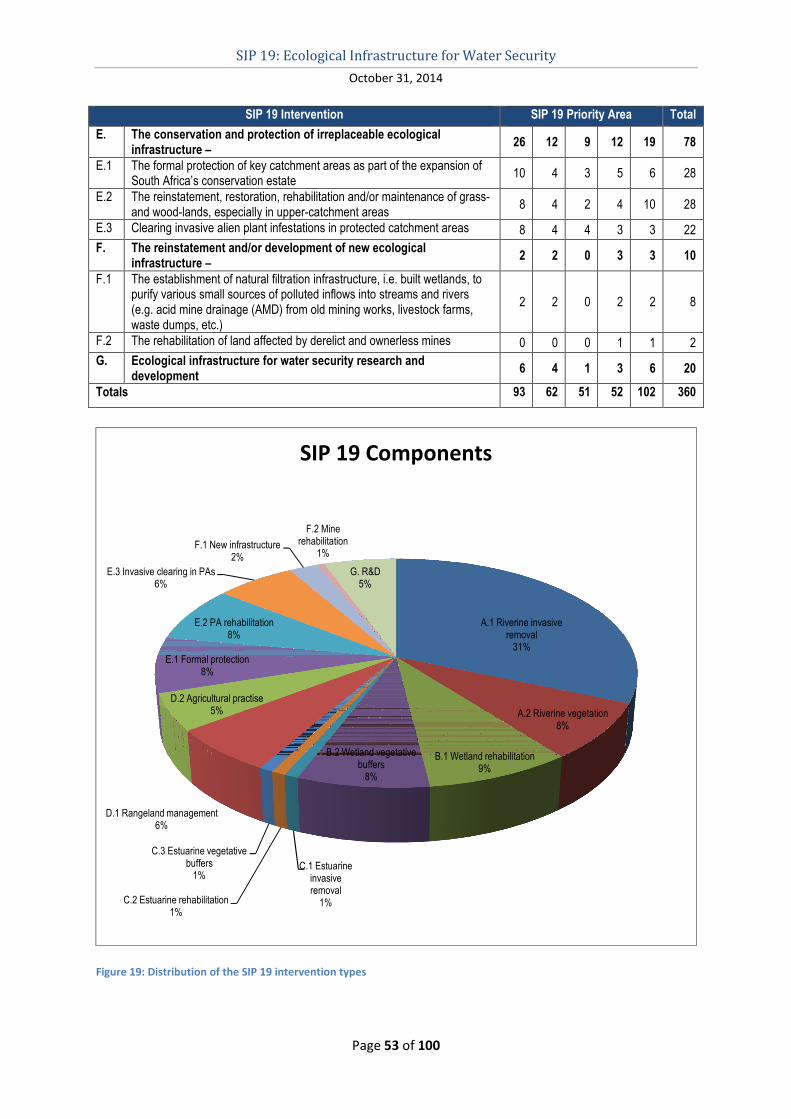
SIP 19: Ecological Infrastructure for Water Security
October 31, 2014
Page 53 of 100
SIP 19 Intervention SIP 19 Priority Area Total
E. The conservation and protection of irreplaceable ecological infrastructure –
26 12 9 12 19 78
E.1 The formal protection of key catchment areas as part of the expansion of South Africa’s conservation estate
10 4 3 5 6 28
E.2 The reinstatement, restoration, rehabilitation and/or maintenance of grass- and wood-lands, especially in upper-catchment areas
8 4 2 4 10 28
E.3 Clearing invasive alien plant infestations in protected catchment areas 8 4 4 3 3 22
F. The reinstatement and/or development of new ecological infrastructure –
2 2 0 3 3 10
F.1 The establishment of natural filtration infrastructure, i.e. built wetlands, to purify various small sources of polluted inflows into streams and rivers (e.g. acid mine drainage (AMD) from old mining works, livestock farms, waste dumps, etc.)
2 2 0 2 2 8
F.2 The rehabilitation of land affected by derelict and ownerless mines 0 0 0 1 1 2
G. Ecological infrastructure for water security research and development
6 4 1 3 6 20
Totals 93 62 51 52 102 360
Figure 19: Distribution of the SIP 19 intervention types
A.1 Riverine invasive removal
31%
A.2 Riverine vegetation 8%
B.1 Wetland rehabilitation9%
B.2 Wetland vegetative buffers
8%
C.1 Estuarine invasive removal
1%C.2 Estuarine rehabilitation1%
C.3 Estuarine vegetative buffers
1%
D.1 Rangeland management6%
D.2 Agricultural practise5%
E.1 Formal protection8%
E.2 PA rehabilitation8%
E.3 Invasive clearing in PAs6%
F.1 New infrastructure2%
F.2 Mine rehabilitation
1%
G. R&D5%
SIP 19 Components
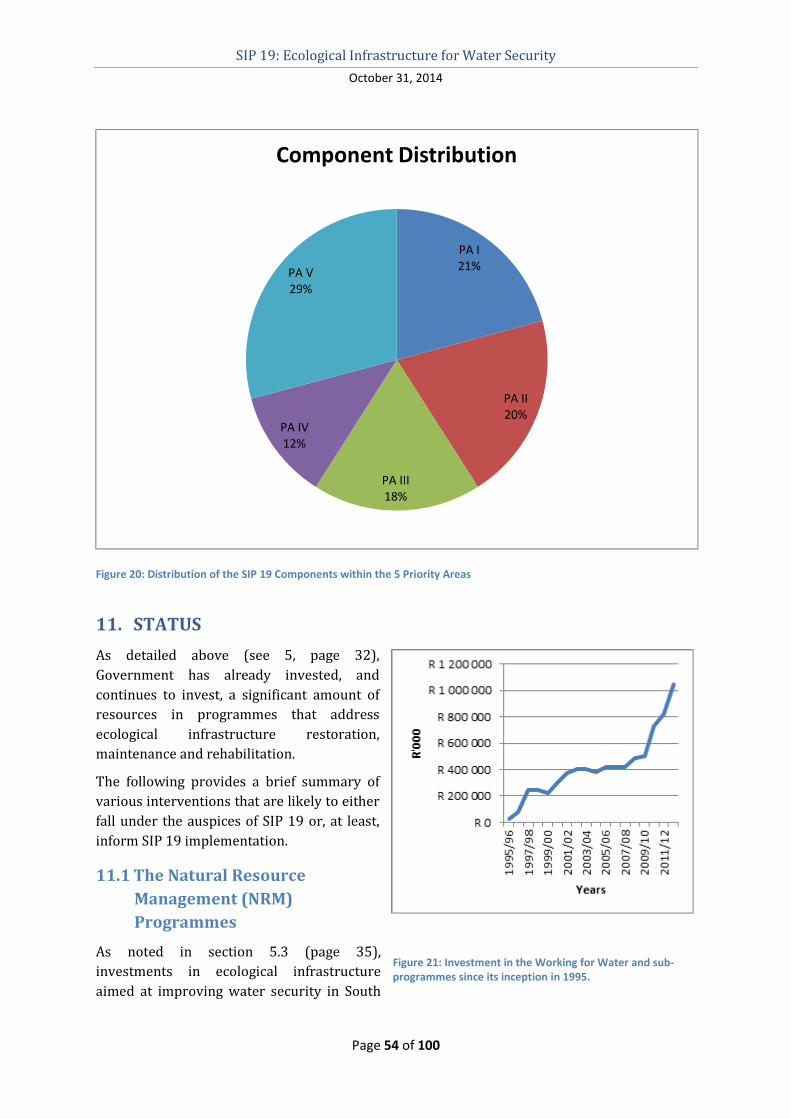
SIP 19: Ecological Infrastructure for Water Security
October 31, 2014
Page 54 of 100
Figure 20: Distribution of the SIP 19 Components within the 5 Priority Areas
11. STATUS
As detailed above (see 5, page 32),
Government has already invested, and
continues to invest, a significant amount of
resources in programmes that address
ecological infrastructure restoration,
maintenance and rehabilitation.
The following provides a brief summary of
various interventions that are likely to either
fall under the auspices of SIP 19 or, at least,
inform SIP 19 implementation.
11.1 The Natural Resource
Management (NRM)
Programmes
As noted in section 5.3 (page 35),
investments in ecological infrastructure
aimed at improving water security in South
PA I
21%
PA II
20%
PA III
18%
PA IV
12%
PA V
29%
Component Distribution
Figure 21: Investment in the Working for Water and sub-
programmes since its inception in 1995.
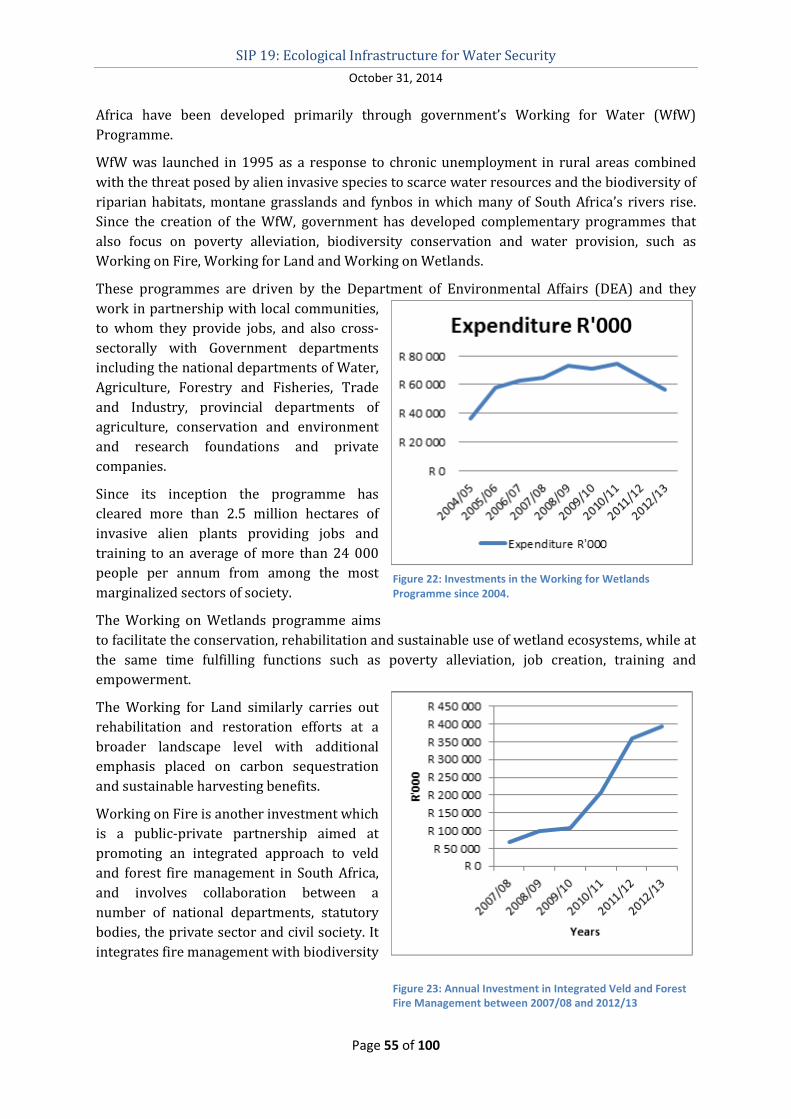
SIP 19: Ecological Infrastructure for Water Security
October 31, 2014
Page 55 of 100
Africa have been developed primarily through government’s Working for Water (WfW)
Programme.
WfW was launched in 1995 as a response to chronic unemployment in rural areas combined
with the threat posed by alien invasive species to scarce water resources and the biodiversity of
riparian habitats, montane grasslands and fynbos in which many of South Africa’s rivers rise.
Since the creation of the WfW, government has developed complementary programmes that
also focus on poverty alleviation, biodiversity conservation and water provision, such as
Working on Fire, Working for Land and Working on Wetlands.
These programmes are driven by the Department of Environmental Affairs (DEA) and they
work in partnership with local communities,
to whom they provide jobs, and also cross-
sectorally with Government departments
including the national departments of Water,
Agriculture, Forestry and Fisheries, Trade
and Industry, provincial departments of
agriculture, conservation and environment
and research foundations and private
companies.
Since its inception the programme has
cleared more than 2.5 million hectares of
invasive alien plants providing jobs and
training to an average of more than 24 000
people per annum from among the most
marginalized sectors of society.
The Working on Wetlands programme aims
to facilitate the conservation, rehabilitation and sustainable use of wetland ecosystems, while at
the same time fulfilling functions such as poverty alleviation, job creation, training and
empowerment.
The Working for Land similarly carries out
rehabilitation and restoration efforts at a
broader landscape level with additional
emphasis placed on carbon sequestration
and sustainable harvesting benefits.
Working on Fire is another investment which
is a public-private partnership aimed at
promoting an integrated approach to veld
and forest fire management in South Africa,
and involves collaboration between a
number of national departments, statutory
bodies, the private sector and civil society. It
integrates fire management with biodiversity
Figure 22: Investments in the Working for Wetlands
Programme since 2004.
Figure 23: Annual Investment in Integrated Veld and Forest
Fire Management between 2007/08 and 2012/13
SIP 19: Ecological Infrastructure for Water Security
October 31, 2014
Page 56 of 100
conservation, the maintenance of ecosystem services, livelihoods strategies, training and
research.
There is general consensus that WfW has been a major success in terms of restoring water
supplies in areas heavily infested by alien invasive species. It is estimated that the 2.5 million
hectares of land that has been cleared since inception is believed to have resulted in a total
saving of some 1 444 million m3/yr or 2.88% of the naturalised mean annual runoff.
Furthermore, apart from the programme’s jobs creation and training and skills impacts, it has
also been used as an entry point for HIV/AIDS awareness programmes.
11.2 The National Freshwater Ecosystem Priority Areas (NFEPAs)
The National Freshwater Ecosystem Priority Areas (NFEPAs) are a set of strategic spatial
priorities for conserving water ecosystems and supporting the sustainable use of water
resources. Development pressures result in it not always being possible to maintain all water
ecosystems in good ecological condition (i.e. in an A or B present ecological state). However, in
order to support the health and sustainability of water ecosystems and thus the provision of
water-related ecosystem services, a certain proportion of water ecosystems need to be
maintained in good ecological condition. The NFEPAs represent such a set of ecosystems,
derived systematically and proactively, in the most efficient configuration, based on the best
available science.
In the regard, the project to generate maps of NFEPAs has been completed. These maps are
available from SANBI and the Water Research Commission in hard copy and electronically, both
as image files and as shape files that can be manipulated in GIS. In addition to the maps, two
supplementary reports have been published:
• A technical report, which explains the scientific methods and stakeholder engagement
process used to create the map products and the analysis of legal and institutional
mechanisms available for implementing NFEPA products
• An implementation manual that provides guidance on how to use the FEPA maps in the
water sector, the biodiversity sector and other key sectors whose planning and decision-
making impacts on freshwater ecosystems
The Strategic Water Source Areas map used to inform the priority spatial areas for the SIP also
had its origins in the NFEPA development process (see Figure 10, page 41).
The NFEPA maps provide a single, nationally consistent information source for incorporating
water ecosystem goals into planning and decision-making processes. Not every FEPA can
automatically be considered key ecological infrastructure, but when combined with other
information sources (e.g. the map of Strategic Water Source Areas), the NFEPA maps remain a
primary input in the identification of ecological infrastructure of significance for water security.
The maps support integrated water resource management by providing guidance on how many
rivers, wetlands and estuaries, and which ones, should remain in a natural or near-natural
condition to support the water resource protection goals of the National Water Act. This does
not mean FEPAs should be restricted from human use, but rather that they should be supported
by good planning, decision-making and management to ensure that human use does not impact
unduly on the condition of the resource.
SIP 19: Ecological Infrastructure for Water Security
October 31, 2014
Page 57 of 100
The Strategic Water Source Areas form the foundational ecological infrastructure on which a
great deal of built infrastructure for water services depends. They are therefore strategic
national assets that are vital for water security, and need to be acknowledged as such at the
highest level across all sectors. SIP 19 represents a tremendous opportunity to further embed
this thinking into policy and practice.
Deterioration of water quality and quantity in these areas can have a disproportionately large
impact on the ability of DWAS to ensure the provision of reasonable quantities of good quality
water at acceptable assurance of supply. Appropriate management of these areas, which occupy
only a small fraction of the country’s total land surface area, can therefore produce significant
returns in terms of water quality and quantity. Investing in Strategic Water Source Areas is also
an important mechanism for long-term adaptation to the effects on climate change on water
provision growth and development.
11.3 Water security – The uMngeni ecological infrastructure partnership
Water from the uMngeni catchment is the cornerstone of the eThekwini and uMgugundlovu
municipality’s growing economies. However the demand for water is now well beyond the
available supply according to the 2009 Water Reconciliation Strategy for the KZN Coastal
Metropolitan Areas. In response to this, a series of expensive engineering solutions have been
identified and are in the process of being implemented. These include, amongst others, the
construction of inter-basin transfer schemes in the adjacent catchments of the Mooi and
Mkomazi Rivers. However, it is recognised that these interventions will ultimately not be
sufficient to address the water rapidly growing demand.
This situation has prompted eThekwini’s Water and Sanitation department to explore
alternative solutions to address water security. A growing body of evidence has shown that
investing in ecological infrastructure can enhance the efficiency of water service delivery
through improving water quality, reducing sediment loads, reducing flood risk and increasing
yield through increased winter baseflows. This in turn augments and enhances the efficiency of
the engineering investments. The management and restoration of ecological infrastructure in
the catchment therefore has huge potential to address some of the most pressing water quantity
and quality problems in the catchment.
River bank restoration work carried out by Working for Water on a stretch of the uMngeni River
downstream of the Albert Falls Dam has illustrated the delivery of these services through a
significant improvement in water quality at a fraction of the cost currently being incurred by the
Water Services Authorities in the catchment. This work has shown that for approximately 10%
of the current water treatment spend, much of the length of the uMngeni River’s riparian area
could be restored and maintained through initiatives such as Working for Water, which would
result in ecological restoration, improved delivery of water services, and the employment of
local people.
The Greater uMngeni River Catchment, together with the upper Mooi and Mkomazi River
Catchments, still have a substantial amount of their land surface (approximately 64%) that is in
a relatively natural condition and which therefore retains its potential to deliver the water
related ecological services listed above.
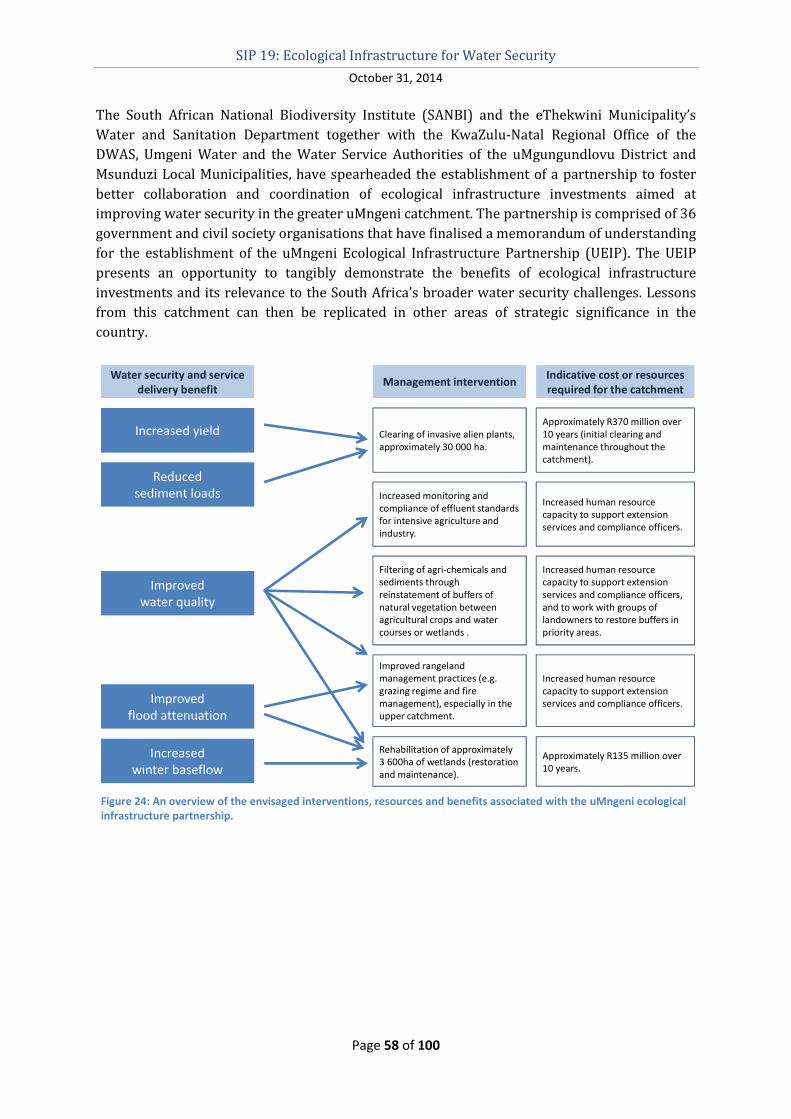
SIP 19: Ecological Infrastructure for Water Security
October 31, 2014
Page 58 of 100
The South African National Biodiversity Institute (SANBI) and the eThekwini Municipality’s
Water and Sanitation Department together with the KwaZulu-Natal Regional Office of the
DWAS, Umgeni Water and the Water Service Authorities of the uMgungundlovu District and
Msunduzi Local Municipalities, have spearheaded the establishment of a partnership to foster
better collaboration and coordination of ecological infrastructure investments aimed at
improving water security in the greater uMngeni catchment. The partnership is comprised of 36
government and civil society organisations that have finalised a memorandum of understanding
for the establishment of the uMngeni Ecological Infrastructure Partnership (UEIP). The UEIP
presents an opportunity to tangibly demonstrate the benefits of ecological infrastructure
investments and its relevance to the South Africa’s broader water security challenges. Lessons
from this catchment can then be replicated in other areas of strategic significance in the
country.
Increased yield
Reduced
sediment loads
Improved
water quality
Increased
winter baseflow
Improved
flood attenuation
Clearing of invasive alien plants,
approximately 30 000 ha.
Approximately R370 million over
10 years (initial clearing and
maintenance throughout the
catchment).
Increased monitoring and
compliance of effluent standards
for intensive agriculture and
industry.
Rehabilitation of approximately
3 600ha of wetlands (restoration
and maintenance).
Improved rangeland
management practices (e.g.
grazing regime and fire
management), especially in the
upper catchment.
Filtering of agri-chemicals and
sediments through
reinstatement of buffers of
natural vegetation between
agricultural crops and water
courses or wetlands .
Increased human resource
capacity to support extension
services and compliance officers,
and to work with groups of
landowners to restore buffers in
priority areas.
Increased human resource
capacity to support extension
services and compliance officers.
Approximately R135 million over
10 years.
Increased human resource
capacity to support extension
services and compliance officers.
Indicative cost or resources
required for the catchmentManagement intervention
Water security and service
delivery benefit
Figure 24: An overview of the envisaged interventions, resources and benefits associated with the uMngeni ecological
infrastructure partnership.
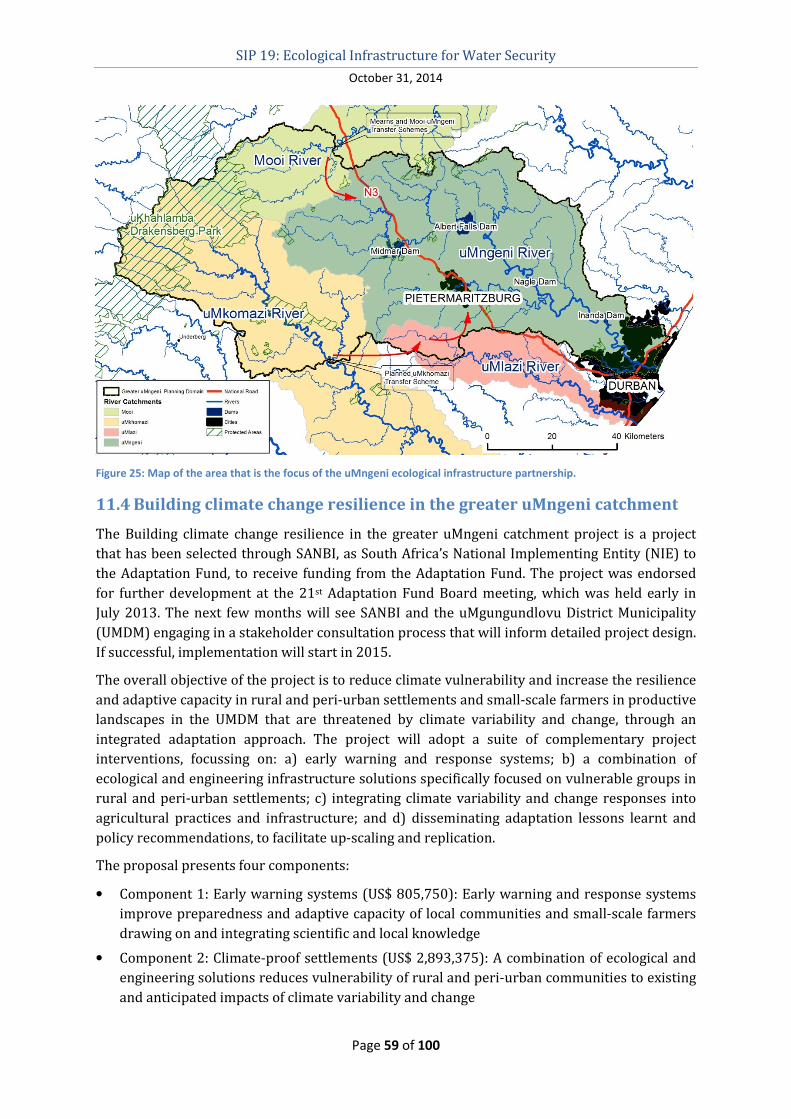
SIP 19: Ecological Infrastructure for Water Security
October 31, 2014
Page 59 of 100
Figure 25: Map of the area that is the focus of the uMngeni ecological infrastructure partnership.
11.4 Building climate change resilience in the greater uMngeni catchment
The Building climate change resilience in the greater uMngeni catchment project is a project
that has been selected through SANBI, as South Africa’s National Implementing Entity (NIE) to
the Adaptation Fund, to receive funding from the Adaptation Fund. The project was endorsed
for further development at the 21st Adaptation Fund Board meeting, which was held early in
July 2013. The next few months will see SANBI and the uMgungundlovu District Municipality
(UMDM) engaging in a stakeholder consultation process that will inform detailed project design.
If successful, implementation will start in 2015.
The overall objective of the project is to reduce climate vulnerability and increase the resilience
and adaptive capacity in rural and peri-urban settlements and small-scale farmers in productive
landscapes in the UMDM that are threatened by climate variability and change, through an
integrated adaptation approach. The project will adopt a suite of complementary project
interventions, focussing on: a) early warning and response systems; b) a combination of
ecological and engineering infrastructure solutions specifically focused on vulnerable groups in
rural and peri-urban settlements; c) integrating climate variability and change responses into
agricultural practices and infrastructure; and d) disseminating adaptation lessons learnt and
policy recommendations, to facilitate up-scaling and replication.
The proposal presents four components:
• Component 1: Early warning systems (US$ 805,750): Early warning and response systems
improve preparedness and adaptive capacity of local communities and small-scale farmers
drawing on and integrating scientific and local knowledge
• Component 2: Climate-proof settlements (US$ 2,893,375): A combination of ecological and
engineering solutions reduces vulnerability of rural and peri-urban communities to existing
and anticipated impacts of climate variability and change
SIP 19: Ecological Infrastructure for Water Security
October 31, 2014
Page 60 of 100
• Component 3: Climate resilient agriculture (US$ 2,490,500): Small-scale farmers have
improved resilience and reduced vulnerability to existing and anticipated impacts of climate
variability and change
• Component 4: Lessons learnt (US$ 439,500): Dissemination of adaptation lessons learnt and
policy recommendations facilitates up-scaling and replication.
The uMgungundlovu District Municipality (UMDM) has been identified as the Executing Entity
for the uMngeni catchment project.
11.5 The Berg River Improvement Plan (BRIP), an inter-governmental
relations partnership
The Berg River catchment is home to cultivated agricultural land, mainly vineyards, fruit trees
and wheat fields. Water is the most critical natural resource in the economic sector, with
communities and industry deriving goods and services from river systems in their catchment
areas. About 75% of the crop produced in the catchment is exported to the European Union and
the United Kingdom (UK).
Water quality in the Berg River catchment of the Western Cape is, however, a cause for concern,
especially to communities, farmers and industry in the various municipalities of the West Coast
and Cape Winelands regions. In response, various stakeholders have implemented initiatives to
address a number of the water pollution problems in the catchment.
The Western Cape Government recently developed and endorsed the implementation of a Berg
River Improvement Plan (BRIP) to address water security concerns (i.e. quality and quantity) in
the Berg River catchment.
The vision of the plan is –
“Berg River water of acceptable quality and quantity for sustainable farming,
industrial development, human consumption and recreation, as well as
ecological health”.
The ultimate aim is to change the lives of people in the Berg River catchment through the
implementation of simple interventions. The desired outcome of the BRIP will be a Berg River
that underpins sustainable growth and development towards a green economy in the Western
Cape largely as a result of, among others, effective ecological infrastructure function and the
concomitant delivery of watershed services in particular and various environmental goods and
services in general. The plan identifies short (≤ 5 years) and long term (5 – 30 years)
interventions, and their financial implications.
The objectives of the plan are to:
• reduce the negative impact from Municipal urban areas, particularly informal settlements
and wastewater treatment works;
• reduce the negative impact of agriculture on the Berg River’s water quality to acceptable
levels;
• ensure sustainable resource use efficiency and ecological integrity.
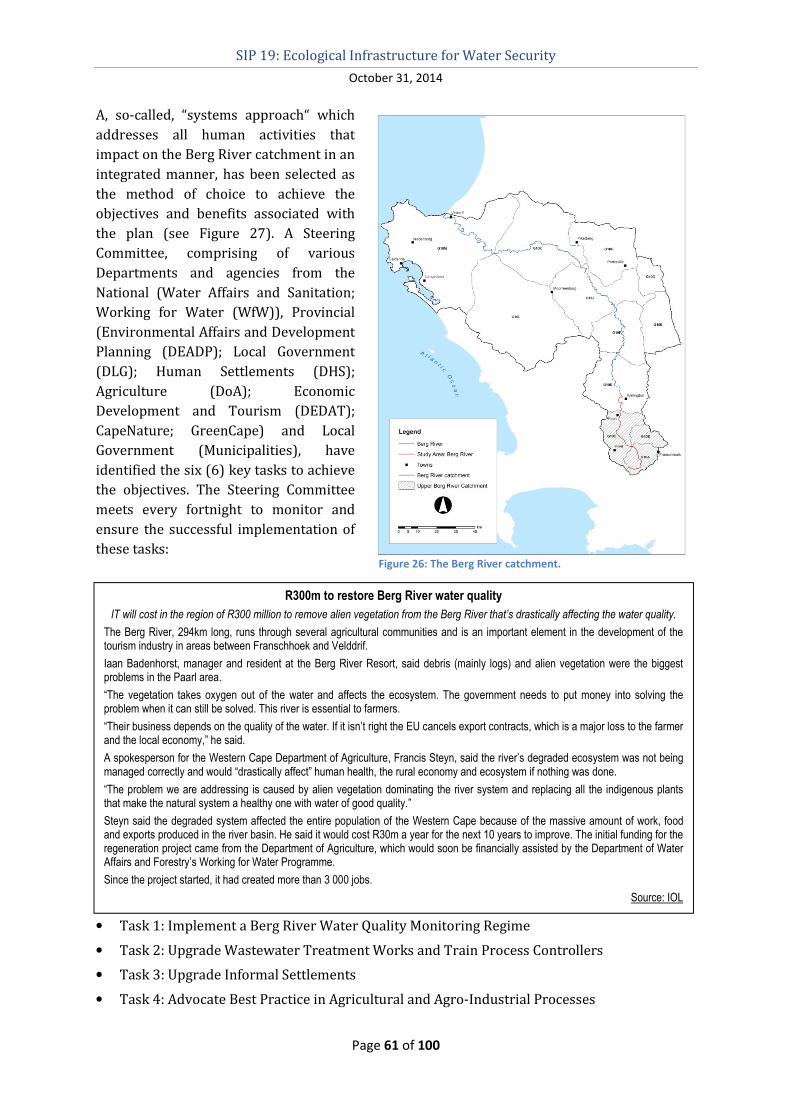
SIP 19: Ecological Infrastructure for Water Security
October 31, 2014
Page 61 of 100
A, so-called, “systems approach“ which
addresses all human activities that
impact on the Berg River catchment in an
integrated manner, has been selected as
the method of choice to achieve the
objectives and benefits associated with
the plan (see Figure 27). A Steering
Committee, comprising of various
Departments and agencies from the
National (Water Affairs and Sanitation;
Working for Water (WfW)), Provincial
(Environmental Affairs and Development
Planning (DEADP); Local Government
(DLG); Human Settlements (DHS);
Agriculture (DoA); Economic
Development and Tourism (DEDAT);
CapeNature; GreenCape) and Local
Government (Municipalities), have
identified the six (6) key tasks to achieve
the objectives. The Steering Committee
meets every fortnight to monitor and
ensure the successful implementation of
these tasks:
• Task 1: Implement a Berg River Water Quality Monitoring Regime
• Task 2: Upgrade Wastewater Treatment Works and Train Process Controllers
• Task 3: Upgrade Informal Settlements
• Task 4: Advocate Best Practice in Agricultural and Agro-Industrial Processes
Figure 26: The Berg River catchment.
R300m to restore Berg River water quality
IT will cost in the region of R300 million to remove alien vegetation from the Berg River that’s drastically affecting the water quality.
The Berg River, 294km long, runs through several agricultural communities and is an important element in the development of the tourism industry in areas between Franschhoek and Velddrif.
Iaan Badenhorst, manager and resident at the Berg River Resort, said debris (mainly logs) and alien vegetation were the biggest problems in the Paarl area.
“The vegetation takes oxygen out of the water and affects the ecosystem. The government needs to put money into solving the problem when it can still be solved. This river is essential to farmers.
“Their business depends on the quality of the water. If it isn’t right the EU cancels export contracts, which is a major loss to the farmer and the local economy,” he said.
A spokesperson for the Western Cape Department of Agriculture, Francis Steyn, said the river’s degraded ecosystem was not being managed correctly and would “drastically affect” human health, the rural economy and ecosystem if nothing was done.
“The problem we are addressing is caused by alien vegetation dominating the river system and replacing all the indigenous plants that make the natural system a healthy one with water of good quality.”
Steyn said the degraded system affected the entire population of the Western Cape because of the massive amount of work, food and exports produced in the river basin. He said it would cost R30m a year for the next 10 years to improve. The initial funding for the regeneration project came from the Department of Agriculture, which would soon be financially assisted by the Department of Water Affairs and Forestry’s Working for Water Programme.
Since the project started, it had created more than 3 000 jobs.
Source: IOL
SIP 19: Ecological Infrastructure for Water Security
October 31, 2014
Page 62 of 100
• Task 5: Riparian Zone Rehabilitation and Bioremediation
• Task 6: Pricing Water Management in the Berg River Catchment
The Tasks are at various stages of implementation (see Figure 28), particularly since
Departments and Municipalities have been upgrading Wastewater Treatment Works (Task 2;
WWTWs), developing plans to upgrade informal settlements (Task 3), as well as implementing
projects on water use efficiency (Task 4; www.fruitlook.gov.za) and clearing alien vegetation in
the Berg River catchment (Task 5).
The approach taken for implementing Task 1 is that of, “one can only manage if one knows its
status”; therefore, to manage water quality, one has to monitor water quality if one is to address
water security in the Berg River catchment successfully.
The resource condition target is that –
“E. coli, suspended sediment and nutrient (dissolved inorganic
nitrogen – DIN; phosphates) levels in receiving waters meet the
Target Water Quality Range (TWQRs) of the SA Water Quality
Guidelines”.
As an initial step, the DEADP developed a River and Estuarine Monitoring Plan for the Berg
River catchment, where a total of 20 sampling sites have been identified, in collaboration with
DWAS. Sampling sites identified will be monitored from 2013 onwards for trace metals and
residuals of pesticides in water and sediment of the Berg River and Berg Estuary, as well as for
E. coli, where applicable to Task 5. Further, the Drakenstein Municipality is implementing its
recently developed Ideal Sampling Plan for Water Quality Monitoring, while the Bergrivier
Municipality also monitors water quality parameters in its jurisdiction. All water quality data
will feed into the existing DWAS database on water quality monitoring, as part of implementing
the systems approach towards managing water quality in an integrated manner in the Berg
River catchment.
A “Genius of Place” project that focuses on biomimicry (described as “using nature’s processes
in a sustainable, efficient and powerful way to achieve environmental stewardship and benefit
for all”) has been initiated by DEDAT, as part of upgrading an informal settlement in the Berg
River catchment in Task 3. This links with the resource condition target that “identified informal
settlements are upgraded”. Phase 1 (2012/2013) of the project focused on identifying specific
interventions for implementation, based on expert opinion; while Phase 2 (2013/2014) is
currently identifying the informal settlement where the Genius of Place intervention(s) can be
implemented. The project is currently in its infancy and aims to use biomimicry to reduce
pollution impacts on the Berg River catchment.
Alien vegetation clearing and rehabilitation of the riparian zone, key to Task 5, is currently
underway through collaborative initiatives undertaken by CapeNature and WfW, as well as
through DEADP and DoA. The interim management action target is to improve groundcover and
riparian vegetation to reduce agricultural runoff; while the resource condition target is to
reduce E. coli, suspended sediment, nutrients (dissolved inorganic nitrogen – DIN) and pesticide
loads to receiving waters. Cleared riparian zones in the Hermon area have been replaced with
indigenous vegetation collected in the catchment and grown at the Kluitjieskraal Nursery.

SIP 19: Ecological Infrastructure for Water Security
October 31, 2014
Page 63 of 100
Workers from the Hermon/Tulbagh area were appointed to propagate and plant the indigenous
vegetation as part of the Expanded Public Works Programme (EPWP). Approximately 4 FTE
jobs were created during 2012/2013 with this number increasing during the 2013/2014
financial year.
Figure 27: An overview of the envisaged management actions, tasks and benefits associated with the Berg River
Improvement Plan partnership (TWQR = Target Water Quality Range).
It was previously estimated that pollution will have a significant impact on the economy,
unemployment and social services in the Berg River catchment. As such, the management action
target in terms of pricing the value of water in the Berg River catchment (Target 6) is to achieve
an “increased GDP in the Berg River catchment”. The DEDAT and DEADP is working
collaboratively to develop scenarios on the cost of pollution in the Berg River catchment, by
initially focusing on how much water is used by the region’s economy, and where and how it is
used. An analysis of water consumption across the economy will be linked to measures of
economic productivity (i.e. water use / GDP contribution). Further, the cost of action versus
inaction will be modeled using various scenarios. The ultimate aim is to design and implement
interventions to alleviate the constraints in the Berg River catchment.
Overall, the lessons by following a systems approach in this catchment will be replicated in
other catchments of strategic significance in the Western Cape.
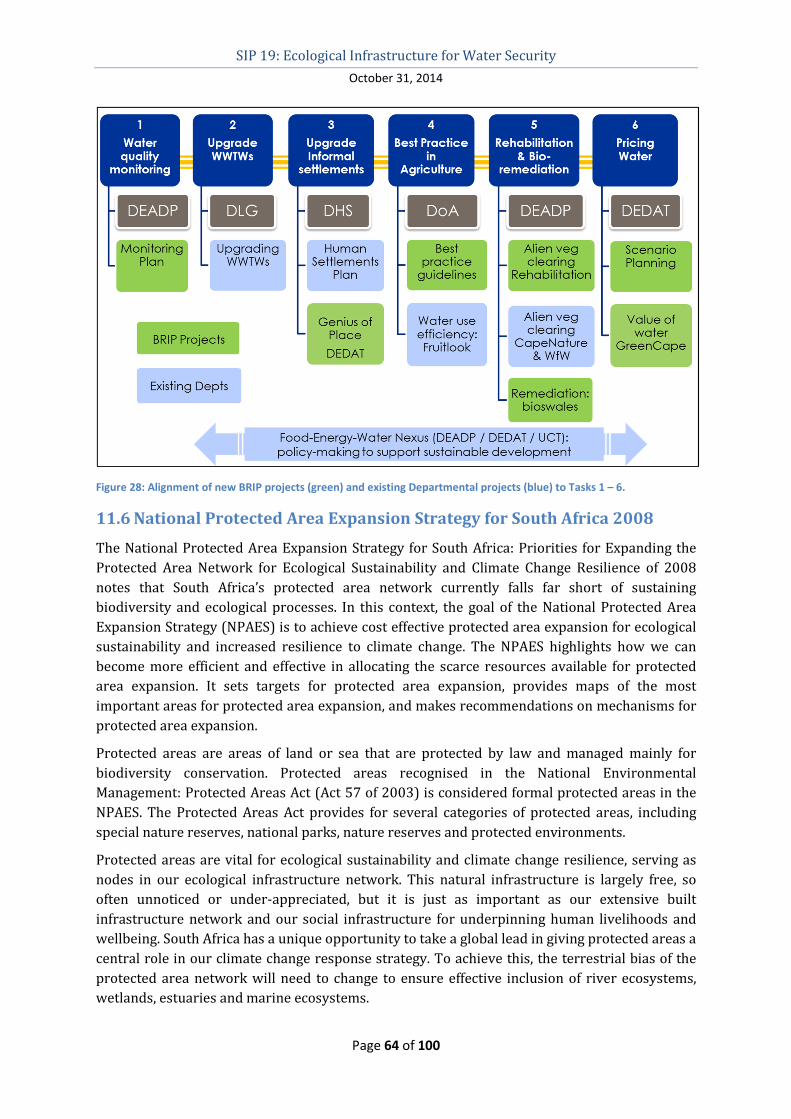
SIP 19: Ecological Infrastructure for Water Security
October 31, 2014
Page 64 of 100
Figure 28: Alignment of new BRIP projects (green) and existing Departmental projects (blue) to Tasks 1 – 6.
11.6 National Protected Area Expansion Strategy for South Africa 2008
The National Protected Area Expansion Strategy for South Africa: Priorities for Expanding the
Protected Area Network for Ecological Sustainability and Climate Change Resilience of 2008
notes that South Africa’s protected area network currently falls far short of sustaining
biodiversity and ecological processes. In this context, the goal of the National Protected Area
Expansion Strategy (NPAES) is to achieve cost effective protected area expansion for ecological
sustainability and increased resilience to climate change. The NPAES highlights how we can
become more efficient and effective in allocating the scarce resources available for protected
area expansion. It sets targets for protected area expansion, provides maps of the most
important areas for protected area expansion, and makes recommendations on mechanisms for
protected area expansion.
Protected areas are areas of land or sea that are protected by law and managed mainly for
biodiversity conservation. Protected areas recognised in the National Environmental
Management: Protected Areas Act (Act 57 of 2003) is considered formal protected areas in the
NPAES. The Protected Areas Act provides for several categories of protected areas, including
special nature reserves, national parks, nature reserves and protected environments.
Protected areas are vital for ecological sustainability and climate change resilience, serving as
nodes in our ecological infrastructure network. This natural infrastructure is largely free, so
often unnoticed or under-appreciated, but it is just as important as our extensive built
infrastructure network and our social infrastructure for underpinning human livelihoods and
wellbeing. South Africa has a unique opportunity to take a global lead in giving protected areas a
central role in our climate change response strategy. To achieve this, the terrestrial bias of the
protected area network will need to change to ensure effective inclusion of river ecosystems,
wetlands, estuaries and marine ecosystems.
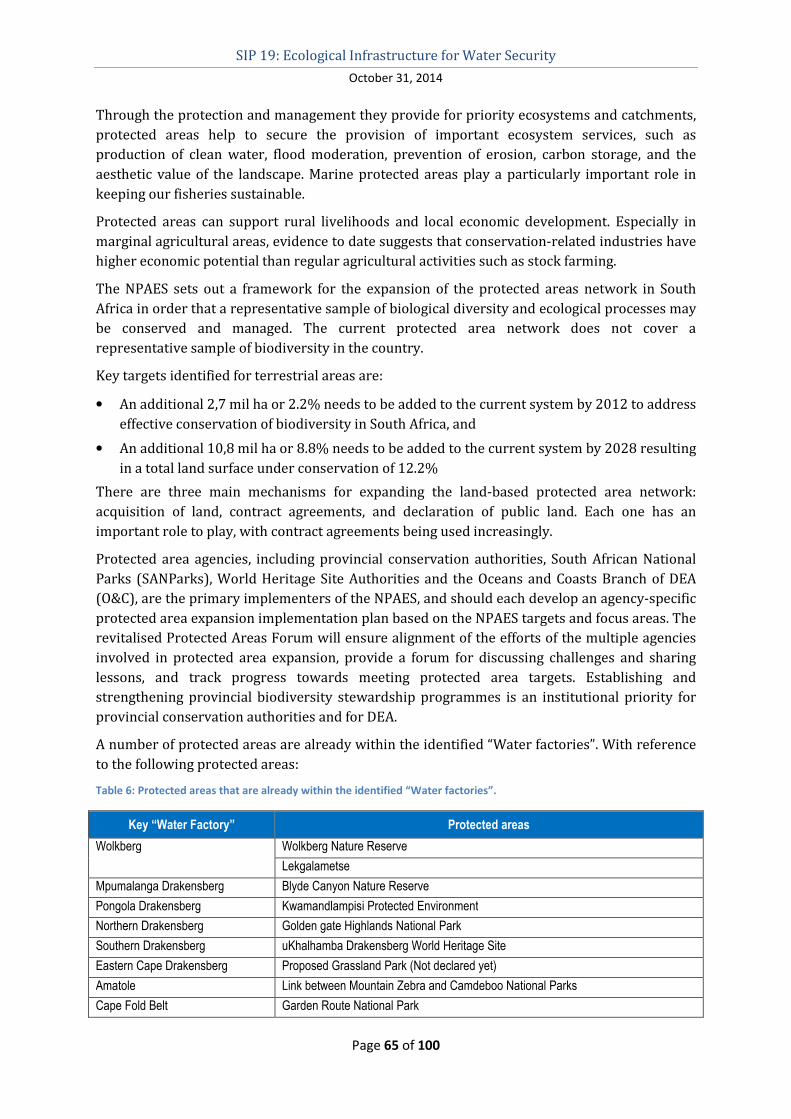
SIP 19: Ecological Infrastructure for Water Security
October 31, 2014
Page 65 of 100
Through the protection and management they provide for priority ecosystems and catchments,
protected areas help to secure the provision of important ecosystem services, such as
production of clean water, flood moderation, prevention of erosion, carbon storage, and the
aesthetic value of the landscape. Marine protected areas play a particularly important role in
keeping our fisheries sustainable.
Protected areas can support rural livelihoods and local economic development. Especially in
marginal agricultural areas, evidence to date suggests that conservation-related industries have
higher economic potential than regular agricultural activities such as stock farming.
The NPAES sets out a framework for the expansion of the protected areas network in South
Africa in order that a representative sample of biological diversity and ecological processes may
be conserved and managed. The current protected area network does not cover a
representative sample of biodiversity in the country.
Key targets identified for terrestrial areas are:
• An additional 2,7 mil ha or 2.2% needs to be added to the current system by 2012 to address
effective conservation of biodiversity in South Africa, and
• An additional 10,8 mil ha or 8.8% needs to be added to the current system by 2028 resulting
in a total land surface under conservation of 12.2%
There are three main mechanisms for expanding the land-based protected area network:
acquisition of land, contract agreements, and declaration of public land. Each one has an
important role to play, with contract agreements being used increasingly.
Protected area agencies, including provincial conservation authorities, South African National
Parks (SANParks), World Heritage Site Authorities and the Oceans and Coasts Branch of DEA
(O&C), are the primary implementers of the NPAES, and should each develop an agency-specific
protected area expansion implementation plan based on the NPAES targets and focus areas. The
revitalised Protected Areas Forum will ensure alignment of the efforts of the multiple agencies
involved in protected area expansion, provide a forum for discussing challenges and sharing
lessons, and track progress towards meeting protected area targets. Establishing and
strengthening provincial biodiversity stewardship programmes is an institutional priority for
provincial conservation authorities and for DEA.
A number of protected areas are already within the identified “Water factories”. With reference
to the following protected areas:
Table 6: Protected areas that are already within the identified “Water factories”.
Key “Water Factory” Protected areas
Wolkberg Wolkberg Nature Reserve
Lekgalametse
Mpumalanga Drakensberg Blyde Canyon Nature Reserve
Pongola Drakensberg Kwamandlampisi Protected Environment
Northern Drakensberg Golden gate Highlands National Park
Southern Drakensberg uKhalhamba Drakensberg World Heritage Site
Eastern Cape Drakensberg Proposed Grassland Park (Not declared yet)
Amatole Link between Mountain Zebra and Camdeboo National Parks
Cape Fold Belt Garden Route National Park
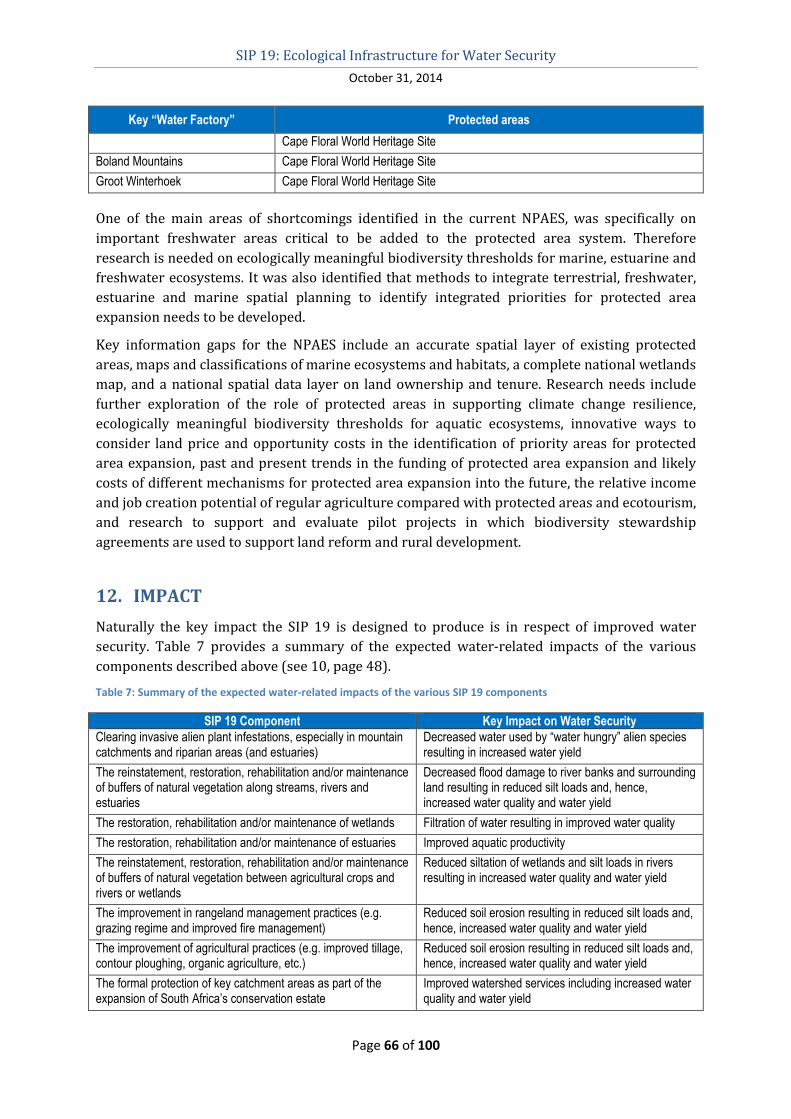
SIP 19: Ecological Infrastructure for Water Security
October 31, 2014
Page 66 of 100
Key “Water Factory” Protected areas
Cape Floral World Heritage Site
Boland Mountains Cape Floral World Heritage Site
Groot Winterhoek Cape Floral World Heritage Site
One of the main areas of shortcomings identified in the current NPAES, was specifically on
important freshwater areas critical to be added to the protected area system. Therefore
research is needed on ecologically meaningful biodiversity thresholds for marine, estuarine and
freshwater ecosystems. It was also identified that methods to integrate terrestrial, freshwater,
estuarine and marine spatial planning to identify integrated priorities for protected area
expansion needs to be developed.
Key information gaps for the NPAES include an accurate spatial layer of existing protected
areas, maps and classifications of marine ecosystems and habitats, a complete national wetlands
map, and a national spatial data layer on land ownership and tenure. Research needs include
further exploration of the role of protected areas in supporting climate change resilience,
ecologically meaningful biodiversity thresholds for aquatic ecosystems, innovative ways to
consider land price and opportunity costs in the identification of priority areas for protected
area expansion, past and present trends in the funding of protected area expansion and likely
costs of different mechanisms for protected area expansion into the future, the relative income
and job creation potential of regular agriculture compared with protected areas and ecotourism,
and research to support and evaluate pilot projects in which biodiversity stewardship
agreements are used to support land reform and rural development.
12. IMPACT
Naturally the key impact the SIP 19 is designed to produce is in respect of improved water
security. Table 7 provides a summary of the expected water-related impacts of the various
components described above (see 10, page 48).
Table 7: Summary of the expected water-related impacts of the various SIP 19 components
SIP 19 Component Key Impact on Water Security
Clearing invasive alien plant infestations, especially in mountain catchments and riparian areas (and estuaries)
Decreased water used by “water hungry” alien species resulting in increased water yield
The reinstatement, restoration, rehabilitation and/or maintenance of buffers of natural vegetation along streams, rivers and estuaries
Decreased flood damage to river banks and surrounding land resulting in reduced silt loads and, hence, increased water quality and water yield
The restoration, rehabilitation and/or maintenance of wetlands Filtration of water resulting in improved water quality
The restoration, rehabilitation and/or maintenance of estuaries Improved aquatic productivity
The reinstatement, restoration, rehabilitation and/or maintenance of buffers of natural vegetation between agricultural crops and rivers or wetlands
Reduced siltation of wetlands and silt loads in rivers resulting in increased water quality and water yield
The improvement in rangeland management practices (e.g. grazing regime and improved fire management)
Reduced soil erosion resulting in reduced silt loads and, hence, increased water quality and water yield
The improvement of agricultural practices (e.g. improved tillage, contour ploughing, organic agriculture, etc.)
Reduced soil erosion resulting in reduced silt loads and, hence, increased water quality and water yield
The formal protection of key catchment areas as part of the expansion of South Africa’s conservation estate
Improved watershed services including increased water quality and water yield
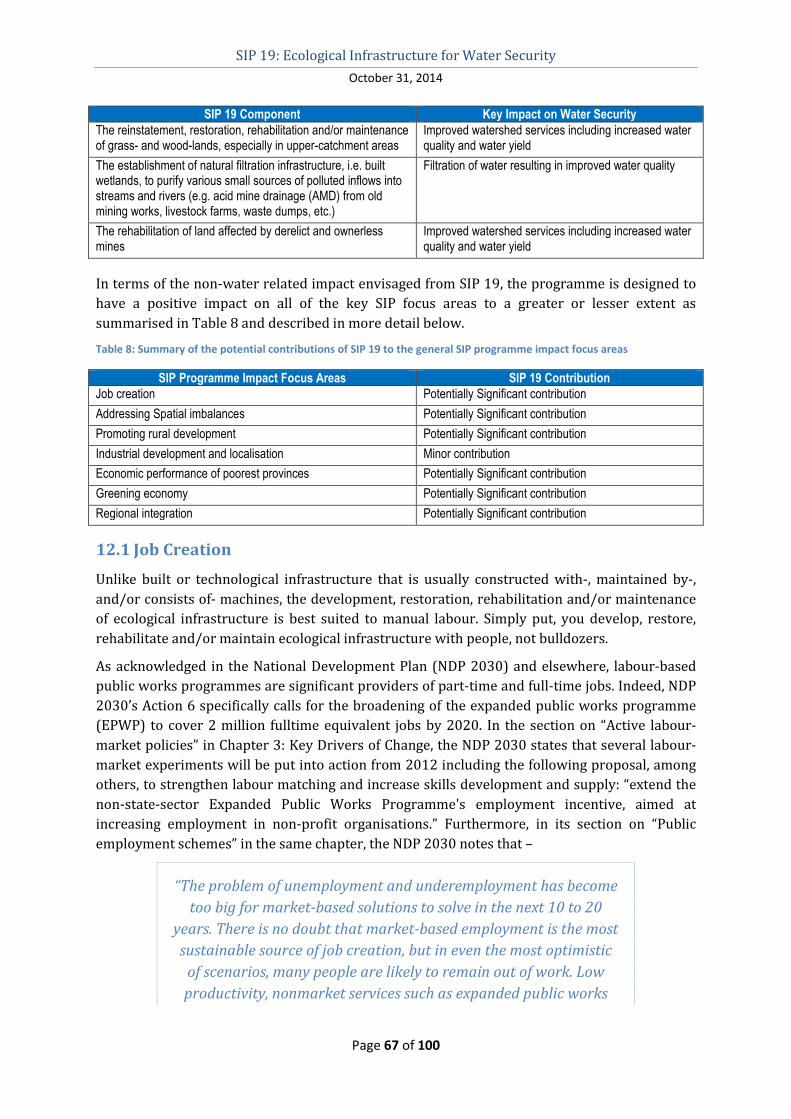
SIP 19: Ecological Infrastructure for Water Security
October 31, 2014
Page 67 of 100
SIP 19 Component Key Impact on Water Security
The reinstatement, restoration, rehabilitation and/or maintenance of grass- and wood-lands, especially in upper-catchment areas
Improved watershed services including increased water quality and water yield
The establishment of natural filtration infrastructure, i.e. built wetlands, to purify various small sources of polluted inflows into streams and rivers (e.g. acid mine drainage (AMD) from old mining works, livestock farms, waste dumps, etc.)
Filtration of water resulting in improved water quality
The rehabilitation of land affected by derelict and ownerless mines
Improved watershed services including increased water quality and water yield
In terms of the non-water related impact envisaged from SIP 19, the programme is designed to
have a positive impact on all of the key SIP focus areas to a greater or lesser extent as
summarised in Table 8 and described in more detail below.
Table 8: Summary of the potential contributions of SIP 19 to the general SIP programme impact focus areas
SIP Programme Impact Focus Areas SIP 19 Contribution
Job creation Potentially Significant contribution
Addressing Spatial imbalances Potentially Significant contribution
Promoting rural development Potentially Significant contribution
Industrial development and localisation Minor contribution
Economic performance of poorest provinces Potentially Significant contribution
Greening economy Potentially Significant contribution
Regional integration Potentially Significant contribution
12.1 Job Creation
Unlike built or technological infrastructure that is usually constructed with-, maintained by-,
and/or consists of- machines, the development, restoration, rehabilitation and/or maintenance
of ecological infrastructure is best suited to manual labour. Simply put, you develop, restore,
rehabilitate and/or maintain ecological infrastructure with people, not bulldozers.
As acknowledged in the National Development Plan (NDP 2030) and elsewhere, labour-based
public works programmes are significant providers of part-time and full-time jobs. Indeed, NDP
2030’s Action 6 specifically calls for the broadening of the expanded public works programme
(EPWP) to cover 2 million fulltime equivalent jobs by 2020. In the section on “Active labour-
market policies” in Chapter 3: Key Drivers of Change, the NDP 2030 states that several labour-
market experiments will be put into action from 2012 including the following proposal, among
others, to strengthen labour matching and increase skills development and supply: “extend the
non-state-sector Expanded Public Works Programme's employment incentive, aimed at
increasing employment in non-profit organisations.” Furthermore, in its section on “Public
employment schemes” in the same chapter, the NDP 2030 notes that –
“The problem of unemployment and underemployment has become
too big for market-based solutions to solve in the next 10 to 20
years. There is no doubt that market-based employment is the most
sustainable source of job creation, but in even the most optimistic
of scenarios, many people are likely to remain out of work. Low
productivity, nonmarket services such as expanded public works

SIP 19: Ecological Infrastructure for Water Security
October 31, 2014
Page 68 of 100
projects in government construction, care, self-help projects and
survivalist activities are generically called public employment
schemes. The public employment programmes should target the
creation of 2 million opportunities annually by 2020 or earlier, if
possible. The central challenge is to identify institutional
approaches that will enable this scale of achievement.”
Government’s New Growth Path (NGP) sets a target of growing employment by five million jobs
by 2020 (around three million more than the anticipated growth if we extrapolated from 2002
to 2009) thereby ensuring that over half of all working-age South Africans would have paid
employment and resulting in narrow unemployment dropping by 10 percentage points from
25% currently to around 15%. To this end, the NGP identifies the following “jobs drivers” –
• Substantial public investment in infrastructure both to create employment directly, in
construction, operation and maintenance as well as the production of inputs, and indirectly
by improving efficiency across the economy;
• Targeting more labour-absorbing activities across the main economic sectors – the
agricultural and mining value chains, manufacturing and services;
• Taking advantage of new opportunities in the knowledge and green economies;
• Leveraging social capital in the social economy and the public services; and
• Fostering rural development and regional integration.
In each of these areas, the NGP notes that special efforts will have to be made to generate
opportunities for young people, who face the highest unemployment rate.
The categories of the jobs drivers are not set in concrete – new opportunities may emerge that
are not foreseen, assumptions on which existing opportunities are based may change - nor are
they fully independent of each other. For instance, the green economy requires profound
changes in energy infrastructure, while rural development depends in large part on
infrastructure, agriculture and tourism. The aim is not to focus on categorisation, but rather to
use the mapping process to think innovatively about new opportunities for employment
creation. A critical element of the New Growth Path is to ensure that the drivers leverage and
reinforce each other based on their inter-linkages.
As a first step, the NGP prioritises efforts to support employment creation in the following key
sectors:
• infrastructure
• the agricultural value chain
• the mining value chain
• the green economy
• manufacturing sectors, which are included in IPAP2, and
• tourism and certain high-level services.
These opportunities will take advantage of the potential of new approaches in the other jobs
drivers, notably regional integration in Africa and the knowledge and social economies.
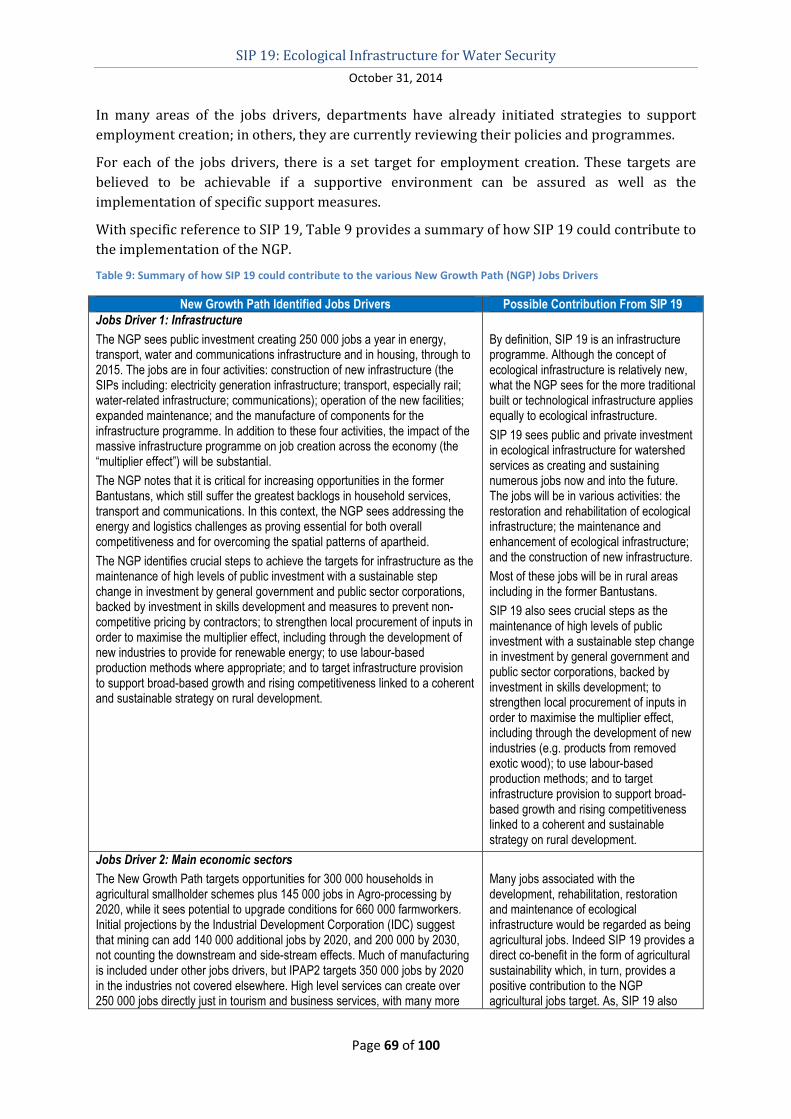
SIP 19: Ecological Infrastructure for Water Security
October 31, 2014
Page 69 of 100
In many areas of the jobs drivers, departments have already initiated strategies to support
employment creation; in others, they are currently reviewing their policies and programmes.
For each of the jobs drivers, there is a set target for employment creation. These targets are
believed to be achievable if a supportive environment can be assured as well as the
implementation of specific support measures.
With specific reference to SIP 19, Table 9 provides a summary of how SIP 19 could contribute to
the implementation of the NGP.
Table 9: Summary of how SIP 19 could contribute to the various New Growth Path (NGP) Jobs Drivers
New Growth Path Identified Jobs Drivers Possible Contribution From SIP 19
Jobs Driver 1: Infrastructure
The NGP sees public investment creating 250 000 jobs a year in energy, transport, water and communications infrastructure and in housing, through to 2015. The jobs are in four activities: construction of new infrastructure (the SIPs including: electricity generation infrastructure; transport, especially rail; water-related infrastructure; communications); operation of the new facilities; expanded maintenance; and the manufacture of components for the infrastructure programme. In addition to these four activities, the impact of the massive infrastructure programme on job creation across the economy (the “multiplier effect”) will be substantial.
The NGP notes that it is critical for increasing opportunities in the former Bantustans, which still suffer the greatest backlogs in household services, transport and communications. In this context, the NGP sees addressing the energy and logistics challenges as proving essential for both overall competitiveness and for overcoming the spatial patterns of apartheid.
The NGP identifies crucial steps to achieve the targets for infrastructure as the maintenance of high levels of public investment with a sustainable step change in investment by general government and public sector corporations, backed by investment in skills development and measures to prevent non-competitive pricing by contractors; to strengthen local procurement of inputs in order to maximise the multiplier effect, including through the development of new industries to provide for renewable energy; to use labour-based production methods where appropriate; and to target infrastructure provision to support broad-based growth and rising competitiveness linked to a coherent and sustainable strategy on rural development.
By definition, SIP 19 is an infrastructure programme. Although the concept of ecological infrastructure is relatively new, what the NGP sees for the more traditional built or technological infrastructure applies equally to ecological infrastructure.
SIP 19 sees public and private investment in ecological infrastructure for watershed services as creating and sustaining numerous jobs now and into the future. The jobs will be in various activities: the restoration and rehabilitation of ecological infrastructure; the maintenance and enhancement of ecological infrastructure; and the construction of new infrastructure.
Most of these jobs will be in rural areas including in the former Bantustans.
SIP 19 also sees crucial steps as the maintenance of high levels of public investment with a sustainable step change in investment by general government and public sector corporations, backed by investment in skills development; to strengthen local procurement of inputs in order to maximise the multiplier effect, including through the development of new industries (e.g. products from removed exotic wood); to use labour-based production methods; and to target infrastructure provision to support broad-based growth and rising competitiveness linked to a coherent and sustainable strategy on rural development.
Jobs Driver 2: Main economic sectors
The New Growth Path targets opportunities for 300 000 households in agricultural smallholder schemes plus 145 000 jobs in Agro-processing by 2020, while it sees potential to upgrade conditions for 660 000 farmworkers. Initial projections by the Industrial Development Corporation (IDC) suggest that mining can add 140 000 additional jobs by 2020, and 200 000 by 2030, not counting the downstream and side-stream effects. Much of manufacturing is included under other jobs drivers, but IPAP2 targets 350 000 jobs by 2020 in the industries not covered elsewhere. High level services can create over 250 000 jobs directly just in tourism and business services, with many more
Many jobs associated with the development, rehabilitation, restoration and maintenance of ecological infrastructure would be regarded as being agricultural jobs. Indeed SIP 19 provides a direct co-benefit in the form of agricultural sustainability which, in turn, provides a positive contribution to the NGP agricultural jobs target. As, SIP 19 also

SIP 19: Ecological Infrastructure for Water Security
October 31, 2014
Page 70 of 100
New Growth Path Identified Jobs Drivers Possible Contribution From SIP 19
possible in the cultural industries. addresses the negative impacts of derelict and ownerless mines in affected areas and where such negative impacts can be addressed through ecological infrastructure-related interventions, SIP 19 also the provides an indirect positive impact on mining sustainability. Furthermore, SIP 19’s possible contribution to job creation in the tourism sector should also not be discounted.
Jobs Driver 3: Seizing the potential of new economies
The NGP sees technological innovation opening the opportunity for substantial employment creation and targets 300 000 additional direct jobs by 2020 to green the economy, with 80 000 in manufacturing and the rest in construction, operations and maintenance of new environmentally friendly infrastructure. The potential for job creation rises to well over 400 000 by 2030.
Additional jobs will be created by expanding the existing public employment schemes to protect the environment, as well as in production of biofuels.
The NGP notes that lessons from international experience point to the importance of emulation, adaptation and diffusion of existing technologies in ways that will support large-scale employment creation and improved livelihoods.
Given the specific mention of “additional jobs being created by expanding the existing public employment schemes to protect the environment”, it is clear that SIP 19 specifically contributes to this NGP Job Driver.
Jobs Driver 4: Investing in social capital and public services
The social economy includes myriad not-for-profit institutions that provide goods and services, including coops, non-governmental organisations (NGOs) and stokvels. The NGP believes that if the sector grew in South Africa closer to international norms, we can anticipate 260 000 new employment opportunities. The public service can also generate 100 000 jobs in health, education and policing by 2020 even if it grows by only 1% a year, as well as substantial opportunities through public employment schemes.
In addition, government will set targets for growth in the public service to meet national needs. It will also establish rural, literacy, green and HIV-education youth brigades that engage up to a million young people over the next few years, combined with measures to expose young people to work experience through internships in the private and public sectors. It will also extend the Community Works Programme to more wards.
Expansion of public employment will require proper budgeting and a strategy to ensure both affordability and cost effectiveness. Government is committed to developing a multi-pronged strategy to support youth employment in particular.
This is another NGP jobs driver that SIP 19 speaks to directly as it involves the expansion of, among others, public employment, in the improvement of water quality and quantity – a clear public service.

SIP 19: Ecological Infrastructure for Water Security
October 31, 2014
Page 71 of 100
New Growth Path Identified Jobs Drivers Possible Contribution From SIP 19
Jobs Driver 5: Spatial development
While urbanisation will continue, a significant share of the population will remain in rural areas, engaged in the rural economy. Government will step up its efforts to provide public infrastructure and housing in rural areas, both to lower the costs of economic activity and to foster sustainable communities. Rural development programmes can achieve a measurable improvement in livelihoods for 500 000 households, as well as stimulating employment in other sectors.
Enhancing rural employment requires finalisation of a spatial perspective that sets out the opportunities available and the choices that we must make in order to lay the basis for aligning government spending, infrastructure and housing investment and economic development initiatives. In addition, government must do more to support small-scale agriculture, including through community food gardens and marketing and service coops as well as accessible banking facilities.
Regional development is an imperative for both solidarity and sustainable growth.
This too is another NGP jobs driver that SIP 19 speaks to directly as it specifically involves the creation of jobs in affected rural areas (see also 12.3 and especially 12.3.1.).
12.2 Addressing Spatial imbalances
As noted in 9.5 (see page 45), the mapping exercise that informed the selection of the SIP 19’s
spatial focus areas included the maps used for the other SIPs, especially those dealing with
spatial imbalances. As a result of these attempts to correlate SIP 19’s spatial focus areas with,
for example, available information from the general SIP mapping exercise relating to public
service levels and Minimum Living Levels, SIP 19 will make a positive contribution to
addressing spatial imbalances.
Indeed, an extremely important observation has been made through the SIP 19 development
process, namely, that often our poorest and least serviced communities are effectively the
custodians of our water factories (see 9.1, page 41 and Figure 10) who receive no compensation
for this custodianship from the many people who benefit most from the water. With this, SIP 19
intends to specifically address this spatial imbalance through, among others, the creation of jobs
and other economic opportunities as described in 12.1 above.
12.3 Promoting rural development
As noted in the National Water Resource Strategy 2 (NWRS-2 (2013)), “water availability is a
crucial input to the Rural Development Strategy.” This notwithstanding, SIP 19 not only
contributes to the water security necessary for successful rural development, but also provides
potentially sustainable livelihoods to rural communities in prioritised water catchments (see
above). In this regard, the following provides one example of how SIP 19 can contribute to
sustainable rural development by way of payments for catchment protection services.
12.3.1 Payments for catchment protection services (PCPS)
Most governments, recognising the close relationship between land use and the quality and
quantity of both surface and ground water, have in the past tried to influence land-use decisions
through regulation. Typically, important parts of catchments were protected, while land use in
other parts of the catchment was controlled through various forms of legislation. Regulatory
mechanisms have generally failed to control land use, and water quality in particular has
suffered. In the last decade, an approach in which stewards of ecosystems are rewarded has
gained increasing recognition and interest amongst conservation and development experts. In
SIP 19: Ecological Infrastructure for Water Security
October 31, 2014
Page 72 of 100
watershed management, payments for good stewardship are generally made by downstream
users of water to upstream land managers. The applicability of payments for watershed services
(PWS), or payments for catchment protection services (PCPS) as they are known in South Africa,
to developing countries has been accelerated by their successful application, amongst others, in
Costa Rica, New York, and the Vittel Valley, France.
In South Africa, as mentioned in various sections of this document, controlling the spread of
alien invasive species is a major challenge and the removal of these invasives frees up millions
of m3 of water annually. The government’s Working for Water (WfW) Programme is one type of
PCPS – albeit publicly funded (see 11.1, page 54). WfW uses long-term unemployed persons,
mainly from rural areas, to remove invasive alien species from catchments to reduce their
negative impact on surface water.
A diagnostic report on payments for catchment protection services identified that the precedent
set by Working for Water created interesting but untested opportunities for the development of
privately led payments for catchment protection services. It is hoped that SIP 19 will explore
how these “interesting but untested opportunities” can be explored, tested and, where
appropriate, made a tangible and significant component of sustainable rural development.
12.4 Industrial development and localisation
It is broadly acknowledged that water availability is often a key constraint for industrial
development and, hence, an intervention aimed at improving water security must be regarded
as being supportive of industrial development. However, in terms of SIP 19’s direct contribution
to industrial development and localisation through, for example, the establishment of new
industries and the production of products that were previously imported, its impact, by
definition, is quite limited.
This notwithstanding, “localisation” is inherent to the concept of ecological infrastructure.
Investments in the restoration, rehabilitation, maintenance or creation of ecological
infrastructure will involve local people using local resources and, more often than not, low-tech
locally produced tools and technology. Furthermore, the establishment of small-scale, and often
rural, industries is often a spinoff of ecological infrastructure investments. For example, wood
from removed alien invasive trees is being used for the manufacture of coffins and furniture,
especially furniture like school desks.
12.5 Economic performance of poorest provinces
Improved water quantity and quality is good for the economy of all affected provinces.
However, as noted in 12.2 above, the mapping exercise that informed the selection of the SIP
19’s spatial focus areas included the maps used for the other SIPs, especially those dealing with
spatial imbalances. As a result of these attempts to correlate SIP 19’s spatial focus areas with,
for example, available information from the general SIP mapping exercise relating to public
service levels and Minimum Living Levels, SIP 19 will make a positive contribution to the
economic performance of some of the poorest provinces.
12.6 Greening economy
By definition, investing in “ecological infrastructure” is a green economy intervention. It is clear
that SIP 19 is the kind of intervention being referred to in the following quote from NDP 2030 –
SIP 19: Ecological Infrastructure for Water Security
October 31, 2014
Page 73 of 100
New initiatives, such as those to do with agriculture in the green
economy and conservation efforts, can potentially create new
employment opportunities in rural areas.
This notwithstanding, there is an extremely well-researched link between, at least, some
components of SIP 19 and greening the economy. DEA, in partnership with the United Nations
Environment Programme (UNEP) and with support from United Nations Development
Programme (UNDP), embarked on the development of a green economy modelling exercise for
South Africa, with technical assistance from the Millennium Institute and the Sustainability
Institute, in collaboration with the Centre for Renewable and Sustainable Energy Studies
(CRSES) of Stellenbosch University. The need for this modelling work has its origin in the first
national green economy summit that was held in May 2010, which was aimed at catalysing
efforts towards a resource efficient, low carbon and pro-employment growth path.
The product of this work was the South African Green Economy Modelling (SAGEM) report that
was developed to test national targets and the effects of investing in a green economy in South
Africa. The SAGEM report was developed on the same basis as the model that underpins the
UNEP Green Economy Report (GER).
The SAGEM report, developed through a consultation process, was launched by The Deputy
Minister of Water and Environmental Affairs at the Durban UNFCCC COP17 in December 2011.
Subsequent engagements included a stakeholder workshop in February 2012 to identify focus
areas and data sources for the study, capacity building training in May 2012 for government
officials and consultation on the draft report in June 2012. The workshops included
participation from the sector departments, provincial and local government representatives,
private sector, NGOs, and academia. The modelling report was finalised and validated to
incorporate the NDP 2030 from July to November 2012.
The SAGEM report, which is based on a system dynamics modelling approach, is primarily
aimed at assessing the impacts of green economy investments in selected sectors pertaining to
the South African economy. Based on planned targets and expenditures and/or costs of
interventions, the modelling identifies the possible options and opportunities to achieving these
targets. Four scenarios were defined: (i) Business-as-usual (BAU); (ii) BAU2% representing a 2
per cent investment of gross domestic product in the BAU activities; (iii) GE2% representing an
allocation of 2 per cent of gross domestic product in green economy sectors (natural resource
management, agriculture, transport and energy); and (iv) the Green Economy Target Specific
Scenario (GETS), which is a scenario aimed at identifying whether policy-makers can achieve
the medium- to long-term targets following green economy interventions in the prioritised
sectors.
The 2 selected sectors modelled by the SAGEM of direct relevance to SIP 19 are:
• Natural resource management – including interventions to decrease the land area that is
infested with invasive alien species; and
• Agriculture – including interventions to increase the yield and land under agricultural
production.
The modelled scenarios for these two sectors is summarised in Table 10.
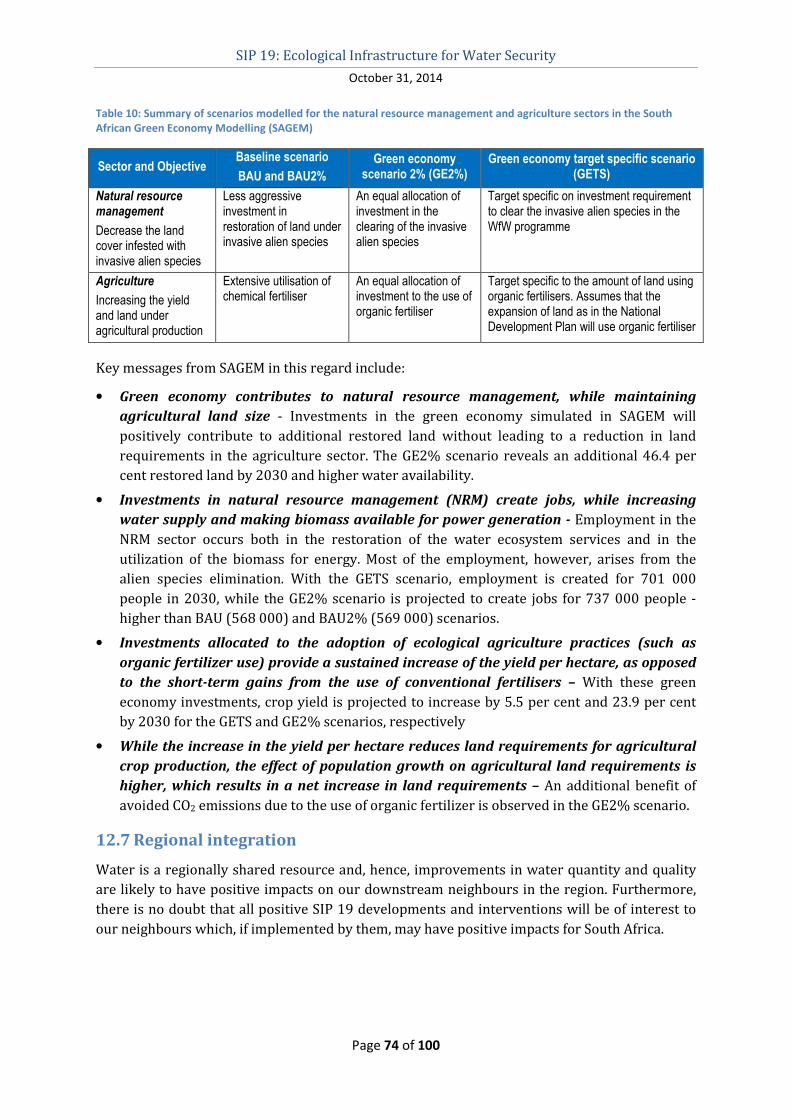
SIP 19: Ecological Infrastructure for Water Security
October 31, 2014
Page 74 of 100
Table 10: Summary of scenarios modelled for the natural resource management and agriculture sectors in the South
African Green Economy Modelling (SAGEM)
Sector and Objective Baseline scenario
BAU and BAU2%
Green economy scenario 2% (GE2%)
Green economy target specific scenario (GETS)
Natural resource management
Decrease the land cover infested with invasive alien species
Less aggressive investment in restoration of land under invasive alien species
An equal allocation of investment in the clearing of the invasive alien species
Target specific on investment requirement to clear the invasive alien species in the WfW programme
Agriculture
Increasing the yield and land under agricultural production
Extensive utilisation of chemical fertiliser
An equal allocation of investment to the use of organic fertiliser
Target specific to the amount of land using organic fertilisers. Assumes that the expansion of land as in the National Development Plan will use organic fertiliser
Key messages from SAGEM in this regard include:
• Green economy contributes to natural resource management, while maintaining
agricultural land size - Investments in the green economy simulated in SAGEM will
positively contribute to additional restored land without leading to a reduction in land
requirements in the agriculture sector. The GE2% scenario reveals an additional 46.4 per
cent restored land by 2030 and higher water availability.
• Investments in natural resource management (NRM) create jobs, while increasing
water supply and making biomass available for power generation - Employment in the
NRM sector occurs both in the restoration of the water ecosystem services and in the
utilization of the biomass for energy. Most of the employment, however, arises from the
alien species elimination. With the GETS scenario, employment is created for 701 000
people in 2030, while the GE2% scenario is projected to create jobs for 737 000 people -
higher than BAU (568 000) and BAU2% (569 000) scenarios.
• Investments allocated to the adoption of ecological agriculture practices (such as
organic fertilizer use) provide a sustained increase of the yield per hectare, as opposed
to the short-term gains from the use of conventional fertilisers – With these green
economy investments, crop yield is projected to increase by 5.5 per cent and 23.9 per cent
by 2030 for the GETS and GE2% scenarios, respectively
• While the increase in the yield per hectare reduces land requirements for agricultural
crop production, the effect of population growth on agricultural land requirements is
higher, which results in a net increase in land requirements – An additional benefit of
avoided CO2 emissions due to the use of organic fertilizer is observed in the GE2% scenario.
12.7 Regional integration
Water is a regionally shared resource and, hence, improvements in water quantity and quality
are likely to have positive impacts on our downstream neighbours in the region. Furthermore,
there is no doubt that all positive SIP 19 developments and interventions will be of interest to
our neighbours which, if implemented by them, may have positive impacts for South Africa.
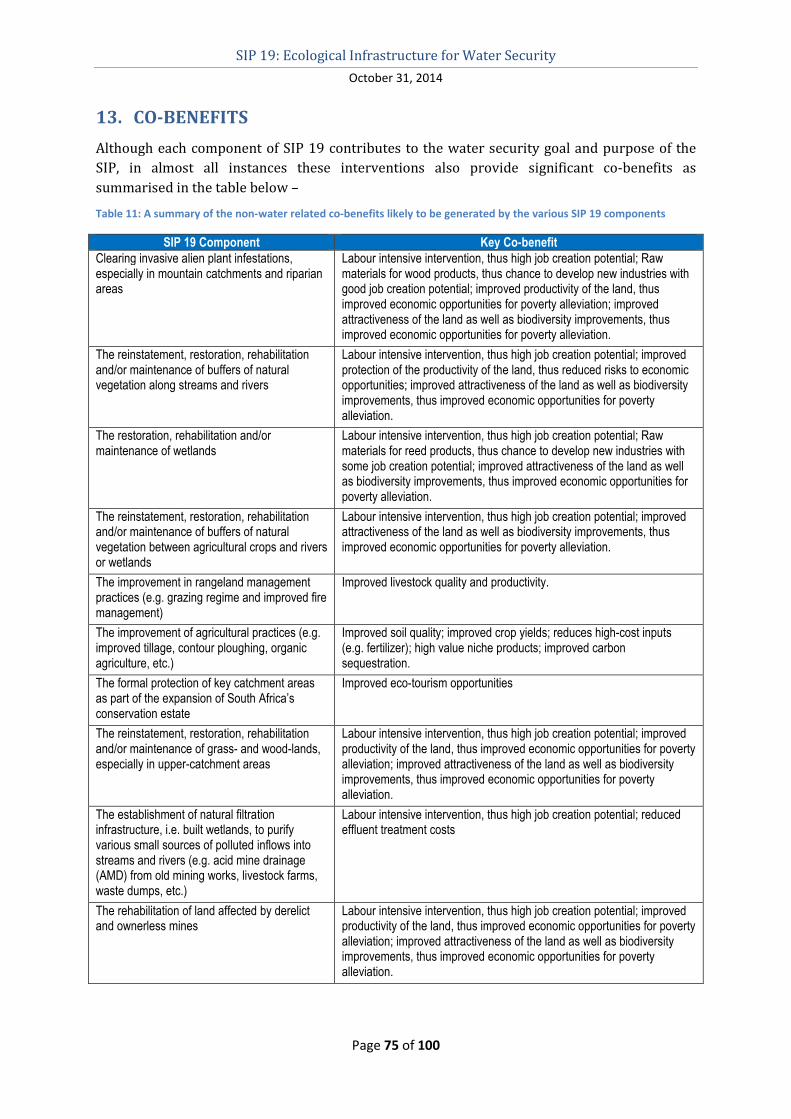
SIP 19: Ecological Infrastructure for Water Security
October 31, 2014
Page 75 of 100
13. CO-BENEFITS
Although each component of SIP 19 contributes to the water security goal and purpose of the
SIP, in almost all instances these interventions also provide significant co-benefits as
summarised in the table below –
Table 11: A summary of the non-water related co-benefits likely to be generated by the various SIP 19 components
SIP 19 Component Key Co-benefit
Clearing invasive alien plant infestations, especially in mountain catchments and riparian areas
Labour intensive intervention, thus high job creation potential; Raw materials for wood products, thus chance to develop new industries with good job creation potential; improved productivity of the land, thus improved economic opportunities for poverty alleviation; improved attractiveness of the land as well as biodiversity improvements, thus improved economic opportunities for poverty alleviation.
The reinstatement, restoration, rehabilitation and/or maintenance of buffers of natural vegetation along streams and rivers
Labour intensive intervention, thus high job creation potential; improved protection of the productivity of the land, thus reduced risks to economic opportunities; improved attractiveness of the land as well as biodiversity improvements, thus improved economic opportunities for poverty alleviation.
The restoration, rehabilitation and/or maintenance of wetlands
Labour intensive intervention, thus high job creation potential; Raw materials for reed products, thus chance to develop new industries with some job creation potential; improved attractiveness of the land as well as biodiversity improvements, thus improved economic opportunities for poverty alleviation.
The reinstatement, restoration, rehabilitation and/or maintenance of buffers of natural vegetation between agricultural crops and rivers or wetlands
Labour intensive intervention, thus high job creation potential; improved attractiveness of the land as well as biodiversity improvements, thus improved economic opportunities for poverty alleviation.
The improvement in rangeland management practices (e.g. grazing regime and improved fire management)
Improved livestock quality and productivity.
The improvement of agricultural practices (e.g. improved tillage, contour ploughing, organic agriculture, etc.)
Improved soil quality; improved crop yields; reduces high-cost inputs (e.g. fertilizer); high value niche products; improved carbon sequestration.
The formal protection of key catchment areas as part of the expansion of South Africa’s conservation estate
Improved eco-tourism opportunities
The reinstatement, restoration, rehabilitation and/or maintenance of grass- and wood-lands, especially in upper-catchment areas
Labour intensive intervention, thus high job creation potential; improved productivity of the land, thus improved economic opportunities for poverty alleviation; improved attractiveness of the land as well as biodiversity improvements, thus improved economic opportunities for poverty alleviation.
The establishment of natural filtration infrastructure, i.e. built wetlands, to purify various small sources of polluted inflows into streams and rivers (e.g. acid mine drainage (AMD) from old mining works, livestock farms, waste dumps, etc.)
Labour intensive intervention, thus high job creation potential; reduced effluent treatment costs
The rehabilitation of land affected by derelict and ownerless mines
Labour intensive intervention, thus high job creation potential; improved productivity of the land, thus improved economic opportunities for poverty alleviation; improved attractiveness of the land as well as biodiversity improvements, thus improved economic opportunities for poverty alleviation.
SIP 19: Ecological Infrastructure for Water Security
October 31, 2014
Page 76 of 100
14. SIP 19 INPUTS
14.1 Funding
Apart from the new funding required to manage and administer the SIP 19, the actual SIP 19
components are required to source their own funds.
Notwithstanding the above, there is a strong belief that –
• Interventions that are recognised as being part of a coordinated, coherent and focussed
programme specifically aimed at ensuring a sustainable supply of fresh, healthy water to
equitably meet South Africa’s social, economic and environmental water needs for current
and future generations stand a better chance of being funded than those that are not;
• New funding sources may be made available to recognised components of a successful
programme;
• Limited financial resources may be more effectively utilised if they are used in a
coordinated, coherent and focussed programme that avoids duplication and unnecessary
overlap;
• New funding mechanism can be explored and tested by SIP 19.
14.1.1 Environmental Offsetting
Over the last few years government and other research bodies have been investigating the
concept of environmental offsetting as an additional mechanism to address the continuous
overall decline in environmental quality and is starting to view environmental offsetting as the
possible “missing link” in sustainable development.
For the purposes of this discussion, the following working definition of environmental offsetting
is used –
“An environmental offset is an intervention, or interventions,
specifically implemented to counterbalance an adverse
environmental impact of land-use change, resource use, discharge,
emission or other activity at one location that is implemented at
another location to deliver a net environmental benefit”.
From the initial work in this regard, it is clear that there are a number of environmental offset
types, of which Carbon (greenhouse gas emission) offsets11 and Biodiversity offsets12 probably
have the most relevance to SIP 19. In this regard, SIP 19 could provide a perfect vehicle to
identify possible offset projects as SIP 19 components and could be used to test and refine the
offsetting concept. In this way, many important SIP 19 components could be funded by
11
An internationally applicable mechanism for counterbalancing atmospheric greenhouse gas emissions through
interventions that reduce current and/or future emissions or that reduce atmospheric greenhouse gas
concentrations (e.g. tree-planting). 12
A nationally or regionally applicable mechanism that the DEA’s Biodiversity and Conservation Branch and
South African National Biodiversity Institute (SANBI) define as follows – “A biodiversity offset is the
measurable conservation outcomes resulting from actions designed to compensate for significant negative
residual impacts on biodiversity arising from project development after appropriate prevention and mitigation
measures have been taken.”

SIP 19: Ecological Infrastructure for Water Security
October 31, 2014
Page 77 of 100
companies wishing, or required, to “compensate for significant negative residual impacts on
biodiversity arising from project development”.
14.2 Human Resources
As for funding (see 14.1 above), apart from the staff required to manage and administer the SIP
19, the actual SIP 19 components are required to source their own human resources.
15. THE COMPLEMENTARY RELATIONSHIP BETWEEN SIP 19 AND
OTHER SIPS, ESPECIALLY SIP 18
From the description of the various components provided in Section 10 above, and especially
those related to “improved agriculture-impacted ecological infrastructure”, it is clear that SIP 19
must build a strong relationship to the agricultural SIP, SIP 11, in terms of building ecological
infrastructure to support rural development and agricultural systems, promote healthy
management of rangelands, ensure healthy livestock and promote more productive and
sustainable livelihoods.
SIP 18 is the SIP dealing with water and sanitation infrastructure, or more precisely, it is the SIP
dealing with the National Water and Sanitation Infrastructure Master Plan. In essence, SIP 18
has been designed to ensure a sustainable supply of water to meet social needs and support
economic growth as well as a comprehensive sanitation service that enhances community
wellbeing, reduces health care costs and improves productivity.
This 10-year plan will address the estimated backlog of access to adequate water to 1,4 million
households and 2,1 million households’ access to basic sanitation. The recent Blue Drop Report
(2010) and “green drop” report indicates that of 914 water supply systems assessed, 41%
scored less than 50%. Similarly, 55% out of 821 wastewater treatment works are in a collapsed
state. On site sanitation systems provided in mostly rural areas are relatively robust but there is
inadequate provision for pit emptying. Improved arrangements with respect to national entities,
catchment management agencies and water boards are proposed for the water institutions
responsible for infrastructure with a replacement asset value estimated at R 968bn.
Water wastage and inefficiencies account for revenue losses of more than R11bn per annum in
the municipal sector alone. As a water scarce country, the PICC supports water demand
measure including advanced pressure management projects, water leak management and water
demand awareness measures.
SIP 18 is not spatially focussed and is regarded as being a nation-wide project.
SIP 18 components include:
• Projects to provide new infrastructure, rehabilitate and upgrade existing infrastructure for:
o Development of water resources
o Potable water supply
o Non-potable water distribution
o Collection of water borne sewage
o Waste water treatment
o On-site sanitation
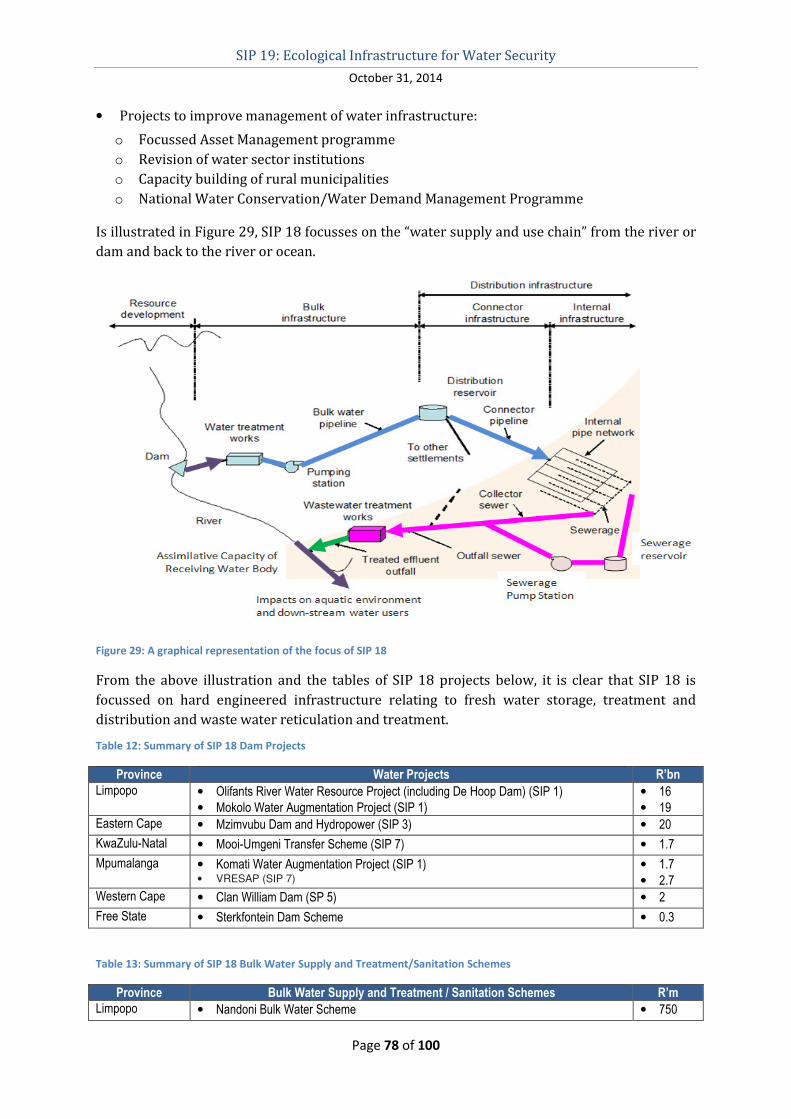
SIP 19: Ecological Infrastructure for Water Security
October 31, 2014
Page 78 of 100
• Projects to improve management of water infrastructure:
o Focussed Asset Management programme
o Revision of water sector institutions
o Capacity building of rural municipalities
o National Water Conservation/Water Demand Management Programme
Is illustrated in Figure 29, SIP 18 focusses on the “water supply and use chain” from the river or
dam and back to the river or ocean.
Figure 29: A graphical representation of the focus of SIP 18
From the above illustration and the tables of SIP 18 projects below, it is clear that SIP 18 is
focussed on hard engineered infrastructure relating to fresh water storage, treatment and
distribution and waste water reticulation and treatment.
Table 12: Summary of SIP 18 Dam Projects
Province Water Projects R’bn
Limpopo • Olifants River Water Resource Project (including De Hoop Dam) (SIP 1) • Mokolo Water Augmentation Project (SIP 1)
• 16 • 19
Eastern Cape • Mzimvubu Dam and Hydropower (SIP 3) • 20
KwaZulu-Natal • Mooi-Umgeni Transfer Scheme (SIP 7) • 1.7
Mpumalanga • Komati Water Augmentation Project (SIP 1) • VRESAP (SIP 7)
• 1.7 • 2.7
Western Cape • Clan William Dam (SP 5) • 2
Free State • Sterkfontein Dam Scheme • 0.3
Table 13: Summary of SIP 18 Bulk Water Supply and Treatment/Sanitation Schemes
Province Bulk Water Supply and Treatment / Sanitation Schemes R’m
Limpopo • Nandoni Bulk Water Scheme • 750
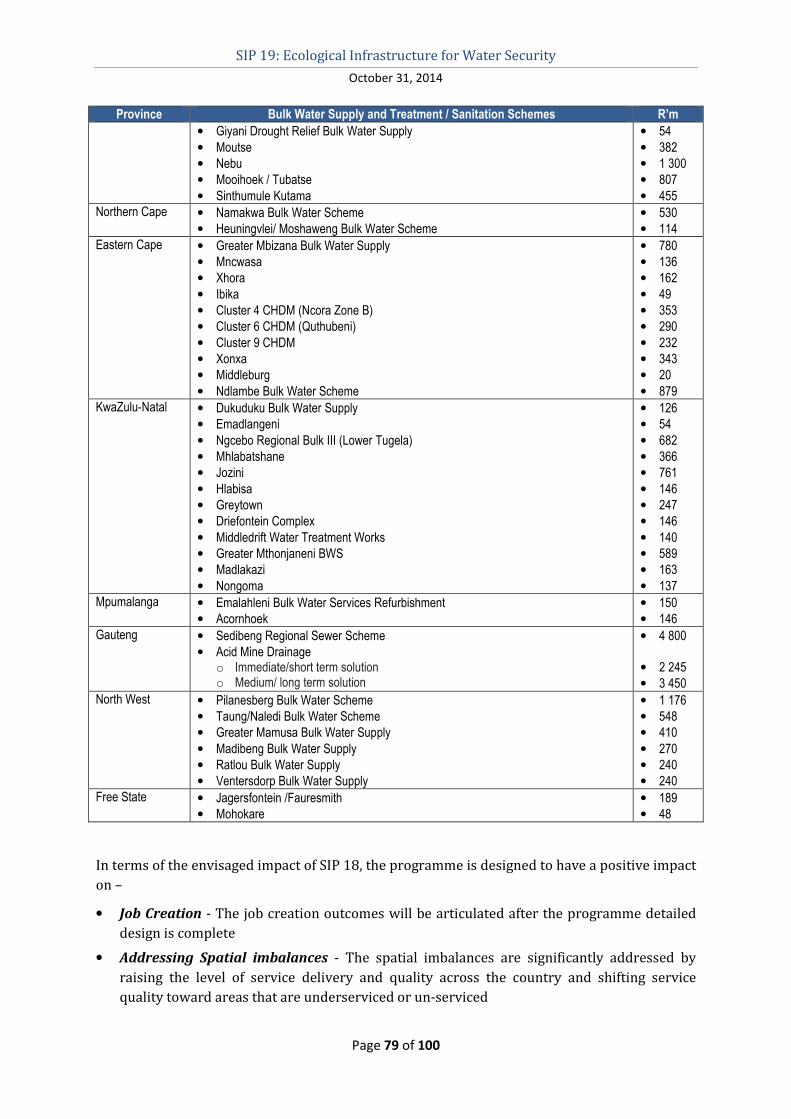
SIP 19: Ecological Infrastructure for Water Security
October 31, 2014
Page 79 of 100
Province Bulk Water Supply and Treatment / Sanitation Schemes R’m
• Giyani Drought Relief Bulk Water Supply • Moutse • Nebu • Mooihoek / Tubatse • Sinthumule Kutama
• 54 • 382 • 1 300 • 807 • 455
Northern Cape • Namakwa Bulk Water Scheme • Heuningvlei/ Moshaweng Bulk Water Scheme
• 530 • 114
Eastern Cape • Greater Mbizana Bulk Water Supply • Mncwasa • Xhora • Ibika • Cluster 4 CHDM (Ncora Zone B) • Cluster 6 CHDM (Quthubeni) • Cluster 9 CHDM • Xonxa • Middleburg • Ndlambe Bulk Water Scheme
• 780 • 136 • 162 • 49 • 353 • 290 • 232 • 343 • 20 • 879
KwaZulu-Natal • Dukuduku Bulk Water Supply • Emadlangeni • Ngcebo Regional Bulk III (Lower Tugela) • Mhlabatshane • Jozini • Hlabisa • Greytown • Driefontein Complex • Middledrift Water Treatment Works • Greater Mthonjaneni BWS • Madlakazi • Nongoma
• 126 • 54 • 682 • 366 • 761 • 146 • 247 • 146 • 140 • 589 • 163 • 137
Mpumalanga • Emalahleni Bulk Water Services Refurbishment • Acornhoek
• 150 • 146
Gauteng • Sedibeng Regional Sewer Scheme • Acid Mine Drainage
o Immediate/short term solution o Medium/ long term solution
• 4 800
• 2 245 • 3 450
North West • Pilanesberg Bulk Water Scheme • Taung/Naledi Bulk Water Scheme • Greater Mamusa Bulk Water Supply • Madibeng Bulk Water Supply • Ratlou Bulk Water Supply • Ventersdorp Bulk Water Supply
• 1 176 • 548 • 410 • 270 • 240 • 240
Free State • Jagersfontein /Fauresmith • Mohokare
• 189 • 48
In terms of the envisaged impact of SIP 18, the programme is designed to have a positive impact
on –
• Job Creation - The job creation outcomes will be articulated after the programme detailed
design is complete
• Addressing Spatial imbalances - The spatial imbalances are significantly addressed by
raising the level of service delivery and quality across the country and shifting service
quality toward areas that are underserviced or un-serviced
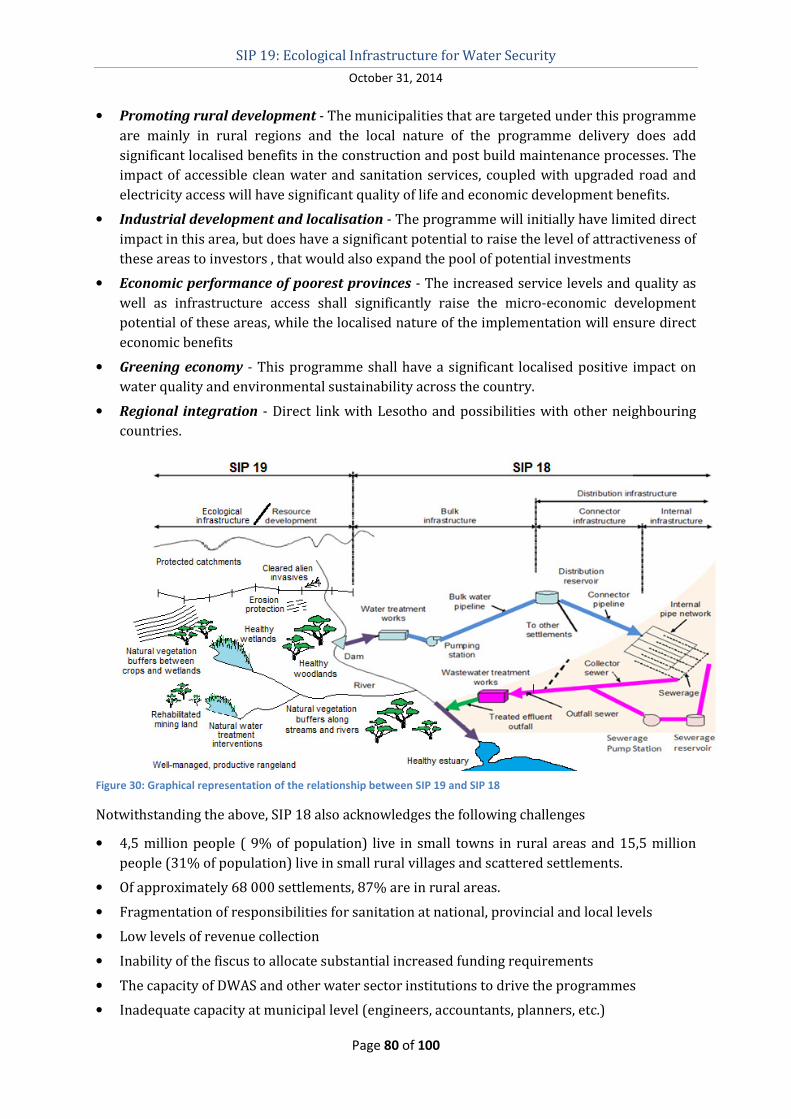
SIP 19: Ecological Infrastructure for Water Security
October 31, 2014
Page 80 of 100
• Promoting rural development - The municipalities that are targeted under this programme
are mainly in rural regions and the local nature of the programme delivery does add
significant localised benefits in the construction and post build maintenance processes. The
impact of accessible clean water and sanitation services, coupled with upgraded road and
electricity access will have significant quality of life and economic development benefits.
• Industrial development and localisation - The programme will initially have limited direct
impact in this area, but does have a significant potential to raise the level of attractiveness of
these areas to investors , that would also expand the pool of potential investments
• Economic performance of poorest provinces - The increased service levels and quality as
well as infrastructure access shall significantly raise the micro-economic development
potential of these areas, while the localised nature of the implementation will ensure direct
economic benefits
• Greening economy - This programme shall have a significant localised positive impact on
water quality and environmental sustainability across the country.
• Regional integration - Direct link with Lesotho and possibilities with other neighbouring
countries.
Figure 30: Graphical representation of the relationship between SIP 19 and SIP 18
Notwithstanding the above, SIP 18 also acknowledges the following challenges
• 4,5 million people ( 9% of population) live in small towns in rural areas and 15,5 million
people (31% of population) live in small rural villages and scattered settlements.
• Of approximately 68 000 settlements, 87% are in rural areas.
• Fragmentation of responsibilities for sanitation at national, provincial and local levels
• Low levels of revenue collection
• Inability of the fiscus to allocate substantial increased funding requirements
• The capacity of DWAS and other water sector institutions to drive the programmes
• Inadequate capacity at municipal level (engineers, accountants, planners, etc.)
SIP 19: Ecological Infrastructure for Water Security
October 31, 2014
Page 81 of 100
• Timeous implementation of the proposed water sector institutional realignment
• Low revenue base in rural municipalities due to poverty levels
• Urgently resolve the Acid Mine Drainage (AMD) problem in Gauteng
From all of the above, although it is clear that both SIP 19 and SIP 18 deal with water in the
same way as SIPs 8, 9 and 10 deal with energy, SIP 19 and SIP 18 are completely
complementary as illustrated in Figure 30. Indeed, it can be strongly argued that the sustained
success of SIP 18 is very dependent on the success of SIP 19.
16. ALIGNMENT WITH THE NATIONAL DEVELOPMENT PLAN (NDP
2030)
With specific reference to SIP 19, the NDP 2030 has the following water-specific objective,
among others –
“Ensure that all people have access to clean, potable water and
that there is enough water for agriculture and industry,
recognising the trade-offs in the use of water”
The NDP 2030 also identifies the following specific “actions” among others –
• NDP 2030 Action number 24 – A comprehensive management strategy including an
investment programme for water resource development, bulk water supply and wastewater
management for major centres by 2012, with reviews every five years;
• 26 – Timely development of several new water schemes to supply urban and industrial
centres, new irrigation systems in the Umzimvubu river basin and Makhathini Flats, and a
national water conservation programme to improve water use and efficiency;
In the NDP 2030’s Chapter 1 entitled “Policy Making in a Complex Environment”, section
entitled “The environment” the following is recognised –
Market and policy failures have resulted in the global economy
entering a period of "ecological deficit", as natural capital (ground
water, marine life, terrestrial biodiversity, crop land and grazing)
is being degraded, destroyed, or depleted faster than it can be
replenished. Waste and carbon-equivalent emissions per capita are
climbing faster every year in an ecosystem with finite limits.
In its Chapter 8 – Transforming Human Settlement – sub-section on “Develop a national spatial
framework for resource-critical regions”, the NDP 2030 notes that there are specific regions of
South Africa that have natural resources that provide ecosystem lifelines to the country that
may require specific policies to ensure their sustainability. They may include areas of highly
valued mineral resources (the platinum belt); areas of great importance for biodiversity (the
Western Cape); and critical water production areas (various catchments along the Eastern
Escarpment). The NDP 2030 also notes that regions with competition between development
SIP 19: Ecological Infrastructure for Water Security
October 31, 2014
Page 82 of 100
and environment, or between competing environmental uses (the Mpumalanga Highveld) may
also fall under this category.
Water-related infrastructure is one of the 8 major infrastructure interventions prioritised by the
NDP 2030, specifically: Developing, in a timely manner, several new water schemes to supply
urban and industrial centres, new irrigation systems in the Umzimvubu river basin and
Makatini Flats, and a national water conservation programme to improve water use and
efficiency.
Furthermore, Chapter 4 of the NDP 2030, entitled “Economy infrastructure – The foundation of
social and economic development”, contains specific sections on, among others, “Access to basic
electricity, water and sanitation, and public transport” and “Water resources and services”.
The NDP 2030 recognises water as a strategic resource critical for social and economic
development and notes growing concern about the potential impact of water-related risks.
South Africa ranks low – 128th of 132 countries – in Yale University's Environmental
Performance Index. This is attributed, in part, to the poor state of our water ecosystems. South
Africa also ranks 148th out of 180 countries in terms of water availability per capita, according
to the 2012 World Water Development Report. Since South Africa is already a water-scarce
country, the NDP 2030 states that greater attention will have to be paid to its management and
use.
To this end, NDP 2030 requires that natural water sources be protected to prevent excessive
extraction and pollution and that water is recognised as a foundation for activities such as
tourism and recreation, reinforcing the importance of its protection.
The NDP 2030 also suggests that alternative solutions such as community-based management,
local franchising or the use of regional water utilities should be allowed if they would be more
effective.
The NDP 2030 states that managing, monitoring and protecting South Africa's water resources
in a sustainable way while allowing for economic growth demands the following, among others:
• Prioritisation - There is an urgent need for a coherent plan to ensure the protection of
water resources and the environment in the Mpumalanga Highveld coalfields, upstream of
the Vaal and Loskop dams, as well as in the Lephalale-Waterberg area. Given environmental
pressures and development demands, current water allocations in the upper Vaal and
Olifants River water management areas urgently need to be revised.
• Manage agricultural use better - Agriculture uses the largest volume of water (even
though agricultural water supplies are less reliable than those supplied to urban and
industrial users). The farming sector will have to increase its water efficiency to improve
production and allow for water to be transferred to new users in water-scarce areas, to
compensate for the expansion of irrigated agriculture, which has high job-creation potential.
The Commission proposes a dedicated national programme to provide support to local and
sectoral efforts to reduce water demand and improve water-use efficiency. Water-saving
and demand-management projects should be considered as part of the overall range of
water-supply investment programmes. These can be compared with supply expansion
projects, and should be prioritised accordingly, based on their merits.
• Investigate water reuse and desalination - There is already extensive indirect reuse of
water in inland areas, where municipal and industrial wastewater is reintroduced into
SIP 19: Ecological Infrastructure for Water Security
October 31, 2014
Page 83 of 100
rivers after treatment. However, there is considerable scope for further water reuse. Many
municipalities lack the technical capacity to build and manage their wastewater treatment
systems. As a result, a regional approach to wastewater management may be required in
certain areas. Water infrastructure investment should include projects to treat and reuse
water, selected on their merits. Research into water reuse and desalination and the skills to
operate such technology should be developed, perhaps under the auspices of a national
water-resource infrastructure agency or the Water Research Commission.
The NDP 2030 believes that institutional development is particularly needed for the Olifants
River, Crocodile-west sub-catchments of the Limpopo, the Nkomati River and the upper and
middle Vaal sub-catchments, and the Umzimvubu River in the Eastern Cape, where water
supplies have already reached their limit and where water allocations need to be reviewed.
Such catchment-based institutions will need strong support from national bodies, especially in
terms of resource monitoring and infrastructure planning.
The NDP 2030 lists the following policy issues, among others, to guide appropriate actions to
improve the management, use and conservation of South Africa's water resources:
• Enhanced management capacity will be needed to address the increasing pressures on
water resources. This capacity is in decline, partly due to institutional uncertainty. New
institutional arrangements should acknowledge limited human resource capacity and give
high priority to the development and retention of the specialised staff required. Current
human-resource development programmes have had limited success and must be made a
strategic priority. • Institutional arrangements for water-resource management need to be finalised, specifically
the number of water-management areas to be established, the mechanisms through which
users will be involved in the management of water in these areas, as well as the organisation
of the management and development of major water resource infrastructure.
• A review of existing water allocations is needed in areas where new users are seeking
access, but current users already take more than can reliably be provided. There is statutory
provision for these reviews, which if not undertaken, will result in a rise of illegal use and
the over-allocation of the resource. This will reduce supply reliability, jeopardise existing
social and economic uses and damage the environment.
• To guide water-management approaches, strategic planning decisions are needed on
general economic and social development, as well as environmental protection. Geographic
areas where this is needed include:
o Mpumalanga Highveld coalfields – a balance between environmental protection,
agriculture, energy requirements and water resources.
o Lephalale and Waterberg areas – water requirements and sources for mining and energy
investments.
o Olifants River (Limpopo/Mpumalanga) – careful consideration of the balance between
mining, agriculture and nature conservation.
o Umzimvubu River (Eastern Cape) – water-resource development could support
agriculture, domestic supply, hydropower production, transport and tourism if planned
in a coordinated manner.
SIP 19: Ecological Infrastructure for Water Security
October 31, 2014
Page 84 of 100
• Investments to support economic uses of water, including urban consumption, should
normally be funded by users through appropriate pricing measures, which must include
arrangements to ensure that all people can afford access to basic water services. However,
the challenges of sustaining service provision in poor municipalities must be recognised and
addressed.
• It is likely that a substantial proportion of investments to support rural development
(including agriculture and rural settlements) will have to be publicly funded. Policy is
needed to guide such investments to achieve a balance between financial costs and social
benefits.
• The norms and standards for basic water supply and sanitation services should guide the
allocation of funds to municipalities. However, in many cases, new investments are routinely
designed to exceed existing norms and standards, resulting in service provision that is
financially unsustainable. An urgent review of the norms and standards, together with the
financial provisions to meet these, is required.
• Many small and rural municipalities lack the financial and technical capacity to manage
water services adequately. Some flexibility in approach is recommended, which could
include the use of regional utilities and community management of franchise arrangements,
provided municipalities retain their role as the political authority responsible for service
oversight.
In charting a way forward for water management, the NDP 2030 lists the following trade-offs
and issues, among others –
• A balance has to be achieved between water allocations for industrial and urban use, with
important economic implications, and for agriculture and conservation, which have
important social and environmental implications.
• Greater water-use efficiency in agriculture tends to be capital- and skills-intensive, but may
in turn support job creation. These gains will be difficult for new entrants to agriculture to
achieve without substantial support.
• The costs associated with environmental protection (for example, those associated with
enforcing pollution standards and extraction of restrictions) should be set against social and
economic needs. Current legislation allows for different levels of protection, but in many
cases water reserved for the environment is already used for other purposes.
• Any review of norms and standards for basic water supply and sanitation services should
consider whether service provision through public infrastructure is advisable outside
formal settlement areas, given the high costs associated with serving scattered rural
communities. Household grants for self-supply may be considered in some areas.
• A balance is needed between allocating financial resources to support investments in higher
levels of service and providing services to underserved households, while also maintaining
and periodically refurbishing existing infrastructure.
• In some rural areas (for example, around Sekhukhune district municipality in Limpopo and
Bushbuckridge local municipality in Mpumalanga), reliable water supplies can only be made
available through large and costly distribution works. Decisions about such schemes must
recognise that they are unlikely to be viable without substantial on-going operating
subsidies.

SIP 19: Ecological Infrastructure for Water Security
October 31, 2014
Page 85 of 100
Between 2012 and 2015, the following actions are required to achieve the 2030 goals:
• The national water-resource strategy should be tabled for consultation by mid-2012 and
approved by year-end to guide the development of the sector. Along with the water-
resource investment programme, it should be reviewed in consultation with water users
and other stakeholders every five years to ensure that it adapts to changing environmental,
social and economic circumstances.
• Future institutional arrangements for water-resource management must be defined by the
end of 2012, with implementation by 2015 at the latest, if institutional memory is to be
retained and continuity in management ensured. The institutional arrangements could
include:
o A national water-resource infrastructure agency that will develop and manage large
economic infrastructure systems.
o Catchment management agencies to undertake resource management on a decentralised
basis, with the involvement of local stakeholders.
o National capacity to support research, development and operation of water reuse and
desalination facilities.
• A dedicated national water-conservation and demand-management programme, with clear
national and local targets for 2017 and 2022, and sub-programmes focused on
municipalities, industry and agriculture.
• A comprehensive investment programme for water-resource development, bulk-water
supply and wastewater management must be established for major centres is being
finalised and should be reviewed every five years. This programme will include the
following major investment projects, with clear allocation of responsibilities for financing
and implementation and set targets for completion:
o The Lesotho Highlands Project Phase 2, which is to be completed by 2020 to supply the
Vaal system.
o Current KwaZulu-Natal Midlands projects (eThekwini and Msunduzi municipalities and
surrounds), which need to be completed and future major augmentations decided on.
These augmentations could be through desalination, reuse or by building a new dam on
the Mkomazi River in time for water to be available in 2022.
o Western Cape water-reuse and groundwater projects, which are to be completed by
2017.
• Regional water infrastructure investments and bulk-water supply programmes, which must
be defined by the end of 2012, with clear implementation targets.
• The management of water services must be strengthened and regional water and
wastewater utilities established to support municipalities (including expanding mandates of
existing water boards) by 2017.
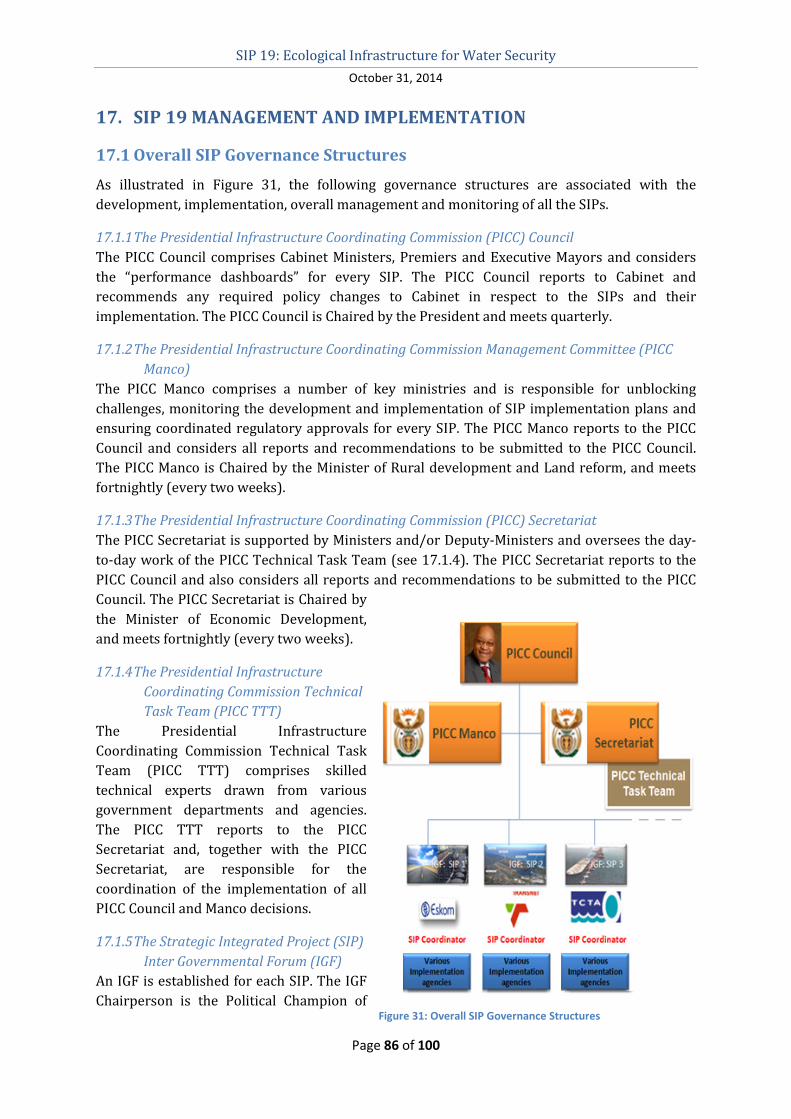
SIP 19: Ecological Infrastructure for Water Security
October 31, 2014
Page 86 of 100
17. SIP 19 MANAGEMENT AND IMPLEMENTATION
17.1 Overall SIP Governance Structures
As illustrated in Figure 31, the following governance structures are associated with the
development, implementation, overall management and monitoring of all the SIPs.
17.1.1 The Presidential Infrastructure Coordinating Commission (PICC) Council
The PICC Council comprises Cabinet Ministers, Premiers and Executive Mayors and considers
the “performance dashboards” for every SIP. The PICC Council reports to Cabinet and
recommends any required policy changes to Cabinet in respect to the SIPs and their
implementation. The PICC Council is Chaired by the President and meets quarterly.
17.1.2 The Presidential Infrastructure Coordinating Commission Management Committee (PICC
Manco)
The PICC Manco comprises a number of key ministries and is responsible for unblocking
challenges, monitoring the development and implementation of SIP implementation plans and
ensuring coordinated regulatory approvals for every SIP. The PICC Manco reports to the PICC
Council and considers all reports and recommendations to be submitted to the PICC Council.
The PICC Manco is Chaired by the Minister of Rural development and Land reform, and meets
fortnightly (every two weeks).
17.1.3 The Presidential Infrastructure Coordinating Commission (PICC) Secretariat
The PICC Secretariat is supported by Ministers and/or Deputy-Ministers and oversees the day-
to-day work of the PICC Technical Task Team (see 17.1.4). The PICC Secretariat reports to the
PICC Council and also considers all reports and recommendations to be submitted to the PICC
Council. The PICC Secretariat is Chaired by
the Minister of Economic Development,
and meets fortnightly (every two weeks).
17.1.4 The Presidential Infrastructure
Coordinating Commission Technical
Task Team (PICC TTT)
The Presidential Infrastructure
Coordinating Commission Technical Task
Team (PICC TTT) comprises skilled
technical experts drawn from various
government departments and agencies.
The PICC TTT reports to the PICC
Secretariat and, together with the PICC
Secretariat, are responsible for the
coordination of the implementation of all
PICC Council and Manco decisions.
17.1.5 The Strategic Integrated Project (SIP)
Inter Governmental Forum (IGF)
An IGF is established for each SIP. The IGF
Chairperson is the Political Champion of Figure 31: Overall SIP Governance Structures
SIP 19: Ecological Infrastructure for Water Security
October 31, 2014
Page 87 of 100
the SIP. A Minister is appointed as Chair and this Minister need not necessarily be the Minister
who is the Shareholder of the SIP Coordinator (see 17.1.6). The IGF coordinates and aligns
across all spheres of government and different government departments and is used by the SIP
Coordinator for this purpose, i.e. if a coordination or alignment challenges is revealed that the
SIP Coordinator cannot effectively address, the issue is escalated to the IGF for intervention.
Notwithstanding this relationship between the IGF and the SIP Coordinator, the IGF
Chairperson’s Department does not have any specific powers in respect of the SIP Coordinator.
17.1.6 The Strategic Integrated Project (SIP) Coordinators
A SIP Coordinator is nominated for each SIP. The SIP Coordinator is usually a State-Owned
Entity/Company (SOE/SOC). The SIP Coordinators support the PICC TTT. As such, SIP
Coordinators are regarded as an extension of the PICC TTT and reports to the PICC Secretariat
through the PICC TTT.
The SIP Coordinator is responsible for the technical coordination of the implementation of the
SIP under the guidance of the IGF (see 17.1.5) and must report regularly to the IGF, PICC
Secretariat and PICC Manco.
To this end, the SIP Coordinator is responsible for, among others:
• The appointment or assignment of a dedicated senior manager to manage the work of the
SIP Coordinator;
• Ensuring that each SIP component has an appointed project manager and that the budgets,
costs, timelines, projects definitions and project information are updated, aligned and
transferred onto a common project management platform;
• Setting up an interim project office;
• Guiding and assisting the SIP component in achieving the broader goals of the PICC,
incorporating skills development, industrialisation (including purchasing of locally-
produced components and inputs), and greening the economy;
• Coordinating and aligning the costs, timing, deliverables and development plans of each SIP
component (as amended from time to time by the PICC) between the various spheres of
Government, public entities, state owned entities and private sector, as identified by the
PICC and approved by Cabinet;
• Ensuring that the Chief Executive and dedicated project manager attend meetings of the
agency co-ordinating structure that may be established for the first group of SIPs; and
• Reporting to the IGF, PICC Secretariat and PICC Manco on a regular basis on progress with
implementation, and identifying challenges to be addressed by the PICC.
The costs of this first phase of work set out above are for the account of the chosen SOE.
Within two weeks of receipt of their directive, the SOE would need to convene an inter-
governmental forum to critically review the status, challenges and impact of the various
projects/components forming part of the SIP. In addition to these tasks the SOE will need to
present any potential related challenges, cost or legal impediments to the PICC Secretariat in
coordinating SIP.
SIP 19: Ecological Infrastructure for Water Security
October 31, 2014
Page 88 of 100
17.1.7 The Strategic Integrated Project (SIP) Steering Committee
A SIP Steering Committee is established for each SIP with the purpose of guiding all phases of
the implementation of a strategic integrated project through —
• The development of mechanisms to identify and determine the different
projects/components which constitute the strategic integrated project, and the submission
of these components for approval by the Secretariat;
• The identification of ways and means of giving effect, in the most effective, efficient and
expeditious manner, to the Commission’s decision to implement the strategic integrated
project and in so doing, ensuring the prompt compliance with all applicable laws;
• The development and adoption of a project plan for approval by the Secretariat for the
implementation of the strategic integrated project in the most effective and expeditious
manner within a period specified by the Minister;
• The facilitation and monitoring of the implementation of the strategic integrated project;
• The coordination of the work of all members of the steering committee;
• Regular meetings with the SIP Chairperson; and
• Serving as a one-stop-shop where any matter relating to the implementation of the strategic
integrated project can be resolved.
The steering committee consists of the SIP coordinator as described in 17.1.6 above and
representatives of departments and other organs of state affected by the strategic integrated
project, and may consist of, among others—
• officials representing departments in the three spheres of government responsible for
environment, water, public works, finance, economic development, spatial planning, land
use management or any other relevant portfolio or representing any other person who will
be required to grant an approval, authorisation, exemption, licence, permission or
exemption necessary for the implementation of the strategic integrated project;
• a member of the Construction Industry Development Board established by section 2 of the
Construction Industry Development Board Act, 2000 (Act No. 38 of 2000); and
• any other person appointed by the Secretariat based on expert knowledge or skills.
The SIP coordinator is the chairperson of the steering committee. In the event that the SIP
coordinator is an entity, the entity nominates a suitably qualified individual to act as chair of the
steering committee for approval by the Secretariat.
A member of a steering committee must have relevant knowledge, skills and experience in his
or her field of work so as to enable the steering committee to perform its functions effectively
and expeditiously.
A member of a steering committee—
• has the authority to take decisions on behalf of the organ of state he or she represents,
excluding any decision to grant an approval, authorisation, license, permission or
exemption; and
• has direct access to the head of the organ of state he or she represents, the Management
Committee and the Secretariat and any of its members.
SIP 19: Ecological Infrastructure for Water Security
October 31, 2014
Page 89 of 100
A member of the steering committee must be available at all times to perform his or her
functions as a member of the steering committee. Membership of a steering committee may not
be delegated without the approval of the Commission.
The Secretariat may, on good cause shown and following a recommendation by a steering
committee—
• appoint additional members to the steering committee; and
• secure the services of or assistance or advice from any person who is not a member of the
committee.
The Commission may at any stage of the implementation of a strategic integrated project
reconstitute the steering committee in order for it to reflect the necessary skills and expertise
required for the implementation of the particular stage.
The Secretariat must dissolve a steering committee upon completion of its functions.
The steering committee must, for projects that fall within the state sector but that may be built
or operated by either the public or private sector—
• identify the projects required for the implementation of a strategic integrated project;
• identify opportunities for localisation, which include local job creation and local
procurement of goods and services, as well as other opportunities, to ensure that the
strategic integrated project contributes to the overall SIP objectives;
• develop and adopt one or more project plans, including feasibility, financial, operational and
maintenance plans, setting out actions, targets and periods of time for the strategic
integrated project and submit the plans to the Commission for approval;
• identify and ensure compliance with the laws applicable to the strategic integrated project;
• determine the approvals, authorisations, licences, permissions or exemptions required to
implement the strategic integrated project;
• ensure that all appropriate persons are appointed as members of the steering committee;
• take all reasonable steps that will assist any relevant authority required to decide an
approval, authorisation, license, permission or exemption to take such decision;
• facilitate the implementation of the strategic integrated project;
• report progress on all phases of the planning, development and implementation of a
strategic integrated project to the Secretariat; and
• bring to the attention of the Secretariat challenges or matters that it is unable to resolve for
resolution or direction, including proposed remedial actions for consideration by the
Secretariat.
Each member of the steering committee must evaluate the strategic integrated project from the
perspective of his or her area of expertise and—
• identify what is required for the expeditious and effective implementation;
• identify challenges presented by the strategic integrated project that will
• impede or delay the implementation of the project, and identify associated remedial actions
required;
SIP 19: Ecological Infrastructure for Water Security
October 31, 2014
Page 90 of 100
• identify amendments required to the strategic integrated project to ensure proper
implementation; and
• identify the amendments required to be effected to the strategic integrated project to ensure
compliance with applicable laws.
When the steering committee has determined the approvals, authorisations, licences,
permissions and exemptions required to enable the implementation of the strategic integrated
project, it informs the applicant to submit all applications simultaneously for consideration by
the persons authorised by the relevant laws to take the applicable decisions.
A member of the steering committee must do everything possible within his or her power to
ensure that an application—
• complies with applicable legislative and other requirements; and
• includes all relevant information to enable the relevant authority to consider the application
without delay.
A member of the steering committee must monitor the processing of the application and report
to the steering committee any regulatory concerns emerging for exploration or consideration of
possible solutions.
The steering committee must report to the Secretariat the outcomes of all applications for
approvals, authorisations, licences, permissions and exemptions.
A steering committee may determine its own procedures to be followed at its meetings.
A steering committee must submit a progress report to the Secretariat at least on a monthly
basis.
The Minister who chairs the strategic integrated project must provide the steering committee
with secretarial or administrative support and with accommodation and work related facilities
as may reasonably be required for the proper functioning of the steering committee or may
request the Economic Development Department to provide such facilities and support. The
costs relating to the functioning of a steering committee are borne by the Department of the
Minister who chairs unless otherwise agreed.
17.2 The SIP 19 Coordinator
As noted in 17.1.6 above, a SIP Coordinator is nominated for each SIP. The SIP Coordinator for
SIP 19 is the South African National Biodiversity Institute (SANBI).
In essence, SANBI, as the SIP 19 Coordinator, is the agency to be designated by the Commission
to coordinate and facilitate the implementation of SIP 19.
In this regard the SIP 19 Coordinator carries out the following functions –
17.2.1 SIP 19 Coordination
As implied by its name, the SIP 19 Coordinator is responsible for coordinating the integrated
implementation of the various SIP 19 components. Key to this function is –
• The chairing of the SIP 19 Steering Committee as described in 17.1.7 above;
SIP 19: Ecological Infrastructure for Water Security
October 31, 2014
Page 91 of 100
• The establishment, convening and hosting of SIP 19 Priority Area Coordinating Committees
made up of representatives from the principle implementers of the various approved
components within each priority area. These structures –
o Provide a platform for discussions around the coordination of efforts and the
identification of any issue that may need to be submitted to the SIP 19 Steering
Committee;
o Identify potential programme gaps that could be addressed through new components;
o Review progress and impacts in the priority area;
o Review mutual problems, challenges, threats, weaknesses and opportunities;
o Identify new partnerships and/or resource sharing opportunities;
• Ensuring coordination, cooperation and alignment with any affected Catchment
Management Agencies (CMAs)13 and regional offices of the Department of Water Affairs and
Sanitation.
• SIP 19 component liaison including –
o Putting components with similar challenges in touch with each other with a view to
formulating possible joint solutions;
o Providing referral services;
o Facilitating desired engagements between various components;
• New component addition including –
o Using its networks and other means to bring programme gaps to the attention of the
ecological infrastructure for water security implementation community;
o Assisting in the development of possible gap-filling components;
o Carrying out all the work necessary for gaining PICC approval for any new proposed
component aimed at improving the overall outcome/impact of SIP 19 as a whole.
• Establishing and maintaining a database, including relevant spatial data, on all SIP 19
components that, among others –
o Provides details of the intervention;
o Provides comparable statistical information;
o Provides an up to date status of the intervention;
o Provides contact details for all the parties involved in the implementation of the
intervention;
o Provides up to date information on the SIP performance of the intervention (e.g. progress
reporting record, involvement in relevant SIP 19 events, responses to requests for
information from the Coordinator, Steering Committee or PICC, etc.)
o Provides details, including photographic material, on the area affected by the
intervention; and
o Provides baseline data, including photographic or video material, which can be used to
illustrate the physical and/or other impacts of the intervention.
13
The establishment of four water catchment management agencies (CMAs) was approved by the Minister of
Water Affairs on 19 May 2014. The agencies are Inkomati-Usuthu, Breede-Broutiz, Limpopo-North West and
the Pongola-Mzimkulu following a decision to establish nine agencies rather than the 19 as originally intended.
The realignment process and establishment of all nine CMAs is intended to be complete by 2016. The other five
to be set up are the Olifants, Vaal, Berg-Olifants, Mzimvubu-Tsitsikamma, and Orange.
SIP 19: Ecological Infrastructure for Water Security
October 31, 2014
Page 92 of 100
17.2.2 Monitoring and Reporting
Progress monitoring, evaluation and reporting is another key function of the SIP 19
Coordinator. In this regard the SIP 19 Coordinator –
• Implements the standard SIP reporting regime which includes, among others –
o Developing, testing, maintaining and continuously improving standard operating
procedures, protocols and templates for the efficient and effective implementation of the
standard SIP reporting regime;
o Establish basic reporting baselines for progress measurement, comparison and the
avoidance of “double-counting”;
o Gathering information from individual components or from existing monitoring activities
(e.g. the “Working For…”programmes already have sophisticated monitoring and
reporting systems in place);
o Compiling and maintaining a register of required authorisations for each SIP 19
component and monitoring progress and status in this regard;
o Storing, sorting, analysing and evaluating progress data;
o Compiling, submitting and presenting Monthly and Quarterly Progress Reports to the
Steering Committee and Secretariat; and
o Conducting basic progress data quality checks informally during site visits (not a formal
progress verification and audit process – implementers are required to ensure the
accuracy and correctness of data submitted for progress reporting purposes)
• Develops, tests, implements, maintains, operates, reviews and improves the SIP 19
Outcome/Impact Indicator System as described in 19 below. This includes, but is not limited
to –
o Setting up a team of volunteer professionals and experts in the field to brainstorm and
jointly design a possible SIP 19 Outcome/Impact Indicator System that could have value
beyond the SIP (e.g. may be a valuable contribution to meeting the NDP 2030 natural
resource indicator objective).
o Coordinating monitoring, evaluation and reporting efforts with organisations already
doing relevant work in the field, i.e. exploiting existing opportunities whilst avoiding any
wasteful duplication of efforts;
o Conducting initial reconnaissance missions aimed at establishing and/or confirming on-
going monitoring activities in affected areas and identifying any possible gaps;
o Compiling monitoring, evaluation and reporting frameworks at component, quaternary
catchment and priority area scales;
o Formalising agreements around the efficient and effective implementation of monitoring,
evaluation and reporting frameworks at component, quaternary catchment and priority
area scales;
o Establishing monitoring, evaluation and reporting baselines, targets, tipping-points
and/or thresholds at component, quaternary catchment and/or priority area scales;
o Gathering, capturing, storing, archiving, analysing, evaluating and generally using
outcome/impact data and/or formalising agreements with other organisations to do this
work on behalf of the SIP with a view to the broader application of the system (e.g. the
WRC, SAEON, DWAS, SANBI and/or the CSIR);
o Compiling Annual SIP 19 Outcome/Impact Progress reports and presentations.
SIP 19: Ecological Infrastructure for Water Security
October 31, 2014
Page 93 of 100
17.2.3 Component Assistance and Support
As part of its general coordination role, the SIP 19 Coordinator will also provide support to the
components and any other assistance that it is able to provide, including –
• Technical and Legal Support – Given that the SIP 19 Coordinator team will include staff with
both technical and legal expertise and/or experience, the coordinator will be able to provide
advice and referrals on most of the technical and legal issues that will be commonly faced by
the SIP 19 components;
• Donor/partner Match-making – Although the SIP 19 Coordinator will not involve itself in
any direct component funding matters, it will –
o actively engage with donors in the field with a view to flagging new and/or emerging
funding opportunities, identifying possible matches and facilitating introductions;
o actively engage with companies or other organisations seeking relevant offset or social
investment opportunities, identifying possible matches and facilitating introductions;
o establish and maintain a database of potential donors or other funding sources
interested in supporting SIP 19 type interventions.
• Enforcement Promotion – Liaise with the Environmental Management Inspectorate (EMIs –
the so-called “Green Scorpions”) around key enforcement interventions where non-
compliance is negatively impacting on the work of SIP 19 components (e.g. illegal effluent
discharges);
• Securing sustainability – Actively participate in all significant activities that may have an
impact on securing the on-going sustainability of the SIP 19 outcomes/impacts including
through various property-related interventions (e.g. provisions in deeds), formal, informal
and/or semi-formal form of land protection (e.g. protected area expansion/prioritisation
planning, conservancies, stewardship, payment for ecosystem service agreements, etc.)
• Intervention Leverage – Use the status of the SIP to leverage various interventions aimed at
addressing issues having a negative impact on the work of SIP 19 components (e.g. poorly
maintained waste-water treatment facilities).
• Regional partnerships – Engage with South Africa’s water-sharing neighbours around
possible complimentary activities in their countries.
17.2.4 Information Sharing and Outreach
Finally, the SIP 19 Coordinator will actively encourage and support the strengthening and
broadening of the environmental infrastructure “community of practise” through, among others
–
• Annual Conference – Hosting or co-hosting an annual conference on “ecosystem
infrastructure for water security”;
• Quarterly Seminars – Hosting or co-hosting various workshops, lectures and/or seminars on
matters relating to “ecosystem infrastructure for water security”;
• SIP 19 Website and newsletter – Hosting and maintaining a useful website with up to date
news, views and progress reports; and
• Presentations – Compiling and presenting local and international presentations on the SIP
19 concept and related.
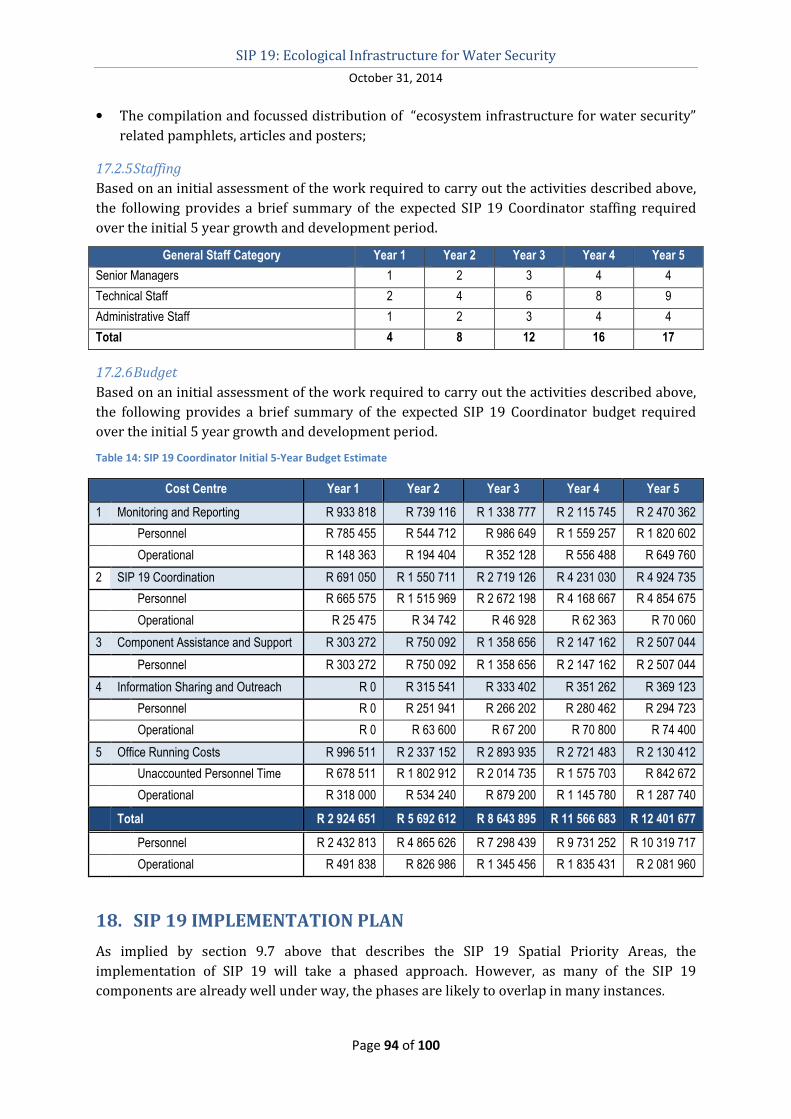
SIP 19: Ecological Infrastructure for Water Security
October 31, 2014
Page 94 of 100
• The compilation and focussed distribution of “ecosystem infrastructure for water security”
related pamphlets, articles and posters;
17.2.5 Staffing
Based on an initial assessment of the work required to carry out the activities described above,
the following provides a brief summary of the expected SIP 19 Coordinator staffing required
over the initial 5 year growth and development period.
General Staff Category Year 1 Year 2 Year 3 Year 4 Year 5
Senior Managers 1 2 3 4 4
Technical Staff 2 4 6 8 9
Administrative Staff 1 2 3 4 4
Total 4 8 12 16 17
17.2.6 Budget
Based on an initial assessment of the work required to carry out the activities described above,
the following provides a brief summary of the expected SIP 19 Coordinator budget required
over the initial 5 year growth and development period.
Table 14: SIP 19 Coordinator Initial 5-Year Budget Estimate
Cost Centre Year 1 Year 2 Year 3 Year 4 Year 5
1 Monitoring and Reporting R 933 818 R 739 116 R 1 338 777 R 2 115 745 R 2 470 362
Personnel R 785 455 R 544 712 R 986 649 R 1 559 257 R 1 820 602
Operational R 148 363 R 194 404 R 352 128 R 556 488 R 649 760
2 SIP 19 Coordination R 691 050 R 1 550 711 R 2 719 126 R 4 231 030 R 4 924 735
Personnel R 665 575 R 1 515 969 R 2 672 198 R 4 168 667 R 4 854 675
Operational R 25 475 R 34 742 R 46 928 R 62 363 R 70 060
3 Component Assistance and Support R 303 272 R 750 092 R 1 358 656 R 2 147 162 R 2 507 044
Personnel R 303 272 R 750 092 R 1 358 656 R 2 147 162 R 2 507 044
4 Information Sharing and Outreach R 0 R 315 541 R 333 402 R 351 262 R 369 123
Personnel R 0 R 251 941 R 266 202 R 280 462 R 294 723
Operational R 0 R 63 600 R 67 200 R 70 800 R 74 400
5 Office Running Costs R 996 511 R 2 337 152 R 2 893 935 R 2 721 483 R 2 130 412
Unaccounted Personnel Time R 678 511 R 1 802 912 R 2 014 735 R 1 575 703 R 842 672
Operational R 318 000 R 534 240 R 879 200 R 1 145 780 R 1 287 740
Total R 2 924 651 R 5 692 612 R 8 643 895 R 11 566 683 R 12 401 677
Personnel R 2 432 813 R 4 865 626 R 7 298 439 R 9 731 252 R 10 319 717
Operational R 491 838 R 826 986 R 1 345 456 R 1 835 431 R 2 081 960
18. SIP 19 IMPLEMENTATION PLAN
As implied by section 9.7 above that describes the SIP 19 Spatial Priority Areas, the
implementation of SIP 19 will take a phased approach. However, as many of the SIP 19
components are already well under way, the phases are likely to overlap in many instances.
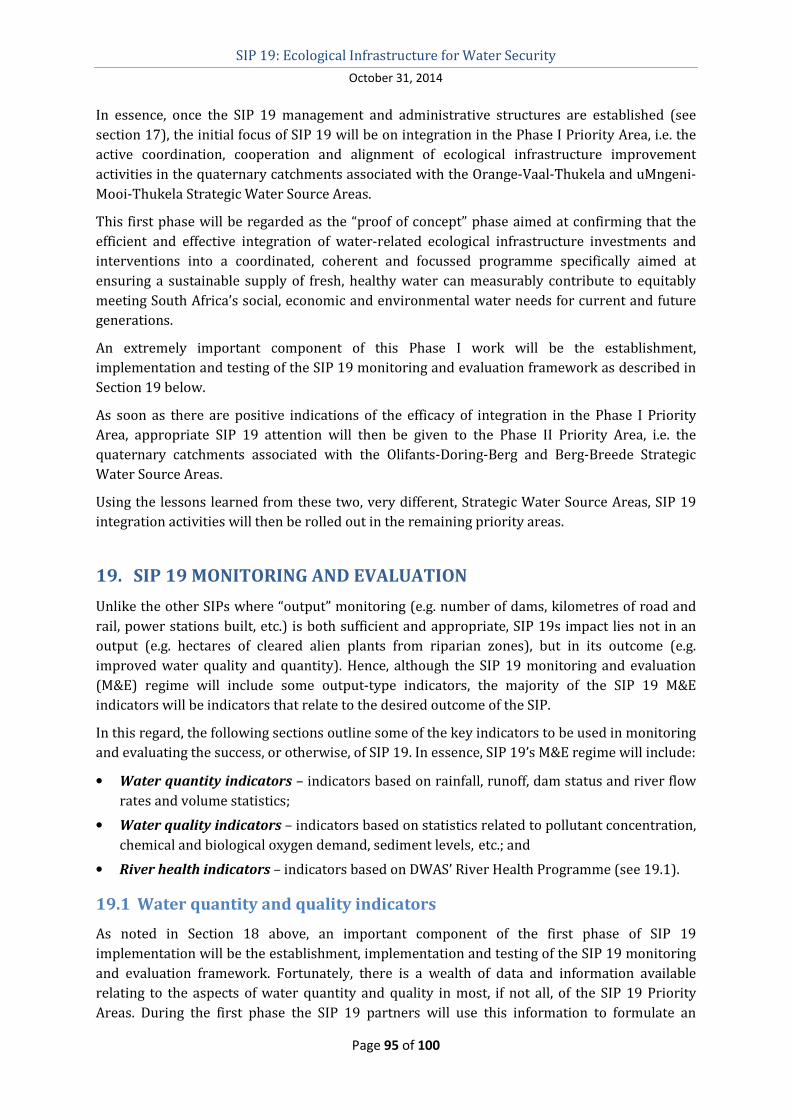
SIP 19: Ecological Infrastructure for Water Security
October 31, 2014
Page 95 of 100
In essence, once the SIP 19 management and administrative structures are established (see
section 17), the initial focus of SIP 19 will be on integration in the Phase I Priority Area, i.e. the
active coordination, cooperation and alignment of ecological infrastructure improvement
activities in the quaternary catchments associated with the Orange-Vaal-Thukela and uMngeni-
Mooi-Thukela Strategic Water Source Areas.
This first phase will be regarded as the “proof of concept” phase aimed at confirming that the
efficient and effective integration of water-related ecological infrastructure investments and
interventions into a coordinated, coherent and focussed programme specifically aimed at
ensuring a sustainable supply of fresh, healthy water can measurably contribute to equitably
meeting South Africa’s social, economic and environmental water needs for current and future
generations.
An extremely important component of this Phase I work will be the establishment,
implementation and testing of the SIP 19 monitoring and evaluation framework as described in
Section 19 below.
As soon as there are positive indications of the efficacy of integration in the Phase I Priority
Area, appropriate SIP 19 attention will then be given to the Phase II Priority Area, i.e. the
quaternary catchments associated with the Olifants-Doring-Berg and Berg-Breede Strategic
Water Source Areas.
Using the lessons learned from these two, very different, Strategic Water Source Areas, SIP 19
integration activities will then be rolled out in the remaining priority areas.
19. SIP 19 MONITORING AND EVALUATION
Unlike the other SIPs where “output” monitoring (e.g. number of dams, kilometres of road and
rail, power stations built, etc.) is both sufficient and appropriate, SIP 19s impact lies not in an
output (e.g. hectares of cleared alien plants from riparian zones), but in its outcome (e.g.
improved water quality and quantity). Hence, although the SIP 19 monitoring and evaluation
(M&E) regime will include some output-type indicators, the majority of the SIP 19 M&E
indicators will be indicators that relate to the desired outcome of the SIP.
In this regard, the following sections outline some of the key indicators to be used in monitoring
and evaluating the success, or otherwise, of SIP 19. In essence, SIP 19’s M&E regime will include:
• Water quantity indicators – indicators based on rainfall, runoff, dam status and river flow
rates and volume statistics;
• Water quality indicators – indicators based on statistics related to pollutant concentration,
chemical and biological oxygen demand, sediment levels, etc.; and
• River health indicators – indicators based on DWAS’ River Health Programme (see 19.1).
19.1 Water quantity and quality indicators
As noted in Section 18 above, an important component of the first phase of SIP 19
implementation will be the establishment, implementation and testing of the SIP 19 monitoring
and evaluation framework. Fortunately, there is a wealth of data and information available
relating to the aspects of water quantity and quality in most, if not all, of the SIP 19 Priority
Areas. During the first phase the SIP 19 partners will use this information to formulate an
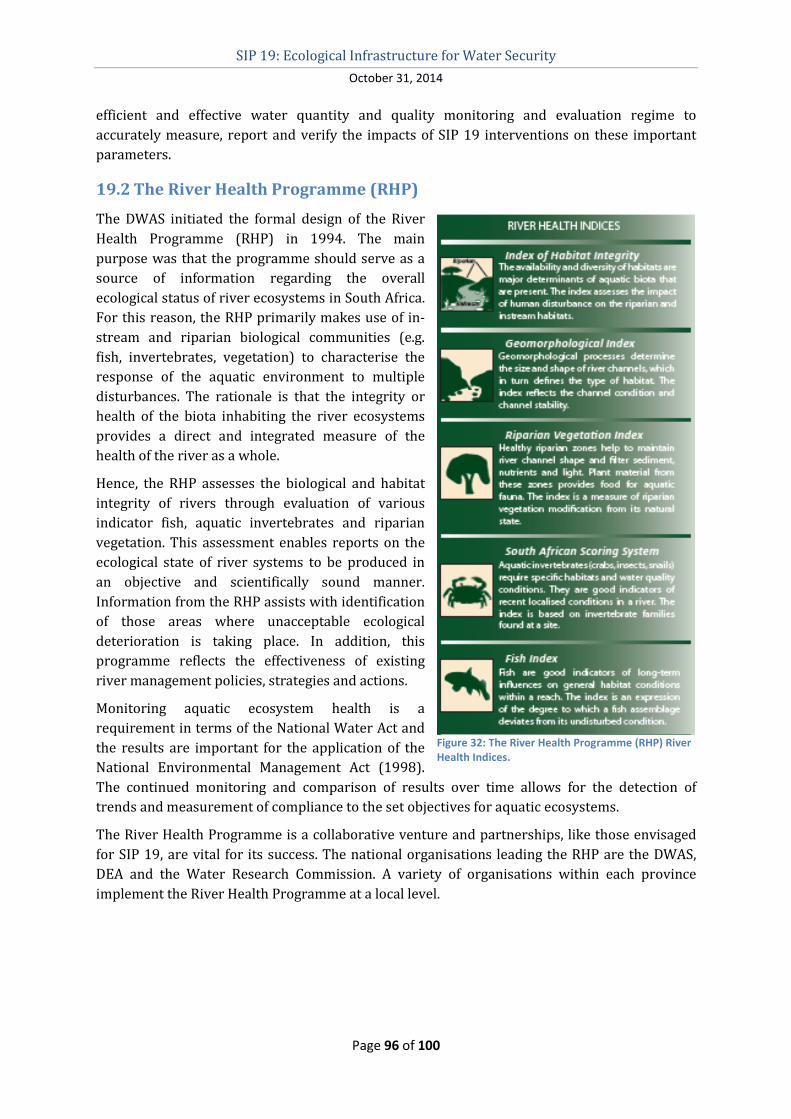
SIP 19: Ecological Infrastructure for Water Security
October 31, 2014
Page 96 of 100
efficient and effective water quantity and quality monitoring and evaluation regime to
accurately measure, report and verify the impacts of SIP 19 interventions on these important
parameters.
19.2 The River Health Programme (RHP)
The DWAS initiated the formal design of the River
Health Programme (RHP) in 1994. The main
purpose was that the programme should serve as a
source of information regarding the overall
ecological status of river ecosystems in South Africa.
For this reason, the RHP primarily makes use of in-
stream and riparian biological communities (e.g.
fish, invertebrates, vegetation) to characterise the
response of the aquatic environment to multiple
disturbances. The rationale is that the integrity or
health of the biota inhabiting the river ecosystems
provides a direct and integrated measure of the
health of the river as a whole.
Hence, the RHP assesses the biological and habitat
integrity of rivers through evaluation of various
indicator fish, aquatic invertebrates and riparian
vegetation. This assessment enables reports on the
ecological state of river systems to be produced in
an objective and scientifically sound manner.
Information from the RHP assists with identification
of those areas where unacceptable ecological
deterioration is taking place. In addition, this
programme reflects the effectiveness of existing
river management policies, strategies and actions.
Monitoring aquatic ecosystem health is a
requirement in terms of the National Water Act and
the results are important for the application of the
National Environmental Management Act (1998).
The continued monitoring and comparison of results over time allows for the detection of
trends and measurement of compliance to the set objectives for aquatic ecosystems.
The River Health Programme is a collaborative venture and partnerships, like those envisaged
for SIP 19, are vital for its success. The national organisations leading the RHP are the DWAS,
DEA and the Water Research Commission. A variety of organisations within each province
implement the River Health Programme at a local level.
Figure 32: The River Health Programme (RHP) River
Health Indices.
SIP 19: Ecological Infrastructure for Water Security
October 31, 2014
Page 97 of 100
Figure 33: The River Health iconography
State of Rivers reporting is a spin-off of State of the Environment (SoE) reporting, which has
become a recognised form of communication on environmental issues over the past decade. The
aim is to provide better information for environmental decision-making. The national SoE uses
the Driving Force-Pressure-State-Impact-Response framework to explain what causes
environmental change, the wider implication of that change and what we can do to manage the
change. State of Rivers reporting uses the same approach, but often with slightly different
terminology. State of Rivers reporting disseminates information on river health to:
• assist in ecologically sound management of rivers;
• ensure the sustainable utilisation of water resources;
• detect trends in the condition and health of river ecosystems;
• inform and educate people regarding the condition of our rivers; and
• encourage wide participation by all stakeholders.
19.2.1 River Health Indicators and Indices
A multitude of factors determine the health of a river ecosystem: its geomorphological
characteristics, hydrological and hydraulic regimes, chemical and physical water quality, and
the nature of in-stream and riparian habitats. It is impractical to monitor each of these factors in
detail. Therefore, the RHP focuses on selected ecological indicators that are representative of
the larger ecosystem and are practical to measure. Since resident aquatic communities reflect
the effects of chemical and physical impacts in a time-integrated manner, they are regarded as
good indicators of overall ecological integrity.
For the purpose of disseminating results of the RHP, the information resulting from monitoring
aquatic community components is simplified to a point where it can be of use to resource
managers, conservationists and the general public. This is done with a biological index that
integrates and summarises biological data within a particular indicator group. Appropriate
indicators, for example selected fish community attributes, need to be tested and justified, and
linked to measuring units (metrics) that can be used to index ecological condition. In this
context, biological indices are used to quantify the condition or health of aquatic ecosystems
and the output format is usually numeric.
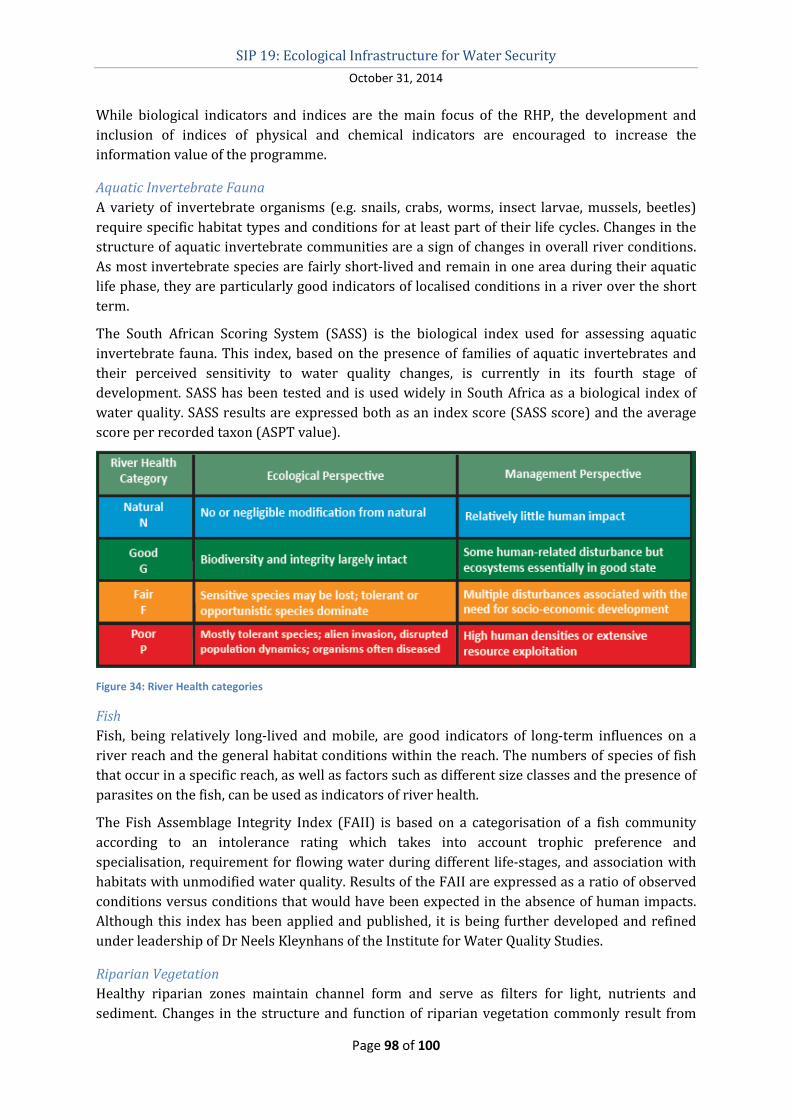
SIP 19: Ecological Infrastructure for Water Security
October 31, 2014
Page 98 of 100
While biological indicators and indices are the main focus of the RHP, the development and
inclusion of indices of physical and chemical indicators are encouraged to increase the
information value of the programme.
Aquatic Invertebrate Fauna
A variety of invertebrate organisms (e.g. snails, crabs, worms, insect larvae, mussels, beetles)
require specific habitat types and conditions for at least part of their life cycles. Changes in the
structure of aquatic invertebrate communities are a sign of changes in overall river conditions.
As most invertebrate species are fairly short-lived and remain in one area during their aquatic
life phase, they are particularly good indicators of localised conditions in a river over the short
term.
The South African Scoring System (SASS) is the biological index used for assessing aquatic
invertebrate fauna. This index, based on the presence of families of aquatic invertebrates and
their perceived sensitivity to water quality changes, is currently in its fourth stage of
development. SASS has been tested and is used widely in South Africa as a biological index of
water quality. SASS results are expressed both as an index score (SASS score) and the average
score per recorded taxon (ASPT value).
Figure 34: River Health categories
Fish
Fish, being relatively long-lived and mobile, are good indicators of long-term influences on a
river reach and the general habitat conditions within the reach. The numbers of species of fish
that occur in a specific reach, as well as factors such as different size classes and the presence of
parasites on the fish, can be used as indicators of river health.
The Fish Assemblage Integrity Index (FAII) is based on a categorisation of a fish community
according to an intolerance rating which takes into account trophic preference and
specialisation, requirement for flowing water during different life-stages, and association with
habitats with unmodified water quality. Results of the FAII are expressed as a ratio of observed
conditions versus conditions that would have been expected in the absence of human impacts.
Although this index has been applied and published, it is being further developed and refined
under leadership of Dr Neels Kleynhans of the Institute for Water Quality Studies.
Riparian Vegetation
Healthy riparian zones maintain channel form and serve as filters for light, nutrients and
sediment. Changes in the structure and function of riparian vegetation commonly result from
SIP 19: Ecological Infrastructure for Water Security
October 31, 2014
Page 99 of 100
changes in the flow regime of a river, exploitation for firewood, or use of the riparian zone for
grazing or ploughing.
Nigel Kemper of IWR Environmental has developed a first prototype of the Riparian Vegetation
Index (RVI). The RVI determines the status of riparian vegetation within river segments based
on the qualitative assessment of a number of criteria in the riparian zone. These criteria are
vegetation removal, cultivation, construction, inundation, erosion/sedimentation and exotic
species. The output is expressed as percentage deviation from natural or unmodified riparian
conditions.
River Habitats
Loss of habitats is regarded as the single most important factor that has contributed towards
the extinction of species in the last century. The destruction of a particular type of habitat will
result in the disappearance of certain species. Examples of river habitat types are pools, rapids,
sandbanks, stones on the riverbed, and vegetation fringing the water’s edges.
As the availability and diversity of habitat are major determinants of whether a given system is
acceptable to a specific suite of biota or not, knowledge of the availability and quality of habitats
is very important in an overall assessment of ecosystem health.
Dr Neels Kleynhans of the Institute for Water Quality Studies developed the Index of Habitat
Integrity (IHI). The IHI is used to assess the impact of major disturbance factors such as water
abstraction, flow regulation, bed and channel modification, removal of indigenous riparian
vegetation, and encroachment by exotic vegetation.
20. SIP 19 CHALLENGES
In the light of all of the above, a fundamental question must be – if the intervention proposed as
SIP 19 is likely to generate the various positive impacts that are detailed above, why has it not
been implemented to date? Although it is probably true that SIP 19 comprises a new and/or
novel approach that was simply not broadly recognised before, there are also a number of other
challenges that may need to be acknowledged and addressed if SIP 19 is to be successful,
including:
20.1 Resistance to change
The following quote from Barton H. Thompson, Jr14. provides an insight into one challenge that
has possibly contributed to why the SIP 19 concept has not been broadly implemented to date –
“In summary, natural capital (in the form of watershed services)
and technological investments (in filtration facilities and other
engineering solutions) are substitutes. And despite their
ascendancy in the 20th century, technological investments in many
cases are the inferior means of providing water supply and quality.
An important question therefore is how key governmental and
14
Barton H. Thompson, Jr. Stanford Law School. The Importance of Watershed Preservation, Watersheds,
Natural Capital, and Water, John M. Olin Conference on Watershed Management

SIP 19: Ecological Infrastructure for Water Security
October 31, 2014
Page 100 of 100
private players, including water suppliers, developers, land use
planners, and environmental regulators, evaluate the choice
between natural capital and technological investments. Is there a
bias in favour of technological investments due to existing
governmental policies, institutional structures, market
imperfections, scientific uncertainties, or problems in valuing the
natural watershed services? And if a bias exists, how can [we]
eliminate that bias? How, in short, can we get the market for
natural services to work correctly? Or is regulation the only policy
solution?”
20.2 Turf Battles and a “silo mentality”
By definition, SIP 19 is an integrating intervention that not only integrates the work of national,
provincial and local spheres, but also integrates across spheres and disciples. Thus, the success
of SIP 19 relies heavily on partnerships between departments and organisations that are not
traditional partners (e.g. mining and agriculture, environment and forestry, conservation and
industry, etc.). Indeed, some of the required partnerships will be between organisations often
regarded as having a conflicting relationship.
However, it is probably not these perceived conflicting mandates that present the biggest
challenge. Indeed, it is likely to be turf battles between actors that have similar or overlapping
mandates that present a challenge that has possibly contributed to why the SIP 19 concept has
not been broadly implemented to date.
20.3 Competition for resources
Related to the above is the fact that many of the actors that have similar or overlapping
mandates in relation to SIP 19-related activities also often draw from the same pool of financial,
human and/or technological resources. Thus, this clear competition for, often, very limited
resources may also present a challenge that has possibly contributed to why the SIP 19 concept
has not been broadly implemented to date.
20.4 Competition for profile
Related to the competition for resources is the fact that resources are often far more accessible
to those actors who have built a recognised profile for successful interventions. Thus, the need
to claim ownership of highly successful interventions may also present a challenge that has
possibly contributed to why the SIP 19 concept has not been broadly implemented to date.
20.5 Legislative constraints/restrictions
Although SIP 19 mainstreams the relatively new and novel concept of ecological infrastructure,
it also introduces a raft of other new concepts and/or approaches that are unlikely to be
recognised by current regulatory regimes (e.g. environmental offsetting). Thus, regulatory and
legislative constraints, shortfalls and/or restrictions may also present a challenge that has
possibly contributed to why the SIP 19 concept has not been broadly implemented to date.