Single Event Transients in LT1128 operational amplifier Heavy ion … · 2004-02-11 · 1...
22
1 T1202_LT1128 Single Event Transients in LT1128 operational amplifier Heavy ion test report Christian Poivey SGT-Inc. Ken Label NASA/GSFC Hak Kim JACKSON & TULL June 2, 2003
Transcript of Single Event Transients in LT1128 operational amplifier Heavy ion … · 2004-02-11 · 1...

1
T1202_LT1128
Single Event Transients inLT1128 operational amplifier
Heavy ion test report
Christian PoiveySGT-Inc.
Ken LabelNASA/GSFC
Hak KimJACKSON & TULL
June 2, 2003
2
Table of Contents
1 INTRODUCTION................................................................................................................................................3
2 TESTED DEVICES ..............................................................................................................................................3
3 IRRADIATION FACILITY...............................................................................................................................3
4 TEST SET-UP AND BIAS CONDITION ......................................................................................................3
5 TEST RESULTS ...................................................................................................................................................4
5.1 SET CROSS SECTION CURVE.......................................................................................................................... 45.2 TRANSIENT WAVEFORM ANALYSIS............................................................................................................... 5
6 CONCLUSION....................................................................................................................................................12
7 APPENDIX 1: DETAILED TEST RESULTS ............................................................................................13
8 APPENDIX 2 : TRANSIENTS’ WIDTH VERSUS AMPLITUDE PLOTS ......................................14

3
1 IntroductionThis report presents Single Event Transient (SET) test data on the LT1128 operational amplifier fromLinear Technology. These tests were performed in the frame of the NEPP/Single Event Transient in lineardevices study.
2 Tested DevicesThe tested devices are described in Table 1.
Type LT1128Manufacturer Linear TechnologyFunction High speed operational AmplifierPackage DIP8Package marking 0050C LT1128 CN8Previous SEE testing No data is available in the literature
Table 1: description of the tested device.
3 Irradiation facilityHeavy ion irradiations were performed at TEXAS A&M in December 2002. Irradiations were performed inAir. The distance of Air between the 25.4 µm Aramica beam window and the Device under test is 5 cm.The types of ions used and their energy is given in Table 2.
Ion Type Ion Energy(MeV)
LET on target(MeVcm2/mg)
Range on target(µm)
Ne 266 2.8 262Ar 496 8.7 174Kr 912 29.3 116Xe 1291 53.9 102
Table 2: Characteristics of ions used during the experiments in December 2002.
4 Test set-up and bias conditionThree different applications conditions have been investigated:- Non Inverting Gain amplifier2 (x11),- Voltage Follower.
The bias conditions are shown in Figures 1 and 2. The device output is monitored by an oscilloscope. Assoon as the device output deviates of more than 500 mV from the nominal output, a transient is counted andthe transient frame is stored for further analysis. The DUT is connected to the oscilloscope with an activeFET probe.

4
Vin +
-Vout
1K
10K
63
2
Vin +
-Vout
1K
10K
63
2
Figure 1: Non Inverting Gain x11 bias conditions.
VinVout
4+
-
3
2
6VinVout
4+
-
3
2
6
Figure 2: Voltage Follower bias conditions
The tested input bias conditions are described in Table 3. All the experiments were performed for anominal power supply voltage of +/-15V.
Application Input (V) Output (V)Voltage follower 1 1
5 510 10
Non inverting gain x11 0.1 1.10.5 5.51 11
Table 3: Input bias conditions
5 Test Results
5.1 SET cross section curveFigure 3 shows the SET cross section curve. The detailed results are shown in the Tables in Appendix1.The application and input bias conditions do not have an effect on the overall cross section curves. Thelower cross sections obtained for the highest input voltages, voltage follower with Vin=10V and non-inverting gain with Vin=1V, were due to a different trigger threshold setting of the oscilloscope. For theseconditions the trigger threshold was set at 1V instead of 500 mV for the other conditions.
The application, bias, and irradiation conditions have a significant effect on the transient waveforms asdetailed in the following section.

5
Figure 3: LT1128, SET cross section curve
5.2 Transient waveform analysisTen different transient waveforms were observed:
- class A: large amplitude positive going transients,- class B: small amplitude, short duration negative going transients,- class C: small amplitude, short duration positive going transients,- class D: long duration oscillating waveform,- class E: oscillating waveform starting with a large negative going component,- class F: large amplitude negative going transients,- class G: small amplitude, short duration oscillating waveform starting with a short negative going
component,- class H: small amplitude, short duration oscillating waveform starting with a positive going
component,,- class I: long duration oscillating waveform starting like a class F transient,- class J: long duration oscillating waveform starting like a class E transient.
Typical transient waveforms for each of these classes are shown in Figure 4 to 13.

6
Figure 4: Examples of class A SETs
Figure 5: Examples of class B SETs

7
Figure 6: Examples of class C SETs
Figure 7: Examples of class D SETs

8
Figure 8: Examples of class E SETs
Figure 9: Example of class F SETs

9
Figure 10: Examples of class G SETs
Figure 11: Examples of class H SETs

10
Figure 12: Examples of class I SETs
Figure 13: Example of class J SETs

11
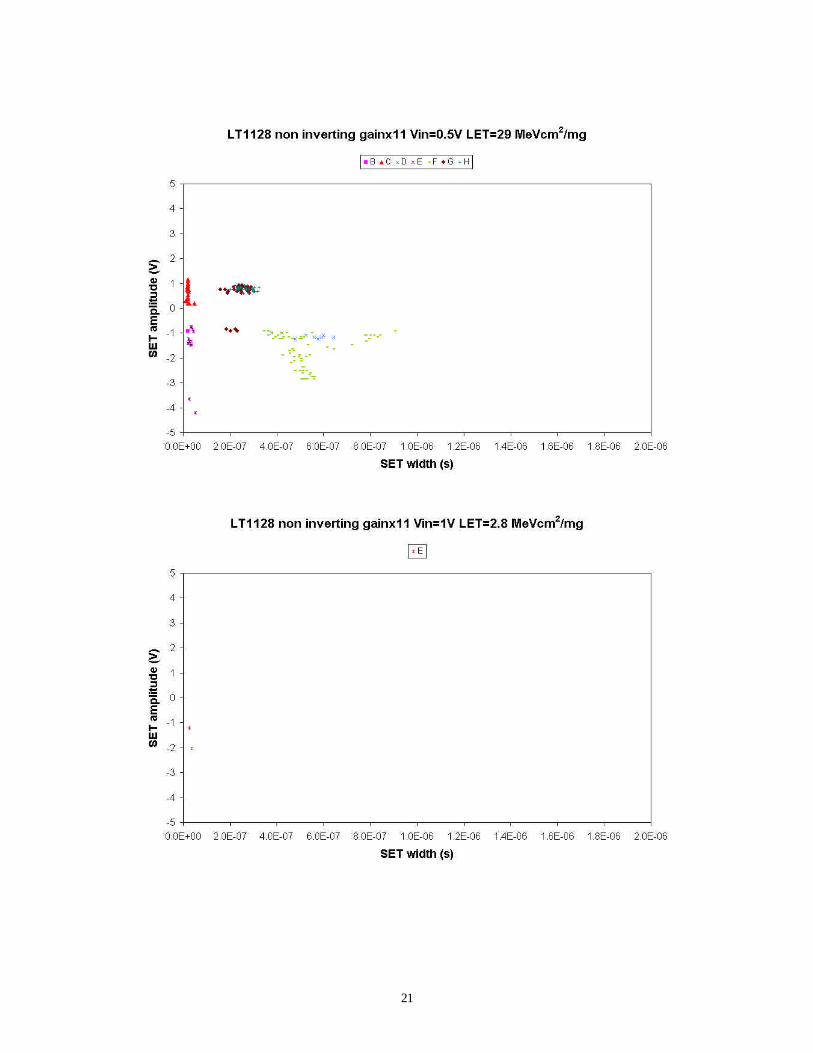
The transients’ widths versus amplitude were plotted for the different test conditions investigated. Weidentified the transient class in these plots. The amplitude is defined as the maximum transient amplitude,and the width as the Full width at Half Maximum (FWHM). For the oscillating waveforms; classes D, E, G,H, I, and J; we have plotted the largest amplitude component. These plots are shown in Appendix 2.
The amplitude versus width plots show the contribution of each transient class to the total device’sresponse:
• class E transients were observed for all test conditions and all LET values. They are a significantpart of the device’s total response. Their maximum amplitude is 5V, and their maximum totalduration is less than 1 µs.
• class A transients appear at the LET of 8.7 MeVcm2/mg. They dominate the device’s totalresponse for the voltage follower application, but they are quasi non-existent in the non-invertinggain application. Their maximum amplitude is 5V, and their maximum total duration is less than 2µs.
• class F transients appear at the LET of 8.7 MeVcm2/mg. They dominate the device’s totalresponse for the non-inverting gain application, but they do not appear in the voltage followerapplication. Their maximum amplitude is 5V, and their maximum total duration is less than 2 µs.
• class C transients appear at the LET of 8.7 MeVcm2/mg. They represent a significant part of thedevice’s total response. Their maximum amplitude is 5V, and their maximum total duration is lessthan 100 ns.
• class B transients appear at the LET of 8.7 MeVcm2.mg. class B transients are marginal in thenon-inverting gain application. Their maximum amplitude is 5V, and their maximum totalduration is less than 100 ns.
• Class D transient appear at the LET of 29.3 MeVcm2/mg. Class D transients were not observed inthe voltage follower application with a 10V input and the non-inverting gain configuration with1V input. When they appear, they appear in small numbers but still represent a significant part ofthe device’s total response. Their maximum amplitude is 1V, and their maximum total duration isless than 10 µs.
All the other transient classes represent a marginal part of the device total response:• class G transients appear at the LET of 8.7 MeVcm2/mg . Their maximum amplitude is 2V, and
their maximum total duration is less than 2 µs.• class H transients appear at the LET of 29.3 MeVcm2/mg. Their maximum amplitude is 2V, and
their maximum total duration is less than 2 µs.• class I transients only appear in the voltage follower application with a 10V input voltage at the
highest LET of 53.9 MeVcm2/mg. Their maximum amplitude is 3V, and their maximum totalduration is less than 10 µs.
• class J transients only appear in the non-inverting gain application with a 0.1V input voltage at thehighest LET of 29.3 MeVcm2/mg. Their maximum amplitude is 3V, and their maximum totalduration is less than 12 µs.

12
6 ConclusionThis report presents the SET heavy ion test data on the LT1128 operational amplifier. A large variety oftransients was observed. We cannot see a significant effect of the application and bias conditions on theSET cross section curves ., but the application and bias conditions have an effect on the SET characteristics.For example, the dominant transient class in the voltage follower application is quasi non-existent in thenon-inverting gain application. And, the dominant transient class in the non-inverting gain application isnon existent in the voltage follower application.The results also show that in high-speed operational amplifiers, a lot of transients have oscillatingwaveforms. The largest transients have a 5V amplitude and a duration lower than 1 µs. The longesttransients have a duration of 10 us but the amplitude is less than 10V. These characteristics make thesetransients easy to filter when filtering is a possible mitigation option.

13
7 Appendix 1: Detailed test results
Run#
Application Vin(V)
SN#
Ion Energy(MeV)
LET(MeVcm2/mg)
Tilt(º)
eff. LET(MeVcm2/mg)
eff. Fluence(#/cm2)
SET#
X SET(cm2/dev)
comment
37 follower 1 1 Xe 1291 53.90 0 53.90 3.34E+05 204 6.11E-04 trigger=0.5/1.5V38 follower 5 1 Xe 1291 53.90 0 53.90 3.37E+05 268 7.95E-04 trigger=4.5/5.5V39 follower 10 1 Xe 1291 53.90 0 53.90 2.27E+05 229 1.01E-03 trigger=9.5/11V40 follower 10 1 Xe 1291 53.90 35 65.80 1.39E+05 211 1.52E-0341 follower 5 1 Xe 1291 53.90 35 65.80 7.16E+04 258 3.60E-03 trigger=4.5/5.5V42 follower 1 1 Xe 1291 53.90 35 65.80 9.15E+04 319 3.49E-03 trigger=1.5/2.5V44 follower 1 1 Kr 912 29.30 0 29.30 1.84E+05 211 1.15E-0345 follower 5 1 Kr 912 29.30 0 29.30 1.75E+05 209 1.19E-03 trigger=4.5/5.5V47 follower 10 1 Kr 912 29.30 0 29.30 3.79E+05 204 5.38E-04 trigger=9.5/11V48 follower 10 1 Kr 912 29.30 35 35.80 3.40E+05 203 5.97E-0449 follower 5 1 Kr 912 29.30 35 35.80 1.53E+05 207 1.35E-0350 follower 1 1 Kr 912 29.30 35 35.80 1.91E+05 266 1.39E-03103 follower 1 1 Ar 496 8.69 0 8.69 1.95E+06 204 1.05E-04104 follower 5 1 Ar 496 8.69 0 8.69 2.06E+06 204 9.90E-05105 follower 10 1 Ar 496 8.69 0 8.69 1.00E+07 47 4.70E-06106 ninv 0.1 2 Ar 496 8.69 0 8.69 1.00E+07 119 1.19E-05107 ninv 0.5 2 Ar 496 8.69 0 8.69 1.00E+07 116 1.16E-05108 ninv 1 2 Ar 496 8.69 0 8.69 1.00E+07 61 6.10E-06109 ninv 1 2 Ar 496 8.69 35 10.60 1.00E+07 117 1.17E-05111 ninv 0.5 2 Ar 496 8.69 35 10.60 1.85E+06 245 1.32E-04112 ninv 0.1 2 Ar 496 8.69 35 10.60 1.44E+06 212 1.47E-04113 follower 1 1 Ar 496 8.69 35 10.60 1.31E+06 205 1.56E-04114 follower 5 1 Ar 496 8.69 35 10.60 1.63E+06 230 1.41E-04118 follower 10 1 Ar 496 8.69 35 10.60 5.83E+05 231 3.96E-04 tried trigger=10V,
device output<10V119 follower 10 1 Ar 496 8.69 35 10.60 1.00E+07 102 1.02E-05 trigger=9.5/11V120 follower 10 1 Ne 266 2.78 0 2.78 1.00E+07 7 7.00E-07121 follower 5 1 Ne 266 2.78 0 2.78 1.00E+07 2 2.00E-07 trigger=4.5/5.5V122 follower 1 1 Ne 266 2.78 0 2.78 1.00E+07 1 1.00E-07 trigger=0.5/1.5V124 ninv 0.1 2 Ne 266 2.78 0 2.78 1.00E+07 10 1.00E-06 trigger=0.6/1.6V125 ninv 0.5 2 Ne 266 2.78 0 2.78 1.00E+07 19 1.90E-06 trigger=5/6V126 ninv 1 2 Ne 266 2.78 0 2.78 1.00E+07 2 2.00E-07 trigger=10/12V127 ninv 1 2 Ne 266 2.78 35 3.39 1.00E+07 4 4.00E-07147 ninv 0.1 2 Kr 912 29.30 0 29.30 1.64E+05 213 1.30E-03 trigger=0.6/1.6V150 ninv 0.5 2 Kr 912 29.30 0 29.30 2.08E+05 201 9.66E-04 trigger=5/6V151 ninv 1 2 Kr 912 29.30 0 29.30 6.47E+05 200 3.09E-04 trigger=10/12V152 ninv 1 2 Kr 912 29.30 0 29.30 2.01E+05 200 9.95E-04 trigger 10.5/11.5V153 ninv 1 2 Kr 912 29.30 35 35.80 5.47E+05 204 3.73E-04 trigger 10/12154 ninv 0.5 2 Kr 912 29.30 35 35.80 1.40E+05 210 1.50E-03 trigger 5/6V155 ninv 0.1 2 Kr 912 29.30 35 35.80 1.41E+05 204 1.45E-03 trigger 0.6/1.6

14
8 Appendix 2 : Transients’ width versus amplitude plots

15

16

17

18

19

20
21

22