Single-cell transcriptome analysis identifies skin ...
17
Single-cell transcriptome analysis identifies skin-specific T-cell responses in systemic sclerosis Alyxzandria M. Gaydosik, Tracy Tabib, Robyn Domsic, Dinesh Khanna, Robert Lafyatis and Patrizia Fuschiotti Supplementary Materials Supplemental Methods Supplemental Figure 1-5 Supplemental Tables 1-4 BMJ Publishing Group Limited (BMJ) disclaims all liability and responsibility arising from any reliance Supplemental material placed on this supplemental material which has been supplied by the author(s) Ann Rheum Dis doi: 10.1136/annrheumdis-2021-220209 –8. :1 0 2021; Ann Rheum Dis , et al. Gaydosik AM
Transcript of Single-cell transcriptome analysis identifies skin ...

Single-cell transcriptome analysis identifies skin-specific T-cell responses
in systemic sclerosis
Alyxzandria M. Gaydosik, Tracy Tabib, Robyn Domsic, Dinesh Khanna, Robert Lafyatis and
Patrizia Fuschiotti
Supplementary Materials
Supplemental Methods
Supplemental Figure 1-5
Supplemental Tables 1-4
BMJ Publishing Group Limited (BMJ) disclaims all liability and responsibility arising from any relianceSupplemental material placed on this supplemental material which has been supplied by the author(s) Ann Rheum Dis
doi: 10.1136/annrheumdis-2021-220209–8.:10 2021;Ann Rheum Dis, et al. Gaydosik AM

Supplemental Methods
Subjects and skin biopsies
Skin samples (3mm) were obtained from 32 patients with confirmed diagnosis of active diffuse cutaneous
SSc (dcSSc)[1-3] at the Scleroderma Clinic of the University of Pittsburgh Medical Center (UPMC) and
at the Scleroderma Program of the University of Michigan Medical School. Disease subtype and internal
organ involvement were assessed according to established criteria.[1, 3, 4] DcSSc patients present
rapidly progressive wide-spread fibrosis of the skin and early fibrosis of the lung and other internal
organs.[2, 3] Active disease in our study refers to patients with moderate to high skin scores, and/or early
in their disease process. Most of the patients, 21/27 (74%), had either a high skin score >25 and/or were
within 2 years of first non-Raynaud's disease manifestation. Only one patient had a disease duration
greater than five years. Twenty-seven patient samples were used for scRNA-seq and 5 for
immunofluorescence (IF) microscopy. Healthy control (HC) skin samples (n=13) were obtained from age
and sex-matched donors with no history of any connective tissue disease, recruited at the UPMC Arthritis
and Autoimmunity Center. Ten HC skin samples were used scRNAseq and 3 for IF microscopy. Research
protocols involving human subjects were approved by the Institutional Review Boards of the University
of Pittsburgh and University of Michigan Medical School. All participants gave their written informed
consent in accordance with the Declaration of Helsinki.
Single cell cDNA and library preparation.
Cell suspensions from skin were obtained as previously described.[5, 6] Briefly, skin biopsies were
minced and digested enzymatically (Whole Dissociation Skin Kit, Miltenyi Biotec) for 2 hours at 37°C and
further dispersed using the Miltenyi gentle MACS Octo Dissociator. A 3mm skin biopsy from each donor
yielded 870-3,179 cells from SSc and 1,035-3,145 cells from HC skin samples. Experimental procedures
followed established techniques[5, 6] using the Chromium Single Cell 3’ Library V2 kit (10x Genomics).
Cell suspensions were separated by the Chromium System (10X Genomics)[5-7] into mini-reaction
"partitions" or GEMs formed by oil micro-droplets, each containing a gel bead and a cell. A 1000-fold
excess of partitions compared to cells assured that most partitions/GEMs had only one cell per GEM.
Gel beads contained an oligonucleotide scaffold composed of an oligo-dT section for priming reverse
transcription, and barcodes for each cell (10X Genomics) and each transcript (unique molecular identifier,
UMI), as described.[8] 7,000 cells were loaded into the instrument to obtain data on ~4,000 cells with a
rate of ~3.1% of partitions showing more than one cell/partition. The following steps were all performed
using reagents and protocols developed by 10X Genomics. Following GEM formation, the emulsions
were transferred from the Chromium chip to a PCR cycler for cDNA synthesis. The emulsion was then
broken using a recovery agent, and following Dynabead and SPRI clean up, cDNAs were amplified by
PCR (C1000, Bio-Rad). cDNAs were sheared enzymatically into lengths of ~200bp. DNA fragment ends
BMJ Publishing Group Limited (BMJ) disclaims all liability and responsibility arising from any relianceSupplemental material placed on this supplemental material which has been supplied by the author(s) Ann Rheum Dis
doi: 10.1136/annrheumdis-2021-220209–8.:10 2021;Ann Rheum Dis, et al. Gaydosik AM

were repaired, A-tailed, and adaptors ligated. The library was quantified using the KAPA Library
Quantification Kit (Illumina), and further characterized for cDNA length by bioanalyzer using a High
Sensitivity DNA kit.
RNA sequencing.
RNA-seq was performed on each sample by the University of Pittsburgh Genomics Research Core
(http://www.genetics.pitt.edu/our-services/rna-sequencing) using the NextSeq500 sequencing system
(Illumina). Genes detected (6,000 genes/cell) had a plateau at about 200,000 reads/cell (10X Genomics,
white paper). We obtained ~200 million reads/sample (NextSeq, Illumina) through the University of
Pittsburgh Genomics Core, Sequencing Facility.
Data Analysis.
Chromium scRNA-seq data produced by the 10X Chromium Platform were processed to generate
sample-specific fastq files. Processed reads were then examined by quality metrics, mapped to a
reference human genome using RNA-seq aligner STAR and assigned to individual cells of origin
according to the cell specific barcodes, using the Cell Ranger pipeline (10X Genomics). To ensure that
PCR amplified transcripts were counted only once, only single UMIs were counted for gene expression
level [9]. In this way, cell x gene UMI counting matrices were generated for downstream analyses. Seurat,
an R package developed for single-cell analysis [10], was used to identify distinct cell populations and
visualize cell clusters in graphs as in [7]. Specifically, the UMI matrix was filtered such that only cells
expressing at least 200 genes were utilized in downstream analysis. Unwanted sources of variation were
regressed out of the data by constructing linear models to predict gene expression based on the number
of UMIs per cell as well as the percentage of mitochondrial gene content. Based on their average
expressions and dispersions, 4,451 highly variable genes were identified and principal component
analysis (PCA) was subsequently performed on the scaled data of the identified highly variable genes.
Statistically significant PCs were identified using a resampling test inspired by Jackstraw [11]. Cells were
clustered using Seurat [10] (Louvain clustering). The resultant clusters were then visualized using a t-
distributed stochastic neighbor embedding (t-SNE) projection plot [12]. For gene differential tests, we
used the “FindAllMarkers” package, which uses the Wilcoxon rank sum test to show differential genes
with a minimum percentage of cells of 25% per cluster.
Pseudo-temporal trajectory analysis
Pseudo-time analysis was performed using the Monocle 3.0 R package [13, 14]. Genes differentially
expressed across PhenoGraph-identified clusters were used as an input for the Monocle analysis. For
the heat map representation of pseudo-time genes, a time trace of each gene was taken using the
BMJ Publishing Group Limited (BMJ) disclaims all liability and responsibility arising from any relianceSupplemental material placed on this supplemental material which has been supplied by the author(s) Ann Rheum Dis
doi: 10.1136/annrheumdis-2021-220209–8.:10 2021;Ann Rheum Dis, et al. Gaydosik AM
“plot_genes_in_pseudotime” function and dividing time into 100 equally sized bins. Time was measured
by selecting the longest path through the trajectory plot going from t = 0 to t = max.
Data availability
All scRNA-seq data generated in this study have been deposited in the Gene Expression Omnibus
database under accession number: GSE138669.
Multicolor immunohistochemistry
Single and dual antibody staining using tyramide signal amplification (ThermoFisher) were performed on
formalin-fixed, paraffin-embedded skin samples as previously described [15]. The antibodies employed
in these experiments are reported in Table S4. Confocal images were captured on an Olympus Fluoview
1000 confocal microscope using an oil immersion 100X objective
Bibliography
1. LeRoy EC, Black C, Fleischmajer R, Jablonska S, Krieg T, Medsger TA, Jr., et al. Scleroderma
(systemic sclerosis): classification, subsets and pathogenesis. J Rheumatol. 1988 Feb; 15(2):202-
205.
2. LeRoy EC, Medsger TA, Jr. Criteria for the classification of early systemic sclerosis. J Rheumatol.
2001 Jul; 28(7):1573-1576.
3. Steen VD, Medsger TA, Jr. Severe organ involvement in systemic sclerosis with diffuse
scleroderma. Arthritis Rheum. 2000 Nov; 43(11):2437-2444.
4. Medsger TA, Jr., Bombardieri S, Czirjak L, Scorza R, Della Rossa A, Bencivelli W. Assessment of
disease severity and prognosis. Clin Exp Rheumatol. 2003; 21(3 Suppl 29):S42-46.
5. Tabib T, Morse C, Wang T, Chen W, Lafyatis R. SFRP2/DPP4 and FMO1/LSP1 Define Major
Fibroblast Populations in Human Skin. J Invest Dermatol. 2018 Apr; 138(4):802-810.
6. Gaydosik AM, Tabib T, Geskin LJ, Bayan CA, Conway JF, Lafyatis R, et al. Single-Cell Lymphocyte
Heterogeneity in Advanced Cutaneous T-cell Lymphoma Skin Tumors. Clin Cancer Res. 2019 Jul
15; 25(14):4443-4454.
BMJ Publishing Group Limited (BMJ) disclaims all liability and responsibility arising from any relianceSupplemental material placed on this supplemental material which has been supplied by the author(s) Ann Rheum Dis
doi: 10.1136/annrheumdis-2021-220209–8.:10 2021;Ann Rheum Dis, et al. Gaydosik AM

7. Macosko EZ, Basu A, Satija R, Nemesh J, Shekhar K, Goldman M, et al. Highly Parallel Genome-
wide Expression Profiling of Individual Cells Using Nanoliter Droplets. Cell. 2015 May 21;
161(5):1202-1214.
8. Zheng GX, Terry JM, Belgrader P, Ryvkin P, Bent ZW, Wilson R, et al. Massively parallel digital
transcriptional profiling of single cells. Nat Commun. 2017 Jan 16; 8:14049.
9. Islam S, Zeisel A, Joost S, La Manno G, Zajac P, Kasper M, et al. Quantitative single-cell RNA-seq
with unique molecular identifiers. Nature methods. 2014 Feb; 11(2):163-166.
10. Satija R, Farrell JA, Gennert D, Schier AF, Regev A. Spatial reconstruction of single-cell gene
expression data. Nature biotechnology. 2015 May; 33(5):495-502.
11. Chung NC, Storey JD. Statistical significance of variables driving systematic variation in high-
dimensional data. Bioinformatics. 2015 Feb 15; 31(4):545-554.
12. van der Maarten L, Hinton G. Visualizing Data using t-SNE. Journal of Machine Learning Research.
2008; 9:2579-29605.
13. Trapnell C, Cacchiarelli D, Grimsby J, Pokharel P, Li S, Morse M, et al. The dynamics and
regulators of cell fate decisions are revealed by pseudotemporal ordering of single cells. Nature
biotechnology. 2014 Apr; 32(4):381-386.
14. Cao J, Spielmann M, Qiu X, Huang X, Ibrahim DM, Hill AJ, et al. The single-cell transcriptional
landscape of mammalian organogenesis. Nature. 2019 Feb; 566(7745):496-502.
15. Gaydosik AM, Queen DS, Trager MH, Akilov OE, Geskin L, Fuschiotti P. Genome-wide
transcriptome analysis of the STAT6-regulated genes in advanced-stage cutaneous T-cell
lymphoma. Blood. 2020 May 21.
16. Korsunsky I, Millard N, Fan J, Slowikowski K, Zhang F, Wei K, et al. Fast, sensitive and accurate
integration of single-cell data with Harmony. Nature methods. 2019 Dec; 16(12):1289-1296.
BMJ Publishing Group Limited (BMJ) disclaims all liability and responsibility arising from any relianceSupplemental material placed on this supplemental material which has been supplied by the author(s) Ann Rheum Dis
doi: 10.1136/annrheumdis-2021-220209–8.:10 2021;Ann Rheum Dis, et al. Gaydosik AM

Supplemental Figure 1. Grouping of SSc and control skin populations. Transcriptomes of 74,607
cells from 10 HC (20,073) and 27 SSc (54,534 cells) skin biopsies clustered using Seurat [10]. (A) Two-
dimensional t-SNE shows dimensional reduction of reads from single cells, revealing grouping in each
SSc sample compared to all healthy control (HC) skin samples. Cells from each subject are indicated by
different colors. (B) All samples are combined. (C) Distinct gene expression signatures are represented
by the clustering of known markers for multiple cell types [6] and visualized using t-SNE. Clusters
belonging to each cell type are color coded. (D) Cell types in skin cell suspensions were identified by cell-
specific marker as previously described [6], including AIF1 - macrophages; VWF - endothelial cells;
TPSAB1 - mast cells; SCGB1B2P - secretory (glandular) cells; RGS5 - pericytes; PMEL - melanocytes;
MS4A1 - B cells; KRT1 - keratinocytes; DES - smooth muscle cells; COL1A1 – fibroblasts; CD3D - T
lymphocytes; and CD1C - dendritic cells. Intensity of purple color indicates the normalized level of gene
expression. Cell-type specific clusters are indicated by an arrow. t-SNE, t-distributed stochastic neighbor
embedding.
BMJ Publishing Group Limited (BMJ) disclaims all liability and responsibility arising from any relianceSupplemental material placed on this supplemental material which has been supplied by the author(s) Ann Rheum Dis
doi: 10.1136/annrheumdis-2021-220209–8.:10 2021;Ann Rheum Dis, et al. Gaydosik AM

Supplemental Figure 2. Batch correlation by Harmony.[16] (A) UMAP of all cell types using Harmony
to verify there are no batch effects as all samples overlap per cell type in this UMAP as we have shown
in Seurat’s clustering. (B) UMAP of all samples IDs of T cells to verify clustering has no batch effects as
no individual samples create own clusters. (C) UMAP of T cells using Harmony to verify clustering is
without batch effects. Unique clusters of SSc cells still visible with corrections. (D) UMAP shows similar
clustering as Seurat in separating out unique T-cell clusters.
BMJ Publishing Group Limited (BMJ) disclaims all liability and responsibility arising from any relianceSupplemental material placed on this supplemental material which has been supplied by the author(s) Ann Rheum Dis
doi: 10.1136/annrheumdis-2021-220209–8.:10 2021;Ann Rheum Dis, et al. Gaydosik AM
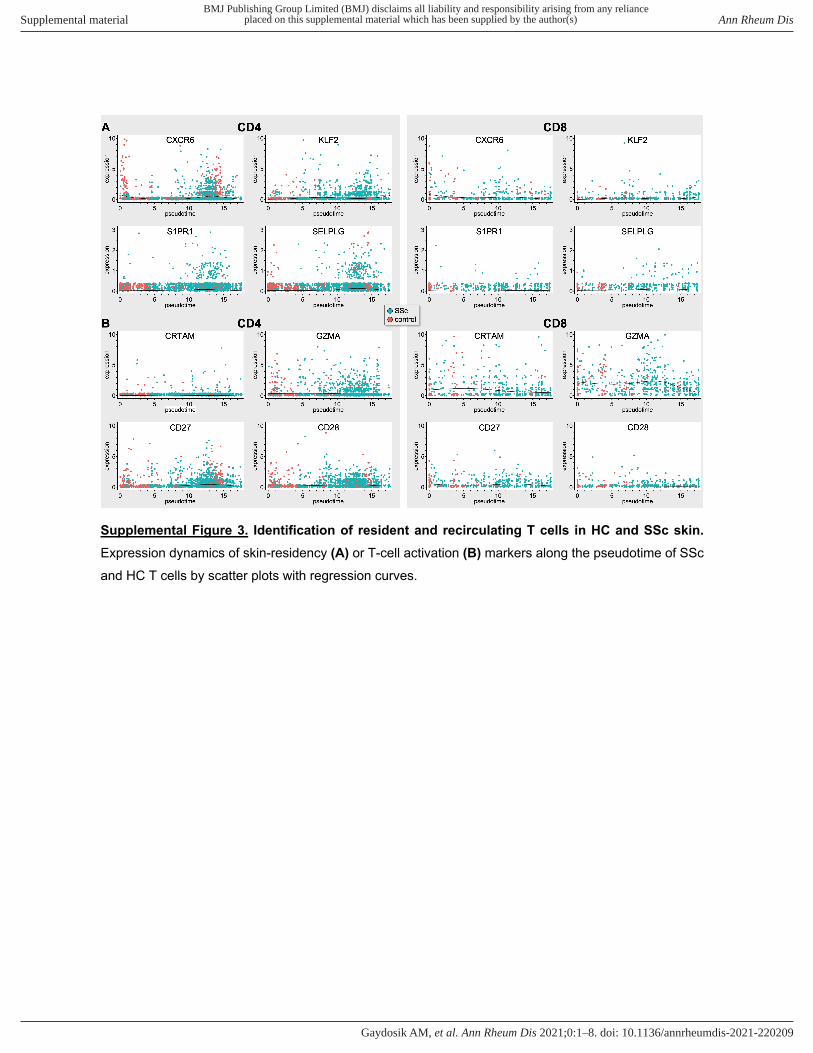
Supplemental Figure 3. Identification of resident and recirculating T cells in HC and SSc skin.
Expression dynamics of skin-residency (A) or T-cell activation (B) markers along the pseudotime of SSc
and HC T cells by scatter plots with regression curves.
BMJ Publishing Group Limited (BMJ) disclaims all liability and responsibility arising from any relianceSupplemental material placed on this supplemental material which has been supplied by the author(s) Ann Rheum Dis
doi: 10.1136/annrheumdis-2021-220209–8.:10 2021;Ann Rheum Dis, et al. Gaydosik AM

Supplemental Figure 4. Two-dimensional t-SNE shows dimensional reduction of reads from single cells,
revealing grouping in all HC (left) compared to SSc (right) skin samples. Expression of CD3 (A) or
CXCL13 (B) is shown. (C-D) Representative examples of CXCL13+ T cells expressing IL-4 or IL-21
measured by intracellular staining and flow cytometry in blood (HC n=3, dcSSc n=5) are reported. Freshly
isolated PBMCs were stimulated for 6 hours with PMA and ionomycin in the presence of brefeldin A.
Cells were gated on lymphocyte scatter and CD3 and CD4 positivity. (E) The percentage of circulating
CD4+CXCL13+ cells in HCs and SSc patients is shown. Statistics by Student's T test. (F) Dot plot showing
the proportion of cells and the scaled average gene expression of selected DE genes by SSc and HC
Tregs. Immunofluorescence microscopy shows co-expression of CXCL13, CXCR5 and BCL6 in dcSSc
skin samples (n=5). A representative experiment is shown at 1000X (G); and positive controls staining
for BCL6 (tonsils) and CCR5 (tonsils), 1000X (H).
BMJ Publishing Group Limited (BMJ) disclaims all liability and responsibility arising from any relianceSupplemental material placed on this supplemental material which has been supplied by the author(s) Ann Rheum Dis
doi: 10.1136/annrheumdis-2021-220209–8.:10 2021;Ann Rheum Dis, et al. Gaydosik AM
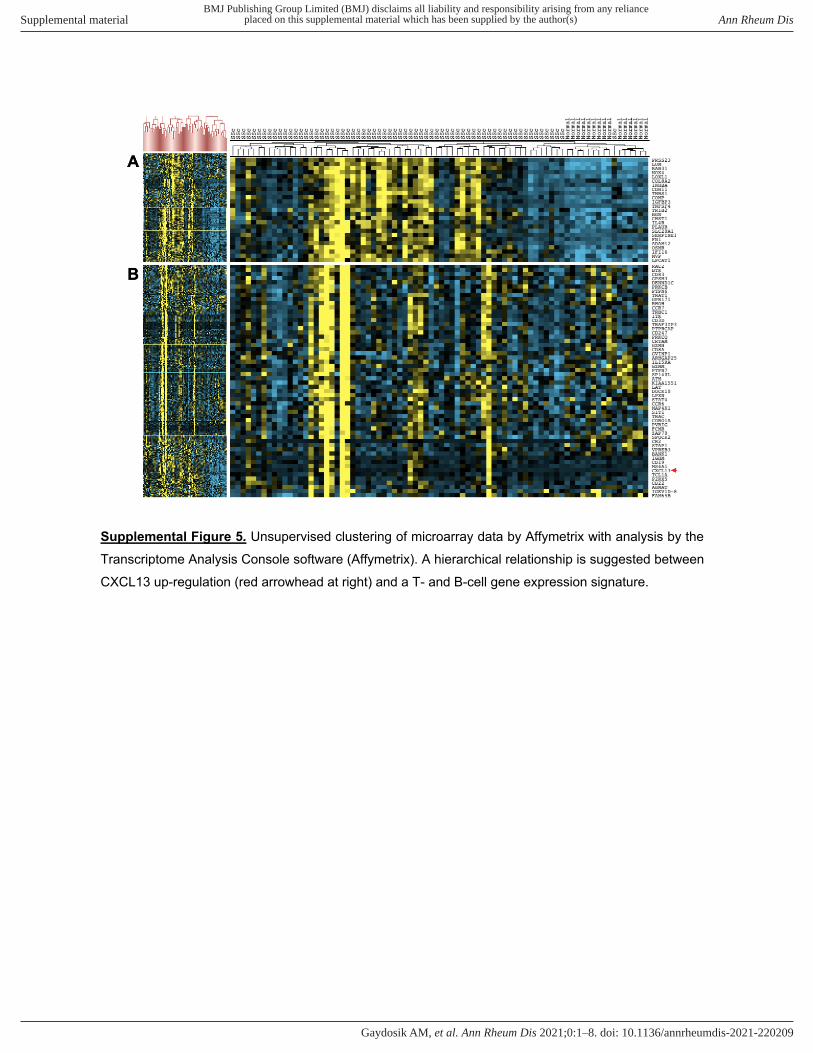
Supplemental Figure 5. Unsupervised clustering of microarray data by Affymetrix with analysis by the
Transcriptome Analysis Console software (Affymetrix). A hierarchical relationship is suggested between
CXCL13 up-regulation (red arrowhead at right) and a T- and B-cell gene expression signature.
BMJ Publishing Group Limited (BMJ) disclaims all liability and responsibility arising from any relianceSupplemental material placed on this supplemental material which has been supplied by the author(s) Ann Rheum Dis
doi: 10.1136/annrheumdis-2021-220209–8.:10 2021;Ann Rheum Dis, et al. Gaydosik AM

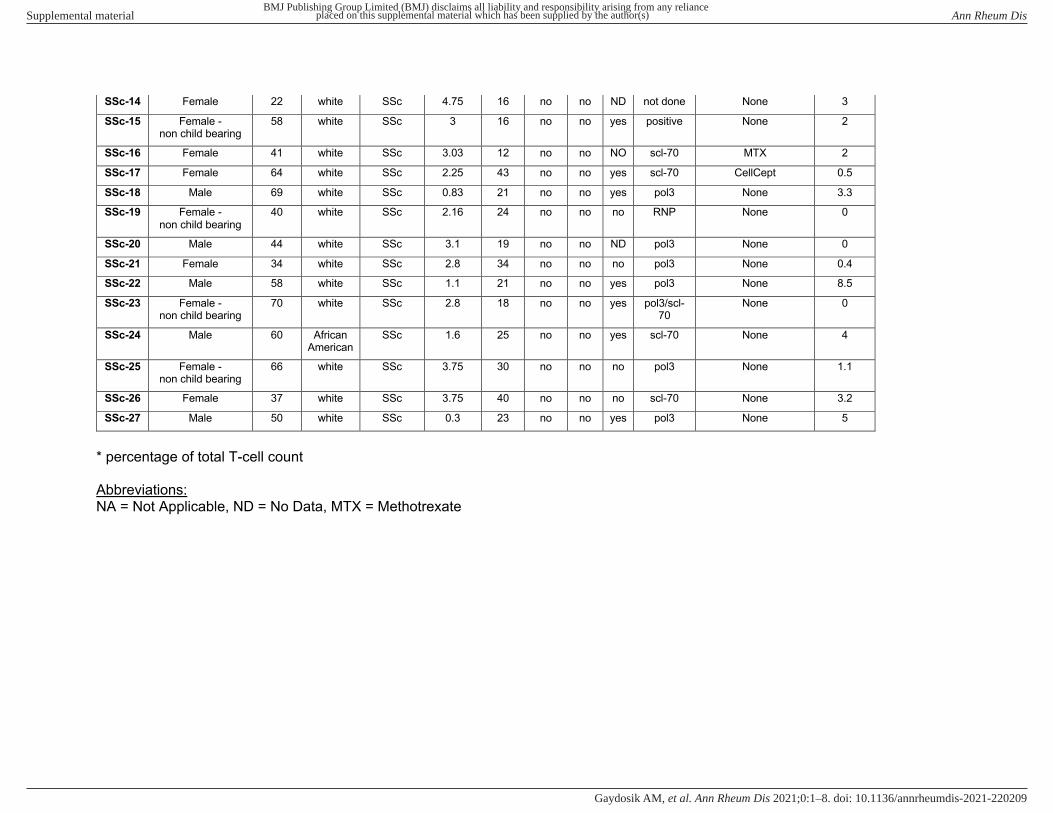
Supplementary Table 1. Demographic and clinical features of patients whose samples were used in scRNAseq.
Subject Sex Age at Biopsy (years)
Race Diagnosis Disease Duration (years)
Skin Score
Renal Crisis
PAH ILD ANA Immunosuppressant
medication at time of biopsy
% CD3+ CXCL13+
cells*
HC- 1 Male 63 White HC NA NA NA NA NA NA NA 0
HC- 2 Male 54 White HC NA NA NA NA NA NA NA 0
HC- 3 Female 66 White HC NA NA NA NA NA NA NA 0
HC- 4 Female 23 Asian HC NA NA NA NA NA NA NA 0.5
HC- 5 Female 62 White HC NA NA NA NA NA NA NA 0
HC- 6 Male 24 White HC NA NA NA NA NA NA NA 0
HC- 7 Male 64 White HC NA NA NA NA NA NA NA 1
HC- 8 Female 48 White HC NA NA NA NA NA NA NA 0
HC- 9 Male 54 White HC NA NA NA NA NA NA NA 0
HC-10 Male 61 African American
HC NA NA NA NA NA NA NA 0
SSc- 1 Female 35 white SSc 6.48 37 no no no scl-70 MTX, CellCept 0
SSc- 2 Female 55 white SSc 4.74 17 no no no scl-70 CellCept, Plaquenil 0
SSc- 3 Male 64 white SSc 2.67 34 no no ND positive CellCept, Plaquenil 1.3
SSc- 4 Female 61 white SSc 2.26 26 no no no ACA CellCept 0
SSc- 5 Male 63 ND SSc 1.21 34 no no ND positive None 1.8
SSc- 6 Male 49 white SSc 1.08 17 no no ND pol3 D-Pen, CellCept 0.9
SSc- 7 Male 60 white SSc 1.5 27 no no ND pol3 CellCept 0
SSc- 8 Female 40 white SSc 0.48 25 no no no scl-70 MTX 0
SSc- 9 Female 55 African American
SSc 2.52 21 no no yes scl-70 None 0
SSc-10 Female - non child bearing
59 white SSc 1.16 28 no no no positive None 2.3
SSc-11 Female - non child bearing
69 white SSc 1.2 32 no no yes pol3 None 3.4
SSc-12 Male 41 white SSc 1.5 12 no no no positive None 0
SSc-13 Female 46 white SSc 1.1 11 no no yes positive None 2.6
BMJ Publishing Group Limited (BMJ) disclaims all liability and responsibility arising from any relianceSupplemental material placed on this supplemental material which has been supplied by the author(s) Ann Rheum Dis
doi: 10.1136/annrheumdis-2021-220209–8.:10 2021;Ann Rheum Dis, et al. Gaydosik AM
SSc-14 Female 22 white SSc 4.75 16 no no ND not done None 3
SSc-15 Female - non child bearing
58 white SSc 3 16 no no yes positive None 2
SSc-16 Female 41 white SSc 3.03 12 no no NO scl-70 MTX 2
SSc-17 Female 64 white SSc 2.25 43 no no yes scl-70 CellCept 0.5
SSc-18 Male 69 white SSc 0.83 21 no no yes pol3 None 3.3
SSc-19 Female - non child bearing
40 white SSc 2.16 24 no no no RNP None 0
SSc-20 Male 44 white SSc 3.1 19 no no ND pol3 None 0
SSc-21 Female 34 white SSc 2.8 34 no no no pol3 None 0.4
SSc-22 Male 58 white SSc 1.1 21 no no yes pol3 None 8.5
SSc-23 Female - non child bearing
70 white SSc 2.8 18 no no yes pol3/scl-70
None 0
SSc-24 Male 60 African American
SSc 1.6 25 no no yes scl-70 None 4
SSc-25 Female - non child bearing
66 white SSc 3.75 30 no no no pol3 None 1.1
SSc-26 Female 37 white SSc 3.75 40 no no no scl-70 None 3.2
SSc-27 Male 50 white SSc 0.3 23 no no yes pol3 None 5
* percentage of total T-cell count Abbreviations: NA = Not Applicable, ND = No Data, MTX = Methotrexate
BMJ Publishing Group Limited (BMJ) disclaims all liability and responsibility arising from any relianceSupplemental material placed on this supplemental material which has been supplied by the author(s) Ann Rheum Dis
doi: 10.1136/annrheumdis-2021-220209–8.:10 2021;Ann Rheum Dis, et al. Gaydosik AM

Supplemental Table 2. Counts of CD3+ cells contributing to each cluster from the different SSc and HC samples (Figure 1C).
HC SSc Total T cells
Cluster 0 261 1040 1301
Cluster 1 208 539 747
Cluster 2 152 571 723
Cluster 3 141 354 495
Cluster 4 48 100 148
Cluster 5 40 107 147
Cluster 6 6 75 81
Cluster 7 2 47 49
Cluster 8 9 29 38
Total 867 2862
BMJ Publishing Group Limited (BMJ) disclaims all liability and responsibility arising from any relianceSupplemental material placed on this supplemental material which has been supplied by the author(s) Ann Rheum Dis
doi: 10.1136/annrheumdis-2021-220209–8.:10 2021;Ann Rheum Dis, et al. Gaydosik AM
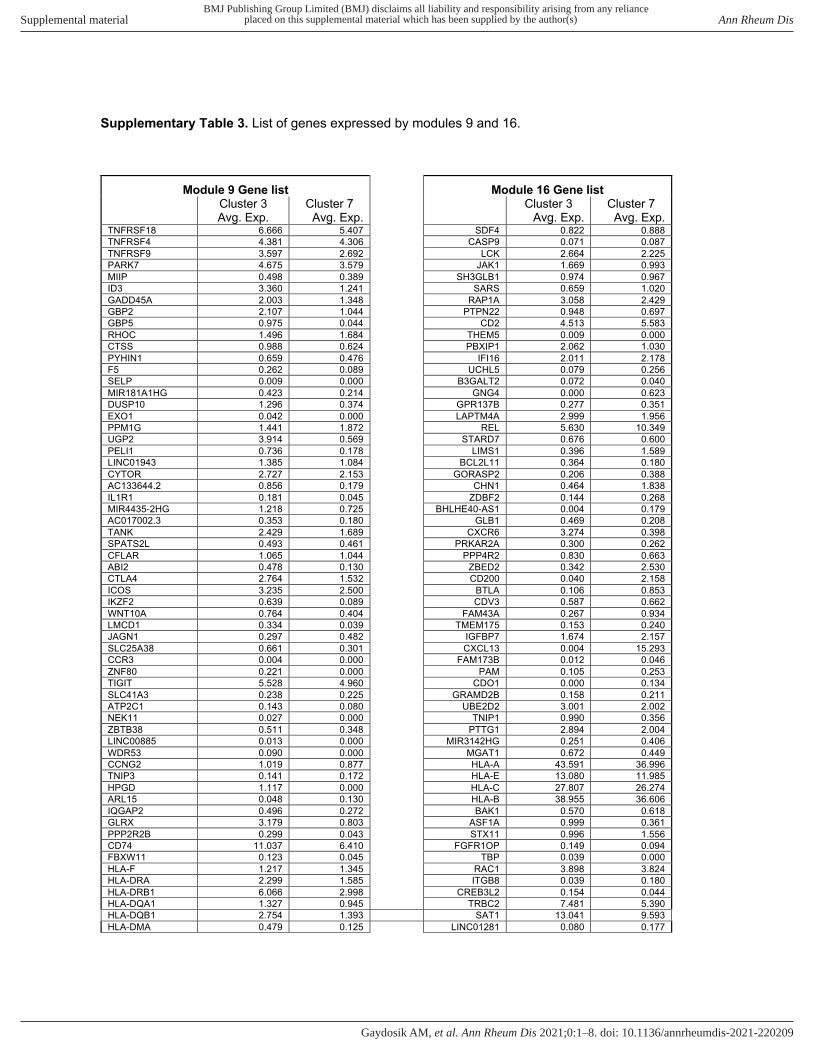
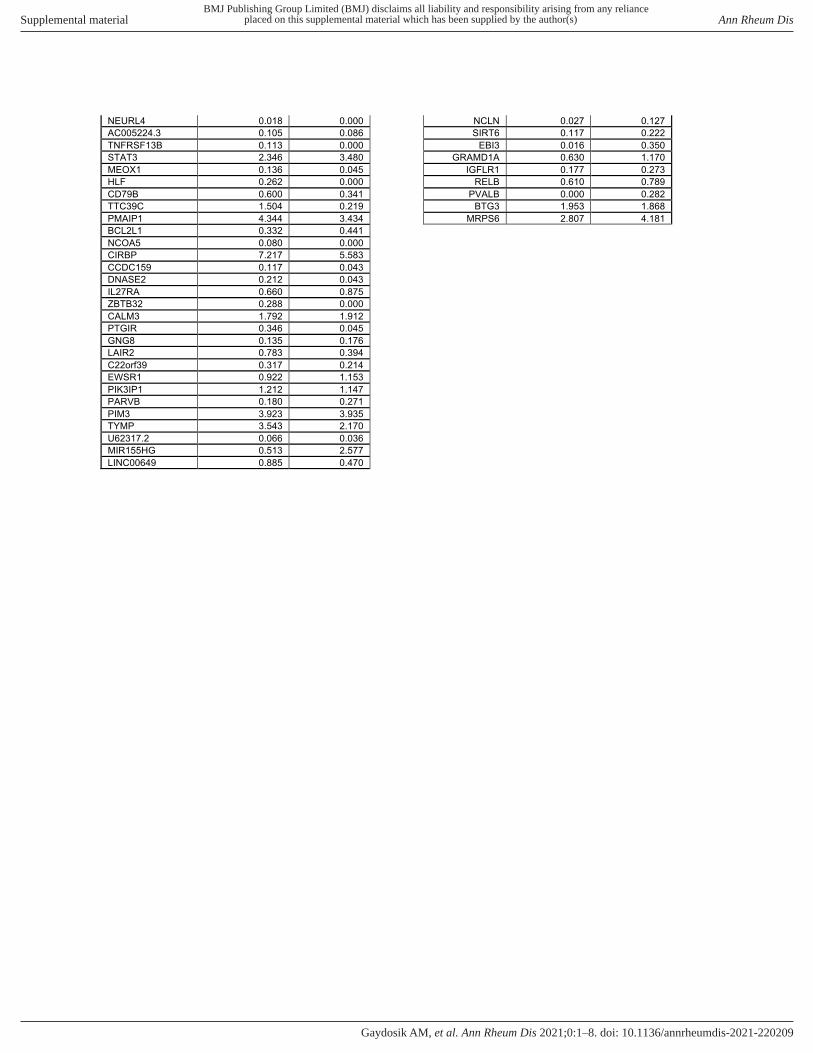
Supplementary Table 3. List of genes expressed by modules 9 and 16.
Module 9 Gene list Module 16 Gene list
Cluster 3 Avg. Exp.
Cluster 7 Avg. Exp.
Cluster 3 Avg. Exp.
Cluster 7 Avg. Exp.
TNFRSF18 6.666 5.407 SDF4 0.822 0.888
TNFRSF4 4.381 4.306 CASP9 0.071 0.087
TNFRSF9 3.597 2.692 LCK 2.664 2.225
PARK7 4.675 3.579 JAK1 1.669 0.993
MIIP 0.498 0.389 SH3GLB1 0.974 0.967
ID3 3.360 1.241 SARS 0.659 1.020
GADD45A 2.003 1.348 RAP1A 3.058 2.429
GBP2 2.107 1.044 PTPN22 0.948 0.697
GBP5 0.975 0.044 CD2 4.513 5.583
RHOC 1.496 1.684 THEM5 0.009 0.000
CTSS 0.988 0.624 PBXIP1 2.062 1.030
PYHIN1 0.659 0.476 IFI16 2.011 2.178
F5 0.262 0.089 UCHL5 0.079 0.256
SELP 0.009 0.000 B3GALT2 0.072 0.040
MIR181A1HG 0.423 0.214 GNG4 0.000 0.623
DUSP10 1.296 0.374 GPR137B 0.277 0.351
EXO1 0.042 0.000 LAPTM4A 2.999 1.956
PPM1G 1.441 1.872 REL 5.630 10.349
UGP2 3.914 0.569 STARD7 0.676 0.600
PELI1 0.736 0.178 LIMS1 0.396 1.589
LINC01943 1.385 1.084 BCL2L11 0.364 0.180
CYTOR 2.727 2.153 GORASP2 0.206 0.388
AC133644.2 0.856 0.179 CHN1 0.464 1.838
IL1R1 0.181 0.045 ZDBF2 0.144 0.268
MIR4435-2HG 1.218 0.725 BHLHE40-AS1 0.004 0.179
AC017002.3 0.353 0.180 GLB1 0.469 0.208
TANK 2.429 1.689 CXCR6 3.274 0.398
SPATS2L 0.493 0.461 PRKAR2A 0.300 0.262
CFLAR 1.065 1.044 PPP4R2 0.830 0.663
ABI2 0.478 0.130 ZBED2 0.342 2.530
CTLA4 2.764 1.532 CD200 0.040 2.158
ICOS 3.235 2.500 BTLA 0.106 0.853
IKZF2 0.639 0.089 CDV3 0.587 0.662
WNT10A 0.764 0.404 FAM43A 0.267 0.934
LMCD1 0.334 0.039 TMEM175 0.153 0.240
JAGN1 0.297 0.482 IGFBP7 1.674 2.157
SLC25A38 0.661 0.301 CXCL13 0.004 15.293
CCR3 0.004 0.000 FAM173B 0.012 0.046
ZNF80 0.221 0.000 PAM 0.105 0.253
TIGIT 5.528 4.960 CDO1 0.000 0.134
SLC41A3 0.238 0.225 GRAMD2B 0.158 0.211
ATP2C1 0.143 0.080 UBE2D2 3.001 2.002
NEK11 0.027 0.000 TNIP1 0.990 0.356
ZBTB38 0.511 0.348 PTTG1 2.894 2.004
LINC00885 0.013 0.000 MIR3142HG 0.251 0.406
WDR53 0.090 0.000 MGAT1 0.672 0.449
CCNG2 1.019 0.877 HLA-A 43.591 36.996
TNIP3 0.141 0.172 HLA-E 13.080 11.985
HPGD 1.117 0.000 HLA-C 27.807 26.274
ARL15 0.048 0.130 HLA-B 38.955 36.606
IQGAP2 0.496 0.272 BAK1 0.570 0.618
GLRX 3.179 0.803 ASF1A 0.999 0.361
PPP2R2B 0.299 0.043 STX11 0.996 1.556
CD74 11.037 6.410 FGFR1OP 0.149 0.094
FBXW11 0.123 0.045 TBP 0.039 0.000
HLA-F 1.217 1.345 RAC1 3.898 3.824
HLA-DRA 2.299 1.585 ITGB8 0.039 0.180
HLA-DRB1 6.066 2.998 CREB3L2 0.154 0.044
HLA-DQA1 1.327 0.945 TRBC2 7.481 5.390
HLA-DQB1 2.754 1.393 SAT1 13.041 9.593
HLA-DMA 0.479 0.125 LINC01281 0.080 0.177
BMJ Publishing Group Limited (BMJ) disclaims all liability and responsibility arising from any relianceSupplemental material placed on this supplemental material which has been supplied by the author(s) Ann Rheum Dis
doi: 10.1136/annrheumdis-2021-220209–8.:10 2021;Ann Rheum Dis, et al. Gaydosik AM

HLA-DPA1 1.668 1.059 CHST7 0.317 0.043
HLA-DPB1 1.915 1.330 IL2RG 2.641 1.755
ETV7 0.204 0.173 ITM2A 2.462 9.878
CUL9 0.358 0.132 SH3BGRL 2.066 1.729
DNPH1 1.319 1.056 ZCCHC18 0.031 0.090
AKIRIN2 1.383 0.689 STAG2 0.351 0.438
PNISR 2.614 4.072 DUSP4 7.439 12.585
PRDM1 1.516 0.798 FABP5 1.156 4.544
ZC3H12D 0.530 0.511 GEM 1.689 8.267
IPCEF1 0.499 0.176 RNF19A 0.886 3.832
ICA1 0.699 0.862 SLA 1.298 2.312
GARS 0.274 0.172 LY6E-DT 0.000 0.090
RHBDD2 1.088 0.706 NDUFB6 0.719 1.455
PHTF2 0.977 0.501 SIT1 2.174 1.500
NAMPT 6.118 3.949 NINJ1 1.284 1.512
CPA5 0.079 0.118 TRAF1 1.252 1.581
TRBC1 7.146 4.322 NPDC1 0.260 0.433
RAB9A 1.150 0.832 NAP1L4 0.724 1.951
SMS 1.284 2.898 ARNTL 0.283 0.046
GK 0.792 0.925 CD82 0.781 1.876
GK-AS1 0.077 0.132 MS4A6A 0.013 1.823
GPR82 0.332 0.183 CCND1 0.032 0.580
PCSK1N 0.461 0.045 SESN3 0.283 1.976
PIM2 1.283 1.001 BIRC3 10.962 13.901
FOXP3 0.904 0.043 SIDT2 0.067 0.045
MAGEH1 0.581 1.226 GRAMD1B 0.030 0.133
BEX3 1.004 0.405 SRPRA 0.403 0.416
RAB11FIP1 1.396 0.925 GATA3 2.139 0.992
NSD3 2.672 1.282 OPTN 1.087 0.906
TOX 0.385 0.440 PSAP 1.798 1.381
ZC2HC1A 0.655 0.126 GLUD1 1.610 0.853
IL7 0.049 0.045 NFKB2 0.835 0.824
HTATIP2 1.328 0.360 CPM 0.196 0.810
PGM2L1 0.780 1.684 ATP2B1 1.382 0.865
CTSC 4.121 0.783 CRADD 0.277 0.237
CASP1 0.864 0.603 ACACB 0.004 0.043
CARD16 3.982 2.144 POP5 0.249 0.421
CARD17 0.049 0.000 LHFPL6 0.023 0.805
LAYN 1.823 0.040 RAP2A 0.031 0.093
SNX19 0.020 0.000 TRAC 12.438 7.840
IL2RA 2.560 0.311 LRP10 0.670 0.621
HACD1 0.303 0.131 MBIP 0.396 0.089
STAM 0.761 0.661 CNIH1 0.815 2.395
SGMS1 0.442 0.421 FAM71D 0.018 0.043
RTKN2 1.263 0.233 RASGRP1 0.647 0.270
ENTPD1 0.846 0.221 ARPP19 1.483 0.937
FANK1 0.508 0.038 C15orf65 0.004 0.083
CD27 3.404 1.098 NMB 0.323 2.791
GPR19 0.044 0.000 ZNF267 0.552 0.356
APOLD1 1.233 0.702 C16orf87 0.419 0.340
PCED1B 0.462 0.378 CCL22 0.018 0.038
COPZ1 0.417 0.180 CMTM3 0.767 0.395
IKZF4 0.223 0.201 CYB5B 0.673 0.309
APAF1 0.083 0.000 MPRIP-AS1 0.028 0.043
ANKS1B 0.170 0.178 ALDH3A1 0.013 0.126
PMCH 0.278 0.046 EPOP 0.172 0.305
EPSTI1 0.300 0.367 IGFBP4 0.153 0.861
TBC1D4 1.580 0.616 STAT5A 0.331 0.654
MYCBP2 0.774 1.029 SEC14L1 0.309 0.243
ANKRD10 1.147 0.954 SEPT9 1.388 1.370
LINC01588 0.326 0.216 CCDC40 0.004 0.045
AKAP5 0.183 0.230 GAPLINC 0.004 0.089
RAD51B 0.039 0.079 PQLC1 0.054 0.170
BATF 5.128 2.673 SOX12 0.009 0.045
SLC12A6 0.148 0.000 CPNE1 0.604 0.581
ZC3H7A 0.344 0.212 TOX2 0.085 0.586
LINC02195 0.656 0.000 YWHAB 4.130 2.801
CPNE2 0.389 0.043 TSHZ2 0.772 3.377
BMJ Publishing Group Limited (BMJ) disclaims all liability and responsibility arising from any relianceSupplemental material placed on this supplemental material which has been supplied by the author(s) Ann Rheum Dis
doi: 10.1136/annrheumdis-2021-220209–8.:10 2021;Ann Rheum Dis, et al. Gaydosik AM
NEURL4 0.018 0.000 NCLN 0.027 0.127
AC005224.3 0.105 0.086 SIRT6 0.117 0.222
TNFRSF13B 0.113 0.000 EBI3 0.016 0.350
STAT3 2.346 3.480 GRAMD1A 0.630 1.170
MEOX1 0.136 0.045 IGFLR1 0.177 0.273
HLF 0.262 0.000 RELB 0.610 0.789
CD79B 0.600 0.341 PVALB 0.000 0.282
TTC39C 1.504 0.219 BTG3 1.953 1.868
PMAIP1 4.344 3.434 MRPS6 2.807 4.181
BCL2L1 0.332 0.441
NCOA5 0.080 0.000
CIRBP 7.217 5.583
CCDC159 0.117 0.043
DNASE2 0.212 0.043
IL27RA 0.660 0.875
ZBTB32 0.288 0.000
CALM3 1.792 1.912
PTGIR 0.346 0.045
GNG8 0.135 0.176
LAIR2 0.783 0.394
C22orf39 0.317 0.214
EWSR1 0.922 1.153
PIK3IP1 1.212 1.147
PARVB 0.180 0.271
PIM3 3.923 3.935
TYMP 3.543 2.170
U62317.2 0.066 0.036
MIR155HG 0.513 2.577
LINC00649 0.885 0.470
BMJ Publishing Group Limited (BMJ) disclaims all liability and responsibility arising from any relianceSupplemental material placed on this supplemental material which has been supplied by the author(s) Ann Rheum Dis
doi: 10.1136/annrheumdis-2021-220209–8.:10 2021;Ann Rheum Dis, et al. Gaydosik AM

Supplementary Table 4. Antibodies used in multi-color immunofluorescent microscopy.
Antibody Company Clone Species
CD3 THERMO Polyclonal Rabbit
CD4 ABCAM EPR15861 Rabbit
CXCL13 ABCAM Polyclonal Rabbit
ICOS ABCAM EPR19518 Rabbit
CTLA4 ABCAM CD3-12 Rat
TIGIT R&D Polyclonal Goat
IL21 R&D 718916 Mouse
IFNg ABCAM JES10-5A2 Rat
CD19 ABCAM Polyclonal Rabbit
CD20 NOVUS Polyclonal Rabbit
CXCR5 LS BIO Polyclonal Rabbit
BCL6 LS BIO Polyclonal Rabbit
BMJ Publishing Group Limited (BMJ) disclaims all liability and responsibility arising from any relianceSupplemental material placed on this supplemental material which has been supplied by the author(s) Ann Rheum Dis
doi: 10.1136/annrheumdis-2021-220209–8.:10 2021;Ann Rheum Dis, et al. Gaydosik AM