Simulation of Wind Power Plants · (single turbine) Detailed turbine dynamics and control,...
18
SAFER, SMARTER, GREENER DNV GL © 14 September 2017 Ervin Bossanyi Simulation of wind power plants 1 4th Workshop on Systems Engineering for Wind Energy Risø, Denmark
Transcript of Simulation of Wind Power Plants · (single turbine) Detailed turbine dynamics and control,...
DNV GL © 14 September 2017 SAFER, SMARTER, GREENERDNV GL ©
14 September 2017Ervin Bossanyi
Simulation of wind power plants
1
4th Workshop on Systems Engineering for Wind EnergyRisø, Denmark

DNV GL © 14 September 2017
What?
Time domain simulation of a wind farm as a power station
Capability to represent:
– All external environmental conditions across the site: wind, wave, current, etc.
– Flow within the wind farm array accounting for atmospheric and wake effects
– Performance, loading and control of each individual turbine + support structure
– Electrical interactions between turbines and with the grid
– Control of the wind power station as a whole
2

DNV GL © 14 September 2017
Why?
Improve wind farm design & layout– More detailed understanding of terrain, wake & electrical interaction effects
Development and testing of wind farm controls– Minimise wake interactions (induction control, wake steering, sector management)
– Provide grid ancillary services (curtailment, ramp rate limits, delta control, frequency response)
– Optimise supervisory control at wind farm level (high wind shutdown / rampdown, low voltage ride-through)
Optimisation of O&M strategies– Understanding conditions experienced by individual turbines
– Planning of scheduled maintenance
3

DNV GL © 14 September 2017
How?
×Not one tool based on one simulation model, but:
Framework or toolbox within which different models can be linked together into a simulation platform tailored to any specific problem: A database structure containing all the fundamental parameters relevant to the wind power station A set of modelling tools of different levels of sophistication for addressing problems of different complexity A framework containing interfaces to the database and the modelling tools A user interface and workflow management system
4

DNV GL © 14 September 2017
Physical components
A wind power station is a complex combination of coupled physical systems that dictate how the entire power station behaves:
– Topographical flow effects (onshore sites)
– Metocean conditions (offshore sites)
– Atmospheric stability and turbulence
– Dynamic wind turbines with individual controllers
– Turbine wake effects (affected by atmospheric turbulence)
– Wind farm electrical systems and interconnections
– Grid connection, and interaction with the external electrical network
5

DNV GL © 14 September 2017
Constraints
Economic revenues:– From electricity production
– From providing grid ancillary services
Operational costs / loss of revenue– Operation and maintenance costs
– Environmental conditions imposed on operation (e.g. noise constraints)
– Curtailment demands imposed by network operators
6

DNV GL © 14 September 2017
Examples of typical timescales
Timesteps:<1ms: electrical transients
~10ms: turbine control & loads, electromechanical interactions
~1 sec: turbine supervisory control and wake dynamics
1-10 min: farm level control
10-60 min: energy trading & forecasting
~1 day: O&M planning
∞ (steady-state): Farm layout design
7
Length of simulations:~1s: electrical transients
~1 min: grid interaction: LVRT, frequency response
10-60 min: farm control for specific wind conditions, including ancillary services
1hr – 1 year: supervisory control
1 week – 25 years: O&M strategy

DNV GL © 14 September 2017
Wind field modelling
8
Temporal variation:– Constant conditions, e.g. for simple simulations up to 10 minutes
– Low frequency variations, e.g. for some supervisory controls, energy trading, etc.
– Turbulence: 10-60 minute simulations with turbine & wake dynamics
– Turbulence + low frequencies: supervisory / farm control with turbine & wake dynamics
Spatial variation:– None
– Steady-state: Terrain / topographical effects
– Dynamic: Correlation of temporal variations across the wind farm

DNV GL © 14 September 2017
Pre-existing tools, further development and links
9
Bladed (single turbine)
Detailed turbine dynamics and control, turbulent wind
Generates fatigue loads, power etc.
(0.01s for 10 minutes)
Dynamic wind farm simulator Turbine model as LongSim
Wind field correlated across wind farm (low frequency + turbulence)
Wakes with wake dynamics, meandering
Wind farm control
(1s for hours – weeks – years)
WindFarmer (wind farm)
Terrain & wakes
Energy calculation
Layout optimisation
(steady state)
CFD (wind farm)
Terrain & wakes
RANS
(steady state)
Set-point optimiser (wind farm)
Power (delta) set-point and yaw offsets
Pre-calculated fatigue look-up
(steady state)
LongSim (single turbine )
Full turbine control with simplified dynamics, pre-calculated fatigue look-up
Low-frequency wind plus turbulence
(1s for hours – weeks – years)
Cost model

DNV GL © 14 September 2017
Dynamic wind farm simulator: 9-turbine example
10
One-hour simulation took 4 minutes on a lap-top (using one core)
• Contour plot of wind speed
• Turbines show yaw position and local wind vector
Look out for:• Turbulence advecting and evolving
• Wakes developing and meandering
• Wind direction changing (SSE to SSW)
• Turbine yaw control follows

DNV GL © 14 September 2017
Dynamic wind farm simulator: Horns Rev 1 (80 turbines)
11
• Low wind speed
• Rapid direction change -~90º in a few minutes
• Direction change propagates through the farm at mean wind speed
• Faster than real time running on a single core

DNV GL © 14 September 2017
Toolbox vision – other interconnections
More direct integration– CFD for higher-fidelity terrain & wake flow calculations
– Site layout optimisation
– Turbine aeroelastic model (Bladed)
– Cost models
Other components– Electrical models such as DigSILENT, PSCAD etc.
– Grid operational models (e.g. KERMIT)
– O&M planning models
– Market models
– Forecasting
– Etc.
12

DNV GL © 14 September 2017
Example application: control of wind farm wakes
13
• Reduced power!• increased loading!
Switch this turbine off?
Or reduce the power set-point of this one?
Or maybe yaw the turbine slightly to steer its wake away from the
next turbine?
1. What is the optimum* distribution of power and yaw set-points for all the turbines, in this wind condition?
2. How can we maintain optimum* performance in dynamically changing circumstances?
* Optimum has to be defined –depends on energy and loading
DNV GL © 14 September 2017
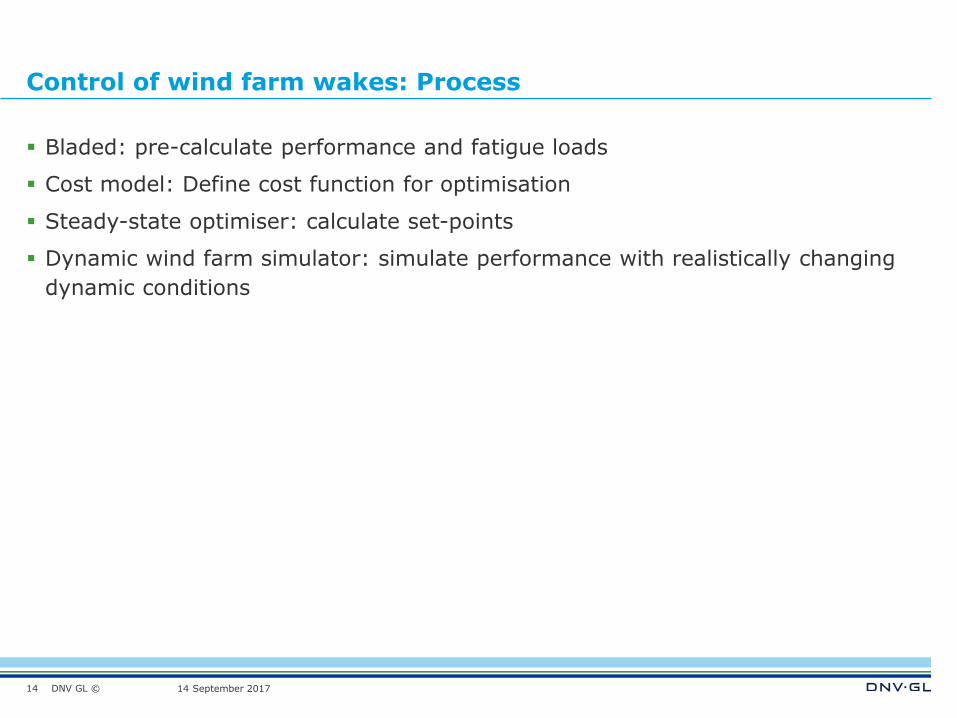
Control of wind farm wakes: Process
Bladed: pre-calculate performance and fatigue loads
Cost model: Define cost function for optimisation
Steady-state optimiser: calculate set-points
Dynamic wind farm simulator: simulate performance with realistically changing dynamic conditions
14

DNV GL © 14 September 2017
0
50
100
150
200
250
300
350
400
1 2 3 4 5 6
Del
ta (
kW)
Turbine number
9 m/s 85º
10 m/s 85º
11 m/s 85º
9 m/s 90º
10 m/s 90º
11 m/s 90º
9 m/s 95º
10 m/s 95º
11 m/s 95º
Example resultsRow of 6 turbines, 3-hour simulation with changing wind conditions
15
Fino1 mast 05-09-2003 13:20 to 16:30Wind Speed [m/s] Turbulence intensity [%]
Time [hour]
3
4
5
6
7
8
9
10
11
0.0 0.5 1.0 1.5 2.0 2.5 3.0 3.5
Fino1 mast 05-09-2003 13:20 to 16:30Wind direction [deg]
Time [hour]
88
89
90
91
92
93
94
0.0 0.5 1.0 1.5 2.0 2.5 3.0 3.5
FINO-1 data:
Optimal set-point matrix calculated for turbulence levels 4%, 7%, 10%
0
50
100
150
200
250
300
350
400
1 2 3 4 5 6
Del
ta (
kW)
Turbine number
4% turbulence 7% turbulence
Wind speed
Turbulence intensity
Wind direction

DNV GL © 14 September 2017
Example results: simulation output
16
Run 'finobase hifreq' Run 'finoopt hifreq'
MYT
Tot
al [
MNm
]
0.16
0.18
0.20
0.22
0.24
0.26
0.28
0.30
0.32Fatigue sum
Run finobase hifreq Run finoopt hifreq
Farm
Powe
r [M
W]
3.0
3.5
4.0
4.5
5.0
5.5
'finoopt hifreq']Turbine1Delta Turbine2Delta Turbine3Delta Turbine4Delta Turbine5Delta Turbine6D
[MW
]
0.05
0.10
0.15
0.20
0.25
0.30
0.35
Power reduction set-pointsTotal power
Set-points change with wind conditions
Large reduction in fatigue loading
Slight increase in energy production
DNV GL © 14 September 2017
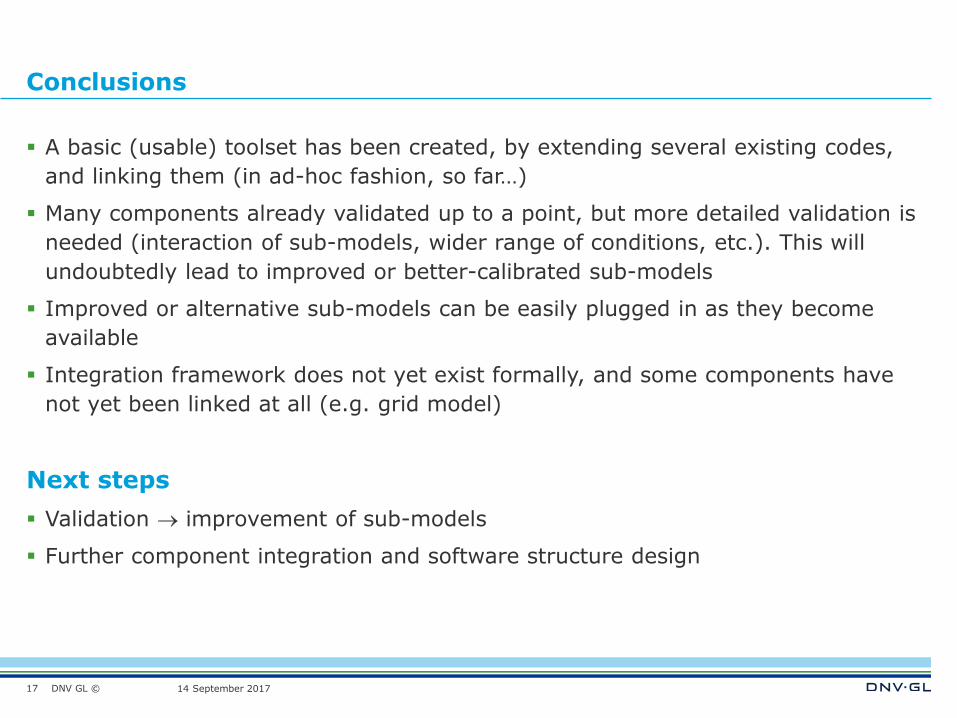
Conclusions
A basic (usable) toolset has been created, by extending several existing codes, and linking them (in ad-hoc fashion, so far…)
Many components already validated up to a point, but more detailed validation is needed (interaction of sub-models, wider range of conditions, etc.). This will undoubtedly lead to improved or better-calibrated sub-models
Improved or alternative sub-models can be easily plugged in as they become available
Integration framework does not yet exist formally, and some components have not yet been linked at all (e.g. grid model)
Next steps Validation → improvement of sub-models
Further component integration and software structure design
17