Simulation of the infrared spectra of thioacetamide by the...
7
In dian Journal of Chemistry Vo l. 4 1A, Se pt ember 2002, pp. 1777 - 1783 Simulation of the infrared spectra of thioacetamide by the extended molecular mechanics method D N Sa th ya narayana* & E Ganes hsrini vas Depa rtment of In orga ni c and Phys i ca l Chemistry, Indian In stitute of Science, Bang al ore 560 01 2, In d ia Received 4 JU li e 2002 The in fra red spec trum of the matri x- iso lated spec ies of thioace tamide has been simulated us in g the extended mol ec ul ar mecha ni cs method. Th e equilibrium structure, vibrational frequencies, dipole moment and infrared absorption intensiti es of thi o ace ta mi de have been calculated in good ag ree ment with the exper iment. The vibra ti onal frequencies and in frared abso rption intensiti es for the iso top ic molec ul es IJCH3 CSN H2, CH 3 CS I5 NH 2 and 13CH3 CS ND2 have also been ca lc ul ated co nsistent with the experiment. The infrared spectra of the matrix iso lated speci es of N- a nd C- de uterated iso topomers of thi oacc tamide, CH) CSND 2 an d CD 3 CSN H 2 have also been simulated in satisfactory agree ment with the experime nt al spectr a. We prese nted ear li er an empiri ca l potential model to successfully simulate the infrared s pectra of t wo simple primary amides, namely, forma mide and ace tamid e1,2. Th e ca lculated equilibrium structure, th er mo dyn aJ' n ic qu antities, normal mode fre qu encies and infrared absorption band intensities were found to be III goo d agree ment with the experimental measurements. We have now ex tended the study to thi oace tamide, the s ulphur analog ue of a ce tamide. Thi oacetamide is a polar molecule like ace tamide. From this laboratori, a study of the vibrational spectra of thi oace tamide and its 13 C_ , 15N_ and differently deuterium labeled molec ul es using normal coordinate analysis proce dure has alrea dy bee n reported. During the sa me time, Walter and Stag li ch 4 have me asured the Raman s pectra of thi oace tamid e and its deuterated iso topes and have ca rried out normal coo rdinate analysis using a ge nera li zed valence force field. Suzuki 5 , howeve r, was the first to perform normal coo rdinate tr ea tment for the in-plane vibra ti ons of thi oace tamid e. Th e potential func ti on empl oye d in the prese nt study calculates the vibra ti onal frequencies and equilibrium structures, w hi ch ca n more appropriately be co mpared with th e gas phase meas urements 6 ,7. We h ave therefore utili zed the recent infrared spectral measurements of thi oace tamide for th e matrix isolated species by Kund se n el ai. 8 • Th e potential func ti on has been paramete ri zed to reprodu ce th e vibra ti onal frequencies and th e qualita ti ve f ea tures of the infrared absorption intensities obse rved for the matrix isolated spectrum of thi oace tamide. Th e infrared spectra of th e matrix i so lated species of thio ace ta mide and its C- and N- deuterium labeled molec ul es h ave bee n simulated. To ch ec k the internal co nsistency of the force field, the calcula ti ons h ave bee n extended to 2H, 15N a nd 13C iso topic molecules of thioacetamide. Computational Details The ca lcul a ti ons were performed using th e sa me potential function as that empl oye d for acetamide 2 • Initia ll y the values of aj (Morse co nstant), D j e (bond dissociation energy) and r jO (bond lengths) were transferred f rom ace tamide. The Dj and aj for C=S and C-N bonds we re suitably modified bas ed on chemical intllltlOn to re produce experimental stretching frequencies. For reproducing the bending frequ encies, the values of bending force co nstants, 8 jO and Fjj we re transferred from ace tamide and modi fied to reprodu ce the e xperimental data. Th e interac ti on force co nstants of ac et amide h ave been used fo r thi oace tamide without any modification exce pt for two new interaction force co nstants included now bet wee n torsional and out- of -plane coo rdinates. Th e torsional parameters repro duce we ll the experimental fre qu encies. Th e electron ega ti vi ty va lues for H, C, N and S were taken from Pauling 9 . Th e ele ctronega ti vity of s ulphur was s li ghtly modified, to 2.6, to reprodu ce the experimental dip ole moments. Th e final potential parameters de ri ved for thi oacetami de are given in Table 1. Th e bond charge parameters and charge flu xes fo r the stretching and bending modes were taken from ace tamide 2 . The values fo r thi oace tamide we re
Transcript of Simulation of the infrared spectra of thioacetamide by the...
Ind ian Journal o f Chemistry Vo l. 4 1A, September 2002, pp. 1777-1783
Simulation of the infrared spectra of thioacetamide by the extended molecular mechanics method
D N Sath yanarayana* & E Ganeshsrini vas
Department of Inorgani c and Phys ica l Chemi stry, Indian Institute of Sc ience, Bangalore 560 01 2, Ind ia
Received 4 JUlie 2002
The in fra red spectrum of the matri x- isolated species of thioacetamide has been simul ated using the extended mo lecular mechanics method. The equili briu m structure, vibrati onal freque nc ies, dipo le mo ment and infrared absorptio n intensities of thioacetami de have been calculated in good agreeme nt with the ex perime nt. T he vibratio na l freq uencies and in frared absorption intensities for the isotopic mo lecul es IJCH3CSN H2, C H3CS I5NH2 and 13CH3CS ND2 have also been calculated
consiste nt with the ex perime nt. T he infrared spectra o f the matri x isolated spec ies o f N- and C- deuterated isotopomers of thioacctamide, C H)CSND2 and CD3CSN H2 have also been simul ated in sat isfactory agreement with the experimental spectra.
We presented earlier an empiri cal po tenti al model to successfull y simulate the infrared spectra of two simple primary amides, namel y, formamide and acetamide1,2. The calculated equilibrium structure, thermodynaJ'n ic quantities, normal mode frequencies and infrared absorption band intens ities were found to be III good agreement with the experimental measurements. We have now extended the study to thioacetamide, the sulphur analogue of acetamide. Thioacetamide is a polar molecule like acetamide. From thi s laboratori, a study of the vibrational spectra of thi oacetamide and its 13C_, 15N_ and di fferently deuterium labeled molecules using normal coordinate analys is procedure has already been reported. During the same time, Walter and Stag lich4
have measured the Raman spectra of thi oacetamide and its deuterated isotopes and have carried out normal coordinate analysis using a generali zed valence force field. Suzuki5, however, was the first to perfo rm normal coordinate treatment for the in-plane vibrations of thioacetamide.
The potential function employed in the present study calcul ates the vibrational frequencies and equilibrium structures, which can more appropriately be compared with the gas phase measurements6
,7. We have therefore utili zed the recent infrared spectral measurements of thioacetamide fo r the matrix isolated species by Kundsen el ai. 8
• The potenti al function has been parameteri zed to reproduce the vibrati onal frequencies and the qualitati ve features of the infrared absorption intensities observed for the matrix isolated spectrum of thi oacetamide. The in frared spectra of the
matrix isolated species of thioacetamide and its Cand N- deuterium labeled molecules have been simulated. To check the internal consistency of the fo rce field , the calculations have been extended to 2H, 15N and 13C isotopic molecules of thioacetamide.
Computational Details The calcul ations were performed using the same
potential function as that employed fo r acetamide2•
Initially the values of aj (Morse constant), D je (bond
dissociati on energy) and r jO (bond lengths) were transferred from acetamide . The Dj and aj for C=S and C-N bonds were suitably modified based on chemical intllltlOn to reproduce experimental stretching frequenc ies. For reproducing the bending frequencies,
the values of bending fo rce constants, 8 jO and F jj were transferred from acetamide and modi fied to reproduce the experimental data. The interaction force constants of acetamide have been used fo r thioacetamide without any modificati on except for two new interaction force constants included now between tors ional and out-of-plane coordinates . The tors ional parameters rep roduce well the experimental frequencies. The electronegati vi ty values for H, C, N and S were taken from Pauling9
. The electronegati vity of sulphur was slightly modified, to 2.6, to reproduce the experimental dipo le moments. The fin al potential parameters deri ved for thioacetamide are g iven in Table 1.
The bond charge parameters and charge flu xes fo r the stretching and bending modes were taken fro m acetamide2
. T he values for thioacetamide were
1778 INDIAN 1 CHEM, SEC A, SEPTEMBER 2002
Table I--Potential parameters for thioacetamide
Non-bonded interactions Bending force constants, Fjj rjj (/jj' ajA I3 jj, (/1 Cjj ' A Angle 8j 8jO , deg Fjj, aJ rad-2
S .... S 20.866 389.990 2.980 Bond stretching H-C-H 111.0 0.535 op bending rj aj, A- I Dj, aJ rj , A C-N-H 116.5 0.500 NH2 0.0
0.0030 H-C 1.835 0.628 1.150 N-C=S 121.0 1.563 C=S 0.0
0.4100 C-C 1.880 0.430 1.500 C-C-N 119.0 0.480 C=S 1.800 0.917 1.196 C-C=S 120.0 0.720 C-N 2.000 0.820 1.373 H-C-C 109.5 0.620 N-H 2.300 0.560 1.011 H-N-H 127.0 0.235
Interaction force constants, Fjj 10-8 N rad·1 Stretch-stretch N em-I Stretch-bend Bend-bend, aJ rad-2 Torsion, aJ
C- H, C- H 0.040 H - C -C, 0.140 H -C- C, -0.010 V2j (C-C-I\'-H) -0.0204 C-C H-C-C
C =S,C-C 0.414 C -C = S, 0.252 H -C-C, -0.109 V2j (H-N-C=,S) -0.0204 C=S N-C=S
C-C, C- N 0.350 C-C- N, 0.243 C-C = S, -0.200 V3j (H-C-C-N) -0.0011 C-N N -C =S
C= S,C-N 1.188 C-C-N, 0.048 C -C = S, -0.360 C-C C-C-N
N - H, N - H -0.077 N -C = S, 0.356 C-C- N, -0.337 C=S N-C=S
C - H, N - H 0.030 N -C = S, 0.362 C - C - N, 0.015 C-N C-N-H C - N - H, 0.125 N -C = S, -0.027 C-N C-N-H C-N -H, 0.100 C- N - H, -0. 120 N - N C-N-H H - N - H, 0.049 C - N - H, -0.128 N-H H-N-H
C-C-N-H -0.074 C* (C, N, = S) C-C- N - H, 0.088 N* (Hz, C =)
* Atom going out of the plane formed by the three atoms given in parenthesis.
parameterized to reproduce i :-1C experimental dipole moments and infrared absorption intensities and they are given in Table 2. The bond charge parameters of C = Sand N-H are different from those of acetamide. On the basis of the stretching flux analysis of Gussoni et al. lO
, it may be said that the values for the CN and NH bonds of thioacetamide reflect the polarity of these bonds. The CN bond is more rigid in thioacetamide relative to that in acetamide consistent with a higher torsional barrier about the C-N bondS. The C = S bond is less polar when compared to that of the CO bond and the value for the stretching flux reveals this feature. The bending charge fluxes for the NCS moiety of thioacetamide was modified from that
of the NCO group. For the CNH group, only a sli ght modification was required.
The infrared spectrum was simu lated assuming Lorentzian line shape and standard half bandwidth «(Do) for a known concentration in the range 1800 to 200 cm- ' .
Results and Discussion The calculated and experimental structural
parameters, dipole moment and atomic charges are g iven in Table 3. There is good agreement between the calculated and experimental equilibrium structure". However, the difference between the observed and calculated dipole moment is somewhat
SATHYANARA YANA et at.: SIMULATION OF INFRARED SPECTRA OF THIOACETAMIDE 1779
larger. As is generally the case, the net atomic charges calculated in the present work are overestimates.
Under the point group symmetry Cs, the normal vibrations of thioacetamide are classified as 14A' + 7 A" modes. The observed and calculated vibrational frequencies and infrared absorption intensities for thioacetamide are presented in Table 4. The agreement between the calculated and experimental frequencies is good except for the CH 3 deformations, which show slightly larger deviations. The calculated values for the asymmetric and symmetric CH3
bending modes are 1411 and 1394 cm- I respectively while the experimental values are 1440 and 1369 cm- I
respectively . The assignments for A' and A" vibrations are in
complete agreement with Knudsen et at. 8 excepting
Table 2-Bond charge parameters and bond charge fluxes for thioacetamide
Bond charge parameters, ~, e Bond stretching fluxes, e A- I
H -C 0.1300 8qs ; c / 8Rc; s 0.300
C=S 0.7680 8qCN /8RcN -1.100
C-N 0.1100 8qcc / 8Rcc -0.020
N - H 0.7500 8qNH / 8RNII -0.320
Homogenous y 8qCH /8Rcll -0.100
C-C 0.350 8qcII /8R'cH -0.035
Angle bending fluxes, e rad·1
N - C = S group C - N - H group
8qc ; s / 80s; C - N -0.040 8qCN /80cNH 0.085
8qcs / 80s; C - C 0.040 8qNH / 80cNil 0.065
8qcs / 80c - c - N 0.000 8qCN / 80' HNII -0.170
8qNII / 8011 NH -0. 130
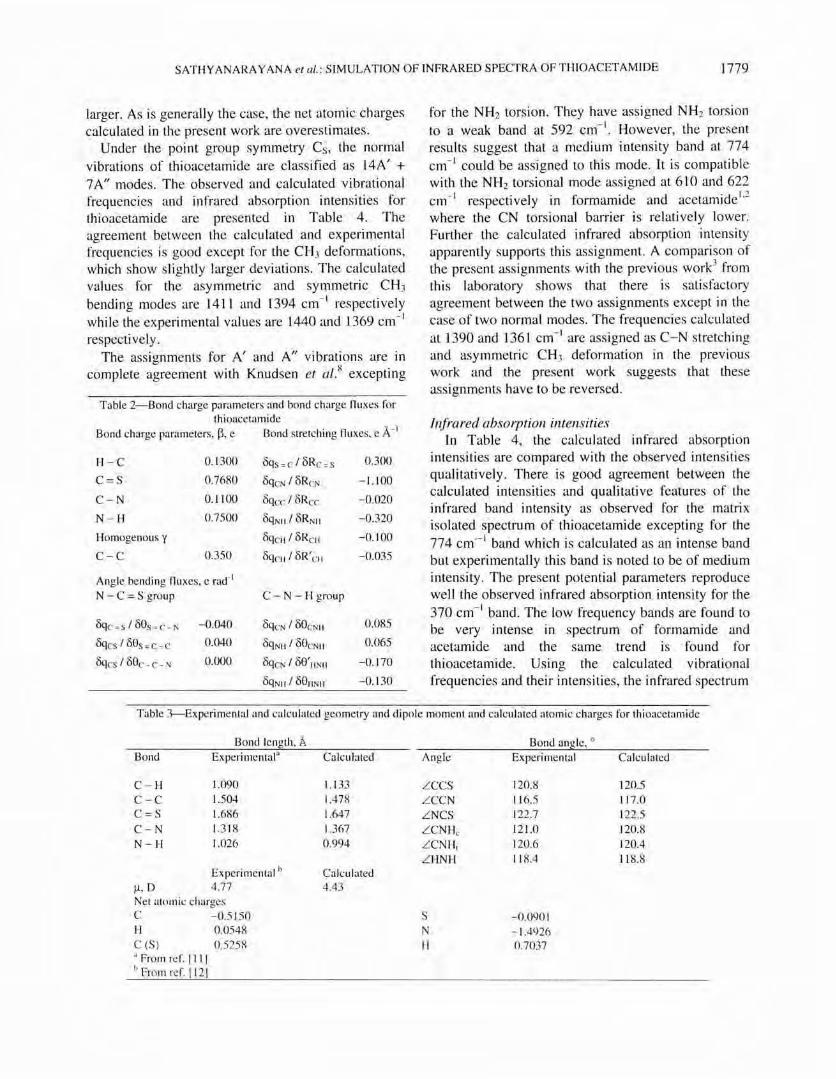
for the NH2 torsion. They have assigned NH2 torsion to a weak band at 592 cm - I . However, the present results suggest that a medium intensity band at 774 cm- I could be assigned to this mode. It is compatible with the NH2 torsional mode assigned at 610 and 622 cm- I respectively in formamide and acetamide\.2 where the CN torsional barrier is relatively lower. Further the calculated infrared absorption intensity apparently supports this assignment. A comparison of the present assignments with the previous work3 from this laboratory shows that there is satisfactory agreement between the two assignments except in the case of two normal modes. The frequencies calculated at 1390 and 1361 cm- I are assigned as C-N stretching and asymmetric CH3 deformation in the previous work and the present work suggests that these assignments have to be reversed.
Illfrared absorption intensities In Table 4 , the calculated infrared absorption
intensities are compared with the observed intensities qualitatively. There is good agreement between the calculated intensities and qualitative features of the infrared band intensity as observed for the matrix isolated spectrum of thioacetamide excepting for the 774 cm·- I band which is calculated as an intense band but experimentally this band is noted to be of medium intensity. The present potential parameters reproduce well the observed infrared absorption intensity for the 370 cm- I band. The low frequency bands are found to be very intense in spectrum of formamide and acetamide and the same trend is found for thioacetamide. Using the calculated vibrational frequencies and their intensities, the infrared spectrum
Table 3--Experimental and calculated geometry and dipole moment and calculated atomic charges for thioacetamide
Bond length, A Bond angle, 0
Bond Experimental" Calculated Angle Experimental Calculated
C - H 1.090 1. 133 L CCS 120.8 120.5 C-C 1.504 1.478 L CCN 116.5 117.0 C=S 1.686 1.647 LNCS 122.7 122.5 C-N 1.318 1.367 LCNHc 121.0 120.8 N - H 1.026 0.994 LCNH, 120.6 120.4
L HNH 11 8.4 11 8.8 Experimental b Calculated
)l, D 4.77 4.43 Net atomic charges C - 0.5150 S - 0.0901 H 0.0548 N - 1.4926 C (S) 0.525R H 0.7037 " From ref. [ IIJ h From ref. r 12]
1780 INDI AN J C HEM , SEC A, SEPTEMBER 2002
Table 4--Ex perimental and calculated vibrati onal frequencies and infrared intensities for thioaeetamicle
Freguenc}' , cm-I
EXEtl. So li d" Matri xh
A' 3295 3520 3080 3404 2945 2963
2850 1650 1596 1479 1440
1390 1369 1362 1346
1303 13 I I
1025 999
972 938 719 728 471 470
377 430 A"· 2977 2920
1440
11 30 101 8
760 774
709 508 51 2 370
" From ref. [3]; b From re f. [8].
'" u c a
%: ' E 1--- ____
VI e ]-
1700
Ca lcd.
3530 3387 294 1 2866 1597 1411 1394 1354 1299 1008 93 1 71 8 471 419 2938 1410 1024 775 501 386 147
( b)
200
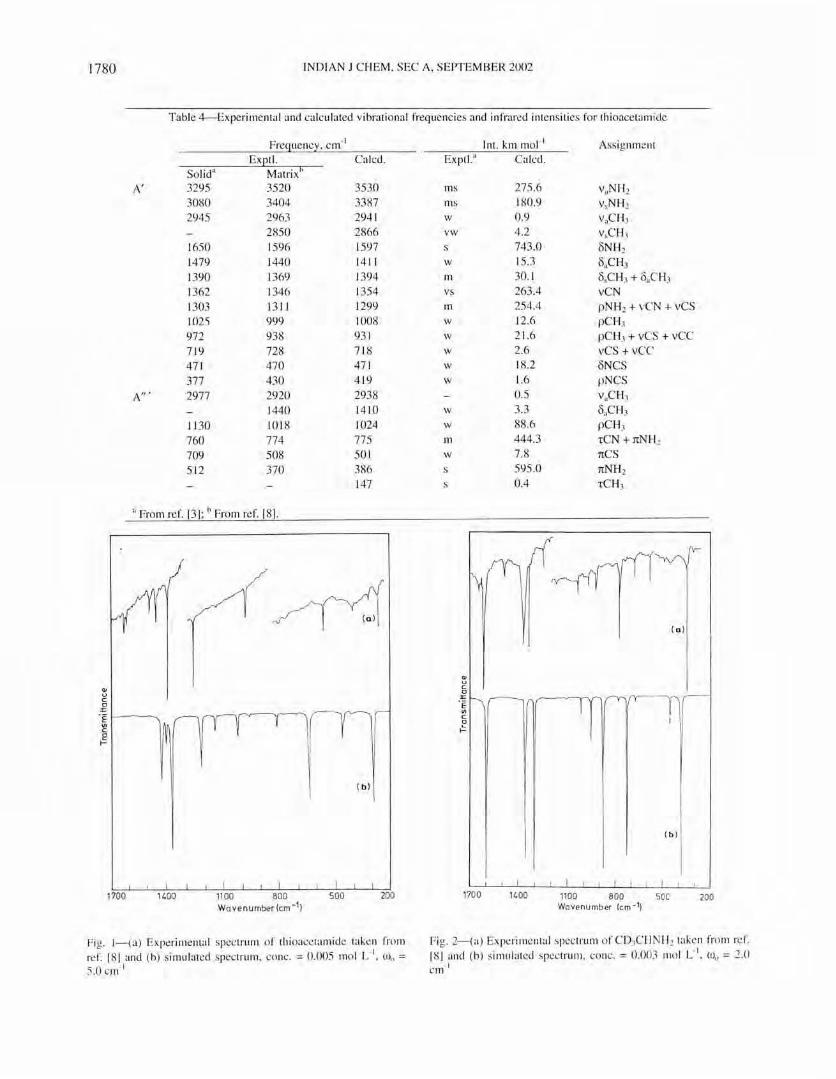
Fi g. l--{a) Experimental spectrum of thi oacetamide taken from ref. [8 1 and (b) simulated spectrum , conc. = 0.005 mol L-
I, OJ" =
5.0 cm-I
Exptl."
ms ms w vw
s w m vs m w w w w
w
w w m w
., u c a
%: 'E
VI c a ~
1700
Int. km ma r l
Calcd .
275.6 180.9 0.9 4.2 743.0 15 .3 30. 1 263 .4 254.4 12.6 2 1.6 2.6 18.2 1.6 0.5 3.3 88.6 444.3 7.8 595.0 0.4
Assignment
v"NH2 vsNH 2
v"CH, vsCH, ON H2 O"CH, OsC H, + o"CH, vCN pNH 2 + vCN + vCS pC H, pCH3 + vCS + vCC vCS + vCC oNCS pNCS
v"C H3
O"CH3
pC H3
tCN + nNH2 nCS nNH2 TCH)
( a )
n I '
( b )
1100 800 soc 200 Wavenu mber !em - 1)
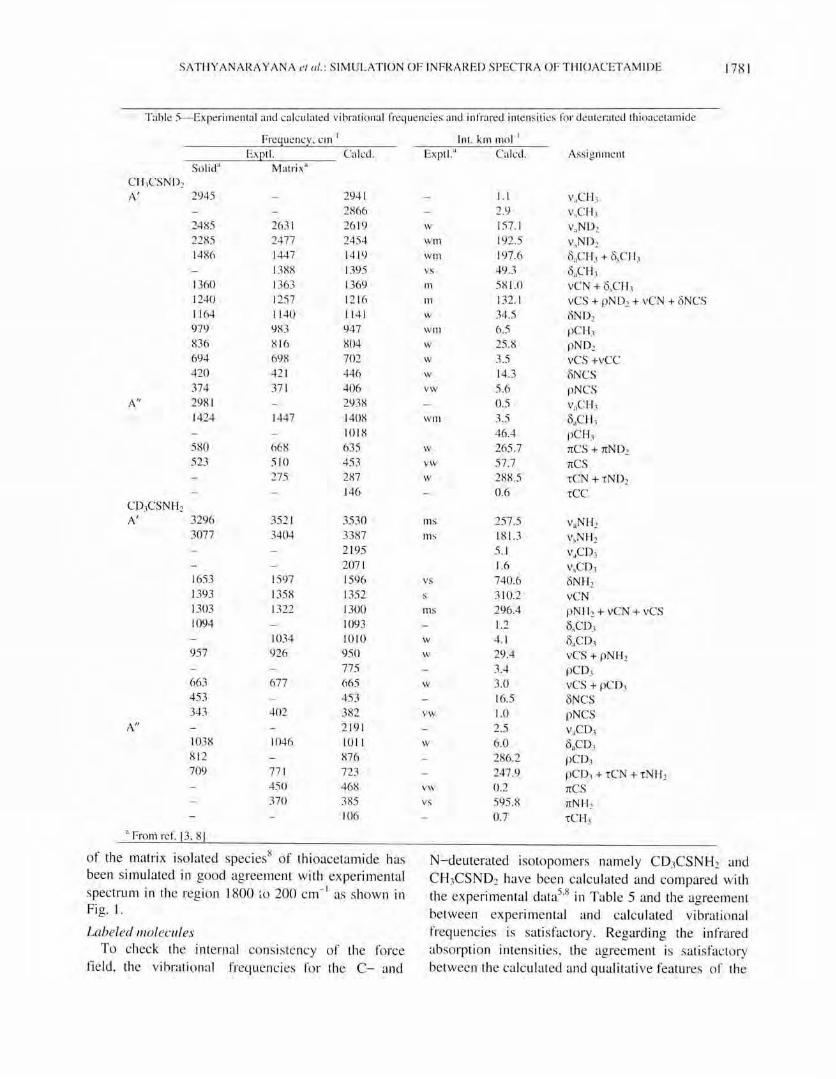
Fig. 2--{a) Experimenta l spec trum of CD, CH NH2 taken from re f. [81 and (b) simul ated spec trum, co nc. = 0.003 mol L-I
, OJo = 2.0 · 1 cm
SATHYANARA YANA el al.: SIM ULATION OF INFRARED SPECTRA OF THIOACETAMIDE 178 1
Table 5-Experilllen tal and ca lcu lated vibrational frequencies and infrared intensities for deuterated th ioacetaillide
Frequency, cm-' Exptl. Calcd.
So lid" Matri x"
AN
AN
2945
2485 2285 1486
1360 1240 11 64 979 836 694 420 374 298 1 1424
580 523
3296 3077
1653 1393 1303 1094
957
663 453 343
1038 812 709
" Frolll ref. 13, 81
2631 2477 1447 1388 1363 1257 11 40 983 816 698 42 1 37 1
1447
668 510 275
352 1 3404
1597 1358 1322
1034 926
677
402
1046
77 1 450 370
294 1 2866 26 19 2454 1419 1395 1369 12 16 11 41 947 804 702 446 406 2938 1408 10 18 635 453 287 146
3530 3387 2195 207 1 1596 1352 1300 1093 1010 950 775 665 453 382 2 191 10 11 876 723
468 385 106
o f the matri x i so lated spec ies8 of thioacetamide has
been simulated in good agreement with experimental
spectrum in the region 1800 to 200 cm- 1 as shown in Fig. I.
Labeled molecules To check the intern al consistency of the force
f ield, the vibrational frequencies for the C- and
Int. kmlllo)"' Expt l." Ca lcd.
W
Will Will vs III
III
W
Will W
W
W
vw
Will
W
vw
W
illS illS
vs
illS
W
W
W
vw
W
vw
VS
1.1 2.9 157.1 192.5 197.6 49.3 581.0 132. 1 34.5 6.5 25.8 3.5 14_3 5.6 0.5 3.5 46.4 265.7 57.7 288.5 0.6
257.5 181.3 5. 1 1.6 740.6 310.2 296.4 1.2 4. 1 29.4 3.4 3.0 16.5 1.0 2.5 6.0 286.2 247.9 0.2 595.8 0.7
Assignillent
v"CH, v,CH, v"ND2 v,ND2 b"CH, + b,CH, b"CH, vCN + b,CH, vCS + p D2 + vC + bNCS bND2 pCH, pND2 vCS +vCC bNCS pNCS v"CH3
b"CH] pCH, nCS + nND2 nCS TCN + TND2 TCC
v"N H2 vsNH2 v"CD, v,CD) bN H2 vCN pNH2 + vCN + vCS bsCD, b"CD} vCS + pNH2 pCD) vCS + pCD, bNCS pNCS v"CD, b"CD, pCD3
pCD} + TCN + TNH2 nCS nNH2 TCH,
N-deuterated isotopomers namely CD}CSNH2 and
CH}CSND2 have been calculated and compared w ith
the experimental datas.8 in Table 5 and the agreement
between experimental and calcu lated vibrational
frequencies IS sati sfactory. Regarding the infrared
absorption intensiti es, the agreement IS sati sfactory
between the ca lculated and qualitati ve features of the
1782 INDIAN J C HEM, SEC A, SEPTEMB ER 2002
Table 6--Ex perimental frequenci es (c m· l) and observed and ca lcul ated shifts for selec ted bands o f I:lC and 15N isotopic
mo lec ules of thi oacetamide"
C H,CS I5NH2 IJCH)CSN H2 I:lC H)CSND1
Freq uency S hift ~ Freq ue ncy Ex ptl. Obsd. Ca lcd. Exptl.
1640 -8 -8 1648 1475 - 4 0 1478 1387 -3 0 1389 136 1 - I - 7 135 1 1300 -3 - 5 1303 1024 - I -2 1022 970 -2 - 2 965 714 -5 - 3 710 704 -5 -6 703 512 0 0 512 466 -5 - 5 470
" From ref. [4, 12 J; b Sh i ft !'J. v = V isolOpomcr - V p"rcnt Illoleeule
~ u C Cl
E VI C o '-t-
1700
(a)
( b )
Wavenumber Icm- 1)
Obsd.
0 -I - I
- II 0 - 3 -7 - 9 -6 0
- I
200
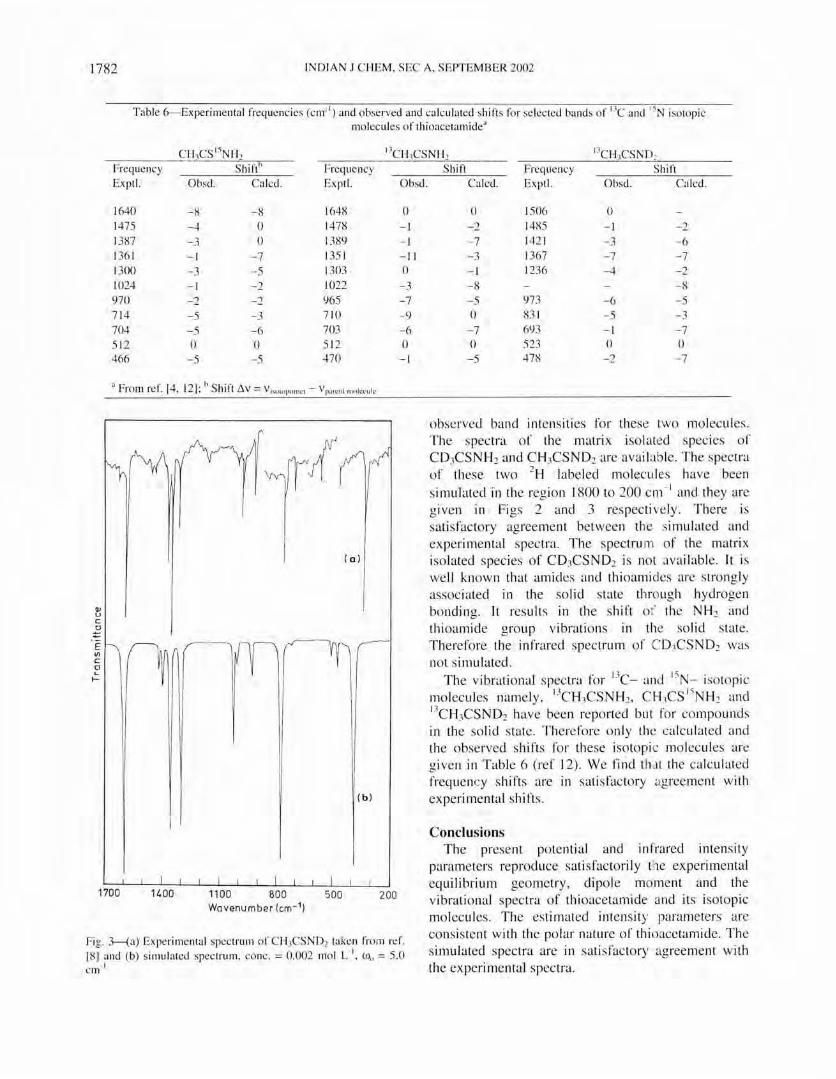
Fig. Ha) Experimental spectrum o f C H)CSND2 taken from ref. [8] and (b) s imul ated spect rum, conc. = 0.002 mo l L- I, Wo = S.O
· 1 cm
Shift Frequency Shift Ca lcd. Exptl. Obsd. Ca lcd.
0 1506 0 -2 1485 - I - 2 - 7 142 1 -3 -6 -3 1367 - 7 -7 - I 1236 - 4 - 2 -8 - 8 - 5 973 - 6 - 5 0 83 1 -5 - 3
- 7 693 - I - 7 0 523 0 0 -5 478 - 2 - 7
observed band intensities for these two molecules. The spec tra o f the matri x isolated species of CD,CSNH2 and CH}CSND2 are avai b ble. The spec tra of these two 2H labeled mo lecu les have been
simu lated in the region 1800 to 200 cm- I and they are given in Figs 2 and 3 respecti ve ly. There is sati sfactory agreement between the simul ated and ex perimental spectra. The spectrum of the matrix isolated species of CD3CSND2 is not available. It is we ll known that amides and thioamides are strong ly associated in the solid state th rough hydrogen bonding. It results in the shift of the NHz and thioamide group vibrations in the solid state. Therefore the infrared spectrum of C D1CSN D2 was not simul ated.
The vibrational spectra fo r 13C_ and 15N_ isotopic molecu les namely, 13CH3CSNH2, CH:\CS I5NH2 and 13CH3CSND2 have been reported but for co mpounds in the solid state. Therefore o nly the calculated and the observed sh ifts for these isotopic mo lecules are g iven in Table 6 (ref 12). We find that the calcul ated frequen cy shifts are in satisfactory ag reement with experimental shifts.
Conclusions The present poten ti a l and in frared intens ity
parameters reproduce satisfactori Iy the experimental equilibrium geometry , dipo le mo ment and the vibrational spec tra of thioacetamide and its isotopic molecules. The estimated intens ity parameters are consistent with the po lar nature of thioacctamide . The simulated spectra are in sati sfac to ry agreement w ith the experimental spectra.
SATI-IY ANARA Y ANA et al.: SIMULATION OF INFRARED SPECTRA OF TI-IIOACETAMIDE 1783
Acknowledgement The authors are greatly thankful to Prof. K Machida
and Dr. Y Miwa (Kyoto University, Japan) for their help by providing the RISE program.
References I Ganeshsrini vas E, Sathyanrayana D N, Machida K & Mi wa
Y, J lIIolec Struct (Theochelll ), 403 (1997) 153. 2 Ganeshsrini vas E, Sathyanrayana D N, Machida K & Miwa
Y, J lIIolec Struct (Th eochelll ), 36 1 (1 996) 2 17. 3 Ray A & Sathyanarayana D N, Bull chelll Soc Japan , 47
(1974) 729. 4 Walter W & Staglich P, Spectrochilll Acta, 3 (1974) 1739.
5 Suzuki I, Bull chem Soc Japan , 35 (1962) 1449.
6 Machida K, Noma I-I & Miwa Y, Indian J pure app/ Phys, 26 (1988) 197.
7 Miwa Y & Machida K, J Alii chem Soc, 110 ( 1988) 51 83.
8 Kundsen R, Sala 0 & I-Iase Y, J molec Struct, 32 1 (1994) 197: 321 ( 1994) 187.
9 Pauling L, The nature of chelllical bond (Cornell University, Ithaca, New York) 1960.
10 Gussoni M, Castiglioni C & Zerbi G, J phys Chern , 88 (1984) 600.
11 I-I argittai M, Samdal S & Seip R, J molec Struct, 71 (1984) 147.
12 Walter W & Kubersky I-I P, Ann Chelll, 694 ( 1966) 352.