Quantitative Issues In Asphalt Infrared Spectra ... · Quantitative Issues In Asphalt Infrared...
30
Quantitative Issues In Asphalt Infrared Spectra Interpretation Infrared Spectra Interpretation Ron Glaser Fred Turner WRI Transportation Technology Unit
-
Upload
truongquynh -
Category
Documents
-
view
222 -
download
0
Transcript of Quantitative Issues In Asphalt Infrared Spectra ... · Quantitative Issues In Asphalt Infrared...

Quantitative Issues In Asphalt Infrared Spectra InterpretationInfrared Spectra Interpretation
Ron Glaser Fred Turner
WRI Transportation Technology Unit

Quantitative Issues In Asphalt Infrared Spectra InterpretationInfrared Spectra Interpretation
Acknowledgements:
SHRP PROGRAM
The Transportation Technology Staff at WRI
Federal Highway Administration

Quantitative Issues In Asphalt Infrared Spectra InterpretationInfrared Spectra Interpretation
• Asphalt: The analyst’s nightmare
• Thousands of high boiling compounds
I f d id i f ti i f ti l• Infrared provides information concerning functional groups, but analysis for compounds is very difficult
• The spectrum is not a pure compound. It is the sum of aThe spectrum is not a pure compound. It is the sum of a complex mixture of compounds

Quantitative Issues In Asphalt Infrared Spectra InterpretationInfrared Spectra Interpretation
ProblemProblem:
Sophisticated studies (ie mechanistic kineticsSophisticated studies, (ie, mechanistic kinetics, phase field studies) require the best precision and accuracy obtainable.y
How can we get more and better information from th IR t ?the IR spectra ?

Quantitative Issues In Asphalt Infrared Spectra Interpretation
QuickReviewInfrared Spectra Interpretation
MolarAbsorbtivity
Path Length• The relationship between the absorbance and the actual
concentration of the functional group is given by Beer’s law:
Absorbtivity Length
A bcAbsorbance Molar
Concentration
• The molar absorbtivity value ONLY applies to a given compound in a given solventcompound in a given solvent.
Quantitative Issues In Asphalt Infrared Spectra Interpretation
QuickReviewInfrared Spectra Interpretation
• Unfortunately, the absorbtivity of a functional group varies with the molecule it is attached to.with the molecule it is attached to.
Compound Peak Location Molar Absorbtivity
Benzyl sulfoxide 1056 2446
Butyl sulfoxide 1037 4498
Didecyl sulfoxide 1055 7439
Dimethyl sulfoxide 1070 4633et y su o de 0 0 633
Pentyl sulfoxide 1043 2939

Quantitative Issues In Asphalt Infrared Spectra InterpretationInfrared Spectra Interpretation
Possible improvements
• Reference Subtraction (works well with oxidation studies)
• Solvent defined separations• Solvent defined separations
• Derivatization (Chemical reactions with functional groups, functional group analysis)
• Peak Series Expansion
• Multivariable Linear Regression

Quantitative Issues In Asphalt Infrared Spectra Interpretation
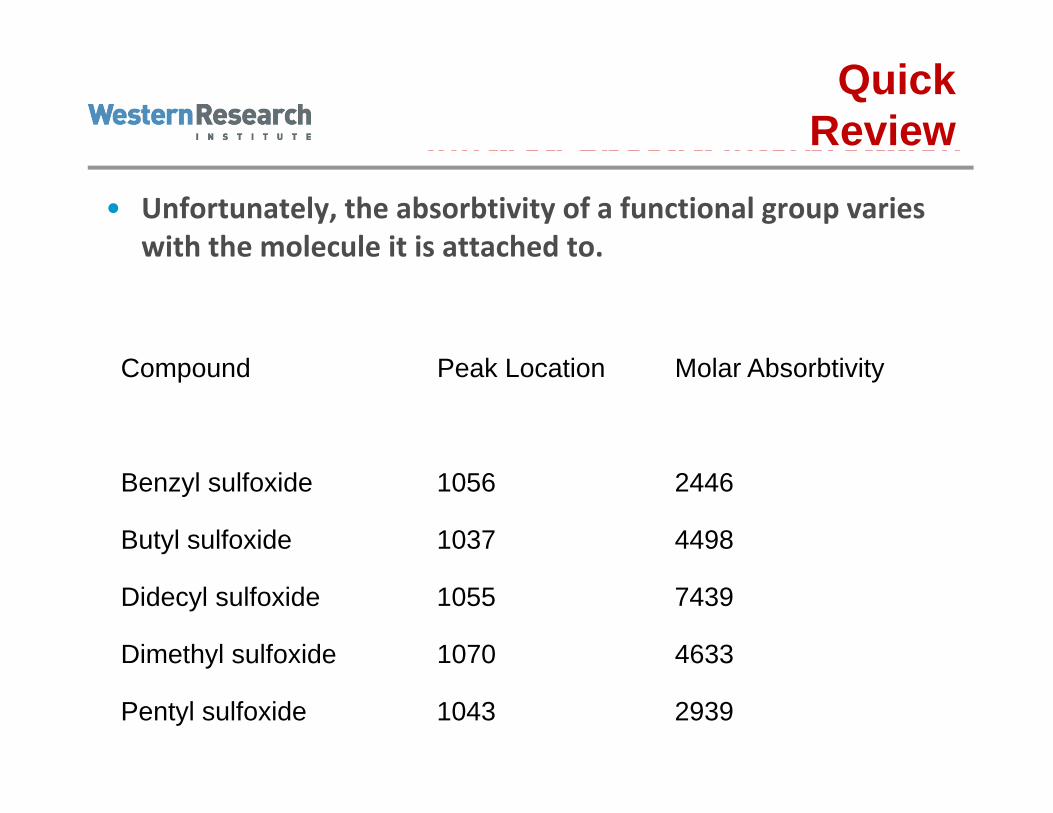
Reference SubtractionInfrared Spectra Interpretation
Full Spectra of eight aged asphalts (20 atm)aged asphalts (20 atm) in carbon disulfide
Quantitative Issues In Asphalt Infrared Spectra Interpretation
Reference SubtractionInfrared Spectra Interpretation
Full Spectra of eight aged asphalts (20 atm) in carbon disulfide after subtracting rtfo spectrum

Quantitative Issues In Asphalt Infrared Spectra Interpretation
Solvent Defined SeparationsInfrared Spectra Interpretation

Quantitative Issues In Asphalt Infrared Spectra Interpretation
Functional Group AnalysisInfrared Spectra Interpretation
• This is an example of a differential Spectrum for determining Carboxylic acid after silylationdetermining Carboxylic acid after silylation

Quantitative Issues In Asphalt Infrared Spectra Interpretation
Functional Group AnalysisInfrared Spectra Interpretation
• Functional group analysis is the best available method for detailed separations of overlapping functional groupsdetailed separations of overlapping functional groups
• Requires a skilled analyst, and considerable time and effort
• Limited to the groups addressed in derivatization scheme (phenols, pyrroles, ketones, carboxylic acids, 2‐quinolones, anhydrides, sulfoxides)
• Other methods to address addition functional groups could• Other methods to address addition functional groups could be designed
Quantitative Issues In Asphalt Infrared Spectra Interpretation
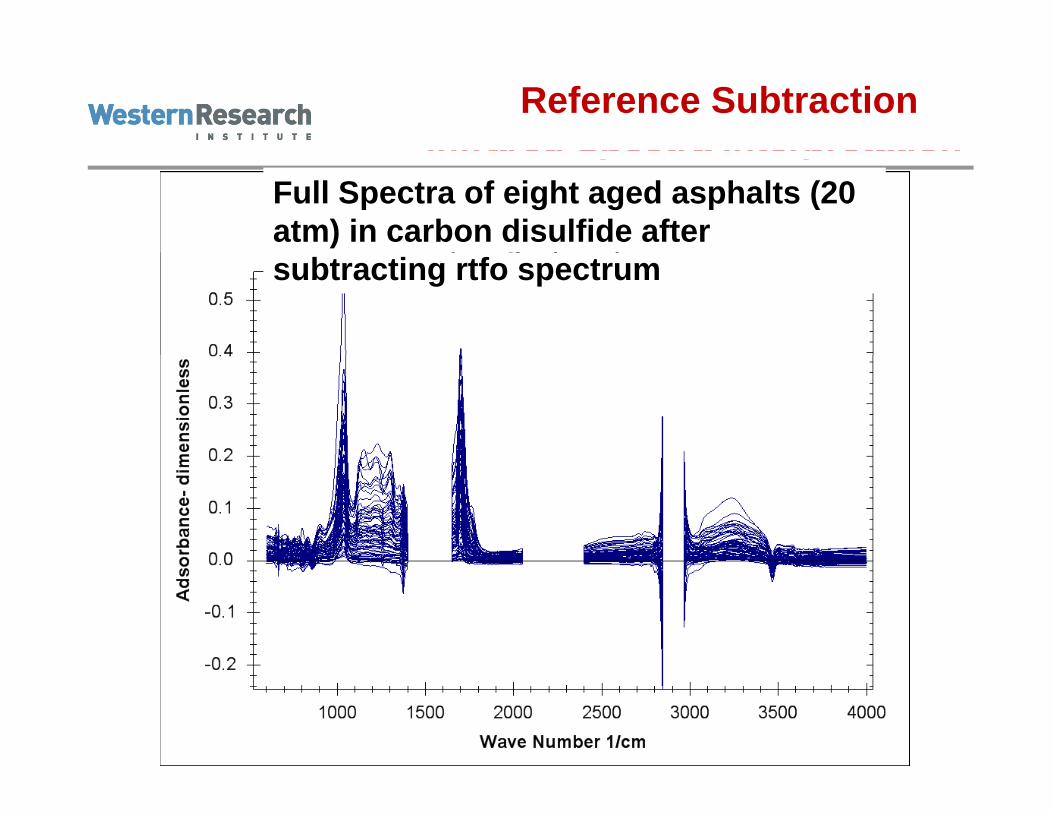
Peak Series AnalysisInfrared Spectra Interpretation
( ) ( )n
S P1
( ) ( )ii
S P
1i
SpectraAbs and frequency
columns in aPeak Shape FunctionLocation Parameter
2
2( )i
columns in a spreadsheetWidth Parameter
22( )P Ae Amplitude or Height

Quantitative Issues In Asphalt Infrared Spectra Interpretation
Peak Series AnalysisInfrared Spectra Interpretation
• Many investigators have attempted this approach
• Typically a sum of squares error function employed or• Typically, a sum of squares error function employed or matrix methods
• Typically, a single spectrum is examined
• Plagued by lack uniqueness issues
Quantitative Issues In Asphalt Infrared Spectra Interpretation
Peak Series AnalysisInfrared Spectra Interpretation
Mitigation of Uniqueness Issues
• A regression problem over a series of spectra (aging series)• A regression problem over a series of spectra (aging series)
• The error function includes derivatives to indicate hidden peaks

Quantitative Issues In Asphalt Infrared Spectra Interpretation
Peak Series AnalysisInfrared Spectra Interpretation
• Set of σ and ω0 the same for all asphalts?
2( )i 22( ) i
iP Ae
( )n
j i iS A 2
1
( )
( )
j i
j i ii
22 ii e

Quantitative Issues In Asphalt Infrared Spectra Interpretation
Peak Series AnalysisInfrared Spectra Interpretation

Quantitative Issues In Asphalt Infrared Spectra Interpretation
Peak Series AnalysisInfrared Spectra Interpretation

Quantitative Issues In Asphalt Infrared Spectra Interpretation
Peak Series Analysis –Preliminary resultsInfrared Spectra InterpretationPreliminary results

Quantitative Issues In Asphalt Infrared Spectra Interpretation
Peak Series Analysis-Regression resultsInfrared Spectra InterpretationRegression results
overall 0.9998
AAM 0.9998 AAM' 0.9850 AAM'' 0.9249
AAD 0.9998 AAD' 0.9856 AAD'' 0.8988
AAC 0 9999 AAC' 0 9889 AAC'' 0 9352AAC 0.9999 AAC 0.9889 AAC 0.9352
AAB 0.9998 AAB' 0.9865 AAB'' 0.9241

Quantitative Issues In Asphalt Infrared Spectra Interpretation
Peak Series Analysis-First Derivative FitInfrared Spectra InterpretationDerivative Fit

Quantitative Issues In Asphalt Infrared Spectra Interpretation
Peak Series Analysis-2nd-Derivative FitInfrared Spectra InterpretationDerivative Fit

Quantitative Issues In Asphalt Infrared Spectra Interpretation
Peak Series AnalysisInfrared Spectra Interpretation
• This method shows promise as a research tool, both for asphalt and other complex systemsasphalt and other complex systems
• Use at the spec test level unlikely, except possibly over narrow regions.
• The uniqueness concerns still remain and critical areas of the spectra would need to be verified with model compounds and/or chemical derivatization methods ifcompounds and/or chemical derivatization methods, if possible.

Quantitative Issues In Asphalt Infrared Spectra Interpretation
Multivariable Linear RegressionInfrared Spectra InterpretationRegression
• Very easy to use, and fast
• Produces much the same information as Peak Series• Produces much the same information as Peak Series
• WRI is producing a software product specifically designed for spectral applications

Quantitative Issues In Asphalt Infrared Spectra Interpretation
Multivariable Linear RegressionInfrared Spectra InterpretationRegression
• Very easy to use, and fast
• Produces much the same information as Peak Series• Produces much the same information as Peak Series

Quantitative Issues In Asphalt Infrared Spectra Interpretation
Multivariable Linear Regression-SimpleInfrared Spectra InterpretationRegression Simple
AJDRSQR 0.9110regression dataY V i blY= Variable x Coefficient group no. F GOODCode by Ronx(0) CONST 0.0100( )x438 1.3780 1037.0000 40.3260 YESx1101 3.1990 1700.0000 273.0650 YES

Quantitative Issues In Asphalt Infrared Spectra Interpretation
Multivariable Linear Regression-CorrectorsInfrared Spectra InterpretationRegression Correctors
• Adding peak overlap correctors results in significant improvement of fit

Quantitative Issues In Asphalt Infrared Spectra Interpretation
Multivariable Linear Regression-Correctors
AJDRSQR 0.9690Infrared Spectra InterpretationRegression Correctorsregression dataY= Variable x Coefficient group no. F GOODCode by Ronx(0) CONST 0.0440x426 ‐17.4000 1025.0000 1.7040 NOx431 69.7400 1030.0000 3.8790 YES436 178 4000 1035 0000 1 7450 NO
• Adding peak overlap correctors –How do we do that?
x436 ‐178.4000 1035.0000 1.7450 NOx438 184.0000 1037.0000 0.8670 NOx441 ‐69.8200 1040.0000 0.3840 NOx446 35.8500 1045.0000 1.0630 NOx451 ‐28.0600 1050.0000 6.9650 YESx1086 ‐12.5400 1685.0000 2.1680 YESx1091 32.8900 1690.0000 5.7980 YESx1096 ‐20.4500 1695.0000 3.7540 YESx1101 ‐4.5330 1700.0000 0.2390 NOx1106 19.0700 1705.0000 1.5210 NOx1111 ‐17 3700 1710 0000 0 9040 NOx1111 17.3700 1710.0000 0.9040 NOx1116 9.5240 1715.0000 0.9410 NO

Quantitative Issues In Asphalt Infrared Spectra Interpretation
Deconvolution not helpfulInfrared Spectra Interpretation
( ( )* ( )) ( ) ( )f t t f t d
( ( )* ( )) ( ) ( )f t g t f g t d
• Convolution and De‐convolution

Quantitative Issues In Asphalt Infrared Spectra InterpretationInfrared Spectra Interpretation
SUMMARY
• Quantitative molar values in asphalt spectra will have fairly high uncertaintyhigh uncertainty
• A number of methods exist to increase the likelihood that the absorbance measurement describes the target gfunctional group
• Quite good relationships can be obtained using absorbance without computing molaritywithout computing molarity.
• WRI will employing many of the described methods in our current aging studies. g g