Simulation Analyses of Performance-Based Fees · Simulation Analyses of Performance-Based Fees ......
35
Simulation Analyses of Performance-Based Fees www.CitigroupAM.com Citigroup Asset Management’s investment services are provided by Salomon Brothers Asset Management Inc, Smith Barney Asset Management (a division of Salomon Smith Barney Inc.), Citibank Global Asset Management (a unit of Citibank, N.A.) and affiliated advisory entities. This is confidential and proprietary information and may not be used other than by the intended user. This material was prepared by Citigroup Asset Management exclusively for the Greenfield Conference. It is for educational purposes only and does not constitute, and should not be construed as, investment advice or recommendations with respect to any of the information presented. It may not be reproduced or distributed in any manner. Model tests and results, and scenario forecasting are based upon mainly publicly available information using Citigroup Asset Management proprietary methodology. The characteristics shown are for a hypothetical portfolio and may not represent characteristics of any specific portfolio. The views expressed are of the individual specified and may not be representative of the opinions and views of the other portfolio managers or of the firm as a whole. Results are based on assumptions made and fed into the models based on the opinions of and by Citigroup Asset Management. Forecasts and model results are inherently limited and should not be relied upon as an indicator of future performance. Martin Lee Director, Manager of Fixed Income Quantitative Research Quantitative Fixed Income Research Group
Transcript of Simulation Analyses of Performance-Based Fees · Simulation Analyses of Performance-Based Fees ......

Simulation Analyses ofPerformance-Based Fees
www.CitigroupAM.com
Citigroup Asset Management’s investment services are provided by Salomon Brothers Asset Management Inc, Smith Barney Asset Management(a division of Salomon Smith Barney Inc.), Citibank Global Asset Management (a unit of Citibank, N.A.) and affiliated advisory entities.This is confidential and proprietary information and may not be used other than by the intended user.
This material was prepared by Citigroup Asset Management exclusively for the Greenfield Conference. It is for educational purposes only and does not constitute, and should not be construed as, investment advice or recommendations with respect to any of the information presented. It may not be reproduced or distributed in any manner.Model tests and results, and scenario forecasting are based upon mainly publicly available information using Citigroup Asset Management proprietary methodology. The characteristics shown are for a hypothetical portfolio and may not represent characteristics of any specific portfolio. The views expressed are of the individual specified and may not be representative of the opinions and views of the other portfol io managers or of the firm as a whole. Results are based on assumptions made and fed into the models based on the opinions of and by Citigroup Asset Management. Forecasts and model results are inherently limited and should not be relied upon as an indicator of future performance.
Martin LeeDirector, Manager of Fixed Income Quantitative ResearchQuantitative Fixed Income Research Group

2 This is confidential and proprietary information and may not be used other than by the intended user.
OverviewPerformance-Based Fees (PBFs)
• Content of the presentation
− Simulation-based analyses of performance-based fees (PBFs)

3 This is confidential and proprietary information and may not be used other than by the intended user.
Analyze PBFs As an Option on Ex-Post Portfolio Performance
• Use option pricing techniques to “price” performance-based fees
• Evaluate the sensitivity of performance fees to underlying assumptions
• Study the issues of manager gaming, high water marks and revenue stability

4 This is confidential and proprietary information and may not be used other than by the intended user.
IntroductionPerformance-Based Fees
• Conceptually very simple
− Pay active managers based on realized performance
− Performance-based fees generally consist of a modest base fee plus a percentage of realized performance above a pre-specified threshold target
• In theory, PBFs should be commonplace
− Managers can signal to clients that they are confident of producing excess returns in order to win mandates
− Clients would only pay above the base fee when performance threshold targets are met
− In aggregate, to the extent that alpha is a zero-sum game, clients should expect to pay less fees
• In reality, PBFs are uncommon
− We estimate that only 5-15% of institutional clients use PBFs
− PBFs has gained more notice with the increased popularity of hedge funds –where PBFs are the standard

5 This is confidential and proprietary information and may not be used other than by the intended user.
Performance-Based Fees
• Client concerns about PBFs
− Fear that PBFs incentivize inappropriate risk behavior (manager gaming)
• When performance is good, manager reduces risk to lock in profit
• When performance is poor, manager increases risk in an attempt of“catch up”
− Aversion to paying above normal fees when performance is good
− A belief that asymmetric information about true alpha and risk profile favors the manager during fee negotiations
− Technical difficulties such as added complexity of fee calculations, etc.
• Manager concerns with PBFs
− Increased volatility in revenues associated with PBFs
− Uncertainty about the sustainability of the excess return going forward
• Simulation-based analysis can be used to shed light on these concerns
Introduction (continued)

6 This is confidential and proprietary information and may not be used other than by the intended user.
The PBF StructureThe Basic PBF Formula
• The fee formula is simple
base fee = minimum fee level
formula = performance participation rate (PPR) X
(account return – benchmark return – threshold)
performance fee = max{formula, 0}
total fee = performance fee + base feeTotal Fee
(bps)
0
10
20
30
40
50
60
70
0 50 100 150 200 250 300
Excess Return (bps)
Base Fee 10 bps)
Performance Fee(30 bps)

7 This is confidential and proprietary information and may not be used other than by the intended user.
The PBF StructureThe PBF Formula Can Be Analyzed As an Option
Total Fee(bps)
0
10
20
30
40
50
60
70
0 50 100 150 200 250 300
Expected Excess Return (bps)
Base Fee (10 bps)
Performance Fee (30 bps)("intrinsic value")
Option Premium (13.5 bps)
ex-post PBF line
expected total fee line
• The above graph was generated by “pricing” the performance-based formula at different levels of expected excess return− 10,000 simulation paths (monthly returns for 10-years) generated at each
expected excess return− Total fee is calculated for each simulation path− The expected total fee line represent the average of the total fees for the
10,000 samples

8 This is confidential and proprietary information and may not be used other than by the intended user.
The PBF StructureThe PBF Formula Can be “Priced” or Valued as an Option
Performance Fee Pricing
0
50
100
150
200
250
-1000 -500 0 500 1000 1500
Excess Return (bps)
Dis
trib
utio
n of
Ex
-
post
Exc
ess
Ret
urn
0.000%
0.020%
0.040%
0.060%
0.080%
0.100%
0.120%
0.140%
Pro
babi
lity
Dis
trib
utio
n
PBF Option Probability Distribution
Peformance Fee Pricing
0.00
0.01
0.02
0.03
0.04
0.05
0.06
0.07
0.08
-1000 -500 0 500 1000 1500
Excess Return (bps)
Pro
babi
lity
Wei
ghte
d P
erfo
rman
ce F
ees
sum of this graph = PBF Value = 53.5
• Expected excess return = 1.6%
• Tracking error = 3.2%
• 10 bps base fee = threshold return
• 20% performance participation rate
9 This is confidential and proprietary information and may not be used other than by the intended user.
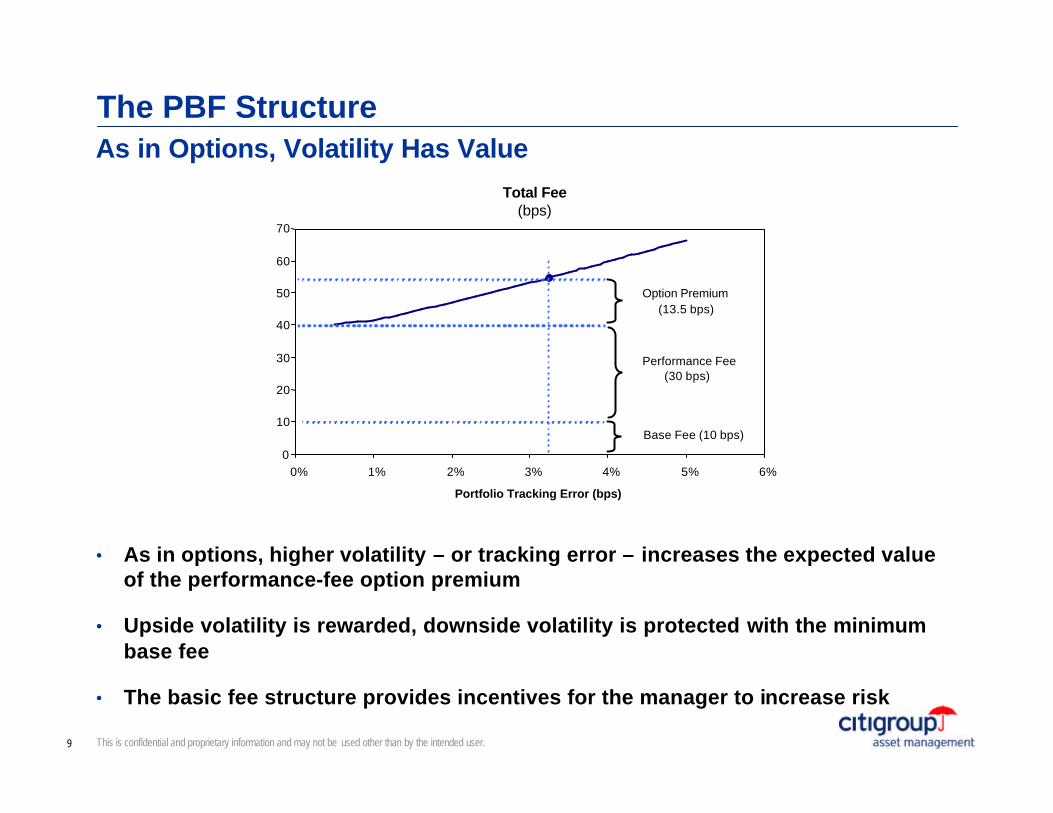
The PBF StructureAs in Options, Volatility Has Value
Total Fee(bps)
0
10
20
30
40
50
60
70
0% 1% 2% 3% 4% 5% 6%
Portfolio Tracking Error (bps)
Base Fee (10 bps)
Performance Fee(30 bps)
Option Premium(13.5 bps)
• As in options, higher volatility – or tracking error – increases the expected value of the performance-fee option premium
• Upside volatility is rewarded, downside volatility is protected with the minimum base fee
• The basic fee structure provides incentives for the manager to increase risk

10 This is confidential and proprietary information and may not be used other than by the intended user.
The PBF StructureImposing a Maximum Fee Cap
Total Fee(bps)
0
10
20
30
40
50
60
70
80
0 50 100 150 200 250 300 350 400 450
Expected Alpha (bps)
Base Fee (10bps)
Performace Fee (40bps)
ex-post PBF line
expected total fee line
target alpha of 1.6% and total fee of 40bps
maximum fee cap: 70bps
long option
short option
• Maximum fee cap is equivalent to portfolio manager selling a call option to the client – with strike at maximum fee level
• Option premium is now symmetric around the target fee level, and the premium is zero at the target alpha
− No longer has a free option effect
• Less incentive for the manager to increase risk

11 This is confidential and proprietary information and may not be used other than by the intended user.
The PBF StructureImpact of Termination Option
Total Fee(bps)
0
10
20
30
40
50
60
70
0 50 100 150 200 250 300 350 400 450
Expected Alpha (bps)
Base Fee
Performance Fee
expected total fee w/o termination
expected total fee w/ termination
target alpha of 1.6% and total fee of 40bps
• The decline in expected total fees is due to the fact that the average is measured over a 10-year horizon
• The impact is similar to the effect of “down-and-out” knock-out options
• At higher levels of expected alpha, the termination condition provides a strong disincentive against managers increasing portfolio risk

12 This is confidential and proprietary information and may not be used other than by the intended user.
The PBF StructureAdding Penalties on Tracking-Error Deviations
• Add explicit cost function to the PBF formula to penalize deviations intracking error
bonus fee = (PPR) x (account return – benchmark return – threshold)
– risk penalty rate (RPR) x abs(average risk – target risk)

13 This is confidential and proprietary information and may not be used other than by the intended user.
Valuing PBF FormulasA Specific (Hypothetical) PBF Example
20 basis points per 1% net excess return(after threshold equal to base fee)
0. Autocorrelation is the correlation returns between two subsequent periods. It is a measure of “trends” in the excess portfolio return
Item Base Case Parameters
Performance Objective Excess return = 1.6% per annum, tracking error 3.2% per annum
Base Fee 10 basis points
Bonus Formula
Fee Maximum 80 bps
Risk Penalty Rate None
Performance Period Simple 1-year excess return
Discount Rate 7%. For calculating annualized expected PV of fees.
Benchmark Performance Return: 8% per annum, volatility: 12% per annum
Excess Return Correlationto Benchmark Return
0
Excess ReturnAutocorrelation
Number of Simulations 10,000
Simulation Period 10 years
14 This is confidential and proprietary information and may not be used other than by the intended user.
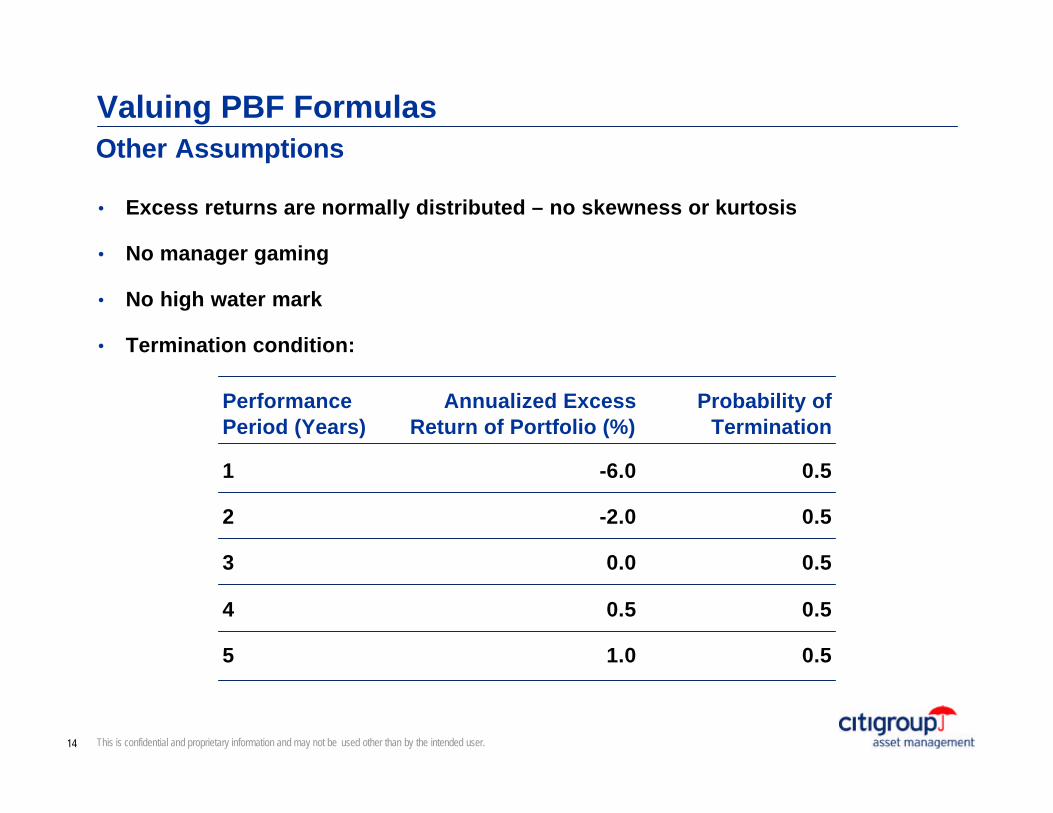
Valuing PBF FormulasOther Assumptions
• Excess returns are normally distributed – no skewness or kurtosis
• No manager gaming
• No high water mark
• Termination condition:
Performance Period (Years)
Annualized Excess Return of Portfolio (%)
Probability of Termination
1 -6.0 0.5
2 -2.0 0.5
3 0.0 0.5
4 0.5 0.5
5 1.0 0.5
15 This is confidential and proprietary information and may not be used other than by the intended user.
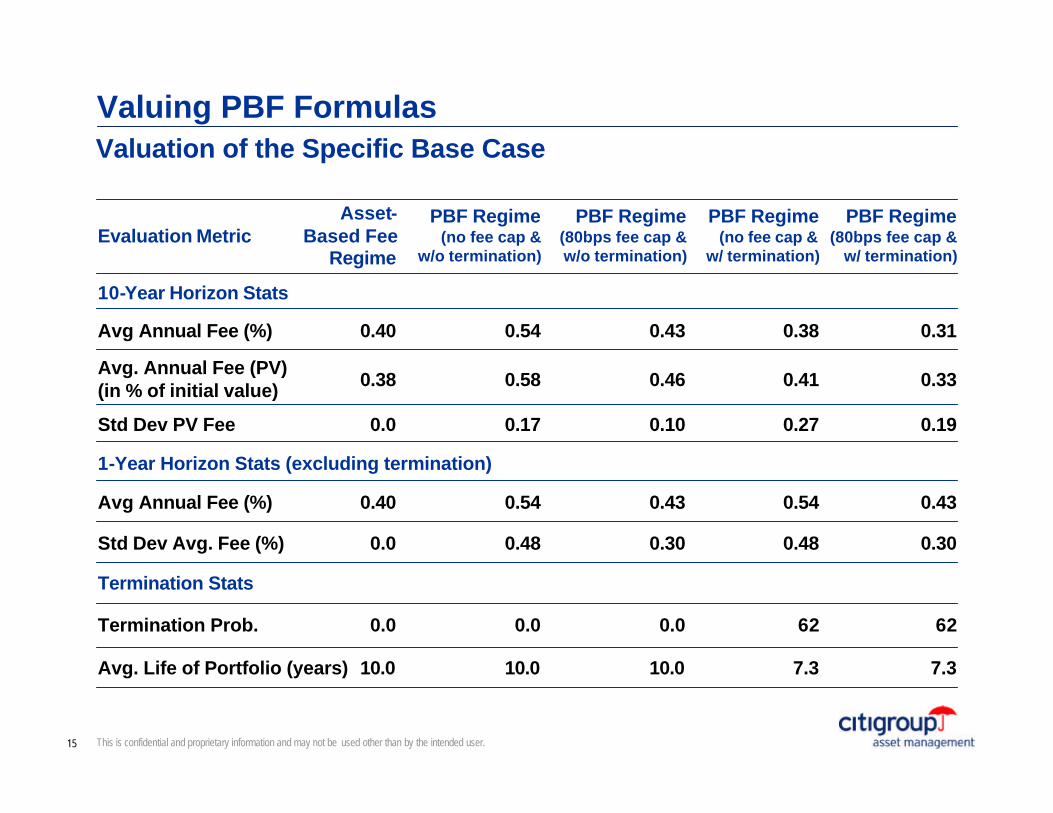
Valuing PBF FormulasValuation of the Specific Base Case
Evaluation MetricAsset-
Based Fee Regime
PBF Regime(no fee cap &
w/o termination)
PBF Regime(80bps fee cap & w/o termination)
PBF Regime(no fee cap &
w/ termination)
PBF Regime(80bps fee cap &
w/ termination)
10-Year Horizon Stats
Avg Annual Fee (%) 0.40 0.54 0.43 0.38 0.31
Avg. Annual Fee (PV)(in % of initial value) 0.38 0.58 0.46 0.41 0.33
Std Dev PV Fee 0.0 0.17 0.10 0.27 0.19
1-Year Horizon Stats (excluding termination)
Avg Annual Fee (%) 0.40 0.54 0.43 0.54 0.43
Std Dev Avg. Fee (%) 0.0 0.48 0.30 0.48 0.30
Termination Stats
Termination Prob. 0.0 0.0 0.0 62 62
Avg. Life of Portfolio (years) 10.0 10.0 10.0 7.3 7.3

16 This is confidential and proprietary information and may not be used other than by the intended user.
Valuing PBF FormulasDistribution of Excess Returns and Total Fees
Distribution of Fees(Avg. Annual NPV)
0.0%
0.5%
1.0%
1.5%
2.0%
2.5%
3.0%
3.5%
4.0%
4.5%
5.0%
0 10 20 30 40 50 60 70 80 90 100
Ann Total Fee (NPV) in bps
Rel
ativ
e Fr
eque
ncy
Distribution of Excess Return(Base Case, Annual Average over 10-years)
0%
1%
2%
3%
4%
5%
6%
7%
8%
9%
-4% -3% -2% -1% 0% 1% 2% 3% 4% 5% 6%
Excess Return
Rel
ativ
e Fr
eque
ncy

17 This is confidential and proprietary information and may not be used other than by the intended user.
PBF Formula SensitivitiesTotal Fee Sensitivity to Excess Return and Tracking Error
Fee Sensitivity to Expected Excess Return and Tracking Error
0.0%
0.1%
0.2%
0.3%
0.4%
0.5%
0.6%
0.7%
0.8%
0.5% 1.5% 2.5% 3.20% 4.0% 5.0% 6.0%
Tracking Error
Fee
(A
nn
. P
V) 0.2% EER
1.0% EER
1.6%EER
2.2% EER
3.0% EER
Base Case
Fee Sensitivity to Expected Excess Return and Tracking Error
0.0%
0.1%
0.2%
0.3%
0.4%
0.5%
0.6%
0.7%
0.8%
0.0% 0.4% 0.8% 1.2% 1.6% 2.0% 2.4% 2.8% 3.2%
Expected Excess Return (Ann. PV)
Fee
(A
nn
. P
V)
1.0% T.E.
3.2% T.E.
5.0% T.E.
Base Case

18 This is confidential and proprietary information and may not be used other than by the intended user.
PBF Formula SensitivitiesTotal Fee Sensitivity to Excess Return and Tracking Error

19 This is confidential and proprietary information and may not be used other than by the intended user.
Fee Sensitivity to IR and Tracking Error
0.0%
0.1%
0.2%
0.3%
0.4%
0.5%
0.6%
0.5% 1.5% 2.5% 3.2% 4.0% 5.0% 6.0%
Tracking Error
Fee
(Ann
. PV
)
0.2 IR
0.5 IR
0.8 IR
Base Case
PBF Formula SensitivitiesTotal Fee Sensitivity to Excess Information Ratio

20 This is confidential and proprietary information and may not be used other than by the intended user.
Expected Portfolio Life Sensitivity to Expected Excess Return and Tracking Error
0
2
4
6
8
10
12
0.0% 0.4% 0.8% 1.2% 1.6% 2.0% 2.4% 2.8% 3.2%
Expected Excess Return (Ann. PV)
Avg
. Po
rtfo
lio L
ife
(yea
rs)
1.0% T.E.
3.2% T.E.
5.0% T.E.
Base Case
PBF Formula SensitivitiesExpected Life of the Portfolio vs. Excess Return and Tracking Error

21 This is confidential and proprietary information and may not be used other than by the intended user.
Fee Sensitivity to Expected Excess Return and Maximum Fee
0.0%
0.1%
0.2%
0.3%
0.4%
0.5%
0.6%
0.7%
0.8%
0.3% 0.5% 0.7% 0.9% 1.1% 1.3% 1.5%
Maximum Fee
Fee
(An
n. P
V)
0.2% EER
1.0% EER
1.6% EER
2.2% EER
3.0% EER
Base Case
PBF Formula SensitivitiesTotal Fee Sensitivity to Maximum Fee Cap

22 This is confidential and proprietary information and may not be used other than by the intended user.
PBF Formula SensitivitiesTotal Fee Sensitivity to Market Assumptions
Fee Sensitivity to Expected Excess Return and Benchmark Return
0.0%
0.1%
0.2%
0.3%
0.4%
0.5%
0.6%
0.7%
0.8%
0.9%
0.0% 2.0% 4.0% 6.0% 8.0% 10.0% 12.0% 14.0%
Benchmark Return
Fee
(A
nn
. P
V) 0.2% EER
1.0% EER
1.6% EER
2.2% EER
3.0% EER
Base Case
Sensitivity: Std Dev of Ann Fee (PV) vs. Market Volatility
0.00%
0.05%
0.10%
0.15%
0.20%
0.25%
0.30%
0.35%
8% 10% 12% 14% 16% 18% 20%
Market Volatility
Std
Dev
of
An
n F
ee (
PV
)
0.2% EER
1.0% EER
1.6% EER
2.2% EER
3.0% EER
Base Case

23 This is confidential and proprietary information and may not be used other than by the intended user.
PBF Formula SensitivitiesImpact of Style Biases: Excess Return Correlation With the Market
Fee Sensitivity to Expected Excess Return and Correlation to Benchmark
0.0%
0.1%
0.2%
0.3%
0.4%
0.5%
0.6%
-0.5 -0.4 -0.3 -0.2 -0.1 0.0 0.1 0.2 0.3 0.4 0.5
Alpha Correlation to Benchmark
Fee
(An
n. P
V)
0.2% EER
1.0% EER
1.6% EER
2.2% EER
3.0% EER
Base Case

24 This is confidential and proprietary information and may not be used other than by the intended user.
PBF Formula and Manager GamingImpact of Manager Gaming the PBF
• Assume that a manager games the PBF formula by
− Reducing risk by 50% after a positive performance
− Increasing risk by 50% after a negative performance
YTD Positive Performance(manager reduces risk by 50%)
YTD Negative Performance(manager increases risk by 50%)
Q1 4.0% -4.0%
Q2 4.0% -4.0%
Q3 3.0% -2.0%
Q4 3.0% -2.0%
25 This is confidential and proprietary information and may not be used other than by the intended user.
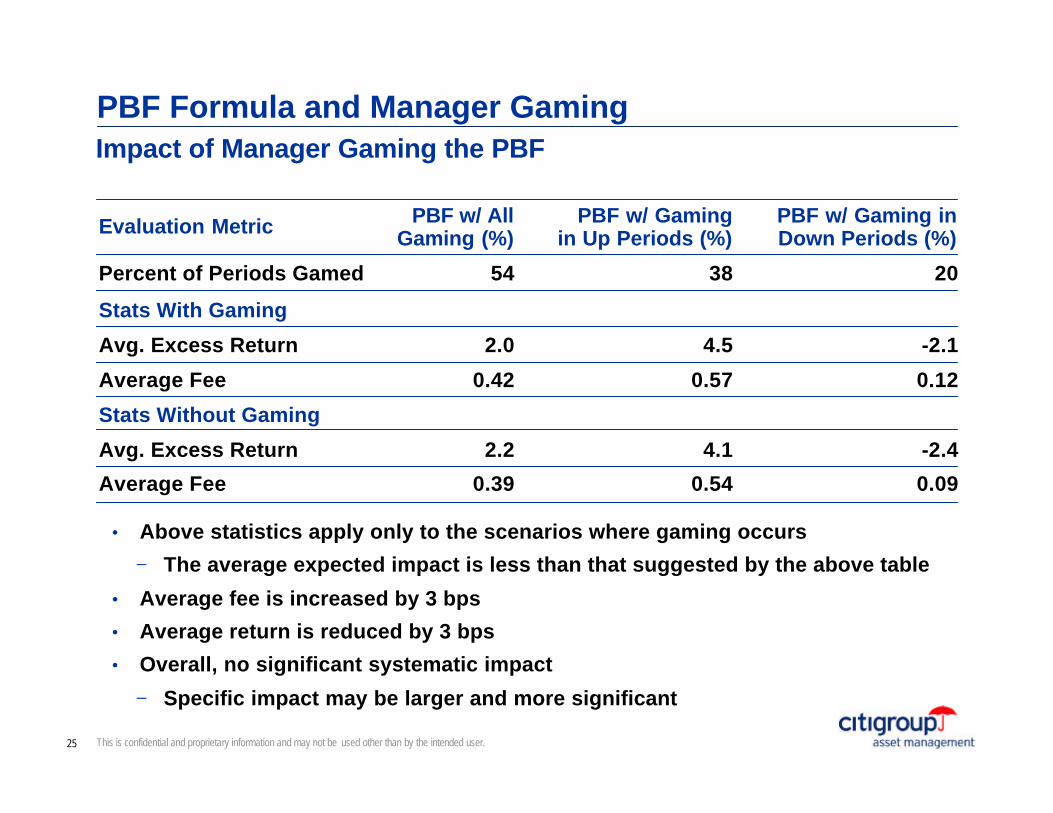
PBF Formula and Manager GamingImpact of Manager Gaming the PBF
• Above statistics apply only to the scenarios where gaming occurs
− The average expected impact is less than that suggested by the above table
• Average fee is increased by 3 bps
• Average return is reduced by 3 bps
• Overall, no significant systematic impact
− Specific impact may be larger and more significant
Evaluation Metric PBF w/ All Gaming (%)
PBF w/ Gaming in Up Periods (%)
PBF w/ Gaming in Down Periods (%)
Percent of Periods Gamed 54 38 20
Stats With Gaming
Avg. Excess Return 2.0 4.5 -2.1
Average Fee 0.42 0.57 0.12
Stats Without Gaming
Avg. Excess Return 2.2 4.1 -2.4
Average Fee 0.39 0.54 0.09

26 This is confidential and proprietary information and may not be used other than by the intended user.
PBF Formula and Revenue StabilityPBF and Revenue Stability – Yearly Total Fee Distribution
Distribution of Total Performance Based Fees (Base Case, with 5 independent products)
0%
5%
10%
15%
20%
25%
30%
35%
0 10 20 30 40 50 60 70 80 90 100
Ann Total Fee (NPV) in bps
Rel
ativ
e F
req
uen
cy

27 This is confidential and proprietary information and may not be used other than by the intended user.
Expected Alpha (%)
0.5 1.0 1.5 2.0 2.5 3.0 3.5 4.0
1.0 43.6 25.5 12.4 5.0 1.6 0.4 0.1 0.0
2.0 46.4 36.8 27.9 20.4 14.3 9.5 6.0 3.6
3.0 47.5 40.8 34.6 28.9 23.6 19.1 15.0 11.5
4.0 47.6 42.6 37.6 33.3 29.0 25.0 21.3 17.8
5.0 46.7 43.1 39.0 35.3 31.8 28.6 25.2 22.1
Tra
ckin
gE
rror
(%
)
• The above statistics assume the base case and assumes that 15 bps is the break-even point for managing the hypothetical portfolio
• Conclusions
− Revenue stability is a significant issue
− Risk of loss on managing a portfolio is high if base fee does not cover allmarginal costs
• Can this risk be mitigated?
PBF Formula and Revenue StabilityPBF and Revenue Stability – Risk of Loss on Hypothetical Portfolio

28 This is confidential and proprietary information and may not be used other than by the intended user.
PBF Formula and Revenue StabilityPBF and Revenue Stability – Benefit of Diversification
Distribution of Total Performance Based Fees (Base Case, with 5 independent products)
0%
1%
2%
3%
4%
5%
6%
7%
8%
0 10 20 30 40 50 60 70 80 90 100
Ann Total Fee (NPV) in bps
Rel
ativ
e F
req
uen
cy
29 This is confidential and proprietary information and may not be used other than by the intended user.
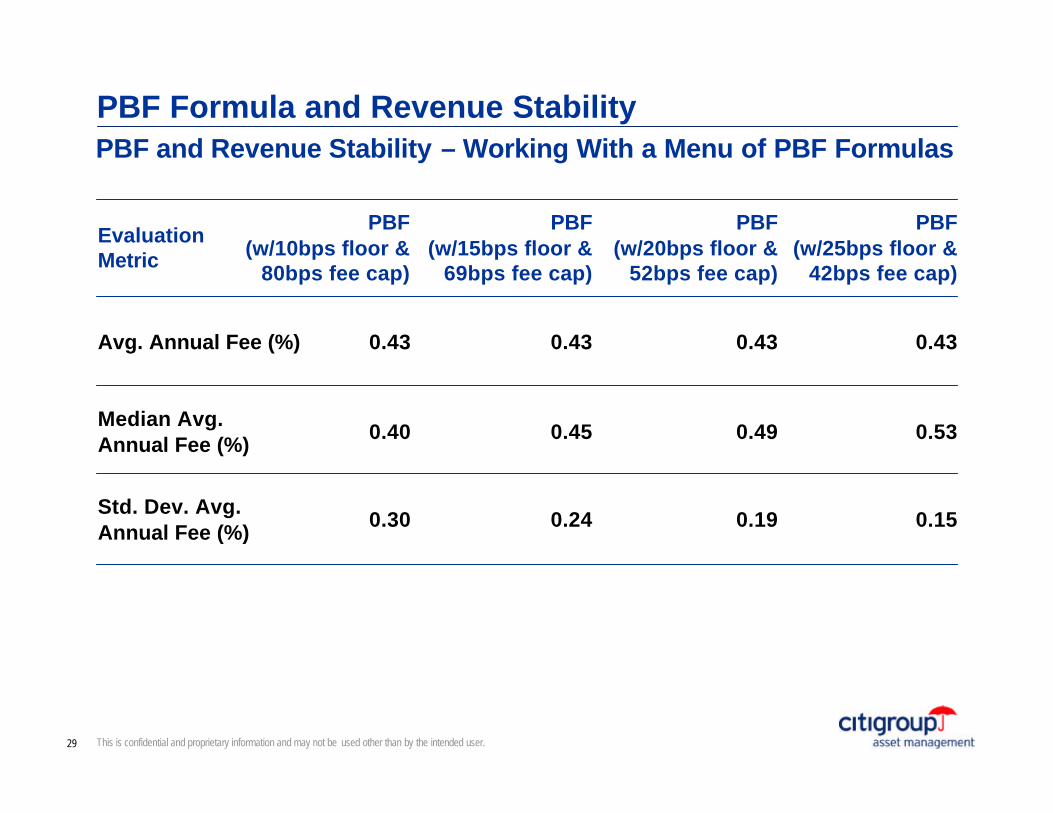
PBF Formula and Revenue StabilityPBF and Revenue Stability – Working With a Menu of PBF Formulas
Evaluation Metric
PBF(w/10bps floor &
80bps fee cap)
PBF(w/15bps floor &
69bps fee cap)
PBF(w/20bps floor &
52bps fee cap)
PBF(w/25bps floor &
42bps fee cap)
Avg. Annual Fee (%) 0.43 0.43 0.43 0.43
Median Avg.Annual Fee (%)
0.40 0.45 0.49 0.53
Std. Dev. Avg.Annual Fee (%)
0.30 0.24 0.19 0.15

30 This is confidential and proprietary information and may not be used other than by the intended user.
PBF Formula and High Water MarkImpact of High Water Mark Condition on PBF Formula
Evaluation MetricPBF
(w/o termination & no fee cap)
PBF(w/o termination & 80bps fee cap)
PBF(w/ termination
& no fee cap)
PBF(w/ termination
& 80bps fee cap
Without High Water Mark
Avg. Annual Fee (PV)(in bps of initial value) 0.58 0.46 0.41 0.33
Yearly Avg. Fee (%)(non-terminated periods)
0.54 0.43 0.54 0.43
Std Dev Yearly Fee (%) 0.48 0.29 0.48 0.29
% Prob. of Base Fees Only 32 32 32 32
With High Water Mark
Ann Avg PV of Fees(in bps of initial value)
0.47 0.39 0.36 0.30
Year Avg. Fee (%)(non-terminated periods) 0.44 0.36 0.48 0.39
Std Dev Yearly Fee (%) 0.47 0.29 0.47 0.29
% Prob. of Base Fees Only 38 38 38 38

31 This is confidential and proprietary information and may not be used other than by the intended user.
PBF Formula and High Water MarkImpact of High Water Mark Condition on PBF Formula – Variation with IR and Tracking Error
Impact of High Water mark vs. IR and TE
0.00%
0.02%
0.04%
0.06%
0.08%
0.10%
0.12%
0.14%
0.0% 1.0% 2.0% 3.0% 4.0% 5.0% 6.0% 7.0%
Tracking Error (%)
Exp
ecte
d F
ee R
edu
ctio
n
IR = 0.2
IR = 0.5
IR = 0.8

32 This is confidential and proprietary information and may not be used other than by the intended user.
Average Shortfall Impacts HWM Fee Reduction
0.00
0.01
0.02
0.03
0.04
0.05
0.06
0.07
-20% -15% -10% -5% 0% 5% 10% 15% 20% 25% 30%
base case: IR = 1, TE = 3.2%IR = 0.5, TE = 3.2%(lower IR increase
average shortfall because of higher
probabilty of shortfall)
IR = 1, TE = 6.4%(higher shortfall magnitude increases average shortfall)
PBF Formula and High Water MarkUnderstanding the Variation of High Water Mark Cost with Changesin IR and Tracking Error

33 This is confidential and proprietary information and may not be used other than by the intended user.
PBF Formula and High Water MarkSome Conclusions
• Imposing high water mark has significant fee revenue implications
− Revenue decrease by over 15% (-7/46 bps) versus the hypothetical base case
− Probability of being paid only the base fee increases from 32% to 38%
− The negative impact of high water mark decreases with increasing IR
− The negative impact of high water mark increases with higher tracking error
− Both magnitude and frequency of shortfall versus the threshold return are positively related to the magnitude of high water mark impact on expected fees
• Aside from higher consistency of portfolio performance, very little can be done to mitigate the negative impact of high water mark conditions
− In fee negotiations, it become more important that base fees be negotiated to a level that covers all marginal costs of managing the portfolio
− Portfolio mandates with a high water mark should seek higher performance participation rates (base case = 20%)

34 This is confidential and proprietary information and may not be used other than by the intended user.
PBF Formula and High Water MarkConclusions (continued)• For analysis, it is possible to treat performance-based fees as a call option on
portfolio performance
− It is possible to “price” this option as the average expected revenue from the portfolio mandate
− With the given analytical framework, it becomes possible to study the impact of imposing various fee conditions and to study the sensitivities against various assumed parameters such as expected information ration, tracking error, market return, etc.
• From the client perspective, many of the common client concerns can be addressed through the transparency provided by the above analysis
− Imposing maximum fees mitigate the concerns over excessive fees and“free option” effects
− Imposing risk criteria (and possibly risk deviation penalties) should secure against risk deviations
− Even when managers are allowed to game the PBF formula, the net expected impactis small
• From the manager perspective, the main concern relates to revenue stability
− PBFs encumbers a significantly higher revenue volatility
− Diversification of products using PBFs will significantly reduce this volatility
− High water marks have significant negative impact on expected revenues

35 This is confidential and proprietary information and may not be used other than by the intended user.
Biography
Martin Lee Director and Manager of Quantitative Research, Quantitative Fixed Income Research Group
• Leads various research projects with particular emphasis on alpha forecasting models, quantitative credit research, and portfolio construction tools; part of the research group that provides fixed income portfolio managers with the tools and techniques that help maintain a consistent and disciplined investment process
• Private investment fund in Hong Kong, fixed income portfolio manager • Goldman, Sachs & Co. – quantitative strategist with the Fixed Income &
FX Proprietary Trading Group• BS, Electrical Engineering, University of California (Berkeley)• MS, Electrical Engineering and Applied Physics, Caltech • MBA, The Wharton School