RICH detector for CLAS12 CLAS12 Technical Workshop P. Rossi Laboratori Nazionali di Frascati - INFN.
Upload
hoangxuyenCategory
view
223download
0
Simulated CLAS12 Neutron Detection Efficiency in the
Forward Time-of-Flight System
G.P. Gilfoyle1, M.Ungaro2, J. Carbonneau1, M. Moog1, and C. Musalo1
1 University of Richmond, Richmond, VA2 University of Connecticut, Storrs, CT
August 9, 2011
Abstract
We have simulated the production of quasi-elastically (QE) scattered electrons andneutrons in CLAS12 with the physics-based, CLAS12 simulation package gemc. Theelectron events were reconstructed with Socrat. We have studied the properties of thedeposited energy and efficiency of the CLAS12 FTOF system to establish a baselinefor the future measurement of the neutron magnetic form factor in Experiment E12-07-104. We have simulated the extraction of the neutron detection efficiency using QEneutrons and found an efficiency of 16% for panels P1A and P1B combined togetherand a value of 8% for panel P2B. A comparison of the simulated efficiency using onlypanels P1A and P2B (that are being reused from CLAS6) with the measured valuesfrom the E5 run (using the p(e, e′π+)n reaction) shows good agreement.

CLAS-NOTE 2011-Draft - August 9, 2011 2
1 Introduction
In this CLAS-Note we present the results of a study of the efficiency for detecting quasielasticneutrons in the CLAS12 time-of-flight (TOF) system. We are preparing for experiment E12-07-104 entitled ‘Measurement of the Neutron Magnetic Form Factor at High Q2 Using theRatio Method on Deuterium’ where the ratio of quasielastic (QE) e−n to e−p scattering ismeasured and the neutron magnetic form factor Gn
M is extracted [1]. The QE e−n scatteringwill be measured with the CLAS12 forward TOF system (FTOF) and the neutron detectionefficiency (NDE) must be accurately determined to meet the experimental goals of systematicuncertainties of 3% or less. We will also compare the simulated results found here with thosemeasurements of the NDE performed for an earlier CLAS6 measurement of Gn
M during theE5 run. This comparison will be particularly relevant because some of the CLAS12 FTOFscintillators will be the same as the ones used in the E5 measurement. Experiment E12-07-104 was originally approved by PAC32 and reviewed by PAC35 to allocate beam time.Thirty days of running were awarded by PAC35 along with an A− rating.
The format of this paper is the following. (1) The motivation for the experiment willbe presented and (2) along with a description of the ratio method). (3) The results froma physics-based simulation (GEant4 MonteCarlo gemc) of the scintillator response to thepassage of electrons and neutrons will be presented [2]. (4) The inputs and results will beshown from the gemc simulation of elastic e−n scattering and reconstruction with the Root-based code Socrat [2, 3]. (5) Last we will present the post-reconstruction analysis used toextract the neutron detection efficiency in the FTOF.
2 The CLAS12 GnM Experiment (E12-07-104)
In JLab Experiment E12-07-104 we intend to dramatically extend the reach of our under-standing of a fundamental feature of the neutron; its magnetic form factor Gn
M . The elasticelectromagnetic form factors(EEFFs) describe the distribution of charge and magnetizationinside the nucleon at low Q2 and probe the quark structure at higher Q2. This experiment ispart of a broad program at JLab to measure the EEFFs, map the internal landscape of thenucleon, and test non-perturbative Quantum Chromodynamics (QCD) and QCD-inspiredmodels of the nucleon (see NSAC Long-Range Plan [4]). The measurement will cover therange Q2 = 3.5 − 14.0 GeV2 with systematic uncertainties less than 3%. Statistical un-certainties will be about 3% in the highest Q2 bin in this range and significantly less atlower Q2. The anticipated range and statistical uncertainties of the experiment are shownin Figure 1. The reduced magnetic form factor Gn
M/(µnGD) is plotted versus Q2 where µn
is the neutron magnetic moment and GD = 1/(1 + Q2/Λ2)2 is the dipole form factor withΛ2 = 0.71 GeV2. We used the recent parameterization of the world’s data on Gn
M in Ref [13]to predict the reduced form factor. Also shown are selected world’s data for Gn
M includingthe recent CLAS6 results (blue, open circles)[5]. The proposed CLAS12 experiment (black,closed squares) will nearly triple the upper limit of the previous CLAS6 measurement andprovide precise data well past any existing measurement.

CLAS-NOTE 2011-Draft - August 9, 2011 3
3 The Ratio Method
To measure GnM we will use the ratio of quasielastic e− n to quasielastic e− p scattering on
deuterium which has been used by us in CLAS6 [5] and others [9, 17, 18, 19, 20] to measureGn
M (see Figure 1). The ratio method is less vulnerable to systematic uncertainties thanprevious methods and we will have consistency checks between different detector componentsof CLAS12 (the FTOF and the CLAS12 electromagnetic calorimeter (EC)) and an overlapwith our previous CLAS6 measurements. A liquid-hydrogen/liquid-deuterium, dual targetwill be used to make in situ measurements of the neutron and proton detection efficiencies.We take advantage of the large acceptance of CLAS12 and veto events with additionalparticles (beyond e − n and e − p coincidences) to reduce the inelastic background. Weexpect to limit the systematic uncertainties to 3% or less [21]. This experiment can be donewith the base equipment for CLAS12 and was approved by PAC32.
The method is based on the ratio of e − n to e − p scattering
R =dσdΩ
(2H(e, e′n)QE)dσdΩ
(2H(e, e′p)QE)= a(Q2)
σnmott(G
nE
2 + τn
εn
GnM
2)(
1
1+τn
)
dσdΩ
(1H(e, e′)p)(1)
for quasielastic (QE) kinematics. The right-hand side is written in terms of the free nucleonform factors and where τ = Q2/4M2 and ǫ = 1/[1+2(1+τ) tan2(θ/2)]. Deviations from this‘free ratio’ assumption are parameterized by the factor a(Q2) which can be calculated fromdeuteron models and is close to unity at large Q2. The results of other measurements of the
2010-11-10 08:19:52 )2(GeV2Q2 4 6 8 10 12 14
DG nµ/
MnG
0.4
0.5
0.6
0.7
0.8
0.9
1
1.1
1.2
Blue - CLAS6Green - Previous World DataBlack - CLAS12 anticipated
AnticipatedStatistical uncertainties only
Miller
Guidal et al.
Cloet et al.
Figure 1: Selected data [5, 6, 7, 8, 9, 10, 11, 12] and anticipated results for GnM (black, filled
squares) in units of µnGD as a function of Q2. The anticipated CLAS12 results follow a fitto the world data on Gn
M that includes the recent CLAS6 GnM results [13]. The blue, open
circles are the CLAS6 results [5]. The curves are from Miller (blue, dashed,[14]), Guidal etal. (blue, dotted,[15]), and Cloet at al. (red,[16]).

CLAS-NOTE 2011-Draft - August 9, 2011 4
proton cross section and the neutron electric form factor are used to extract GnM . The ratio
R is insensitive to the luminosity, electron acceptance, electron reconstruction efficiency,trigger efficiency, the deuteron wave function used in a(Q2), and radiative corrections [5, 22].
An essential aspect of the neutron measurement in the TOF and EC systems is measur-ing the neutron detection efficiency. In the experiment we will use the p(e, e′π+n) reactionas a source of tagged neutrons. Electrons and π+’s will be detected in CLAS12 and missingmass used to select candidate neutrons (found neutrons). We then predict the position ofthe neutron in CLAS12 and search for it. If a neutron is found we call these reconstructedneutrons. The ratio of reconstructed to found events gives us the detection efficiency. Thiswill be done in CLAS12 with a unique, dual target. Co-linear, liquid hydrogen and deu-terium cells will provide production and calibration events simultaneously and under thesame conditions (in situ). This reduces our vulnerability to variations in detector gains,beam properties, etc. The same method was used in the CLAS6 measurement during the E5run period. The results for the NDE measurement at two different beam energies is shownin Figure 2.
Neutron Momentum (GeV)0 0.5 1 1.5 2 2.5 3 3.5 4
Neu
tron
Effi
cien
cy
0
0.02
0.04
0.06
0.08
0.1
0.12
0.142.6 GeV
4.2 GeV
Figure 2: Neutron detection efficiency measured with the e, e′π+)n reaction for the CLAS6Gn
M measurement.
For this study we do not yet have an appropriate simulation of the p(e, e′π+)n reaction sowe will start with a simulation of elastic scattering from a simulated neutron target as a firststep to understanding the neutron detection efficiency. The method we will use is analogousto the one proposed for E12-07-104 and used in Ref [5]. Scattered electrons are simulated inCLAS12 and the electron information is used to predict the position of the neutron assumingthat elastic scattering has occurred. If the predicted position of the neutron is within theactive area of the FTOF we call this a found neutron. We then search the simulation resultsfor a neutron in region of the found neutron. If a neutron is found within an angular conearound the predicted position of the found neutron, then we have a reconstructed neutron.
CLAS-NOTE 2011-Draft - August 9, 2011 5
The NDE is the ratio of reconstructed to found neutrons.
4 Simulation of FTOF Scintillator Response to
Electrons
The passage of electrons and neutrons through the scintillator material of the FTOF wassimulated with gemc. The gemc code is a physics-based simulation using the Geant4 packagefrom CERN [23]. It is an object-oriented, C++-based code that reads detector informationfrom an external, mysql database. Hits in detector components are built by a factory methodat run time, and the output banks are dynamic. Qt4 is used for a graphical user interface[24].
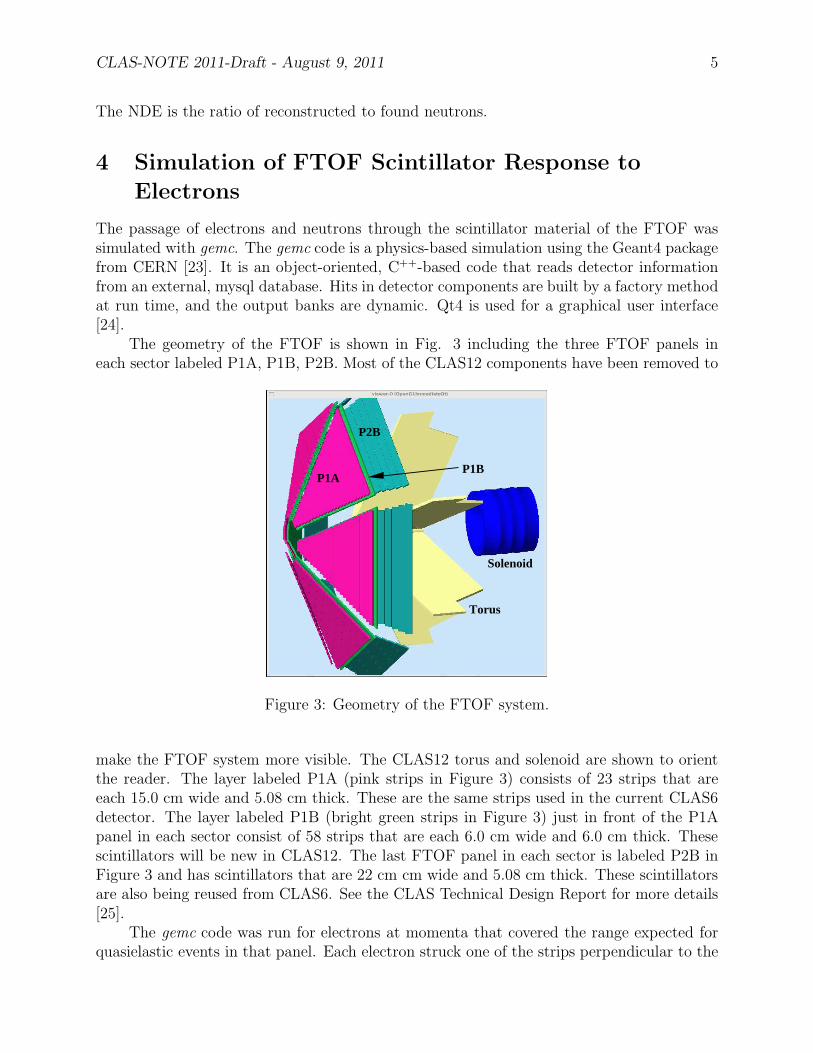
The geometry of the FTOF is shown in Fig. 3 including the three FTOF panels ineach sector labeled P1A, P1B, P2B. Most of the CLAS12 components have been removed to
P1BP1A
P2B
Torus
Solenoid
Figure 3: Geometry of the FTOF system.
make the FTOF system more visible. The CLAS12 torus and solenoid are shown to orientthe reader. The layer labeled P1A (pink strips in Figure 3) consists of 23 strips that areeach 15.0 cm wide and 5.08 cm thick. These are the same strips used in the current CLAS6detector. The layer labeled P1B (bright green strips in Figure 3) just in front of the P1Apanel in each sector consist of 58 strips that are each 6.0 cm wide and 6.0 cm thick. Thesescintillators will be new in CLAS12. The last FTOF panel in each sector is labeled P2B inFigure 3 and has scintillators that are 22 cm cm wide and 5.08 cm thick. These scintillatorsare also being reused from CLAS6. See the CLAS Technical Design Report for more details[25].
The gemc code was run for electrons at momenta that covered the range expected forquasielastic events in that panel. Each electron struck one of the strips perpendicular to the

CLAS-NOTE 2011-Draft - August 9, 2011 6
plane of the panel. All of the other CLAS12 components between the target and the FTOFpanel were removed in the simulation so those components would not alter the properties ofthe electrons striking the panel. The CLAS12 magnetic field was also turned off. The gemccommand is shown below.
gemc -USE_QT=0 -OUTPUT=p1a.gcard -N=500000 -PRINT_EVENT=20000
-HALL_MATERIAL=Vacuum -gcard=$GCARD -USE_PHYSICSL=gemc
-BEAM_P="e-, 9.25*GeV, 25*deg, 0*deg" -SPREAD_P="0.0*GeV, 0*deg, 0*deg"
-LUMI_EVENT="0,0*ns,2*ns" -NO_FIELD=all
The energy deposited for electrons in the P1A scintillator panel is shown in Figures 4-5 forelectron momenta of 9.25 GeV/c and 3.5 GeV/c respectively. The left-hand panel of Fig. 4
(MeV)depE0 5 10 15 20 25 30 35 40 45 50
Cou
nts/
N-M
eV
-510
-410
-310
-210
-110
= 9.25 GeV/c electronse
pTOF panel P1ABlack - all eventsRed - E > 8 MeVBlue - E < 8 MeV
E (MeV)0 1000 2000 3000 4000 5000 6000 7000 8000 9000 10000
(M
eV)
dep
E
0
10
20
30
40
50
60
-510
-410
-310
-210
-1109.25 GeV/c electrons
TOF panel P1A
Figure 4: Energy deposited and particle energy in the FTOF scintillators for electrons ofmomentum pe = 9.25 GeV for FTOF panel P1A. The vertical axis in the left-hand panel isthe number of events from the Monte Carlo, gemc calculation divided by the bin size andthe number of thrown events. The histogram in the right-hand panel is the number of eventsdivided by the number of thrown events.
shows the distribution of Edep for all particles that deposit any energy in the scintillator (blackcurve largely obscured by the other histograms). Electrons were simulated of momentum9.25 − GeV, incident at one point near the center of the scintillator, and normal to thesurface. The spectra in Fig. 4 are for all particles, but nearly all (98%) are electrons. Thepeak created by minimum-ionizing particles (MIPs) is visible at Edep ≈ 9 MeV. This is theexpected position since MIPs deposit about 2 MeV of energy per cm of scintillator material.There is also a significant number of events at energies below the MIP peak.
To understand the low-Edep features consider the right-hand panel of Fig. 4 which showsa two-dimensional histogram of Edep versus E where E is the energy (known in simulation)of the particle as it enters the volume (the P1A scintillator panel here). The thresholdat Edep ≈ 8 MeV is the low-Edep edge of the MIP peak. Electrons passing through the

CLAS-NOTE 2011-Draft - August 9, 2011 7
scintillator are not expected to deposit energy less than this amount. There are narrowpeaks at E = 9.25 GeV in the right-hand panel of Fig. 4 (corresponding to the incidentelectron energy) and at E = 0 MeV. The long, E tail below E = 9.25 GeV is due to primaryelectrons that have emitted a bremsstrahlung photon before reaching the P1A scintillator.At E = 9.25 GeV and Edep < 8 MeV in the right-hand panel of Fig. 4 there is a low-Edep
tail below the energy of a minimum-ionizing particle. These events are due to full-energyelectrons that enter the scintillator and emit a bremsstrahlung photon that carries awaynearly all of the incident electron energy. The remaining, now low-energy electrons willstop in the scintillator and deposit less than the MIP energy all the way down to zero.Another explanation for this high-E, low-Edep tail is from backscattered electrons, but thecross section for bremsstrahlung is orders of magnitude greater than the backscatter one.This low-Edep, high-E feature can be seen in the red histogram in the left-hand panel of Fig.4 where the Edep spectrum is extracted for events with E > 8 MeV; the minimum energydeposited for MIPs and the threshold visible in the right-hand panel. The red histogramalmost completely overlaps the MIP peak and has the low-Edep tail.
The blue histogram in the left-hand panel is for events with E < 8 MeV and correspondsto the peak near E = 0 MeV in the right-hand panel. These are low-E, secondary electronsproduced when the primary electron passed through the scintillator. The thickness of theP1A scintillator (5.08 cm) corresponds to the range of electrons with energies of about10 MeV so electrons with energies up to 10 MeV will stop in the scintillator (unless theyare produced near the back surface of the panel so they can escape). Once the energy ofthe secondary electrons exceeds 10 MeV they will pass through the scintillator and depositthe MIP energy (unless they have a momentum that carries them along the long-axis of thescintillator paddle through a larger amount of the material). In the Edep − E distributionthere is also a hint of protons that deposited energy in the scintillator at E ≈ 1 GeV. Thereprotons were produced by reactions in the scintillator.
We now consider the effect of lower incident momentum electrons on the FTOF response.Fig. 5 shows the results from the analysis of the same study illustrated in Fig. 4, but at alower primary electron momentum corresponding to the momentum of quasielastic electronsnear the large-angle edge of the FTOF panel P1A. The command used to generate the eventfile with gemc was the same used above with only the incident electron momentum changed.The left-hand panel of Fig. 5 shows the same Edep distribution except now the incidentelectron momentum is 3.5 GeV. The overall shape of the distribution and its breakdowninto components above and below the MIP threshold are nearly identical. The right-handpanel in Fig. 5 shows Edep versus E distribution as in Fig. 4, but with the reduced incidentelectron momentum. The only difference is the reduced E range due to the lower incidentmomentum. For the range of electron momenta we have studied here the response of theFTOF system to electrons is largely independent of the incident neutron momentum.
The response of the FTOF panel P1B is shown in Figs 6-7. These panels are mounted infront of panel P1A (see Fig. 3), cover about the same angular range, and are thicker (6.0 cmversus 5.1 cm). As in the previous study simulated, incident electrons at two momenta(3.5 GeV/c and 9.25 GeV/c) struck the center of the panel normal to the surface. ComparingFigs. 4 and 6 (9.25 GeV/c) the distributions are very similar. The only difference is theEdep threshold for the minimum ionizing particles is higher in panel P1B than in panel P1A(9 MeV versus 8 MeV) because P1B is thicker. The same features can be seen comparing

CLAS-NOTE 2011-Draft - August 9, 2011 8
(MeV)depE0 5 10 15 20 25 30 35 40 45 50
Cou
nts/
N-M
eV
-510
-410
-310
-210
-110
= 3.5 GeV/c electronse
pTOF panel P1ABlack - all eventsRed - E > 8 MeVBlue - E < 8 MeV
E (MeV)0 1000 2000 3000 4000 5000 6000 7000 8000 9000 10000
(M
eV)
dep
E
0
10
20
30
40
50
60
-510
-410
-310
-210
-1103.5 GeV/c electronsTOF panel P1A
Figure 5: Energy deposited and particle energy in the FTOF scintillators for electrons ofmomentum pe = 3.5 GeV for FTOF panel P1A. The vertical axis in the left-hand panel isthe number of events from the Monte Carlo, gemc calculation divided by the bin size andthe number of thrown events. The histogram in the right-hand panel is the number of eventsdivided by the number of thrown events.
(MeV)depE0 5 10 15 20 25 30 35 40 45 50
Cou
nts/
N-M
eV
-510
-410
-310
-210
-110
= 9.25 GeV/c electronse
pTOF panel P1BBlack - all eventsRed - E > 9 MeVBlue - E < 9 MeV
E (MeV)
0 1000 2000 3000 4000 5000 6000 7000 8000 9000 10000
(M
eV)
dep
E
0
10
20
30
40
50
60
-510
-410
-310
-210
-1109.25 GeV/c electronsTOF panel P1B
Figure 6: Energy deposited and particle energy in the FTOF scintillators for electrons ofmomentum E = 9.25 GeV/c for FTOF panel P1B. The vertical axis in the left-hand panelis the number of events from the Monte Carlo, gemc calculation divided by the bin size andthe number of thrown events. The histogram in the right-hand panel is the number of eventsdivided by the number of thrown events.
Figs. 5 and 7 (3.5 GeV/c).

CLAS-NOTE 2011-Draft - August 9, 2011 9
(MeV)depE0 5 10 15 20 25 30 35 40 45 50
Cou
nts/
N-M
eV
-510
-410
-310
-210
-110
= 3.5 GeV/c electronse
pTOF panel P1BBlack - all eventsRed - E > 9 MeVBlue - E < 9 MeV
E (MeV)
0 1000 2000 3000 4000 5000 6000 7000 8000 9000 10000
(M
eV)
dep
E
0
10
20
30
40
50
60
-510
-410
-310
-210
-1103.5 GeV/c electronsTOF panel P1B
Figure 7: Energy deposited and particle energy in the FTOF scintillators for electrons ofmomentum E = 3.5 GeV/c for FTOF panel P1B. The vertical axis in the left-hand panelis the number of events from the Monte Carlo, gemc calculation divided by the bin size andthe number of thrown events. The histogram in the right-hand panel is the number of eventsdivided by the number of thrown events.
(MeV)depE0 5 10 15 20 25 30 35 40 45 50
Cou
nts/
N-M
eV
-510
-410
-310
-210
-110
= 2.5 GeV/c electronse
pTOF panel P2BBlack - all eventsRed - E > 8 MeVBlue - E < 8 MeV
E (MeV)
0 1000 2000 3000 4000 5000 6000 7000 8000 9000 10000
(M
eV)
dep
E
0
10
20
30
40
50
60
-510
-410
-310
-210
-1102.5 GeV/c electronsTOF panel P2B
Figure 8: Energy deposited and particle energy in the FTOF scintillators for electrons ofmomentum E = 2.5 GeV/c for FTOF panel P2B. The vertical axis in the left-hand panelis the number of events from the Monte Carlo, gemc calculation divided by the bin size andthe number of thrown events. The histogram in the right-hand panel is the number of eventsdivided by the number of thrown events.
The response of the FTOF panel P2B is shown in Fig. 8. This panel is mounted in at

CLAS-NOTE 2011-Draft - August 9, 2011 10
larger angles relative to panel P1A (see Fig. 3), covers the angular range θ =???, and hasthe same thickness as the P1A panels (5.1 cm). The scintillators will be reused from CLAS6.Simulated, incident electrons at momentum 2.5 GeV/c struck the center of the panel normalto the surface. We only used a single momentum here since the angular range and, hence,the momentum range for quasielastic electrons is narrow. Comparing Fig. 8 with the otherpanels shows that the minimum ionizing peak is much the same as the one for panel P1Awhich has the same thickness of scintillator. The shape of the Edep spectrum changes littlewith incident electron beam energy as seen in comparing the left-hand panels in Figs. 4-8. Inthe two-dimensional plots of Edep versus E, they all have similar features; the only differenceis the position of the peak from the incident electrons.
5 Simulation of FTOF Scintillator Response to
Neutrons
The gemc code was run for neutrons striking one of the strips in each panel perpendicularto the plane of the panel over the range pn = 3.1 − 9.2 GeV/c. For each panel all of theother CLAS12 components between the target and the TOF panel were removed so thosecomponents would not alter the properties of the electrons striking the panel. The gemccommand is shown below. It is much the same as the one above except for the choice ofparticle and momentum.
gemc -USE_QT=0 -OUTPUT=neutrons.ev -N=500000 -PRINT_EVENT=20000
-HALL_MATERIAL=Vacuum -gcard=p1a.gcard -USE_PHYSICSL=gemc
-BEAM_P="neutron, 8.0*GeV, 25*deg, 0*deg" -SPREAD_P="0*GeV, 0*deg, 0*deg"
-LUMI_EVENT="0,0*ns,2*ns" -NO_FIELD=all
The energy deposited for neutrons in the scintillator is shown in Figs. 9-12. The left-handpanel of Fig. 9 shows the distribution of deposited energy Edep for all neutral particles (blackhistogram largely obscured by the red one) from primary neutrons with pn = 8.0 GeV/cincident on panel P1A and perpendicular to the face of the panel. The distribution is broad;stretching out to an energy E ≈ 500 MeV where E is the energy (known in simulation) ofthe particle as it enters the volume (the P1A scintillator panel here). The distribution isdominated by neutrons (70%) with the remainder composed mostly of photons produced byneutron reactions in the scintillator. The other important feature is the scale is much smallerthan the comparable momentum for electrons (see Fig 4) reflecting the much lower detectionefficiency of the scintillators for neutrons than electrons. The right-hand panel of Fig. 9shows the distribution of Edep versus E. The narrow ridge at E = 8.0 GeV is produced bythe primary neutrons and there is smaller group near E = 1 GeV from secondary neutronsproduced by reactions in the scintillator.
Similar distributions are shown in Fig. 10 for a lower incident, primary neutron mo-mentum pn = 3.1 GeV/c. The deposited energy distribution for neutrons in the left-handpanel is softer; it does not extend to as high an energy as the higher-momentum neutronsin Fig. 10. On the other hand, the photon spectrum, which is produced by reactions in thematerial of the scintillator, is about the same in Figs. 9 and 10. The Edep − E spectrum in

CLAS-NOTE 2011-Draft - August 9, 2011 11
2011-07-23 18:17:31 (MeV)depE
0 50 100 150 200 250 300 350 400 450 500
Cou
nts/
N-M
eV
-610
-510
-410
-310
-210
Black - All neutralsRed - neutronsBlue - photonsN = 500000
= 8 GeVn
p
TOF panel P1A
E (MeV)0 2000 4000 6000 8000 10000
(M
eV)
dep
E
0
100
200
300
400
500
600
700
-510
-410
-310
-210
= 8 GeV/c neutronsn
p
TOF panel P1A
Figure 9: Energy deposited and particle energy in the FTOF scintillators for neutrons ofmomentum pn = 8.0 GeV/c for FTOF panel P1A. The vertical axis in the left-hand panelis the number of events from the Monte Carlo, gemc calculation divided by the bin size andthe number of thrown events. The histogram in the right-hand panel is the number of eventsdivided by the number of thrown events and the bin size.
2011-07-23 20:19:06
(MeV)depE0 50 100 150 200 250 300 350 400 450 500
Cou
nts/
N-M
eV
-610
-510
-410
-310
-210
Black - All neutralsRed - neutronsBlue - photonsN = 500000
= 3.1 GeVn
p
TOF panel P1A
E (MeV)0 2000 4000 6000 8000 10000
(M
eV)
dep
E
0
100
200
300
400
500
600
700
-510
-410
-310
-210 = 3.1 GeV/c neutrons
np
TOF panel P1A
Figure 10: Energy deposited and particle energy in the FTOF scintillators for neutrons ofmomentum pn = 3.1 GeV/c for FTOF panel P1A. The vertical axis in the left-hand panelis the number of events from the Monte Carlo, gemc calculation divided by the bin size andthe number of thrown events. The histogram in the right-hand panel is the number of eventsdivided by the number of thrown events and the bin size.
the right-hand panel of Fig. 10 has much the same features as the higher-momentum one in

CLAS-NOTE 2011-Draft - August 9, 2011 12
Fig. 9 except the ridge from the primary neutron is shifted to lower E.The results for panels P1B and P2B (see Fig. 3) are shown in Figures 11-12. The
2011-07-23 23:52:26
(MeV)depE0 50 100 150 200 250 300 350 400 450 500
Cou
nts/
N-M
eV
-610
-510
-410
-310
-210
-110
Black - All neutralsRed - neutronsBlue - photonsN = 500000
= 3.1 GeVn
p
TOF panel P1B
(MeV)depE0 50 100 150 200 250 300 350 400 450 500
Cou
nts/
N-M
eV
-610
-510
-410
-310
-210
-110
Black - All neutralsRed - neutronsBlue - photonsN = 500000
TOF panel P1B
= 8.0 GeVn
p
Figure 11: Energy deposited and particle energy in the FTOF scintillators for neutrons ofmomentum pn = 8.0 GeV/c (left-hand panel) and pn = 3.1 GeV/c (right-hand panel) forFTOF panel P1B. The vertical axis on each plot is the number of events from the MonteCarlo, gemc calculation divided by the bin size and the number of thrown events.
(MeV)depE0 50 100 150 200 250 300 350 400 450 500
Cou
nts/
N-M
eV
-610
-510
-410
-310
-210
-110Black - All neutralsRed - neutronsBlue - photonsN = 500000
= 9.2 GeVn
p
TOF panel P2B
Figure 12: Energy deposited and particle energy in the FTOF scintillators for neutrons ofmomentum pn = 9.1 GeV/c for FTOF panel P2B. The vertical axis on each plot is thenumber of events from the Monte Carlo, gemc calculation divided by the bin size and thenumber of thrown events.
deposited energy has the same features seen above. (1) The neutron spectrum is harder

CLAS-NOTE 2011-Draft - August 9, 2011 13
for higher-momentum incident neutrons and (2) the photon distribution changes little withincident neutron momentum.
6 Simulation of Neutron Detection Efficiency for
Quasielastic e − n Events
We now study the simulation of the quasielastic scattering of electrons from neutrons toextract the neutron scattering efficiency (NDE); an essential component of the Gn
M measure-ment described above. This study will provide a baseline of understanding of the NDE inpreparation for the experiment. Quasielastic e − n events were simulated assuming (1) astationary neutron target and (2) an isotropic angular distribution. The first assumptionprovides a starting point for a future study of the NDE with a more realistic simulationof the Fermi motion of the neutron in deuterium. The second one enables us to obtain anadequate number of Monte Carlo events at large angles in a shorter period of time. Theseevents were then used as input to gemc [2] using the following command.
gemc -USE_QT=0 -OUTPUT="evio,gemc_results1.ev" -N=500000
-INPUT_GEN_FILE="LUND, nInput1.dat" -PRINT_EVENT=20000 -HALL_MATERIAL=Vacuum
-gcard=nde.gcard -USE_PHYSICSL=gemc -SCALE_FIELD=1 -SAVE_ALL_MOTHERS=1
-HALL_FIELD=srr-solenoid -ENERGYCUT="100*MeV"
Electrons were reconstructed with the code Socrat described in Ref. [3]. Reconstructionparameters can be found in Appendices A-B. A cut on the ratio ∆p/p was required. Fig. 13shows the distribution of ∆p/p. The difference ∆p was extracted between the reconstructed
/ ndf 2χ 30.92 / 14
p0 27.2± 5014
p1 0.0000759± -0.0005635
p2 0.00012± 0.01251
p/p∆-0.05 0 0.05
Cou
nts
0
1000
2000
3000
4000
5000
/ ndf 2χ 30.92 / 14
p0 27.2± 5014
p1 0.0000759± -0.0005635
p2 0.00012± 0.01251
gemc/Socrat
CLAS12 electronmomentumresolution
E = 11 GeV
Figure 13: Distribution of ∆p/p using the momentum from the Socrat reconstruction withthe momentum calculated from the reconstructed electron angle and assuming quasielasticscattering.
electron momentum from Socrat and the momentum calculated from the measured polar

CLAS-NOTE 2011-Draft - August 9, 2011 14
angle (also from Socrat) and assuming elastic scattering. This quantity was divided by themomentum from Socrat. This ratio was calculated event-by-event and required to be within±0.05 of the origin. This limit is larger than the expected resolution of CLAS12 of 0.1%[26]. A second cut on Edep was also required. The minimum value for the deposited energyin CLAS6 (Edep > 0.5 MeV) was estimated from Ref. [27] and applied to all FTOF signalsin gemc.
Quasielastic neutrons were reconstructed in the following way. (1) Using only the recon-structed electron information and assuming elastic scattering off the neutron, the directionof the scattered neutron was calculated and the expected CLAS12 sector the neutron wouldstrike was determined. The struck sector was determined solely from the calculated directionof the neutron extracted from the measured electron information. (2) A neutron track wasgenerated assuming the electron vertex as the starting point and using the calculated neu-tron 3-momentum to determine the direction from that vertex. (3) The intersection pointof the neutron track and the plane of each FTOF panel in the expected CLAS12 sector wascalculated. This task was done using the three points at the corners of the active area ofthe FTOF P1A and P1B panels to define a triangular plane, calculating the intersectionpoint, and using a theorem from analytical geometry to determine if the intersection pointlay inside this triangle [28]. If the intersection point lay within the FTOF panel active area,this neutron was classified as ‘found’. If the intersection point lay outside the active area,the event was rejected. For the P2B panel a similar approach was used. The trapezoidalshape of the panel was used to form the bottom portion of a new triangle, i.e. the baseand the two equivalent angles of an isosceles triangle. The intersection of the neutron trackwith this new triangle was calculated and tested to see if it lay inside the triangle. If thatwas true, then the intersection point was required to lie close to the base of the isoscelestriangle and within the active area of the P2B panel. (4) The FTOF data was scanned tosee if one of the hits in the FTOF matched the expected position of the ‘found’ neutron. Aray was drawn from the vertex of the electron track to the position of a hit on the face ofthe FTOF panel and the angle γ was calculated between this ray and the one representingthe direction of the 3-momentum of the found neutron. If this angle was less than 10, theneutron reconstruction was deemed a success. If the angle was greater than 10, the eventwas rejected. If more than one FTOF hit lay within this angular cone around the foundneutron 3-momentum, then the hit with the smallest angle γ was selected.
Fig. 14 shows the opening angle γ between the direction of the found neutron 3-momentum and the ray going from the electron track vertex and the FTOF hits in panel P1B.The black histogram shows γ for all FTOF hits in the panel. There is a rapid, exponentialdrop from the peak at γ = 0 out to 10. Beyond that range, the distribution is nearlyflat and then drops rapidly again beyond 40 to zero. The red histogram shows the samedistribution for all FTOF hits that lay in the sector of the found neutron. It closely followsthe black histogram for all FTOF hits out to γ = 10 and then diverges; continuing to fallrapidly to zero. The dashed line in Fig. 14 marks the position of the cut on γ used to selectreconstructed neutrons. This value for the γ cut (γ = 10) was originally used in the CLAS6Gn
M analysis and it can be seen here that the cut excludes the region where background hitsin other sectors start to become significant. About 99% of the events in the red histogramfall within the 10 cut.

CLAS-NOTE 2011-Draft - August 9, 2011 15
(deg)γ0 10 20 30 40 50 60 70 80 90 100
1
10
210
310
410 > 0.5 MeVdep
E = 11 GeV, E
Black - all P1B hits
Red - P1B hits in foundneutron sector
Figure 14: Opening angle between found neutron and TOF hit in panel P1B which lies infront of panel P1A. The vertical line shows position of cut to select neutrons.
The neutron detection efficiency (NDE) can now be extracted from the simulation. Itis the ratio of reconstructed neutrons to found neutrons. Fig. 15 shows the momentumdistribution of found (black) and reconstructed (red) neutrons in the left-hand panel. Themomentum distribution of found neutrons is peaked at higher momentum. This abundance
(GeV/c)n
p0 2 4 6 8 10
Cou
nts
0
5000
10000
15000
20000
25000
Red - Reconstructed neutronsBlack - Found neutronsE = 11 GeV
> 0.5 MeVdepE
(GeV/c)n
p0 2 4 6 8 10
ND
E
0
0.05
0.1
0.15
0.2
0.25
0.3
0.35
0.4
E = 11 GeV, gemc simulation
Neutron detection efficiency
>0.5 MeVdepE
Figure 15: Histograms of found (black) and reconstructed (red) neutrons detected in FTOFare shown in the left-hand panel. The neutron detection efficiency derived from these resultsis shown in the right-hand panel.

CLAS-NOTE 2011-Draft - August 9, 2011 16
of high-momentum neutrons can be explained since it is associated with low-momentum,large-angle electrons in quasielastic scattering. These large-angle electrons are scattered intoa region where CLAS12 has larger acceptance because it is away from the region at forwardangles where the cryostat for the torus coils is merging and reducing the acceptance. Thered histogram for the reconstructed neutrons has much the same shape, but reduced in sizeby about a factor of ten. The right-hand panel in Fig. 15 shows the NDE extracted fromthe distributions shown in the left-hand panel. The simulated NDE (blue points) is largelyflat over most of the momentum range and drops off rapidly at the limits of the acceptance.The drop in the efficiency at pn ≈ 3 GeV/c is due to edge of the P1B panel. Quasielasticneutrons at higher momentum and more forward angles have to pass through both P1B andP1A panels. At larger neutron angle (and lower momentum for QE neutrons), the particlesonly encounter the P2B panel which has lower efficiency than the combined P1A+P1Bpanels.
The response of the neutron detection efficiency to changes in the Edep threshold wasstudied. As mentioned above the value used here was the CLAS6 value taken from Ref. [27].The results of changing this minimum value for Edep are shown in Fig. 16. The average
Threshold (MeV)depE0 0.5 1 1.5 2 2.5 3 3.5 4
ND
E
0
2
4
6
8
10
12
14
16
18
20
E = 11 GeV
FTOF neutron detection efficiency
Figure 16: Dependence of the neutron detection efficiency (NDE) for quasielastic neutronsas a function of the minimum deposited energy Edep is shown.
NDE for the P1A+P2B panels is 15.6 ± 0.2% at the nominal CLAS6 threshold and rises toa maximum of 17.6± 0.2% when the threshold is reduced to zero. Turning the threshold uphas only a modest effect on the neutron detection efficiency.
The detection efficiency for quasielastic neutrons was measured in the E5 run periodand presents an opportunity to challenge our simulations here with data. During the E5 runthe p(e, e′π+)n reaction provided a source of tagged or ‘found’ neutrons where the neutronmomentum was known from the electron and pion kinematics. The found neutrons werethen matched with hits in the CLAS6 time-of-flight system. The P1A and P2B panels to be

CLAS-NOTE 2011-Draft - August 9, 2011 17
used in CLAS12 gemc were originally part of the CLAS6 time-of-flight system.To compare the gemc simulation and the E5 NDE measurement we focus only on the
P1A and P2B panels. The P1B panel in front of P1A was turned off in the simulation.The results are shown in Fig. 17. The left-hand panel shows the momentum spectra for
(GeV/c)n
p0 2 4 6 8 10
Cou
nts
0
5000
10000
15000
20000
25000Red - Reconstructed neutronsBlack - Found neutronsE = 11 GeV
> 0.5 MeVdepEno P1B panel
(GeV/c)n
p0 2 4 6 8 10
ND
E
0
0.02
0.04
0.06
0.08
0.1
0.12
0.14
0.16
0.18
0.2
E = 11 GeV, gemc simulation
Neutron detection efficiency
with P1B removed
>0.5 MeVdepE
Figure 17: Histograms of found (back) and reconstructed (red) neutrons detected in FTOFpanels P1A and P2B only are shown in the left-hand panel. The neutron detection efficiencyderived from these results is shown in the right-hand panel (blue points) along with the NDEmeasured at E = 4.2 GeV in CLAS6 during the E5 running period (black points).
found and reconstructed neutrons. The shapes are qualitatively similar to the ones in theleft-hand panel of Fig. 15. The right-hand panel in Fig. 17 shows the NDE extracted fromthe momentum spectra (blue points). For pn > 4 GeV/c the neutrons were detected in panelP1A and have a roughly constant efficiency of about 8%. There is a dip in the efficiencyat pn ≈ 3 GeV/c where the QE neutrons fall into a gap between panels P1A and P2B.This gap is covered by the P1B panel in the full CLAS12 detector. At the lowest neutronmomenta, the efficiency returns to about 8% where the neutrons are striking panel P2B. TheE5 measurement of the NDE is show as the black points in Fig. 17. The measured NDErises rapidly from zero and reaches a plateau at pn ≈ 2GeV/c and at an efficiency of about8%. There is good agreement within the experimental uncertainty between the measuredNDE and the simulated one. It bears emphasizing that the simulated and measured resultsagree even though two different reactions are used.
We now summarize the work described in this CLAS-Note. We have simulated the pro-duction and reconstruction of quasi-elastically scattered electrons and neutrons in CLAS12with gemc [2] and Socrat [3]. We have studied the properties of the deposited energy andefficiency of the CLAS12 FTOF system to establish a baseline for the future. We have sim-ulated the extraction of the neutron detection efficiency using QE neutrons and found anefficiency of 16% for panels P1A and P1B combined together and a value of 8% for panel
CLAS-NOTE 2011-Draft - August 9, 2011 18
P2B. A comparison of the simulated efficiency using only panels P1A and P2B (that arebeing reused from CLAS6) with the measured values from the E5 run (using the p(e, e′π+)nreaction) shows good agreement. For future work to prepare for the CLAS12 Gn
M measure-ment we will add the effects of Fermi motion to the target neutron and develop a simulationof the p(e, e′π+)n reaction that will be used to extract the neutron detection efficiency in theCLAS12 Gn
M experiment (E12-07-104).This work is supported by US Department of Energy grant DE-FG02-96ER40980 and
Jefferson Science Associates.
References
[1] G.P. Gilfoyle et al. Experiment E12-07-104, Jefferson Lab, Newport News, VA, 2007.
[2] M. Ungaro. gemc - geant4 montecarlo. Technical report, Jefferson Lab, 2011.
[3] S. Procureur. Socrat: a software for clas12 reconstruction and tracking. CLAS-Note2008-015, Jefferson Lab, 2008.
[4] Nuclear Science Advisory Committee. The Frontiers of Nuclear Science. US Departmentof Energy, 2007.
[5] J. Lachniet, A. Afanasev, H. Arenhovel, W. K. Brooks, G. P. Gilfoyle, D. Higinbotham,S. Jeschonnek, B. Quinn, M. F. Vineyard, et al. Precise Measurement of the NeutronMagnetic Form Factor Gn
M in the Few-GeV2 Region. Phys. Rev. Lett., 102(19):192001,2009.
[6] W. Bartel et al. Nucl. Phys. B, 58:429, 1973.
[7] G. Kubon et al. Phys. Lett. B, 524:26–32, 2002.
[8] A. Lung et al. Phys. Rev. Lett., 70(6):718–721, Feb 1993.
[9] H. Anklin et al. Phys. Lett. B, 428:248–253, 1998.
[10] B. Anderson et al. Phys. Rev. C, 75:034003, 2007.
[11] R. G. Arnold et al. Measurements of transverse quasielastic electron scattering fromthe deuteron at high momentum transfers. Phys. Rev. Lett., 61(7):806–809, Aug 1988.
[12] S. Rock et al. Measurement of Elastic Electron-Neutron Cross Sections up to Q2 = 10(GeV/c)2. Phys. Rev. Lett., 49(16):1139–1142, Oct 1982.
[13] W. M. Alberico, S. M. Bilenky, C. Giunti, and K. M. Graczyk. Electromagnetic formfactors of the nucleon: New fit and analysis of uncertainties. Phys. Rev. C (NuclearPhysics), 79(6):065204, 2009.
[14] G.A. Miller. Phys. Rev. C, 66:032201, 2002.

CLAS-NOTE 2011-Draft - August 9, 2011 19
[15] M. Guidal, M.V. Polyyakov, A.V. Radyushkin, and M. Vanderhaeghen. Phys. Rev. D,72:054013, 2005.
[16] I. C. Cloet, G. Eichmann, B. El-Bennich, T. Klahn, and C. D. Roberts. Survey ofnucleon electromagnetic form factors. Few Body Syst., 46:1–36, 2009.
[17] C.E. Hyde-Wright and K.deJager. Electromagnetic Form Factors of the Nucleon andCompton Scattering. Ann. Rev. Nucl. Part. Sci., 54.
[18] H. Anklin et al. Phys. Lett. B, 336:313–318, 1994.
[19] G. Kubon et al. Phys. Lett. B, 524:26–32, 2002.
[20] E. E. W. Bruins et al. Measurement of the neutron magnetic form factor. Phys. Rev.Lett., 75(1):21–24, Jul 1995.
[21] G.P. Gilfoyle, W.K. Brooks, S. Stepanyan, M.F. Vineyard, S.E. Kuhn, J.D. Lachniet,L.B. Weinstein, K. Hafidi, J. Arrington, D. Geesaman, R. Holt, D. Potterveld, P.E.Reimer, P. Solvignon, M. Holtrop, M. Garcon, S. Jeschonnek, and P. Kroll. Measure-ment of the Neutron Magnetic Form Factor at High Q2 Using the Ratio Method onDeuterium. E12-07-104, Jefferson Lab, Newport News, VA, 2007.
[22] J.D. Lachniet, W.K. Brooks, G.P. Gilfoyle, B. Quinn, and M.F. Vineyard. A highprecision measurement of the neutron magnetic form factor using the CLAS detector.CLAS Analysis Note 2008-103, Jefferson Lab, 2008.
[23] J. Allison et al. Geant4 developments and applications. IEEE Transactions on NuclearScience, 53:270–278, 2006.
[24] Wikipedia. Qt (framework) — wikipedia, the free encyclopedia, 2011. [Online; accessed27-June-2011].
[25] The CLAS12 TDR Editorial Board. The CLAS12 Technical Design Report. Technicalreport, Thomas Jefferson National Accelerator Facility, Newport News, VA, 2008.
[26] The Hall B 12 GeV Upgrade CDR Editorial Board. The Hall B 12 GeV UpgradePreconceptual Design Report. Technical report, Thomas Jefferson National AcceleratorFacility, Newport News, VA, 2005.
[27] K. Loukachine. Measurement of the Polarization of the phi(1020) in Electroproduction.PhD thesis, Virginia Polytechnic Institute, 2000.
[28] Wikipedia. Line-plane intersection — wikipedia, the free encyclopedia, 2011. [Online;accessed 26-July-2011].

CLAS-NOTE 2011-Draft - August 9, 2011 20
A Socrat Parameter Input
// This is the option file to run the Socrat tracking code
// Author: S.Procureur, May 2008, v1.0
//the electron beam energy in GeV, only important for Neutron Tracking
Ebeam 11.0
// run the neutron tracking code (1) or not (0)
Neutron Tracking 1
// run the forward tracking code (1) or not (0)
Forward Tracking 1
// run the central tracking code (1) or not (0)
Central Tracking 0
// vertex fit on (1) or off (0) (both central and forward track must be on!)
Vertex Fit 0
// Events from Geant (1) of from internal Socrat routine (0)
Geant 1
// if Geant mode, specify the path to the Geant output
//GFile gemc.root
//GFile /home/moog/ec/clas12EC3.root
//GFile results.root
GFile mmass.root
// Mode: batch (1) or interactive (0)
Mode 1
// Number of events to process (batch mode only, without Geant)
Events 100000
// Save a DC or BST display of last event (interactive mode only)
DispEvent DC 1
DispEvent BST 1
// Do the final fit or not (using Kalman Filter)
Kalman Filter 1
// Fill the output root tree (1) or not (0)
Outtree 1
// Debug mode (more variables in output tree) on (1) or off (0)
Debug 0
// Verbosity, how much do you want printed to the screen while socrat runs?
Verbosity 0

CLAS-NOTE 2011-Draft - August 9, 2011 21
// Cut on deposited energy in DC and FST (in MeV)
DC Edep 0.0001
SVT Edep 0.02
CTOF Edep 1.0
// Use linear interpolation for torus field estimation (should be 1!)
Linear Interp 1
// orientation of first wire in DC: +6 (1) or -6 (-1)
DC Firstangle 1
// ministagger in the DC (in microns)
DC Ministag 500.
// torus polarity (1: electrons go back to the beam; -1: opposite)
Torus Polarity 1
// Use the Forward Tracker (1) or not (0)
FST use 0
// fraction of dead channels in the FST (in %)
FST dead 0.0
//--------------------------------------------------------------------
// if Geant mode is not used, you need to specify the phase space for
// the internal track generator type of charged particle (numbering
// scheme from PDG, eg proton is 2212, electron is 11)
Central Particle 11
Forward Particle 11
// range in p (GeV/c)
Central Prange 0.25 1.5
Forward Prange 5 8
// range in theta (polar angle, in degrees)
Central Thetarange 35 125
Forward Thetarange 15 40
// range in phi (azimuthal angle, in degrees)
Central Phirange 50 60
Forward Phirange 50 60
// z length of the target (in m, vertex will be generated randomly inside it)
Target length 0.00
// occupancy in each of the DC regions (in %)

CLAS-NOTE 2011-Draft - August 9, 2011 22
DC occ 0 0 0
// background rate in FST, if used (in MHz/ layer)
FST rate 0
// background rate in BST, if used (in MHz/ layer)
BST rate 0
// Multiple scattering on (1) or off(0)
Mult Scat 1
// Print the hits information
Print Hit 0
// introduce some misalignments (in mm and mrad!)
Misalign BST Z 0 0 0 0
Misalign BST R 0 0 0 0
Misalign BST Phi 0 0 0 0
Misalign DC R 0 0 0
Misalign DC Tilt 0 0 0
Misalign DC Angle1st 0 0 0
Misalign FST Z 0 0 0
Misalign FST Phi 0 0 0
Misalign Solenoid 0 0 0
Misalign Torus 0 0 0
// Internal param (change speed, don’t change if you don’t know it!)
Time Accel 4.0e-13 5
B Socrat Tracking Parameters
// This is the parameter file to run the Socrat tracking code
// Author: S.Procureur, June 17th, 2008, v1.1
FI2 iteration 30
KF iteration 2
DC Dwire 0.18 5.0
FST InterMargin 0.02
FST Dphi 0.02
FST DRadius 0.004 -0.002
DC LRiter 8
BST InterMargin 0.1
BST VertexDist 0.008
BST Prange 0.1 4.0
CTOF TimeWindow 60 80
BST Dphi 0.4 0.25 0.7 0.7 0.4
BST distP4 0.07 0.01
BST cosP234 0.75
//Torus FieldInt 1.20 1.17 1.00 0.9
Torus FieldIntp -3.20 0.0695 -0.000667 0.000000531 0.0000000182 -2.85 -0.0230 0.00316
Torus FieldIntm -4.30 0.131 -0.00212 0.0000165 -0.0000000472 -2.89 -0.0317 -0.0192

CLAS-NOTE 2011-Draft - August 9, 2011 23
FT CovMat1 0.03 0.08 0.5
FT CovMat2 0.03 0.08 0.5
FT CovMatN 0.03 0.08 0.2
DCFST Rmatching 0.01
FST MultResol 1. 100000.
CT CovMat zphi 0.002 0.0005 1.0 0.25
CT CovMat mom 0.04 0.01 0.1 0.05
BST MultResol 3.0
VERTEX DistRZ 0.01 0.01