Simplified In-Situ Stress Properties in Fractured ... AGR-Tracs... · Simplified In-Situ Stress...
22
Simplified In-Situ Stress Properties in Fractured Reservoir Models Tim Wynn AGR-TRACS
Transcript of Simplified In-Situ Stress Properties in Fractured ... AGR-Tracs... · Simplified In-Situ Stress...
Simplified In-Situ Stress Properties in Fractured Reservoir Models
Tim Wynn
AGR-TRACS

Early assessment of the influence of in-situ stresses
Relatively fast model construction and analysis
Iterations with standard reservoir simulators
Ownership by asset team members
Use results to guide more specialised modelling
Before the What and the How is Why………
Potential decrease in fault seal capacity
Potential increase in natural fracture permeability
Simplified? – Stress properties are static, no coupled modelling
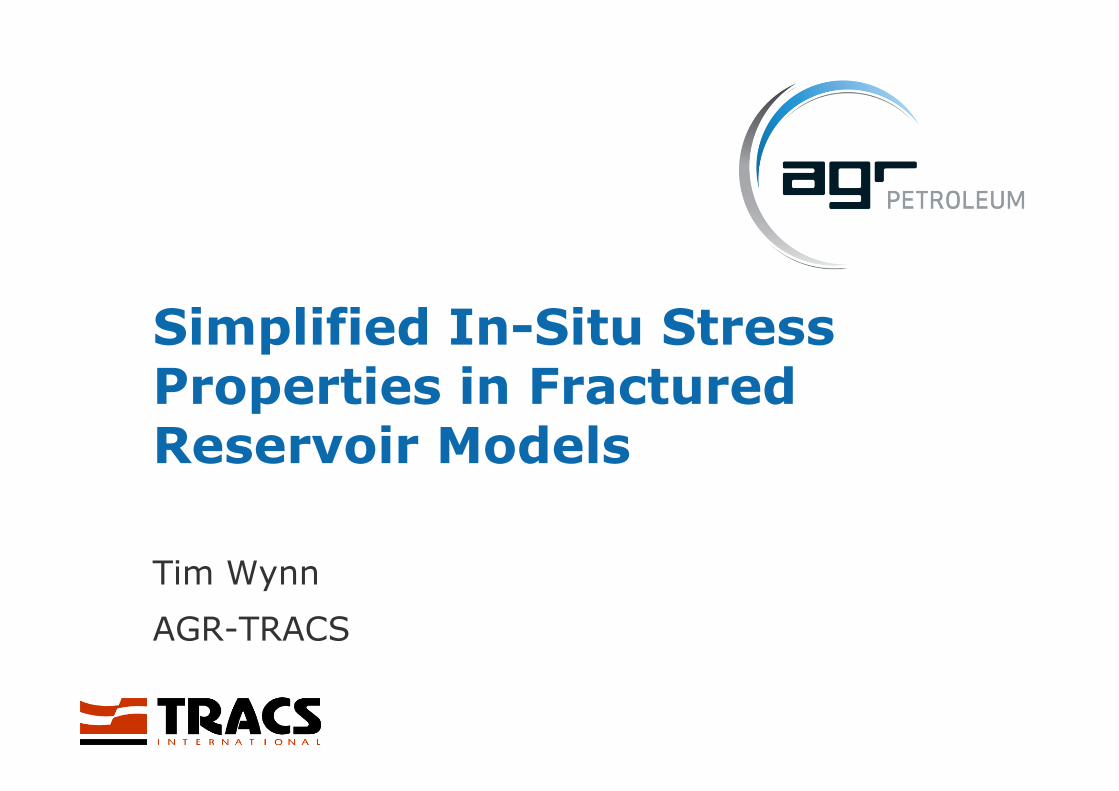
Fundamental Principles - Normal and Shear Stresses
σ
σ
σ n τ = Shear stress
High values act to move fractures
σn = Normal Stress
High values act to close fractures
Shear stress is not affected by pore pressure
σ = S - Pp
τ

The Fundamental Principles - Critical Shear
Critical levels of shear stress on fractures leads to small slip events. Can enhance permeability through brecciation and breaking of minor mineral bonds
Normal Effective Stress σn
Shea
r Str
ess
τ
Slope = µ ~ 0.6
µ = Coefficient of sliding friction
CFF = τ – (µ * σn)
CFF = Coulomb Failure Function
If CFF > 0 slip can occur

Building The In-Situ Stress Model
In-situ stress modelling
Input Properties for each cell or fracture Principal stress magnitudes and orientations Pore pressure Fracture dip and dip azimuth
Output Properties for each cell or fracture Normal Stress σn
Shear stress τ CFF
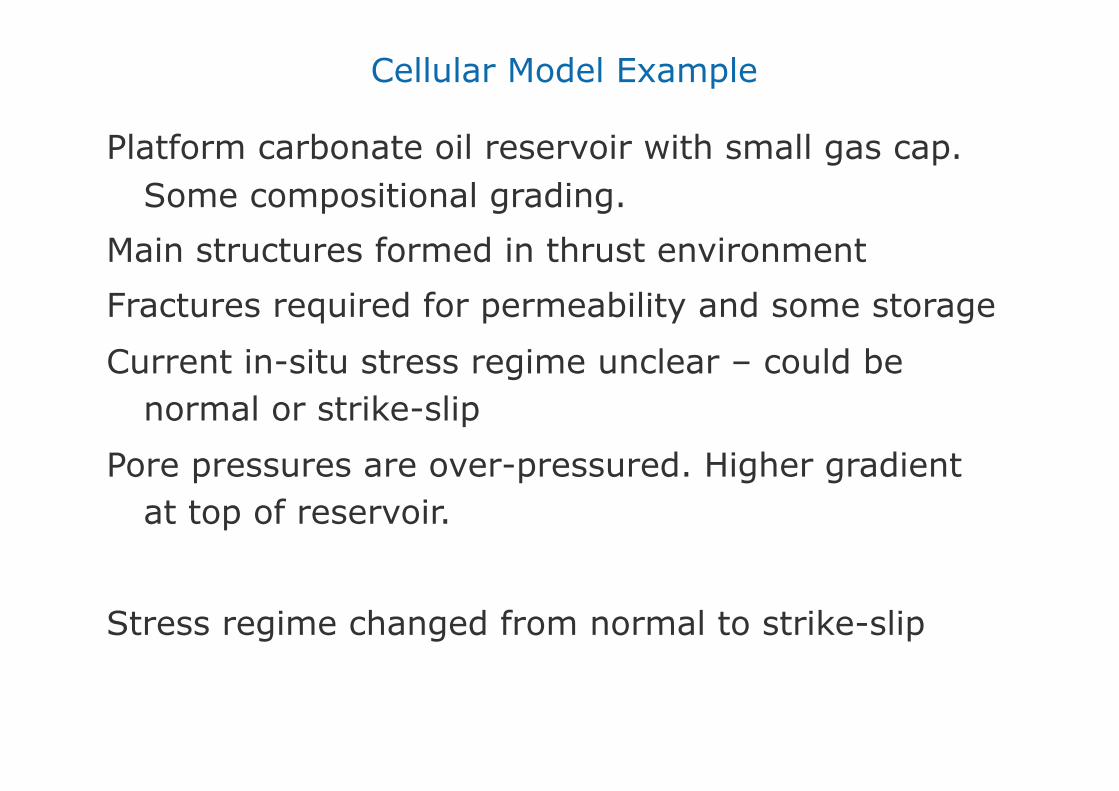
Cellular Model Example
Platform carbonate oil reservoir with small gas cap. Some compositional grading.
Main structures formed in thrust environment
Fractures required for permeability and some storage
Current in-situ stress regime unclear – could be normal or strike-slip
Pore pressures are over-pressured. Higher gradient at top of reservoir.
Stress regime changed from normal to strike-slip

Cellular Model Example – Normal Stress Input Parameters
Virgin Pore Pressure SH Magnitude
SH Orientation Fracture Dip Azimuth

Cellular Model Example – Normal Stress Output Parameters
σn Magnitude τ Magnitude
Coulomb Failure Function

Cellular Model Example – CFF Correlations 1
Outlined circles = strike-slip
Un-outlined circles = normal

Cellular Model Example – CFF Correlations 2
Outlined circles = strike-slip
Un-outlined circles = normal

Cellular Model Example – Conclusions
CFF nearly always negative with modelled values
Some indications that higher CFF values are associated with inflow
However, many locations where higher CFF values are not associated with PLT inflow or mud loss intervals.
Possible correlation with larger scale faults
Further analysis on the correlations of parameters (fractures, faults, dynamic data, mineralisation, CFF)
Further simplified modelling is warranted, possibly leading to fully coupled geomechanical modelling

DFN Model Example
Platform carbonate gas reservoir
Main structures formed in strike-slip environment
Fractures may influence permeability and storage
Current in-situ stress regime probably strike-slip
Reservoir under appraisal, no production data
Preliminary run of in-situ stress parameters
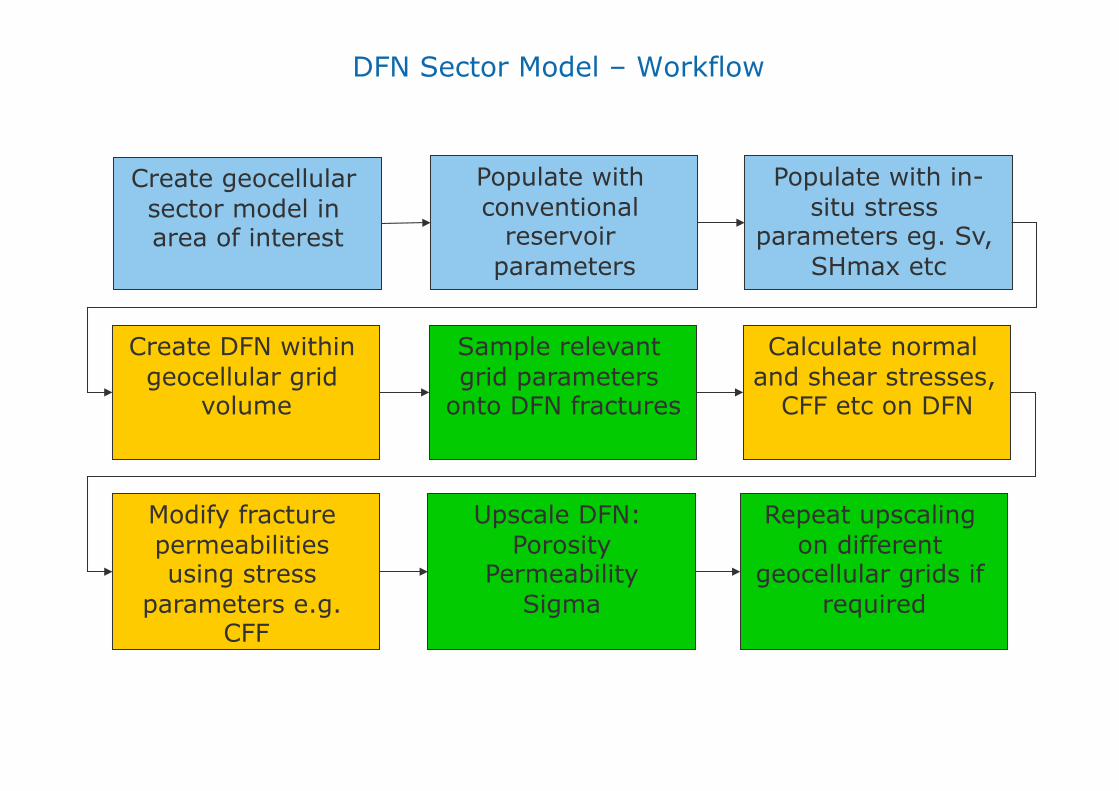
DFN Sector Model – Workflow
Create geocellular sector model in area of interest
Populate with conventional
reservoir parameters
Populate with in-situ stress
parameters eg. Sv, SHmax etc
Create DFN within geocellular grid
volume
Sample relevant grid parameters
onto DFN fractures
Calculate normal and shear stresses,
CFF etc on DFN
Modify fracture permeabilities using stress
parameters e.g. CFF
Upscale DFN: Porosity
Permeability Sigma
Repeat upscaling on different
geocellular grids if required

DFN Sector Model – Geocellular Grid Lithology
Limestone layers
Seismic scale fault
Shale and evaporite interlayers
1 km
Dolomite with best matrix properties
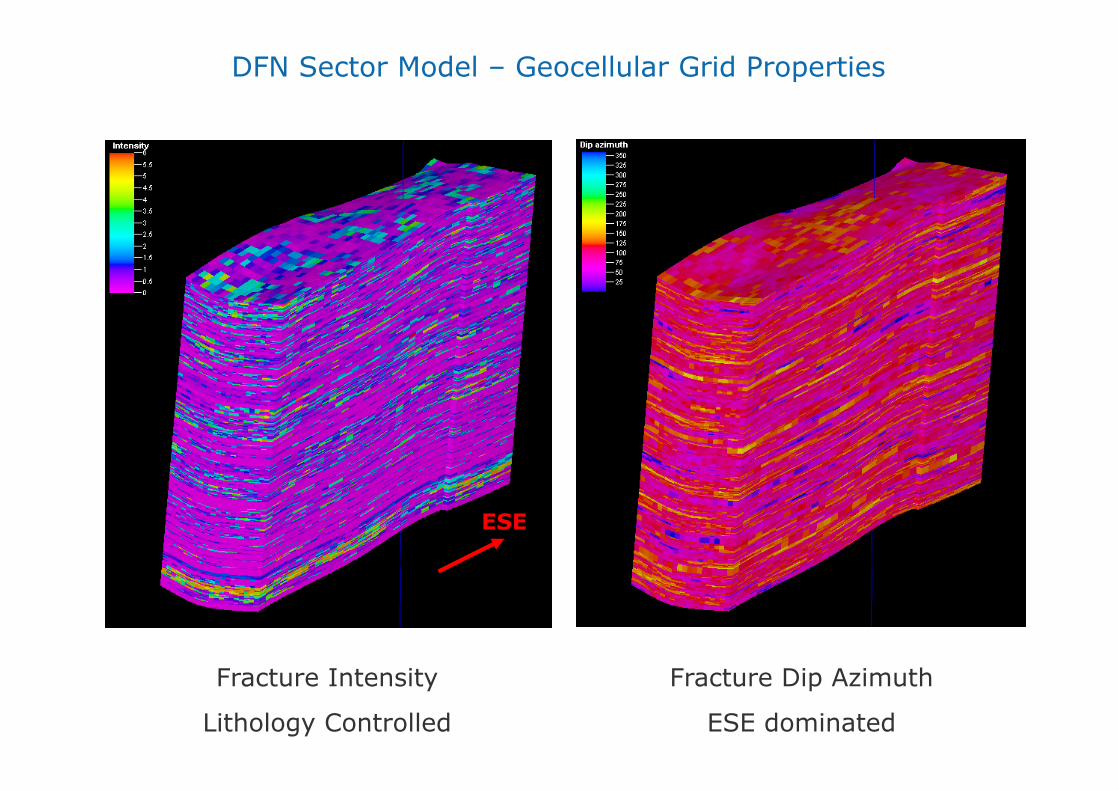
DFN Sector Model – Geocellular Grid Properties
Fracture Intensity
Lithology Controlled
Fracture Dip Azimuth
ESE dominated
ESE

DFN Sector Model – Fracture Network
Layer bound joints & Veins
with facies dependent distributions
Seismic scale fault
Fault damage zone fractures
1 km ~350,000 fractures
Orientation distributions
same for each set in all layers

DFN Sector Model – Property Sampling
Pore pressure
Sampled into DFN
Pore pressure
In geocellular grid

DFN Sector Model – DFN Properties
CFF modified permeability
350° SHmax
CFF on DFN fractures

DFN Sector Model – DFN Stress Modified Permeability
CFF modified permeability
350° SHmax
CFF on DFN
015° SHmax
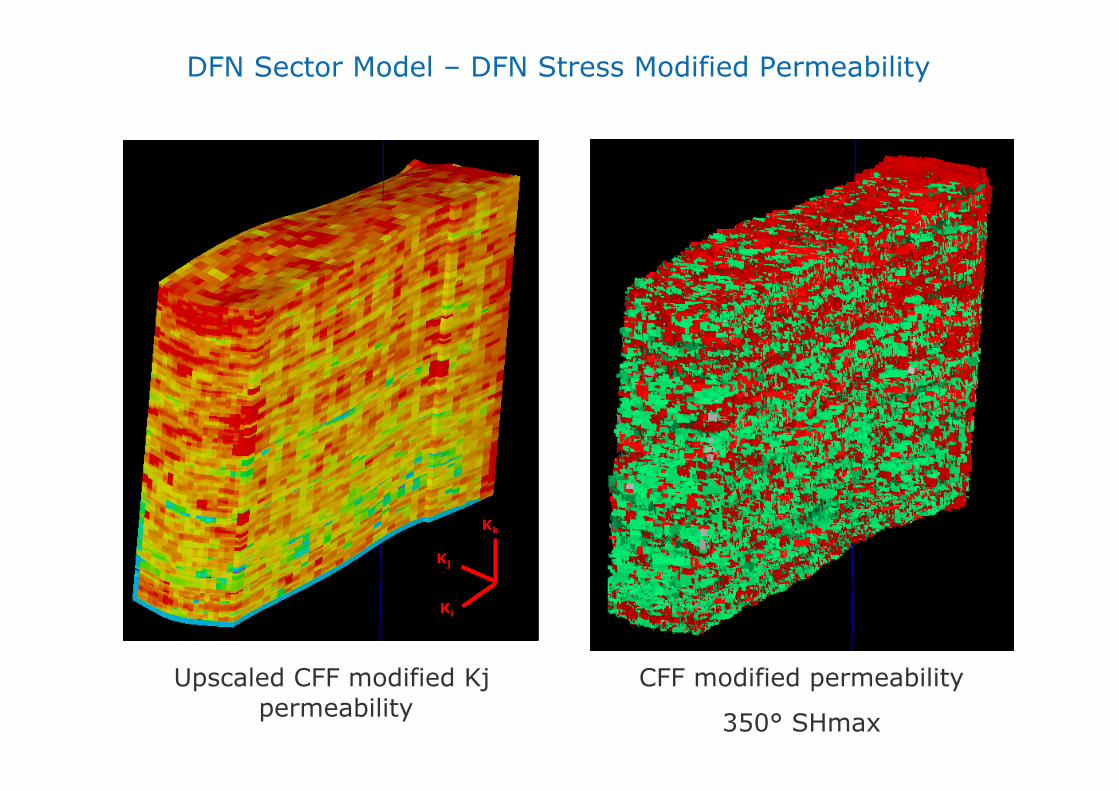
Upscaled CFF modified Kj permeability
DFN Sector Model – DFN Stress Modified Permeability
CFF modified permeability
350° SHmax
Kk
Kj
Ki

DFN Model Example – Conclusions
25° change in SHmax direction made more difference than other stress parameters (SHmax, Pp etc).
CFF values very low
Too deep in structure?
Stress magnitudes poorly constrained.
Not critically stressed…
Mainly useful for modelling scenarios. Little dynamic data to constrain options.
Some further simplified modelling warranted.
Conclusions
1. Simplified approach allows better integration of in-situ stress data into the standard reservoir modelling workflow
2. Can help define uncertainties for constraining additional data gathering or further modelling
3. Valuable screening tool prior to more advanced geomechanical modelling
4. In-situ stress parameters available as preliminary input to wellbore stability or fracture design