Simplex Infra, 19th February, 2013
11
Please refer to important disclosures at the end of this report 1 Quarterly Highlights – Standalone Y/E March ( ` cr) 3QFY13 3QFY12 2QFY13 % chg (yoy) % chg (qoq) Net sales 1,352 1,569 1,398 (13.9) (3.3) Operating profit 129 128 119 0.7 8.4 Adjusted Net profit 12 21 13 (43.8) (5.4) Source: Company, Angel Research Simplex Infrastructures (Simplex) reported slow execution and lower profitability in 3QFY2013 due to stagnant order book and delayed payments from clients. The company has an order book of ` 15,064cr (2.5x trailing revenue) as of 3QFY2013. It secured orders worth ` 1,239cr and ` 4,254cr in 3QFY2013 and 9MFY2013 respectively. Slower execution, margins ahead of our estimates: On the top-line front, the company reported a decline of 13.9% yoy to ` 1,352cr, which was 24.7% and 21% lower than our and consensus estimate. Revenue contribution from domestic and overseas operations stood at 85% and 15%, respectively, for 9MFY2013. On the operating front, the company reported an EBITDA of ` 129cr, a growth of 8.9% qoq in 3QFY2013. Adjusting for the foreign exchange MTM loss of ` 0.6cr, the EBITDA margin stood at 9.6% and was higher than our estimate of 8.7%. The company reported an adjusted PAT of ` 12cr (was below our estimate of ` 28cr) in 3QFY2013, a decline of 43.8% yoy. This was mainly due to lower-than-expected revenue growth during the quarter. Outlook and valuation: Simplex has been performing well on the revenue front since the last four consecutive quarters and has a strong order book of ` 15,064cr (2.5x trailing revenue). However the Management has earlier given a guidance of 10-15% on the revenue front for FY2013 owing to the macro challenges faced by the sector. Going forward, given the current order book mix, we estimate Simplex to report a revenue and PAT CAGR of 9% and 21% respectively over FY2012-14. We maintain our Buy rating on the stock, with a target price of ` 197 per share, valuing the company at 8x FY2014E earnings. Key financials (Consolidated) Y/E March ( ` cr) FY2011 FY2012 FY2013E FY2014E Net Sales 4,808 5,983 6,002 7,114 % chg 5.6 24.5 0.3 18.5 Adj.Net Profit 125 89 70 122 % chg (2.0) (28.2) (22.0) 74.3 EBITDA (%) 10.2 8.9 9.1 9.3 FDEPS ( ` ) 25.2 18.1 14.1 24.6 P/E (x) 6.5 9.0 11.6 6.6 P/BV (x) 0.7 0.7 0.6 0.6 RoE (%) 12.1 7.8 5.6 9.2 RoCE (%) 12.3 10.7 9.2 10.7 EV/Sales (x) 0.5 0.5 0.5 0.5 EV/EBITDA (x) 4.8 5.4 5.7 5.1 OB/Sales (x) 3.1 2.6 2.8 2.6 Order Inflows 8,024 6,561 7,728 8,570 % chg 34.1 (18.2) 17.8 10.9 Source: Compa ny, Angel Research BUY CMP ` 163 Target Price ` 197 Investment Period 12 Months Stock Info Sector Net Debt ( ` cr) 2,618 Bloomberg Code Shareholding Pattern (%) Promoters 55.0 MF / Banks / Indian Fls 21.6 FII / NRIs / OCBs 12.6 Indian Public / Others 10.8 Abs. (%) 3m 1yr 3yr Sensex 6.5 6.6 20.4 Simplex ( 14.9) ( 34.0) (62.1) 2 19,501 5,898 SINF.BO SINF@IN 806 0.7 264/160 2,823 Infrastructure Avg. Dail y Volume Market Cap ( ` cr) Beta 52 Week High / Low Face Value ( ` ) BSE Sensex Nifty Reuters Code Viral Shah 022-39357800 Ext: 6842 [email protected] Simplex Infrastructures Performance Highlights 3QFY2013 Result Update | Infrastruct ure February 18, 2013
-
Upload
angel-broking -
Category
Documents
-
view
216 -
download
0
Transcript of Simplex Infra, 19th February, 2013

7/29/2019 Simplex Infra, 19th February, 2013
http://slidepdf.com/reader/full/simplex-infra-19th-february-2013 1/10
Please refer to important disclosures at the end of this report 1
Quarterly Highlights – Standalone
Y/E March (` cr) 3QFY13 3QFY12 2QFY13 % chg (yoy) % chg (qoq)
Net sales 1,352 1,569 1,398 (13.9) (3.3)
Operating profit 129 128 119 0.7 8.4
Adjusted Net profit 12 21 13 (43.8) (5.4)
Source: Company, Angel Research
Simplex Infrastructures (Simplex) reported slow execution and lower
profitability in 3QFY2013 due to stagnant order book and delayed payments
from clients. The company has an order book of ` 15,064cr (2.5x trailing
revenue) as of 3QFY2013. It secured orders worth ` 1,239cr and ` 4,254cr in3QFY2013 and 9MFY2013 respectively.
Slower execution, margins ahead of our estimates: On the top-line front, the
company reported a decline of 13.9% yoy to ` 1,352cr, which was 24.7% and
21% lower than our and consensus estimate. Revenue contribution from domestic
and overseas operations stood at 85% and 15%, respectively, for 9MFY2013.
On the operating front, the company reported an EBITDA of ` 129cr, a growth of
8.9% qoq in 3QFY2013. Adjusting for the foreign exchange MTM loss of ` 0.6cr,
the EBITDA margin stood at 9.6% and was higher than our estimate of 8.7%. The
company reported an adjusted PAT of ` 12cr (was below our estimate of ` 28cr) in
3QFY2013, a decline of 43.8% yoy. This was mainly due to lower-than-expected
revenue growth during the quarter.
Outlook and valuation: Simplex has been performing well on the revenue front
since the last four consecutive quarters and has a strong order book of
` 15,064cr (2.5x trailing revenue). However the Management has earlier given a
guidance of 10-15% on the revenue front for FY2013 owing to the macro
challenges faced by the sector. Going forward, given the current order book mix,
we estimate Simplex to report a revenue and PAT CAGR of 9% and 21%
respectively over FY2012-14. We maintain our Buy rating on the stock, with a
target price of `197 per share, valuing the company at 8x FY2014E earnings.
Key financials (Consolidated)Y/E March (` cr) FY2011 FY2012 FY2013E FY2014E
Net Sales 4,808 5,983 6,002 7,114
% chg 5.6 24.5 0.3 18.5
Adj.Net Profit 125 89 70 122
% chg (2.0) (28.2) (22.0) 74.3
EBITDA (%) 10.2 8.9 9.1 9.3
FDEPS (`) 25.2 18.1 14.1 24.6
P/E (x) 6.5 9.0 11.6 6.6
P/BV (x) 0.7 0.7 0.6 0.6
RoE (%) 12.1 7.8 5.6 9.2
RoCE (%) 12.3 10.7 9.2 10.7
EV/Sales (x) 0.5 0.5 0.5 0.5
EV/EBITDA (x) 4.8 5.4 5.7 5.1
OB/Sales (x) 3.1 2.6 2.8 2.6
Order Inflows 8,024 6,561 7,728 8,570
% chg 34.1 (18.2) 17.8 10.9
Source: Company, Angel Research
BUYCMP ` 163
Target Price ` 197
Investment Period 12 Months
Stock Info
Sector
Net Debt ( ` cr) 2,618
Bloomberg Code
Shareholding Pattern (%)
Promoters 55.0
MF / Banks / Indian Fls 21.6
FII / NRIs / OCBs 12.6 Indian Public / Others 10.8
Abs. (%) 3m 1yr 3yr
Sensex 6.5 6.6 20.4
Simplex (14.9) (34.0) (62.1)
2
19,501
5,898
SINF.BO
SINF@IN
806
0.7
264/160
2,823
Infrastructure
Avg. Daily Volume
Market Cap ( ` cr)
Beta
52 Week High / Low
Face Value ( ` )
BSE Sensex
Nifty
Reuters Code
Viral Shah
022-39357800 Ext: 6842
Simplex Infrastructures
Performance Highlights
3QFY2013 Result Update | Infrastructure
February 18, 2013

7/29/2019 Simplex Infra, 19th February, 2013
http://slidepdf.com/reader/full/simplex-infra-19th-february-2013 2/10
Simplex Infra | 3QFY2013 Result Update
February 18, 2013 2
Exhibit 1: Quarterly performance (Standalone)
Y/E March (` cr) 3QFY13 3QFY12 2QFY13 % chg (yoy) % chg (qoq) 9MFY2013 9MFY2012 % Chg
Net Sales 1,352 1,569 1,398 (13.9) (3.3) 4,335 4,129 5.0
Total Expenditure 1,222 1,438 1,278 (15.0) (4.4) 3,932 3,751 4.8Operating Profit 130 132 119 (1.3) 8.9 402 378 6.4
OPM (%) 9.6 8.4 8.5 138 bp 103 bp 9.3 9.2 18bp
Interest 74 58 68 27.6 8.0 212 161 32.0
Depreciation 51 49 50 4.1 2.1 151 135 11.5
Non Operating Income 14 5 17 182.6 (18.4) 36 15 135.8
Nonrecurring items (1) (3) (1) (81.3) (28.2) (9) (7) 38.6
Profit Before tax 19 27 17 (30.3) 6.9 66 91 0.8
Tax 7 9 6 (16.2) 29.5 23 28 (16.8)
Net Profit before MI 11 18 12 (37.0) (3.8) 43 63 (31.6)
PAT (%) 0.8 1.2 0.8 (31)bp (0.4)bp 1.0 1.5 (53)bp
Minority Interest (MI) - - - - - - -
Net Profit after MI 12 21 13 (43.8) (5.4) 53 70 (24.9)
Adj. PAT (%) 0.9 1.4 0.9 (47bp (2)bp 1.2 1.7 (48)bp
Adj. FDEPS 2.4 4.3 2.6 (43.8) (5.4) 10.6 14.1 (24.9)
Source: Company, Angel Research
Exhibit 2: 3QFY2013 Actual vs Estimates
(` cr) Estimates Actual Variation (%)
Net Sales 1,795 1,352 (24.7)
EBITDA 156 129 (17.3)
EBITDAM (%) 8.7 9.6 86 bp
Interest and Financial Charges 69 73 5.8
Adj. PAT 28 12 (57.6)
Source: Company, Angel Research
Execution disappoints
On the top-line front, the company reported a decline of 13.9% yoy to ` 1,352cr,
which was 24.7% and 21% lower than our and consensus estimates. The muted
revenue growth was mainly on account of (a) liquidity issues faced by the clients
and (b) a slow moving order book. Revenue contribution from domestic and
overseas operations stood at 85% and 15%, respectively, for 9MFY2013.
The Management maintained its guidance for order inflows in the range of
` 6,000-7,000cr for FY2013. Based on its 9MFY2013 performance, we believe it
would be able to meet the guidance on order inflow front.

7/29/2019 Simplex Infra, 19th February, 2013
http://slidepdf.com/reader/full/simplex-infra-19th-february-2013 3/10
Simplex Infra | 3QFY2013 Result Update
February 18, 2013 3
Exhibit 3: Execution performance falters
Source: Company, Angel Research
Exhibit 4: Revenue mix (3QFY2013, %)
Source: Company, Angel Research
Slower execution and high interest cost hurts profitability
On the operating front, the company reported an EBITDA of ` 129cr, a growth of
8.9% qoq in 3QFY2013. Adjusting for the foreign exchange MTM loss of ` 0.6cr,
the EBITDA margin stood at 9.6% and was higher than our estimate of 8.7%. On
the bottom-line front, the company reported an adjusted PAT of ` 12cr (was below
our estimate of ` 28cr) in 3QFY2013, a decline of 43.8% yoy. This was mainly due
to lower-than-expected revenue growth during the quarter.
Exhibit 5: EBITDAM back on track
Source: Company, Angel Research
Exhibit 6: Slower execution hurts profitability
Source: Company, Angel Research
Order book analysis
Company secured orders worth ` 4,245cr in 9MFY2013, thus taking the order
book to ` 15,064cr (excluding L1 orders of ~ ` 1,784cr), indicating a growth of
4.3% yoy. This converts into an order book-to-sales ratio of 2.5x trailing revenues.
Going forward, we expect the domestic segment to drive revenue growth, which
constitutes 92% of the total order book.
1 , 2
3 7
1 , 3
2 2
1 , 5
6 9
1 , 7
9 6
1 , 5
8 5
1 , 3
9 8
1 , 3
5 2
5.2 22.2
34.5 31.3 28.1
5.7 (13.9)
(20.0)
(10.0)
0.0 10.0 20.0 30.0 40.0
0
500
1,000
1,500
2,000
1QFY12 2QFY12 3QFY12 4QFY12 1QFY13 2QFY13 3QFY13
Sales (` cr, LHS) Growth (yoy %, RHS)
1 2 2
1 2 5
1 2 8
1 5 6
1 5 3
1 1 9
1 2 9
9.8 9.5
8.2
8.7 9.7
8.5
9.6
0.0
2.0
4.0
6.0
8.0
10.0
12.0
0
20
40
60
80
100
120
140
160
180
1QFY12 2QFY12 3QFY12 4QFY12 1QFY13 2QFY13 3QFY13
EBITDA (`cr, LHS) EBITDAM (%, RHS)
2 5
2 4
2 1
2 6
2 8
1 3
1 2
2.0 1.8
1.4
1.4 1.8
0.9 0.9
0.0 0.5 1.0 1.5 2.0
2.5
0 5
10 15 20 25 30
1QFY12 2QFY12 3QFY12 4QFY12 1QFY13 2QFY13 3QFY13
PAT (` cr, LHS) PATM (%, RHS)

7/29/2019 Simplex Infra, 19th February, 2013
http://slidepdf.com/reader/full/simplex-infra-19th-february-2013 4/10
Februa
Exhibi
Source:
ry 18, 2013
t 7: Order i
Company, Ang
nflows – Se
l Research
ment wise (%)
Outlook
Simplex h
consecutiv
revenue).
the revenu
Based on it
to meet its
player in t
limited exp
Going forrevenue a
maintain o
valuing the
Investm
Diversifi
Simplex is
of work log
of the infraand bridg
executed ~
India and
successfully
well sprea
Qatar, Om
such as Ba
governmen
provided t
but has als
Exhi
Sourc
and valua
s been per
quarters a
owever the
front for F
s 9MFY2013
guidance o
rms of sect
osure to road
ard, given td PAT CA
our Buy ratin
company at
nt argu
d play
one of the ol
). Since ince
structure sects (1980), a
2,400 proje
broad. This
execute co
geographi
an, Dubai a
ngladesh. In
t and private
e company t
o qualified it
it 8: Order
: Company, An
ion
forming well
nd has a st
anagement
2013 owing
performanc
n the revenu
rs, geograp
BOT assets.
e current orR of 9% a
g on the sto
8x FY2014E
ent
dest infrastru
tion, the co
or, from pilind the real
cts and is cu
reflects the c
plex and nu
ally, with a
nd Abu Dha
terms of its
sector proje
he experienc
to bid for big
Simplex I
backlog –
gel Research
on the re
rong order
had earlier
to the macr
, we believe
e front. Furt
ies and clie
er book mix,nd 21% re
ock, with a t
earnings.
cture compa
pany has be
g (1924) toestate busi
rrently involv
mpany's ex
erous proje
presence in
i and is no
client profil
ts. This succ
e of executin
ger ticket-siz
nfra | 3QFY
egment wi
enue front
book ( ` 15,
given a guid
challenges
the compan
er, Simplex
t mix and,
we estimatepectively ov
target price o
nies in India
en involved i
power (1960ess (2007).
ed in >150
cution capab
cts on time.
the Middle-
venturing i
, Simplex h
essful diversif
g different a
projects goi
013 Result
se (%)
since the la
64cr; 2.5x
ance of 10-1
faced by the
would not
is a well-div
nlike its pee
Simplex to rr FY2012-1
of `197 per
(over eight d
n different se
), to roads, rThe compa
ongoing pro
ilities, and a
he company
astern coun
to newer te
s a healthy
ication has n
d complex
ng ahead.
Update
4
st four
trailing
5% on
sector.
e able
ersified
rs, has
eport a4. We
share,
ecades
gments
ailwaysny has
jects in
bility to
is also
ries of
ritories
mix of
ot only
rojects

7/29/2019 Simplex Infra, 19th February, 2013
http://slidepdf.com/reader/full/simplex-infra-19th-february-2013 5/10
Simplex Infra | 3QFY2013 Result Update
February 18, 2013 5
Exhibit 9: Recommendation summary
Company CMP TP Rating Top-line (` cr) EPS (`) P/E (x) OB/
FY12 FY13E FY14E CAGR (%) FY12 FY13E FY14E CAGR (%) FY12 FY13E FY14E Sales (x)
ABL 219 268 Buy 1,500 1,866 2,131 19.2 22.6 24.3 27.0 9.3 9.7 9.0 8.1 2.9CCCL 13 - Neutral 2,048 2,262 2,522 11.0 (0.5) 1.5 2.7 - - 8.6 4.8 2.2
IRB Infra 115 164 Buy 3,133 3,843 4,212 15.9 14.9 16.9 17.8 9.3 7.7 6.8 6.4 2.8
ITNL 197 225 Accu. 5,606 6,564 7,054 12.2 25.6 26.3 29.0 6.5 7.7 7.5 6.8 1.5
IVRCL 30 35 Buy 6,178 3,773 6,706 4.2 0.6 (3.9) 2.9 121.0 51.5 - 10.5 4.9
JP Assoc. 74 97 Buy 12,853 14,243 16,382 12.9 4.8 3.2 4.3 (5.2) 15.4 23.2 17.1 -
L&T 1,467 1,788 Buy 53,171 60,666 69,525 14.3 64.3 63.2 75.1 8.1 22.8 23.2 19.5 2.7
NCC 41 44 Accu. 5,250 5,863 6,576 11.9 1.4 3.1 4.1 71.0 29.3 13.3 10.0 3.3
Punj Lloyd 48 - Neutral 10,557 11,892 13,116 11.5 2.8 (0.4) 3.0 3.5 17.3 (112.3) 16.2 2.0
Sadbhav 115 168 Buy 2,676 2,344 2,804 2.4 9.3 7.2 8.7 (3.5) 12.3 16.0 13.2 2.9
Simplex In. 163 197 Buy 6,010 6,026 7,135 9.0 18.1 14.1 24.6 16.6 9.0 11.6 6.6 2.5
Unity Infra 36 58 Buy 1,973 2,180 2,455 11.5 14.0 12.9 14.8 3.0 2.6 2.8 2.4 2.0
Source: Company, Angel Research
Exhibit 10: SOTP breakup
Company Core Const. Real Estate Road BOT Invst. In Subsidiaries Others Total
` % to TP ` % to TP ` % to TP ` % to TP ` % to TP `
ABL 86 32 - - 182 68 - - - - 268
CCCL 16 100 - - - - - - - - 16
IRB Infra 52 32 - - 113 69 4 3 - - 164
ITNL 74 33 - - 121 54 - - 30 13 225IVRCL 14 40 - - - - 21 60 - - 35
JP Assoc. 25 26 26 27 - - - - 46 47 97
L&T 1,351 76 - - - - 437 24 - - 1,788
NCC 25 57 - - 7 16 - - 12 27 44
Punj Lloyd 64 100 - - - - - - - - 64
Sadbhav 70 41 - - 99 59 - - - - 168
Simplex In. 197 100 - - - - - - - - 197
Unity Infra 52 90 - - 6 10 - - - - 58
Source: Company, Angel Research
Company background
Simplex is one of the oldest construction companies in India, based in Kolkata.
Over the years, Simplex has diversified across various segments to encash upon
the untapped construction opportunity, and it has an excellent track record of
achieving the same. The company is present across eight segments – buildings
(25% of order book), bridges (5%), industrial (10%), marine (1%), pilling (3%),
power (23%), rail and roads (24%) and urban infrastructure (8%).
7/29/2019 Simplex Infra, 19th February, 2013
http://slidepdf.com/reader/full/simplex-infra-19th-february-2013 6/10
Simplex Infra | 3QFY2013 Result Update
February 18, 2013 6
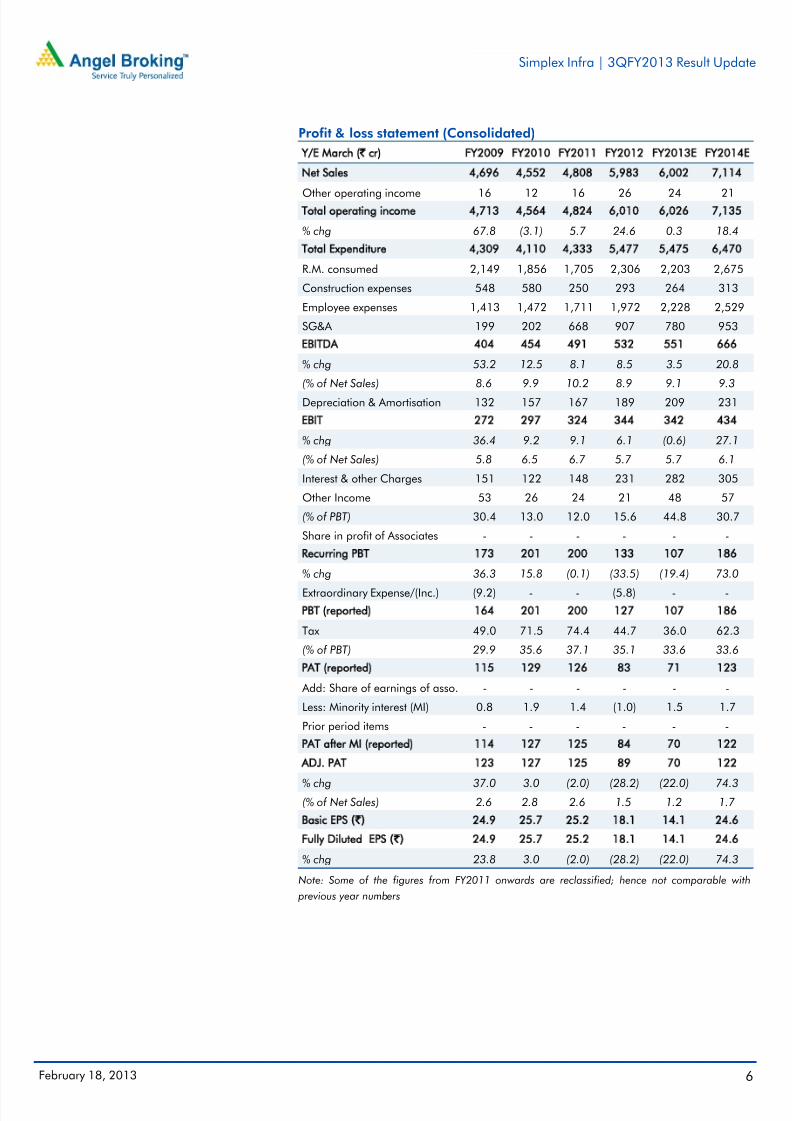
Profit & loss statement (Consolidated)
Y/E March (` cr) FY2009 FY2010 FY2011 FY2012 FY2013E FY2014E
Net Sales 4,696 4,552 4,808 5,983 6,002 7,114
Other operating income 16 12 16 26 24 21Total operating income 4,713 4,564 4,824 6,010 6,026 7,135
% chg 67.8 (3.1) 5.7 24.6 0.3 18.4
Total Expenditure 4,309 4,110 4,333 5,477 5,475 6,470
R.M. consumed 2,149 1,856 1,705 2,306 2,203 2,675
Construction expenses 548 580 250 293 264 313
Employee expenses 1,413 1,472 1,711 1,972 2,228 2,529
SG&A 199 202 668 907 780 953
EBITDA 404 454 491 532 551 666
% chg 53.2 12.5 8.1 8.5 3.5 20.8
(% of Net Sales) 8.6 9.9 10.2 8.9 9.1 9.3
Depreciation & Amortisation 132 157 167 189 209 231
EBIT 272 297 324 344 342 434
% chg 36.4 9.2 9.1 6.1 (0.6) 27.1
(% of Net Sales) 5.8 6.5 6.7 5.7 5.7 6.1
Interest & other Charges 151 122 148 231 282 305
Other Income 53 26 24 21 48 57
(% of PBT) 30.4 13.0 12.0 15.6 44.8 30.7
Share in profit of Associates - - - - - -
Recurring PBT 173 201 200 133 107 186
% chg 36.3 15.8 (0.1) (33.5) (19.4) 73.0
Extraordinary Expense/(Inc.) (9.2) - - (5.8) - -
PBT (reported) 164 201 200 127 107 186
Tax 49.0 71.5 74.4 44.7 36.0 62.3
(% of PBT) 29.9 35.6 37.1 35.1 33.6 33.6
PAT (reported) 115 129 126 83 71 123
Add: Share of earnings of asso. - - - - - -
Less: Minority interest (MI) 0.8 1.9 1.4 (1.0) 1.5 1.7
Prior period items - - - - - -
PAT after MI (reported) 114 127 125 84 70 122
ADJ. PAT 123 127 125 89 70 122
% chg 37.0 3.0 (2.0) (28.2) (22.0) 74.3(% of Net Sales) 2.6 2.8 2.6 1.5 1.2 1.7
Basic EPS (`) 24.9 25.7 25.2 18.1 14.1 24.6
Fully Diluted EPS (`) 24.9 25.7 25.2 18.1 14.1 24.6
% chg 23.8 3.0 (2.0) (28.2) (22.0) 74.3
Note: Some of the figures from FY2011 onwards are reclassified; hence not comparable with
previous year numbers
7/29/2019 Simplex Infra, 19th February, 2013
http://slidepdf.com/reader/full/simplex-infra-19th-february-2013 7/10
Simplex Infra | 3QFY2013 Result Update
February 18, 2013 7
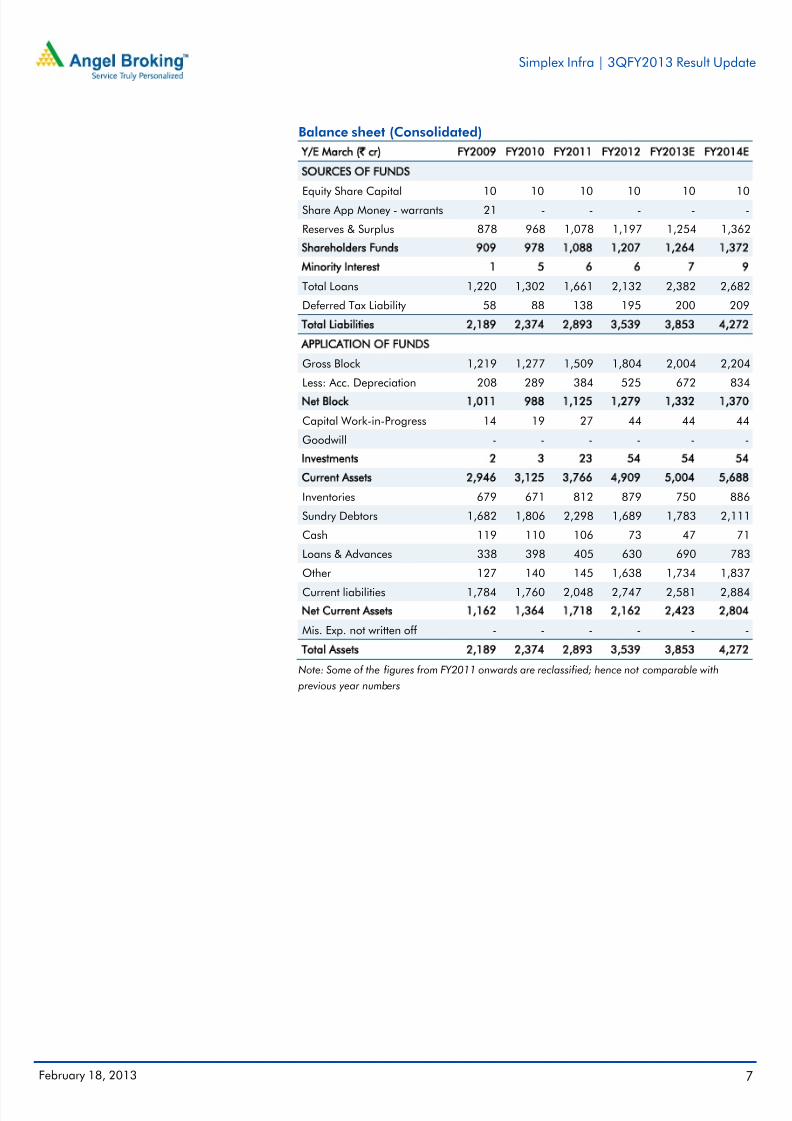
Balance sheet (Consolidated)
Y/E March (` cr) FY2009 FY2010 FY2011 FY2012 FY2013E FY2014E
SOURCES OF FUNDS
Equity Share Capital 10 10 10 10 10 10Share App Money - warrants 21 - - - - -
Reserves & Surplus 878 968 1,078 1,197 1,254 1,362
Shareholders Funds 909 978 1,088 1,207 1,264 1,372
Minority Interest 1 5 6 6 7 9
Total Loans 1,220 1,302 1,661 2,132 2,382 2,682
Deferred Tax Liability 58 88 138 195 200 209
Total Liabilities 2,189 2,374 2,893 3,539 3,853 4,272
APPLICATION OF FUNDS
Gross Block 1,219 1,277 1,509 1,804 2,004 2,204
Less: Acc. Depreciation 208 289 384 525 672 834
Net Block 1,011 988 1,125 1,279 1,332 1,370
Capital Work-in-Progress 14 19 27 44 44 44
Goodwill - - - - - -
Investments 2 3 23 54 54 54
Current Assets 2,946 3,125 3,766 4,909 5,004 5,688
Inventories 679 671 812 879 750 886
Sundry Debtors 1,682 1,806 2,298 1,689 1,783 2,111
Cash 119 110 106 73 47 71
Loans & Advances 338 398 405 630 690 783
Other 127 140 145 1,638 1,734 1,837
Current liabilities 1,784 1,760 2,048 2,747 2,581 2,884
Net Current Assets 1,162 1,364 1,718 2,162 2,423 2,804
Mis. Exp. not written off - - - - - -
Total Assets 2,189 2,374 2,893 3,539 3,853 4,272
Note: Some of the figures from FY2011 onwards are reclassified; hence not comparable with
previous year numbers
7/29/2019 Simplex Infra, 19th February, 2013
http://slidepdf.com/reader/full/simplex-infra-19th-february-2013 8/10
Simplex Infra | 3QFY2013 Result Update
February 18, 2013 8
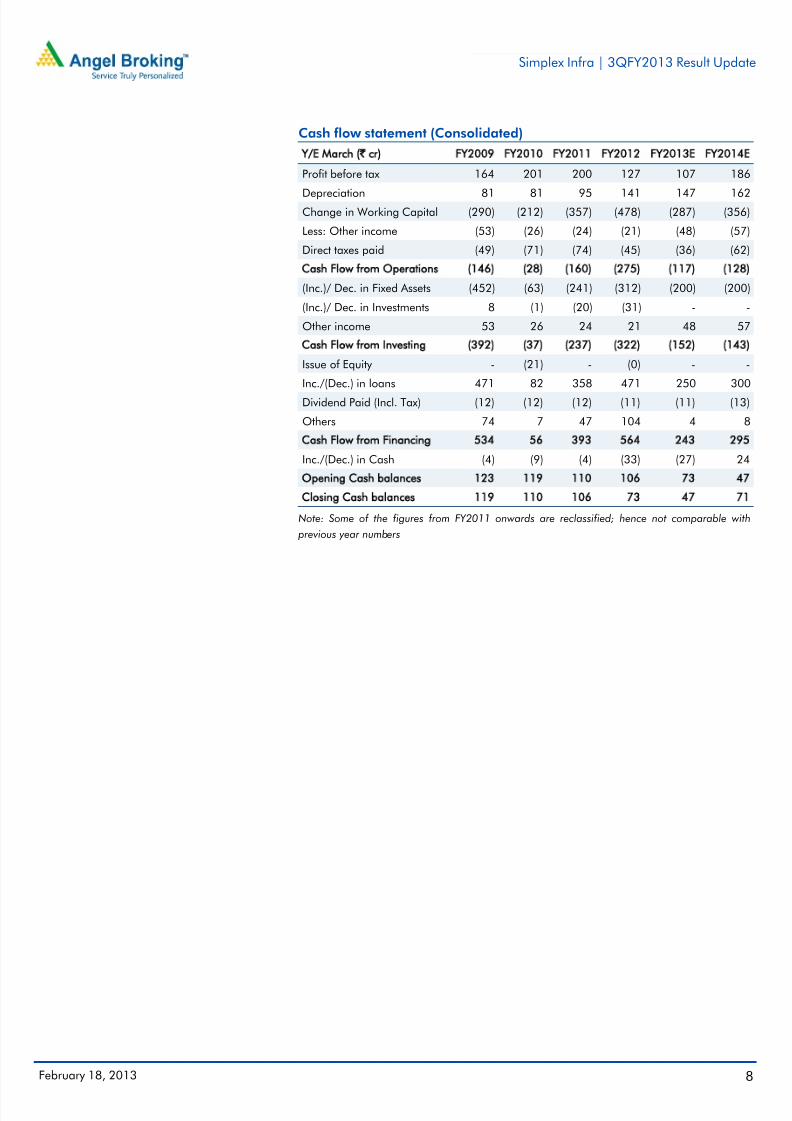
Cash flow statement (Consolidated)
Y/E March (` cr) FY2009 FY2010 FY2011 FY2012 FY2013E FY2014E
Profit before tax 164 201 200 127 107 186
Depreciation 81 81 95 141 147 162Change in Working Capital (290) (212) (357) (478) (287) (356)
Less: Other income (53) (26) (24) (21) (48) (57)
Direct taxes paid (49) (71) (74) (45) (36) (62)
Cash Flow from Operations (146) (28) (160) (275) (117) (128)
(Inc.)/ Dec. in Fixed Assets (452) (63) (241) (312) (200) (200)
(Inc.)/ Dec. in Investments 8 (1) (20) (31) - -
Other income 53 26 24 21 48 57
Cash Flow from Investing (392) (37) (237) (322) (152) (143)
Issue of Equity - (21) - (0) - -
Inc./(Dec.) in loans 471 82 358 471 250 300
Dividend Paid (Incl. Tax) (12) (12) (12) (11) (11) (13)
Others 74 7 47 104 4 8
Cash Flow from Financing 534 56 393 564 243 295
Inc./(Dec.) in Cash (4) (9) (4) (33) (27) 24
Opening Cash balances 123 119 110 106 73 47
Closing Cash balances 119 110 106 73 47 71
Note: Some of the figures from FY2011 onwards are reclassified; hence not comparable with
previous year numbers
7/29/2019 Simplex Infra, 19th February, 2013
http://slidepdf.com/reader/full/simplex-infra-19th-february-2013 9/10
Simplex Infra | 3QFY2013 Result Update
February 18, 2013 9
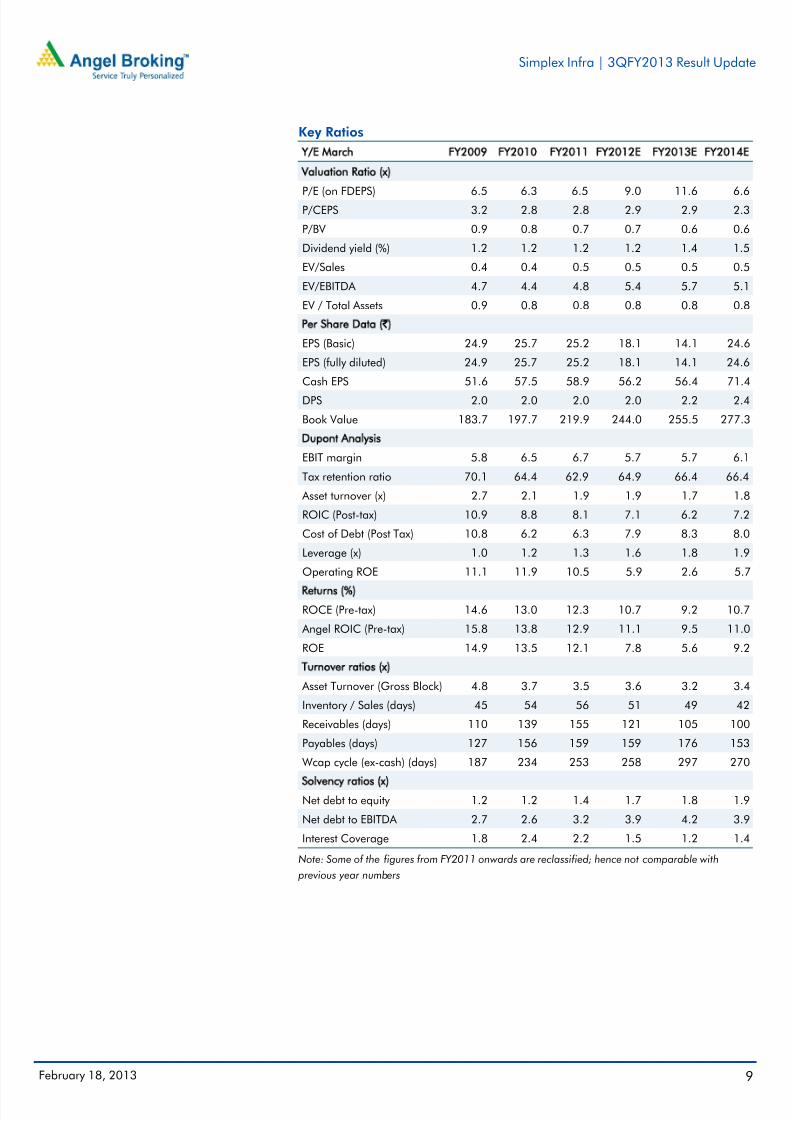
Key Ratios
Y/E March FY2009 FY2010 FY2011 FY2012E FY2013E FY2014E
Valuation Ratio (x)
P/E (on FDEPS) 6.5 6.3 6.5 9.0 11.6 6.6P/CEPS 3.2 2.8 2.8 2.9 2.9 2.3
P/BV 0.9 0.8 0.7 0.7 0.6 0.6
Dividend yield (%) 1.2 1.2 1.2 1.2 1.4 1.5
EV/Sales 0.4 0.4 0.5 0.5 0.5 0.5
EV/EBITDA 4.7 4.4 4.8 5.4 5.7 5.1
EV / Total Assets 0.9 0.8 0.8 0.8 0.8 0.8
Per Share Data (`)
EPS (Basic) 24.9 25.7 25.2 18.1 14.1 24.6
EPS (fully diluted) 24.9 25.7 25.2 18.1 14.1 24.6
Cash EPS 51.6 57.5 58.9 56.2 56.4 71.4
DPS 2.0 2.0 2.0 2.0 2.2 2.4
Book Value 183.7 197.7 219.9 244.0 255.5 277.3
Dupont Analysis
EBIT margin 5.8 6.5 6.7 5.7 5.7 6.1
Tax retention ratio 70.1 64.4 62.9 64.9 66.4 66.4
Asset turnover (x) 2.7 2.1 1.9 1.9 1.7 1.8
ROIC (Post-tax) 10.9 8.8 8.1 7.1 6.2 7.2
Cost of Debt (Post Tax) 10.8 6.2 6.3 7.9 8.3 8.0
Leverage (x) 1.0 1.2 1.3 1.6 1.8 1.9
Operating ROE 11.1 11.9 10.5 5.9 2.6 5.7
Returns (%)
ROCE (Pre-tax) 14.6 13.0 12.3 10.7 9.2 10.7
Angel ROIC (Pre-tax) 15.8 13.8 12.9 11.1 9.5 11.0
ROE 14.9 13.5 12.1 7.8 5.6 9.2
Turnover ratios (x)
Asset Turnover (Gross Block) 4.8 3.7 3.5 3.6 3.2 3.4
Inventory / Sales (days) 45 54 56 51 49 42
Receivables (days) 110 139 155 121 105 100
Payables (days) 127 156 159 159 176 153
Wcap cycle (ex-cash) (days) 187 234 253 258 297 270
Solvency ratios (x)Net debt to equity 1.2 1.2 1.4 1.7 1.8 1.9
Net debt to EBITDA 2.7 2.6 3.2 3.9 4.2 3.9
Interest Coverage 1.8 2.4 2.2 1.5 1.2 1.4
Note: Some of the figures from FY2011 onwards are reclassified; hence not comparable with
previous year numbers

7/29/2019 Simplex Infra, 19th February, 2013
http://slidepdf.com/reader/full/simplex-infra-19th-february-2013 10/10
Simplex Infra | 3QFY2013 Result Update
February 18, 2013 10
Research Team Tel: 022 - 39357800 E-mail: [email protected] Website: www.angelbroking.com
DISCLAIMER
This document is solely for the personal information of the recipient, and must not be singularly used as the basis of any investment
decision. Nothing in this document should be construed as investment or financial advice. Each recipient of this document should makesuch investigations as they deem necessary to arrive at an independent evaluation of an investment in the securities of the companies
referred to in this document (including the merits and risks involved), and should consult their own advisors to determine the merits and
risks of such an investment.
Angel Broking Limited, its affiliates, directors, its proprietary trading and investment businesses may, from time to time, make
investment decisions that are inconsistent with or contradictory to the recommendations expressed herein. The views contained in this
document are those of the analyst, and the company may or may not subscribe to all the views expressed within.
Reports based on technical and derivative analysis center on studying charts of a stock's price movement, outstanding positions and
trading volume, as opposed to focusing on a company's fundamentals and, as such, may not match with a report on a company's
fundamentals.
The information in this document has been printed on the basis of publicly available information, internal data and other reliablesources believed to be true, but we do not represent that it is accurate or complete and it should not be relied on as such, as thisdocument is for general guidance only. Angel Broking Limited or any of its affiliates/ group companies shall not be in any way responsible for any loss or damage that may arise to any person from any inadvertent error in the information contained in this report .
Angel Broking Limited has not independently verified all the information contained within this document. Accordingly, we cannot testify,nor make any representation or warranty, express or implied, to the accuracy, contents or data contained within this document. While Angel Broking Limited endeavours to update on a reasonable basis the information discussed in this material, there may be regulatory,compliance, or other reasons that prevent us from doing so.
This document is being supplied to you solely for your information, and its contents, information or data may not be reproduced,
redistributed or passed on, directly or indirectly.
Angel Broking Limited and its affiliates may seek to provide or have engaged in providing corporate finance, investment banking or
other advisory services in a merger or specific transaction to the companies referred to in this report, as on the date of this report or in
the past.
Neither Angel Broking Limited, nor its directors, employees or affiliates shall be liable for any loss or damage that may arise from or in
connection with the use of this information.
Note: Please refer to the important `Stock Holding Disclosure' report on the Angel website (Research Section). Also, pleaserefer to the latest update on respective stocks for the disclosure status in respect of those stocks. Angel Broking Limited andits affiliates may have investment positions in the stocks recommended in this report.
Disclosure of Interest Statement Simplex Infra
1. Analyst ownership of the stock No
2. Angel and its Group companies ownership of the stock No
3. Angel and its Group companies' Directors ownership of the stock No
4. Broking relationship with company covered No
Note: We have not considered any Exposure below ` 1 lakh for Angel, its Group companies and Directors.
Ratings (Returns): Buy (> 15%) Accumulate (5% to 15%) Neutral (-5 to 5%)Reduce (-5% to -15%) Sell (< -15%)

![Simplex Infra - Corporate Presentation- Q3FY16 · Title: Simplex Infra - Corporate Presentation- Q3FY16 [Compatibility Mode] Author: Naresh Created Date: 2/15/2016 2:07:54 PM Keywords](https://static.fdocuments.in/doc/165x107/5ffd821165694272c37702a5/simplex-infra-corporate-presentation-q3fy16-title-simplex-infra-corporate.jpg)