SILT MONITORING VIA ULTRASONIC SIGNAL ANALYSIS · SILT MONITORING VIA ULTRASONIC SIGNAL ANALYSIS...
13
IGHEM-2010, Oct. 21-23, 2010, AHEC, IIT Roorkee, India 104 SILT MONITORING VIA ULTRASONIC SIGNAL ANALYSIS Bruno Lüscher Scintilla Bosch AG Luterbachstr. 10 CH - 4528 Zuchwil, Switzerland [email protected] Peter Gruber Lucerne University of Applied Sciences and Arts Technikumstr. 21, CH-6048, Horw, Switzerland & Rittmeyer Ltd , CH - 6340 Baar, Switzerland [email protected] ABSTRACT A monitoring procedure based upon ultrasonic signal analysis is presented which allows estimating the particle concentration under certain conditions. The multi path Acoustic Discharge Measurement method (ADM) can be used not only for flow measurement but also for monitoring purposes. The suspensions sound speed and the attenuation can be measured and derived from the transit time measurements. These quantities can be recorded on-line over long intervals with the new generation of flow meters. Other characteristics of the ultrasonic pulses can also be extracted by signal analysis with the potential to gather additional information on particles in the water. The particle parameters are concentration, size respectively size distribution, shape, density and particle sound speed. Operating parameters affecting the measurable quantities suspension sound speed and attenuation are the sensor frequency, pressure and temperature. A suitable physical model is presented for the frequency range and particle concentration range of interest. This model gives the dependency of the suspension sound speed and the attenuation on the above parameters. Material properties of silt are known and the shape of the particles must be assumed as spherical or elliptical. The remaining crucial particle parameter is the particle size. For a given particle size measurements confirm a linear relationship between the attenuation in Neper per meter and particle concentration. The suspension sound speed however can hardly be used, as the sensitivity of the suspension sound speed to particle concentration variation is too small compared to other operating parameters as e.g. the temperature. As the linear relationship for a given particle size could be verified by measurements, a simple calibration method with selected water probes can be used. Several path arrangements will also be discussed for an improvement of the method. Information on first test sites are reported. 1. MEASUREMENT OF SUSPENDED PARTICLES The total amount of suspended solids in water can be measured in the field by high precision continuous pressure difference measurement, which allows determination of the density of the flow. In the laboratory the total amount of suspended solids can be determined by evaporating samples and weighing the solid material content [ISO 2591, ISO 4365, ISO 9276]. The sizes of clay and small silt particles prevailing in the flow cannot be determined by sieving, since the smallest mesh size of commercially available sieves is about 40 μm. In laboratories sedimentation techniques are used. The sedimentation rate of the particles is measured and their diameter calculated from the semi-empirical equation known as Stokes’ Law. For continuous monitoring of the suspended particle concentration and particle size range, however, sedimentation techniques are not suitable. Two optical techniques are used for monitoring: optical backscatter and optical transmission. The backscatter method uses infrared or visible light directed into a sample volume and photodiodes to measure the scattered light. In the optical transmission method the sensor is located opposite the light source and measures the attenuation of light intensity. These turbidimeters need to be calibrated and the calibration unfortunately varies with particle size and color. The units of turbidity form calibrated instruments are called Nephelometric Turbidity Units (NTU). Acoustic techniques use the backscatter or forward scatter of pulsed acoustic bursts. In backscattering techniques, the intensity of the backscattered signal depends on the concentration, particle
Transcript of SILT MONITORING VIA ULTRASONIC SIGNAL ANALYSIS · SILT MONITORING VIA ULTRASONIC SIGNAL ANALYSIS...

IGHEM-2010, Oct. 21-23, 2010, AHEC, IIT Roorkee, India
104
SILT MONITORING VIA ULTRASONIC SIGNAL ANALYSIS
Bruno Lüscher Scintilla Bosch AG
Luterbachstr. 10 CH - 4528 Zuchwil, Switzerland [email protected]
Peter Gruber
Lucerne University of Applied Sciences and Arts Technikumstr. 21, CH-6048, Horw, Switzerland &
Rittmeyer Ltd , CH - 6340 Baar, Switzerland [email protected]
ABSTRACT
A monitoring procedure based upon ultrasonic signal analysis is presented which allows estimating the particle concentration under certain conditions. The multi path Acoustic Discharge Measurement method (ADM) can be used not only for flow measurement but also for monitoring purposes. The suspensions sound speed and the attenuation can be measured and derived from the transit time measurements. These quantities can be recorded on-line over long intervals with the new generation of flow meters. Other characteristics of the ultrasonic pulses can also be extracted by signal analysis with the potential to gather additional information on particles in the water. The particle parameters are concentration, size respectively size distribution, shape, density and particle sound speed. Operating parameters affecting the measurable quantities suspension sound speed and attenuation are the sensor frequency, pressure and temperature. A suitable physical model is presented for the frequency range and particle concentration range of interest. This model gives the dependency of the suspension sound speed and the attenuation on the above parameters. Material properties of silt are known and the shape of the particles must be assumed as spherical or elliptical. The remaining crucial particle parameter is the particle size. For a given particle size measurements confirm a linear relationship between the attenuation in Neper per meter and particle concentration. The suspension sound speed however can hardly be used, as the sensitivity of the suspension sound speed to particle concentration variation is too small compared to other operating parameters as e.g. the temperature. As the linear relationship for a given particle size could be verified by measurements, a simple calibration method with selected water probes can be used.
Several path arrangements will also be discussed for an improvement of the method. Information on first test sites are reported. 1. MEASUREMENT OF SUSPENDED PARTICLES
The total amount of suspended solids in water can be measured in the field by high precision continuous pressure difference measurement, which allows determination of the density of the flow. In the laboratory the total amount of suspended solids can be determined by evaporating samples and weighing the solid material content [ISO 2591, ISO 4365, ISO 9276].
The sizes of clay and small silt particles prevailing in the flow cannot be determined by sieving, since the smallest mesh size of commercially available sieves is about 40 µm. In laboratories sedimentation techniques are used. The sedimentation rate of the particles is measured and their diameter calculated from the semi-empirical equation known as Stokes’ Law. For continuous monitoring of the suspended particle concentration and particle size range, however, sedimentation techniques are not suitable.
Two optical techniques are used for monitoring: optical backscatter and optical transmission. The backscatter method uses infrared or visible light directed into a sample volume and photodiodes to measure the scattered light. In the optical transmission method the sensor is located opposite the light source and measures the attenuation of light intensity. These turbidimeters need to be calibrated and the calibration unfortunately varies with particle size and color. The units of turbidity form calibrated instruments are called Nephelometric Turbidity Units (NTU).
Acoustic techniques use the backscatter or forward scatter of pulsed acoustic bursts. In backscattering techniques, the intensity of the backscattered signal depends on the concentration, particle

IGHEM-2010, Oct. 21-23, 2010, AHEC, IIT Roorkee, India
105
size, and frequency. By using multiple frequencies both particle size and distribution can be determined [Thorne et al. 2002]. On the other hand forward scattering that is used in transit time (time of flight) acoustic discharge measurement methods, can be used indirectly to estimate particle concentration and particle size [McClements 2002]. Here too with multiple frequencies more informa-tion can be retrieved from the forward scattered signals. The frequencies must however be far enough apart from each another (e.g. factor 5).
Currently the best, but also most expensive, method is the laser diffraction method. Here a laser beam is directed into the sample volume, where the suspended particles scatter, absorb, and reflect the beam. Light blockage produces a diffraction pattern that overrides the light intensity in the original direction. This diffraction pattern is received by an array of detectors. The diffraction pattern is weaker and wider for small particles, but tall and narrow for large particles. The width helps determining particle size while the magnitude gives evidence of concentration [Agrawal, Pottsmith 2000].
2. ULTRASONIC METHODS
In two phase suspension systems like silt/water mixtures ultrasonic signal characteristics can be used to obtain information about the concentration and size distribution of suspended particles. The advantages of the acoustic methods compared to other sediment measurement methods are:
- non-intrusive measurement - rapid measurement - works under optically opaque conditions
On the other hand the limitations of the method are:
- concentration of particles must lie in the range of 1g/l up to 50g/l - particle radius must lie between 10nm and 1mm - air bubbles disturb the measurements heavily
Typically, in hydro power stations the particle concentration covers a wide range. Small
concentrations of less than 0.1g/l provide ideal conditions for the transit time method. However, in highly loaded rivers silt content may reach 10g/l or even higher concentrations. Cases of silt concentration up to 100g/l have been reported. Such concentrations have a detrimental effect (abrasion) on the turbines. Generally it is recommendable to shut down the turbines to prevent damage if particle concentration is higher than 5g/l. The silt particle size that is dangerous for the machines in material is often in the range where the acoustic methods work.
The scatter of acoustic signals at individual particles in motion is widely known and described in literature [e.g. Dukhin, Goetz, 2002]. Theoretical approaches for describing forward and back scattering are available. Statistical methods are needed in order to describe scatter with a large particle number.
Theoretical models for determining the wave propagation speed and the attenuation of the sound wave as a function of particle concentration and size are derived from the interaction of the incoming sound wave with the particles (forward and backward scattering, absorption) [Kytöma 1995, Hipp, Storti, Morbidelli, 2001/2002]. These models can be simplified by classification of different wavelength regimes dependent on the particle size (radius r) and the wavelength λ of the incoming sound wave:
Fig. 1: Identification of three simplified wavelength regimes Long Wavelength Regime LWR
r < 0.05 λ
r < 74μm
Intermediate Wavelength Regime IWR
0.05 λ < r < 50 λ
74 μm < r < 74mm
Short Wavelength Regime SWR
50 λ < r
r > 74mm
Particle in water (20°C), frequency 1MHz

IGHEM-2010, Oct. 21-23, 2010, AHEC, IIT Roorkee, India
106
Figure 2 displays the boundaries of the three regimes in double logarithmic scales. In the applications covered in this study, the frequency lies between 200 kHz and 2 MHz and the particles radius between 0.5 m and 500m. This means that the long wavelength (LWR) models apply for most of the relevant cases.
Fig. 2 Application range of simplified wavelength regimes (Diagram applies to solids in water at 20°C) Classification of grain size according to the Wentworth scale
The reflected backward scattered wave effects which can be obtained in the echo mode for the time of flight and Doppler methods are not part of the investigation. In the LWR regime visco-inertial and thermal effects dominate while in the SWR regime the scattering effect is dominant. In the intermediate IWR regime all effects play a role. For this regime the most complex models must be applied. To gain information about the particle parameters concentration and size, two approaches have been chosen:
1) empirical signal analysis of the forward scattered acoustic pulses 2) use of physical models for attenuation and sound speed in suspension
3. ACOUSTIC DISCHARGE MEASUREMENT
The multipath acoustic discharge measurement (ADM) based on the time of flight method is a well established method for accurate discharge measurement, especially for large closed conduits and rectangular channels. On each path the time of flight of acoustic signals travelling in forward and backward direction are determined from which the averaged axial path velocities Naxax vv ,1, ,..., are calculated.
Fig. 3: Measurement section of a 4 path and two planes ADM for circular and rectangular sections
Figure 3 shows typical 2x4-path applications in two planes for a closed conduit of circular or
rectangular cross section. The two planes allow compensation of cross flows effects in the measurement section. The resulting flow rate Q is given by Q= (QA + QB)/2.
Averaged axial velocities Naxax vv ,1, ,..., are measured on each of the acoustic paths. These path
velocities are influenced by local flow disturbances and possible cross flow in the measuring section. The volume flux in the entire cross section is estimated by averaging and weighting dependent on the integration method the individual path readings. The theoretical achievable accuracy of this flow measuring method increases in most cases with larger pipe diameters, higher velocities and a higher number of paths.
0.1
1
10
100
1000
0.1 1 10 100 1000
Radius [μm]
Freq
uenc
y [M
Hz]
classificationof grain size(Wentworth scale)
LWR
IWR
SWR
Application range
clay silt sandcolloid
Li
IGHEM-2010, Oct. 21-23, 2010, AHEC, IIT Roorkee, India
107
The method allows to measure at a high rate not only the flow velocities of each path but also the suspension sound speed c and the attenuation of the acoustic pulses in both directions at various locations easily. Paths that are arranged at different heights reveal information of concentration of particles, if present, of different sizes due to the tendency that larger particles tend to be transported at a lower height. The acoustic signal that is used is characterized basically by its frequency (500kHz or 1MHz are typical frequencies), power (amplitude) and its duration. The duration can be parame-terized by its number of bursts. Next to c and the signal shape and the frequency content can also be analysed. Normally the ADM systems operate with a single frequency only.
4. EMPIRICAL CHARACTERISTICS FROM STATISTICAL SIGNAL ANALYSIS
As many signal pairs are available per second, extended statistical analysis can be done on various signal parameters as:
• histogram, mean and standard deviation of amplitude maxima • histogram, mean and standard deviation of time of occurrence of amplitude maxima (time of
flight) and difference of forward-backward time of flights • frequency content • mean and standard deviation of amplitude spectrum per frequency • total power (e.g. in the 0-2.5MHz band for 1 MHz ultrasonic frequency) • shape of averaged spectrum • shape of standard deviation of amplitudes per frequency
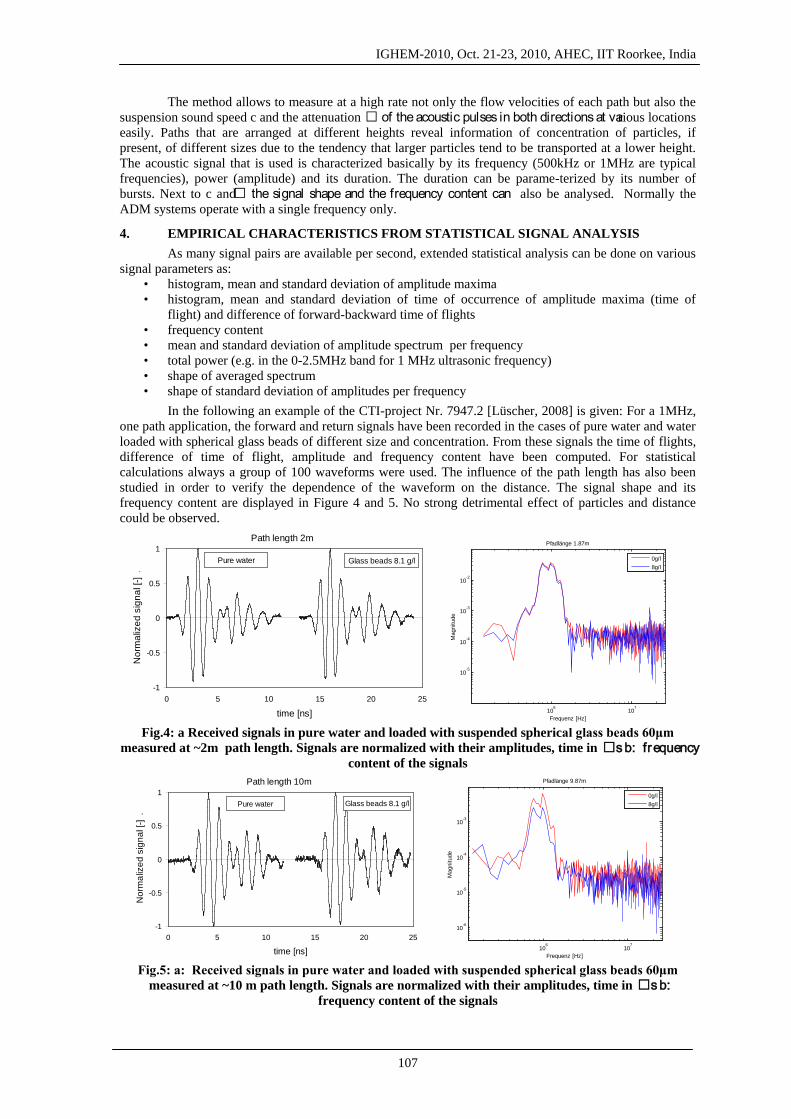
In the following an example of the CTI-project Nr. 7947.2 [Lüscher, 2008] is given: For a 1MHz, one path application, the forward and return signals have been recorded in the cases of pure water and water loaded with spherical glass beads of different size and concentration. From these signals the time of flights, difference of time of flight, amplitude and frequency content have been computed. For statistical calculations always a group of 100 waveforms were used. The influence of the path length has also been studied in order to verify the dependence of the waveform on the distance. The signal shape and its frequency content are displayed in Figure 4 and 5. No strong detrimental effect of particles and distance could be observed.
Path length 2m
-1
-0.5
0
0.5
1
0 5 10 15 20 25
time [ns]
Nor
mal
ized
sig
nal [
-] .
Glass beads 8.1 g/lPure water
106
107
10-5
10-4
10-3
10-2
Pfadlänge 1.87m
Mag
nitu
de
Frequenz [Hz]
0g/l8g/l
Fig.4: a Received signals in pure water and loaded with suspended spherical glass beads 60μm
measured at ~2m path length. Signals are normalized with their amplitudes, time in s b: frequency content of the signals
Path length 10m
-1
-0.5
0
0.5
1
0 5 10 15 20 25
time [ns]
Nor
mal
ized
sig
nal [
-] .
Glass beads 8.1 g/lPure water
10
610
7
10-6
10-5
10-4
10-3
Pfadlänge 9.87m
Mag
nitu
de
Frequenz [Hz]
0g/l8g/l
Fig.5: a: Received signals in pure water and loaded with suspended spherical glass beads 60μm
measured at ~10 m path length. Signals are normalized with their amplitudes, time in s b: frequency content of the signals
IGHEM-2010, Oct. 21-23, 2010, AHEC, IIT Roorkee, India
108
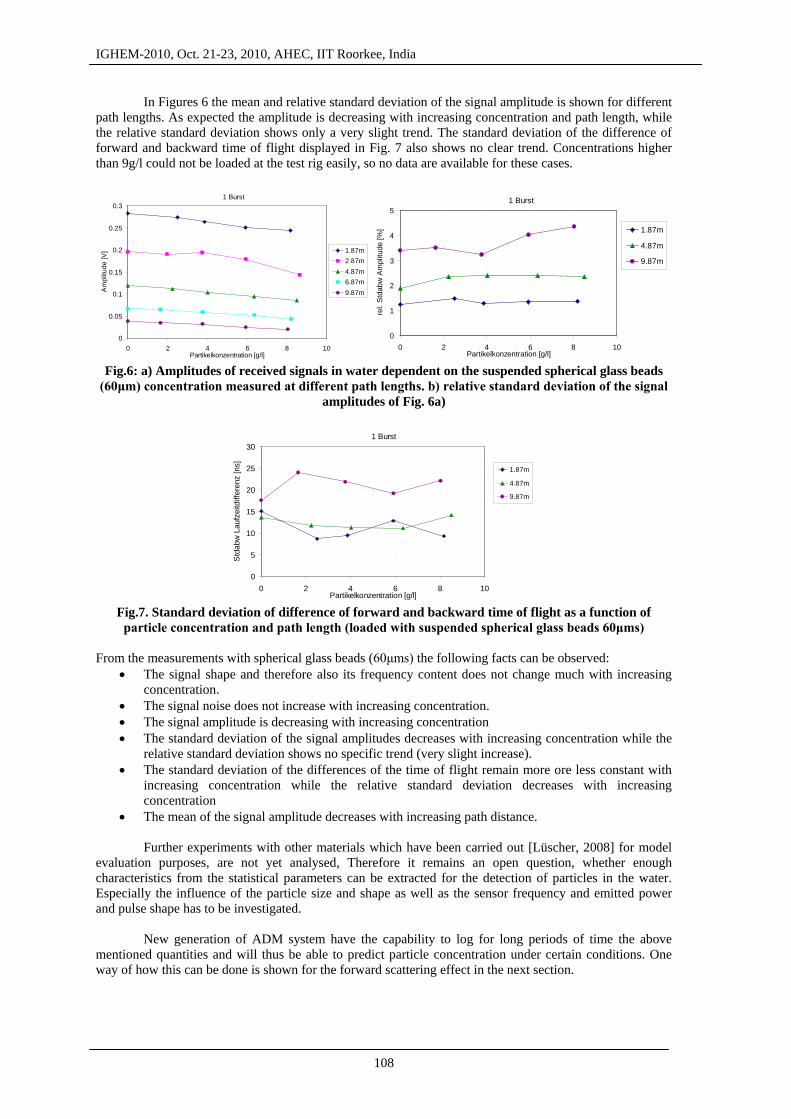
In Figures 6 the mean and relative standard deviation of the signal amplitude is shown for different path lengths. As expected the amplitude is decreasing with increasing concentration and path length, while the relative standard deviation shows only a very slight trend. The standard deviation of the difference of forward and backward time of flight displayed in Fig. 7 also shows no clear trend. Concentrations higher than 9g/l could not be loaded at the test rig easily, so no data are available for these cases.
1 Burst
0
0.05
0.1
0.15
0.2
0.25
0.3
0 2 4 6 8 10Partikelkonzentration [g/l]
Am
plitu
de [V
] 1.87m2.87m4.87m6.87m9.87m
1 Burst
0
1
2
3
4
5
0 2 4 6 8 10Partikelkonzentration [g/l]
rel.
Std
abw
Am
plitu
de [%
] 1.87m
4.87m
9.87m
Fig.6: a) Amplitudes of received signals in water dependent on the suspended spherical glass beads
(60μm) concentration measured at different path lengths. b) relative standard deviation of the signal amplitudes of Fig. 6a)
1 Burst
0
5
10
15
20
25
30
0 2 4 6 8 10Partikelkonzentration [g/l]
Std
abw
Lau
fzei
tdiff
eren
z [n
s]
1.87m
4.87m
9.87m
Fig.7. Standard deviation of difference of forward and backward time of flight as a function of
particle concentration and path length (loaded with suspended spherical glass beads 60μms) From the measurements with spherical glass beads (60μms) the following facts can be observed:
• The signal shape and therefore also its frequency content does not change much with increasing concentration.
• The signal noise does not increase with increasing concentration. • The signal amplitude is decreasing with increasing concentration • The standard deviation of the signal amplitudes decreases with increasing concentration while the
relative standard deviation shows no specific trend (very slight increase). • The standard deviation of the differences of the time of flight remain more ore less constant with
increasing concentration while the relative standard deviation decreases with increasing concentration
• The mean of the signal amplitude decreases with increasing path distance.
Further experiments with other materials which have been carried out [Lüscher, 2008] for model evaluation purposes, are not yet analysed, Therefore it remains an open question, whether enough characteristics from the statistical parameters can be extracted for the detection of particles in the water. Especially the influence of the particle size and shape as well as the sensor frequency and emitted power and pulse shape has to be investigated.
New generation of ADM system have the capability to log for long periods of time the above mentioned quantities and will thus be able to predict particle concentration under certain conditions. One way of how this can be done is shown for the forward scattering effect in the next section.

IGHEM-2010, Oct. 21-23, 2010, AHEC, IIT Roorkee, India
109
5. CHARACTERISTICS FROM PHYSICAL MODELLING OF TWO PHASE SYSTEMS: ATKINSON-KYTÖMAA (AK) MODEL
The suspension sound speed and the attenuation of sound in suspensions can be modelled with
different grades of complexity. The first useful model for the attenuation and speed of sound in suspensions in the LWR regime was developed by Urick [Urick, 1948]. Here a more sophisticated model is presented which can be applied not only for the LWR regime but also to the lower IWR regime [Atkinson & Kytömaa, 1992] . This model needs of course more model parameters but is well suited for the application range (see Fig.2). The model incorporates visco-inertial effects on a particle surrounded by liquid if the particle is excited under periodic pressure wave. The model provides linearized periodic solutions for pressure, concentration as well as the velocities and densities of the liquid and the solid phases The model evaluation and validation was also carried out during the KTI project Nr 7947.2 [Costa, Storti & al, 2007] ,[Lüscher, 2008]. There exist even more complicated models like the ECAH model named after their creators [Epstein and Carhart, 1953] and [Allegra and Hawley, 1972], which covers a greater range taking all major physical effects acoustic wave interaction with one particle into account. For the SWR there exist also models based on resonant scattering theory [Farhan, 1951].
The parameters needed for the Atkinson-Kytömaa model for suspension sound speed and sound attenuation are listed in the following Table 1. Table 1: parameters needed for the AK-model (highlighted are the important one for this study) If we restrict ourselves to one type of particle material (silt), we can concentrate us on the highlighted parameters. water silt operating parameters temperature T pressure p sensor frequency f power ( pulse shape) number of burst site material parameters density l=w s sound velocity (bulk modulus K=c2
cl=cw cs
attenuation l=w s dynamic viscosity particle site parameters particle size r or d (r<75 m for 1MHz)
(r<150 m for 500kHz) (r<375 m for 200kHz)
particle size distribution monodisperse, polydisperse
particle concentration ϕ (<0.05% or <125g/l) for silt particle shape sphere, spheroidal, ? 5.1 Suspension Sound Speed C
a) operating parameters:
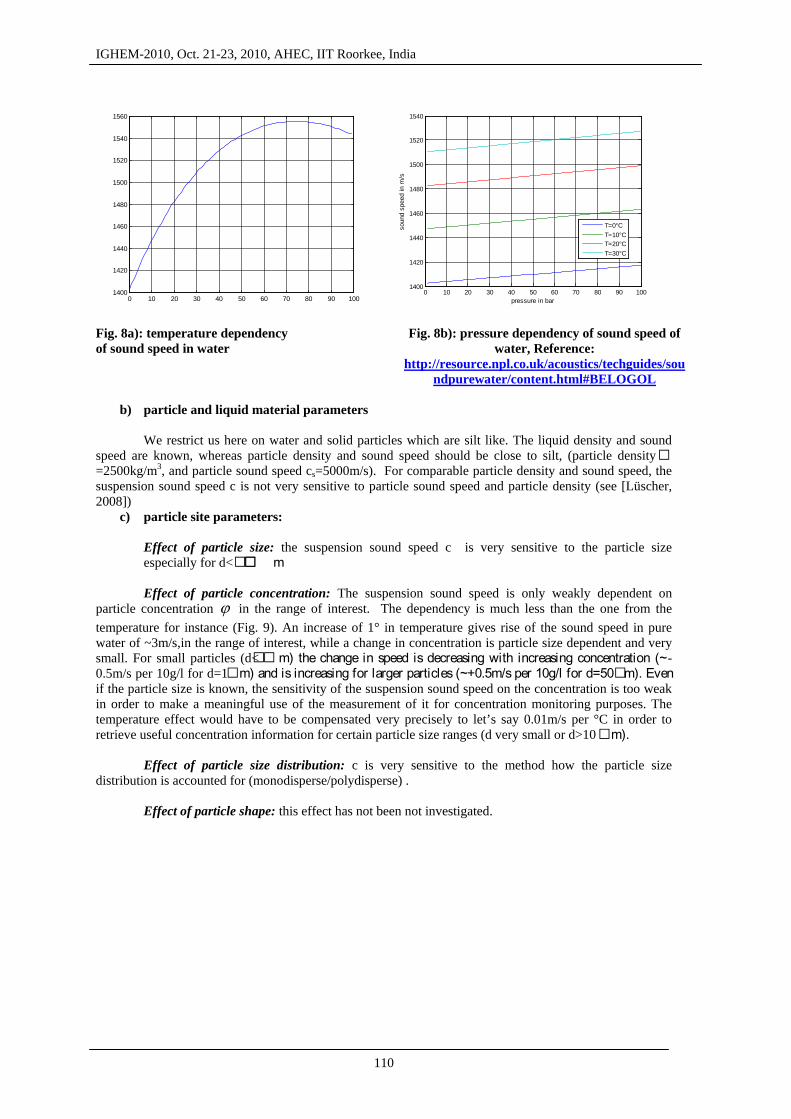
Effect of frequency: The suspension sound speed is independent on the emitted frequency for the particle range of interest. Effect of temperature: The effect is not negligible, see Fig. 8a), must be compensated , Effect of pressure: The effect is small, see Fig. 8b),
IGHEM-2010, Oct. 21-23, 2010, AHEC, IIT Roorkee, India
110
Fig. 8a): temperature dependency of sound speed in water
Fig. 8b): pressure dependency of sound speed of water, Reference:
http://resource.npl.co.uk/acoustics/techguides/soundpurewater/content.html#BELOGOL
b) particle and liquid material parameters
We restrict us here on water and solid particles which are silt like. The liquid density and sound
speed are known, whereas particle density and sound speed should be close to silt, (particle density =2500kg/m3, and particle sound speed cs=5000m/s). For comparable particle density and sound speed, the suspension sound speed c is not very sensitive to particle sound speed and particle density (see [Lüscher, 2008])
c) particle site parameters:
Effect of particle size: the suspension sound speed c is very sensitive to the particle size especially for d< m Effect of particle concentration: The suspension sound speed is only weakly dependent on
particle concentration ϕ in the range of interest. The dependency is much less than the one from the temperature for instance (Fig. 9). An increase of 1° in temperature gives rise of the sound speed in pure water of ~3m/s,in the range of interest, while a change in concentration is particle size dependent and very small. For small particles (d< m) the change in speed is decreasing with increasing concentration (~-0.5m/s per 10g/l for d=1m) and is increasing for larger particles (~+0.5m/s per 10g/l for d=50m). Even if the particle size is known, the sensitivity of the suspension sound speed on the concentration is too weak in order to make a meaningful use of the measurement of it for concentration monitoring purposes. The temperature effect would have to be compensated very precisely to let’s say 0.01m/s per °C in order to retrieve useful concentration information for certain particle size ranges (d very small or d>10 m).
Effect of particle size distribution: c is very sensitive to the method how the particle size distribution is accounted for (monodisperse/polydisperse) .
Effect of particle shape: this effect has not been not investigated.
0 10 20 30 40 50 60 70 80 90 1001400
1420
1440
1460
1480
1500
1520
1540
1560
0 10 20 30 40 50 60 70 80 90 1001400
1420
1440
1460
1480
1500
1520
1540
pressure in bar
soun
d sp
eed
in m
/s
T=0°CT=10°CT=20°CT=30°C
IGHEM-2010, Oct. 21-23, 2010, AHEC, IIT Roorkee, India
111
0 20 40 60 80 100 120 1401476
1478
1480
1482
1484
1486
1488
1490
1492
1494
1496suspension sound velocity (Kytomaa)
concentration in g/l
soun
d ve
loci
ty (m
/s)
d=1umd=2umd=5umd=10umd=20umd=30umd=50umd=70umd=100d=150um
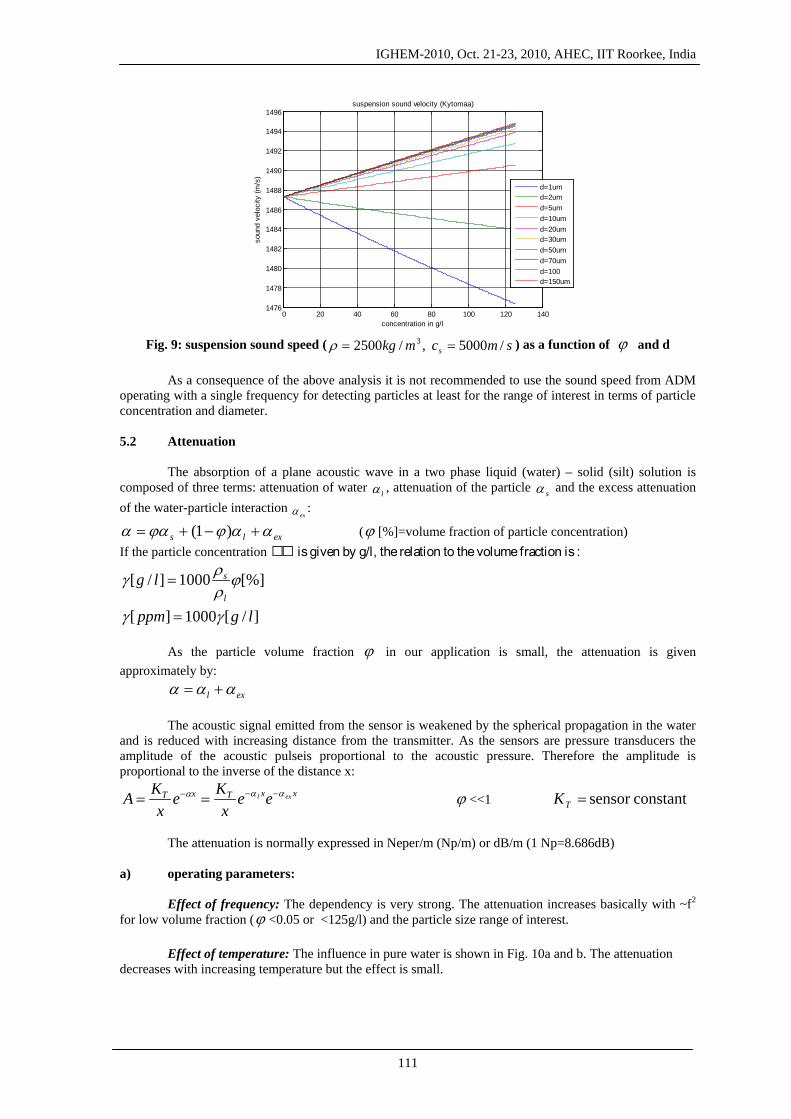
Fig. 9: suspension sound speed ( smcmkg s /5000 ,/2500 3 ==ρ ) as a function of ϕ and d
As a consequence of the above analysis it is not recommended to use the sound speed from ADM
operating with a single frequency for detecting particles at least for the range of interest in terms of particle concentration and diameter. 5.2 Attenuation
The absorption of a plane acoustic wave in a two phase liquid (water) – solid (silt) solution is composed of three terms: attenuation of water lα , attenuation of the particle sα and the excess attenuation of the water-particle interaction
exα :
exls ααϕϕαα +−+= )1( (ϕ [%]=volume fraction of particle concentration) If the particle concentration is given by g/l, the relation to the volume fraction is :
]/[1000][
[%]1000]/[
lgppm
lgl
s
γγ
ϕρργ
=
=
As the particle volume fraction ϕ in our application is small, the attenuation is given
approximately by:
exl ααα +=
The acoustic signal emitted from the sensor is weakened by the spherical propagation in the water and is reduced with increasing distance from the transmitter. As the sensors are pressure transducers the amplitude of the acoustic pulseis proportional to the acoustic pressure. Therefore the amplitude is proportional to the inverse of the distance x:
xxTxT exl eex
Kex
KA ααα −−− == ϕ <<1 constantsensor =TK
The attenuation is normally expressed in Neper/m (Np/m) or dB/m (1 Np=8.686dB)
a) operating parameters:
Effect of frequency: The dependency is very strong. The attenuation increases basically with ~f2 for low volume fraction (ϕ <0.05 or <125g/l) and the particle size range of interest.
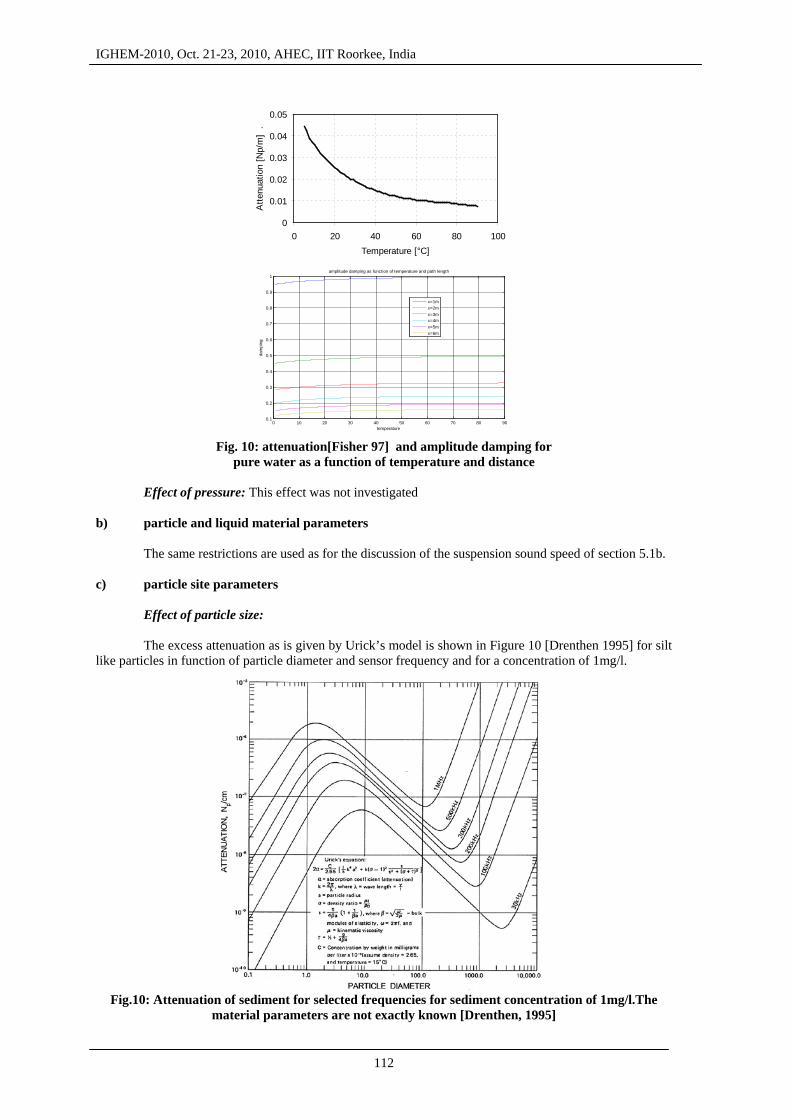
Effect of temperature: The influence in pure water is shown in Fig. 10a and b. The attenuation decreases with increasing temperature but the effect is small.
IGHEM-2010, Oct. 21-23, 2010, AHEC, IIT Roorkee, India
112
0
0.01
0.02
0.03
0.04
0.05
0 20 40 60 80 100Temperature [°C]
Atte
nuat
ion
[Np/
m]
.
0 10 20 30 40 50 60 70 80 900.1
0.2
0.3
0.4
0.5
0.6
0.7
0.8
0.9
1
temperature
dam
ping
amplitude damping as function of temperature and path length
x=1mx=2mx=3mx=4mx=5mx=6m
Fig. 10: attenuation[Fisher 97] and amplitude damping for
pure water as a function of temperature and distance
Effect of pressure: This effect was not investigated
b) particle and liquid material parameters The same restrictions are used as for the discussion of the suspension sound speed of section 5.1b.
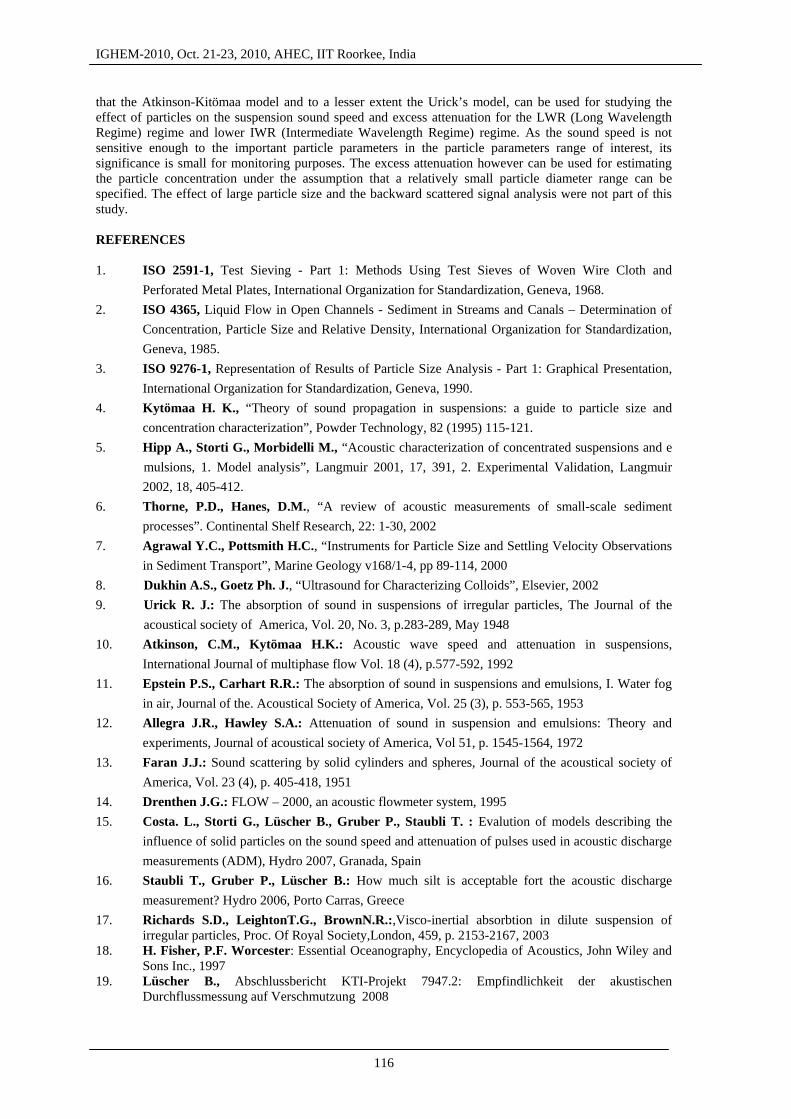
c) particle site parameters Effect of particle size: The excess attenuation as is given by Urick’s model is shown in Figure 10 [Drenthen 1995] for silt
like particles in function of particle diameter and sensor frequency and for a concentration of 1mg/l.
Fig.10: Attenuation of sediment for selected frequencies for sediment concentration of 1mg/l.The
material parameters are not exactly known [Drenthen, 1995]

IGHEM-2010, Oct. 21-23, 2010, AHEC, IIT Roorkee, India
113
Comparisons have been done [Lüscher 2008] between the Urick’s and the Atkinson-Kytömaa model. The agreement in the low diameter range is good, while for diameters larger than 100 m the Urick’s model overestimates the attenua-tion. It can be seen that for small particle diameter (<1m) the attenuation increases ~d2, for intermediate particles (1m < d < 150m) the effect is proportional to ~1/d, while for large particle the dependency is increasing again ~d3. Figure 11 show the comparison for 1MHz and for a particle concentration of 20g/l where the largest deviation between the two models could be found.
10-1
100
101
102
103
0
0.5
1
1.5
2
2.5
3
3.5
4
Partikeldurchmesser [um]
α [N
p/m
]
10-1
100
101
102
-2
0
2
4
6
8
Partikeldurchmesser [um]
( αur
- α
kyt )
/ αky
t ) [%
]
KytomaaUrick
Fig. 11: excess attenuation ( smcmkg s /5000 ,/2500 3 ==ρ ) for 1Mhz and a concentration of
20g/l as function of particle diameter in m, left: Ur ick’s and Kitömaa model, r ight: difference between the two models in [%] in the diameter range [0.5 - 70 m]
Effect of particle concentration:
For our range of interest the dependency of the attenuation on concentration is almost linear. Only for very small diameters (<2m) a small nonlinear behaviour can be observed (see Fig. 12).
0 20 40 60 80 100 120 1400
2
4
6
8
10
12
14
16
18
20excess attenuation in Np/m
concentration in g/l
exce
ss a
ttenu
atio
n in
Np/
m
d=1umd=2umd=5umd=10umd=20umd=30umd=50umd=70umd=100d=150um
Fig. 12: excess attenuation ( smcmkg s /5000 ,/2500 3 ==ρ ) as a function of concentration for
different particle diameters for a 1MHzsensor frequency Effect of particle shape: If spheroidal particles are used instead of spherical ones [Richards & al., 2003], no large effect has been observed. For very irregular shapes no investigations have been made.

IGHEM-2010, Oct. 21-23, 2010, AHEC, IIT Roorkee, India
114
Effect of particle size distribution:
The size distribution has a large effect on the attenuation because the attenuation is so heavily dependent on the diameter. The question that has to be answered is how the attenuation is obtained from the size distribution. The naïve way of calculating from the volume distribution an average size and then using this diameter in a mono disperse model cannot be used because of the ~d3 relationship between size and volume. For small concentration as in this application the following approach can be used: For each diameter of the size distribution the attenuation is computed and added to obtain a total attenuation. Then an average diameter is chosen which leads to the same attenuation. This average diameter can then be used in the mono disperse models (AK-model, Urick’s model). This approach has been chosen in this investigation. Another approach would be to use a poly disperse model which incorporates the different particle size effect already into the physical effects directly which will result in a single attenuation. 6. SILT MONITORING
17
PhysicalMeasurement
Processdescribed by
ΑΚmodel
InverseAK
model
concentration
diameterbulk modulus(sound speed)
density
shape
temperature pressure sensor frequency
attenuation
Particleparameters:
Assumed particle parameters:densitydiametershape (fixed)bulk modulus or particle sound speed
Operating conditions:
concentration
AK model for monitoring purposes
suspensionsound speed(not used)
Measurement process
Monitoring processWater probe
Figure 13: AK model for monitoring purposes. Measured attenuation ex is post processed in an inverse AK model. Particle diameter is an assumed input, concentration an output of this process.
Figure 13 shows the principle way how the Atkinson-Kitömaa model can be used for monitoring
purpose. As only the attenuation is used the significance of the result is limited. For given particle parameters diameter, sound speed, density and shape a concentration can be obtained. Figure 14 shows how sensitive the particle concentration estimates is on a wrong diameter or density. While the density has nearly no effect on the estimate, the difference between actual and assumed diameter affects the particle concentration estimate considerably. This sensitivity is such that a difference in diameter of 20% results in ~20% misjudgement of the actual particle concentration. Figure 15 shows again this fact in another way. For a measured attenuation there exist infinitely many combinations of diameter and concentration. All these combinations lie approximately on straight lines. Their slopes indicate the above described sensitivity.

IGHEM-2010, Oct. 21-23, 2010, AHEC, IIT Roorkee, India
115
0
2
4
6
8
10
12
14
16
18P
artic
le c
once
ntra
tion
m [g
/l] .
ReferenceConcentrationMonitoring
40microns
60microns
70microns
50microns
30microns
0
2
4
6
8
10
12
14
Parti
cle
conc
entra
tion
[g/l]
.
ReferenceConcentrationMonitoring
2400kg/m3 2500kg/m3
2600kg/m3 2700kg/m3
Figure 14: Monitoring of the particle concentration for large particles (dref = 50 μm) using different
particle diameters on the left and particle densities (ρref = 2500kg/m3) on the right.
0 50 100 1500
20
40
60
80
100
120
140concentration as a function of diameter for given excess attenuation (Kytomaa)
diameter in micrometer
conc
entra
tion
in g
/l
alpha_ex=0.1alpha_ex=0.15alpha_ex=0.2alpha_ex=0.25alpha_ex=0.3alpha_ex=0.35alpha_ex=0.4alpha_ex=0.45alpha_ex=0.5
Figure 15: pairs of diameter (d< m) – concentration
(<125g/l) leading to the same excess attenuation
An alternative way can be chosen if water probes can be taken at the site. At least two probes should be taken which are wide apart in terms of concentration. Under the assumption of constant particle parameters a linear relationship between attenuation and particle concentration can be established without applying the AK-model. The model however confirms the linear relationship. 7. TEST SITE
Two test sites have been chosen to gain experience with this kind of monitoring, one in the Austrian and one in the Swiss Alps. Both locations experience high concentration of silt at irregular intervals and duration during the summer months. One system is running during the summer 2010 while the other will be in operation in 2011. At both locations the newest generation of ADM measurement equipment with logging capabilities is used. Beside the signal amplitudes for several path signals the temperature (sound speed) of each path is also logged. Other particle measurement devices will also be installed running in parallel to the acoustic measurement. Water probes will be taken additionally. CONCLUSION
Two philosophies have been presented in this study that address the problem of finding a relationships between particle parameters and acoustic signal parameters in acoustic time of flight (ADM) measurement systems. The first method examines empirically the impact that particles have on the statistical properties of the acoustic pulses. This approach has only been applied for spherical particles and has not shown the desired results. An extension on real silt concentration with arbitrary shapes is foreseen. The second method applies a physical model describing the influence of the particles. It has been shown
IGHEM-2010, Oct. 21-23, 2010, AHEC, IIT Roorkee, India
116
that the Atkinson-Kitömaa model and to a lesser extent the Urick’s model, can be used for studying the effect of particles on the suspension sound speed and excess attenuation for the LWR (Long Wavelength Regime) regime and lower IWR (Intermediate Wavelength Regime) regime. As the sound speed is not sensitive enough to the important particle parameters in the particle parameters range of interest, its significance is small for monitoring purposes. The excess attenuation however can be used for estimating the particle concentration under the assumption that a relatively small particle diameter range can be specified. The effect of large particle size and the backward scattered signal analysis were not part of this study. REFERENCES 1. ISO 2591-1, Test Sieving - Part 1: Methods Using Test Sieves of Woven Wire Cloth and
Perforated Metal Plates, International Organization for Standardization, Geneva, 1968. 2. ISO 4365, Liquid Flow in Open Channels - Sediment in Streams and Canals – Determination of
Concentration, Particle Size and Relative Density, International Organization for Standardization, Geneva, 1985.
3. ISO 9276-1, Representation of Results of Particle Size Analysis - Part 1: Graphical Presentation, International Organization for Standardization, Geneva, 1990.
4. Kytömaa H. K., “Theory of sound propagation in suspensions: a guide to particle size and concentration characterization”, Powder Technology, 82 (1995) 115-121.
5. Hipp A., Storti G., Morbidelli M., “Acoustic characterization of concentrated suspensions and e mulsions, 1. Model analysis”, Langmuir 2001, 17, 391, 2. Experimental Validation, Langmuir 2002, 18, 405-412.
6. Thorne, P.D., Hanes, D.M., “A review of acoustic measurements of small-scale sediment processes”. Continental Shelf Research, 22: 1-30, 2002
7. Agrawal Y.C., Pottsmith H.C., “Instruments for Particle Size and Settling Velocity Observations in Sediment Transport”, Marine Geology v168/1-4, pp 89-114, 2000
8. Dukhin A.S., Goetz Ph. J., “Ultrasound for Characterizing Colloids”, Elsevier, 2002 9. Urick R. J.: The absorption of sound in suspensions of irregular particles, The Journal of the
acoustical society of America, Vol. 20, No. 3, p.283-289, May 1948 10. Atkinson, C.M., Kytömaa H.K.: Acoustic wave speed and attenuation in suspensions,
International Journal of multiphase flow Vol. 18 (4), p.577-592, 1992 11. Epstein P.S., Carhart R.R.: The absorption of sound in suspensions and emulsions, I. Water fog
in air, Journal of the. Acoustical Society of America, Vol. 25 (3), p. 553-565, 1953 12. Allegra J.R., Hawley S.A.: Attenuation of sound in suspension and emulsions: Theory and
experiments, Journal of acoustical society of America, Vol 51, p. 1545-1564, 1972 13. Faran J.J.: Sound scattering by solid cylinders and spheres, Journal of the acoustical society of
America, Vol. 23 (4), p. 405-418, 1951 14. Drenthen J.G.: FLOW – 2000, an acoustic flowmeter system, 1995 15. Costa. L., Storti G., Lüscher B., Gruber P., Staubli T. : Evalution of models describing the
influence of solid particles on the sound speed and attenuation of pulses used in acoustic discharge measurements (ADM), Hydro 2007, Granada, Spain
16. Staubli T., Gruber P., Lüscher B.: How much silt is acceptable fort the acoustic discharge measurement? Hydro 2006, Porto Carras, Greece
17. Richards S.D., LeightonT.G., BrownN.R.:,Visco-inertial absorbtion in dilute suspension of irregular particles, Proc. Of Royal Society,London, 459, p. 2153-2167, 2003
18. H. Fisher, P.F. Worcester: Essential Oceanography, Encyclopedia of Acoustics, John Wiley and Sons Inc., 1997
19. Lüscher B., Abschlussbericht KTI-Projekt 7947.2: Empfindlichkeit der akustischen Durchflussmessung auf Verschmutzung 2008