Silicon Valley Clean Water
616
New Issue: Book-Entry Only Ratings: Standard & Poor’s “AA” Moody’s “Aa2” (See “CONCLUDING INFORMATION – Ratings) In the opinion of Jones Hall, A Professional Law Corporation, San Francisco, California, Bond Counsel, subject, however to certain qualifications described herein, under existing law, the interest on the 2018 Bonds is excluded from gross income for federal income tax purposes and such interest is not an item of tax preference for purposes of the federal alternative minimum tax; although, in the case of tax years beginning prior to January 1, 2018, for the purpose of computing the alternative minimum tax imposed on certain corporations, such interest earned by a corporation prior to the end of its tax year in 2018 is taken into account in determining certain income and earnings. In the further opinion of Bond Counsel, such interest is exempt from California personal income taxes. See “CONCLUDING INFORMATION – Tax Matters.” $140,955,000 SILICON VALLEY CLEAN WATER (San Mateo County, California) 2018 Wastewater Revenue Bonds Due: August 1, as shown on the inside cover Dated: Date of Delivery The Authority: Silicon Valley Clean Water (formerly named the South Bayside System Authority) (the “Authority”) is a joint exercise of powers authority established to provide wastewater transmission, treatment, and effluent disposal for the cities of Belmont, Redwood City, and San Carlos, and the West Bay Sanitary District (collectively, the “Members”). Purpose: The captioned bonds (the “2018 Bonds”) are being issued to (i) finance the acquisition and construction of capital improvements to the Authority’s wastewater system and (ii) pay costs of issuing the 2018 Bonds. Book-Entry; Denominations; Payment Dates: The 2018 Bonds will bear interest at the rates shown on the inside cover, payable semiannually on February 1 and August 1 of each year, commencing on August 1, 2018, and will be issued in fully registered form without coupons in the denomination of $5,000 or any integral multiple of $5,000. The 2018 Bonds will be issued in book-entry only form, initially registered in the name of Cede & Co., as nominee of The Depository Trust Company, New York, New York (“DTC”). Purchasers of the 2018 Bonds will not receive certificates representing their interests in the 2018 Bonds. Payments of the principal of, premium, if any, and interest on the 2018 Bonds will be made by to DTC, which is obligated in turn to remit such principal, premium, if any, and interest to its DTC Participants for subsequent disbursement to the beneficial owners of the 2018 Bonds. See “THE 2018 BONDS.” “Record Date” for the 2018 Bonds is defined in the Indenture of Trust dated as of February 1, 2018 (the “Indenture”), between the Authority and ZB, National Association dba Zions Bank, as trustee (the “Trustee”) as the 15th calendar day of the month immediately preceding such Interest Payment Date, whether or not such day is a Business Day. Security: The 2018 Bonds are limited obligations of the Authority, which are payable solely from and secured solely by the Revenues pledged under the Indenture, consisting primarily of payments made by the City of Redwood City, the City of San Carlos, and the West Bay Sanitary District (the “Participating Members”) under individual Financing Agreements between the Authority and each of the Participating Members. The 2018 Bonds do not constitute an indebtedness of the Authority, the Participating Members, the State of California or any political subdivision or agency thereof within the meaning of any constitutional or statutory provisions. Neither the faith and credit nor the taxing power of the State of California, nor any political corporation or subdivision or agency thereof, nor the faith and credit of the Authority or the Participating Members, is pledged to the payment of the principal of or interest on the 2018 Bonds. The Participating Members’ obligations under their respective Financing Agreements are secured by a pledge of Net Revenues derived from the respective wastewater systems of the Participating Members. The Participating Members executed and delivered these or similar Financing Agreements in connection with issuance by the Authority of its (i) $55,855,000 initial principal amount 2009 Wastewater Revenue Bonds (the “2009 Bonds”), (ii) $60,000,000 initial principal amount of 2014 Wastewater Revenue Bonds (the “2014 Bonds”) and (iii) $70,200,000 initial principal amount of 2015 Wastewater Revenue Bonds (the “2015 Bonds”). Under the Financing Agreements, each Participating Member’s obligation with respect to the 2009 Bonds, the 2014 Bonds, the 2015 Bonds, and its obligation with respect to the 2018 Bonds is payable on a parity basis from Net Revenues of the Participating Member’s wastewater collection system. In addition, the Participating Members are authorized to incur additional obligations payable from Net Revenues on a parity basis with their obligations under the Financing Agreements. The Authority is not funding a debt service reserve account for the 2018 Bonds. Redemption: The 2018 Bonds are subject to optional and mandatory sinking fund redemption prior to their stated date of maturity. MATURITY SCHEDULE (see inside cover) The Bonds were sold and awarded pursuant to competitive bidding processes held on February 8, 2018, as set forth in the Official Notice of Sale with respect to the 2018 Bonds. The 2018 Bonds are offered when, as and if issued, subject to the approval as to their legality by Jones Hall, A Professional Law Corporation, San Francisco, California, Bond Counsel. Certain legal matters also will be passed upon for the Authority by Jones Hall, A Professional Law Corporation, San Francisco, California, as Disclosure Counsel. It is anticipated that the 2018 Bonds in definitive form will be available for delivery to Cede & Co., as nominee of DTC, on or about February 22, 2018. Dated: February 8, 2018
Transcript of Silicon Valley Clean Water

New Issue: Book-Entry Only Ratings: Standard & Poor’s “AA”Moody’s “Aa2”
(See “CONCLUDING INFORMATION – Ratings)
In the opinion of Jones Hall, A Professional Law Corporation, San Francisco, California, Bond Counsel, subject, however to certain qualifications described herein, under existing law, the interest on the 2018 Bonds is excluded from gross income for federal income tax purposes and such interest is not an item of tax preference for purposes of the federal alternative minimum tax; although, in the case of tax years beginning prior to January 1, 2018, for the purpose of computing the alternative minimum tax imposed on certain corporations, such interest earned by a corporation prior to the end of its tax year in 2018 is taken into account in determining certain income and earnings. In the further opinion of Bond Counsel, such interest is exempt from California personal income taxes. See “CONCLUDING INFORMATION – Tax Matters.”
$140,955,000SIlIcON VAllEy clEAN WAtER
(San Mateo county, california)2018 Wastewater Revenue Bonds
Due: August 1, as shown on the inside cover Dated: Date of Delivery
the Authority: Silicon Valley Clean Water (formerly named the South Bayside System Authority) (the “Authority”) is a joint exercise of powers authority established to provide wastewater transmission, treatment, and effluent disposal for the cities of Belmont, Redwood City, and San Carlos, and the West Bay Sanitary District (collectively, the “Members”).
Purpose: The captioned bonds (the “2018 Bonds”) are being issued to (i) finance the acquisition and construction of capital improvements to the Authority’s wastewater system and (ii) pay costs of issuing the 2018 Bonds.
Book-Entry; Denominations; Payment Dates: The 2018 Bonds will bear interest at the rates shown on the inside cover, payable semiannually on February 1 and August 1 of each year, commencing on August 1, 2018, and will be issued in fully registered form without coupons in the denomination of $5,000 or any integral multiple of $5,000. The 2018 Bonds will be issued in book-entry only form, initially registered in the name of Cede & Co., as nominee of The Depository Trust Company, New York, New York (“DTC”). Purchasers of the 2018 Bonds will not receive certificates representing their interests in the 2018 Bonds. Payments of the principal of, premium, if any, and interest on the 2018 Bonds will be made by to DTC, which is obligated in turn to remit such principal, premium, if any, and interest to its DTC Participants for subsequent disbursement to the beneficial owners of the 2018 Bonds. See “THE 2018 BONDS.”
“Record Date” for the 2018 Bonds is defined in the Indenture of Trust dated as of February 1, 2018 (the “Indenture”), between the Authority and ZB, National Association dba Zions Bank, as trustee (the “Trustee”) as the 15th calendar day of the month immediately preceding such Interest Payment Date, whether or not such day is a Business Day.
Security: The 2018 Bonds are limited obligations of the Authority, which are payable solely from and secured solely by the Revenues pledged under the Indenture, consisting primarily of payments made by the City of Redwood City, the City of San Carlos, and the West Bay Sanitary District (the “Participating Members”) under individual Financing Agreements between the Authority and each of the Participating Members. The 2018 Bonds do not constitute an indebtedness of the Authority, the Participating Members, the State of California or any political subdivision or agency thereof within the meaning of any constitutional or statutory provisions. Neither the faith and credit nor the taxing power of the State of California, nor any political corporation or subdivision or agency thereof, nor the faith and credit of the Authority or the Participating Members, is pledged to the payment of the principal of or interest on the 2018 Bonds.
The Participating Members’ obligations under their respective Financing Agreements are secured by a pledge of Net Revenues derived from the respective wastewater systems of the Participating Members. The Participating Members executed and delivered these or similar Financing Agreements in connection with issuance by the Authority of its (i) $55,855,000 initial principal amount 2009 Wastewater Revenue Bonds (the “2009 Bonds”), (ii) $60,000,000 initial principal amount of 2014 Wastewater Revenue Bonds (the “2014 Bonds”) and (iii) $70,200,000 initial principal amount of 2015 Wastewater Revenue Bonds (the “2015 Bonds”). Under the Financing Agreements, each Participating Member’s obligation with respect to the 2009 Bonds, the 2014 Bonds, the 2015 Bonds, and its obligation with respect to the 2018 Bonds is payable on a parity basis from Net Revenues of the Participating Member’s wastewater collection system. In addition, the Participating Members are authorized to incur additional obligations payable from Net Revenues on a parity basis with their obligations under the Financing Agreements.
The Authority is not funding a debt service reserve account for the 2018 Bonds.
Redemption: The 2018 Bonds are subject to optional and mandatory sinking fund redemption prior to their stated date of maturity.
MAtURIty ScHEDUlE(see inside cover)
The Bonds were sold and awarded pursuant to competitive bidding processes held on February 8, 2018, as set forth in the Official Notice of Sale with respect to the 2018 Bonds. The 2018 Bonds are offered when, as and if issued, subject to the approval as to their legality by Jones Hall, A Professional Law Corporation, San Francisco, California, Bond Counsel. Certain legal matters also will be passed upon for the Authority by Jones Hall, A Professional Law Corporation, San Francisco, California, as Disclosure Counsel. It is anticipated that the 2018 Bonds in definitive form will be available for delivery to Cede & Co., as nominee of DTC, on or about February 22, 2018.
Dated: February 8, 2018

MATURITY SCHEDULE
Base CUSIP†: 82707B
$125,850,000 Serial Bonds
Maturity Date (August 1)
Principal Amount
Interest Rate
Yield Price
CUSIP†
2018 $2,460,000 5.000% 1.150% 101.690 BZ1 2019 2,245,000 5.000 1.280 105.296 CA5 2020 2,360,000 5.000 1.420 108.560 CB3 2021 2,480,000 5.000 1.550 111.518 CC1 2022 2,605,000 5.000 1.670 114.197 CD9 2023 2,745,000 5.000 1.780 116.628 CE7 2024 2,880,000 5.000 1.900 118.710 CF4 2025 3,025,000 5.000 2.020 120.492 CG2 2026 3,185,000 5.000 2.130 122.065 CH0 2027 3,345,000 5.000 2.250 123.273 CJ6 2028 3,515,000 5.000 2.350 123.371 C CK3 2029 3,695,000 5.000 2.450 122.377 C CL1 2030 3,890,000 5.000 2.540 121.491 C CM9 2031 4,090,000 5.000 2.580 121.100 C CN7 2032 4,255,000 3.000 3.210 97.587 CP2 2033 4,405,000 4.000 3.000 108.539 C CQ0 2034 4,565,000 3.125 3.323 97.500 CR8 2035 4,730,000 4.000 3.200 106.764 C CS6 2036 4,920,000 4.000 3.250 106.326 C CT4 2037 5,110,000 3.250 3.400 97.877 CU1 2038 5,275,000 3.250 3.430 97.369 CV9 2039 5,450,000 3.250 3.449 97.000 CW7 2040 5,645,000 4.000 3.400 105.023 C CX5 2041 5,880,000 4.000 3.420 104.851 C CY3 2042 6,125,000 4.000 3.430 104.765 C CZ0 2043 6,350,000 3.500 3.500 100.000 DA4 2044 6,600,000 4.000 3.450 104.593 C DB2 2045 6,870,000 4.000 3.460 104.508 C DC0 2046 7,150,000 4.000 3.470 104.422 C DD8
$15,105,000 3.500% Term Bond due August 1, 2048; Yield 3.581%; Price: 98.500; CUSIP† DF3 C: Priced to optional call at par on February 1, 2028. † CUSIP Copyright 2018, CUSIP Global Services, and a registered trademark of American Bankers Association. CUSIP data herein is provided by CUSIP Global Services, which is managed on behalf of American Bankers Association by S&P Capital IQ. Neither the District nor the Purchasers take any responsibility for the accuracy of the CUSIP data.

Redwood City
WBSD
Belmont San Carlos

[THIS PAGE INTENTIONALLY LEFT BLANK]

SILICON VALLEY CLEAN WATER
Authority Commissioners
Commissioner Title Member Agency Represented John Seybert Chair City of Redwood City
Warren Lieberman Vice Chair City of Belmont Robert Grassilli Secretary City of San Carlos
George Otte Member West Bay Sanitary District
Authority Management
Daniel T. Child, Manager
Teresa Herrera, Assistant Manager/Authority Engineer Monte Hamamoto, Wastewater Superintendent
Matthew Anderson, Chief Financial Officer
Professional Services
Bond Counsel and Disclosure Counsel Jones Hall, A Professional Law Corporation
San Francisco, California
Municipal Advisor Fieldman, Rolapp & Associates Inc.
Irvine, California
Authority Counsel Fitzgerald Law Offices Burlingame, California
Trustee
ZB, National Association dba Zions Bank
Los Angeles, California

GENERAL INFORMATION ABOUT THIS OFFICIAL STATEMENT
Use of Official Statement. This Official Statement is submitted in connection with the sale of the 2018 Bonds and may not be reproduced or used, in whole or in part, for any other purpose. This Official Statement is not to be construed as a contract with the purchasers of the 2018 Bonds.
Estimates and Forecasts. When used in this Official Statement and in any continuing disclosure by the Authority and the Participating Members, in any press release and in any oral statement made with the approval of an authorized officer of the Authority and the Participating Members, the words or phrases “will likely result,” “are expected to”, “will continue”, “is anticipated”, “estimate”, “project,” “forecast”, “expect”, “intend” and similar expressions identify forward looking statements. Such statements are subject to risks and uncertainties that could cause actual results to differ materially from those contemplated in such forward-looking statements. Any forecast is subject to such uncertainties. Inevitably, some assumptions used to develop the forecasts will not be realized and unanticipated events and circumstances may occur. Therefore, there are likely to be differences between forecasts and actual results, and those differences may be material. The information and expressions of opinion in this Official Statement are subject to change without notice, and neither the delivery of this Official Statement nor any sale made hereunder shall, under any circumstances, give rise to any implication that there has been no change in the affairs of the Authority and the Participating Members since the date of this Official Statement.
Limit of Offering. No dealer, broker, salesperson or other person has been authorized by the Authority, the Participating Members or the Purchaser to give any information or to make any representations other than those contained in this Official Statement and, if given or made, such other information or representation must not be relied upon as having been authorized by any of the foregoing. This Official Statement does not constitute an offer to sell or the solicitation of an offer to buy nor shall there be any sale of the 2018 Bonds by a person in any jurisdiction in which it is unlawful for such person to make such an offer, solicitation or sale.
Limited Scope of Information. The Authority and the Participating Members have obtained certain information set forth in this Official Statement from sources which are believed to be reliable, but such information is neither guaranteed as to accuracy or completeness, nor to be construed as a representation of such by the Authority and the Participating Members. The information and expressions of opinions in this Official Statement are subject to change without notice and neither delivery of this Official Statement nor any sale of the 2018 Bonds shall, under any circumstances, create any implication that there has been no change in the affairs of the Authority and the Participating Members since the date of this Official Statement. All summaries of or references to the documents referred to in this Official Statement are made subject to the provisions of such documents and do not purport to be complete statements of any or all of such provisions. All capitalized terms used in this Official Statement, unless noted otherwise, have the meanings given in the Indenture.
The Purchaser has provided the following sentence for inclusion in this Official Statement: The Purchaser has reviewed the information in this Official Statement in accordance with, and as part of, its responsibilities to investors under the federal securities laws as applied to the facts and circumstances of this transaction, but the Purchaser does not guarantee the accuracy or completeness of such information.
Stabilization of Prices. In connection with this offering, the Purchaser may overallot or effect transactions which stabilize or maintain the market price of the 2018 Bonds at a level above that which might otherwise prevail in the open market. Such stabilizing, if commenced, may be discontinued at any time. The Purchaser may offer and sell the 2018 Bonds to certain dealers and others at prices lower than the public offering prices set forth on the inside cover page and the public offering prices may be changed from time to time by the Purchaser.
THE 2018 BONDS HAVE NOT BEEN REGISTERED UNDER THE SECURITIES ACT OF 1933, AS AMENDED, IN RELIANCE UPON AN EXCEPTION FROM THE REGISTRATION REQUIREMENTS CONTAINED IN SUCH ACT. THE 2018 BONDS HAVE NOT BEEN REGISTERED OR QUALIFIED UNDER THE SECURITIES LAWS OF ANY STATE.
Websites. The Authority and the Members maintain Internet websites. The information on those websites is not incorporated by reference in this Official Statement.

i
TABLE OF CONTENTS
Page Page
INTRODUCTION ........................................... 1
Silicon Valley Clean Water ........................ 1Purpose of the 2018 Bonds ....................... 2Security for the 2018 Bonds ....................... 3Parity Debt of the Participating Members ... 4Other Debt of the Authority ........................ 4Disclaimer .................................................. 5
FINANCING PLAN ........................................ 6General ...................................................... 6The Project ................................................ 6Anticipated Sources and Uses of Funds .... 7
DEBT SERVICE SCHEDULE ....................... 8COMBINED DEBT SERVICE SCHEDULE ... 9THE 2018 BONDS ...................................... 10
Authority for Issuance .............................. 10Description of the 2018 Bonds ................. 10Redemption ............................................. 11
SECURITY FOR THE 2018 BONDS .......... 12General .................................................... 12Financing Agreements ............................. 12No Reserve Fund ..................................... 14Issuance of Parity Debt by the Authority .. 14State Revolving Fund Loans of the
Authority .............................................. 15Line of Credit ........................................... 15
THE AUTHORITY AND THE WASTEWATER SYSTEM .................................................. 16The Authority ........................................... 16Governance & Management ................... 17Comparative Residential Sewer Charges18Participating Member Historical & Adopted
Sewer Rate Increases ......................... 20The Wastewater System ......................... 21Sewer Utility Regulatory Issues .............. 25
Capital Improvement Program ..................... 25Financial Plan .............................................. 27Member Financial Projections ..................... 28Budget and Billing Process .......................... 28Maximum Capacity Rights Owned by
Members .................................................. 29Wastewater Flow ......................................... 29Capacity Fees for New Development .......... 30Outstanding Debt ......................................... 30
CONSTITUTIONAL LIMITATIONS ON APPROPRIATIONS ...................................... 32Article XIIIB Gann Limit ................................ 32Articles XIIIC and XIIID ................................ 32
RISK FACTORS .............................................. 36Demand for the Sewer Service .................... 36Wastewater System Expenses .................... 36Parity Debt ................................................... 36Natural Disasters ......................................... 37Limitations on Remedies Available;
Bankruptcy ............................................... 37Limited Obligations ...................................... 38Change in Law ............................................. 38Loss of Tax Exemption ................................ 39Secondary Market for Bonds ....................... 39Build America Bonds .................................... 39
CONCLUDING INFORMATION ...................... 40Continuing Disclosure .................................. 40Absence of Litigation .................................... 41Legal Matters ............................................... 41Tax Matters .................................................. 41Ratings ......................................................... 43Competitive Sale of Bonds ........................... 44Municipal Advisor ......................................... 44Miscellaneous .............................................. 44
Appendix A – Information About Redwood City’s Wastewater System Appendix B – Information About the City of San Carlos’ Wastewater System Appendix C – Information About the West Bay Sanitary District Appendix D – Area Statistical Information Appendix E – Summary of Principal Legal Documents Appendix F – Forms of Continuing Disclosure Certificates Appendix G – Form of Bond Counsel Opinion Appendix H – DTC and the Book-Entry Only System Appendix I – Audited Financial Report for Silicon Valley Clean Water – Fiscal Year Ended June 30, 2017 Appendix J – Comprehensive Annual Financial Report for the City of Redwood City – Fiscal Year Ended
June 30, 2017 Appendix K – Comprehensive Annual Financial Report for the City of San Carlos – Fiscal Year Ended June
30, 2017 Appendix L – Financial Statements and Independent Auditor’s Report for West Bay Sanitary District – Fiscal
Year Ended June 30, 2017

[THIS PAGE INTENTIONALLY LEFT BLANK]
-1-
$140,955,000 Silicon Valley Clean Water
(San Mateo County, California) 2018 Wastewater Revenue Bonds
INTRODUCTION
This introduction is not a summary of this Official Statement. It is only a brief description of and guide to, and is qualified by, more complete and detailed information contained in the entire Official Statement, including the cover page and attached appendices, and the documents that it summarizes or describes. A full review should be made of the entire Official Statement. Unless otherwise indicated, capitalized terms used but not defined in this Official Statement have the respective meanings ascribed to them in the Indenture (as that term is defined below). This Official Statement, including the cover page and attached appendices, is provided to furnish information regarding the bonds captioned above (the “2018 Bonds”) to be issued by Silicon Valley Clean Water (formerly the South Bayside System Authority) (the “Authority”) under authority conferred by its Joint Powers Agreement (as that term is defined below). Silicon Valley Clean Water
Silicon Valley Clean Water is a joint exercise of powers authority that provides wastewater transmission, treatment, and effluent disposal services to the Cities of Belmont, Redwood City, and San Carlos, and the West Bay Sanitary District (collectively, the “Members”), all of which are located in the northern part of Silicon Valley, between the Cities of San Francisco and San Jose. The Authority’s wastewater treatment plant is located in the City of Redwood City. The Authority serves more than 200,000 people and businesses located predominantly in San Mateo County, California. See “THE AUTHORITY AND THE WASTEWATER SYSTEM” below.
The Authority owns and operates a regional wastewater treatment plant with an average
dry weather flow permit capacity of 29 million gallons per day, an approximately nine-mile influent force main pipeline that conveys wastewater from the Members to the Authority’s treatment plant, five wastewater pump stations, and a 1.25-mile effluent disposal pipeline that discharges treated effluent into the San Francisco Bay. The Authority also provides recycled water to the City of Redwood City.
Since 2008, the Authority has been rebuilding, rehabilitating, and upgrading its wastewater
transmission and treatment facilities, which are approaching the end of their useful operating lives. The Authority has previously funded or has received funding commitments for over $244 million to be used for capital improvements. An October 2017 update of the Authority’s 2008 10-Year Capital Improvement Program (the “CIP”) identified approximately $596 million of capital projects to be funded between 2018 and 2025, of which $450.3 million (75.5%) is to replace the sewer conveyance system, $80.0 million (13.4%) is to for treatment plant improvements, and $66 million (11%) is to address anticipated regulatory changes regarding nutrient removal. The Authority anticipates funding its remaining CIP expenditures via a combination of bonds (including the 2018 Bonds), State Revolving Fund Loans issued by the California State Water Resources Control Board (the “SWRCB”), a line of credit with Wells Fargo Bank, National Association and cash funding. See “THE AUTHORITY AND THE WASTEWATER SYSTEM – Capital Improvement Program” and “THE AUTHORITY AND THE WASTEWATER SYSTEM – Financial Plan.”

-2-
The 2018 Bonds are being issued to generate funding for the next phase of the Authority’s CIP. Financing Agreements adopted between the Authority and the City of Redwood City, the City of San Carlos, and the West Bay Sanitary District (collectively, the “Participating Members”) obligate each of these agencies to make payments to the Authority for their respective allocable share of debt service on the 2018 Bonds. The City of Belmont is not a Participating Member for this financing and is not obligated to make any debt service payments on the 2018 Bonds. The Participating Members include:
City of Redwood City - The City of Redwood City (“Redwood City”) is located approximately 25 miles south of San Francisco and 23 miles north of San Jose. Redwood City has a population of roughly 85,601 and owns and operates a sanitary sewer collection system consisting of approximately 200 miles of sewer pipelines and 31 sewer lift stations. In addition to providing wastewater service within its boundaries, Redwood City also conveys wastewater from five San Mateo County sewer maintenance districts and the Town of Woodside to the Authority for treatment and effluent disposal pursuant to agreements with each agency.
City of San Carlos - The City of San Carlos (“San Carlos”) is located approximately
22 miles south of San Francisco and about 26 miles north of San Jose. San Carlos has a population of roughly 29,311 and owns and operates a sanitary sewer collection system consisting of approximately 105 miles of sewer pipelines and 6 sewer lift stations. In addition to providing wastewater service within its boundaries, San Carlos also conveys wastewater from four San Mateo County sewer maintenance districts to the Authority for treatment and effluent disposal pursuant to agreements with each agency.
West Bay Sanitary District - The West Bay Sanitary District (“West Bay Sanitary
District”) is an independent special district that provides wastewater service to the City of Menlo Park and surrounding areas. The West Bay Sanitary District is located approximately 26 miles south of San Francisco and 20 miles north of San Jose. The West Bay Sanitary District serves a population of approximately 55,000 and owns and operates a sanitary sewer collection system consisting of approximately 200 miles of sewer pipelines and 13 sewer pump stations.
Each of the Members has been proactively raising sewer rates to support their allocable
share of funding requirements for the Authority’s operations and CIP, as well as their own operating and capital programs. See “THE AUTHORITY AND THE WASTEWATER SYSTEM - Participating Member Historical & Adopted Sewer Rate Increases.”
Purpose of the 2018 Bonds
The 2018 Bonds are being issued to (i) finance the acquisition and construction of capital improvements to the Authority’s wastewater system (the “Project”) and (ii) pay costs of issuing the 2018 Bonds. The Project includes capital improvements that are allocable to the Participating Members. The City of Belmont will fund its share of the allocable improvements independently.

-3-
Security for the 2018 Bonds The 2018 Bonds are being issued under an Indenture of Trust, dated as of February 1, 2018
(the “Indenture”), between the Authority and ZB, National Association dba Zions Bank, as trustee (the “Trustee”). The 2018 Bonds are limited obligations of the Authority, payable solely from “Revenues” under the Indenture consisting primarily of (i) certain amounts payable by the Participating Members under the Financing Agreements described below (the “SVCW Bond Payments”), representing the portion of debt service on the 2018 Bonds that is allocable to each Participating Member (the “Allocable Share”), and (ii) amounts on hand from time to time in the funds established under the Indenture. The 2018 Bonds are not secured by other revenues of the Authority.
Each Participating Member is obligated to pay debt service for its Allocable Share of the
2018 Bonds as follows:
Participating Member Allocable Share of 2018 Bonds ($) Allocable Share of 2018 Bonds (%) Redwood City $82,210,000 58.32% San Carlos 25,635,000 18.19 West Bay Sanitary District 33,110,000 23.49 Total $140,955,000 100.00%
Each Participating Member is obligated to pay debt service for the Authority’s prior series of bonds, as follows:
Participating Member Allocable Share Total % of Total Bonds
2009 Bonds 2014 Bonds 2015 Bonds
Redwood City $1,500,000.00 $30,678,753.72 $35,225,000.00 $67,403,753.72 52.50% San Carlos 390,000.00 9,563,029.26 12,180,000.00 22,133,029.26 17.24 West Bay Sanitary District 665,000.00 16,953,217.02 21,245,000.00 38,863,217.02 30.27 Total $2,555,000.00 $57,195,000.00 68,650,000.00 $128,400,000.00 100.00%
The Authority anticipates that the City of Belmont will contribute approximately $16.9
million towards the next phase of the CIP. The Authority previously entered into the following Financing Agreements (each, a
“Financing Agreement”):
Financing Agreements with Redwood City and the West Bay Sanitary District, each dated as of December 1, 2008, as amended by a First Amendment to Financing Agreement dated as of March 20, 2014, obligates those parties to make payments to the Authority with respect to the Authority’s (i) $55,855,000 initial principal amount 2009 Wastewater Revenue Bonds (the “2009 Bonds”), which were partially refunded on a crossover basis in October 2015, (ii) $60,000,000 initial principal amount of 2014 Wastewater Revenue Bonds (the “2014 Bonds”), (iii) $70,200,000 initial principal amount of 2015 Wastewater Revenue Bonds (the “2015 Bonds”), (iv) the 2018 Bonds and (v) all future bond issuances of the Authority.
Financing Agreements with San Carlos, dated as of (i) July 1, 2009, in connection
with the Authority’s issuance of its 2009 Bonds, which were partially refunded on a crossover basis in October 2015, (ii) March 20, 2014, in connection with the

-4-
Authority’s issuance of its 2014 Bonds, (iii) November 1, 2015, in connection with the Authority’s issuance of its 2015 Bonds and (iv) January 1, 2018, in connection with the Authority’s issuance of its 2018 Bonds.
Under the Financing Agreements, each Participating Member is obligated to make SVCW
Bond Payments to the Authority in an amount sufficient to pay that Participating Member’s Allocable Share of debt service on (i) the 2009 Bonds, (ii) the 2014 Bonds, (iii) the 2015 Bonds, (iv) the 2018 Bonds, and (v) any bonds issued by the Authority in the future.
Each Participating Member’s obligation to make the SVCW Bond Payments under its
respective Financing Agreement is secured by a lien on and pledge of Net Revenues derived from the wastewater system of the Participating Member, and is not secured by the full faith and credit or general funds of the Participating Member. Each Participating Member’s obligation to make SVCW Bond Payments with respect to the 2018 Bonds is payable on a parity basis with its obligation to pay its Allocable Share of debt service on the 2009 Bonds, the 2014 Bonds, and the 2015 Bonds. There is no joint or several liability among the Participating Members, and each Participating Member is obligated only for its Allocable Share. See “THE AUTHORITY AND THE WASTEWATER SYSTEM - Outstanding Debt.”
The Authority is not funding a debt service reserve for the 2018 Bonds.
Parity Debt of the Participating Members
The Participating Members are authorized under their respective Financing Agreements to incur additional obligations payable from Net Revenues, which may be on a parity with the SVCW Bond Payments that secure the 2018 Bonds. As of the date hereof, none of the Participating Members has incurred any obligations on a parity with their obligations in respect of the 2009 Bonds, the 2014 Bonds, and the 2015 Bonds. See “SECURITY FOR THE 2018 BONDS – Issuance of Parity Debt by the Participating Members.” Other Debt of the Authority
The Authority is not authorized to issue additional obligations payable from Revenues, because “Revenues” is defined to include the SVCW Bond Payments that represent debt service payments on the 2018 Bonds. However, the Authority has previously issued the 2009 Bonds, the 2014 Bonds, and the 2015 Bonds, each of which are payable from SVCW Bond Payments that represent debt service on those bonds, and may issue bonds in the future payable from increased SVCW Bond Payments.
SRF Loans. The Authority has previously been awarded funding commitments for a combined total of approximately $57 million under three loans from the SWRCB (each an “SRF Loan”), outstanding in the amount of approximately $55 million as of August 2, 2017. Going forward, the Authority intends to continue to apply for low-cost SRF Loans. At present, the Authority is estimating that it will apply for SRF Loans of approximately $65 million from the SWRCB in order to fund the nutrient removal projects. There can be no guarantee that the Authority will be awarded additional SRF Loans, in which case the Authority may alternatively issue additional parity debt. SRF Loans are payable from a source of the Authority’s revenues that is separate and distinct from the source of revenues which is pledged for payment of the 2009 Bonds, the 2014 Bonds, the 2015 Bonds, and the 2018 Bonds; and each Participating Member will be responsible for payments to the Authority for repayment of the SRF Loans pursuant to the Joint Powers Agreement (as defined below). While the SRF Loans are not direct obligations of
-5-
the Participating Members, and are not secured by a pledge of Net Revenues, payments from each Participating Member are paid to the Authority pursuant to the Joint Powers Agreement (as defined below). Payments made by the Participating Members with respect to the SRF Loans are not secured by a pledge of or lien on the Net Revenues from the respective wastewater systems of such Participating Members, nor are they an Operation and Maintenance Cost of the Participating Members. See “SECURITY FOR THE 2018 BONDS - State Revolving Fund Loans of the Authority”.
Line of Credit. The Authority has a short-term line of credit with Wells Fargo Bank,
National Association (the “Line of Credit”), which is used to provide interim funding. Specifically, the Line of Credit furnishes interim cash flow funding as needed when the Authority is awaiting reimbursement from its SRF Loans. The Line of Credit is also payable from a source of the Authority’s revenues that is separate and distinct from the source of revenues which is pledged for payment of the 2009 Bonds, the 2014 Bonds, the 2015 Bonds, and the 2018 Bonds; and each Participating Member will be responsible for payments to the Authority for repayment of the Line of Credit pursuant to the Joint Powers Agreement (as defined below). Although the line of credit is secured by Authority revenues, payments made by the Participating Members with respect to the Line of Credit are not secured by a pledge of or lien on the Net Revenues of the respective wastewater systems of such Participating Members. See “SECURITY FOR THE 2018 BONDS – Line of Credit.”
Disclaimer
This introduction is not a summary of this Official Statement. Information presented in this
section is described more completely elsewhere in this Official Statement, which should be read in its entirety. Terms used in this Official Statement and not otherwise defined have the meanings ascribed to them in the Indenture. All references herein to the 2018 Bonds, the Indenture, the Joint Powers Agreement, and the Financing Agreements are qualified in their entirety by reference to the actual documents. Documents referred to in this Official Statement can be obtained from the financial advisor prior to the closing, and from the Authority thereafter.
[remainder of page intentionally left blank]

-6-
FINANCING PLAN General
The 2018 Bonds are being issued to (i) finance the acquisition and construction of capital improvements to the Authority’s wastewater system (the “Project”) and (ii) pay costs of issuing the 2018 Bonds.
The Project
The Authority continues to move forward with construction of CIP projects to rebuild, rehabilitate, and upgrade its wastewater conveyance and treatment facilities. Current CIP activities are concentrated on the Regional Environmental Sewer Conveyance Upgrade program (the “RESCU Program”) that will replace aging pipelines, rehabilitate pump stations, and construct receiving and headworks facilities at the treatment plant. See “THE AUTHORITY AND THE WASTEWATER SYSTEM – Capital Improvement Plan” for additional information about the RESCU Program.
In addition to activities related to the RESCU Program, projects include technological
upgrades and system-wide automation designed to improve operational efficiency, manage electricity use, and ensure wastewater treatment is not interrupted.
The Authority has previously funded or received funding commitments for over $244
million to be used for capital improvements, including funds from the 2008 Bonds, the 2009 Bonds, the 2014 Bonds, the 2015 Bonds, cash contributions from the City of Belmont and the City of Redwood City, SRF Loans, the Line of Credit, and interest earned on project funds. An October 2017 update of the CIP identified roughly $596 million of additional capital funding still needed through 2025. The Authority anticipates funding its remaining capital improvement costs via a combination of bonds (including the 2018 Bonds), SRF Loans issued by the SWRCB, the Line of Credit and cash funding.
Under the Joint Powers Agreement, each of the Members is contractually obligated to fund its allocable share of the Authority’s capital improvements. The City of Belmont anticipates providing cash (either from its own financing or its reserves) for its allocable share of related capital improvements of the Authority’s CIP rather than participating in the issuance of the 2018 Bonds.
See “THE AUTHORITY AND THE WASTEWATER SYSTEM – Capital Improvement Plan”
and “THE AUTHORITY AND THE WASTEWATER SYSTEM – Financial Plan” for additional information about the CIP and the Authority’s plans for meeting the capital funding needs.
-7-
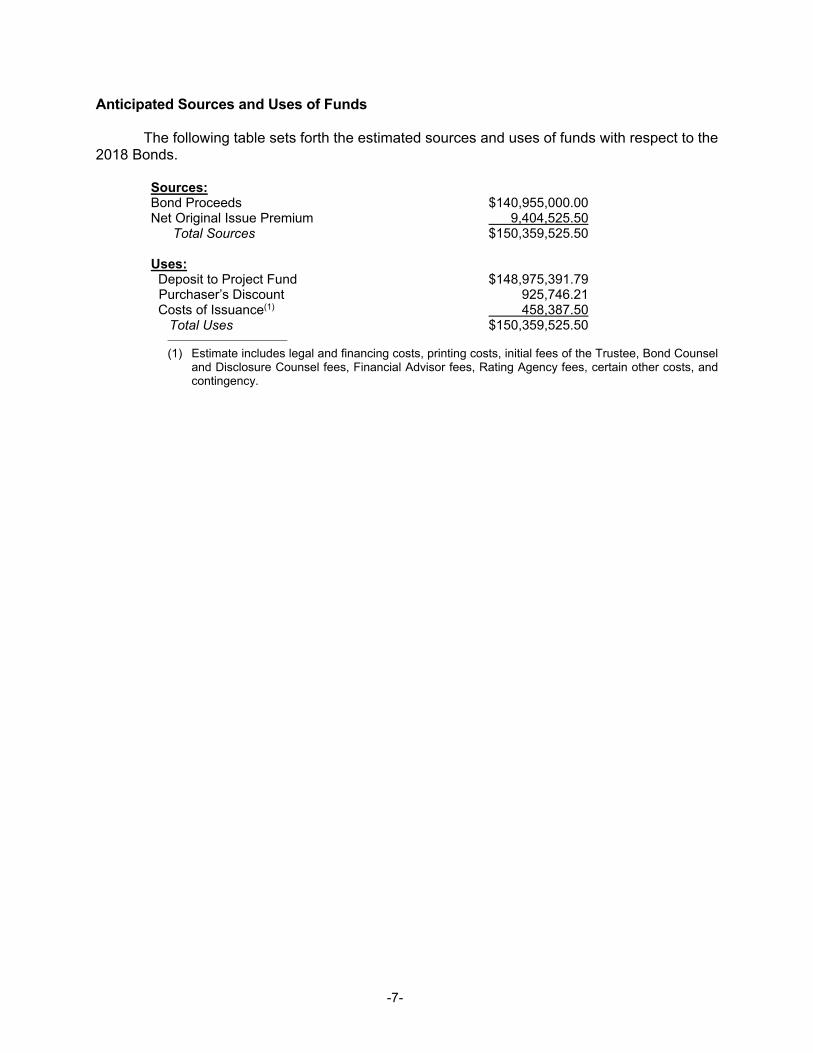
Anticipated Sources and Uses of Funds
The following table sets forth the estimated sources and uses of funds with respect to the 2018 Bonds.
Sources: Bond Proceeds $140,955,000.00 Net Original Issue Premium 9,404,525.50 Total Sources $150,359,525.50
Uses: Deposit to Project Fund $148,975,391.79
Purchaser’s Discount 925,746.21 Costs of Issuance(1) 458,387.50 Total Uses $150,359,525.50
(1) Estimate includes legal and financing costs, printing costs, initial fees of the Trustee, Bond Counsel and Disclosure Counsel fees, Financial Advisor fees, Rating Agency fees, certain other costs, and contingency.
-8-
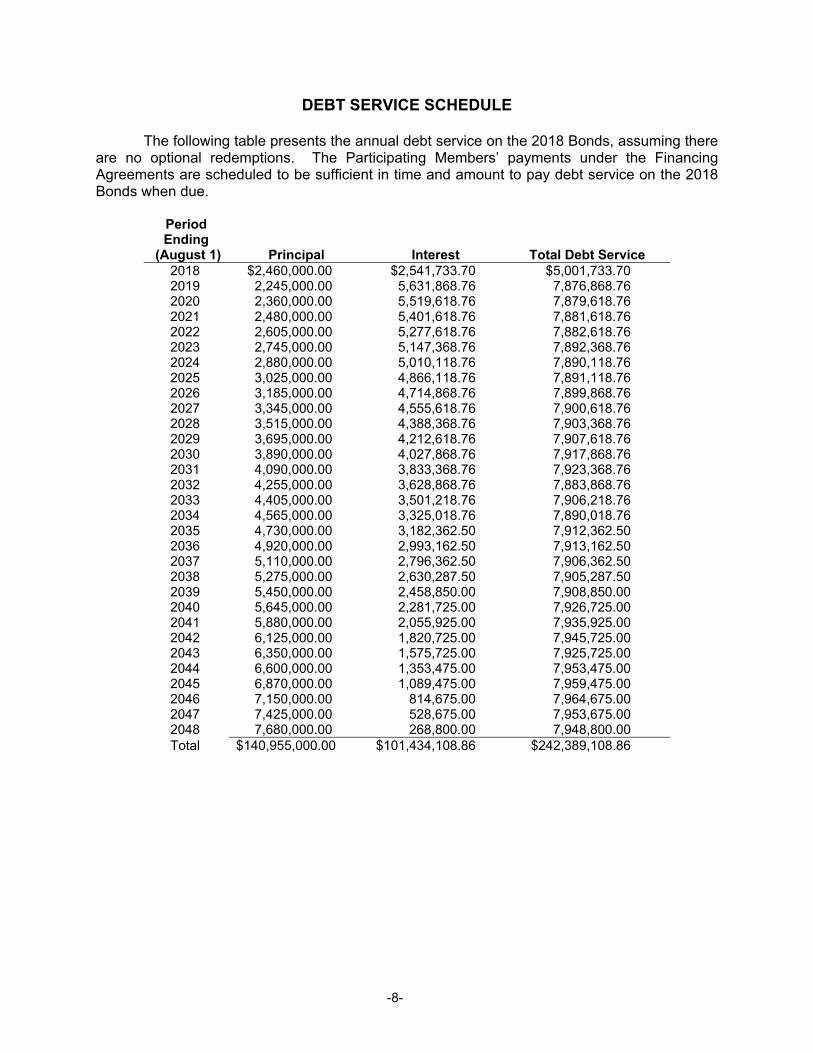
DEBT SERVICE SCHEDULE
The following table presents the annual debt service on the 2018 Bonds, assuming there are no optional redemptions. The Participating Members’ payments under the Financing Agreements are scheduled to be sufficient in time and amount to pay debt service on the 2018 Bonds when due.
Period Ending
(August 1)
Principal Interest Total Debt Service 2018 $2,460,000.00 $2,541,733.70 $5,001,733.70 2019 2,245,000.00 5,631,868.76 7,876,868.76 2020 2,360,000.00 5,519,618.76 7,879,618.76 2021 2,480,000.00 5,401,618.76 7,881,618.76 2022 2,605,000.00 5,277,618.76 7,882,618.76 2023 2,745,000.00 5,147,368.76 7,892,368.76 2024 2,880,000.00 5,010,118.76 7,890,118.76 2025 3,025,000.00 4,866,118.76 7,891,118.76 2026 3,185,000.00 4,714,868.76 7,899,868.76 2027 3,345,000.00 4,555,618.76 7,900,618.76 2028 3,515,000.00 4,388,368.76 7,903,368.76 2029 3,695,000.00 4,212,618.76 7,907,618.76 2030 3,890,000.00 4,027,868.76 7,917,868.76 2031 4,090,000.00 3,833,368.76 7,923,368.76 2032 4,255,000.00 3,628,868.76 7,883,868.76 2033 4,405,000.00 3,501,218.76 7,906,218.76 2034 4,565,000.00 3,325,018.76 7,890,018.76 2035 4,730,000.00 3,182,362.50 7,912,362.50 2036 4,920,000.00 2,993,162.50 7,913,162.50 2037 5,110,000.00 2,796,362.50 7,906,362.50 2038 5,275,000.00 2,630,287.50 7,905,287.50 2039 5,450,000.00 2,458,850.00 7,908,850.00 2040 5,645,000.00 2,281,725.00 7,926,725.00 2041 5,880,000.00 2,055,925.00 7,935,925.00 2042 6,125,000.00 1,820,725.00 7,945,725.00 2043 6,350,000.00 1,575,725.00 7,925,725.00 2044 6,600,000.00 1,353,475.00 7,953,475.00 2045 6,870,000.00 1,089,475.00 7,959,475.00 2046 7,150,000.00 814,675.00 7,964,675.00 2047 7,425,000.00 528,675.00 7,953,675.00 2048 7,680,000.00 268,800.00 7,948,800.00 Total $140,955,000.00 $101,434,108.86 $242,389,108.86

-9-
COMBINED DEBT SERVICE SCHEDULE
The following table shows the aggregate annual debt service on the parity and subordinate obligations of the Authority, assuming there are no optional redemptions. The Participating Members’ payments under the Financing Agreements are scheduled to be sufficient to pay debt service on the obligations shown below, when due.
Parity Debt Subordinate Debt
Period Ending
(June 30)
2009 Bonds (1)
2014 Bonds
2015 Bonds (2)
2018 Bonds
Existing SRF Loan Payments
Conveyance
Planning SRF Loan Payments (3)
Total Debt Service
2018 $4,943,389.00 $3,860,100.00 $2,308,800.00 -- $2,630,598.53 -- $13,742,887.53 2019 4,909,805.00 3,862,100.00 2,300,100.00 $7,817,668.08 2,630,598.53 -- 21,520,271.61 2020 3,115,746.25 3,862,500.00 3,250,225.00 7,820,744.76 2,630,598.53 $1,526,132.15 22,205,945.69 2021 -- 3,864,500.00 5,330,500.00 7,820,619.76 2,630,598.53 1,526,132.15 21,172,349.44 2022 -- 3,863,500.00 5,326,500.00 7,819,619.76 2,630,598.53 1,526,132.15 21,166,349.44 2023 -- 3,864,500.00 5,322,375.00 7,817,494.76 2,630,598.53 1,526,132.15 21,161,099.44 2024 -- 3,862,250.00 5,317,875.00 7,823,744.76 2,630,598.53 1,526,132.15 21,160,599.44 2025 -- 3,861,750.00 5,327,375.00 7,818,119.76 2,630,598.53 1,526,132.15 21,163,974.44 2026 -- 3,862,750.00 5,306,000.00 7,815,494.76 2,630,598.53 1,526,132.15 21,140,974.44 2027 -- 3,865,000.00 5,294,000.00 7,820,244.76 2,630,598.53 1,526,132.15 21,135,974.44 2028 -- 3,863,250.00 5,300,375.00 7,816,994.76 2,630,598.53 1,526,132.15 21,137,349.44 2029 -- 3,862,500.00 5,294,625.00 7,815,494.76 2,630,598.53 1,526,132.15 21,129,349.44 2030 -- 3,862,500.00 5,281,875.00 7,815,244.76 2,630,598.53 -- 19,590,217.29 2031 -- 3,863,000.00 4,657,625.00 7,820,619.76 2,630,598.53 -- 18,971,842.29 2032 -- 3,863,750.00 4,652,125.00 7,821,119.76 2,630,598.53 -- 18,967,592.29 2033 -- 3,864,500.00 4,640,125.00 7,820,044.76 2,630,598.53 -- 18,955,267.29 2034 -- 3,865,000.00 4,636,250.00 7,818,119.76 1,888,096.89 -- 18,207,465.65 2035 -- 3,860,000.00 4,620,250.00 7,818,691.63 1,888,096.89 -- 18,187,037.52 2036 -- 3,863,600.00 4,616,750.00 7,817,763.50 1,888,096.89 -- 18,186,209.39 2037 -- 3,863,100.00 4,610,125.00 7,814,763.50 1,888,096.89 -- 18,176,084.39 2038 -- 3,861,350.00 4,595,250.00 7,823,325.00 -- -- 16,279,925.00 2039 -- 3,863,100.00 4,586,750.00 7,819,569.75 -- -- 16,269,418.75 2040 -- 3,862,850.00 4,569,250.00 7,820,288.50 -- -- 16,252,387.50 2041 -- 3,859,750.00 1,656,750.00 7,813,825.00 -- -- 13,330,325.00 2042 -- 3,861,000.00 1,652,250.00 7,818,325.00 -- -- 13,331,575.00 2043 -- 3,864,250.00 1,654,500.00 7,823,225.00 -- -- 13,341,975.00 2044 -- 3,864,000.00 1,648,375.00 7,814,600.00 -- -- 13,326,975.00 2045 -- -- 1,648,750.00 7,821,475.00 -- -- 9,470,225.00 2046 -- -- 1,650,250.00 7,822,075.00 -- -- 9,472,325.00 2047 -- -- -- 7,821,675.00 -- -- 7,821,675.00 2048 -- -- -- 7,823,738.50 -- -- 7,823,737.50 2049 -- -- -- 7,814,400.00 -- -- 7,814,400.00 Total $12,968,940.25 $104,296,450.00 $117,056,000.00 $242,389,108.86 $49,641,964.04 $15,261,321.50 $541,613,784.65
(1) Represents approximate allocated share of gross debt service on the Series 2009 Bonds; does not include any Refundable
Credits. (2) Excludes debt service payments made from escrow funds as a result of the crossover refunding of the 2009 Bonds. (3) Preliminary debt service estimate and amortization shown; final amount and amortization, which the Authority is attempting to
extend, will be determined after the SRF-Loan project is completed. The related project is expected to be completed during calendar year 2018.

-10-
THE 2018 BONDS
Authority for Issuance
The 2018 Bonds will be issued by the Authority in accordance with Article 4 of Chapter 5 of Division 7 of Title 1 of the Government Code (commencing with Section 6584) (the “Bond Law”) of the State of California (the “State”), resolutions adopted by the governing boards of the Authority and the Participating Members, and the Indenture.
Description of the 2018 Bonds
Bond Terms: The 2018 Bonds will be dated their date of delivery and issued in fully registered form without coupons in denominations of $5,000 or any integral multiple of $5,000. The 2018 Bonds will mature in the amounts and on the dates, and bear interest at the rates per annum, set forth on the inside cover page of this Official Statement.
Payments of Principal and Interest: Interest on the 2018 Bonds will be payable on
February 1 and August 1 in each year, beginning August 1, 2018 (each an “Interest Payment Date”).
Interest on the 2018 Bonds is payable from the Interest Payment Date next preceding the
date of authentication thereof unless: (i) a 2018 Bond is authenticated on or before an Interest Payment Date and
after the close of business on the preceding Record Date, in which event it will bear interest from such Interest Payment Date,
(ii) a 2018 Bond is authenticated on or before July 15, 2018, in which event
interest thereon will be payable from the Closing Date, or (iii) interest on any 2018 Bond is in default as of the date of authentication
thereof, in which event interest thereon will be payable from the date to which interest has been paid in full, payable on each Interest Payment Date.
Interest is payable on the 2018 Bonds on each Interest Payment Date to the persons in
whose names the ownership of the 2018 Bonds is registered on the Registration Books at the close of business on the immediately preceding Record Date, except as provided below. Interest on any 2018 Bond which is not punctually paid or duly provided for on any Interest Payment Date is payable to the person in whose name the ownership of such 2018 Bond is registered on the Registration Books at the close of business on a special record date for the payment of such defaulted interest to be fixed by the Trustee, notice of which is given to such Owner by first-class mail not less than 10 days prior to such special record date.
The Trustee will pay interest on the 2018 Bonds by check of the Trustee mailed by first
class mail, postage prepaid, on each Interest Payment Date to the Owners of the Bonds at their respective addresses shown on the Registration Books as of the close of business on the preceding Record Date. At the written request of the Owner of 2018 Bonds in an aggregate principal amount of at least $1,000,000, which written request is on file with the Trustee as of any Record Date, the Trustee will pay interest on such 2018 Bonds on each succeeding Interest Payment Date by wire transfer in immediately available funds to such account of a financial institution within the United States of America as specified in such written request, which written

-11-
request will remain in effect until rescinded in writing by the Owner. The Trustee will pay principal of the Bonds in lawful money of the United States of America by check of the Trustee upon presentation and surrender thereof at the Office of the Trustee.
Redemption
Optional Redemption: The 2018 Bonds maturing on or before August 1, 2027 are not subject to optional redemption prior to maturity. The 2018 Bonds maturing on or after August 1, 2028 may be called prior to maturity and redeemed at the option of the Authority on any date on or after February 1, 2028, as a whole or in part, from any source of available funds, at a redemption price of 100% of the of the principal amount of the 2018 Bonds to be redeemed, together with accrued interest to the date of redemption.
Mandatory Sinking Fund Redemption: Subject to certain provisions of the Indenture,
the 2018 Bonds maturing on August 1, 2048 are subject to mandatory redemption in whole, or in part by lot, from sinking fund payments made under the Indenture at a redemption price equal to the principal amount thereof to be redeemed, without premium, plus accrued interest to the date of redemption, in the aggregate respective principal amounts and on August 1 in the years shown in the following table:
Term Bond maturing August 1, 2048
Payment Date
(August 1) Payment Amount
2047 $7,425,000 2048 (Maturity) 7,680,000
Notice of Redemption: The Trustee will mail notice of any redemption to the respective
Owners of any 2018 Bonds designated for redemption at their respective addresses appearing on the registration books, to the Securities Depositories and to the Municipal Securities Rulemaking Board, at least 30 but not more than 60 days prior to the date fixed for redemption; provided, however, that neither failure to receive any such notice so mailed nor any defect therein will affect the validity of the proceedings for the redemption of such 2018 Bonds or the cessation of the accrual of interest thereon.
The Authority has the right to rescind any notice of optional redemption of the 2018 Bonds
under the Indenture by written notice to the Trustee on or prior to the date fixed for redemption. Any notice of redemption shall be cancelled and annulled if for any reason funds will not be or are not available on the date fixed for redemption for the payment in full of the 2018 Bonds then called for redemption, and such cancellation shall not constitute an event of default. The Authority and the Trustee have no liability to the Owners or any other party related to or arising from such rescission of redemption.
Manner of Redemption of 2018 Bonds of the Same Maturity: Whenever provision is made in the Indenture for the redemption of less than all of the 2018 Bonds of the same maturity, the Trustee will select the 2018 Bonds to be redeemed by lot in any manner which the Trustee in its sole discretion deems appropriate. For purposes of such selection, all 2018 Bonds will be deemed to be comprised of separate $5,000 denominations and such separate denominations will be treated as separate 2018 Bonds which may be separately redeemed.
-12-
SECURITY FOR THE 2018 BONDS
General
The 2018 Bonds are limited obligations of the Authority, payable solely from “Revenues” under the Indenture consisting primarily of (i) SVCW Bond Payments to be received by the Trustee on behalf of the Authority from Participating Members, and (ii) amounts on hand from time to time in the funds established under the Indenture. In conjunction with the issuance of the 2018 Bonds, and pursuant to the Financing Agreements, the Authority has directed the Participating Members to make the SVCW Bond Payments directly to the Trustee.
All SVCW Bond Payments received by the Trustee will be deposited in the Revenue Fund
which will be maintained by the Trustee under the Indenture. On or before each date on which principal of or interest or premium (if any) on the 2018 Bonds becomes due and payable, the Trustee will transfer the amounts necessary to make scheduled principal and interest payments on the 2018 Bonds and pay the redemption price of any 2018 Bonds called for redemption.
Financing Agreements
General. As described in this Official Statement, the Authority and each of the Participating Members originally entered into Financing Agreements concurrently with the issuance of the 2008 Bonds, which have been fully paid and redeemed from the proceeds of the 2015 Bonds; and San Carlos entered into new Financing Agreements relating to the 2009 Bonds, the 2014 Bonds, and the 2015 Bonds. A more complete description of the Financing Agreements is set forth in Appendix E. Certain key provisions are summarized below.
SVCW Bond Payments. Each of the Participating Members is responsible for paying its
Allocable Share of debt service on the 2009 Bonds, the 2014 Bonds, the 2015 Bonds, the 2018 Bonds, and any bonds the Authority may issue in the future that such Participating Member chooses to participate in. These issuances constitute SVCW Bond Payments under the Financing Agreements of the Participating Members. The Authority allocates debt service to each of the Participating Members in accordance with the Joint Powers Agreement. See “THE AUTHORITY AND THE WASTEWATER SYSTEM” below.
Pledge of Net Revenues. Under each Financing Agreement, the SVCW Bond Payments
of a Participating Member are secured by a lien on and pledge of Net Revenues derived from the wastewater system of the Participating Member. “Net Revenues” consist generally of wastewater system “Gross Revenues” remaining after payment of “Operation and Maintenance Costs.” The Net Revenues from one Participating Member’s wastewater system are pledged solely to its own SVCW Bond Payments and any other indebtedness of such Participating Member secured by a lien on and pledge of Net Revenues; no Participating Member has any liability or responsibility for the SVCW Bond Payments of another Participating Member.
Flow of Funds. Each of the Participating Members covenants and agrees that all Gross
Revenues derived from its wastewater system will be deposited in a wastewater fund, which will be maintained so long as the related Financing Agreement remains outstanding. Amounts on deposit in each Participating Member’s wastewater fund will be used to pay, in the following order of priority:
(a) all Operation and Maintenance Costs of the Participating Member’s wastewater
collection and transmission system;

-13-
(b) the SVCW Bond Payments of such Participating Member, and payments of principal of and interest on any Parity Debt (as defined below) issued by such Participating Member;
(c) any other payments required to comply with the provisions of the Joint Powers
Agreement, including payments due with respect to SRF Loans or the Line of Credit, and any Parity Debt Documents;
(d) any other lawful expenses of the Participating Member’s wastewater collection and
transmission system. Rate Covenants. Each of the Participating Members covenants to establish rates and
charges for its wastewater system during each fiscal year, as follows: To yield Gross Revenues sufficient to pay Operation and Maintenance Costs of the
Participating Member’s wastewater collection and transmission system, fund its allocable share of debt service on the 2009 Bonds, the 2014 Bonds, the 2015 Bonds and any additional Parity Debt, and pay any other obligations payable from the Gross Revenues of its wastewater system; and
Generate wastewater system Net Revenues equal to at least 120% of the Participating
Member’s allocable share of debt service on the 2009 Bonds, the 2014 Bonds, the 2015 Bonds, the 2018 Bonds (i.e., the Participating Member’s SVCW Bond Payments), and any Parity Debt, provided that the unencumbered fund balance of the Participating Member’s wastewater system as of the last day of the immediately preceding fiscal year can be counted as Net Revenues in an amount not to exceed 20% of debt service on the 2009 Bonds, the 2014 Bonds, the 2015 Bonds, the 2018 Bonds, and any Parity Debt.
No Senior Lien Debt. Each of the Participating Members covenants that it will not issue or
incur any additional bonds or other obligations which are senior to its allocable share of debt service payments for the 2018 Bonds.
Pro Rata Nature of SVCW Bond Payments. As described above, each Participating
Member’s SVCW Bond Payment obligation is equal to its Allocable Share of debt service with respect to the 2009 Bonds, the 2014 Bonds, the 2015 Bonds, the 2018 Bonds, and any future bonds issued by the Authority that are payable from SVCW Bond Payments. Each Participating Member’s Allocable Share of debt service is calculated based on its allocated share of the Authority’s capital improvement costs to be funded by each debt issue (as determined in accordance with the Joint Powers Agreement, as defined herein) less any cash contributions toward their share of allocated costs. SVCW Bond Payments will be allocated to the 2009 Bonds, the 2014 Bonds, the 2015 Bonds, and the 2018 Bonds (and any such future bonds issued by the Authority) on a pro rata basis. The Participating Member’s SVCW Bond Payments are projected to be sufficient to pay debt service on the 2009 Bonds, the 2014 Bonds, the 2015 Bonds, the 2018 Bonds.
Issuance of Parity Debt by the Participating Members. Each of the Participating
Members may issue parity debt (“Parity Debt”) payable from the Net Revenues of its wastewater systems provided that the following conditions are met:
(a) the Participating Member is not in default on payment of the SVCW Bond
Payments or any parity debt;

-14-
(b) the amount of Net Revenues as shown by the books of the Participating
Member for the latest fiscal year for which audited statements are available, or as shown by the books of the Participating Member for any more recent 12-month period, are at least equal to 120% of the amount of Maximum Annual Debt Service on the related SVCW Bond Payments and any parity debt issued by the Participating Member, provided that Net Revenues may be increased to reflect:
(i) any increase in wastewater system rates and charges that have
been adopted prior to the issuance of parity debt and that will be in effect in any of the subsequent three fiscal years in an amount by which the Net Revenues would have increased if the increase had been in effect during that period;
(ii) unencumbered wastewater system fund balances as of the last day
of the immediately preceding fiscal year, but in no case in an amount exceeding 20% of Maximum Annual Debt Service;
(iii) any additions or improvements or extensions of each Participating
Member’s wastewater system that were not in effect during the 12-month period in an amount equal to the estimated additional average annual Net Revenues that would be derived during the first three years in which the addition, improvement, or extension is to be in operation, all as shown by the certificate of a qualified independent financial consultant employed by the Participating Member; (c) the Participating Member shall be in compliance with all conditions for
issuing parity debt as set forth in any Parity Debt Documents. Issuance of Subordinate Debt. Each of the Participating Members may issue unsecured
or subordinate obligations. Third-Party Beneficiaries. The Trustee is a third-party beneficiary and is entitled to the
benefits of the Financing Agreements with the same force and effect as if the Trustee were a party to each of the Financing Agreements. No Reserve Fund Neither the Authority nor the Participating Members is establishing a debt service reserve fund for the 2018 Bonds. Issuance of Parity Debt by the Authority
Under the Indenture, the Authority covenants that, except for the 2018 Bonds, no additional bonds, notes, or other indebtedness will be issued or incurred which are payable from Revenues in whole or in part. However, the Authority has the right to issue additional bonds, notes or other obligations that are secured by payments made by any or all of the Members, which payments may be secured by a pledge of and lien on Net Revenues of such Members on a parity with the SVCW Bond Payments. In such case, Participating Members must satisfy the conditions for their respective issuance of Parity Debt. See “- Financing Agreements - Issuance of Parity Debt by the Participating Members.: Nothing in the Indenture limits the authority of the Participating Members to issue parity obligations in accordance with their respective Financing Agreements as described under “- Financing Agreements” above.

-15-
State Revolving Fund Loans of the Authority The Authority has previously borrowed $11,489,095 under that certain Project Finance Agreement, dated February 1, 2012, by and between the Authority and the SWRCB, $31,549,337 under that certain Project Finance Agreement, dated May 10, 2012, by and between the Authority and the SWRCB and $14,000,000 under that certain Project Finance Agreement, dated April 28, 2016 (each, as amended, an “SRF Loan”), which SRF Loans account for a combined total of $57,038,432 of capital project funding commitments. The SRF Loans were outstanding in the amount of approximately $55 million, as of August 2, 2017. The final amount of the SRF Loans may be amended depending on the amount of final project costs determined eligible for funding after the projects have been completed. The SRF Loans, and any future loans from the SWRCB to the Authority, if any, constitute indebtedness of the Authority and do not constitute indebtedness of the Participating Members pursuant to the Financing Agreements. The Authority anticipates applying for additional funding of approximately $65 million through SRF Loans over the next eight years. There can be no assurance that the Authority will be awarded additional funding through SRF Loans, in which case the Authority may alternatively issue debt on a parity with the 2018 Bonds. The SRF Loans are secured by a pledge of the Authority’s net revenues, which net revenues do not include the revenues securing the SVCW Bond Payments. Pursuant to the Joint Powers Agreement, the Authority is authorized to charge its Members for their proportionate share of debt service payments on the SRF Loans. This revenue source is separate and distinct from Revenues pledged to the 2018 Bonds, and the SRF Loans are accordingly not considered parity debt to the 2009 Bonds, 2014 Bonds, 2015 Bonds, or 2018 Bonds. The 2009 Bonds, 2014 Bonds, 2015 Bonds, and 2018 Bonds have priority in payment over the SRF Loans because each Participating Member’s SVCW Bond Payments are secured by a pledge of the Participating Member’s Net Revenues, while the payments made by each Participating Member to the Authority that are used to pay the SRF Loans are not secured by a pledge of the Participating Member’s Net Revenues. Line of Credit
The Authority has also obtained a $30,000,000 short-term line of credit (the “Line of Credit”) with Wells Fargo Bank, National Association, which is used to provide interim financing. Specifically, the Line of Credit furnishes interim cash flows whenever the Authority is awaiting reimbursement from its SRF Loans. This Line of Credit replaced a previous line of credit with Bank of the West, and is secured by a source of revenues of the Authority that is distinct from the Revenues securing the 2018 Bonds and revenues securing the 2009 Bonds, the 2014 Bonds and 2015 Bonds. As of January 25, 2018, $11.5 million outstanding under the Line of Credit.
The 2009 Bonds, 2014 Bonds, 2015 Bonds, and 2018 Bonds have priority in payment over the Line of Credit because each Participating Member’s SVCW Bond Payments are secured by a pledge of the Participating Member’s Net Revenues, while the payments made by each Participating Member to the Authority that are used to pay the Line of Credit are not secured by a pledge of the Participating Member’s Net Revenues.
The Line of Credit expires on May 29, 2018. The Authority expects to renew the Line of
Credit, but there can be no assurance that the Line of Credit will in fact be renewed, or what the terms or amount will be.

-16-
THE AUTHORITY AND THE WASTEWATER SYSTEM
The Authority
The Authority is a joint exercise of powers authority that provides wastewater transmission, treatment, and effluent disposal services to the Cities of Belmont, Redwood City, and San Carlos, and the West Bay Sanitary District (defined as the “Members” in this Official Statement). The Members are all located in the northern part of Silicon Valley, nearly midway between the cities of San Francisco and San Jose. The Authority’s wastewater treatment plant is located in Redwood City and serves more than 200,000 people in located in its Members’ communities.
The Authority is a distinct public entity that operates under a Joint Exercise of Powers
Agreement (the “Joint Powers Agreement”) dated November 13, 1975, as amended, among the Members. Under the Joint Powers Agreement, the Authority owns and operates certain wastewater facilities and the Members are obligated to pay the Authority for their allocable share of the Authority’s operating, maintenance, and capital expenses. The Authority is organized and exists under the laws of the State of California.
Authority facilities include: a wastewater treatment plant located in Redwood City, wastewater pump stations in Menlo Park, Redwood City, Belmont, and San Carlos; a booster pump station located in San Carlos; an approximately nine-mile influent force main pipeline that conveys wastewater from Members to the wastewater treatment plant; and a 1.25-mile effluent disposal pipeline to discharge treated effluent into the San Francisco Bay. The Authority also provides recycled water to Redwood City following treatment by the Authority pursuant to applicable standards, under an agreement for the production of recycled water, through disinfection facilities owned by Redwood City and operated by the Authority. Under the agreement, Redwood City reimburses the Authority for costs associated with the production of recycled water. The Authority operates in full compliance with its Waste Discharge Permit issued by the State of California.
Participating Members in this 2018 Bond issue include the City of Redwood City, the City of San Carlos and the West Bay Sanitary District. Each has covenanted to pay its allocable share of debt service on the 2018 Bonds. The City of Belmont has elected not to be a Participating Member and has no obligation to pay any debt service on the 2018 Bonds.
City of Redwood City - Redwood City is located approximately 25 miles south of San
Francisco, roughly midway between San Francisco and San Jose, and has a population of roughly 85,600 people. Redwood City owns and operates a sanitary sewer collection system consisting of approximately 200 miles of sewer pipelines and 31 sewer lift stations. In addition to providing wastewater service within its boundaries, the City also conveys wastewater from five San Mateo County sewer maintenance districts and the Town of Woodside to the Authority for treatment and effluent disposal pursuant to agreements with each agency. See Appendix A for a description of the City of Redwood City and its Sewer System.
City of San Carlos - San Carlos is located approximately 22 miles south of San Francisco
and about 26 miles north of San Jose. San Carlos has a population of roughly 29,000 people and owns and operates a sanitary sewer collection system consisting of approximately 105 miles of sewer pipelines ranging in size from 5 to 27 inches in diameter, and 6 sewer lift stations. In addition to providing wastewater service within its boundaries, San Carlos also conveys wastewater from four San Mateo County sewer maintenance

-17-
districts to the Authority for treatment and effluent disposal pursuant to agreements with each agency. See Appendix B for a description of the City of San Carlos and its Sewer System.
West Bay Sanitary District - The West Bay Sanitary District (“WBSD”) is an independent
special district that provides wastewater service to the City of Menlo Park and surrounding areas. The WBSD is located approximately 26 miles south of San Francisco and about 20 miles north of San Jose. WBSD serves a population of approximately 55,000 people and owns and operates a sanitary sewer collection system consisting of approximately 200 miles of sewer pipelines, and 13 sewer pump stations. See Appendix C for a description of the WBSD and its Sewer System.
City of Belmont - The City of Belmont is located approximately 20 miles south of San Francisco and has a population of roughly 28,000 people. The City of Belmont owns and operates a sanitary sewer collection system consisting of approximately 80 miles of sewer pipelines and 12 sewer lift stations. The City of Belmont is not a Participating Member with respect to the 2018 Bonds. The City of Belmont is obligated to contribute its share towards the completion of the Authority’s CIP. Belmont has historically contributed amounts towards the CIP from cash or the sale of bonds by the City of Belmont. The City of Belmont is expected to contribute approximately $16.9 million towards the Projects over the next 18 months.
See “APPENDIX A”, “APPENDIX B” and “APPENDIX C” for additional information regarding
the Participating Members.
Governance & Management
Commission. The Authority is governed by a four-member “Commission” consisting of one appointed member from each of the Members’ governing bodies. Current Commission Members are:
Commissioner Title Agency Represented
John Seybert Chair City of Redwood City Warren Lieberman Vice Chair City of Belmont
Robert Grassilli Secretary City of San Carlos George Otte Member West Bay Sanitary District
Voting is proportional to the Members’ respective ownership interests in the Authority’s
wastewater system. There is currently a total of 100 votes which are allocated as follows:
Redwood City 42 votes West Bay Sanitary District 28 votes San Carlos 19 votes City of Belmont 11 votes
A proportionally-weighted vote of at least three-fourths of the total Commission votes is
required to adopt or amend bylaws, rules, and regulations; to adopt or modify any budget; to approve any capital costs, contracts, appropriations, or transfers of more than $75,000; to employ the manager, engineers, and certain other consultants; to sell or dispose of property; and to

-18-
approve other designated items. Other actions of the Commission must be approved by a majority of total possible votes.
Any amendment of the Joint Powers Agreement requires the concurrence of all of the
Members. In addition, any amendment to the Joint Powers Agreement must also be approved by a four-fifths vote by each of the Members’ governing bodies.
SVCW has no taxing power and therefore receives nearly all of its funding, other than
interest earnings and other miscellaneous revenues, according to rules established by the Joint Powers Agreement. Combined, Members pay all expenditures associated with operations, capital repairs, capital improvements, contributions to capital improvement reserves, debt service, and debt reserves. According to the Joint Powers Agreement, capital improvement costs and contributions to capital improvement reserves are allocated as follows:
Redwood City 48.57% West Bay Sanitary District 26.84% San Carlos 15.14% City of Belmont 9.45%
Capital and Operating Budgets. Each year the SVCW Commission adopts an Operating
and pay-go Capital budget for the following year. The budget establishes the funding requirements for each of the Members. Operating expenses, capital project contributions, and cash reserve contributions are paid in twelve monthly installments. Payments in respect of debt service on the SRF Loans are paid on an annual basis.
Operating costs are allocated to each Member based on a three-year average of each
Member’s annual pro-rata share of total wastewater flow and strength loadings as measured by biological oxygen demand (“BOD”) and suspended solids (“SS”). As a result, the Budget for fiscal year 2017-18 allocated operating costs as follows:
Redwood City 46.5% West Bay Sanitary District 27.9% San Carlos 12.8% City of Belmont 12.8%
After the close of the fiscal year, the payments made by each Member towards operating
budgets are reconciled against the actual expenditures allocated to each Member according to the Joint Powers Agreement. Any difference is applied toward fund reserves held by the Authority on behalf of each Member.
Member Residential Sewer Charges. Significant rate increases were necessary to fund
SVCW’s capital improvement projects. Since 2008, Members have proactively raised sewer rates to support their allocable share of the CIP, as well as to fund their own operating and capital programs. See Table 3 for the single-family residential monthly sewer rate increases as adopted by each Member from 2007-08 to current.
Comparative Residential Sewer Charges
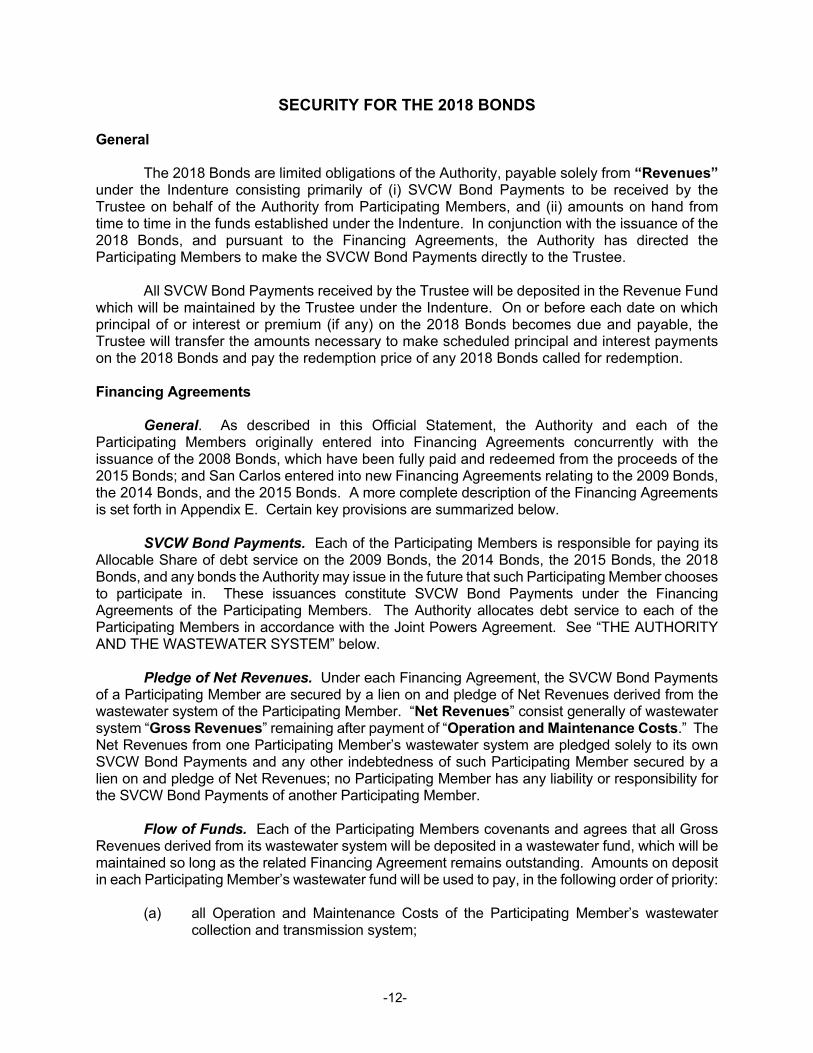
Wastewater Rates. Each of the Participating Members’ wastewater rates has increased in recent years, and it is anticipated that rates will continue to increase annually. See the sections entitled “Wastewater Rates” in each of Appendices A, B and C for information about the
-19-
Participating Members’ current wastewater rates. The table below shows single-family residential monthly sewer charges for each of the Participating Members since for fiscal years 2012-13 through 2017-18.
Table 1
SILICON VALLEY CLEAN WATER Single-Family Residential Monthly Sewer Service Charges
2012-13 2013-14 2014-15 2015-16 2016-17 2017-18
Redwood City $57.88 $63.09 $68.77 $74.95 $75.11 $76.68 San Carlos 53.10 67.29 80.75 88.82 88.82 93.26 West Bay Sanitary District 62.67 68.33 74.42 81.08 85.92 89.33 Source: Participating Members
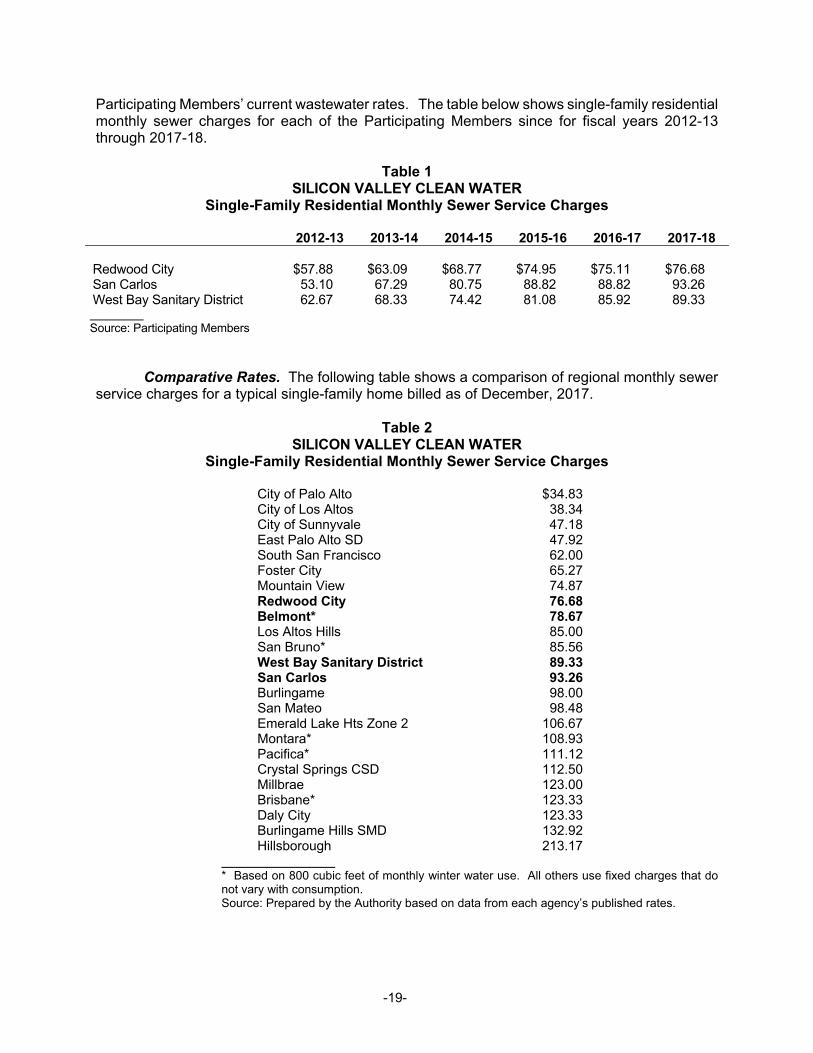
Comparative Rates. The following table shows a comparison of regional monthly sewer
service charges for a typical single-family home billed as of December, 2017.
Table 2 SILICON VALLEY CLEAN WATER
Single-Family Residential Monthly Sewer Service Charges
City of Palo Alto $34.83 City of Los Altos 38.34 City of Sunnyvale 47.18 East Palo Alto SD 47.92 South San Francisco 62.00 Foster City 65.27 Mountain View 74.87 Redwood City 76.68 Belmont* 78.67 Los Altos Hills 85.00 San Bruno* 85.56 West Bay Sanitary District 89.33 San Carlos 93.26 Burlingame 98.00 San Mateo 98.48 Emerald Lake Hts Zone 2 106.67 Montara* 108.93 Pacifica* 111.12 Crystal Springs CSD 112.50 Millbrae 123.00 Brisbane* 123.33 Daly City 123.33 Burlingame Hills SMD 132.92 Hillsborough 213.17
* Based on 800 cubic feet of monthly winter water use. All others use fixed charges that do not vary with consumption. Source: Prepared by the Authority based on data from each agency’s published rates.
-20-
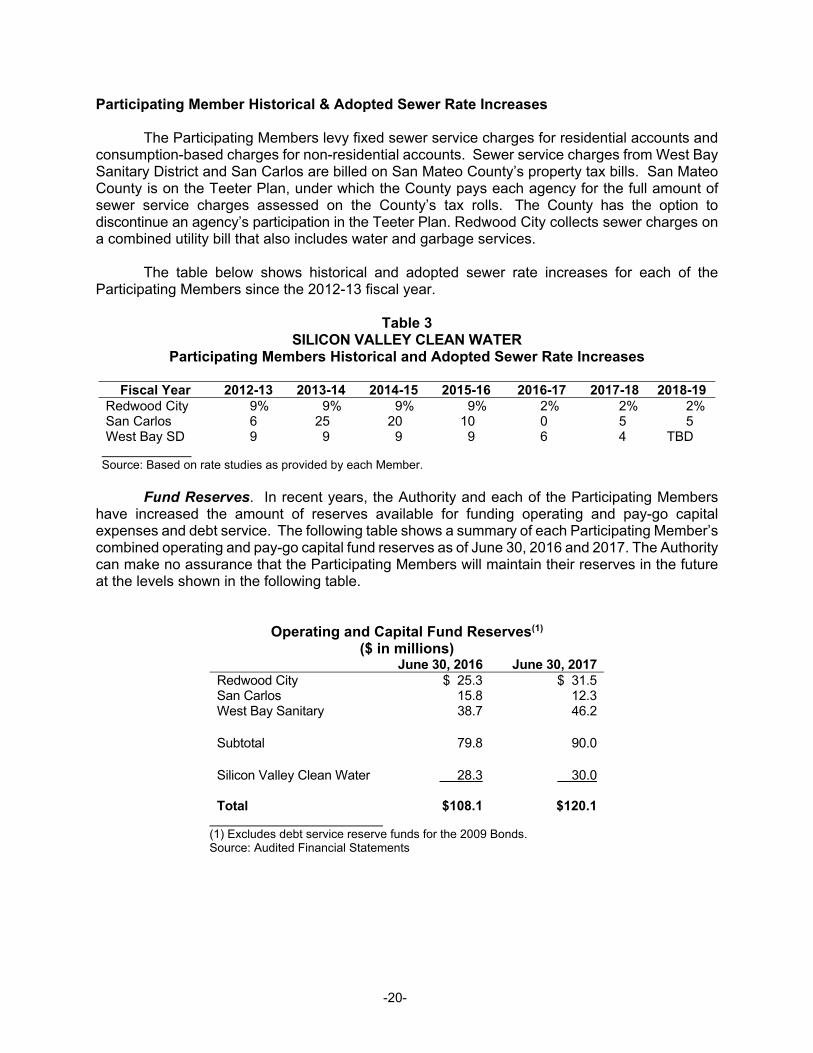
Participating Member Historical & Adopted Sewer Rate Increases
The Participating Members levy fixed sewer service charges for residential accounts and consumption-based charges for non-residential accounts. Sewer service charges from West Bay Sanitary District and San Carlos are billed on San Mateo County’s property tax bills. San Mateo County is on the Teeter Plan, under which the County pays each agency for the full amount of sewer service charges assessed on the County’s tax rolls. The County has the option to discontinue an agency’s participation in the Teeter Plan. Redwood City collects sewer charges on a combined utility bill that also includes water and garbage services.
The table below shows historical and adopted sewer rate increases for each of the
Participating Members since the 2012-13 fiscal year.
Table 3 SILICON VALLEY CLEAN WATER
Participating Members Historical and Adopted Sewer Rate Increases
Fiscal Year 2012-13 2013-14 2014-15 2015-16 2016-17 2017-18 2018-19 Redwood City 9% 9% 9% 9% 2% 2% 2% San Carlos 6 25 20 10 0 5 5 West Bay SD 9 9 9 9 6 4 TBD
Source: Based on rate studies as provided by each Member.
Fund Reserves. In recent years, the Authority and each of the Participating Members
have increased the amount of reserves available for funding operating and pay-go capital expenses and debt service. The following table shows a summary of each Participating Member’s combined operating and pay-go capital fund reserves as of June 30, 2016 and 2017. The Authority can make no assurance that the Participating Members will maintain their reserves in the future at the levels shown in the following table.
Operating and Capital Fund Reserves(1)
($ in millions) June 30, 2016 June 30, 2017 Redwood City $ 25.3 $ 31.5 San Carlos 15.8 12.3 West Bay Sanitary 38.7 46.2 Subtotal 79.8 90.0 Silicon Valley Clean Water 28.3 30.0 Total $108.1 $120.1
(1) Excludes debt service reserve funds for the 2009 Bonds. Source: Audited Financial Statements
-21-
Manager. The Commission appoints a Manager who is responsible for day-to-day management of the Authority under policy guidelines set by the Commission. In 2006, the Commission appointed Daniel Child as Manager. Mr. Child has more than 35 years of experience in the management of various municipal, industrial, and public works facilities. Before joining the Authority, he served as area manager/vice president of operations for Veolia Water North America West LLC, the nation’s leading water services provider for local and federal governments and business and industry. In that capacity, he managed the activities of more than 60 water treatment, wastewater treatment and public works operations throughout the western U.S. Before that, he served as an account manager for US Filter Corporation/Davis Products Division (which was acquired by Veolia), providing municipalities and consulting firms with products and engineering support to meet various wastewater treatment needs.
Mr. Child began his career in 1981, working six years as wastewater superintendent for the
Price River Water Improvement District in Carbon County, Utah. He served as operations manager with the Victor Valley Wastewater Reclamation Authority in southern California, from September 1987 to February 1989 and also from February 1992 to August 1995. In between, he served as wastewater superintendent for the City of San Diego’s Metropolitan Wastewater Division. He is a past president of the Desert and Mountain Section of the California Water Environment Association.
Chief Engineer / Assistant Manager. Teresa Herrera has over 35 years of wastewater engineering experience, and joined Silicon Valley Clean Water in 2008 as Plant Engineer to create an Engineering Department and implement its inaugural Capital Improvement Program. In 2012 Teresa was promoted to Assistant Manager/Authority Engineer. Teresa now oversees the Authority’s $833 million CIP and is implementing SVCW’s first Design-Build projects.
Teresa received her Bachelor’s degree in Civil Engineering from California Polytechnic
State University and her Masters of Science in Civil Engineering from the University of California, Davis. Teresa then joined the consulting firm of Whitley Burchett & Associates (WBA). She served as president of the company from 2001 to 2008. WBA served public agencies throughout Northern California as District Engineer, Program Managers and Project Managers for both large and small wastewater agency facilities.
Chief Financial Officer. Matt Anderson joined SVCW in 2014 as the Chief Financial Officer. He has 25 years of financial management experience in the water and transportation industries. Prior to joining SVCW Matt served as Chief Financial Officer for the Goleta Water District in Santa Barbara, California. He also worked in the airline sector for fourteen years, most recently as Managing Director of Finance and Administration for Northwest Airlines’ international division. Matt has managed $500 million annual operating budgets spanning nine countries, 200 cost centers, and 2,000 employees. He brings private-sector experience to the public utility sector by introducing long-range financial planning, zero-based budgeting, and effective management reporting. Matt started his career with the accounting firm KPMG and maintains his Certified Public Accountant designation. He has an MBA from California Polytechnic State University. The Wastewater System
The Authority owns and operates a wastewater conveyance, treatment, and effluent disposal system for the shared benefit of the Members. The Members each own and operate their own wastewater collection systems serving their respective service areas. Wastewater is conveyed from each of the Members to the Authority’s wastewater treatment plant via the Authority’s conveyance system.

-22-
The wastewater treatment plant has been in operation since its construction in 1980, and major electrical, mechanical and instrumentation components are nearing the end of their useful lives. In addition, both concrete structures and the miscellaneous metal components of the facilities are in need of rehabilitation to ensure a continued useful life into SVCW’s future.
Reliable and efficient operation and maintenance of the plant and conveyance system
infrastructure are required to ensure the continued health and protection of the environment and for meeting the effluent quality and discharge requirements set forth in the Authority’s National Pollution Discharge Eliminations System (“NPDES”) Permit issued by the state (NPDES Permit No. CA0038369). Other regulatory permit requirements are also placed upon SVCW including air quality, odor control, safety, and record-keeping. The various regulatory permits under which SVCW operates require expenditure of capital to prevent fines for violations and to meet possible future, restrictive changes to the permits. It is also necessary to upgrade the facilities to improve operations in an effort to reduce costs as well as improving the facility’s operational reliability. Finally, it is necessary to expend capital funds to match the capacity needs of the service area.
In 2008, the Authority began evaluating the operational integrity of existing facilities, and
determined extensive improvements were necessary to ensure uninterrupted treatment operations, address future regulatory changes, increase treatment capacity, and strengthen safety. The original 2008 CIP 10-Year plan included 131 projects necessary to achieve this. The CIP has been updated five times since 2008, most recently in October 2017. As of the date of this Official Statement, the 2017 CIP remains the Authority’s guiding document. The 2017 CIP now includes 201 projects, half of which are complete, each the result of defining the project scope, estimating necessary budgets, determining the timing of implementation, and identifying specific sources of funds. While the original CIP was a 10-Year Plan, the 2017 update anticipates completion of the CIP in 2025.
Wastewater Conveyance System: Forcemains and Pump Stations. The conveyance
system consists of approximately 9 miles of influent force main pipeline and four pump stations. The influent force main varies in diameter from 33 to 63 inches as the pipeline approaches the treatment plant. A portion of the influent force main originally served as the outfall for Redwood City’s and San Carlos’ wastewater systems and was converted into an influent force main when the Authority’s treatment plant was constructed in 1980. This portion of the influent force main has been operating at a higher pressure than it was originally designed for.
Four pump stations pump raw wastewater through the influent force main including one
pump station for each of the Members and a booster pump station benefiting West Bay Sanitary District and Redwood City, the two agencies whose wastewater travels furthest to the treatment plant. The Authority’s pump stations are approximately 40 to 50 years old and need to be rehabilitated and/or replaced in the near future. See “THE AUTHORITY AND THE WASTEWATER SYSTEM – Capital Improvement Program”.
Wastewater Treatment Plant. The Authority’s wastewater treatment plant was
constructed in 1980 and is located in the Redwood Shores area of Redwood City bordering the San Francisco Bay. The treatment plant processes all wastewater conveyed from each of the Members’ sewer service areas. The treatment plant is comprised of liquid and solids treatment processes. Most of the treated effluent is disposed via the Authority’s effluent disposal pipeline. However, a portion of the Authority’s wastewater undergoes a higher level of treatment and disinfection and is used to supply recycled water to Redwood City.

-23-
Liquid Processing. Wastewater is delivered directly to the treatment plant’s primary sedimentation tanks (“PST”). The PST provides the first step of treatment to the raw sewage. By allowing heavy material to settle and light material to float and be sent to the solids processing units. The water from the PST process is then sent to biological treatment that consists of 4 fixed film reactors and aeration in 4 aeration basins to remove biological contaminants. The water in the aeration basins is then directed to the secondary sedimentation tank (“SST”) for separation of solids from the liquid. The SST process generates fairly clear effluent that flows to the dual media filters for further removal of small solids from the water. Dual media filtration followed by disinfection with sodium hypochloride concludes the treatment of the liquid stream in the treatment plant. The disinfected and dechlorinated advanced secondary treated effluent is then pumped to the bay via a 66-inch diameter outfall.
Solids Processing. The primary functions of the solids handling facilities are to stabilize
the organic solids in the wastewater stream, reclaim the heat value of the organic solids for power generation, and reduce the sludge volume to minimize the cost of disposal. The treatment plant processes a solids stream that is predominantly made up of a primary sludge consisting of a slurry of settled solids and primary scum (slurry with floated oil/grease/scum) withdrawn from the primary sedimentation tanks and the waste activated sludge (“WAS”) derived from the aeration basins. In addition to the primary sludge, the primary scum and the WAS, the anaerobic digesters also receive grease and oily wastewater delivered to the septic receiving station at the treatment plant. With mixing and heating, the two designated primary digesters stabilize the sludge feed and generate sufficient digester gas to fire a co-generation facility that generates electricity to power much of the electrical demand within the treatment plant.
The digested solids are transferred periodically from the designated primary digesters to
a third digester that currently functions as a holding tank. The stored sludge is eventually withdrawn and transferred to the dewatering centrifuge to reduce its volume. The centrifuge removes liquid from the stabilized sludge, transforming the liquid sludge into a loose sludge cake. The dewatered sludge cake is disposed off-site in accordance with government regulations.
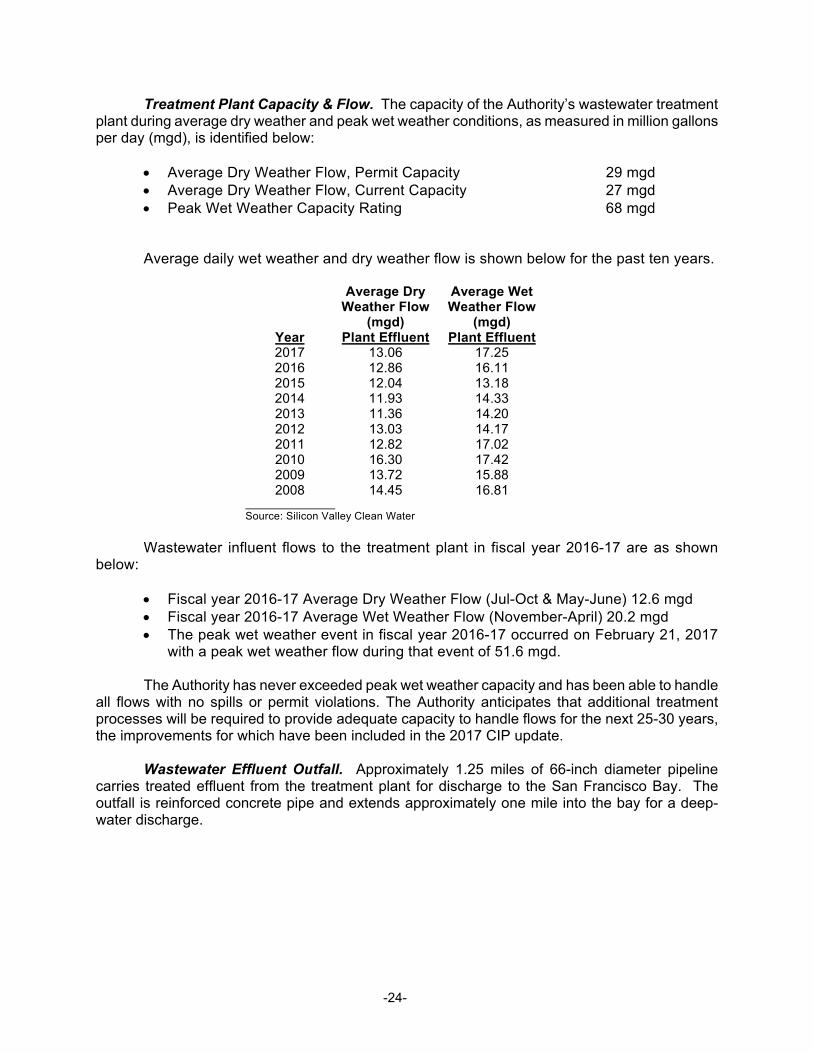
-24-
Treatment Plant Capacity & Flow. The capacity of the Authority’s wastewater treatment plant during average dry weather and peak wet weather conditions, as measured in million gallons per day (mgd), is identified below:
Average Dry Weather Flow, Permit Capacity 29 mgd Average Dry Weather Flow, Current Capacity 27 mgd Peak Wet Weather Capacity Rating 68 mgd
Average daily wet weather and dry weather flow is shown below for the past ten years.
Average Dry Weather Flow
(mgd)
Average Wet Weather Flow
(mgd) Year Plant Effluent Plant Effluent 2017 13.06 17.25 2016 12.86 16.11 2015 12.04 13.18 2014 11.93 14.33 2013 11.36 14.20 2012 13.03 14.17 2011 12.82 17.02 2010 16.30 17.42 2009 13.72 15.88 2008 14.45 16.81
Source: Silicon Valley Clean Water
Wastewater influent flows to the treatment plant in fiscal year 2016-17 are as shown
below:
Fiscal year 2016-17 Average Dry Weather Flow (Jul-Oct & May-June) 12.6 mgd Fiscal year 2016-17 Average Wet Weather Flow (November-April) 20.2 mgd The peak wet weather event in fiscal year 2016-17 occurred on February 21, 2017
with a peak wet weather flow during that event of 51.6 mgd. The Authority has never exceeded peak wet weather capacity and has been able to handle
all flows with no spills or permit violations. The Authority anticipates that additional treatment processes will be required to provide adequate capacity to handle flows for the next 25-30 years, the improvements for which have been included in the 2017 CIP update.
Wastewater Effluent Outfall. Approximately 1.25 miles of 66-inch diameter pipeline
carries treated effluent from the treatment plant for discharge to the San Francisco Bay. The outfall is reinforced concrete pipe and extends approximately one mile into the bay for a deep-water discharge.

-25-
Sewer Utility Regulatory Issues
General. Regulatory requirements applicable to the Authority’s wastewater conveyance, treatment and effluent disposal system are contained in or imposed by regulation pursuant to the Federal Water Pollution Control Act, as amended, and the State of California Porter Cologne Water Quality Control Act of 1969, as amended. Both federal and State regulations are administered through the San Francisco Bay Regional Water Quality Control Board (the “Regional Board”). The Authority is not aware of any environmental or regulatory issues that would adversely impact its ability to provide sewer collection service.
Waste Discharge Requirements. The Authority operates pursuant to a National Pollution
Discharge Eliminations System (“NPDES”) Permit issued by the state (NPDES Permit No. CA0038369) which establishes effluent quality and discharge requirements for the Authority’s treated wastewater. The NPDES Permit was renewed in 2017 and is set to expire in 2022. The Authority operates in full compliance with its discharge permit. Capital Improvement Program
The Authority is in the process of rebuilding, rehabilitating, and upgrading its wastewater transmission and treatment facilities, which are approaching the end of their useful operating lives. The Authority initially developed its 10-Year Capital Improvement Program in 2008 to provide a proactive plan for addressing the Authority’s near-term and long-term capital needs. The Authority’s Engineering Division staff updated the CIP in October 2017, which as of the date of this Official Statement remains the Authority’s guiding CIP document.
Since 2008 the Authority has been improving / upgrading / updating its capital facilities
and has spent nearly $244 million on capital infrastructure and upgrades. Following is a table summarizing the expenditures and completed projects as of October 2017.
CIP Program Description
Expenditures Conveyance System $ 85.1 Energy and Automation 77.1 General Plant Facilities 35.2 Solids Handling 17.6 Plant Processes 15.3 Corrosion and Odor Control 12.7 Biological/Secondary Process Optimization 0.6 CIP Support 0.4 TOTAL $244.0
Approximately $596 million of additional capital funding is needed over approximately the
next eight years (including funding from the 2018 Bonds and excluding future cost inflation). The Authority anticipates funding its remaining CIP costs via a combination of bonds, SRF Loans issued by the SWRCB, and cash funding.
The updated CIP identifies 101 projects targeted for completion over the next eight years.
SVCW believes these projects, when complete, will comprehensively address all known issues with the Authority’s wastewater system, including:
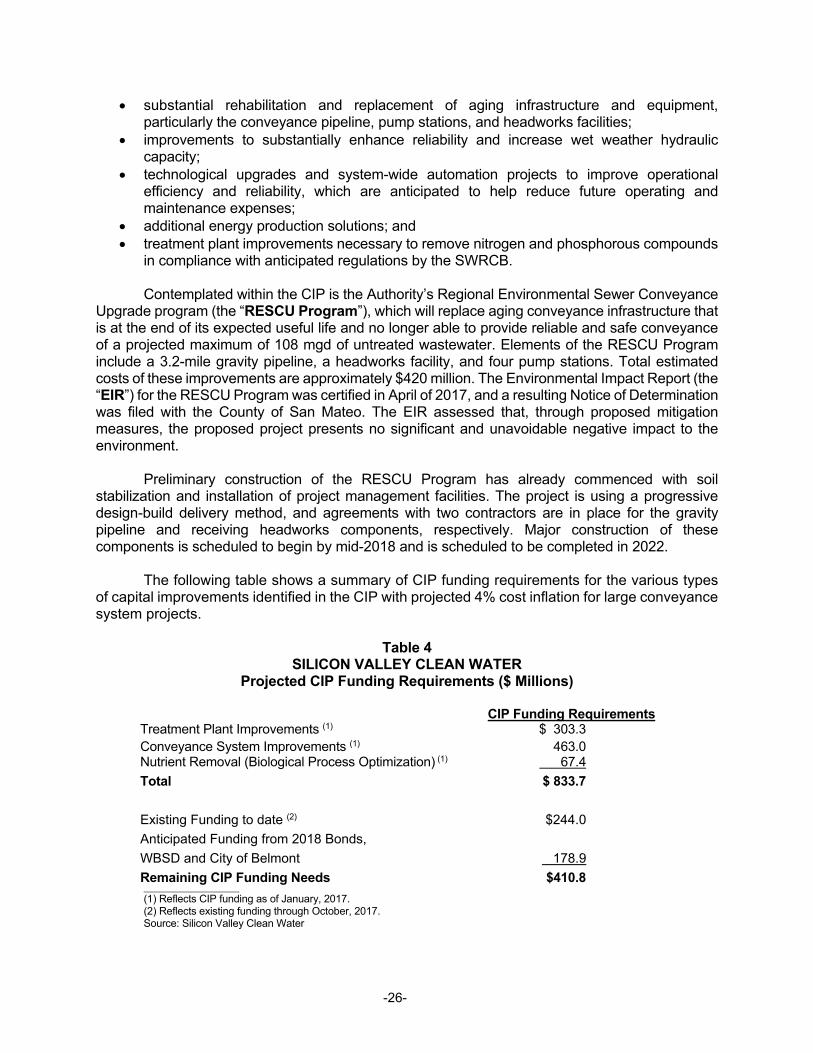
-26-
substantial rehabilitation and replacement of aging infrastructure and equipment, particularly the conveyance pipeline, pump stations, and headworks facilities;
improvements to substantially enhance reliability and increase wet weather hydraulic capacity;
technological upgrades and system-wide automation projects to improve operational efficiency and reliability, which are anticipated to help reduce future operating and maintenance expenses;
additional energy production solutions; and treatment plant improvements necessary to remove nitrogen and phosphorous compounds
in compliance with anticipated regulations by the SWRCB. Contemplated within the CIP is the Authority’s Regional Environmental Sewer Conveyance
Upgrade program (the “RESCU Program”), which will replace aging conveyance infrastructure that is at the end of its expected useful life and no longer able to provide reliable and safe conveyance of a projected maximum of 108 mgd of untreated wastewater. Elements of the RESCU Program include a 3.2-mile gravity pipeline, a headworks facility, and four pump stations. Total estimated costs of these improvements are approximately $420 million. The Environmental Impact Report (the “EIR”) for the RESCU Program was certified in April of 2017, and a resulting Notice of Determination was filed with the County of San Mateo. The EIR assessed that, through proposed mitigation measures, the proposed project presents no significant and unavoidable negative impact to the environment.
Preliminary construction of the RESCU Program has already commenced with soil
stabilization and installation of project management facilities. The project is using a progressive design-build delivery method, and agreements with two contractors are in place for the gravity pipeline and receiving headworks components, respectively. Major construction of these components is scheduled to begin by mid-2018 and is scheduled to be completed in 2022.
The following table shows a summary of CIP funding requirements for the various types
of capital improvements identified in the CIP with projected 4% cost inflation for large conveyance system projects.
Table 4
SILICON VALLEY CLEAN WATER Projected CIP Funding Requirements ($ Millions)
CIP Funding Requirements
Treatment Plant Improvements (1) $ 303.3 Conveyance System Improvements (1) 463.0 Nutrient Removal (Biological Process Optimization) (1) 67.4
Total $ 833.7
Existing Funding to date (2) $244.0
Anticipated Funding from 2018 Bonds,
WBSD and City of Belmont 178.9
Remaining CIP Funding Needs $410.8
(1) Reflects CIP funding as of January, 2017. (2) Reflects existing funding through October, 2017. Source: Silicon Valley Clean Water
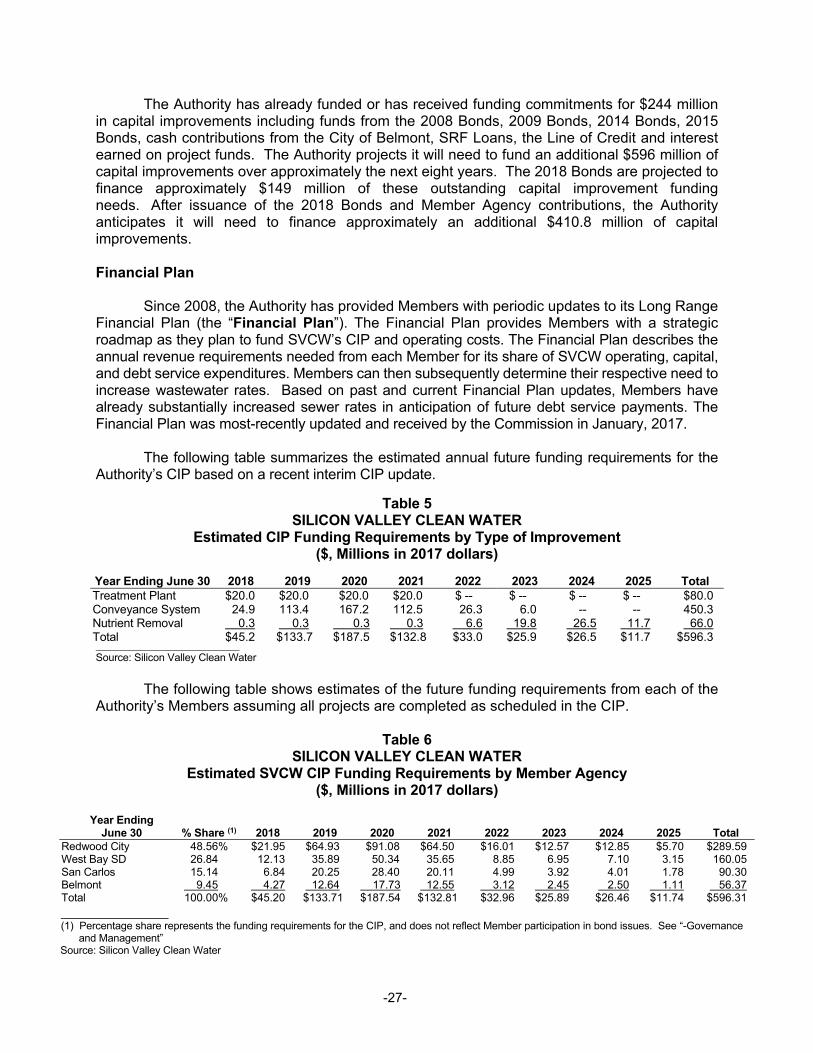
-27-
The Authority has already funded or has received funding commitments for $244 million in capital improvements including funds from the 2008 Bonds, 2009 Bonds, 2014 Bonds, 2015 Bonds, cash contributions from the City of Belmont, SRF Loans, the Line of Credit and interest earned on project funds. The Authority projects it will need to fund an additional $596 million of capital improvements over approximately the next eight years. The 2018 Bonds are projected to finance approximately $149 million of these outstanding capital improvement funding needs. After issuance of the 2018 Bonds and Member Agency contributions, the Authority anticipates it will need to finance approximately an additional $410.8 million of capital improvements. Financial Plan
Since 2008, the Authority has provided Members with periodic updates to its Long Range Financial Plan (the “Financial Plan”). The Financial Plan provides Members with a strategic roadmap as they plan to fund SVCW’s CIP and operating costs. The Financial Plan describes the annual revenue requirements needed from each Member for its share of SVCW operating, capital, and debt service expenditures. Members can then subsequently determine their respective need to increase wastewater rates. Based on past and current Financial Plan updates, Members have already substantially increased sewer rates in anticipation of future debt service payments. The Financial Plan was most-recently updated and received by the Commission in January, 2017.
The following table summarizes the estimated annual future funding requirements for the Authority’s CIP based on a recent interim CIP update.
Table 5 SILICON VALLEY CLEAN WATER
Estimated CIP Funding Requirements by Type of Improvement ($, Millions in 2017 dollars)
Year Ending June 30 2018 2019 2020 2021 2022 2023 2024 2025 TotalTreatment Plant $20.0 $20.0 $20.0 $20.0 $ -- $ -- $ -- $ -- $80.0 Conveyance System 24.9 113.4 167.2 112.5 26.3 6.0 -- -- 450.3 Nutrient Removal 0.3 0.3 0.3 0.3 6.6 19.8 26.5 11.7 66.0 Total $45.2 $133.7 $187.5 $132.8 $33.0 $25.9 $26.5 $11.7 $596.3
Source: Silicon Valley Clean Water
The following table shows estimates of the future funding requirements from each of the
Authority’s Members assuming all projects are completed as scheduled in the CIP.
Table 6 SILICON VALLEY CLEAN WATER
Estimated SVCW CIP Funding Requirements by Member Agency ($, Millions in 2017 dollars)
Year Ending
June 30 % Share (1) 2018 2019 2020 2021 2022 2023 2024 2025 Total Redwood City 48.56% $21.95 $64.93 $91.08 $64.50 $16.01 $12.57 $12.85 $5.70 $289.59 West Bay SD 26.84 12.13 35.89 50.34 35.65 8.85 6.95 7.10 3.15 160.05 San Carlos 15.14 6.84 20.25 28.40 20.11 4.99 3.92 4.01 1.78 90.30 Belmont 9.45 4.27 12.64 17.73 12.55 3.12 2.45 2.50 1.11 56.37 Total 100.00% $45.20 $133.71 $187.54 $132.81 $32.96 $25.89 $26.46 $11.74 $596.31
(1) Percentage share represents the funding requirements for the CIP, and does not reflect Member participation in bond issues. See “-Governance
and Management” Source: Silicon Valley Clean Water

-28-
The Authority anticipates funding remaining CIP costs with a combination of bonds payable from SVCW Bond Payments and SRF Loans issued by the SWRCB, supplemented by the Line of Credit and potential pay-as-you-go cash funding, pending future approval by the Members.
Table 7
SILICON VALLEY CLEAN WATER Projected Sources of Funding for the SVCW CIP
($, Millions in 2017 dollars)
Year Ending June 30 2018 2019 2020 2021 2022 2023 2024 2025 TotalMember Agency Contributions(1) $4.27 $25.66 $0.00 $0.00 $0.00 $0.00 $0.00 $0.00 $29.93 Gov’t Loan Programs -- -- -- -- 6.62 19.85 26.46 11.74 64.67 Fixed Rate Bonds(2) 40.92 108.05 143.06 94.68 -- -- -- -- 386.71 Variable Rate Bonds(2) -- -- 44.48 38.13 26.35 6.04 -- -- 115.00 Total $45.20 $133.71 $187.54 $132.81 $32.96 $25.89 $26.46 $11.74 $596.31 (1) Member Agency contributions are anticipated to be funded by either available cash, bond financings or available interim financing. (2) Reflects funding from bond financings issued by SVCW. Source: Silicon Valley Clean Water
Member Financial Projections
Each of the Members has been proactively raising sewer rates to support its allocable share of funding requirements for the Authority’s operations and CIP, as well as its own operating and capital programs. Appendices A, B, and C show long-term financial projections for each Participating Member that incorporates updated CIP cost and financing projections from the Financial Plan. See “APPENDIX A,” “APPENDIX B” and “APPENDIX C.”
Budget and Billing Process
Each year, the Authority’s Commission adopts a budget for the upcoming fiscal year. The budget establishes the funding requirements for each of the Members. Operating and maintenance expenses, as well as capital and reserve contributions, are paid in 12 monthly installments. Payments in respect of debt service on the SRF Loans are paid on an annual basis. After the close of the fiscal year, the annual payments made by each Member are reconciled against the actual expenditures allocated to each Member, and any difference is applied toward fund reserves held by the Authority on behalf of each Member.
Currently, the Authority has adopted two cash reserve policies established to mitigate the
negative impact of revenue shortfalls from economic fluctuations, to fund unforeseen expense requirements, to provide stable rates for member entities, and to help fund future long-term capital needs. As of June 30, 2017 the operating reserve was funded at approximately $3.49 million, which is equal to 10% of the approved operating and pay-go capital budget plus an additional $1 million. A separate CIP program reserve is at approximately $16.1 million as of June 30, 2017 which, with annual contributions from Members, will grow to the calculated amount of depreciation of SVCW facilities to meet the long-term needs of replacing capital assets upon reaching the end of their useful life. The Authority also holds an additional “Stage 2” reserve of $9.2 million in funds that are available to finance projects that add capacity. If the amount of fund reserves held by the Authority on any Member’s behalf falls below the target, the Authority includes a line item in its budget to bring the reserves back up to the target level. The Authority has the ability to amend its reserve policy at any time.

-29-
The Authority has no taxing power. The Authority receives almost all of its funding, other than interest earnings and other miscellaneous revenues, from payments made by the Members, which include payments for operations, capital repairs, capital reserves, SRF loans and SRF loan reserve requirements. To the best of the knowledge of Authority staff, there have never been any payment delinquencies by any of the Members. Maximum Capacity Rights Owned by Members
Under the Joint Powers Agreement, each of the Members has rights to capacity in the treatment plant as shown on the following table.
Table 8
SILICON VALLEY CLEAN WATER Maximum Capacity Rights Per Member
Member
Average Daily Dry Weather Flow (mgd)
Peak Wet Weather
Flow (mgd) BOD
(lbs per day) SS
(lbs per day) Belmont 2.3 8.8 5,204 5,678 Redwood City (1) 11.4 30.5 38,727 36,510 San Carlos 3.7 14.3 6,982 9,554 West Bay SD 6.6 14.4 14,137 13,308 Total 24.0 68.0 65,050 65,050
(1) Peak Wet Weather Flow shown for Redwood City is for capacity rights in treatment plant. Redwood City’s Peak Wet
Weather Flow capacity in the conveyance system is 25.9 mgd. Source: SVCW Joint Powers Agreement
Under the Joint Powers Agreement, any of the Members can purchase or lease available
capacity from any of the other Members subject to written approval from the Authority.
Wastewater Flow
The following table shows a history of average daily wastewater flow conveyed to the Authority’s wastewater treatment plant from each Member for the last five fiscal years.
Table 9
SILICON VALLEY CLEAN WATER Average Wastewater Flow (mgd)
Member 2012-13 2013-14 2014-15 2015-16 2016-17 Redwood City 6.4 6.6 6.1 6.4 8.0 WBSD 3.5 3.5 3.6 3.8 4.1 San Carlos 1.7 1.9 1.8 1.9 2.7 Belmont 1.7 1.9 1.9 1.7 2.1 Total 13.3 13.9 13.4 13.8 16.9
Source: Silicon Valley Clean Water

-30-
Capacity Fees for New Development Pursuant to the Joint Powers Agreement, the Authority has established a capacity fee to
recover costs for future expansion of Authority facilities. The fee is levied on new development within the Authority’s service area and is collected by the Members on the Authority’s behalf. The current capacity fee is $7.91 per gallon per day of estimated wastewater flow. For example, for a new single-family residence with an estimated wastewater discharge of 200 gallons per day, the Authority’s capacity fee would total approximately $1,582. The Authority has initiated a discussion of capacity fees with Members and may update its capacity fee schedule in the next fiscal year.
Outstanding Debt
The Authority has not previously issued bonds payable from its Revenues. However, the Authority previously issued: (i) the 2008 Bonds, which were payable from SVCW Bond Payments until they were defeased in October 2015, (ii) the 2009 Bonds, which were partially defeased in October 2015 but remain secured by SVCW Bond Payments until August 1, 2019, and (iii) the 2014 Bonds and 2015 Bonds, both of which are currently payable from SVCW Bond Payments under the Financing Agreements with respect to each of such bond issues.
The obligations of the Participating Members to make SVCW Bond Payments with respect
to the 2009 Bonds, SVCW Bond Payments with respect to the 2014 Bonds, SVCW Bond Payments with respect to the 2015 Bonds, and SVCW Bond Payments with respect to the 2018 Bonds are secured by their respective Net Revenues on a parity basis.
The Authority has obtained three SRF Loans for a combined total of $57 million of capital
project funding commitments currently outstanding in the amount of approximately $55 million as of August 2, 2017. The SRF Loans constitute indebtedness of the Authority, payments of which are made to the Authority by the Participating Members pursuant to the Joint Powers Agreement, and do not constitute indebtedness of the Participating Members pursuant to the Financing Agreements. The Authority anticipates obtaining additional funding through SRF Loans in the future. See “SECURITY FOR THE 2018 Bonds - State Revolving Fund Loans of the Authority.”
The Authority has a $30 million Line of Credit to provide interim funding and facilitate the
continued funding of capital projects prior to issuing the 2018 Bonds, payments of which are also made to the Authority by the Participating Members pursuant to the Joint Powers Agreement. As of January 25, 2018, there was $11.5 million outstanding under the Line of Credit. See “SECURITY FOR THE 2018 Bonds – Line of Credit.”
The Authority maintains an internet website for investors and potential investors
at www.svcwinvestors.org. The reference to this internet website is shown for reference and convenience only, the information contained within the website is not incorporated herein by reference.

-31-
Drought and Response
In recent years, the State of California has experienced drought conditions. However, as a result of above-average rainfall and snowfall, in April of 2017 the Governor issued an executive order declaring the drought to officially have ended in all but a few areas of the State. The Authority cannot predict whether drought conditions will return. Should drought conditions return, the financial impacts to each Participating Agency’s wastewater system are expected to be minimal. Each of the Participating Members levy fixed residential charges for sewer service that do not vary with changes in water consumption. Additionally, all of the Participating Members have already adopted wastewater rate increases that are projected to provide adequate financial capacity to fund their share of payments for the Authority’s operating and capital programs.
See “APPENDIX I” for the Authority’s audited financial statements.
-32-
CONSTITUTIONAL LIMITATIONS ON APPROPRIATIONS Article XIIIB Gann Limit
Article XIIIB of the California State Constitution limits the annual appropriations of the State and of any city, county, school district, authority or other political subdivision of the State to the level of appropriations of the particular governmental entity for the prior fiscal year, as adjusted for changes in the cost of living and population. The “base year” for establishing such appropriation limit is the 1978-79 fiscal year and the limit is to be adjusted annually to reflect changes in population and consumer prices. Adjustments in the appropriations limit of an entity may also be made if (i) the financial responsibility for a service is transferred to another public entity or to a private entity, (ii) the financial source for the provision of services is transferred from taxes to other revenues, or (iii) the voters of the entity approve a change in the limit for a period of time not to exceed four years.
Appropriations subject to Article XIIIB generally include the proceeds of taxes levied by
the State or other entity of local government, exclusive of certain State subventions and refunds of taxes. “Proceeds of taxes” include, but are not limited to, all tax revenues and the proceeds to an entity of government from (i) regulatory licenses, user charges, and user fees (but only to the extent such proceeds exceed the cost of providing the service or regulation), and (ii) the investment of tax revenues. Article XIIIB includes a requirement that if an entity’s revenues in any year exceed the amounts permitted to be spent, the excess would have to be returned by revising tax rates or fee schedules over the subsequent two years.
Certain expenditures are excluded from the appropriations limit including payments of
indebtedness existing or legally authorized as of January 1, 1979, or of bonded indebtedness thereafter approved by the voters and payments required to comply with court or federal mandates which without discretion require an expenditure for additional services or which unavoidably make the providing of existing services more costly.
Each of the Participating Members is of the opinion that its charges with respect to its
wastewater system do not exceed the costs it reasonably bears in providing wastewater service and are not subject to the limits of Article XIIIB.
Articles XIIIC and XIIID
General. On November 5, 1996, California voters approved Proposition 218, the so-called "Right to Vote on Taxes Act." Proposition 218 added Articles XIIIC and XIIID to the State Constitution, which affect the ability of local governments to levy and collect both existing and future taxes, assessments, and property-related fees and charges. Proposition 218, which generally became effective on November 6, 1996, changed, among other things, the procedure for the imposition of any new or increased property-related "fee" or "charge," which is defined as "any levy other than an ad valorem tax, a special tax or an assessment, imposed by a local government upon a parcel or upon a person as an incident of property ownership, including user fees or charges for a property related service" (and referred to in this section as a “property-related fee or charge”).
On November 2, 2010, California voters approved Proposition 26, the so-called
“Supermajority Vote to Pass New Taxes and Fees Act”. Section 1 of Proposition 26 declares that Proposition 26 is intended to limit the ability of the State Legislature and local government to circumvent existing restrictions on increasing taxes by defining the new or expanded taxes as

-33-
“fees.” Proposition 26 amended Articles XIIIA and XIIIC of the State Constitution. The amendments to Article XIIIA limit the ability of the State Legislature to impose higher taxes (as defined in Proposition 26) without a two-thirds vote of the Legislature. Proposition 26’s amendments to Article XIIIC broadly define “tax,” but specifically exclude, among other things:
“(1) A charge imposed for a specific benefit conferred or privilege granted directly to
the payor that is not provided to those not charged, and which does not exceed the reasonable costs to the local government of conferring the benefit or granting the privilege.
(2) A charge imposed for a specific government service or product provided directly
to the payor that is not provided to those not charged, and which does not exceed the reasonable costs to the local government of providing the service or product.
... (6) A charge imposed as a condition of property development. (7) Assessments and property-related fees imposed in accordance with the provisions
of Article XIII D.” Property-Related Fees and Charges. Under Article XIIID, before a municipality may
impose or increase any property-related fee or charge, the entity must give written notice to the record owner of each parcel of land affected by that fee or charge. The municipality must then hold a hearing upon the proposed imposition or increase at least 45 days after the written notice is mailed, and, if a majority of the property owners of the identified parcels present written protests against the proposal, the municipality may not impose or increase the property-related fee or charge.
Further, under Article XIIID, revenues derived from a property-related fee or charge may
not exceed the funds required to provide the "property-related service" and the entity may not use such fee or charge for any purpose other than that for which it imposed the fee or charge. The amount of a property-related fee or charge may not exceed the proportional cost of the service attributable to the parcel, and no property-related fee or charge may be imposed for a service unless that service is actually used by, or is immediately available to, the owner of the property in question.
Initiative Power. In addition, Article XIIIC states that “the initiative power shall not be
prohibited or otherwise limited in matters of reducing or repealing any local tax, assessment, fee or charge. The power of initiative to affect local taxes, assessments, fees and charges shall be applicable to all local governments and neither the Legislature nor any local government charter shall impose a signature requirement higher than that applicable to statewide statutory initiatives.”
Judicial Interpretation of Articles XIIIC and XIIID. After Proposition 218 was enacted in
1996, appellate court cases and an Attorney General’s opinion initially indicated that fees and charges levied for water and wastewater services would not be considered property-related fees and charges, and thus not subject to the requirements of Article XIIID regarding notice, hearing and protests in connection with any increase in the fees and charges being imposed. However, three subsequent cases have held that certain types of water and wastewater charges could be subject to the requirements of Article XIIID under certain circumstances.
In Richmond v. Shasta Community Services District (2004) 32 Cal.4th 409, the California
Supreme Court addressed the applicability of the notice, hearing and protest provisions of Article

-34-
XIIID to certain charges related to water service. In Richmond, the Court held that capacity charges are not subject to Proposition 218. The Court also indicated in dictum that a fee for ongoing water service through an existing connection could, under certain circumstances, constitute a property-related fee and charge, with the result that a local government imposing such a fee and charge must comply with the notice, hearing and protest requirements of Article XIIID.
In Howard Jarvis Taxpayers Association v. City of Fresno (2005) 127 Cal.App.4th 914, the
California Court of Appeal, Fifth District, concluded that water, sewer and trash fees are property-related fees subject to Proposition 218 and a municipality must comply with Article XIIID before imposing or increasing such fees. The California Supreme Court denied the City of Fresno's petition for review of the Court of Appeal's decision on June 15, 2005.
In July 2006 the California Supreme Court, in Bighorn-Desert View Water Agency v. Verjil
(2006) 39 Cal.4th 205, addressed the validity of a local voter initiative measure that would have (a) reduced a water agency’s rates for water consumption (and other water charges), and (b) required the water agency to obtain voter approval before increasing any existing water rate, fee, or charge, or imposing any new water rate, fee, or charge. The court adopted the position indicated by its statement in Richmond that a public water agency’s charges for ongoing water delivery are “fees and charges” within the meaning of Article XIIID, and went on to hold that charges for ongoing water delivery are also “fees” within the meaning of Article XIIIC’s mandate that the initiative power of the electorate cannot be prohibited or limited in matters of reducing or repealing any local tax, assessment, fee or charge. Therefore, the court held, Article XIIIC authorizes local voters to adopt an initiative measure that would reduce or repeal a public agency’s water rates and other water delivery charges. (However, the court ultimately ruled in favor of the water agency and held that the entire initiative measure was invalid on the grounds that the second part of the initiative measure, which would have subjected future water rate increases to prior voter approval, was not supported by Article XIIIC and was therefore invalid.)
The court in Bighorn specifically noted that it was not holding that the initiative power is
free of all limitations; the court stated that it was not determining whether the electorate’s initiative power is subject to the statutory provision requiring that water service charges be set at a level that will pay for operating expenses, provide for repairs and depreciation of works, provide a reasonable surplus for improvements, extensions, and enlargements, pay the interest on any bonded debt, and provide a sinking or other fund for the payment of the principal of such debt as it may become due.
Articles XIIIC and XIIID and the Participating Members’ Water Rates and Charges.
The Participating Members’ current sewer rates (see Appendices A, B and C) were adopted by the governing boards of the respective Participating Members following notice to property owners and a public hearing held at least 45 days after the notice had been mailed, in compliance with the Bighorn decision.
The Participating Members believe their sewer rates and charges do not constitute “taxes”
under Article XIIIC as revised by Proposition 26 because, as described in subsection 1(e)(7) of Article XIIIC, they are “property-related fees imposed in accordance with the provisions of Article XIIID” (and are also charges for a “property-related service” as defined in subsection 2(g) of Article XIIID) and because, as described in subsection 1(e)(2) of Article XIIIC, they are charged for sewer service, which is “a specific government service or product provided directly to the payor that is not provided to those not charged.”

-35-
Conclusion. It is not possible to predict how courts will further interpret Article XIIIC and Article XIIID in future judicial decisions, and what, if any, further implementing legislation will be enacted.
Under the Bighorn case, local voters could adopt an initiative measure that reduces or
repeals the Participating Members’ rates and charges, though it is not clear whether (and California courts have not decided whether) any such reduction or repeal by initiative would be enforceable in a situation in which such rates and charges are pledged to the repayment of bonds or other indebtedness, as is the case with respect to the Financing Agreements.
There can be no assurance that the courts will not further interpret, or the voters will not
amend, Article XIIIC and Article XIIID to limit the ability of local agencies to impose, levy, charge and collect increased fees and charges for sewer service, or to call into question previously adopted sewer rate increases.

-36-
RISK FACTORS The following factors, along with other information in this Official Statement, should be
considered by potential investors in evaluating the risks in the purchase of the 2018 Bonds.
Demand for the Sewer Service
There can be no assurance that the demand for sewer service provided by the Participating Members’ wastewater systems will be maintained at current or historical levels. Reduction in the level of demand could require an increase in rates or charges in order to produce Net Revenues sufficient to comply with each Participating Member’s rate covenant in their related Financing Agreement. Such rate increases could increase the likelihood of nonpayment, and could also further decrease demand. Wastewater System Expenses
There can be no assurance that the wastewater system operating and maintenance expenses of each Participating Member or the Authority will be consistent with the levels described in this Official Statement. Increases in the cost of staffing, energy, or other expenses would reduce Net Revenues, and could require substantial increases in rates or charges in order to comply with the rate covenant. Furthermore, there can be no assurance that any other entity with regulatory authority over the Participating Members’ wastewater systems or the Authority’s system will not adopt further restrictions on operation of those wastewater systems, leading to increased rates. Such rate increases could increase the likelihood of nonpayment, and could also decrease demand.
If costs of the Project are higher than projected in the CIP, the Authority may have
additional financing needs. The CIP projections are based on current engineering and construction cost estimates.
Parity Debt
The Authority will not issue bonds payable from Revenues on a parity basis with the 2018 Bonds. However, the Authority has the right to issue additional bonds, notes or other obligations that are secured by payments made by any or all of the Members, which payments may be secured by a pledge of and lien on Net Revenues of such Members on a parity with the SVCW Bond Payments.
The Participating Members are authorized by the respective Financing Agreements to
issue indebtedness with a lien on Net Revenues on a parity basis with the SVCW Bond Payments, if certain financial tests are met. See “SECURITY FOR THE 2018 BONDS – Financing Agreements – Issuance of Parity Debt” above. These financial tests may involve, to some extent, projections of Net Revenues. There can be no assurance that the assumptions which form the basis of such projections, if any, will be actually realized subsequent to the date of such projections. If such assumptions are not realized, the amount of future Net Revenues may be less than projected, and the actual amount of Net Revenues may be insufficient to provide for the payment of the 2018 Bonds and such additional indebtedness.
-37-
Natural Disasters
General. The Authority and the Participating Members, like all northern California communities, are subject to unpredictable seismic activity, fires, floods, or other natural disasters. A severe natural disaster, such as an earthquake, fire, or flood, could result in substantial damage to the Authority and/or each of the Participating Members, including their wastewater systems. Such an event—which could increase the costs of operating and maintaining the Participating Members’ wastewater systems and could reduce revenues as a result of widespread damage—could adversely impact the Participating Members’ ability to pay their SVCW Bond Payment with which the Authority will pay principal and interest on the 2018 Bonds.
Seismic Activity. The Authority and/or each of the Participating Members could
experience ground shaking, ground failure, landslides or fault creep related to major faults in the area. The San Andreas Fault runs near the western edge of each Participating Member’s respective service areas. Large earthquakes on the San Andreas Fault were recorded in 1838, 1865, 1890, 1906 and 1989.
Flooding. A portion of each of the Participating Members’ service areas is mapped within
the 100-year flood plain and could be flooded during heavy rains. The Authority does not maintain insurance covering damage to the Project caused by earthquakes or flooding.
Fire. Wildfires have occurred in recent years in different regions of the State and a number
of fires were recently burning in California, damaging and threatening thousands of homes. There can be no assurance fires will not occur in the boundaries of the Authority in the future, leading to decreased usage of the Authority’s or any of the Members’ wastewater system, and a decline in Net Revenues available to pay debt service on the 2018 Bonds. The Authority carries property insurance for fire damage.
Drought. On April 1, 2015, for the first time in California’s history, Governor Edmund G.
Brown directed the SWRCB to implement mandatory water reductions in cities and towns across California to reduce water usage by 25%, which in many cases led to declines in wastewater usage as well. Following a wet winter in 2016-17, most of the mandatory water reductions have been lifted. However, there can be no assurance that future drought conditions would not re-appear in the future, leading to decreased usage of the Authority’s and each Member’s wastewater system, and a potential decline in Net Revenues available to each Participating Member with which to pay their respective SVCW Bond Payments. Limitations on Remedies Available; Bankruptcy
The enforceability of the rights and remedies of the Owners and the obligations of the Authority and/or any of the Participating Members may become subject to the following: the federal bankruptcy code and applicable bankruptcy, insolvency, reorganization, moratorium, or similar laws relating to or affecting the enforcement of creditors’ rights generally, now or hereafter in effect; equitable principles which may limit the specific enforcement under State law of certain remedies; the exercise by the United States of America of the powers delegated to it by the Federal Constitution; and the reasonable and necessary exercise, in certain exceptional situations, of the police power inherent in the sovereignty of the State and its governmental bodies in the interest of servicing a significant and legitimate public purpose. Bankruptcy proceedings, or the exercising of powers by the federal or State government, if initiated, could subject the

-38-
Owners to judicial discretion and interpretation of their rights in bankruptcy or otherwise and consequently may entail risks of delay, limitation, or modification of their rights.
Limited Obligations
The 2018 Bonds are limited obligations of the Authority payable solely from and secured solely by the Revenues pledged in the Indenture. Revenues consist primarily of the SVCW Bond Payments payable under the Financing Agreements and amounts on deposit from time to time in the funds and accounts held by the Trustee. If for any reason, the Authority does not collect sufficient Revenues to pay debt service on the 2018 Bonds, the Authority will not be obligated to utilize any other of its funds, other than certain amounts on deposit in the funds and accounts established under the Indenture, to pay debt service on the 2018 Bonds. The Authority has no taxing power. The obligation of the Authority to pay debt service on the 2018 Bonds does not constitute a debt of the Authority or the State or any of its political subdivisions, and does not constitute an indebtedness within the meaning of any constitutional or statutory debt limitation or restriction.
The SVCW Bond Payments are limited obligations of the Participating Members payable
solely from and secured solely by the Net Revenues of their respective wastewater systems. If for any reason, any Participating Member does not have Net Revenues available in an amount sufficient to make its SVCW Bond Payments, the Participating Member will not be obligated to utilize any other of its funds to make SVCW Bond Payments. See “SECURITY FOR THE 2018 BONDS – Financing Agreements – Rate Covenants.”
The obligation of the Participating Members to pay the SVCW Bond Payments does not
constitute an obligation of any Participating Member for which the Participating Member is obligated to levy or pledge any form of taxation or for which the Participating Member has levied or pledged any form of taxation. Each of the Participating Members has covenanted to establish rates and charges for its wastewater system to yield Gross Revenues sufficient to make the SVCW Bond Payments. See “SECURITY FOR THE 2018 BONDS – Financing Agreements – Rate Covenants.”
The obligation of each Participating Member to pay SVCW Bond Payments does not
constitute a debt of that Participating Member or the State or any of its political subdivisions, and does not constitute an indebtedness within the meaning of any constitutional or statutory debt limitation or restriction.
The Net Revenues from one Participating Member’s wastewater system are pledged
solely to that Participating Member’s obligations under the Financing Agreement to which it is a party. No Participating Member has any liability or responsibility for the SVCW Bond Payment of another Participating Member. Change in Law
In addition to the other limitations described herein, the California electorate or Legislature could adopt a constitutional amendment, legislation, or an initiative with the effect of reducing revenues payable to or collected by the Authority and/or the Participating Members. There is no assurance that the California electorate or Legislature will not at some future time approve additional limitations that could have the effect of reducing the Net Revenues of a Participating Member and adversely affecting the security of the 2018 Bonds.
-39-
See also “-Loss of Tax Exemption” below
Loss of Tax Exemption
As discussed in this Official Statement under the caption “CONCLUDING INFORMATION – Tax Matters,” interest on the 2018 Bonds could become includable in gross income for purposes of federal income taxation retroactive to the date the 2018 Bonds were issued, as a result of future acts or omissions of the Authority in violation of its covenants in the Indenture or the Participating Members in violation of their covenants in the Financing Agreements.
In addition, current and future legislative proposals, if enacted into law, may cause interest
on the 2018 Bonds to be subject, directly or indirectly, to federal income taxation by, for example, changing the current exclusion or deduction rules to limit the aggregate amount of interest on state and local government bonds that may be treated as tax exempt by individuals.
Should such an event of taxability occur, the 2018 Bonds are not subject to a special
redemption and will remain outstanding until maturity.
Secondary Market for Bonds
There can be no guarantee that there will be a secondary market for the 2018 Bonds or, if a secondary market exists, that any 2018 Bonds can be sold for any particular price. Occasionally, because of general market conditions or because of adverse history or economic prospects connected with a particular issue, secondary marketing practices in connection with a particular issue are suspended or terminated. Additionally, prices of issues for which a market is being made will depend upon then-prevailing circumstances. Such prices could be substantially different from the original purchase price. Build America Bonds
The 2009 Bonds were issued as taxable Build America Bonds, and as a result, the Authority is eligible for a Refundable Credit equal to 35% of each bond interest payment on the 2009 Bonds. However, as part of the federal budget sequestration, the Internal Revenue Service has announced that direct bond subsidy payments are being reduced by a federal fiscal year 2018 sequestration rate of 6.6%. The 2018 sequestration rate will continue through fiscal year 2024, unless Congress takes additional action to modify the sequestration reduction. Decreased Refundable Credits increases the debt service costs of the Authority and the Participating Members on the 2009 Bonds, which could adversely impact the availability of Revenues to pay debt service on the 2018 Bonds. Certain maturities of the 2009 Bonds were refunded on a crossover basis in October, 2015 from proceeds of the 2015 Bonds. As a result of such crossover refunding, the 2009 Bonds will remain outstanding through August 1, 2019, and will continue to be payable from SVCW Bond Payments and from direct bond subsidy payments. The 2009 Bonds will be redeemed in full on August 1, 2019 from a portion of the proceeds of the 2015 Bonds.

-40-
CONCLUDING INFORMATION
Continuing Disclosure
Authority. Under the Indenture, the Authority has covenanted for the benefit of the holders and beneficial owners of the 2018 Bonds to provide certain financial information and operating data relating to the District (an “Annual Report”) to the Municipal Securities Rulemaking Board not later than nine months after the end of the District’s fiscal year (which currently would be March 31), commencing March 31, 2018 with the report for the 2016-17 fiscal year, and to provide notices of the occurrence of certain enumerated events, to assist the participating underwriter in complying with SEC Rule 15c2-12(b)5 (the “Rule”). The initial Annual Report for the 2016-17 fiscal year shall be satisfied by filing the Official Statement promptly following the issuance of the Bonds. A form of the Continuing Disclosure Certificate of the Authority is attached in Appendix F.
The Authority has made previous undertakings under the Rule in connection with the
delivery of prior bonds. Specific instances of non-compliance with prior undertakings in the previous five years include the (i) failure to timely file the Authority’s financial statements for fiscal years 2011-12 and 2012-13, and operating data for fiscal year 2013-14, (ii) the failure to properly link its fiscal year 2015-16 audited financial statements to the 2009 Bonds, and (iii) the failure to file notice of certain underlying rating changes. In addition, no notices of failure to file with respect to any of the above instance of non-compliance was provided at the time of the failure. Remedial filings have been made with respect to the above instances of non-compliance.
The Authority believes it has established procedures to ensure that it will comply with all
material provisions of its continuing disclosure undertakings in the future. Participating Members. Under the Financing Agreements, each of the Participating
Members has covenanted for the benefit of the holders and beneficial owners of the 2018 Bonds to provide Annual Reports to the Municipal Securities Rulemaking Board not later than nine months after the end of the Participating Member’s fiscal year (which currently would be March 31), commencing March 31, 2018 with the report for the 2016-17 fiscal year, and to provide notices of the occurrence of certain enumerated events, to assist the participating underwriter in complying with the Rule. The initial Annual Reports for the 2016-17 fiscal year shall be satisfied by filing the Official Statement promptly following the issuance of the Bonds. A form of the Continuing Disclosure Certificate of each Participating Member is attached in Appendix F.
Redwood City. Redwood City has made previous undertakings under the Rule in connection with the delivery of prior bonds. Specific instances of non-compliance by Redwood City with prior undertakings in the previous five years include: (i) with respect to the City of Redwood City Public Financing Authority Lease Revenue Bonds, Series 2003, the fiscal year 2011-12 Annual Report did not include certain required information, (ii) with respect to Redwood City’s Community Facilities District No. 99-1 Special Tax Refunding Bonds, Series 2012B, and Redwood City’s Community Facilities District No. 2000-1 Special Tax Refunding Bonds, Series 2012, Redwood City’s financial statements were filed almost two months late for fiscal year 2011-12 and 16 days late for fiscal year 2012-13, (iii) with respect to water revenue bonds issued in 2006 and 2007, Redwood City’s dissemination agent omitted operating data reports; and (iv) with respect to the City’s Community Facilities District No. 99-1 Special Tax Bonds, Series 2001 and 2003, and for Redwood City’s Community Facilities District No. 2000-1 Special Tax Bonds, Series 2000, the financial statements were not filed for fiscal year 2010-11 (although they were timely filed for all other City bond issues).
-41-
Additionally, with respect to (a) the 2008 Bonds and the 2009 Bonds, the City’s financial statements for fiscal year 2010-11 and fiscal year 2011-12 were not filed until April 2015, and (b) the 2015 Bonds, certain required financial information was missing for the reports filed for fiscal year 2011-12 and 2012-13, certain audit and annual report filings were not linked to each CUSIP number associated with the issue. In addition, no notice of failure to file with respect to the above instance of non-compliance was provided at the time of the failure. Remedial filings have been made with respect to the above instances of non-compliance.
San Carlos. San Carlos has made previous undertakings under the Rule in connection
with the delivery of prior bonds. Specific instances of non-compliance by San Carlos with prior undertakings in the previous five years include the failure to timely file its fiscal year 2011-12 audited financial statements and required operating information. In addition, no notice of failure to file with respect to the above instance of non-compliance was provided at the time of the failure. Remedial filings have been made with respect to the above instances of non-compliance.
West Bay Sanitary District. The West Bay Sanitary District has made previous undertakings under the Rule in connection with the delivery of prior bonds. Specific instances of non-compliance by the West Bay Sanitary District with prior undertakings in the previous five years include the failure to timely file its fiscal year 2013-14 audited financial statements and required operating information. In addition, no notice of failure to file with respect to the above instance of non-compliance was provided at the time of the failure. Remedial filings have been made with respect to the above instances of non-compliance.
Absence of Litigation
There is no action, suit, or proceeding known to be pending or threatened, restraining or enjoining the execution or delivery of the 2018 Bonds, the Indenture, or the Financing Agreements, or in any way contesting or affecting the validity of the foregoing or any proceedings of the Authority or the Participating Members taken with respect to any of the foregoing.
Legal Matters
Jones Hall, A Professional Law Corporation, San Francisco, California, Bond Counsel, will render an opinion with respect to the legality and enforceability of the 2018 Bonds. The form of such legal opinion is attached in Appendix G. Jones Hall is also acting as Disclosure Counsel to the Authority. Certain legal matters will be passed upon by the General Counsels of the Authority and the West Bay Sanitary District, and by the City Attorneys of Redwood City and San Carlos.
Compensation of Bond Counsel and Disclosure Counsel is contingent upon issuance of
the 2018 Bonds.
Tax Matters
Federal Tax Law. In the opinion of Jones Hall, A Professional Law Corporation, San Francisco, California, Bond Counsel, subject, however to the qualifications set forth below, under existing law, the interest on the 2018 Bonds is excluded from gross income for federal income tax purposes and such interest is not an item of tax preference for purposes of the federal alternative minimum tax; although, in the case of tax years beginning prior to January 1, 2018, for the purpose of computing the alternative minimum tax imposed on certain corporations, such interest earned by a corporation prior to the end of its tax year in 2018 is taken into account in determining certain income and earnings.

-42-
The opinions set forth in the preceding paragraph are subject to the condition that the
Authority and the Participating Members comply with all requirements of the Internal Revenue Code of 1986, as amended (the "Tax Code") that must be satisfied subsequent to the issuance of the 2018 Bonds. The Authority and the Participating Members have covenanted to comply with each such requirement. Failure to comply with certain of such requirements may cause the inclusion of such interest in gross income for federal income tax purposes to be retroactive to the date of issuance of the 2018 Bonds.
If the initial offering price to the public (excluding bond houses and brokers) at which a
2018 Bond is sold is less than the amount payable at maturity thereof, then such difference constitutes "original issue discount" for purposes of federal income taxes and State of California personal income taxes. If the initial offering price to the public (excluding bond houses and brokers) at which a 2018 Bond is sold is greater than the amount payable at maturity thereof, then such difference constitutes "original issue premium" for purposes of federal income taxes and State of California personal income taxes. De minimis original issue discount and original issue premium is disregarded.
Under the Tax Code, original issue discount is treated as interest excluded from federal
gross income and exempt from State of California personal income taxes to the extent properly allocable to each owner thereof subject to the limitations described in the first paragraph of this section. The original issue discount accrues over the term to maturity of the 2018 Bond on the basis of a constant interest rate compounded on each interest or principal payment date (with straight-line interpolations between compounding dates). The amount of original issue discount accruing during each period is added to the adjusted basis of such 2018 Bonds to determine taxable gain upon disposition (including sale, redemption, or payment on maturity) of such 2018 Bond. The Tax Code contains certain provisions relating to the accrual of original issue discount in the case of purchasers of the 2018 Bonds who purchase the 2018 Bonds after the initial offering of a substantial amount of such maturity. Owners of such 2018 Bonds should consult their own tax advisors with respect to the tax consequences of ownership of Bonds with original issue discount, including the treatment of purchasers who do not purchase in the original offering, the allowance of a deduction for any loss on a sale or other disposition, and the treatment of accrued original issue discount on such 2018 Bonds under federal individual and corporate alternative minimum taxes.
Under the Tax Code, original issue premium is amortized on an annual basis over the
term of the 2018 Bond (said term being the shorter of the 2018 Bond's maturity date or its call date). The amount of original issue premium amortized each year reduces the adjusted basis of the owner of the 2018 Bond for purposes of determining taxable gain or loss upon disposition. The amount of original issue premium on a 2018 Bond is amortized each year over the term to maturity of the 2018 Bond on the basis of a constant interest rate compounded on each interest or principal payment date (with straight-line interpolations between compounding dates). Amortized Bond premium is not deductible for federal income tax purposes. Owners of premium Bonds, including purchasers who do not purchase in the original offering, should consult their own tax advisors with respect to State of California personal income tax and federal income tax consequences of owning such 2018 Bonds.
Current and future legislative proposals, if enacted into law, clarification of the Tax Code
or court decisions may cause interest on the 2018 Bonds to be subject, directly or indirectly, to federal income taxation or to be subject to or exempted from state income taxation, or otherwise prevent beneficial owners from realizing the full current benefit of the tax status of such interest.

-43-
The introduction or enactment of any such legislative proposals, clarification of the Tax Code or court decisions may also affect the market price for, or marketability of, the 2018 Bonds. Prospective purchasers of the 2018 Bonds should consult their own tax advisors regarding any pending or proposed federal or state tax legislation, regulations or litigation, as to which Bond Counsel expresses no opinion.
California Law. In the further opinion of Bond Counsel, interest on the 2018 Bonds is
exempt from California personal income taxes. Current and future legislative proposals, if enacted into law, clarification of the Tax Code
or court decisions may cause interest on the 2018 Bonds to be subject, directly or indirectly, to federal income taxation or to be subject to or exempted from state income taxation, or otherwise prevent beneficial owners from realizing the full current benefit of the tax status of such interest. The introduction or enactment of any such legislative proposals, clarification of the Tax Code or court decisions may also affect the market price for, or marketability of, the 2018 Bonds. Prospective purchasers of the 2018 Bonds should consult their own tax advisors regarding any pending or proposed federal or state tax legislation, regulations or litigation, as to which Bond Counsel expresses no opinion.
Other Consequences. Owners of the 2018 Bonds should also be aware that the
ownership or disposition of, or the accrual or receipt of interest on, the 2018 Bonds may have federal or state tax consequences other than as described above. Bond Counsel expresses no opinion regarding any federal or state tax consequences arising with respect to the 2018 Bonds other than as expressly described above.
Form of Bond Counsel Opinion. The form of Bond Counsel’s opinion is attached in
Appendix G.
Ratings
S&P Global Ratings, a Standard & Poor’s Financial Services LLC business (“S&P”) has assigned its municipal bond rating of “AA” to the 2018 Bonds, and Moody’s Investors Service (“Moody’s”) and has assigned its municipal bond rating of “Aa2” to the 2018 Bonds.
These ratings reflect only the views of the respective rating agency, and an explanation of
the significance of these ratings, and any outlook assigned to or associated with these ratings, should be obtained from the respective rating agency.
Generally, a rating agency bases its rating on the information and materials furnished to it
and on investigations, studies and assumptions of its own. The Authority and the Participating Members have provided certain additional information and materials to the rating agencies (some of which does not appear in this Official Statement).
There is no assurance that these ratings will continue for any given period of time or that
these ratings will not be revised downward or withdrawn entirely by the respective rating agency, if in the judgment of the rating agency, circumstances so warrant. Any such downward revision or withdrawal of any rating on the 2018 Bonds may have an adverse effect on the market price or marketability of the 2018 Bonds.

-44-
Competitive Sale of Bonds
The 2018 Bonds were sold following a competitive bidding process, pursuant to the terms set forth in an Official Notice of Sale with respect to the Bonds. The Bonds were awarded to Morgan Stanley & Co., LLC (the “Purchaser”).
The Purchaser has agreed to purchase the 2018 Bonds at a price of $149,433,779.29,
which is equal to the initial principal amount of the 2018 Bonds of $140,955,000.00, plus a net original issue premium of $9,404,525.50, less a Purchaser’s discount of $925,746.21. The Purchaser intends to offer the 2018 Bonds to the public at the offering prices set forth on the inside cover page of this Official Statement. The Purchaser may offer and sell to certain dealers and others at a price lower than the offering prices stated on the inside cover page hereof. The offering price may be changed from time to time by the Purchaser.
The Purchaser has entered into a distribution agreement with its affiliate, Morgan Stanley
Smith Barney LLC. As part of the distribution arrangement, the Purchaser may distribute municipal securities to retail investors through the financial advisor network of Morgan Stanley Smith Barney LLC. As part of this arrangement, the Purchaser may compensate Morgan Stanley Smith Barney LLC for its selling efforts with respect to the Bonds. Municipal Advisor
The Authority has retained Fieldman, Rolapp & Associates, Inc., of Irvine, California, as municipal advisor (the “Municipal Advisor”) in connection with the issuance of the 2018 Bonds. The Municipal Advisor is not obligated to undertake, and not undertaken to make, an independent verification or assume responsibility for the accuracy, completeness, or fairness of the information contained in this Official Statement. The Municipal Advisor is an independent financial advisory firm and is not engaged in the business of underwriting, trading or distributing municipal securities or other public securities. The payment of the fees of the Municipal Advisor is contingent upon the issuance of the 2018 Bonds. Miscellaneous
This Official Statement is not to be construed as a contract or agreement between the Authority and the purchasers or holders of any of the 2018 Bonds. Any statements made in this Official Statement involving matters of opinion, whether or not expressly so stated, are intended merely as an opinion and not as representations of fact. The information and expressions of opinion herein are subject to change without notice, and neither the delivery of this official statement nor any sale made hereunder shall, under any circumstances, create any implication that there has been no change in affairs in the Authority or any of the Participating Members since the date thereof.

-45-
Execution of the Official Statement
The Authority has duly authorized the execution and delivery of this Official Statement.
SILICON VALLEY CLEAN WATER /s/ Daniel T. Child Manager

[THIS PAGE INTENTIONALLY LEFT BLANK]

A-1
APPENDIX A
INFORMATION ABOUT REDWOOD CITY’S WASTEWATER SYSTEM
City of Redwood City
The City of Redwood City (the “City”) is located in the northern part of Silicon Valley,
approximately 25 miles south of San Francisco, roughly midway between San Francisco and San Jose. The City is the county seat of San Mateo County. The City’s economy is well diversified, with a strong industrial and commercial base, including many “high-tech” companies such as Oracle Corporation. The City encompasses approximately 19 square miles within its corporate limits and has a population of approximately 85,601.
Form of Government
The City was incorporated in 1867 and became a charter city in 1929, under the charter
laws of the State of California. The City is governed by a seven-member City Council whose members are elected at large to staggered terms of four years. The City Council selects a mayor from among its members. The current members of the City Council are:
Council Member Current Term Expires Ian Bain, Mayor November 2020 Diane Howard, Vice-Mayor November 2018 John D. Seybert November 2018 Alicia C. Aguirre November 2020 Janet Borgens November 2020 Jeffrey Gee November 2018 Shelly Masur November 2020
The City operates under a council-manager form of government. The City Council appoints
a City Manager who is responsible for the day-to-day administration and management of the City. The City Manager is Melissa Stevenson Diaz, and the Director of the Public Works Services Department is Ramana Chinnakotla. City Leadership
Melissa Stevenson Diaz, City Manager. Melissa Stevenson Diaz has over 26 years of
local government leadership experience in the San Francisco Bay Area. Prior to becoming City Manager of Redwood City, Ms. Diaz served as both Assistant City Manager and Interim City Manager for the City of Mountain View. She previously held various leadership roles in the cities of Fremont and Morgan Hill, and was responsible for a wide range of functions including human resources, finance and budget, policy analysis, redevelopment and economic development, information technology management, community engagement and communications. Ms. Diaz is a member of the International City/County Management Association, the California Public Employers Labor Relations Association, and the Urban Land Institute. She holds a Masters of Public Administration from San Jose State University and a Bachelor of Arts from Mills College.

A-2
Ramana Chinnakotla, Director of Public Works Services. Ramana Chinnakotla has more than 22 years of experience in public works, most of which has been in the public sector. He most recently was on assignment in Sri City, India, as Director of Infrastructure and Utilities. In that role, he oversaw the planning, designing, and building of the city’s entire infrastructure including roads, recycled water and sewer systems, power, landscaping, and other elements. Mr. Chinnakotla also has extensive experience in multiple public works roles with the City of Grapevine, Texas, where he served as Assistant Director of Public Works, Transportation and Utilities Manager, Transportation Manager, and City Traffic Engineer. Mr. Chinnakotla holds an MBA in Finance and General Management, an MS in Civil Engineering, and a Bachelor of Technology in Civil Engineering. The Sewer Utility System
The City owns and operates a sanitary sewer collection system consisting of approximately
200 miles of sewer pipelines and 31 sewer lift stations. The City’s wastewater is conveyed to the Authority for treatment and disposal. The City’s sewer utility is accounted for as a separate enterprise fund.
The Public Works Services Department oversees management, maintenance and operation
of the City’s sewer collection system. The City’s Engineering and Construction Division of the Community Development Department is responsible for the design and construction of capital improvements to the City’s sewer collection system. Financial management of the City’s Sewer Utility System is provided by the City’s Administrative Services Department under which the Revenue Services Division is responsible for all City utility billing and collections, including processing of connection and facilities fees.
Wastewater Flows
The following table shows the City’s recent average daily wastewater flows to the Authority.
Table A1 Redwood City - Annual Wastewater Flow
2012-13 2013-14 2014-15 2015-16 2016-17
Average Daily Flow (mgd) 6.4 6.6 6.1 6.4 8.0 Source: Silicon Valley Clean Water
Service Area and Customer Base
The City’s sewer enterprise provides wastewater service to most of the incorporated area
of the City as well as some surrounding adjacent areas. The City also provides wastewater conveyance and treatment services to five sewer districts and a small sewer assessment district as discussed later on in this section.

A-3
The following table shows a history of accounts by customer class for the City’s sewer customers.
Table A2 Redwood City - Historical Sewer Accounts
2013-14 2014-15 2015-16* 2016-17
Accounts % of Total Accounts
% of Total Accounts
% of Total Accounts
% of Total
City Sewer Accounts Residential 18,308 93.6% 18,344 93.7% 18,362 93.8% 18,380 93.8% Class A - Standard Strength, Low Flow 12 0.1% 12 0.1% 12 0.1% 11 0.1% Class B - Low Strength 98 0.5% 101 0.5% 108 0.6% 102 0.5% Class C - Standard Strength 1,048 5.4% 1,038 5.3% 1,002 5.1% 996 5.1% Class D - Mod-High Strength N/A N/A N/A 3 0.0% Class E - High Strength 98 0.5% 96 0.5% 95 0.5% 93 0.5% Flat Rate 4 0.0% 4 0.0% 4 0.0% 4 0.0% Total 19,568 100.0% 19,595 100.0% 19,583 100.0% 19,589 100.0% * New sewer classes were established in August 2016. Source: City of Redwood City
The following table shows a history of service charge revenues.
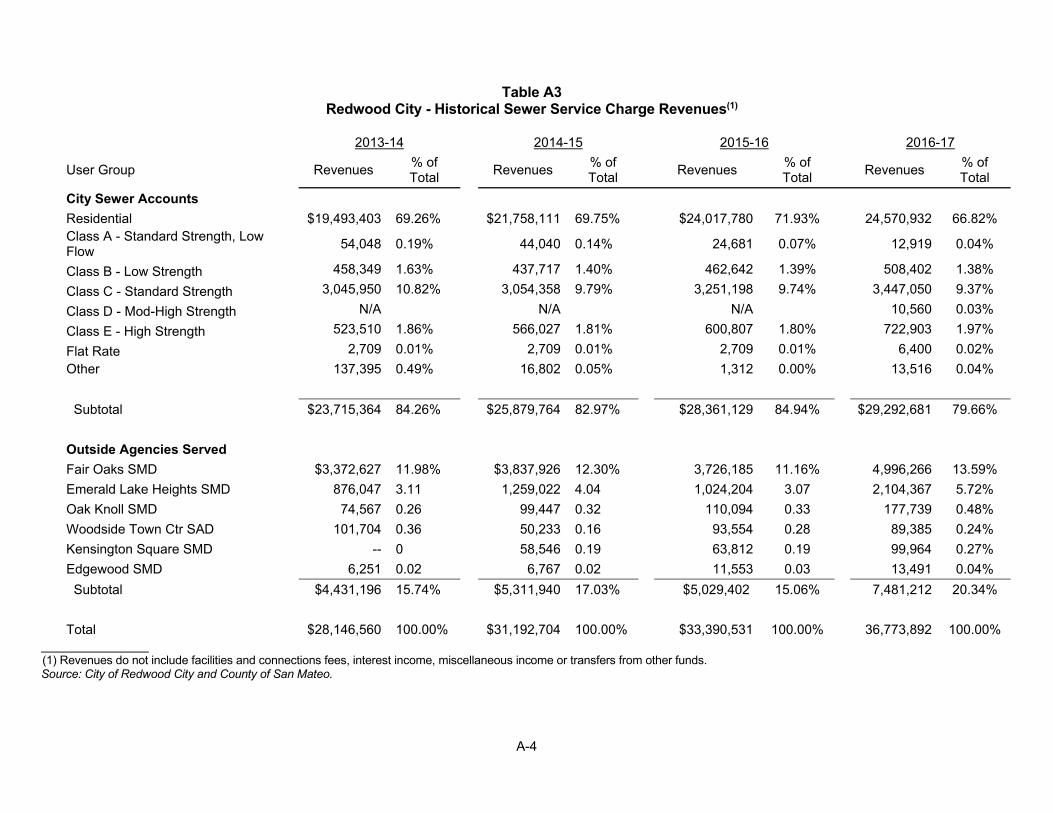
A-4
Table A3 Redwood City - Historical Sewer Service Charge Revenues(1)
2013-14 2014-15 2015-16 2016-17
User Group Revenues % of Total
Revenues % of Total
Revenues % of Total
Revenues % of Total
City Sewer Accounts
Residential $19,493,403 69.26% $21,758,111 69.75% $24,017,780 71.93% 24,570,932 66.82% Class A - Standard Strength, Low Flow
54,048 0.19% 44,040 0.14% 24,681 0.07% 12,919 0.04%
Class B - Low Strength 458,349 1.63% 437,717 1.40% 462,642 1.39% 508,402 1.38%
Class C - Standard Strength 3,045,950 10.82% 3,054,358 9.79% 3,251,198 9.74% 3,447,050 9.37%
Class D - Mod-High Strength N/A N/A N/A 10,560 0.03%
Class E - High Strength 523,510 1.86% 566,027 1.81% 600,807 1.80% 722,903 1.97%
Flat Rate 2,709 0.01% 2,709 0.01% 2,709 0.01% 6,400 0.02%
Other 137,395 0.49% 16,802 0.05% 1,312 0.00% 13,516 0.04%
Subtotal $23,715,364 84.26% $25,879,764 82.97% $28,361,129 84.94% $29,292,681 79.66%
Outside Agencies Served
Fair Oaks SMD $3,372,627 11.98% $3,837,926 12.30% 3,726,185 11.16% 4,996,266 13.59%
Emerald Lake Heights SMD 876,047 3.11 1,259,022 4.04 1,024,204 3.07 2,104,367 5.72%
Oak Knoll SMD 74,567 0.26 99,447 0.32 110,094 0.33 177,739 0.48%
Woodside Town Ctr SAD 101,704 0.36 50,233 0.16 93,554 0.28 89,385 0.24%
Kensington Square SMD -- 0 58,546 0.19 63,812 0.19 99,964 0.27%
Edgewood SMD 6,251 0.02 6,767 0.02 11,553 0.03 13,491 0.04%
Subtotal $4,431,196 15.74% $5,311,940 17.03% $5,029,402 15.06% 7,481,212 20.34%
Total $28,146,560 100.00% $31,192,704 100.00% $33,390,531 100.00% 36,773,892 100.00% (1) Revenues do not include facilities and connections fees, interest income, miscellaneous income or transfers from other funds. Source: City of Redwood City and County of San Mateo.

A-5
The following table lists the City’s largest sewer customers by service charge revenues for fiscal year 2016-17.
Table A4
Redwood City - Largest Customers, Fiscal Year 2016-17
Description
2016-17 Sewer
Service Charges % of Total 10 Largest City Sewer Accounts County of San Mateo Institutional / Public $253,092 0.69% Redwood Shores Apt. Residential 251,074 0.68 The Irvine Company LLC Residential 240,156 0.65 TGA 299 Franklin LLC Residential 234,205 0.64 Essex Property Trust Inc. Residential 218,038 0.59 AIMCO INDIGO LC Residential 177,629 0.48 Ventana Del Mar HOA Residential 176,743 0.48 Boardwalk Residential 170,135 0.46 Shorebird H/O Assoc. Residential 166,083 0.45 Oracle USA Inc. Retail / Commercial 161,338 0.44 Subtotal $2,048,493 5.57% Outside Sewer Districts Fair Oaks SMD Predominantly Residential $4,996,266 13.59% Emerald Lake Heights SMD Predominantly Residential 2,104,367 5.72 Oak Knoll SMD Predominantly Residential 177,739 0.48 Woodside Town Center SMD Predominantly Residential 89,385 0.24 Kensington Square SMD Predominantly Residential 99,964 0.27 Edgewood SMD Predominantly Residential 13,491 0.04 Subtotal $7,481,212 20.34% All Other Customers $27,244,188 74.09% Total (1) $36,773,892 100.00%
(1) Totals may not add due to rounding. Source: City of Redwood City.
Sewer Districts Served by Redwood City
The City provides sewer service to five San Mateo County sewer maintenance districts and
a small sewer assessment district that is part of the Town of Woodside. Together, these districts accounted for approximately 20.3% of the City’s sewer charge revenues in fiscal year 2016-17, and are projected to account for approximately 17.7% of sewer service charge revenues in fiscal year 2017-18. The City provides these services pursuant to separate legal agreements with San Mateo County for each district, and the Town of Woodside. These districts provide their own local wastewater collection services and pay Redwood City for conveyance and wastewater treatment. The Authority bills Redwood City based on the City’s share of wastewater flows and loading, which includes the wastewater conveyed from the six districts. Each of the districts pays Redwood City for wastewater service pursuant to each district’s legal agreement with Redwood City. The sewer districts served by Redwood City are listed below along with a brief description of each district and the basis of its payments to Redwood City.
A-6
Fair Oaks Sewer Maintenance District – This is the largest sewer district served by the City and accounts for approximately 13.5% of the City’s total sewer service charge revenues. Under the agreement, the district is obligated to pay the City for a pro rata share of Redwood City’s payments to the Authority based on the sewer district’s share of total wastewater flow sent to the Authority by Redwood City. The sewer district’s annual flows are estimated by mutual consensus between the City and San Mateo County at 27.99% of the City’s total wastewater flow to the Authority. In fiscal year 2016-17, the sewer district billed 7,054 accounts, of which 6,446, or approximately 91%, were residential. For fiscal year 2016-17, the sewer district’s annual sewer rate was $620 per residential unit or equivalent. San Mateo County collects these charges on its property tax rolls. See Table A6 for further discussion of San Mateo County’s sewer charges.
Emerald Lake Heights Sewer Maintenance District (Zone 2) – This district includes
approximately 1,468 sewer accounts, of which all but 4 are residential. The district pays the City for sewer service based on the number of accounts multiplied by the City’s existing sewer rates.
Oak Knoll Sewer Maintenance District – This district includes approximately 132
accounts, of which all but 1 are residential. The district pays the City based on the number of accounts multiplied by the City’s existing sewer rates.
Kensington Square Sewer Maintenance District – This district includes approximately 74
residential accounts and pays the City based on the number of accounts multiplied by the City’s existing sewer rates.
Woodside Town Center Sewer Assessment District – This district includes
approximately 158 accounts, of which all but 16 are residential. Under an agreement between the Town of Woodside on behalf of the district and Redwood City, the district is obligated to pay the City for a pro rata share of Redwood City’s payments to the Authority based on the district’s share of total wastewater flow sent to the Authority by Redwood City. The agreement also requires the district to pay a small sewer transmission fee and capacity rental fee.
Edgewood Sewer Maintenance District - This district includes approximately 15
residential accounts and pays the City based on the number of accounts multiplied by the City’s existing sewer rates.
Sewer Utility Regulatory Issues
General. Regulatory requirements applicable to the City’s sanitary sewer collection
system and conveyance system are contained in or imposed by regulation pursuant to the Federal Water Pollution Control Act, as amended, and the State of California Porter Cologne Water Quality Control Act of 1969, as amended. Both federal and State regulations are administered through the Regional Board. The City is not aware of any environmental or regulatory issues that would adversely impact its ability to provide sewer collection service.
Waste Discharge Requirements. The City is not subject to independent waste discharge
requirements in connection with operation of its sanitary sewer collection system because it sends its wastewater to the Authority for treatment and discharge.

A-7
Wastewater Rates The City’s wastewater rates are independently established by the City Council pursuant to
a rate ordinance, and do not require approval by any other legal entity. Single family residential customers are billed a flat rate for sewer service. Non-residential customers pay volumetric charges based on customer class and metered water use, subject to a minimum monthly charge.
The City has increased its sewer rates each year for the past 10 years. Rate increases
have accounted for the anticipation of increased funding needs for the City’s collection system capital improvement program, the City’s pro rata share of the Authority’s capital improvement program, and the City’s sewer enterprise operating cost inflation. The following table shows the City’s historical and adopted sewer rates. These rates were adopted pursuant to Article XIIID of the California Constitution. See “CONSTITUTIONAL LIMITATIONS ON APPROPRIATIONS – Articles XIIIC and XIIID”.
Table A5
Redwood City - Adopted Monthly Sewer Rates
2013-14 2014-15 2015-16 2016-17 2017-18 2018-19 Rate Increase % 9% 9% 9% 2% 2% 2%
Residential with 1-9 Dwelling Units $63.09 $68.77 $74.95 $75.11 $76.68 $78.24
Multi-Family Residential with 10+ Dwelling Units $63.09 $68.77 $74.95 $67.60 $69.01 $70.42
Non-Residential/Commercial (charge per hcf of metered water use)
Class A - Standard Strength, Low Flow $4.14 $4.51 $4.91 $5.75 $5.87 $5.99 Class B - Low Strength 4.64 5.06 5.52 6.69 6.83 6.97 Class C - Standard Strength 5.18 5.65 6.15 7.08 7.23 7.37 Class D - Mod-High Strength N/A N/A N/A 11.27 11.51 11.76 Class E - High Strength 12.57 13.70 14.93 16.95 17.31 17.66 Minimum Monthly Charge 63.09 68.77 74.95 67.60 69.01 70.42 Source: City of Redwood City.
The following table shows sewer rates adopted by San Mateo County for the sewer districts
served by Redwood City, which charges are collected on San Mateo County’s property tax rolls. These rates were adopted pursuant to XIIID of the California Constitution.
Table A6
San Mateo County Adopted Annual Sewer Service Charges
2013-14 2014-15 2015-16 2016-17 2017-18 2018-19 2019-20 Sewer Districts Served by Redwood City Annual Charge per Residential Unit or Equivalent Fair Oaks SMD $530 $560 $590 $620 $680 $ --* $ --* Emerald Lake Heights SMD (Zone 2) 890 930 970 1,010 1,280 1,415 1,490 Oak Knoll SMD 960 990 1,020 1,050 1,155 1,270 1,395 Kensington Square SMD 1,055 1,095 1,135 1,175 1,230 1,290 1,350 Edgewood SMD 1,100 1,175 1,250 1,325 1,405 1,490 1,580 ________________ * Rates to be evaluated during fiscal year 2017-18. Source: San Mateo County
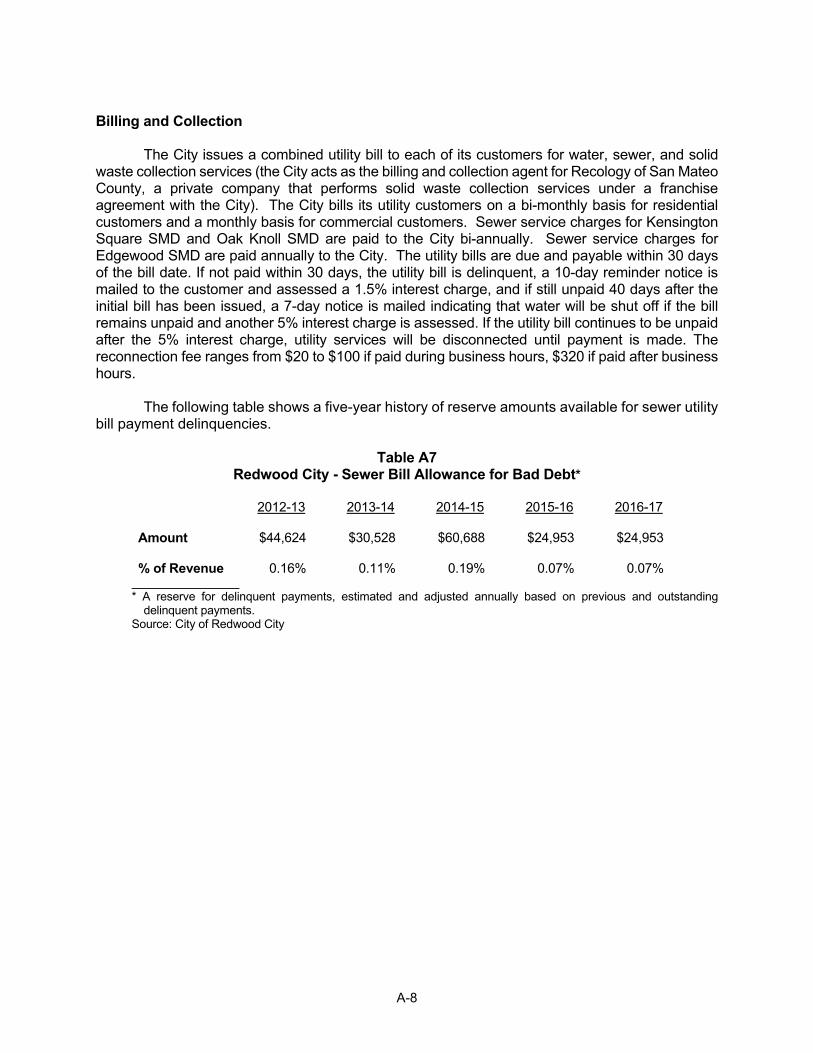
A-8
Billing and Collection
The City issues a combined utility bill to each of its customers for water, sewer, and solid
waste collection services (the City acts as the billing and collection agent for Recology of San Mateo County, a private company that performs solid waste collection services under a franchise agreement with the City). The City bills its utility customers on a bi-monthly basis for residential customers and a monthly basis for commercial customers. Sewer service charges for Kensington Square SMD and Oak Knoll SMD are paid to the City bi-annually. Sewer service charges for Edgewood SMD are paid annually to the City. The utility bills are due and payable within 30 days of the bill date. If not paid within 30 days, the utility bill is delinquent, a 10-day reminder notice is mailed to the customer and assessed a 1.5% interest charge, and if still unpaid 40 days after the initial bill has been issued, a 7-day notice is mailed indicating that water will be shut off if the bill remains unpaid and another 5% interest charge is assessed. If the utility bill continues to be unpaid after the 5% interest charge, utility services will be disconnected until payment is made. The reconnection fee ranges from $20 to $100 if paid during business hours, $320 if paid after business hours.
The following table shows a five-year history of reserve amounts available for sewer utility bill payment delinquencies.
Table A7
Redwood City - Sewer Bill Allowance for Bad Debt*
2012-13 2013-14 2014-15 2015-16 2016-17 Amount $44,624 $30,528 $60,688 $24,953 $24,953 % of Revenue 0.16% 0.11% 0.19% 0.07% 0.07%
* A reserve for delinquent payments, estimated and adjusted annually based on previous and outstanding
delinquent payments. Source: City of Redwood City
A-9
Sewer Facilities Fee for New Development
The City levies a sewer facilities fee on applicants for new (or expanded) wastewater service as a condition of obtaining a permit to connect to the sewer system. This fee is used to help fund the cost of sewer facilities that provide benefit to the new or expanded connection. The City’s sewer facilities fees are established by the City Council of the City. The current sewer facilities fee for a new residential connection is $960. New non-residential connections pay a fee equal to $960 per each 2,000 square feet of building area.
In addition, pursuant to the Joint Powers Agreement, the City also collects the Authority’s
treatment capacity charges and periodically remits payment of these fees to the Authority.
Future Capital Needs The City budgets funds annually for capital improvements to its sewer collection system
including repairs, replacements, upgrades, and expansions. The City budgeted $6.7 million for sewer system capital funding in fiscal year 2017-18 and projects to budget approximately $6 million to $7 million annually through fiscal year 2024-25. The City anticipates fully funding its sewer system capital improvements on a pay-as-you-go basis.
The City’s 2013 update to its Sanitary Sewer Master Plan identified approximately
$45,300,000 of recommended capital improvements to the City’s wastewater collection system. The City conducts closed-circuit television inspections of the wastewater collection system to identify sources of infiltration and inflow and in general assess the condition of the system. Recommended capital improvements are adjusted periodically in light of real estate development and the physical condition of the collection system.
The City currently anticipates funding its collection system capital needs on a pay-as-you-
go, cash basis, and has increased its sewer rates accordingly. However, the City might consider the future use of debt financing if such financing were either needed to fund high-priority projects or if it made economic sense to construct a number of improvements in a given year rather than spread the capital improvement expenditures over a longer timeframe. Any such debt, if issued, would likely be issued on a parity with the Bonds.
Additionally, the City could be liable for funding some additional expenditures related to the
monitoring or clean-up of soil with perchloroethylene (“PCE”) contamination located under Sequoia Station, a retail shopping center located next to a Caltrain station. Through mediation, the City has received approximately $650,000 from the prior owner of a dry-cleaning business that used to be located near the site and was the source of the PCE. These funds are designated towards remedying the situation. The San Francisco Bay Area Regional Water Quality Control Board (“RWQCB”) has jurisdiction over determining what actions need to be taken to remedy or monitor the situation. The RWQCB has determined that the City was partially responsible for the PCE contamination due to overflow/leaks from the City’s sewer pipelines. In October 2014, the City contracted with an outside consultant to create a work plan that would propose steps to monitor the groundwater pollutant plume and develop a remedial action plan. In November 2016, the RWQCB approved the remedial action plan and required the City to submit quarterly groundwater monitoring reports. As of November 2017, the City has submitted 10 groundwater monitoring reports and is preparing to initiate a small-scale remediation study at the shopping center site in 2018. The full-scale remedial action plan contains 3 strategies and is anticipated to cost close to $2 million.

A-10
The City anticipates financing most of its remaining allocable share of costs for the Authority’s capital improvement plan, equal to approximately $289.6 million from Fiscal Year 2017-2018 through Fiscal Year 2024-25. The City anticipates financing these costs through long-term debt issued by the Authority.
Sewer Utility System Finances
The City’s water and sewer utilities are accounted for as separate enterprise funds. Sewer
enterprise operations and capital improvements are funded predominantly by sewer service charges supplemented by interest earnings, capacity fees, and other miscellaneous revenues.
Outstanding Sewer Utility Debt
The City incurred obligations in connection with the issuance by the Authority of the 2009
Bonds, the 2014 Bonds, the 2015 Bonds, SRF Loans, and the Line of Credit, as described in “THE AUTHORITY AND THE WASTEWATER SYSTEM – Outstanding Debt”. The City’s payment obligations to the Authority with respect to the SRF Loans and the Line of Credit are payable from Net Revenues on an unsecured basis.

A-11
Table A8 Redwood City – Sewer Utility System Outstanding Debt
Parity Debt Subordinate Debt
Fiscal Year
Ending June 30
2009
SVCW Bond Payment(1)
2014
SVCW Bond Payment
2015
SVCW Bond Payment (2)
2018
SVCW Bond Payment
Existing SRF Loan Payment
Conveyance
Planning SRF LoanPayment (3)
Total
2018 $2,908,052.00 $2,070,514.16 $1,016,300.00 $ -- $1,315,326.55 $ -- $7,310,192.70 2019 2,889,827.75 2,071,586.94 1,005,050.00 4,559,729.12 1,315,326.55 -- 11,841,520.35 2020 1,831,150.00 2,071,801.49 1,567,650.00 4,561,893.76 1,315,326.55 $741,242.39 12,089,064.17 2021 -- 2,072,874.27 2,795,250.00 4,559,768.76 1,315,326.55 741,242.39 11,484,461.95 2022 -- 2,072,337.88 2,789,000.00 4,559,268.76 1,315,326.55 741,242.39 11,477,175.56 2023 -- 2,072,874.27 2,790,000.00 4,560,143.76 1,315,326.55 741,242.39 11,479,586.95 2024 -- 2,071,667.40 2,783,125.00 4,562,143.76 1,315,326.55 741,242.39 11,473,505.08 2025 -- 2,071,399.20 2,783,250.00 4,560,143.76 1,315,326.55 741,242.39 11,471,361.88 2026 -- 2,071,935.59 2,780,125.00 4,559,018.76 1,315,326.55 741,242.39 11,467,648.27 2027 -- 2,073,142.46 2,778,625.00 4,558,518.76 1,315,326.55 741,242.39 11,466,855.14 2028 -- 2,072,203.78 2,778,500.00 4,558,393.76 1,315,326.55 741,242.39 11,465,666.46 2029 -- 2,071,801.49 2,774,625.00 4,558,393.76 1,315,326.55 741,242.39 11,461,389.17 2030 -- 2,071,801.49 2,762,125.00 4,558,268.76 1,315,326.55 -- 10,707,521.79 2031 -- 2,072,069.68 2,400,000.00 4,562,643.76 1,315,326.55 -- 10,350,039.98 2032 -- 2,072,471.98 2,393,375.00 4,561,268.76 1,315,326.55 -- 10,342,442.28 2033 -- 2,072,874.27 2,388,375.00 4,559,443.76 1,315,326.55 -- 10,336,019.57 2034 -- 2,073,142.47 2,384,750.00 4,560,843.76 917,048.66 -- 9,935,784.89 2035 -- 2,070,460.52 2,377,375.00 4,562,803.13 917,048.66 -- 9,927,687.31 2036 -- 2,072,391.52 2,371,125.00 4,560,962.50 917,048.66 -- 9,921,527.68 2037 -- 2,072,123.32 2,370,625.00 4,558,362.50 917,048.66 -- 9,918,159.48 2038 -- 2,071,184.65 2,360,750.00 4,562,537.50 -- -- 8,994,472.15 2039 -- 2,072,123.32 2,361,250.00 4,559,143.75 -- -- 8,992,517.07 2040 -- 2,071,989.23 2,351,875.00 4,562,500.00 -- -- 8,986,364.23 2041 -- 2,070,326.42 631,500.00 4,559,925.00 -- -- 7,261,751.42 2042 -- 2,070,996.91 631,875.00 4,560,425.00 -- -- 7,263,296.91 2043 -- 2,072,740.17 631,000.00 4,560,425.00 -- -- 7,264,165.17 2044 -- 2,072,606.07 628,875.00 4,559,187.50 -- -- 7,260,668.57 2045 -- -- 630,375.00 4,562,350.00 -- -- 5,192,725.00 2046 -- -- 630,375.00 4,560,250.00 -- -- 5,190,625.00 2047 -- -- -- 4,561,750.00 -- -- 4,561,750.00 2048 -- -- -- 4,562,575.00 -- -- 4,562,575.00 2049 -- -- -- 4,558,400.00 -- -- 4,558,400.00
Total: $7,629,029.75 $55,943,440.95 $58,947,125.00 141,371,482.40 $24,713,419.44 $7,412,423.85 $296,016,921.22 (1) Represents approximate allocated share of gross debt service on the Series 2009 Bonds; does not include any Refundable Credits. (2) Excludes debt service payments made from escrow funds. (3) Preliminary debt service estimate and amortization shown; final amount and amortization, which the Authority is attempting to
extend, will be determined after the SRF-Loan project is completed. The related project is expected to be completed during calendar year 2018.
Source: Silicon Valley Clean Water.

A-12
Pension and Other Employee Benefit Costs The City allocates a portion of its employee expenses to its sewer utility based on
employees allocated to operation of the sewer utility. In fiscal year 2016-17, the City allocated 3.1% of its total employee costs to the sewer utility.
Pension. Substantially all City employees are eligible to participate in pension plans
offered by California Public Employees' Retirement System (“PERS”), an agent multiple-employer defined benefit pension plan which acts as a common investment and administrative agent for its participating member employers. PERS provides retirement and disability benefits, annual cost of living adjustments, and death benefits to plan members who must be public employees and beneficiaries. The City’s employees participate in the separate safety (police and fire) and miscellaneous (all other) employee plans. Benefit provisions under both plans are established by state statute and City resolution.
Benefits are based on years of credited service, equal to one year of full time employment. Funding contributions for both plans are determined annually on an actuarial basis as of June 30 by PERS; the City must contribute these amounts. See Note 9 of the City’s June 30, 2017 audited financial report, which is attached to this Official Statement as Appendix J, for information as of June 30, 2017 related to the City’s pension and post-retirement medical benefit costs.
The City’s total PERS plan contributions are determined through PERS’ annual actuarial
valuation process. The actuarially determined rate is the estimated amount necessary to finance the costs of benefits earned by employees during the year, with additional amount to finance any unfunded accrued liability. The employer is required to contribute the difference between the actuarially determined rate and the contribution rate of employees. For the measurement period ended June 30, 2016 (the measurement date), the average active employee contribution rate is 7.83% of annual pay for the Miscellaneous Plan and 9.04% of annual pay for the Safety Plan; and the employer contribution rate is 9.27% of annual payroll for the Miscellaneous Plan and 22.03% of annual payroll for the Safety Plan.
For the year ended June 30, 2017, the City recognized pension expense of $8,864,628
for the Miscellaneous Plan and $13,755,299 for the Safety Plan. At June 30, 2017, the City reported deferred outflows of resources and deferred inflows of resources related to pensions from the following sources:
Deferred Outflows of
Resources Deferred Inflows of
Resources Pension Contributions Subsequent to Measurement Date $17,721,552 $ --
Changes of Assumptions -- $3,937,518
Differences between Expected & Actual Experiences $3,328,061 $141,618
Net Differences between Projected & Actual Earnings on Plan Investments $21,940,552 --
Total $42,990,165 $4,079,136

A-13
$17,721,552 reported as deferred outflows of resources related to contributions subsequent to the measurement date will be recognized as a reduction of the net pension liability in the fiscal year ended June 30, 2018. Other amounts reported as deferred outflows of resources and deferred inflows of resources related to pensions will be recognized as pension expenses as follows:
Fiscal Year Ending June 30:
2018 1,649,511
2019 3,020,849
2020 10,663,904
2021 5,855,213 Source: City of Redwood City 2017 Comprehensive Annual Financial Report Three-year trend information for the City’s pension plan for both miscellaneous and safety
plans for fiscal years ending June 30 is set forth below:
Three-year Trend of Annual Pension Cost
Miscellaneous
Fiscal year ended
June 30
Annual pension cost
(APC)
Percentage of APC
contributed
Net pension obligations
2015 $6,799,358 100% $ -- 2016 6,923,087 100 -- 2017 7,428,605 100 --
Source: City of Redwood City
Public Safety
Fiscal year ended
June 30
Annual pension cost
(APC)
Percentage of APC
contributed
Net pension obligations
2015 $9,667,759 100% $ -- 2016 10,439,692 100 -- 2017 10,292,946 100 --
Source: City of Redwood City
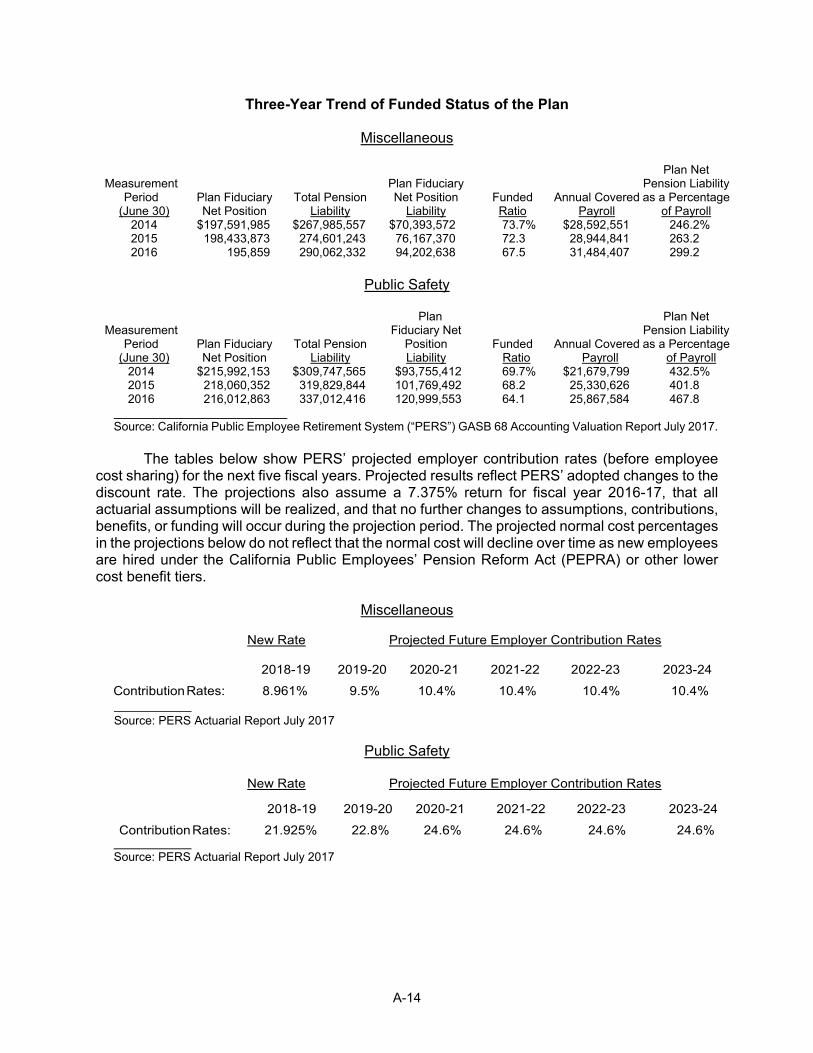
A-14
Three-Year Trend of Funded Status of the Plan
Miscellaneous
Measurement
Period (June 30)
Plan Fiduciary Net Position
Total Pension Liability
Plan Fiduciary Net Position
Liability
Funded Ratio
Annual Covered
Payroll
Plan Net
Pension Liability as a Percentage
of Payroll 2014 $197,591,985 $267,985,557 $70,393,572 73.7% $28,592,551 246.2% 2015 198,433,873 274,601,243 76,167,370 72.3 28,944,841 263.2 2016 195,859 290,062,332 94,202,638 67.5 31,484,407 299.2
Public Safety
Measurement
Period (June 30)
Plan Fiduciary Net Position
Total Pension Liability
Plan Fiduciary Net
Position Liability
Funded Ratio
Annual Covered
Payroll
Plan Net
Pension Liability as a Percentage
of Payroll 2014 $215,992,153 $309,747,565 $93,755,412 69.7% $21,679,799 432.5% 2015 218,060,352 319,829,844 101,769,492 68.2 25,330,626 401.8 2016 216,012,863 337,012,416 120,999,553 64.1 25,867,584 467.8
Source: California Public Employee Retirement System (“PERS”) GASB 68 Accounting Valuation Report July 2017.
The tables below show PERS’ projected employer contribution rates (before employee cost sharing) for the next five fiscal years. Projected results reflect PERS’ adopted changes to the discount rate. The projections also assume a 7.375% return for fiscal year 2016-17, that all actuarial assumptions will be realized, and that no further changes to assumptions, contributions, benefits, or funding will occur during the projection period. The projected normal cost percentages in the projections below do not reflect that the normal cost will decline over time as new employees are hired under the California Public Employees’ Pension Reform Act (PEPRA) or other lower cost benefit tiers.
Miscellaneous
New Rate Projected Future Employer Contribution Rates
2018-19 2019-20 2020-21 2021-22 2022-23 2023-24
Contribution Rates: 8.961% 9.5% 10.4% 10.4% 10.4% 10.4% Source: PERS Actuarial Report July 2017
Public Safety
New Rate Projected Future Employer Contribution Rates
2018-19 2019-20 2020-21 2021-22 2022-23 2023-24
Contribution Rates: 21.925% 22.8% 24.6% 24.6% 24.6% 24.6% Source: PERS Actuarial Report July 2017
A-15
Recent Changes by PERS. At its April 17, 2013, meeting, PERS’ Board of Administration (the “Board of Administration”) approved a recommendation to change the PERS amortization and smoothing policies. Prior to this change, PERS employed an amortization and smoothing policy that spread investment returns over a 15-year period with experienced gains and losses paid for over a rolling 30-year period. After this change, PERS will employ an amortization and smoothing policy that will pay for all gains and losses over a 20-year period with a five-year ramp-up, and five-year ramp-down, period. The new amortization and smoothing policy was used for the first time in the June 30, 2013, actuarial valuations in setting employer contribution rates for fiscal year 2015-16.
On February 18, 2014, the PERS Board approved new demographic actuarial
assumptions based on a 2013 study of recent experience. The largest impact, applying to all benefit groups, is a new 20-year mortality projection reflecting longer life expectancies and that longevity will continue to increase. Because retirement benefits will be paid out for more years, the cost of those benefits will increase as a result. The Board of Administration also assumed earlier retirements for Police 3%@50, Fire 3%@55, and Miscellaneous 2.7%@55 and 3%@60, which will increase costs for those groups. As a result of these changes, rates will increase beginning in fiscal year 2016-17 (based on the June 30, 2014 valuation) with full impact in fiscal year 2020-21.
On November 18, 2015, the PERS Board adopted a funding risk mitigation policy intended
to incrementally lower its discount rate – its assumed rate of investment return – in years of good investment returns, help pay down the pension fund's unfunded liability, and provide greater predictability and less volatility in contribution rates for employers. The policy establishes a mechanism to reduce the discount rate by a minimum of 0.05 percentage points to a maximum of 0.25 percentage points in years when investment returns outperform the existing discount rate, currently 7.5%, by at least four percentage points. PERS staff modeling anticipates the policy will result in a lowering of the discount rate to 6.5% in about 21 years, improve funding levels gradually over time and cut risk in the pension system by lowering the volatility of investment returns. More information about the funding risk mitigation policy can be accessed through PERS’ web site at the following website address:
https://www.calpers.ca.gov/page/newsroom/calpers-news/2015/adopts-funding-risk-mitigation-policy The reference to this Internet website is provided for reference and convenience only. The
information contained within the website may not be current, has not been reviewed by the City and is not incorporated in this Official Statement by reference.
On December 21, 2016, the PERS Board voted to lower its discount rate from 7.5% to
7.0% over the next three years according to the following schedule.
Valuation Date
Fiscal Year Required Contribution
Discount Rate
June 30, 2016 2018-19 7.375% June 20, 2017 2019-20 7.250 June 30, 2018 2020-21 7.000
For public agencies like the City, the new discount rate will increase contribution costs
beginning in fiscal year 2018-19. Lowering the discount rate means employers that contract with PERS to administer their pension plans will see increases in their normal costs and unfunded

A-16
actuarial liabilities. Active members hired after January 1, 2013, under the Public Employees' Pension Reform Act will also see their contribution rates rise. The three-year reduction of the discount rate will result in average employer rate increases of about 1 percent to 3 percent of normal cost as a percent of payroll for most miscellaneous retirement plans, and a 2 percent to 5 percent increase for most safety plans. Additionally, many PERS employers will see a 30 to 40 percent increase in their current unfunded accrued liability payments. These payments are made to amortize unfunded liabilities over 20 years to bring the pension fund to a fully funded status over the long-term.
Other Post-Employment Benefits (OPEB). The City’s annual other post-employment
benefit cost (expense) is calculated based on the annual required contribution (“ARC”) of the employer, an amount actuarially determined in accordance with the parameters of Governmental Accounting Standards Board Statement 45. The ARC represents a level of funding that, if paid on an ongoing basis, is projected to cover normal costs each year and amortize any unfunded actuarial liabilities (or funding excess) over a period not to exceed thirty years. The City’s annual OPEB cost, the percentage of annual OPEB cost contributed to the plan, and the net OPEB obligation for the fiscal year ended June 30, 2017 and the two preceding yfiscal ears were as follows:
Three-Year Trend of Annual OPEB Cost (Excluding the Port of Redwood City)
Fiscal year
ended June 30
Annual OPEB cost
(AOC) Percentage of AOC
contributed
OPEB obligations
(Asset) 2015 $5,037,000 100% $6,962,477 2016 5,982,000 100 6,962,477 2017 6,163,000 100 6,962,477
Source: City of Redwood City 2017 Comprehensive Annual Financial Report
Three-year Trend of
Funded Status of the Plan (Excluding the Port of Redwood City)*
Actuarial Valuation
Date (June 30)
Actuarial
Value of Assets
Actuarial accrued
liability for benefits
Unfunded/ (overfunded)
liability (UAAL)
Funded ratio
Annual covered payroll
UAAL as a percentage of payroll
2013 $11,001,000 $56,177,000 $45,176,000 19.6% $48,399,901 93.3% 2015 18,382,000 70,852,000 52,470,000 25.9 51,466,341 102.0 2017 26,570,000 84,172,000 57,602,000 31.6 57,404,000 100.3
*Annual payroll of active employees covered by the plan Source: City of Redwood City 2017 Comprehensive Annual Financial Report
As of June 30, 2017, the most recent actuarial valuation date, the plan was 31.6% funded.
The actuarial accrued liability for benefits was $84,172,000, and the actuarial value of plan assets was $26,570,000, resulting in an unfunded actuarial accrued liability (UAAL) of $57,602,000. The covered payroll (annual payroll of active employees covered by the plan) was $57,404,000 and the ratio of UAAL to the covered payroll was 100.3%.

A-17
Historical Revenues and Expenses The following table shows a five-year history of revenues, expenses, and net revenues
based on information provided in the City’s audited financial statements and by the City.
Table A9 Sewer Enterprise – Historical Revenues, Operating Expenses, and Net Revenues
Fiscal Year Ended June 30
Fiscal Year Ending June 30 2013 2014 2015 2016 2017 (Audited) (Audited) (Audited) (Audited) (Audited) Adopted Rate Increase (rounded) 9% 9% 9% 9% 2% REVENUES Sewer Service Charges $26,569,508 $28,218,306 $31,232,763 $33,479,149 $36,702,114Connection Fees 1,057,492 877,109 1,329,542 1,272,329 366,664Investment Earnings & Other Revenues 14,735 127,201 177,602 250,884 225,234 Total Revenues 27,641,735 29,222,616 32,739,907 35,002,362 37,294,012 EXPENSES Operating & Maintenance Operating Expenses from Audit 19,287,430 19,989,758 22,081,105 34,345,565 26,675,533 Less Depreciation (525,718) (523,563) (581,078) (627,173) (670,287) Less SVCW Bond Debt Service(1) (2,598,152) (2,869,674) (4,819,301) (4,669,331) (5,701,084) Less SVCW Non-Operating Payments (753,070) (974,433) - (13,013,064) (1,611,375) Plus Transfers Out -- 23,047 -- 516,286 517,835Net Operating Expenses 15,410,490 15,622,088 16,680,726 16,035,997 18,692,787 Net Revenues 12,231,245 13,600,528 16,059,181 18,966,365 18,601,225 Debt Service (1) City Share of SVCW 2008 Bonds 452,043 360,802 450,194 345,206 0City Share of SVCW 2009 Bonds 2,146,109 2,110,594 2,180,607 1,731,416 2,193,074 City Share of SVCW 2014 Bonds - - 1,790,222 2,072,928 2,070,782 City Share of SVCW 2015 Bonds - - - 121,503 1,038,950 Total Senior Debt Service 2,598,152 2,471,396 4,421,023 4,271,053 5,302,806 Senior Debt Service Coverage 4.71 5.50 3.63 4.44 3.51 City Share of SVCW SRF Loans - 398,278 398,278 398,278 398,278 Total Debt Service 2,598,152 2,869,674 4,819,301 4,669,331 5,701,084 Total Debt Service Coverage 4.71 4.74 3.33 4.06 3.26 Net Revenues After Debt Service 9,633,093 10,730,854 11,239,880 14,297,034 12,900,141 Cash & Equivalents June 30(2) $14,771,134 $21,643,469 $27,497,483 $25,342,608 $31,507,971 Days Operating Cash June 30 350 506 602 577 615
____________________ (1) Net of reserve and interest credits received by the City. (2) Unrestricted cash and investments of the Sewer Enterprise Fund as reported in the City’s Comprehensive Annual Financial
Reports. Source: City of Redwood City and City of Redwood City Comprehensive Annual Financial Reports for years 2013 - 2017.

A-18
Projected Revenues, Expenses, and Debt Service Coverage Assumptions Related to Revenue
1. The City’s sewer service charges are based on actual revenues received in fiscal year 2016-17 and increase due to adopted and projected rate increases and growth.
2. Contract agencies charges are based on payments calculated for each agency according
to their individual contracts with the City, and assume a 6‐month lag in payments.
3. Interest earnings are based on the City’s 2017-18 budget and are subsequently projected based on the annual beginning fund balance multiplied by projected interest rate shown for each year, with interest rates projected to increase from 1% to 2% over the next three years. (LAIF currently yields approximately 1.14% as of October 2017).
4. Revenues from the City’s sewer facilities fees and connection fees are estimated at $100,000 per year, although they have been substantially higher during the prior 3 years.
5. Other Revenues are projected at $50,000 per year based on the City’s 2017-18 budget.
Assumptions Related to Expenses
1. Operating and maintenance expenses are mostly based on the City’s 2017-18 budget and escalate at the annual rate of 4% to account for future operating cost inflation.
2. SVCW wastewater treatment operations are based the City’s share of allocated costs according to SVCW’s 2017-18 budget with future costs escalating at the annual rate of 3%.
3. The City’s share of debt service for SVCW’s capital program are based on updated projections provided by SVCW as shown in Table A8.
4. City sewer system capital improvements are projected $7 million most years, with funding
temporarily reduced to $6 million and will be funded on a pay‐as‐you‐go basis without the need for debt financing.
5. SVCW pay‐go capital funding is based on SVCW’s 2017-18 budget and assume a constant level of funding in future years, in line with SVCW projections.
6. SVCW SRF reserve contributions are based on SVCW projections shown on Table A8 and are based on the assumption that each of the SVCW member agencies make annual contributions toward their respective share of the reserve requirement for SVCW’s SRF loans. Actual SRF reserve requirements are required to be met approximately 90 days prior to the project completion date for SRF loan.

A-19
Table A10 Redwood City Sewer Enterprise Cash Flow Projections
Fiscal Year Ending June 30
2017-18 2018-19 2019-20 2020-21 2021-22
Adopted Adopted Projected Projected Projected Rate Increase 2% 2% 5% 5% 5% Beginning Fund Reserves $31,507,971 $34,230,770 $32,832,567 $31,831,365 $31,151,919
REVENUES Sewer Service Charges 29,767,000 30,408,000 31,976,000 33,625,000 35,359,000 Contract Agency Charges 6,506,000 7,216,000 8,202,000 9,279,000 10,012,000 Connection Fees 100,000 100,000 100,000 100,000 100,000 Investment Earnings 270,000 276,000 422,000 560,000 542,000 Other Revenues 50,000 50,000 50,000 50,000 50,000 Total 36,693,000 38,050,000 40,750,000 43,614,000 46,063,000
EXPENSES Operating & Maintenance City Operating Expenses 8,570,000 8,827,000 9,095,000 9,373,000 9,663,000 SVCW Operating Expenses 10,830,466 11,232,486 11,644,530 12,095,049 12,145,653 Subtotal 19,400,466 20,059,486 20,739,530 21,468,049 21,808,653
Net Revenues 17,292,534 17,990,514 20,010,470 22,145,951 24,254,347
Debt Service Senior Debt Service City Share of SVCW 2009 Bonds (Net) 2,189,509 2,185,415 1,482,626 -- - City Share of SVCW 2014 Bonds 2,070,514 2,071,587 2,071,801 2,072,874 2,072,338 City Share of SVCW 2015 Bonds 1,016,300 1,005,050 1,567,650 2,795,250 2,789,000 City Share of SVCW 2018 Bonds -- 4,559,729 4,561,894 4,559,769 4,559,269 City Share of Future SVCW Bonds -- - 1,004,204 3,815,533 6,830,960 Total Senior Debt Service 5,276,323 9,821,781 10,688,175 13,243,426 16,251,567 Senior Debt Service Coverage 3.28 1.83 1.87 1.67 1.49
Subordinate Debt Service City Share of Outstanding SVCW SRF Loans 1,315,327 1,315,327 2,056,569 2,056,569 2,056,569 City Share of SVCW Line of Credit 41,493 -- -- -- -- Total Subordinate Debt Service 1,356,819 1,315,327 2,056,569 2,056,569 2,056,569
Total Combined Debt Service 6,633,142 11,137,107 12,744,744 15,299,995 18,308,136 Total Debt Service Coverage 2.61 1.62 1.57 1.45 1.32
Capital & Other Non-Operating City Capital Improvements 6,700,000 7,000,000 7,000,000 6,000,000 7,000,000 SVCW Pay-Go Capital Funding 750,892 765,910 781,228 796,853 812,790 SVCW SRF Reserve Contributions 485,700 485,700 485,700 728,550 971,400 Subtotal 7,936,592 8,251,610 8,266,928 7,525,403 8,784,190 Total Expenses 33,970,201 39,448,203 41,751,202 44,293,446 48,900,979 Revenues Less Expenses 2,722,799 (1,398,203) (1,001,202) (679,446) (2,837,979) Ending fund Reserve 34,230,770 32,832,567 31,831,365 31,151,919 28,313,940 Days Cash on Hand 644 597 560 530 474
Source: Bartle Wells Associates and the City of Redwood City

A-20
Absence of Litigation The City is not aware of any action, suit, or proceeding known to be pending or threatened,
that would affect the execution of the City’s Financing Agreement with the Authority, or materially impact the finances of the City’s wastewater system.
Financial Statements
The City’s audited financial statements for the fiscal year ending June 30, 2017 are attached
as Appendix J. The City’s financial statements were audited by Badawi & Associates, Certified Public Accountants, independent auditors. The auditor has not been asked to consent to the inclusion of the City’s audited financial statements in this Official Statement and has not reviewed this Official Statement.

B-1
APPENDIX B
INFORMATION ABOUT THE CITY OF SAN CARLOS’ WASTEWATER SYSTEM
City of San Carlos
The City of San Carlos (the “City”) is located in the northern part of Silicon Valley,
approximately 22 miles south of San Francisco, roughly midway between San Francisco and San Jose. The City encompasses approximately six square miles within its corporate limits and has a population of approximately 29,311.
Form of Government
The City was incorporated in 1925 and is a general law city pursuant to the California
Government Code. The City is governed by a five-member City Council whose members are elected at large to staggered terms of four years. The City Council selects a mayor from among its members. The City Treasurer is also an elected position. The current members of the City Council are:
Member Current Term Expires Robert Grassilli*, Mayor November 2018 Cameron Johnson, Vice Mayor November 2018 Ron Collins November 2020 Matthew B. Grocott November 2018 Mark Olbert November 2020 *Secretary of the Silicon Valley Clean Water Commission. The City operates under a council-manager form of government. The City Council appoints
a City Manager who is responsible for the day-to-day administration and management of the City. The current City Manager is Jeff Maltbie, and the City’s Wastewater System is managed by the Public Works Director.
City Leadership
Jeff D. Maltbie began serving as the City’s Interim City Manager in September of 2010 and, after a national recruitment, was selected by the Council to serve as City Manager in March 2011. During his 16 years with the City, he has served as Deputy City Manager, including five years serving as the City’s Administrative Services Director. As the Administrative Services Director he was responsible for all of the City’s business operations including Finance, Human Resources, Information Technology and Risk Management. Jeff joined the City of San Carlos in 2001 as a Senior Analyst. Prior to coming to San Carlos Jeff worked for the City of Daly City, Santa Clara County, and the City of Milpitas. Jeff attended San Diego State University and San Jose State University earning a Bachelor’s of Art degree in Political Science/Public Administration.
Tara Peterson began serving as the City’s temporary Interim Public Works Director in January 2018, after having served four years as the Assistant City Manager. Previously, she was the Administrative Services Manager in the Engineering and Transportation Department with the City of San Leandro for 15 years. Tara attended the University of
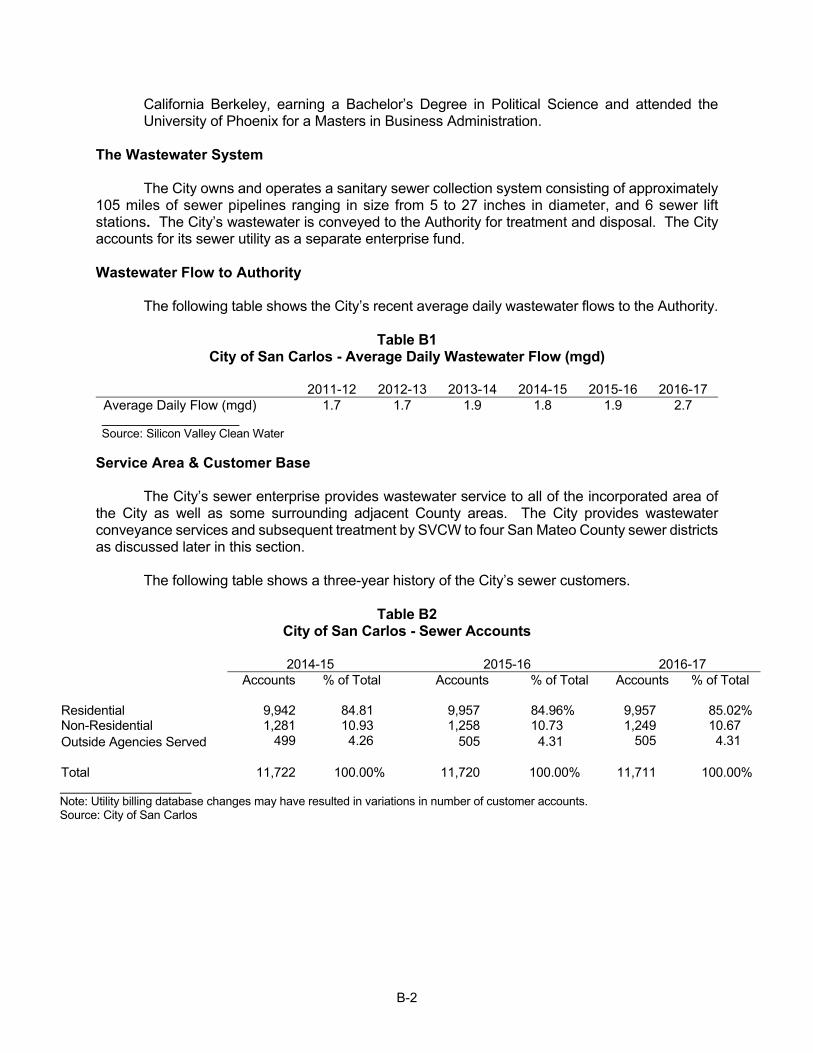
B-2
California Berkeley, earning a Bachelor’s Degree in Political Science and attended the University of Phoenix for a Masters in Business Administration.
The Wastewater System The City owns and operates a sanitary sewer collection system consisting of approximately
105 miles of sewer pipelines ranging in size from 5 to 27 inches in diameter, and 6 sewer lift stations. The City’s wastewater is conveyed to the Authority for treatment and disposal. The City accounts for its sewer utility as a separate enterprise fund.
Wastewater Flow to Authority
The following table shows the City’s recent average daily wastewater flows to the Authority.
Table B1 City of San Carlos - Average Daily Wastewater Flow (mgd)
2011-12 2012-13 2013-14 2014-15 2015-16 2016-17
Average Daily Flow (mgd) 1.7 1.7 1.9 1.8 1.9 2.7 Source: Silicon Valley Clean Water
Service Area & Customer Base
The City’s sewer enterprise provides wastewater service to all of the incorporated area of
the City as well as some surrounding adjacent County areas. The City provides wastewater conveyance services and subsequent treatment by SVCW to four San Mateo County sewer districts as discussed later in this section.
The following table shows a three-year history of the City’s sewer customers.
Table B2 City of San Carlos - Sewer Accounts
2014-15 2015-16 2016-17 Accounts % of Total Accounts % of Total Accounts % of Total Residential 9,942 84.81 9,957 84.96% 9,957 85.02% Non-Residential 1,281 10.93 1,258 10.73 1,249 10.67 Outside Agencies Served 499 4.26 505 4.31 505 4.31 Total 11,722 100.00% 11,720 100.00% 11,711 100.00% Note: Utility billing database changes may have resulted in variations in number of customer accounts. Source: City of San Carlos

B-3
The following table shows a three-year history of service charge revenues.
Table B3 City of San Carlos - Historical Sewer Service Charge Revenues
2014-15 2015-16 2016-17 Revenues % of Total Revenues % of Total Revenues % of Total City Sewer Accounts Residential $11,121,537 73.01% $12,234,954 75.04% $12,205,731 76.04% Non-Residential 3,697,163 24.27 3,633,552 22.28 3,368,544 20.99 Subtotal $14,818,700 97.28% $15,868,506 97.32% $15,574,275 97.02% Outside Agencies Served 414,592 2.72% $436,900 2.68% $477,766 2.98% Total $15,233,292 100.00% $16,305,406 100.00% $16,052,041 100.00%
Source: City of San Carlos
The following table lists the City’s largest sewer customers by service charge revenues for
fiscal year 2016-17. Table B4
City of San Carlos - Largest Customers, Fiscal Year 2016-17
Description
FY 2016-17 Sewer
Service Charges % of Total 10 Largest City Sewer Accounts Vica Capital LLC Industrial $140,374 0.87% San Carlos School District Public 136,534 0.85 Sutter Bay Medical Foundation Industrial 113,770 0.71 Equity One San Carlos LLC Industrial 76,188 0.47 L-3 Communications Corp C/O Ted Kennel Industrial 71,107 0.44 G W Williams Co. Industrial 66,093 0.41 Cordilleras Center Commercial 65,913 0.41 Grm Fisc LLC Lessee & City of San Carlos Commercial 60,973 0.38 Black Mountain Holdings LLC Industrial 55,152 0.34 County Road Associates c/o Boris Wolper Commercial 53,436 0.33 Subtotal $839,541 5.23% Outside Sewer Districts Devonshire County Sanitation District $267,182 1.66% Emerald Lake Heights Sewer Maintenance District 102,375 0.64 Scenic Heights County Sanitation District 48,923 0.30 Harbor Industrial Sewer Maintenance District 59,286 0.37 Subtotal $477,766 2.98% All Other Customers $14,734,734 91.79% Total $16,052,041 100.00%
Source: City of San Carlos utility billing data
B-4
Sewer Districts Served by San Carlos
The City provides sewer service to four San Mateo County sewer maintenance districts pursuant to separate legal agreements with San Mateo County for each district. These districts provide their own local wastewater collection services and pay the City for conveyance and wastewater treatment. The Authority bills San Carlos based on the City’s share of wastewater flows and loading, which includes the wastewater conveyed from the four County sewer districts. Each of the districts pays San Carlos for wastewater service pursuant to each district’s legal agreement with the City. The sewer districts served by San Carlos are listed below along with a brief description of each district and the basis of its payments to the City.
Devonshire County Sanitation District – This District includes approximately 274
residential accounts, and pays the City based on the number of accounts multiplied by 85% of the City’s existing sewer rate. The District also includes an institution, which is charged based on water consumption multiplied by 85% of the applicable sewer rate.
Emerald Lake Heights Sewer Maintenance District (Zone 1) – This District includes
approximately 113 residential accounts and pays the City based on the number of accounts multiplied by 85% of the City’s existing sewer rate.
Scenic Heights County Sanitation District – This District includes approximately 55
residential accounts and pays the City based on the number of accounts multiplied by 85% of the City’s existing sewer rate.
Harbor Industrial Sewer Maintenance District – This District serves approximately 68
commercial and industrial customer accounts. The charges billed to this District are calculated based on district-wide loading data, City loading data and SVCW revenue.
Sewer Utility Regulatory Issues
General. Regulatory requirements applicable to the City’s sanitary sewer collection
system are contained in or imposed by regulation pursuant to the Federal Water Pollution Control Act, as amended, and the State of California Porter Cologne Water Quality Control Act of 1969, as amended. Both federal and State regulations are administered through the San Francisco Bay Regional Water Quality Control Board (the “Regional Board”). The City is not aware of any environmental or regulatory issues that would adversely impact its ability to provide sewer collection service.
Waste Discharge Requirements. The City is not subject to independent waste discharge
requirements in connection with operation of its sanitary sewer collection system because it sends its wastewater to the Authority for treatment and discharge.
Recent Enforcement Actions. On February 16, 2010, the City entered into a consent
decree with San Francisco Baykeeper to reduce the number of sanitary sewer overflows (SSOs) from the City’s wastewater collection system. The agreement sets forth a timeline for reducing SSOs from the 2010 level of 64 per 100 miles of sewer line per year to a level of 4 per 100 miles of sewer line per year in 2017. The agreement required payments of $200,000 for an environmental mitigation project, $95,000 for litigation fees and costs, and $55,000 for compliance monitoring and these obligations have been met. The agreement also commits the City to certain actions regarding SSO investigation, response and reporting; sewer condition assessment rehabilitation replacement; implementation of a fats, oil and grease program; sewer cleaning, hot spots, and lateral programs; regulation of private laterals; and a chemical root control program.
B-5
An annual report is required commencing on March 1, 2011 and each year thereafter. The agreement set forth stipulated payments for failure to file required reports. On April 19, 2017, San Francisco Baykeeper notified the City that the Consent Decree had automatically terminated and that there would be no extension pursued, indicating their satisfaction with the City’s efforts and progress to meeting the overall SSO reduction targets.
Wastewater Rates
The City’s wastewater rates are independently established by the City Council pursuant to
a rate ordinance, and do not require approval by any other legal entity. Residential customers are billed annually on their property tax statements. Non-residential customers pay volumetric charges based on customer class and metered water use from April 1 to March 31 preceding each new fiscal year, subject to a minimum monthly charge.
In 2016, the City adopted a series of three annual rate increases effective for fiscal years
2016-17 through 2018-19. These rate increases were adopted to support the City’s allocable share of debt service for SVCW’s CIP as well as SVCW operations and the City’s operating and capital programs. These rates were adopted in compliance with Article XIIID of the California Constitution. See “CONSTITUTIONAL LIMITATIONS ON APPROPRIATIONS – Articles XIIIC and XIIID. The following table shows the City’s historical and adopted sewer rates.

B-6
Table B5 City of San Carlos – Historical and Adopted Sewer Rates
2012-13 2013-14 2014-15 2015-16 2016-17 2017-18 2018-19 Effective Rate Increase % 6% 25% 20% 10% 0% 5% 5% Residential (annual charge) $637.24 $807.46 $968.95 $1,065.85 $1,065.85 $1,119.14 $1,175.10 Monthly Equivalent 53.10 67.29 80.75 88.82 88.82 93.26 97.93 Commercial* (per hcf of metered water use) High Strength/Restaurants(1) 10.13 13.05 15.66 17.23 17.23 18.09 18.99 Moderate Strength (includes hotels)(2) 9.94 11.14 13.37 14.71 14.71 15.45 16.22 Standard Strength/All Others 6.47 8.25 9.90 10.89 10.89 11.43 12.00
*Subject to Minimum Annual Charge per Parcel or Account(3): 637.24 605.60 726.71 799.39 799.39 839.36 881.33
Institutional* (per hcf of metered water use) Hospital 6.47 8.47 10.16 11.18 11.18 11.74 12.33 All Others 6.12 7.90 9.48 10.43 10.43 10.95 11.50
*Subject to Minimum Annual Charge per Parcel or Account(3): 637.24 605.60 726.71 799.39 799.39 839.36 881.33
Industrial* Volumetric Charge ($ per hcf of water use) 5.53 6.79 8.15 8.97 8.97 9.42 9.89 BOD ($ per pound) 0.3869 0.7543 0.9052 0.9957 0.9957 1.0455 1.0978 SS ($ per pound) 0.4064 0.7981 0.9577 1.0535 1.0535 1.1062 1.1615
*Subject to Minimum Annual Charge per Parcel or Account(3): 637.24 605.60 726.71 799.39 799.39 839.36 881.33
(1) Includes restaurants, bakeries, mortuaries, markets with garbage disposals, and mixed-use accounts whose wastewater is comprised of 75% or higher flow from
high strength users. (2) Includes hotels with food service and/or laundry facilities, and mixed-use accounts whose wastewater is comprised of greater than 25% but less than 75% of flow
from high-strength users. (3) The City determines which customer class best reflects the wastewater characteristics of each account. Source: City of San Carlos
The following table shows sewer rates adopted by San Mateo County for the sewer districts
served by the City. These rate increases were adopted to help support each district’s share of costs for the Authority’s CIP. These rates were adopted pursuant to Article XIIID of the California Constitution.
Table B6
San Mateo County Adopted Annual Sewer Service Charges
2013-14 2014-15 2015-16 2016-17 2017-18 2018-19 2019-20
Sewer Districts Served by San Carlos Annual Charge per Residential Unit or Equivalent Emerald Lake Heights SMD (Zone 1) $1,190 $1,220 $1,250 $1,280 $1,345 $1,415 $1,490 Devonshire CSD 1,050 1075 1,100 1,125 1,240 1,365 1,500 Harbor Industrial SMD 340 350 360 370 410 --* --* Scenic Heights CSD 1,110 1,140 1,170 1,200 1,440 1,650 1,895 * Rates to be evaluated in fiscal year 2017-18. Source: San Mateo County

B-7
Billing and Collection Each year, the City calculates the wastewater charge for the upcoming fiscal year for each
parcel in the City’s service area. Beginning in 2009, San Carlos began contracting with a financial services firm to prepare the wastewater bills and to monitor trends. These charges are submitted to San Mateo County for collection on the County’s property tax bills (except for governmental agencies which are billed directly). The City’s wastewater charges are listed as a separate item on the tax bill and are collected at the same time and in the same manner as the County’s ad valorem property taxes. The City’s charges are subject to the same penalties and payment enforcement as the County’s taxes, which include the potential to foreclose on properties with payment delinquencies.
San Mateo County’s property tax bills are due in equal installments on November 1 and
February 1 of each fiscal year and become delinquent if not paid by December 10 and April 10 respectively. San Mateo County is on the Teeter Plan under which the County pays the City the full amount of all charges assessed on the County’s tax rolls, and also retains any penalties due to payment delinquency. The County pays the City for 100% of its annual wastewater billings, regardless of payment delinquencies. The County has the option to discontinue an agency’s participation in the Teeter Plan.
Capacity Fees for New Development
The City levies a sewer capacity fee on applicants for new (or expanded) wastewater service
as a condition of obtaining a permit to connect to the sewer system. This fee is used to help fund the cost of sewer facilities that provide benefit to the new or expanded connection. The City’s sewer capacity fees are established by the City Council, and were last updated in 2016. The current sewer capacity fee is $10,811 for a new single family residential connection and $5,000 for each dwelling unit of a new multi-family development. New non-residential connections pay a fee equal to $5,690 for the first 100 gallons of estimated daily average quantity of sewage, plus $56.90 per subsequent 1 gallon of daily estimated average quantity of sewage discharge, as determined by the City Engineer. The City also passes through the current amount of the SVCW connection fee for each new connection.
Future Capital Needs
The City commissioned RMC Water and Environment to prepare a Sewer Collection
System Master Plan, dated January 2013 (the “Master Plan”). The Master Plan reported that the City has $8,802,000 of high priority capacity improvement projects that the City submitted to Baykeeper in compliance with the consent decree (see “-Sewer Utility Regulatory Issues” above). These projects were prioritized based on relative severity of existing capacity deficiencies and the location of historical wet weather overflows. The projects that were determined to have the maximum benefit on the existing collection system capacity have been completed as of June, 2017. An additional rate increase was passed in 2013 to fund projects for lateral and main line replacement starting in 2014. The Master Plan created a priority plan for addressing the system deficiencies as outlined below.
In 2014 the City Council approved the Master Plan approach for a recommended 20-year
collection system capital improvement program in the amount of $20,802,000 (including the $8,802,000 described in the previous paragraph and additional $12 million of sewer rehabilitation) over the next 6 years.

B-8
In addition, the City anticipates financing its 15.14% allocable share of costs for the Authority’s CIP, equal to an estimated $90 million (including 3% cost inflation), after taking into account proceeds from the 2015 Bonds, the 2014 Bonds and outstanding SRF Loans, over approximately the next five years, through long-term debt issued by the Authority or the City.
In 2016, the City adopted three years of rate increases to fund its allocable share of debt
service for the Authority’s CIP and to help fund the City’s capital improvement needs on a pay-as-you-go, cash basis.
Wastewater System Finances
The City’s sewer utility is accounted for as a separate enterprise fund. Sewer enterprise
operations and capital improvements are funded predominantly by sewer service charges supplemented by interest earnings, capacity fees, and other miscellaneous revenues.

B-9
Outstanding Wastewater System Debt The City incurred obligations in connection with the issuance by the Authority of the 2009
Bonds, the 2014 Bonds, the 2015 Bonds, SRF Loans, and the Line of Credit, and, as described in “THE AUTHORITY AND THE WASTEWATER SYSTEM – Outstanding Debt”. The City’s payment obligations to the Authority with respect to the SRF Loans and the Line of Credit are payable from Net Revenues on an unsecured basis.
Table B7 City of San Carlos - Wastewater System Outstanding Debt
Parity Debt Subordinate Debt
Fiscal Year Ending June 30
2009
SVCW Bond Payment(1)
2014
SVCW Bond Payment
2015 SVCW
Bond Payment(2)
2018 SVCW Bond Payment
Existing SFR Loan Payments
Conveyance
Planning SRF Loan Payments(3)
Total 2018 $749,907.25 $645,410.43 $465,550.00 $ -- $410,004.14 $ -- $2,270,871.82 2019 743,691.00 645,744.83 471,000.00 1,419,458.65 410,004.14 -- 3,689,898.62 2020 473,933.75 645,811.71 613,075.00 1,424,137.50 410,004.14 231,056.41 3,798,018.51 2021 -- 646,146.10 924,750.00 1,423,137.50 410,004.14 231,056.41 3,635,094.15 2022 -- 645,978.91 922,375.00 1,421,137.50 410,004.14 231,056.41 3,630,551.96 2023 -- 646,146.11 924,125.00 1,423,012.50 410,004.14 231,056.41 3,634,344.16 2024 -- 645,769.90 929,750.00 1,423,637.50 410,004.14 231,056.41 3,640,217.95 2025 -- 645,686.31 929,250.00 1,423,012.50 410,004.14 231,056.41 3,639,009.36 2026 -- 645,853.51 918,000.00 1,421,137.50 410,004.14 231,056.41 3,626,051.56 2027 -- 646,229.70 916,000.00 1,422,887.50 410,004.14 231,056.41 3,626,177.75
2028 -- 645,937.10 917,875.00 1,423,137.50 410,004.14 231,056.41 3,628,010.15
2029 -- 645,811.71 918,500.00 1,421,887.50 410,004.14 231,056.41 3,627,259.76 2030 -- 645,811.71 917,875.00 1,419,137.50 410,004.14 -- 3,392,828.35 2031 -- 645,895.30 818,500.00 1,419,762.50 410,004.14 -- 3,294,161.94 2032 -- 646,020.70 825,250.00 1,423,512.50 410,004.14 -- 3,304,787.34 2033 -- 646,146.11 820,750.00 1,423,262.50 410,004.14 -- 3,300,162.75 2034 -- 646,229.71 820,125.00 1,420,637.50 285,857.87 -- 3,172,850.08 2035 -- 645,393.70 818,250.00 1,421,668.75 285,857.87 -- 3,171,170.32 2036 -- 645,995.63 820,000.00 1,421,500.00 285,857.87 -- 3,173,353.50 2037 -- 645,912.03 815,375.00 1,421,400.00 285,857.87 -- 3,168,544.90 2038 -- 645,619.42 814,375.00 1,423,387.50 -- -- 2,883,381.92 2039 -- 645,912.02 811,875.00 1,422,675.00 -- -- 2,880,462.02 2040 -- 645,870.23 807,875.00 1,420,987.50 -- -- 2,874,732.73 2041 -- 645,351.90 368,500.00 1,419,400.00 -- -- 2,433,251.90 2042 -- 645,560.91 369,125.00 1,422,500.00 -- -- 2,437,185.91 2043 -- 646,104.31 369,000.00 1,423,800.00 -- -- 2,438,904.31 2044 -- 646,062.51 368,125.00 1,421,287.50 -- -- 2,435,475.01
2045 -- -- 366,500.00 1,422,075.00 -- -- 1,788,575.00
2046 -- -- 369,000.00 1,423,075.00 -- -- 1,792,075.00
2047 -- -- -- 1,422,075.00 -- -- 1,422,075.00
2048 -- -- -- 1,422,450.00 -- -- 1,422,450.00
2049 -- -- -- 1,419,412.50 -- -- 1,419,412.50 Total: $1,967,532.00 $17,438,412.51 $21,150,750.00 $44,080,589.90 $7,703,497.72 $2,310,564.08 $94,651,346.26
(1) Represents approximate allocated share of gross debt service on the Series 2009 Bonds; does not include any Refundable
Credits. (2) Excludes debt service payments made from escrow funds as a result of the crossover refunding of the 2009 Bonds. (3) Preliminary debt service estimate and amortization shown; final amount and amortization, which the Authority is attempting to
extend, will be determined after the SRF-Loan project is completed. The related project is expected to be completed during calendar year 2018.
Source: Silicon Valley Clean Water

B-10
Pension and Other Employee Benefit Costs The City allocates a portion of its employee expenses to its sewer utility based on
employees allocated to operation of the sewer utility. In fiscal year 2016-17, the City allocated approximately 10% of its total employee costs to the sewer utility.
Pension. A significant portion of the City’s employment costs are pension and post-
retirement medical benefit costs. See Notes 10 and 11 of the City’s June 30, 2017 audited financial report, which is attached to this Official Statement as Appendix K, for information as of June 30, 2017 related to the City’s pension and post-retirement medical benefit costs.
The City Miscellaneous Plans Tier 1, Tier 2, Tier 3 and Public Employees’ Pension Reform
Act of 2013 (“PEPRA”), and all Safety Plans (Safety Police and Safety Fire, which were merged together into the Safety Fire Plan effective the beginning of Fiscal Year 2015-16) are all cost-sharing multiple-employer defined benefit pension plans (each a “Plan” and together, the “Plans”) administered by the California Public Employees’ Retirement System (“PERS”), an agent multiple-employer public employee defined benefit pension plan. PERS provides retirement and disability benefits, annual cost-of-living adjustments, and death benefits to plan members and beneficiaries. PERS acts as a common investment and administrative agent for participating public entities within the State of California.
Three-year trend information for the City’s Plans is set forth below:
Three-year Trend of Annual Pension Cost
Contribution Rate Contribution
Amount Miscellaneous Plan
Safety Fire 1st Tier 2nd Tier 3rd Tier PEPRA 1st Tier 2015 $2,359,606 22.167% 15.133% 10.773% 6.500% 19.900% 2016 $2,610,942 11.478 10.132 8.479 6.460 13.813 2017 $1,783,534 11.973 10.408 8.721 6.647 14.785
Source: City of San Carlos
Three-year Trend of Funded Status of the Miscellaneous Plans
Statewide Miscellaneous Plan Tier 1 (2.7% at 55 years)
Valuation Date
Entry Age Accrued Liability
Share of Pool’s MarketValue of Assets
Unfunded (Overfunded)
Liability Funded Ratio
Annual Covered Payroll
2014 $58,833,653 $43,775,180 $15,058,473 74.4% $3,642,548 2015 61,190,816 43,515,489 17,675,327 71.1 3,534,886 2016 63,983,099 42,444,815 21,538,284 66.3 3,399,615
Source: PERS Actuarial Report August 2017
Statewide Miscellaneous Plan Tier 2 (2.5% at 55 years)
Valuation Date
Entry Age Accrued Liability
Share of Pool’s Market Value of Assets
Unfunded (Overfunded)
Liability Funded Ratio
Annual Covered Payroll
2014 $442,889 $394,869 $48,030 89.2% $301,855 2015 504,999 460,215 44,784 91.1 177,647 2016 636,002 542,616 93,386 85.3 223,593
Source: PERS Actuarial Report August 2017

B-11
Statewide Miscellaneous Plan Tier 3 (2.0% at 55 years)
Valuation Date
Entry Age Accrued Liability
Share of Pool’s Market Value of Assets
Unfunded (Overfunded)
Liability Funded Ratio
Annual Covered Payroll
2014 $351,972 $378,307 ($26,335) 107.5% $1,164,667 2015 596,121 621,810 (25,689) 104.3 1,380,906 2016 958,264 907,272 50,992 94.7 1,585,486
Source: PERS Actuarial Report August 2017
PEPRA Miscellaneous Plan (2.0% at 62 years)
Valuation Date
Entry Age Accrued Liability
Share of Pool’s Market Value of Assets
Unfunded (Overfunded)
Liability Funded Ratio
Annual Covered Payroll
2014 $95,526 $100,496 ($4,970) 105.2% $754,437 2015 217,980 208,831 9,149 95.8 1,110,831 2016 413,084 369,546 43,538 89.5 1,751,167
Source: PERS Actuarial Report August 2017
Safety Plan (Fire - 2% @ 50 years; Police - 3% @ 55 years)
Valuation Date Accrued Liability
Share of Pool’s Market Value of Assets
Plan’s Share of Pool’s Unfunded
Liability Funded Ratio
Annual Covered Payroll
2014 $50,420,361 $36,261,877 $14,158,484 71.9% $104,279 2015 51,152,779 35,320,829 15,831,950 69.0 109,807 2016 51,217,026 32,564,017 18,653,009 63.6 114,753 Source: PERS Actuarial Report August 2017
In addition to the Plans, the City is required to make annual contributions to the Belmont-
San Carlos Fire Department (“BSCFD”), a dissolved joint powers authority between the City of Belmont and the City of San Carlos, which pay for other post-employment benefits for retirees who earned lifetime medical coverage, unfunded liabilities of the safety and miscellaneous retirement plans with PERS, outstanding workers’ compensation claims from former employees, and liability claims or other obligations of the former BSCFD. The City’s contribution during the year ended June 30, 2017 was $1,814,363.
See “APPENDIX A – Pension and Other Employee Benefit Costs – Recent Changes by
PERS” for more information about PERS. Other Post-Employment Benefits (OPEB). Three-year trend information for the City’s
OPEB plan is set forth below:
Three-year Trend of Annual OPEB Cost
Fiscal year ended
June 30
Annual OPEB cost
(AOC)
Actual
Contribution
Percentage of AOC
contributed
Net OPEB obligations
(Asset)
Healthcare 2015 $287,127 $287,000 100% $(106,873) 2016 381,320 284,200 75 (9,759) 2017 383,000 398,000 104 (24,759)
Source: City of San Carlos

B-12
Historical Revenues and Expenses The following table shows a history of revenues, expenses, and net revenues based on information
provided in the City’s audited financial statements and by the City.
Table B8 Sewer Enterprise - Historical Revenues, Expenses, and Fund Balances
Fiscal Year Ended June 30
2013
(Audited) 2014
(Audited) 2015
(Audited) 2016
(Audited) 2017
(Audited) Adopted Rate Increase (rounded) 6% 25% 20% 10% 0% REVENUES Charges for Service $9,963,605 $12,621,331 $15,233,292 $16,305,406 $16,052,041 Connection Fees 47,970 63,921 102,050 492,893 741,572 Intra-Agency Transfers 211,041 243,477 192,256 190,043 187,502 Investment Earnings & Other Revenues 45,509 93,671 104,249 109,244 91,733 Total Revenues $10,268,125 $13,022,400 $15,631,847 $17,097,586 $17,072,848 EXPENSES Operating & Maintenance Operating Expenses from Audit 7,072,683 8,428,989 10,426,290 11,821,102 11,543,508 Less Depreciation (315,341) (352,480) (465,684) (472,774) (694,679) Less SVCW Debt Service Payments (1) (671,637) (780,607) (1,455,974) (1,363,661) (1,795,651) Less SVCW Non-Operating Payments 0 0 0 0 0 Plus Transfer Out 510,000 520,200 591,000 562,600 573,900
Net Operating Expenses $6,595,705 $7,816,102 $9,095,632 $10,547,267 $9,627,078
Net Revenues $3,672,420 $5,206,298 $6,536,215 $6,550,319 $7,445,770
Debt Service (1) City Share of SVCW 2008 Bonds 118,208 116,008 118,708 88,754 0 City Share of SVCW 2009 Bonds (Net) 553,430 540,453 655,081 444,149 562,611 City Share of SVCW 2014 Bonds 0 0 558,039 646,163 645,494 City Share of SVCW 2015 Bonds 0 0 0 60,449 463,400
Total Senior Debt Service $671,637 $656,461 $1,331,828 $1,239,515 $1,671,505 Senior Debt Service Coverage 5.47 7.93 4.91 5.28 4.45 City Share of SVCW SRF Loans 0 124,146 124,146 124,146 124,146 City Share of SVCW Line of Credit 0 0 0 0 0 Total Debt Service $671,637 $780,607 $1,455,974 $1,363,661 $1,795,651 Total Debt Service Coverage 5.47 6.67 4.49 4.80 4.15
Net Revenues After Debt Service 3,000,783 4,425,691 5,080,241 5,186,658 5,650,119
Cash & Equivalents June 30(2) 7,769,570 10,485,167 14,772,639 15,755,190 12,298,405 Days Operating Cash June 30 430 490 593 545 466
(1) Net of reserve and interest credits received by the City. (2) Unrestricted cash and investments of the Sewer Enterprise Fund as reported in the City’s Comprehensive Annual Financial Reports. Source: City of San Carlos and City of San Carlos Comprehensive Annual Financial Reports.

B-13
Projected Revenues, Expenses, and Debt Service Coverage
The following table shows cash flow assumptions and projections of the City’s sewer enterprise revenues, expenses, and net revenues. The projections include the City’s estimated allocable share of debt service for the Authority’s CIP. The projections were developed by the City and Bartle Wells Associates based on information provided by the City and SVCW, and a number of assumptions including those listed on the following table. Debt service projections are based on the latest estimates provided by SVCW. While the City believes the estimates and projections shown are reasonable, no assurance can be given that the results shown will be achieved.
Assumptions Regarding Revenues
1. Sewer Service Charges are projected based on fiscal year 2016-17 actual revenues adjusted for adopted and projected rate increases and growth.
2. Connection Fees are projected at $250,000 in the current fiscal year 2017-18 based on year-to-date revenues, and are conservatively projected at $100,000 per year in future years.
3. Investment Earnings are conservatively projected at $150,000 per year in future years.
4. Other revenues are projected as shown on the table, with a conservative estimate of a 2% increase per year.
Assumptions Regarding Expenses
1. City Operating and Maintenance Expenses are based on the City’s Budget for fiscal year 2017-18 and are projected to escalate at the annual rate of 3%.
2. SVCW Operating Expenses are based on SVCW’s fiscal year 2017-18 budget with operating and maintenance costs broken out separately from debt service, capital and other non-operating expenses. Future SVCW operating expenses are based on projections provided by SVCW and assumes the FY 2017-18 Budget and increases of 3-4% per year thereafter, except in fiscal year 2021-22.
3. Senior Debt Service includes the City’s allocable share of payments due for outstanding and projected SVCW bonds issued to help fund SVCW’s CIP. Debt service due on the 2009 Bonds, which were issued as Build America Bonds, is offset by a direct federal subsidy payment.
4. City Capital Improvements are projected based on the City’s proposed 5-year sewer system capital improvement program budget with some minor modifications and additional contingency funding. The City anticipates funding all of these projects on a pay-as-you-go, cash basis.
5. SVCW Capital & Reserve Contribution Payments include the City’s share of projected SVCW cash-funded capital repairs and the City’s allocable share of payments for the Authority’s operating reserve requirements.
6. Days Cash on Hand is based on Ending Fund Reserves divided by Operating & Maintenance Expenses, multiplied by 365 days.
7. Payments for the City’s allocated share of SVCW’s 2009 Bonds and the Refundable Credits, 2014 Bonds, 2015 Bonds, 2018 Bonds, Future Bonds and SRF Loans are rounded to the nearest $1,000 dollars.

B-14
Table B9 City of San Carlos - Sewer Enterprise Cash Flow Projections
2017-18 2018-19 2019-20 2020-21 2021-22 Adopted Adopted Projected Projected Projected Rate Increase 5% 5% 6% 6% 6% Beginning Fund Reserves $12,298,000 $12,679,000 $12,878,000 $13,308,000 $13,381,000 REVENUES Sewer Service Charges 16,400,000 17,295,000 18,333,000 19,433,000 20,599,000Contract Agency Charges 502,000 527,000 559,000 593,000 629,000Connection Fees 250,000 100,000 100,000 100,000 100,000Investment Earnings 154,000 150,000 150,000 150,000 150,000Other Revenues 508,000 518,000 528,000 539,000 550,000Total Revenues 17,814,000 18,590,000 19,670,000 20,815,000 22,028,000 EXPENSES Operating & Maintenance City Operating Expenses 6,432,000 6,625,000 6,824,000 7,029,000 7,240,000SVCW Operating Expenses 2,977,000 3,087,000 3,200,000 3,324,000 3,338,000 Total O&M with Transfers 9,409,000 9,712,000 10,024,000 10,353,000 10,578,000 Net Revenues 8,405,000 8,878,000 9,646,000 10,462,000 11,450,000 Debt Service Senior Debt Service City Share of SVCW 2009 Bonds (Net) 565,000 563,000 384,000 -- --City Share of SVCW 2014 Bonds 645,000 646,000 646,000 646,000 646,000City Share of SVCW 2015 Bonds 466,000 471,000 613,000 925,000 922,000City Share of SVCW 2018 Bonds -- 1,419,000 1,424,000 1,423,000 1,421,000City’s Share of Future SVCW Bonds -- -- 313,000 1,189,000 2,129,000 Total Senior Debt Service 1,676,000 3,099,000 3,380,000 4,183,000 5,118,000 Senior Debt Service Coverage 5.01 2.86 2.85 2.50 2.24 Subordinate Debt Service City Share of Existing SVCW SRF Loans 410,000 410,000 641,000 641,000 641,000City Share of SVCW Line of Credit 13,000 Subtotal Subordinate Debt Service 423,000 410,000 641,000 641,000 641,000 Total Combined Debt Service 2,099,000 3,509,000 4,021,000 4,824,000 5,759,000 Total Debt Service Coverage 4.00 2.53 2.40 2.17 1.99 Capital & Other Non-Operating City Sewer System Improvements 4,000,000 3,500,000 4,000,000 4,000,000 4,000,000Other City Capital Improvements 1,540,000 1,280,000 800,000 1,090,000 1,000,000SVCW Pay-Go Capital Funding 234,000 239,000 244,000 248,000 253,000SVCW Reserve Contributions 151,000 151,000 151,000 227,000 303,000 Subtotal 5,925,000 5,170,000 5,195,000 5,565,000 5,556,000 Total Expenses 17,433,000 18,391,000 19,240,000 20,742,000 21,893,000
Revenues Less Expenses 381,000 199,000 430,000 73,000 135,000Ending Fund Reserves $12,679,000 $12,878,000 $13,308,000 $13,381,000 $13,516,000Days Cash on Hand 492 484 485 472 466 Source: City of San Carlos
B-15
Absence of Litigation The City is not aware of any action, suit, or proceeding known to be pending or threatened,
that would affect the execution of the City’s Financing Agreement with the Authority, or materially impact the finances of the City’s wastewater system.
Financial Statements
The City’s most recent audited financial statements for the fiscal year ending June 30, 2017
are attached as Appendix K. The City’s financial statements were audited by Maze & Associates, independent auditors. The auditor has not been asked to consent to the inclusion of the City’s audited financial statements in this Official Statement and has not reviewed this Official Statement.

[THIS PAGE INTENTIONALLY LEFT BLANK]

C-1
APPENDIX C
INFORMATION ABOUT WEST BAY SANITARY DISTRICT
West Bay Sanitary District The West Bay Sanitary District is an independent special district that provides wastewater
service to the City of Menlo Park, Atherton, Portola Valley and areas of East Palo Alto, Woodside and unincorporated San Mateo and Santa Clara counties. The District is located in the northern part of Silicon Valley approximately 26 miles south of San Francisco, between San Francisco and San Jose. The District was originally formed in December 1902 as the Menlo Park Sanitary District under the Sanitary Sewer Act of 1891. The District operated as the Menlo Park Sanitary District from 1902 until 1981 when its name was changed to the West Bay Sanitary District to more accurately reflect the service area. The powers of the District are established by the State of California Health and Safety Code. The District serves a population of approximately 55,000 via approximately 19,195 predominantly residential sewer service connections.
Form of Government
The District is governed by a five-member Board of Directors whose members are elected at
large from the District’s service area to staggered terms of four years. The current members of the Board of Directors are:
Director Current Term Expires Edward P. Moritz, President November 2018 Fran Dehn, Secretary November 2020 Roy Thiele-Sardiña, Treasurer November 2018 George Otte* November 2018 David Walker November 2020 ____________ * Appointed representative to Silicon Valley Clean Water. Day to day activities of the District are managed by a District Manager, who is appointed by the
Board of Directors and oversees a staff of approximately 28 employees.
District Leadership
Phil Scott is the District Manager and reports directly to the Board of Directors. Mr. Scott manages day to day operations of the District including more than 25 employees. Mr. Scott also serves as Chief Fiscal Officer and is responsible for budgeting, forecasting revenue requirements, long range and strategic planning, facilitating Board meetings, and negotiations. Mr. Scott has 36 years of experience in the wastewater industry and has been District Manager of the District for 8 years.
Bill Kitajima is the Projects & IT Manager: With over 20 years at the District, Mr. Kitajima manages all capital improvement projects and Collection System Master Planning, prioritizes CIP projects, and oversees engineering, bidding and construction of all CIP projects. Mr. Kitajima also manages all databases and computer/server operations and replacements and day to day technical operations.
John Simonetti is the Regulatory and Compliance Coordinator: Mr. Simonetti has 28 years of experience at the District and manages all commercial and industrial pretreatment and discharge inspections and permitting. Mr. Simonetti ensures NPDES compliance with all

C-2
commercial customers, monitors flows and loadings of the system, and also acts as District Liaison to the Treatment Plant and serves as Safety Officer for the District.
Liz Bahrami is the District Accountant and has over 15 years of service with the District. Ms. Bahrami manages all accounting operations, is responsible for deposits, AP, AR, cash flow forecasting, production of Withdrawal Orders, quarterly financial statements, annual audits, final financial statements and payroll. Ms. Bahrami also produces the annual budget and provides monthly expense reports for internal controls.
Sergio Ramirez is the Operations Superintendent, with 7 years of experience at the District and over 23 years in the wastewater industry. Mr. Ramirez manages and oversees 17 employees and the collection system maintenance operations, including cleaning and repairing of sewer pipelines and CCTV inspection of sewer pipelines and pump station maintenance. Mr. Ramirez ensures that the system runs efficiently, safely and with minimal interruptions to convey wastewater (4.1 MGD) to the treatment plant in Redwood City, and helped the District to achieve the Collection System of the Year award for the Santa Clara Valley Section of the California Water Environment Association for 2012.
The Wastewater System The District owns and operates a sanitary sewer collection system consisting of approximately
200 miles of sewer pipelines ranging in size from 3 to 54 inches in diameter, and 13 sewer pump stations. The District’s wastewater collection system is in good operating condition and has an average age of approximately 50 years, with an estimated life of 90 years. The District also owns a flow equalization facility, which has the capacity to hold approximately 10 million gallons of untreated wastewater. The District’s wastewater is conveyed to the Authority for treatment and disposal.
Wastewater Flow to Authority
The following table shows the District’s recent average daily wastewater flows to the Authority.
Table C1 West Bay Sanitary District - Average Daily Wastewater Flow (mgd)
2012-13 2013-14 2014-15 2015-16 2016-17 Average Daily Flow (mgd) 3.5 3.5 3.6 3.8 4.1
Source: Silicon Valley Clean Water
Service Area & Customer Base
The District’s sewer service area is approximately 14 square miles and includes the City of
Menlo Park, portions of the Cities of East Palo Alto, Redwood City, and Atherton, portions of the Towns of Woodside and Portola Valley, and portions of unincorporated San Mateo and Santa Clara Counties.
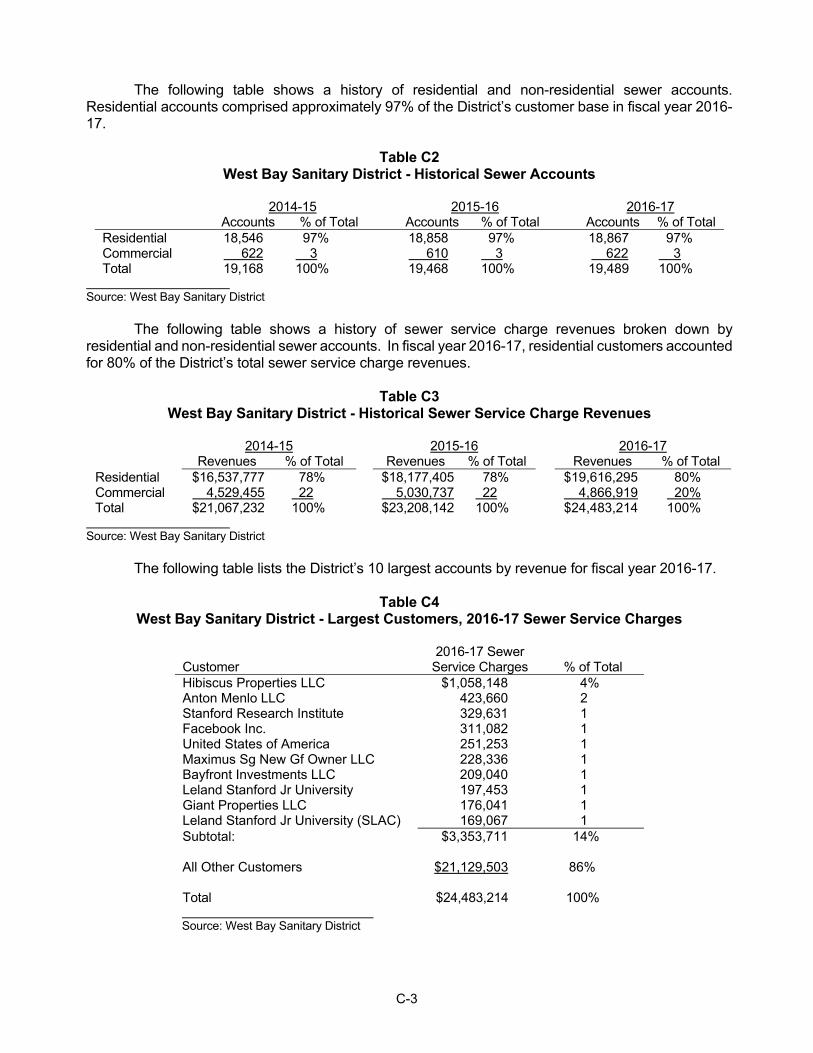
C-3
The following table shows a history of residential and non-residential sewer accounts. Residential accounts comprised approximately 97% of the District’s customer base in fiscal year 2016-17.
Table C2
West Bay Sanitary District - Historical Sewer Accounts
2014-15 2015-16 2016-17 Accounts % of Total Accounts % of Total Accounts % of Total Residential 18,546 97% 18,858 97% 18,867 97% Commercial 622 3 610 3 622 3 Total 19,168 100% 19,468 100% 19,489 100%
Source: West Bay Sanitary District
The following table shows a history of sewer service charge revenues broken down by
residential and non-residential sewer accounts. In fiscal year 2016-17, residential customers accounted for 80% of the District’s total sewer service charge revenues.
Table C3
West Bay Sanitary District - Historical Sewer Service Charge Revenues
2014-15 2015-16 2016-17
Revenues % of Total Revenues % of Total Revenues % of Total Residential $16,537,777 78% $18,177,405 78% $19,616,295 80% Commercial 4,529,455 22 5,030,737 22 4,866,919 20% Total $21,067,232 100% $23,208,142 100% $24,483,214 100%
Source: West Bay Sanitary District
The following table lists the District’s 10 largest accounts by revenue for fiscal year 2016-17.
Table C4 West Bay Sanitary District - Largest Customers, 2016-17 Sewer Service Charges
Customer 2016-17 Sewer
Service Charges % of Total Hibiscus Properties LLC $1,058,148 4% Anton Menlo LLC 423,660 2 Stanford Research Institute 329,631 1 Facebook Inc. 311,082 1 United States of America 251,253 1 Maximus Sg New Gf Owner LLC 228,336 1 Bayfront Investments LLC 209,040 1 Leland Stanford Jr University 197,453 1 Giant Properties LLC 176,041 1 Leland Stanford Jr University (SLAC) 169,067 1 Subtotal: $3,353,711 14% All Other Customers $21,129,503 86% Total $24,483,214 100% Source: West Bay Sanitary District
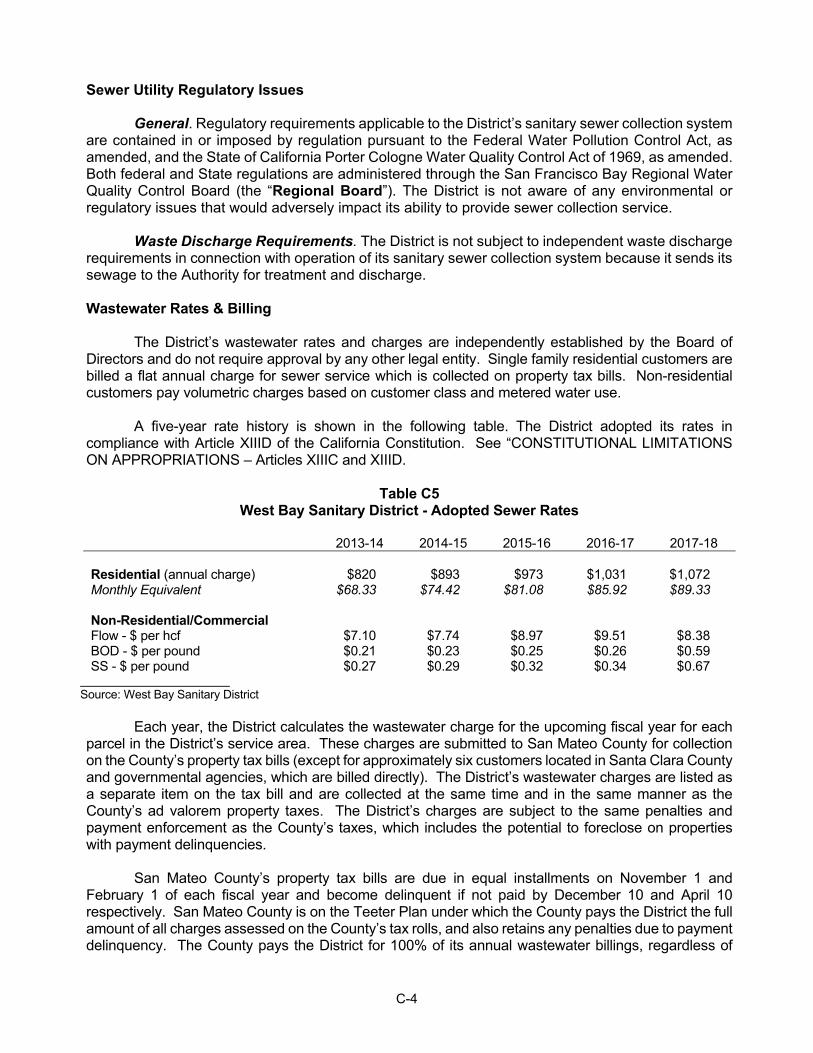
C-4
Sewer Utility Regulatory Issues General. Regulatory requirements applicable to the District’s sanitary sewer collection system
are contained in or imposed by regulation pursuant to the Federal Water Pollution Control Act, as amended, and the State of California Porter Cologne Water Quality Control Act of 1969, as amended. Both federal and State regulations are administered through the San Francisco Bay Regional Water Quality Control Board (the “Regional Board”). The District is not aware of any environmental or regulatory issues that would adversely impact its ability to provide sewer collection service.
Waste Discharge Requirements. The District is not subject to independent waste discharge
requirements in connection with operation of its sanitary sewer collection system because it sends its sewage to the Authority for treatment and discharge.
Wastewater Rates & Billing
The District’s wastewater rates and charges are independently established by the Board of
Directors and do not require approval by any other legal entity. Single family residential customers are billed a flat annual charge for sewer service which is collected on property tax bills. Non-residential customers pay volumetric charges based on customer class and metered water use.
A five-year rate history is shown in the following table. The District adopted its rates in
compliance with Article XIIID of the California Constitution. See “CONSTITUTIONAL LIMITATIONS ON APPROPRIATIONS – Articles XIIIC and XIIID.
Table C5
West Bay Sanitary District - Adopted Sewer Rates
2013-14 2014-15 2015-16 2016-17 2017-18 Residential (annual charge) $820 $893 $973 $1,031 $1,072 Monthly Equivalent $68.33 $74.42 $81.08 $85.92 $89.33 Non-Residential/Commercial Flow - $ per hcf $7.10 $7.74 $8.97 $9.51 $8.38 BOD - $ per pound $0.21 $0.23 $0.25 $0.26 $0.59 SS - $ per pound $0.27 $0.29 $0.32 $0.34 $0.67
Source: West Bay Sanitary District
Each year, the District calculates the wastewater charge for the upcoming fiscal year for each
parcel in the District’s service area. These charges are submitted to San Mateo County for collection on the County’s property tax bills (except for approximately six customers located in Santa Clara County and governmental agencies, which are billed directly). The District’s wastewater charges are listed as a separate item on the tax bill and are collected at the same time and in the same manner as the County’s ad valorem property taxes. The District’s charges are subject to the same penalties and payment enforcement as the County’s taxes, which includes the potential to foreclose on properties with payment delinquencies.
San Mateo County’s property tax bills are due in equal installments on November 1 and
February 1 of each fiscal year and become delinquent if not paid by December 10 and April 10 respectively. San Mateo County is on the Teeter Plan under which the County pays the District the full amount of all charges assessed on the County’s tax rolls, and also retains any penalties due to payment delinquency. The County pays the District for 100% of its annual wastewater billings, regardless of

C-5
payment delinquencies. The County has the option to discontinue an agency’s participation in the Teeter Plan.
Connection Fees for New Development
The District levies a sewer connection charge on new applicants for wastewater service and
applicants for expanded service. The purpose of the charge is to recover a proportionate share of costs of District facilities benefiting new connections to the wastewater system. The District’s connection fees are established by the Board of Directors. The District’s current residential connection charge is a fixed, one-time charge of $6,919 per residential unit. The fee for non-residential connections is based on the estimated wastewater discharge for each new account, as determined by the District.
In addition, pursuant to the Joint Powers Agreement, the District also collects the Authority’s
connection fees and periodically remits payment of these fees to the Authority. The total connection charges collected by the District from new non-residential accounts, including both the District’s and Authority’s connection fees, are subject to a minimum charge of $8,501 per connection or $42.50 per gallon per day of estimated wastewater discharge.
Future Capital Needs
The District anticipates spending approximately $9.8 million in 2017-18 and an average of
approximately $7.9 million per year for capital improvements to the District’s wastewater system in upcoming years. This level of expenditures represents an increase from the amounts spent annually in recent history. These improvements primarily include repairs, replacements, and other upgrades to the District’s collection system pipelines, but also include some pump station improvements. The District anticipates funding these improvements on a pay-as-you-go, cash basis.
In addition, the District anticipates financing its allocable share of costs for the Authority’s CIP,
equal to approximately $160 million through 2024-25, after taking into account proceeds from the 2015 Bonds, the 2014 Bonds and outstanding SRF Loans. The District anticipates financing these costs through long-term debt issued by the Authority and/or the District.

C-6
Outstanding District Debt The District incurred obligations in connection with the issuance by the Authority of the 2008
Bonds, the 2009 Bonds, the 2014 Bonds, the 2015 Bonds, SRF Loans, and the Line of Credit, as described in “THE AUTHORITY AND THE WASTEWATER SYSTEM – Outstanding Debt”. The District’s payment obligations to the Authority with respect to the SRF Loans and the Line of Credit are payable from Net Revenues on an unsecured basis.
Table C6 West Bay Sanitary District - Outstanding Debt
Parity Debt Subordinate Debt
Fiscal Year Ending June 30
2009
SVCW Bond Payment(1)
2014
SVCW Bond Payment
2015 SVCW
Bond Payment(2)
2018 SVCWBond Payment
Existing SRF Loan Payments
Conveyance
Planning SRF Loan
Payments(3) Total 2018 $1,285,429.75 $1,144,175.41 $826,950.00 $ -- $726,842.69 $ -- $3,983,397.85 2019 1,276,286.25 1,144,768.23 824,050.00 1,838,480.31 726,842.69 -- 5,810,427.48 2020 810,662.50 1,144,886.80 1,069,500.00 1,834,712.50 726,842.69 $409,613.87 5,996,218.36 2021 -- 1,145,479.63 1,610,500.00 1,837,712.50 726,842.69 409,613.87 5,730,148.69 2022 -- 1,145,183.21 1,615,125.00 1,839,212.50 726,842.69 409,613.87 5,735,977.27 2023 -- 1,145,479.62 1,608,250.00 1,834,337.50 726,842.69 409,613.87 5,724,523.68 2024 -- 1,144,812.70 1,605,000.00 1,837,962.50 726,842.69 409,613.87 5,724,231.76 2025 -- 1,144,664.49 1,614,875.00 1,834,962.50 726,842.69 409,613.87 5,730,958.55 2026 -- 1,144,960.90 1,607,875.00 1,835,337.50 726,842.69 409,613.87 5,724,629.96 2027 -- 1,145,627.84 1,599,375.00 1,838,837.50 726,842.69 409,613.87 5,720,296.90 2028 -- 1,145,109.12 1,604,000.00 1,835,462.50 726,842.69 409,613.87 5,721,028.18 2029 -- 1,144,886.80 1,601,500.00 1,835,212.50 726,842.69 409,613.87 5,718,055.86 2030 -- 1,144,886.80 1,601,875.00 1,837,837.50 726,842.69 -- 5,311,441.99 2031 -- 1,145,035.02 1,439,125.00 1,838,212.50 726,842.69 -- 5,149,215.21 2032 -- 1,145,257.32 1,433,500.00 1,836,337.50 726,842.69 -- 5,141,937.51 2033 -- 1,145,479.62 1,431,000.00 1,837,337.50 726,842.69 -- 5,140,659.81 2034 -- 1,145,627.82 1,431,375.00 1,836,637.50 506,765.20 -- 4,920,405.53 2035 -- 1,144,145.78 1,424,625.00 1,834,218.75 506,765.20 -- 4,909,754.74 2036 -- 1,145,212.85 1,425,625.00 1,835,300.00 506,765.20 -- 4,912,903.06 2037 -- 1,145,064.65 1,424,125.00 1,835,000.00 506,765.20 -- 4,910,954.86 2038 -- 1,144,545.93 1,420,125.00 1,837,400.00 -- -- 4,402,070.93 2039 -- 1,145,064.66 1,413,625.00 1,837,750.00 -- -- 4,396,439.66 2040 -- 1,144,990.54 1,409,500.00 1,836,800.00 -- -- 4,391,290.54 2041 -- 1,144,071.68 656,750.00 1,834,500.00 -- -- 3,635,321.68 2042 -- 1,144,442.18 651,250.00 1,835,400.00 -- -- 3,631,092.18 2043 -- 1,145,405.52 654,500.00 1,839,000.00 -- -- 3,638,905.52 2044 -- 1,145,331.42 651,375.00 1,834,125.00 -- -- 3,630,831.42 2045 -- -- 651,875.00 1,837,050.00 -- -- 2,488,925.00 2046 -- -- 650,875.00 1,838,750.00 -- -- 2,489,625.00 2047 -- -- -- 1,837,850.00 -- -- 1,837,850.00 2048 -- -- -- 1,838,712.50 -- -- 1,838,712.50 2049 -- -- -- 1,836,587.50 -- -- 1,836,587.50 Total: $3,372,378.50 $30,914,596.54 $36,958,125.00 $56,937,036.56 $13,656,543.78 $4,096,138.69 $145,934,819.17 (1) Represents approximate allocated share of gross debt service on the Series 2009 Bonds; does not include any Refundable
Credits. (2) Excludes debt service payments made from escrow funds as a result of the crossover refunding of the 2009 Bonds. (3) Preliminary debt service estimate and amortization shown; final amount and amortization, which the Authority is attempting to
extend, will be determined after the SRF-Loan project is completed. The related project is expected to be completed during calendar year 2018.
Source: Silicon Valley Clean Water

C-7
Pension and Other Employee Benefit Costs A significant portion of the District’s operation costs are employee costs, including pension
and post-retirement medical benefit costs. See Notes 10 and 11 of the District’s June 30, 2017 audited financial report, which is attached to this Official Statement as Appendix L, for information as of June 30, 2017 related to the District’s pension and post-retirement medical benefit costs.
The District contributes to the California Public Employees’ Retirement System (“PERS”), an
agent multiple-employer public employee defined benefit pension plan. PERS provides retirement and disability benefits, annual cost-of-living adjustments, and death benefits to plan members and beneficiaries. PERS acts as a common investment and administrative agent for participating public entities within the State of California.
Pension. Three-year trend information for the District’s pension plan is set forth below:
Three-Year Trend of Annual Pension Cost (Employer Portion)
Fiscal year ended
June 30
Annual pension cost
(APC)
Percentage of APC
contributed
Net pension obligations
2015 $542,448 65% $353,860 2016 558,925 65 365,293 2017 583,950 68 399,280
Source: West Bay Sanitary District
Three-Year Trend of
Funded Status of the Plan
Miscellaneous Plan Tier 1 (2.5% at 55 years)
Valuation Date
(June 30) Accrued Liability
Share of
Pool’s Market Value of Assets
Plan’s Share of Pool’s Unfunded Liability Funded Ratio
Annual Covered Payroll
UAAL as a Percentage of
Payroll 2014 $15,632,782 $12,557,621 $3,075,161 80.3% $2,348,871 156.2% 2015 16,156,045 12,387,076 3,768,969 76.7 2,413,220 156.2 2016 17,009,823 12,109,690 4,900,133 71.2 2,285,057 214.5
Source: PERS Actuarial Report August 2017
Miscellaneous Plan Tier 2 (2% at 60 years)
Valuation Date
(June 30) Accrued Liability
Share of
Pool’s Market Value of Assets
Plan’s Share of Pool’s Unfunded Liability Funded Ratio
Annual Covered Payroll
UAAL as a Percentage of
Payroll 2015 $545 $519 $26 95.2% $67,687 0.04% 2016 0 (28) 28 0.0 0 0.00
Source: PERS Actuarial Report August 2017

C-8
Miscellaneous Plan PEPRA (2% at 62 years)
Valuation Date
(June 30) Accrued Liability
Share of
Pool’s Market Value of Assets
Plan’s Share of Pool’s Unfunded Liability Funded Ratio
Annual Covered Payroll
UAAL as a Percentage of
Payroll 2014 $8,925 $9,322 ($397) 104.5% $62,472 N/A 2015 19,605 18,757 848 95.7 63,721 1.3% 2016 57,120 51,725 5,395 90.6 319,166 1.7
Source: PERS Actuarial Report August 2017
As of June 30, 2016, the most recent actuarial valuation date, the market value of the Plan’s
assets was $12,103,690, resulting in a funded ratio of 71.2%. See “APPENDIX A – Pension and Other Employee Benefit Costs – Recent Changes by PERS”
and for information about PERS.
Other Post-Employment Benefits (OPEB). Trend information for the District’s OPEB plan is set forth below:
Three-year Trend of Annual OPEB Cost
Fiscal year
ended June 30
Annual OPEB cost
(AOC)
Percentage of AOC
contributed
Net OPEB obligations
(Asset) 2014 $26,200 23.33% $77,659 2015 25,900 16.75 99,221 2016 25,313 21.67 119,049
Source: West Bay Sanitary District 2016 Audit Report
Three-year Trend of
Funded Status of the Plan
Valuation Date
(March 1)
Actuarial Value
of Assets
Entry age normal accrued liability
Unfunded/ (overfunded)
liability (UAAL)
Funded ratio
Annual covered payroll
UAAL as a percentage of payroll
2010 $0 $137,900 $137,900 0% $1,952,200 7.06% 2013 0 186,100 186,000 0 2,391,800 7.78 2015 0 217,440 217,440 0 2,846,000 7.64
Source: West Bay Sanitary District 2016 Audit Report
As of July 1, 2015, the most recent available actuarial valuation date, the market value of the
OPEB assets was $0, resulting in a funded ratio of 0%.
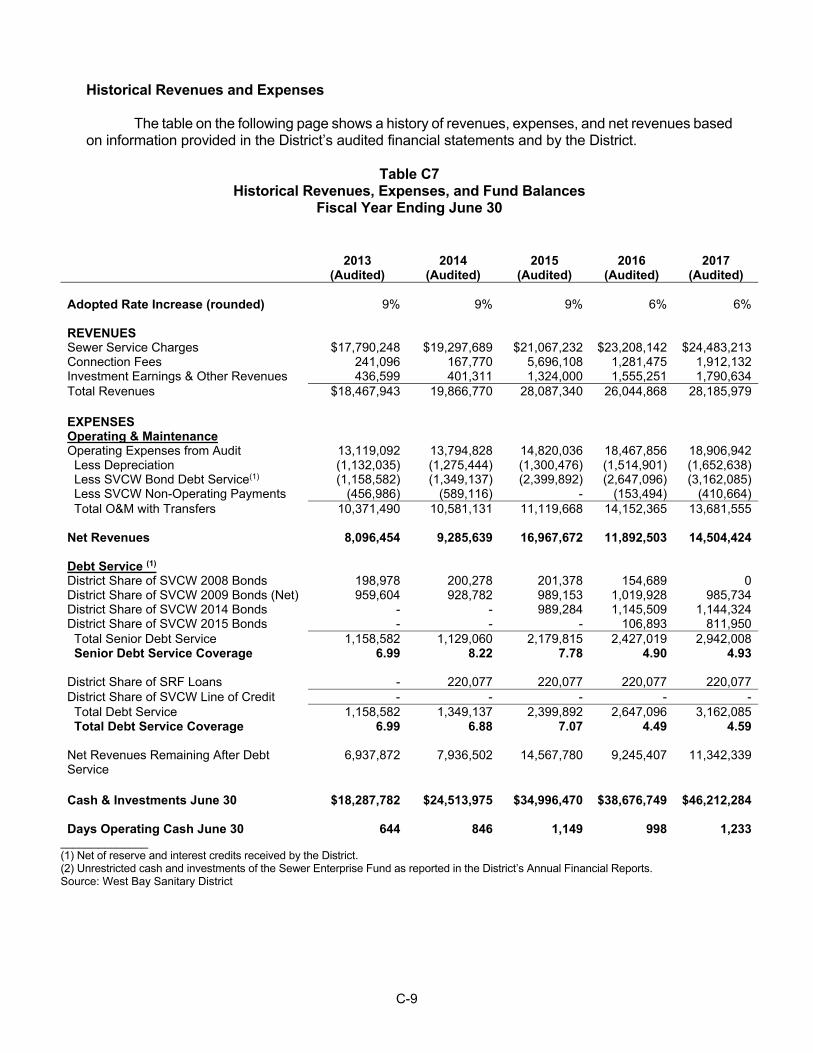
C-9
Historical Revenues and Expenses
The table on the following page shows a history of revenues, expenses, and net revenues based on information provided in the District’s audited financial statements and by the District.
Table C7
Historical Revenues, Expenses, and Fund Balances Fiscal Year Ending June 30
2013
(Audited) 2014
(Audited) 2015
(Audited) 2016
(Audited) 2017
(Audited) Adopted Rate Increase (rounded)
9% 9% 9% 6% 6%
REVENUES Sewer Service Charges $17,790,248 $19,297,689 $21,067,232 $23,208,142 $24,483,213Connection Fees 241,096 167,770 5,696,108 1,281,475 1,912,132Investment Earnings & Other Revenues 436,599 401,311 1,324,000 1,555,251 1,790,634Total Revenues $18,467,943 19,866,770 28,087,340 26,044,868 28,185,979 EXPENSES Operating & Maintenance Operating Expenses from Audit 13,119,092 13,794,828 14,820,036 18,467,856 18,906,942 Less Depreciation (1,132,035) (1,275,444) (1,300,476) (1,514,901) (1,652,638) Less SVCW Bond Debt Service(1) (1,158,582) (1,349,137) (2,399,892) (2,647,096) (3,162,085) Less SVCW Non-Operating Payments (456,986) (589,116) - (153,494) (410,664) Total O&M with Transfers 10,371,490 10,581,131 11,119,668 14,152,365 13,681,555 Net Revenues 8,096,454 9,285,639 16,967,672 11,892,503 14,504,424 Debt Service (1) District Share of SVCW 2008 Bonds 198,978 200,278 201,378 154,689 0District Share of SVCW 2009 Bonds (Net) 959,604 928,782 989,153 1,019,928 985,734District Share of SVCW 2014 Bonds - - 989,284 1,145,509 1,144,324District Share of SVCW 2015 Bonds - - - 106,893 811,950 Total Senior Debt Service 1,158,582 1,129,060 2,179,815 2,427,019 2,942,008 Senior Debt Service Coverage 6.99 8.22 7.78 4.90 4.93 District Share of SRF Loans - 220,077 220,077 220,077 220,077District Share of SVCW Line of Credit - - - - - Total Debt Service 1,158,582 1,349,137 2,399,892 2,647,096 3,162,085 Total Debt Service Coverage 6.99 6.88 7.07 4.49 4.59 Net Revenues Remaining After Debt Service
6,937,872 7,936,502 14,567,780 9,245,407 11,342,339
Cash & Investments June 30 $18,287,782 $24,513,975 $34,996,470 $38,676,749 $46,212,284 Days Operating Cash June 30 644 846 1,149 998 1,233
______________ (1) Net of reserve and interest credits received by the District. (2) Unrestricted cash and investments of the Sewer Enterprise Fund as reported in the District’s Annual Financial Reports. Source: West Bay Sanitary District
C-10
Projected Revenues, Expenses, and Debt Service Coverage Assumptions Related to Revenue
1. The District’s sewer service charges are based on actual revenues received in fiscal year 2016-17 and increase due to adopted and projected rate increases and growth.
2. Interest earnings are projected to remain constant for the foreseeable future.
3. Revenues from the District’s connection fees are estimated at $50,000 per year after 2017-18, although they have been substantially higher during the prior 3 years.
4. Other Revenues are projected at $850,000 per year based on the District’s 2017-18 budget, with slight increases until 2020-21, at which time they are projected to increase in the amount of $680,000 for the payment of debt service on the recycled water project SRF Loan from the Sharon Heights Golf Course.
Assumptions Related to Expenses
1. Operating and maintenance expenses are mostly based on the District’s 2017-18 budget and escalate at the annual rate of 4.0% to account for future operating cost inflation.
2. SVCW wastewater treatment operations are based on the District’s share of allocated costs according to SVCW’s 2017-18 budget with future costs escalating at the annual rate of 3.7%.
3. The District’s share of debt service for SVCW’s capital program are based on updated projections provided by SVCW as shown in Table C8.
4. District sewer system capital improvements are projected at approximately $6.5 million to $9 million most years, and will be funded on a pay‐as‐you‐go basis without the need for debt financing.
5. SVCW pay‐go capital funding is based on SVCW’s 2017-18 budget and assume a constant level of funding in future years, in line with SVCW projections.
6. SVCW CIP reserve contributions are based on SVCW projections shown on Table C8 and are based on the assumption that each of the SVCW member agencies make annual contributions toward their respective share of the SVCW reserve requirement.

C-11
Table C8 West Bay Sanitary District – Cash Flow Projections
2017-18 2018-19 2019-20 2020-21 2021-22 Projected Projected Projected Projected Projected Rate Increase 4% 5% 5% 5% 5% Beginning Fund Reserves $46,212,284 $45,784,093 $43,857,009 $42,611,797 $41,920,462 REVENUES Sewer Service Charges 25,395,641 26,665,423 27,998,694 29,398,629 30,868,560 Connection Fees 500,000 50,000 50,000 50,000 50,000 Investment Earnings 125,000 125,000 125,000 125,000 125,000 Other Revenues (1) 850,000 860,000 870,000 1,560,000 1,570,000 Total Revenues 26,870,641 27,700,423 29,043,694 31,133,629 32,613,560 EXPENSES Operating & Maintenance District Operating Expenses 7,128,473 7,413,607 7,710,151 8,018,557 8,339,299 SVCW Operating Expenses 6,505,267 6,746,738 6,994,231 7,264,832 7,295,228 Total O&M 13,633,740 14,160,345 14,704,382 15,283,389 15,634,527 Net Revenues 13,236,901 13,540,078 14,339,312 15,850,240 16,979,033 Debt Service Senior Debt Service District Share of SVCW 2009 Bonds (Net) 968,196 965,311 656,803 0 0 District Share of SVCW 2014 Bonds 1,144,175 1,144,768 1,144,887 1,145,480 1,145,183 District Share of SVCW 2015 Bonds 826,950 824,050 1,069,500 1,610,500 1,615,125 District Share of SVCW 2018 Bonds - 1,838,480 1,834,713 1,837,713 1,839,213 Projected Recycled Water SRF Loan (2) - - - 680,000 680,000 District Share of Future SVCW Bonds(3) - - 1,234,928 2,788,481 4,454,819 Total Senior Debt Service 2,939,322 4,772,609 5,940,830 8,062,173 9,734,340 Senior Debt Service Coverage 4.50 2.84 2.41 1.97 1.74 Subordinate Debt Service District Share of Existing SRF Loans 726,843 726,843 1,136,457 1,136,457 1,136,457 District Share of SVCW Line of Credit(4) 22,929 66,064 132,128 - - Total Subordinate Debt Service 749,772 792,907 1,268,585 1,136,457 1,136,457 Total Combined Debt Service 3,689,094 5,565,516 7,209,415 9,198,629 10,870,796 Total Debt Service Coverage 3.59 2.43 1.99 1.72 1.56 Capital & Other Non-Operating District Capital Improvements 9,292,652 9,210,000 7,675,000 6,500,000 6,600,000 SVCW Pay-Go Capital Funding 414,946 423,245 431,710 440,344 449,151 SVCW Reserve Contributions 268,400 268,400 268,400 402,600 536,800 Subtotal 9,975,998 9,901,645 8,375,110 7,342,944 7,585,951 Total Expenses 27,298,832 29,627,507 30,288,907 31,824,963 34,091,275 Revenues Less Expenses (428,191) (1,927,084) (1,245,213) (691,334) (1,477,715) Ending Fund Reserve $45,784,093 $43,857,009 $42,611,797 $41,920,462 $40,442,748 Days Cash on Hand 1,226 1,130 1,058 1,001 944 (1) Fiscal Year 2021 and 2021 include projected reimbursements from Sharon Heights Golf Course in the amount of $680,000 for the
payment of debt service on the recycled water project SRF Loan. (2) Reflects projected debt service amounts on an SRF Loan for the District's recycled water project expected to be completed in July,
2019. (3) Includes the District's share of ~$13 million CIP funding that is anticipated to be drawn on the line of credit and subsequently taken
out with fixed rate bonds. (4) Reflects the District’s estimated share of the interest expense on the line of credit draw in FY 2018 and full interest expense on
the anticipated ~$13 million draw on the line of credit in FY 2019 and 2020. Source: West Bay Sanitary District
C-12
Absence of Litigation The District is not aware of any action, suit, or proceeding known to be pending or
threatened, that would affect the execution of the District’s Financing Agreement with the Authority, or materially impact the District’s finances.
Financial Statements
The District’s financial statements for the fiscal year ending June 30, 2017 are attached as
Appendix L. The District’s financial statements were audited by Chavan & Associates, LLP. The auditor has not been asked to consent to the inclusion of the District’s audited financial statements in this Official Statement and has not reviewed this Official Statement.

D-1
APPENDIX D
GENERAL DEMOGRAPHIC AND STATISTICAL INFORMATION ABOUT THE COUNTY OF SAN MATEO
General Information
City of Redwood City. The City of Redwood City (“Redwood City”), the County seat, is located in the San Francisco Bay Area 25 miles south of San Francisco. It is the oldest bayside city in the County of San Mateo (the “County”), incorporated in 1867. Redwood City combines residential, industrial, and commercial elements in a largely urban environment. Its waterfront provides a yacht harbor and the only deep-water port in the South Bay. A wide variety of housing types are available. Services and trade, the County’s two largest industry divisions, are expected to provide close to two-thirds of anticipated growth in the next two years. Today the Redwood City is known as the home of several technology companies such as Oracle and Electronic Arts.
City of San Carlos. The City of San Carlos (“San Carlos”) is located in the County,
approximately 25 miles south of San Francisco, and encompasses an area of approximately 4.5 square miles. San Carlos was incorporated in 1925 and is a general law city pursuant to the California Government Code. San Carlos has a Council-Manager form of government, with five elected Council members served by a full-time City Manager and staff. The City Council consists of a Mayor and four other Councilmembers. The Mayor is selected from among the sitting Councilmembers and serves a one-year term. Councilmembers are elected at-large for staggered four-year terms. The City Treasurer is also an elected position. The City Clerk is appointed by the City Manager.
San Mateo County. The City of Belmont, Redwood City, San Carlos, and the West Bay Sanitary District (the “Members”) are all located within the County. The County was established April 19, 1856 and encompasses roughly 741 square miles including most of the San Francisco Peninsula south of the City and County of San Francisco. The County shares its southern borders with Santa Clara County and Santa Cruz County. San Francisco International Airport is located at the northern end of the County, and Silicon Valley stretches into the southeastern end. San Mateo County ranks as the 14th most populous county in California with a January 1, 2017 population of approximately 770,203 as estimated by the California State Department of Finance. The County includes 20 incorporated cities and 17 unincorporated communities.

D-2
Population The largest cities in the County are the cities of Daly City, Redwood City, and South San
Francisco. The following table sets forth annual population figures, as of January 1, for the County and the State of California (the “State”), for each of the years listed.
SAN MATEO COUNTY AND STATE OF CALIFORNIA Population Estimates
Calendar Years 2013 through 2017
2013 2014 2015 2016 2017SAN MATEO COUNTY
Atherton 7,056 7,064 7,085 7,107 7,148 Belmont 27,047 27,243 27,459 27,608 27,594 Brisbane 4,452 4,491 4,599 4,690 4,722 Burlingame 29,479 29,588 29,724 29,916 30,148 Colma 1,482 1,490 1,499 1,505 1,506 Daly City 105,730 107,225 107,983 108,538 109,287 East Palo Alto 29,602 29,824 30,072 30,225 30,340 Foster City 31,751 32,726 32,947 33,068 33,225 Half Moon Bay 11,729 11,826 12,146 12,530 12,591 Hillsborough 11,300 11,409 11,565 11,663 11,753 Menlo Park 33,200 33,309 33,671 33,807 35,670 Millbrae 22,674 22,786 23,056 23,148 23,168 Pacifica 37,781 37,901 38,036 38,192 38,124 Portola Valley 4,587 4,613 4,667 4,703 4,707 Redwood City 81,076 82,629 83,757 85,402 85,601 San Bruno 43,606 43,872 45,059 45,230 45,295 San Carlos 28,876 29,002 29,145 29,262 29,311 San Mateo 99,807 100,420 101,568 102,977 103,426 South San Francisco 64,612 64,781 65,022 65,378 65,451 Woodside 5,531 5,570 5,610 5,652 5,666 Balance of County 64,261 64,586 64,939 65,294 65,470 Incorporated 681,378 687,769 694,670 700,601 704,733
San Mateo County Total 745,639 752,355 759,609 765,895 770,203 STATE OF CALIFORNIA 38,238,492 38,572,211 38,915,880 39,189,035 39,523,613
Source: California State Department of Finance.
[Remainder of page intentionally left blank]
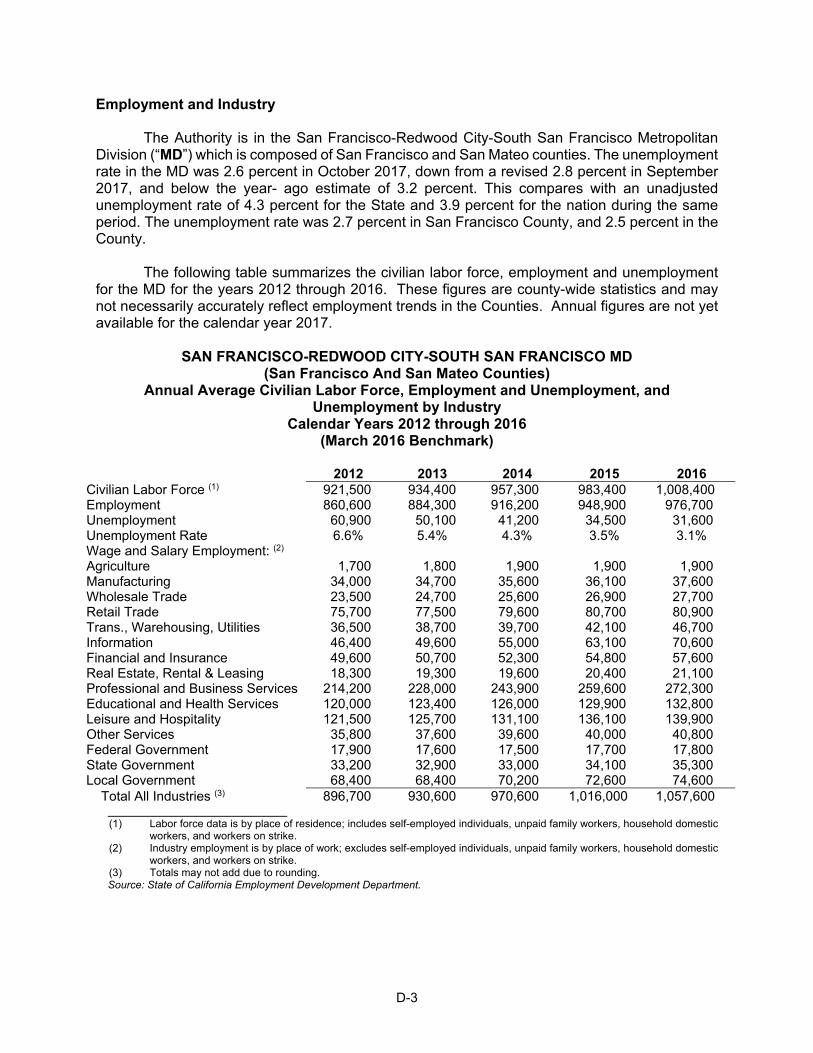
D-3
Employment and Industry The Authority is in the San Francisco-Redwood City-South San Francisco Metropolitan
Division (“MD”) which is composed of San Francisco and San Mateo counties. The unemployment rate in the MD was 2.6 percent in October 2017, down from a revised 2.8 percent in September 2017, and below the year- ago estimate of 3.2 percent. This compares with an unadjusted unemployment rate of 4.3 percent for the State and 3.9 percent for the nation during the same period. The unemployment rate was 2.7 percent in San Francisco County, and 2.5 percent in the County.
The following table summarizes the civilian labor force, employment and unemployment
for the MD for the years 2012 through 2016. These figures are county-wide statistics and may not necessarily accurately reflect employment trends in the Counties. Annual figures are not yet available for the calendar year 2017.
SAN FRANCISCO-REDWOOD CITY-SOUTH SAN FRANCISCO MD
(San Francisco And San Mateo Counties) Annual Average Civilian Labor Force, Employment and Unemployment, and
Unemployment by Industry Calendar Years 2012 through 2016
(March 2016 Benchmark)
2012 2013 2014 2015 2016 Civilian Labor Force (1) 921,500 934,400 957,300 983,400 1,008,400 Employment 860,600 884,300 916,200 948,900 976,700 Unemployment 60,900 50,100 41,200 34,500 31,600 Unemployment Rate 6.6% 5.4% 4.3% 3.5% 3.1% Wage and Salary Employment: (2) Agriculture 1,700 1,800 1,900 1,900 1,900 Manufacturing 34,000 34,700 35,600 36,100 37,600 Wholesale Trade 23,500 24,700 25,600 26,900 27,700 Retail Trade 75,700 77,500 79,600 80,700 80,900 Trans., Warehousing, Utilities 36,500 38,700 39,700 42,100 46,700 Information 46,400 49,600 55,000 63,100 70,600 Financial and Insurance 49,600 50,700 52,300 54,800 57,600 Real Estate, Rental & Leasing 18,300 19,300 19,600 20,400 21,100 Professional and Business Services 214,200 228,000 243,900 259,600 272,300 Educational and Health Services 120,000 123,400 126,000 129,900 132,800 Leisure and Hospitality 121,500 125,700 131,100 136,100 139,900 Other Services 35,800 37,600 39,600 40,000 40,800 Federal Government 17,900 17,600 17,500 17,700 17,800 State Government 33,200 32,900 33,000 34,100 35,300 Local Government 68,400 68,400 70,200 72,600 74,600 Total All Industries (3) 896,700 930,600 970,600 1,016,000 1,057,600
(1) Labor force data is by place of residence; includes self-employed individuals, unpaid family workers, household domestic
workers, and workers on strike. (2) Industry employment is by place of work; excludes self-employed individuals, unpaid family workers, household domestic
workers, and workers on strike. (3) Totals may not add due to rounding. Source: State of California Employment Development Department.
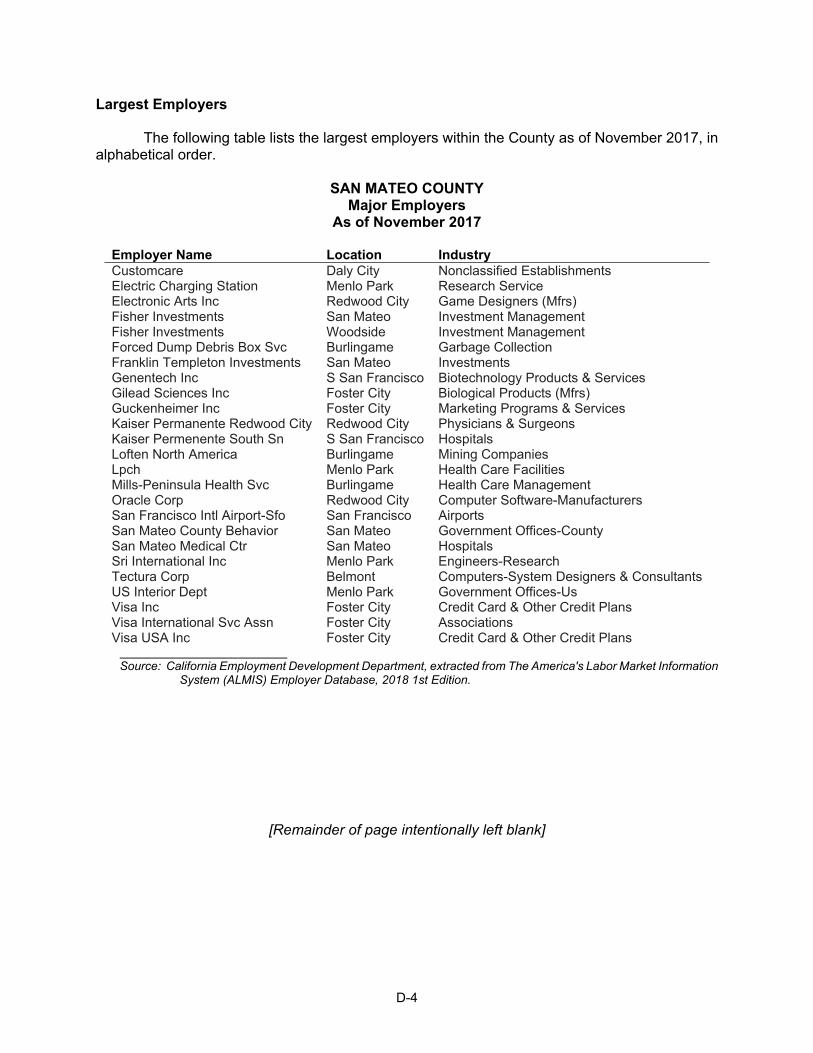
D-4
Largest Employers The following table lists the largest employers within the County as of November 2017, in
alphabetical order.
SAN MATEO COUNTY Major Employers
As of November 2017
Employer Name Location Industry Customcare Daly City Nonclassified Establishments Electric Charging Station Menlo Park Research Service Electronic Arts Inc Redwood City Game Designers (Mfrs) Fisher Investments San Mateo Investment Management Fisher Investments Woodside Investment Management Forced Dump Debris Box Svc Burlingame Garbage Collection Franklin Templeton Investments San Mateo Investments Genentech Inc S San Francisco Biotechnology Products & Services Gilead Sciences Inc Foster City Biological Products (Mfrs) Guckenheimer Inc Foster City Marketing Programs & Services Kaiser Permanente Redwood City Redwood City Physicians & Surgeons Kaiser Permenente South Sn S San Francisco Hospitals Loften North America Burlingame Mining Companies Lpch Menlo Park Health Care Facilities Mills-Peninsula Health Svc Burlingame Health Care Management Oracle Corp Redwood City Computer Software-Manufacturers San Francisco Intl Airport-Sfo San Francisco Airports San Mateo County Behavior San Mateo Government Offices-County San Mateo Medical Ctr San Mateo Hospitals Sri International Inc Menlo Park Engineers-Research Tectura Corp Belmont Computers-System Designers & ConsultantsUS Interior Dept Menlo Park Government Offices-Us Visa Inc Foster City Credit Card & Other Credit Plans Visa International Svc Assn Foster City Associations Visa USA Inc Foster City Credit Card & Other Credit Plans
Source: California Employment Development Department, extracted from The America's Labor Market Information
System (ALMIS) Employer Database, 2018 1st Edition.
[Remainder of page intentionally left blank]

D-5
Effective Buying Income “Effective Buying Income” is defined as personal income less personal tax and non-tax
payments, a number often referred to as “disposable” or “after-tax” income. Personal income is the aggregate of wages and salaries, other labor-related income (such as employer contributions to private pension funds), proprietor’s income, rental income (which includes imputed rental income of owner-occupants of non-farm dwellings), dividends paid by corporations, interest income from all sources, and transfer payments (such as pensions and welfare assistance). Deducted from this total are personal taxes (federal, state and local), non-tax payments (fines, fees, penalties, etc.) and personal contributions to social insurance. According to U.S. government definitions, the resultant figure is commonly known as “disposable personal income.”
The following table summarizes the total effective buying income for Redwood City, San
Carlos, the County, the State and the United States for the period 2012 through 2016. Effective Buying Income data is not yet available for the calendar year 2017.
CITY OF REDWOOD CITY, CITY OF SAN CARLOS
AND SAN MATEO COUNTY Effective Buying Income - As of January 1, 2012 through 2016
Year
Area
Total Effective Buying Income (000s Omitted)
Median Household Effective
Buying Income 2012 City of Redwood City $2,693,878 $62,528 City of San Carlos 1,510,000 85,698 San Mateo County 26,570,648 68,429 California 864,088,828 47,307 United States 6,737,867,730 41,358 2013 City of Redwood City $2,802,145 $65,351 City of San Carlos 1,549,938 91,864 San Mateo County 26,846,688 70,427 California 858,676,636 48,340 United States 6,982,757,379 43,715 2014 City of Redwood City $2,893,518 $66,809 City of San Carlos 1,631,885 92,952 San Mateo County 28,257,708 72,165 California 901,189,699 50,072 United States 7,357,153,421 45,448 2015 City of Redwood City $3,175,728 $72,095 City of San Carlos 1,630,065 95,776 San Mateo County 30,989,833 77,717 California 981,231,666 53,589 United States 7,757,960,399 46,738 2016 City of Redwood City 3,484,968 75,359 City of San Carlos 1,844,215 102,803 San Mateo County 33,690,067 81,795 California 1,036,142,723 55,681 United States 8,132,748,136 48,043
Source: The Nielsen Company (US), Inc.
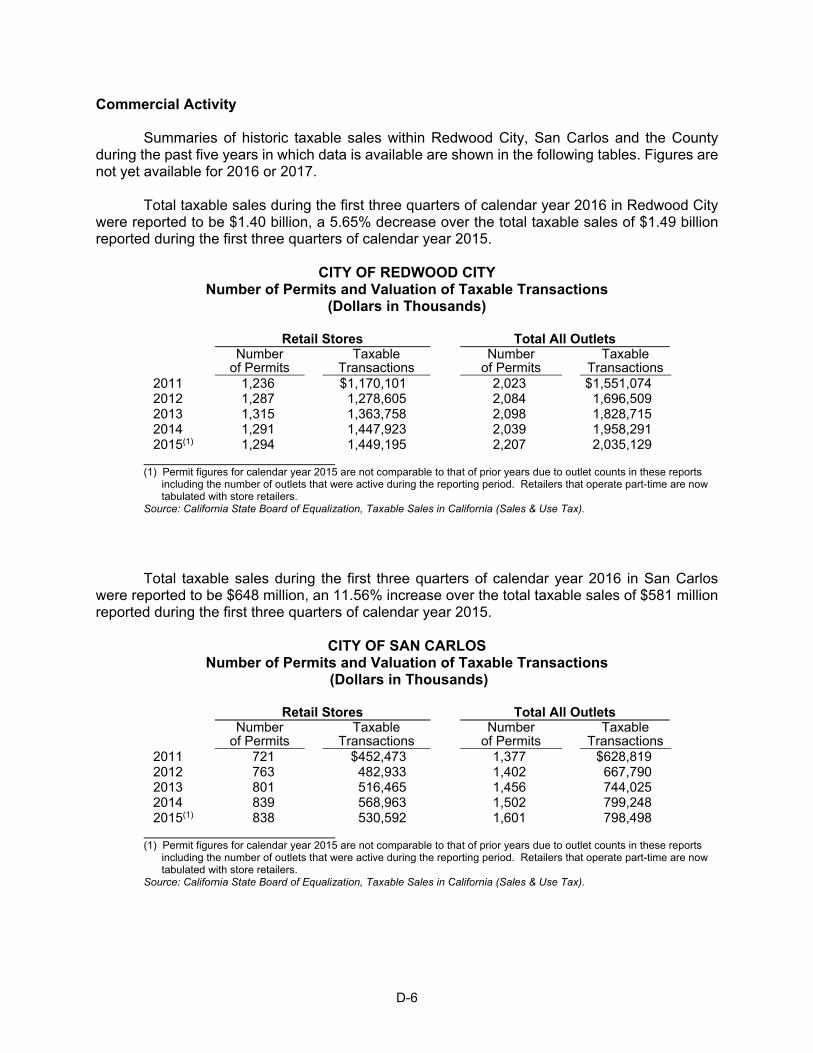
D-6
Commercial Activity Summaries of historic taxable sales within Redwood City, San Carlos and the County
during the past five years in which data is available are shown in the following tables. Figures are not yet available for 2016 or 2017.
Total taxable sales during the first three quarters of calendar year 2016 in Redwood City
were reported to be $1.40 billion, a 5.65% decrease over the total taxable sales of $1.49 billion reported during the first three quarters of calendar year 2015.
CITY OF REDWOOD CITY
Number of Permits and Valuation of Taxable Transactions (Dollars in Thousands)
Retail Stores Total All Outlets
Number of Permits
TaxableTransactions
Numberof Permits
Taxable Transactions
2011 1,236 $1,170,101 2,023 $1,551,074 2012 1,287 1,278,605 2,084 1,696,509 2013 1,315 1,363,758 2,098 1,828,715 2014 1,291 1,447,923 2,039 1,958,291 2015(1) 1,294 1,449,195 2,207 2,035,129
(1) Permit figures for calendar year 2015 are not comparable to that of prior years due to outlet counts in these reports
including the number of outlets that were active during the reporting period. Retailers that operate part-time are now tabulated with store retailers.
Source: California State Board of Equalization, Taxable Sales in California (Sales & Use Tax). Total taxable sales during the first three quarters of calendar year 2016 in San Carlos
were reported to be $648 million, an 11.56% increase over the total taxable sales of $581 million reported during the first three quarters of calendar year 2015.
CITY OF SAN CARLOS
Number of Permits and Valuation of Taxable Transactions (Dollars in Thousands)
Retail Stores Total All Outlets
Number of Permits
TaxableTransactions
Numberof Permits
Taxable Transactions
2011 721 $452,473 1,377 $628,819 2012 763 482,933 1,402 667,790 2013 801 516,465 1,456 744,025 2014 839 568,963 1,502 799,248 2015(1) 838 530,592 1,601 798,498
(1) Permit figures for calendar year 2015 are not comparable to that of prior years due to outlet counts in these reports
including the number of outlets that were active during the reporting period. Retailers that operate part-time are now tabulated with store retailers.
Source: California State Board of Equalization, Taxable Sales in California (Sales & Use Tax).

D-7
Total taxable sales during the first three quarters of calendar year 2016 in the County were reported to be $11.43 billion, a 1.06% increase over the total taxable sales of $11.31 billion reported during the first quarter of calendar year 2015.
SAN MATEO COUNTY
Number of Permits and Valuation of Taxable Transactions (Dollars in Thousands)
Retail and Food Services Stores Total All Outlets Number
of Permits Taxable
Transactions Number
of Permits Taxable
Transactions 2011 11,470 $8,536,043 18,995 $13,020,643 2012 11,748 9,277,144 19,189 13,906,978 2013 12,438 9,935,641 19,808 14,611,618 2014 12,673 10,278,717 19,999 15,298,434 2015(1) 12,744 10,301,197 21,581 15,478,010
(1) Permit figures for calendar year 2015 are not comparable to that of prior years due to outlet counts in these reports
including the number of outlets that were active during the reporting period. Retailers that operate part-time are now tabulated with store retailers.
Source: California State Board of Equalization, Taxable Sales in California (Sales & Use Tax).
[Remainder of page intentionally left blank]

D-8
Construction and Building Activity Provided below are the building permits and valuations for Redwood City, San Carlos and
the County for calendar years 2012 through 2016. Annual figures are not yet available for calendar year 2017.
CITY OF REDWOOD CITY
Total Building Permit Valuations (Valuations in thousands)
2012 2013 2014 2015 2016
Permit Valuation New Single-Family $35,516.6 $3,399.2 $6,400.3 $13,130.4 $10,361.1 New Multi-Family 103,125.6 57,869.2 83,820.0 16,463.2 76,854.5 Res. Alterations/Additions 10,362.8 28,261.4 26,301.6 27,133.5 35,949.0 Total Residential 149,005.0 89,529.8 116,521.9 56,727.1 123,164.6 New Commercial 3,351.5 26,843.9 9,107.1 21,836.4 109,558.0 New Industrial 382.0 619.2 7,000.0 0.0 0.0 New Other 17.6 905.5 18,994.3 10,949.0 6,807.2 Com. Alterations/Additions 16,037.5 47,256.7 63,598.1 87,473.2 117,348.5 Total Nonresidential 19,788.6 75,625.3 98,699.5 120,258.6 233,713.7 New Dwelling Units Single-Family 60 8 15 17 19 Multiple Family 267 395 749 135 587 Total 327 403 764 152 606 Source: Construction Industry Research Board, Building Permit Summary.
CITY OF SAN CARLOS Total Building Permit Valuations
(Valuations in thousands)
2012 2013 2014 2015 2016 Permit Valuation New Single-Family $2,006.7 $14,222.9 $4,856.9 $17,837.6 $19,015.2 New Multi-Family 585.0 2,620.2 0.0 2,935.3 59,445.0 Res. Alterations/Additions 21,177.2 25,237.4 25,289.6 32,146.8 28,948.4 Total Residential 23,768.9 42,080.5 30,146.5 52,919.7 107,408.6 New Commercial 964.3 1,860.3 1,398.0 2,239.5 59,255.2 New Industrial 45.0 15,100.0 0.0 0.0 0.0 New Other 0.0 797.0 1,352.6 3,047.5 4,854.6 Com. Alterations/Additions 7,873.9 41,144.5 26,317.1 29,395.2 4,625.9 Total Nonresidential 8,883.2 58,901.8 29,067.7 34,682.2 68,735.7 New Dwelling Units Single-Family 3 22 9 24 24 Multiple Family 2 8 0 11 256 Total 5 30 9 35 380 Source: Construction Industry Research Board, Building Permit Summary.
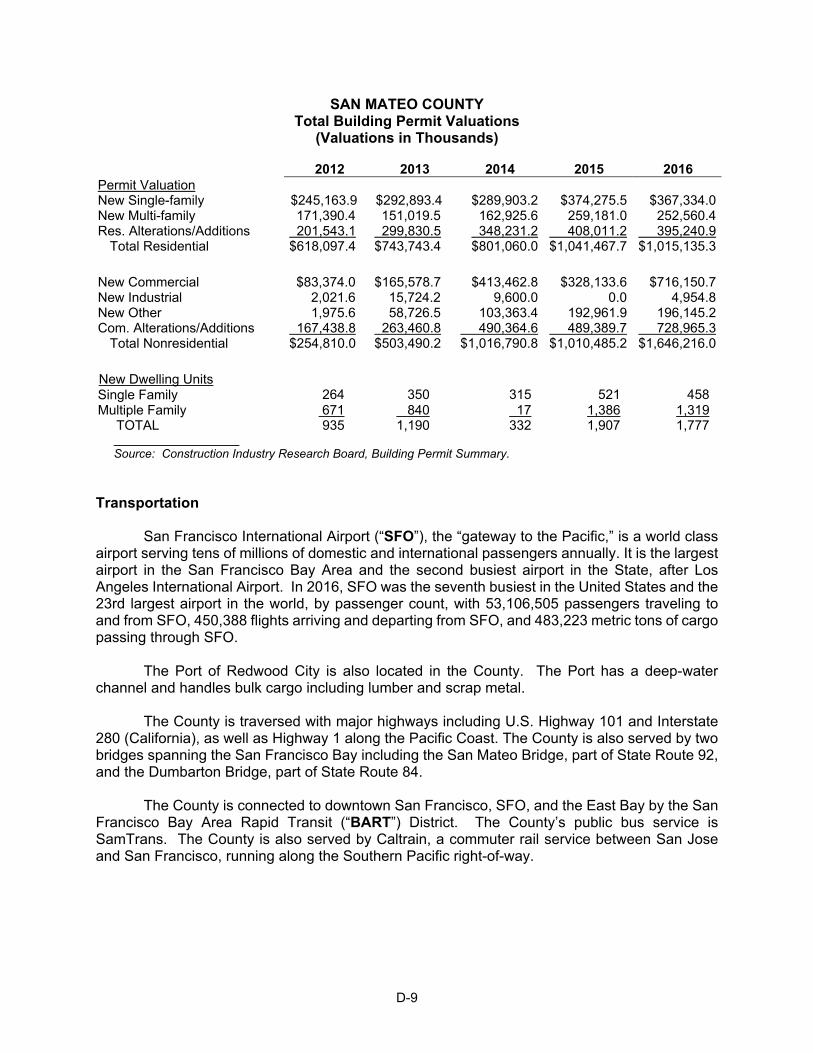
D-9
SAN MATEO COUNTY Total Building Permit Valuations
(Valuations in Thousands)
2012 2013 2014 2015 2016 Permit Valuation New Single-family $245,163.9 $292,893.4 $289,903.2 $374,275.5 $367,334.0New Multi-family 171,390.4 151,019.5 162,925.6 259,181.0 252,560.4Res. Alterations/Additions 201,543.1 299,830.5 348,231.2 408,011.2 395,240.9
Total Residential $618,097.4 $743,743.4 $801,060.0 $1,041,467.7 $1,015,135.3
New Commercial $83,374.0 $165,578.7 $413,462.8 $328,133.6 $716,150.7New Industrial 2,021.6 15,724.2 9,600.0 0.0 4,954.8New Other 1,975.6 58,726.5 103,363.4 192,961.9 196,145.2Com. Alterations/Additions 167,438.8 263,460.8 490,364.6 489,389.7 728,965.3
Total Nonresidential $254,810.0 $503,490.2 $1,016,790.8 $1,010,485.2 $1,646,216.0
New Dwelling Units Single Family 264 350 315 521 458 Multiple Family 671 840 17 1,386 1,319 TOTAL 935 1,190 332 1,907 1,777
Source: Construction Industry Research Board, Building Permit Summary.
Transportation San Francisco International Airport (“SFO”), the “gateway to the Pacific,” is a world class
airport serving tens of millions of domestic and international passengers annually. It is the largest airport in the San Francisco Bay Area and the second busiest airport in the State, after Los Angeles International Airport. In 2016, SFO was the seventh busiest in the United States and the 23rd largest airport in the world, by passenger count, with 53,106,505 passengers traveling to and from SFO, 450,388 flights arriving and departing from SFO, and 483,223 metric tons of cargo passing through SFO.
The Port of Redwood City is also located in the County. The Port has a deep-water
channel and handles bulk cargo including lumber and scrap metal. The County is traversed with major highways including U.S. Highway 101 and Interstate
280 (California), as well as Highway 1 along the Pacific Coast. The County is also served by two bridges spanning the San Francisco Bay including the San Mateo Bridge, part of State Route 92, and the Dumbarton Bridge, part of State Route 84.
The County is connected to downtown San Francisco, SFO, and the East Bay by the San
Francisco Bay Area Rapid Transit (“BART”) District. The County’s public bus service is SamTrans. The County is also served by Caltrain, a commuter rail service between San Jose and San Francisco, running along the Southern Pacific right-of-way.

[THIS PAGE INTENTIONALLY LEFT BLANK]
E-1
APPENDIX E
SUMMARY OF PRINCIPAL LEGAL DOCUMENTS The following is a brief summary of the provisions of the Indenture of Trust under which
the Bonds are issued, and a summary of the Financing Agreements between the Authority and each of the Participating Members. Such summaries are not intended to be definitive. Reference is made to the actual documents (copies of which are available from the Authority) for the complete terms thereof.
DEFINITIONS
The following terms have the following meanings, notwithstanding that any such terms
may be elsewhere defined in this Official Statement. Any terms not expressly defined in this Summary but previously defined in this Official Statement have the respective meanings previously given.
“Authority” means Silicon Valley Clean Water, a joint powers authority duly organized and
existing under the Joint Exercise of Powers Agreement dated as of November 13, 1975, as amended, among the cites of Belmont, Redwood City and San Carlos and the West Bay Sanitary District, and under the laws of the State of California.
“Bond Counsel” means (a) Jones Hall, A Professional Law Corporation, or (b) any other
attorney or firm of attorneys appointed by or acceptable to the Authority of nationally-recognized experience in the issuance of obligations the interest on which is excludable from gross income for federal income tax purposes under the Tax Code.
“Bond Year” means each twelve-month period extending from August 2 in one calendar
year to August 1 of the succeeding calendar year, both dates inclusive; except that the first Bond Year begins on the Closing Date and ends on August 1, 2018.
“Business Day” means a day of the year, other than a Saturday or Sunday, on which banks
are not closed in the city in which the Trust Office of the Trustee is located. “Closing Date” means the date of original delivery of the Bonds to the original purchaser
thereof. “Costs of Issuance” means all items of expense directly or indirectly payable by or
reimbursable to the Authority relating to the authorization, issuance, sale and delivery of the Bonds, including but not limited to: printing expenses; rating agency fees; filing and recording fees; initial fees, expenses and charges of the Trustee and its counsel, including the Trustee’s first annual administrative fee; fees, charges and disbursements of attorneys, financial advisors, accounting firms, consultants and other professionals; fees and charges for preparation, execution and safekeeping of the Bonds; and any other cost, charge or fee in connection with the original issuance of the Bonds.
“Event of Default” means an event of default under and as defined in the Indenture, which
events are summarized below. “Federal Securities” means: (a) any direct general obligations of the United States of
America (including obligations issued or held in book entry form on the books of the Department

E-2
of the Treasury of the United States of America), the payment of principal of and interest on which are unconditionally and fully guaranteed by the United States of America; and (b) obligations of any agency, department or instrumentality of the United States of America the timely payment of principal of and interest on which are fully guaranteed by the United States of America.
“Fiscal Year” means any twelve-month period extending from July 1 in one calendar year
to June 30 of the succeeding calendar year, both dates inclusive, or any other twelve-month period selected and designated by the Authority as its official fiscal year period.
“Financing Agreements” means, collectively, the following, in each case as originally
executed and delivered together with all duly authorized and executed amendments or supplements thereto:
(a) Financing Agreement dated as of December 1, 2008, between the Authority
and the City of Redwood City, as amended by that certain First Amendment to Financing Agreement dated as of March 20, 2014, between the Authority and the City of Redwood City;
(b) Financing Agreement dated as of February 1, 2018, between the Authority
and the City of San Carlos; and (c) Financing Agreement dated as of December 1, 2008, between the Authority
and the West Bay Sanitary District, as amended by that certain First Amendment to Financing Agreement dated as of March 20, 2014, between the Authority and the West Bay Sanitary District.
“Owner”, when used with respect to any Bond, means the person in whose name the
ownership of such Bond will be registered on the Registration Books. “Participating Members” means the City of Redwood City, the City of San Carlos and the
West Bay Sanitary District, and any successors thereto. “Permitted Investments” means any of the following which at the time of investment are
legal investments under the laws of the State of California for the moneys proposed to be invested therein (provided that the Trustee shall be entitled to rely upon any investment directions from the Authority as conclusive certification to the Trustee that the investments described therein are so authorized under the laws of the State of California):
(a) Federal Securities; (b) Bonds, debentures, notes or other evidence of indebtedness issued or
guaranteed by any of the following non-full faith and credit U.S. government agencies (stripped securities only as stripped by the agency itself): (i) senior debt obligations of the Federal Home Loan Bank System; (ii) participation certificates and senior debt obligations of the Federal Home Loan Mortgage Corporation; (iii) mortgaged-backed securities and senior debt obligations of the Federal National Mortgage Association; and (iv) consolidated system-wide bonds and notes of the Farm Credit System.
(c) Money market funds registered under the Federal Investment Company Act
of 1940, whose shares are registered under the Federal Securities Act of

E-3
1933, and having a rating by S&P of at least AAm-G or AAm, including such funds for which the Trustee, its affiliates or subsidiaries provide investment advisory or other management services or for which the Trustee or an affiliate of the Trustee serves as investment administrator, shareholder servicing agent, and/or custodian or subcustodian, notwithstanding that (i) the Trustee or an affiliate of the Trustee receives fees from funds for services rendered, (ii) the Trustee collects fees for services rendered pursuant to the Indenture, which fees are separate from the fees received from such funds, and (iii) services performed for such funds and pursuant to the Indenture may at times duplicate those provided to such funds by the Trustee or an affiliate of the Trustee.
(e) Certificates of deposit (including those of the Trustee, its parent and its
affiliates) which have a maturity not greater than one year from the date of investment and which are issued by commercial banks, savings and loan associations or mutual savings banks whose short-term obligations are rated “A-1+” or better by S&P.
(f) Certificates of deposit, savings accounts, deposit accounts or money market
deposits (including those of the Trustee and its affiliates) which are fully insured by the Federal Deposit Insurance Corporation, issued by banks having reported capital and surplus of at least $15 million.
(h) Commercial paper having original maturities of not more than 270 days, rated
“A-1+” or better by S&P at the time of purchase. (i) Direct general obligations of any state of the United States of America or any
subdivision or agency thereof to which is pledged the full faith and credit of a state the unsecured general obligation debt of which is rated at least “A-” by S&P, or any obligation fully and unconditionally guaranteed by any state, subdivision or agency whose unsecured obligation debt is so rated.
(j) Direct general short-term obligations of any state or state agency or
subdivision or agency thereof described in paragraph (i) above and rated at least “A-1+” by S&P.
(k) Federal funds or bankers acceptances with a maximum term of one year of
any bank which an unsecured, uninsured and unguaranteed obligation rating of at least “A-1+” by S&P.
(l) Any investment agreement (including guaranteed investment contracts,
forward delivery agreements, repurchase agreements or similar obligations) with, or guaranteed by, an entity the long-term unsecured obligations or the claims paying ability of which are rated A or better by a nationally recognized rating agency (without regard to gradations or modifiers within such category) at the time of initial investment.
(m) Shares in a California common law trust established pursuant to Title 1,
Division 7, Chapter 5 of the Government Code of the State of California which invests exclusively in investments permitted by Section 53601 of Title 5,
E-4
Division 2, Chapter 4 of the Government Code of California, as it may be amended.
(n) The Local Agency Investment Fund which is administered by the California
Treasurer for the investment of funds belonging to local agencies within the State of California, provided for investment of funds held by the Trustee, the Trustee is entitled to make investments and withdrawals in its own name as Trustee.
“Project” means the improvements to the wastewater collection, treatment and disposal
system of the Authority which are acquired and constructed from amounts held in the Project Fund.
“Project Costs” means, with respect to the Project, all costs of the acquisition, construction
and installation thereof which are paid from moneys on deposit in the Project Fund, including but not limited to:
(a) all costs required to be paid to any person under the terms of any agreement
for or relating to the acquisition, construction and installation of the Project; (b) obligations incurred for labor and materials in connection with the acquisition,
construction and installation of the Project; (c) the cost of performance or other bonds and any and all types of insurance
that may be necessary or appropriate to have in effect in connection with the acquisition, construction and installation of the Project;
(d) all costs of engineering and architectural services, including the actual out-
of-pocket costs for test borings, surveys, estimates, plans and specifications and preliminary investigations therefor, development fees, sales commissions, and for supervising construction, as well as for the performance of all other duties required by or consequent to the proper acquisition, construction and installation of the Project;
(e) any sums required to reimburse the Authority for advances made for any of
the above items or for any other costs incurred and for work done which are properly chargeable to the acquisition, construction and installation of the Project;
(f) all Costs of Issuance and other financing costs incurred in connection with
the acquisition, construction and installation of the Project; and (g) interest on the Bonds coming due during the period of acquisition,
construction and installation of the Project. “Registration Books” means the records maintained by the Trustee under the Indenture
for the registration and transfer of ownership of the Bonds. “Revenues” means: (a) all amounts payable by the Participating Members under the
respective Financing Agreements, representing the portion of debt service on the Bonds which is allocable to each Participating Member; (b) any proceeds of the Bonds originally deposited with

E-5
the Trustee and all moneys deposited and held from time to time by the Trustee in the funds and accounts established under the Indenture; and (c) income and gains with respect to the investment of amounts on deposit in the funds and accounts established under the Indenture . The term “Revenues” does not include amounts payable by the Participating Members under the Financing Agreements with respect to any bonds, notes or other obligations of the Authority other than the Bonds.
“S&P” means Standard & Poor’s Ratings Services, its successors and assigns. “Tax Code” means the Internal Revenue Code of 1986, as amended. Any reference to a
provision of the Tax Code will include the applicable temporary and permanent regulations promulgated under or with respect to Section 103 and Sections 141 through 150, inclusive, of the Tax Code.
“Written Certificate”, “Written Request” or “Written Requisition” mean, respectively, a
certificate, request or requisition in writing signed by the General Manager of the Authority, or by any other officer of the Authority duly authorized by the Commission of the Authority for that purpose, written notice of which authorization is given to the Trustee.
Application of Bond Proceeds
Deposit of Proceeds on Closing Date. Upon the receipt of payment for the Bonds on the Closing Date, the Trustee shall apply the proceeds of sale thereof as follows:
(a) The Trustee will deposit an amount in the Costs of Issuance Fund which is
sufficient to pay the Costs of Issuance of the Bonds. (b) The Trustee will deposit the remainder of such proceeds in the Project Fund. Costs of Issuance Fund. The Trustee will establish and hold in trust a separate fund
designated as the “Costs of Issuance Fund” into which the Trustee. The Trustee will disburse amounts in the Costs of Issuance Fund from time to time to pay the Costs of Issuance upon submission of a Written Requisition of the Authority. On April 1, 2018, or upon the earlier Written Request of the Authority, the Trustee shall transfer all amounts remaining in the Costs of Issuance Fund to the Project Fund, and shall thereupon close the Costs of Issuance Fund.
Project Fund. The Trustee will establish and maintain a separate fund to be known as the
“Project Fund”. Amounts on deposit in the Project Fund shall be applied to pay Project Costs for Projects which are of benefit to all of the members of the Authority. The Trustee will disburse moneys in the Project Fund from time to time to pay Project Costs (or to reimburse the Authority for payment of Project Costs) in accordance with Written Requisitions filed by the Authority with the Trustee.
Each such Written Requisition must state, with respect to each payment to be made
thereby, (i) the name and address of the firm or corporation to whom payment is to be made, (ii) the amount and purpose of the payment, (iii) that each payment constitutes a Project Cost, and (iv) that each payment from a particular account is for a Project the Project Costs of which are of benefit to all of the members of the Authority. Each such Written Requisition shall be sufficient evidence to the Trustee of the facts stated therein and the Trustee shall have no duty to confirm the accuracy of such facts and has no responsibility for payments made in accordance with the
E-6
foregoing provisions. The Authority shall maintain accurate records showing all disbursements from the Project Fund.
Upon the filing with the Trustee of a Written Certificate of the Authority stating that no
further amounts are intended to be requisitioned from the Project Fund, the Trustee shall thereupon close the Project Fund and shall transfer all remaining amounts therein to the Interest Account or, at the election of the Authority, be applied to redeem or defease Outstanding Bonds.
Security for the Bonds
The Bonds are secured by a first lien on, pledge of and security interest in all of the Revenues, including all of the moneys in the Revenue Fund, the Interest Account and the Principal Account, and including all amounts derived from the investment of such moneys, without priority for number, date of Bonds, date of execution or date of delivery. The Authority transfers in trust and assigns to the Trustee, for the benefit of the Owners from time to time of the Bonds, all of the Revenues and all of the right, title and interest of the Authority in the Financing Agreements.
For the security of the Bonds, the Authority grants a first pledge of and lien on, and a
security interest in, all of the Revenues and all of the right, title and interest of the Authority in the Financing Agreements. Such pledge, lien and security interest are for the equal security of the Bonds without preference or priority for number, date of execution or date of delivery.
The Trustee is entitled to receive all of the Revenues, and any Revenues collected or
received by the Authority will be deemed to be held, and to have been collected or received, by the Authority as the agent of the Trustee and will forthwith be paid by the Authority to the Trustee. The Trustee will also be entitled to and, subject to the provisions of the Indenture, will take all steps, actions and proceedings reasonably necessary in its judgment to enforce, either jointly with the Authority or separately, all of the rights of the Authority and all of the obligations of the Participating Members under the Financing Agreements.
Deposit and Application of Revenues
All Revenues described in clause (a) of the definition thereof will be promptly deposited by the Trustee upon receipt thereof in a special fund designated as the “Revenue Fund” which the Trustee will establish, maintain and hold in trust.
The Trustee will transfer from the Revenue Fund and deposit into the following respective
accounts (each of which the Trustee will establish and maintain within the Revenue Fund), the following amounts at the following times in the following order of priority, the requirements of each such account (including the making up of any deficiencies in any such account resulting from lack of Revenues sufficient to make any earlier required deposit) at the time of deposit to be satisfied before any transfer is made to any account subsequent in priority:
(a) Interest Account. On or before each date on which the interest on the Bonds
is payable, the Trustee will deposit in the Interest Account an amount required to cause the aggregate amount on deposit in the Interest Account to equal the amount of interest coming due and payable on such date on all outstanding Bonds. The Trustee will apply amounts in the Interest Account solely for the purpose of paying the interest on the Bonds when due, including accrued interest on any Bonds redeemed prior to maturity. Any amounts on deposit in the Interest Account on the first day of any Bond Year, to the extent

E-7
not required to pay any interest then having come due and payable on the outstanding Bonds, will be transferred to the Revenue Fund.
(b) Principal Account. On or before each date on which the principal of the
Bonds is payable, the Trustee shall deposit in the Principal Account an amount required to cause the aggregate amount on deposit therein to equal the aggregate amount of principal coming due and payable on such date on the Bonds, or the redemption price of the Bonds (consisting of the principal amount thereof and any applicable redemption premiums) required to be redeemed on such date. The Trustee will apply amounts in the Principal Account for the purpose of (i) paying the principal of the Bonds at the maturity thereof, (ii) paying the principal of the Bonds upon the redemption thereof, including the principal amount of the Term Bonds coming due upon the mandatory sinking fund redemption thereof. All amounts on deposit in the Principal Account on the first day of any Bond Year, to the extent not required to pay the principal of any outstanding Bonds then having come due and payable, will be transferred to the Revenue Fund.
Investment of Moneys in Funds
The Trustee will invest moneys in the funds and accounts established and held by it under the Indenture in Permitted Investments as directed by the Authority in writing. For the purpose of determining the amount in any fund, the Trustee will value Permitted Investments credited to such fund at least annually at the fair market value thereof, determined in any manner deemed reasonable by the Trustee. For purposes of acquiring any investments, the Trustee may commingle funds held by it under the Indenture. The Trustee may (but is not obligated to) act as principal or agent in the acquisition or disposition of any investment. The Trustee has no liability for losses arising from any investments made under the Indenture.
Financial Covenants
Punctual Payment. The Authority will punctually pay or cause to be paid the principal,
interest and premium (if any) to become due in respect of all the Bonds, in strict conformity with the terms of the Bonds and of the Indenture, according to the true intent and meaning thereof, but only out of Revenues and other assets pledged for such payment as provided in the Indenture.
Trustee Accounting Records. The Trustee will at all times keep, or cause to be kept,
proper books of record and account, prepared in accordance with corporate trust industry standards, in which complete and accurate entries will be made of all transactions made by the Trustee relating to the proceeds of Bonds, the Revenues and all funds and accounts established under the Indenture. Such books of record and account will be available for inspection by the Authority during regular business hours with reasonable prior notice.
Authority Financial Statements. The Authority shall cause to be prepared annually, within
210 days after the close of each Fiscal Year so long as any of the Bonds are Outstanding, complete audited financial statements with respect to such Fiscal Year showing the Revenues and all disbursements thereof as of the end of such Fiscal Year. The Authority shall furnish a copy of such statements, upon reasonable request, to the Trustee and any Bond Owner.
Issuance of Parity Debt. Except for the Bonds, the Authority covenants that no additional
bonds, notes or other indebtedness will be issued or incurred which are payable out of the
E-8
Revenues in whole or in part. Nothing in this covenant limits the authority of any Participating Member to issue parity obligations in accordance with the related Financing Agreement, including parity obligations which secure additional bonds of the Authority.
Financing Agreements. The Trustee, as assignee of the Authority's rights, covenants to
collect all amounts due from the Participating Members under the Financing Agreements and, subject to the provisions of the Indenture, will enforce, and take all steps, actions and proceedings reasonably necessary for the enforcement of all of the rights of the Authority under the Indenture and for the enforcement of all of the obligations of the Participating Members.
Amendment of Indenture
Amendment With Bond Owner Consent. The Indenture and the rights and obligations of the Authority and of the Owners of the Bonds may be modified or amended by the Authority and the Trustee at any time, with the written consent of the Owners of a majority in aggregate principal amount of the Bonds then outstanding.
Amendment Without Bond Owner Consent. The Indenture and the rights and obligations
of the Authority and of the Owners of the Bonds may also be modified or amended at any time, without the consent of any Owners of the Bonds, for any one or more of the following purposes:
(a) to add to the covenants and agreements of the Authority contained in the
Indenture, other covenants and agreements required to be observed under the Indenture, to pledge or assign additional security for the Bonds (or any portion thereof), or to surrender any right or power therein reserved to or conferred upon the Authority;
(b) to cure any ambiguity, inconsistency or omission, or correct any defective
provision, contained in the Indenture, or in any other respect whatsoever, as the Authority may deem necessary or desirable, provided that such amendment does not materially adversely affect the interests of the Bond Owners in the opinion of Bond Counsel filed with the Authority and the Trustee;
(c) to modify, amend or supplement the Indenture in such manner as to permit
the qualification of the Indenture under the Trust Indenture Act of 1939, as amended, or any similar federal statute at any time in effect, and to add such other terms, conditions and provisions as may be permitted by said act or similar federal statute; or
(d) to amend any provision relating to the Tax Code, to any extent whatsoever
but only if and to the extent such amendment does not adversely affect the exclusion from gross income of interest on any of the Bonds under the Tax Code, in the opinion of Bond Counsel filed with the Authority and the Trustee
Events of Default
Events of Default Defined. Each of the following events constitutes an Event of Default under the Indenture:

E-9
(a) Default in the due and punctual payment of the principal of any Bond when and as the same will become due and payable, whether at maturity as therein expressed, by proceedings for redemption, by declaration or otherwise.
(b) Default in the due and punctual payment of any installment of interest on any
Bond when and as such interest installment comes due and payable. (c) Failure by the Authority to observe and perform any of the covenants,
agreements or conditions on its part in the Indenture or in the Bonds contained, other than as referred to in the preceding clauses, for a period of 30 days after written notice, specifying such failure and requesting that it be remedied has been given to the Authority by the Trustee; provided, however, that if in the reasonable opinion of the Authority the failure stated in such notice can be corrected, but not within such 30-day period, such failure will not constitute an Event of Default if corrective action is instituted by the Authority within such 30-day period and diligently pursued until such failure is corrected.
(d) Certain events relating to the insolvency or bankruptcy of the Authority. (e) The failure by a Participating Member to make any payment of its pro rata
share of debt service on the Bonds in full when due under the related Financing Agreement.
Remedies Upon Default
Remedies of Trustee. Whenever any Event of Default has happened and is continuing, the Trustee has the right, at its option and without any further demand upon or notice to the Authority, to take any one or more of the following actions:
(a) Actions at Law or in Equity. The Trustee may take whatever action at law or
in equity may appear necessary or desirable to enforce performance and observance of any obligation, agreement or covenant of the Authority under the Indenture.
(b) Appointment of Receiver. As a matter of right, in connection with the filing of
a suit or other commencement of judicial proceedings to enforce the rights of the Trustee and the Bond Owners, the Trustee may cause the appointment of a receiver or receivers of the Revenues and other pledged amounts, with such powers as the court making such appointment shall confer.
Power of Trustee to Control Proceedings. If the Trustee, upon the happening of an Event
of Default, takes any action, by judicial proceedings or otherwise, in the performance of its duties under the Indenture, whether upon its own discretion, upon the request of the Owners of a majority in aggregate principal amount of the Bonds then outstanding, it has full power, in the exercise of its discretion for the best interests of the Owners of the Bonds, with respect to the continuance, discontinuance, withdrawal, compromise, settlement or other disposal of such action.
Limitation on Owners’ Right to Sue. No Owner of a Bond has the right to institute any suit,
action or proceeding at law or in equity, for any remedy under or upon the Indenture, unless:

E-10
(a) said Owner has previously given to the Trustee written notice of the occurrence of an Event of Default;
(b) the Owners of a majority in aggregate principal amount of all the Bonds then
outstanding have requested the Trustee in writing to exercise the powers granted under the Indenture or to institute such action, suit or proceeding in its own name;
(c) said Owners have tendered to the Trustee indemnity reasonably acceptable
to the Trustee against the costs, expenses and liabilities to be incurred in compliance with such request;
(d) the Trustee has failed to comply with such request for a period of 60 days
after such written request has been received by, and said tender of indemnity has been made to, the Trustee; and
(e) no direction inconsistent with such written request has been given to the
Trustee during such 60-day period by the Owners of a majority in aggregate principal amount of the Bonds then Outstanding.
Application of Funds Upon Event of Default
All of the Revenues and all sums in the funds and accounts established and held by the Trustee under the Indenture upon the occurrence of an Event of Default, and all sums thereafter received by the Trustee thereunder, will be applied by the Trustee as follows and in the following order:
First, to the payment of any fees, costs and expenses incurred by the Trustee to
protect the interests of the Owners of the Bonds; payment of the fees, costs and expenses of the Trustee (including fees and expenses of its counsel, including any allocated costs of internal counsel) incurred in and about the performance of its powers and duties under the Indenture and the payment of all fees, costs and expenses owing to the Trustee, together with interest on all such amounts advanced by the Trustee at the maximum rate permitted by law;
Second, to the payment of the whole amount then owing and unpaid upon the
Bonds for interest and principal, with interest on such overdue amounts at the respective rates of interest borne by those Bonds, and in case such moneys will be insufficient to pay in full the whole amount so owing and unpaid upon the Bonds, then to the payment of such interest, principal and interest on overdue amounts without preference or priority among such interest, principal and interest on overdue amounts ratably to the aggregate of such interest, principal and interest on overdue amounts.
Defeasance of Bonds
If the Authority pays and discharges the entire indebtedness on any Bonds in any one or more of the following ways:

E-11
(a) by paying or causing to be paid the principal of, and the interest and premium (if any) on, such Bonds when due and payable;
(b) by irrevocably depositing with the Trustee, in trust, at or before maturity,
money which, together with the available amounts then on deposit in the funds and accounts established with the Trustee under the Indenture and the Financing Agreements, is fully sufficient to pay such Bonds, including all principal, interest and premiums (if any); or
(c) by irrevocably depositing with the Trustee or any other fiduciary, in trust, non-
callable Federal Securities in such amount as an independent accountant determines will, together with the interest to accrue thereon and available moneys then on deposit in the funds and accounts established with the Trustee under the Indenture and the Financing Agreements, be fully sufficient to pay and discharge the indebtedness on such Bonds (including all principal, interest and redemption premiums) at or before their respective maturity dates;
and if such Bonds are to be redeemed prior to the maturity thereof notice of such redemption has been duly given or provision satisfactory to the Trustee has been made for the giving of such notice, then, at the election of the Authority, and notwithstanding that any such Bonds have not been surrendered for payment, the pledge of the Revenues and other funds provided for in the Indenture and all other obligations of the Trustee and the Authority under the Indenture with respect to such Bonds will terminate.

E-12
FINANCING AGREEMENTS
Definitions
The following terms have the following meanings when used in this Summary of the Financing Agreements between the Authority and each of the Participating Members, notwithstanding that any such terms may be elsewhere defined in this Official Statement. Any terms not expressly defined in this Summary but previously defined in this Official Statement have the respective meanings previously given.
“Allocable Share” means the portion of the debt service payments on the Bonds which is
allocated to the Participating Member as determined in accordance with the Joint Powers Agreement.
“Federal Securities” means: (a) any direct general obligations of the United States of
America (including obligations issued or held in book entry form on the books of the Department of the Treasury of the United States of America), the payment of principal of and interest on which are unconditionally and fully guaranteed by the United States of America; and (b) any obligations the principal of and interest on which are unconditionally guaranteed by the United States of America.
“Fiscal Year” means any twelve-month period extending from July 1 in one calendar year
to June 30 of the succeeding calendar year, both dates inclusive, or any other 12-month period selected and designated by the Participating Member as its official fiscal year period.
“Gross Revenues” means all gross charges received for, and all other gross income and
receipts derived by the Participating Member from, the ownership and operation of the Wastewater System or otherwise arising from the Wastewater System, including but not limited to investment earnings thereon and including connection or capacity charges; but excluding (a) the proceeds of any ad valorem property taxes levied for the purpose of paying general obligation bonds of the Participating Member relating to the Wastewater System, (b) the proceeds of any special assessments or special taxes levied upon real property within any improvement district for the purpose of paying special assessment bonds or special tax obligations of the Participating Member relating to the Wastewater System; and (c) customers’ deposits or any other deposits subject to refund until such deposits have become the property of the Participating Member, or contributions in aid of construction.
“Maximum Annual Debt Service” means, as of the date of any calculation, the maximum
sum obtained for the current or any future Fiscal Year by totaling the following amounts for such Fiscal Year: (a) the aggregate amount of the Member Payments coming due and payable in such Fiscal Year; and (b) the amount of principal of and interest on all outstanding Parity Debt coming due and payable by their terms in such Fiscal Year.
“Member Payments” means the amounts paid by the Participating Member under the
related Financing Agreement representing payments of principal of and interest and redemption premium (if any) on an Allocable Share of the Bonds.
“Net Revenues” means, for any period, an amount equal to all of the Gross Revenues
received during such period minus the amount required to pay all Operation and Maintenance Costs coming payable during such period.

E-13
“Operation and Maintenance Costs” means the reasonable and necessary costs paid or incurred by the Participating Member for maintaining and operating the Wastewater System, determined in accordance with generally accepted accounting principles, including but not limited to (a) all reasonable expenses of management and repair and other expenses necessary to maintain and preserve the Wastewater System in good repair and working order, (b) amounts payable for operation and maintenance under the Joint Powers Agreement, and (c) all administrative costs of the Participating Member that are charged directly or apportioned to the operation of the Wastewater System, such as salaries and wages of employees, overhead, taxes (if any) and insurance premiums. “Operating and Maintenance Costs” does not include (i) payments of debt service on bonds, notes or other obligations issued by the Participating Member with respect to the Wastewater System, (ii) payments made by the Participating Member under the Joint Powers Agreement in respect of debt service on notes, bonds or other obligations issued by the Authority to finance the project, (iii) depreciation, replacement and obsolescence charges or reserves therefor, and (iv) amortization of intangibles or other bookkeeping entries of a similar nature.
“Parity Debt” means any bonds, notes, leases, installment sale agreements or other
obligations of the Participating Member which are payable from and secured by a pledge of and lien upon any of the Net Revenues on a parity with the Member Payments, entered into or issued under and in accordance with the related Financing Agreement.
“Parity Debt Documents” means, collectively, the indenture of trust, trust agreement, loan
agreement, installment sale agreement or other document authorizing the issuance of any Parity Debt.
“Payment Schedule” means the schedule prepared by the Authority and filed with the
Participating Member showing the amount and date of each Member Payment relating to the Bonds, and setting forth the provisions relating to prepayment of the Member Payments.
“Unencumbered Fund Balance” means, for any Fiscal Year, the balance of Net Revenues
remaining on deposit in any of the funds and accounts of the Participating Member (including but not limited to the Wastewater Fund and any rate stabilization fund established by the Participating Member) as of the last day of such Fiscal Year, as shown on the books of the Participating Member, which may lawfully be used to pay the Member Payments. The amount of the Unencumbered Fund Balance as of the last day of any Fiscal Year does not include any funds which the Participating Member determines will be required for payment of the Member Payments or the principal of and interest on any Parity Debt during the next six months.
“Wastewater Fund” means the fund or funds established and held by the Participating
Member with respect to the Wastewater System for the receipt and deposit of Gross Revenues. “Wastewater System” means the entire system of the Participating Member for the
collection and transmission of wastewater, including but not limited to all facilities, properties and improvements at any time owned, controlled or operated by the Participating Member for the collection and transmission of wastewater within the service area of the Participating Member, and any necessary lands, rights, entitlements and other property useful in connection therewith, together with all extensions thereof and improvements thereto at any time acquired, constructed or installed by the Participating Member.
E-14
Debt Service Payments The Participating Member is solely responsible for payment of its Allocable Share of
principal of and interest on the Bonds. Payment of Member Payments by the Participating Member will be made as follows:
(a) Payment Dates and Amounts. The Participating Member will pay the
Member Payments in semiannual installments in the amounts and at the times set forth in the Payment Schedule.
(b) Payment Schedule. Upon the sale of the Bonds, the Authority will determine
the Member Payments for the Participating Member. Prior to the issuance of the Bonds, the Authority will file with the Participating Member a Payment Schedule showing the amount and date of each Member Payment and setting forth the provisions relating to prepayment of such Member Payments.
(c) Credit for Debt Service Fund Earnings. In determining the amount of the
Member Payment which the Participating Member is required to pay on any semiannual payment date or prepayment date, the Participating Member will be credited for an Allocable Share of any earnings which are received from the investment of the Principal Account and Interest Account which are established for the Bonds.
(d) Payments to Trustee. At the written direction of the Authority, the
Participating Member will pay the Member Payments to the Trustee or other assignee of the Authority. Upon the closing of the Bonds, the Authority will file such written direction with the Participating Member.
Pledge of Net Revenues
The Participating Member establishes a pledge of, lien on and security interest in all of the
Net Revenues to secure the Member Payments. The Participating Member agrees to deposit all of the Gross Revenues in the Wastewater
Fund immediately upon receipt. Amounts on deposit in the Wastewater Fund will be applied by the Participating Member to pay when due the following amounts in the following order of priority:
(a) all Operation and Maintenance Costs; (b) the Member Payments and all payments of principal of and interest and
premium (if any) on outstanding Parity Debt; (c) any other payments required to comply with the provisions of the Joint
Powers Agreement and any Parity Debt Documents; and (d) any other lawful purposes of the Wastewater System. The Participating Member will manage, conserve and apply amounts on deposit in the
Wastewater Fund in such a manner that all deposits required to be made under the Financing Agreement will be made at the times and in the amounts so required. So long as the Participating
E-15
Member is not in default in the payment of the Member Payments or the payment of principal of and interest and premium (if any) on outstanding Parity Debt, the Participating Member may use and apply amounts in the Wastewater Fund for (i) the payment of any subordinate obligations or any unsecured obligations, (ii) the acquisition and construction of improvements to the Wastewater System, (iii) the establishment of a rate stabilization fund, or (iv) any other lawful purposes of the Participating Member.
Special Obligation of the Participating Member; Obligations Absolute
The Participating Member’s obligation to pay the Member Payments and any other
amounts coming due and payable under the Financing Agreement is a special obligation of the Participating Member limited solely to the Net Revenues. Under no circumstances is the Participating Member required to advance moneys derived from any source of income other than the Net Revenues and other sources specifically identified in the Financing Agreement for the payment of the Member Payments and such other amounts. The obligations of the Participating Member to pay the Member Payments from the Net Revenues and to perform and observe the other agreements contained in the Financing Agreement are absolute and unconditional and are not subject to any defense or any right of set-off, counterclaim or recoupment whatsoever.
Rates and Charges
Gross Revenue Covenant. The Participating Member covenants to fix, prescribe, revise
and collect rates, fees and charges for the services and facilities furnished by the Wastewater System during each Fiscal Year, which are at least sufficient, after making allowances for contingencies and error in the estimates, to yield Gross Revenues sufficient to pay all obligations of the Participating Member which are charges, liens, encumbrances upon, or which are otherwise payable from, the Gross Revenues in such Fiscal Year, including all Member Payments and payments of principal of and interest on Parity Debt.
Net Revenue Covenant. In addition, the Participating Member agrees to fix, prescribe,
revise and collect rates, fees and charges for the services and facilities furnished by the Wastewater System during each Fiscal Year which are sufficient to yield Net Revenues at least equal to 120% of the Member Payments and payments of principal of and interest on Parity Debt coming due in such Fiscal Year. The amount of the Unencumbered Fund Balance as of the last day of the immediately preceding Fiscal Year will be credited towards the Participating Member’s obligations under this covenant, in an amount not to exceed 20% of the Member Payments and payments of principal of and interest on Parity Debt.
No Senior Lien Debt
So long as the Member Payments remain unpaid, the Participating Member will not issue
or incur any additional bonds or other obligations which are senior to the Member Payments.
Issuance of Parity Debt The Participating Member may issue Parity Debt which is payable from and secured by a
pledge of and lien on the Net Revenues on a parity with the Member Payments, upon satisfaction of the following conditions:
(a) The Participating Member is not then in default in the payment of the Member
Payments and in the payment of principal of and interest on any Parity Debt.

E-16
(b) The amount of Net Revenues, calculated in accordance with sound
accounting principles, as shown by the books of the Participating Member for the latest Fiscal Year for which audited financial statements are available, or as shown by the books of the Participating Member for any more recent 12-month period selected by the Participating Member, are at least equal to 120% of the amount of Maximum Annual Debt Service. For purposes of determining the amount of Net Revenues under this paragraph, the following will apply:
(i) the amount of Net Revenues may be increased to reflect any increase
in the rates and charges levied for service from the Wastewater System which has been adopted prior to the date the Parity Debt is issued, in an amount by which the Net Revenues would have been increased if such increase in charges (based on the highest adopted rate which will be in effect for any of the next three Fiscal Years) had been in effect during the whole of such Fiscal Year or other 12-month period;
(ii) the amount of Net Revenues may be increased (in an amount not
exceeding 20% of Maximum Annual Debt Service) by the amount of the Unencumbered Fund Balance as of the last day of the immediately preceding Fiscal Year; and
(iii) the amount of Net Revenues may be increased to take into account
any additions or improvements to or extensions of the Wastewater System to be financed from the proceeds of such Parity Debt or from any other source but in any case which, during all or any part of such Fiscal Year or other 12-month period, were not in service, in an amount equal to the estimated additional average annual Net Revenues to be derived from such additions, improvements and extensions for the first 36-month period in which each addition, improvement or extension is to be in operation, all as shown by the certificate or opinion of a qualified independent engineer or qualified independent financial consultant employed by the Participating Member.
(c) The Participating Member agrees to comply with all conditions to the
issuance of Parity Debt as set forth in the any Parity Debt Documents.
Issuance of Subordinate Debt Nothing in the Financing Agreement limits or affects the ability of the Participating Member
to issue or incur obligations which are unsecured or which are secured by an interest which is junior and subordinate to the pledge of and lien upon the Net Revenues established thereunder.
Operation and Insurance of the Wastewater System
The Participating Member covenants and agrees to operate the Wastewater System in an
efficient and economical manner and to operate, maintain and preserve the Wastewater System in good repair and working order. The Participating Member will at all times maintain with

E-17
responsible insurers all such insurance on the Wastewater System as is customarily maintained with respect to works and properties of like character against accident to, loss of or damage to the Wastewater System. The Participating Member will also maintain, with responsible insurers, worker’s compensation insurance and insurance against public liability and property damage to the extent reasonably necessary to protect the Participating Member, the Authority, the Trustee and the Owners of the Bonds.
Records and Accounts
The Participating Member agrees to keep proper books of record and accounts of the
Wastewater System in which complete and correct entries are made of all transactions relating to the Wastewater System. Said books will, upon prior written request, be subject to the reasonable inspection of the Authority and the Trustee, or their representatives authorized in writing, upon not less than two Business Days’ prior notice to the Participating Member. The Participating Member will cause the books and accounts of the Wastewater System to be audited annually by an Independent Accountant not more than nine months after the close of each Fiscal Year, and will make a copy of such report available for inspection by the Authority and the Trustee. Such report may be part of a combined financial audit or report covering all or part of the Participating Member’s finances.

[THIS PAGE INTENTIONALLY LEFT BLANK]

F-1
APPENDIX F
FORMS OF CONTINUING DISCLOSURE CERTIFICATES
AUTHORITY CONTINUING DISCLOSURE CERTIFICATE This CONTINUING DISCLOSURE CERTIFICATE (this “Disclosure Certificate”) is
executed and delivered by SILICON VALLEY CLEAN WATER (formerly the South Bayside System Authority) (the “Authority”) in connection with the issuance of the Silicon Valley Clean Water (San Mateo County, California) 2018 Wastewater Revenue Bonds (the “Bonds”). The Bonds are being issued pursuant to an Indenture of Trust, dated as of February 1, 2018 (the “Indenture”), by and between the Authority and ZB, National Association dba Zions Bank, as trustee.
The Authority covenants and agrees as follows: Section 1. Purpose of the Disclosure Certificate. This Disclosure Certificate is being
executed and delivered by the Authority for the benefit of the holders and beneficial owners of the Bonds and in order to assist the Participating Underwriter in complying with S.E.C. Rule 15c2-12(b)(5).
Section 2. Definitions. In addition to the definitions set forth above and in the Indenture,
which apply to any capitalized term used in this Disclosure Certificate unless otherwise defined in this Section 2, the following capitalized terms shall have the following meanings:
“Annual Report” means any Annual Report provided by the Authority pursuant to, and as
described in, Sections 4 and 5. “Annual Report Date” means the date that is nine months after the end of the Authority’s
fiscal year (currently March 31 based on the Authority’s fiscal year end of June 30). “Dissemination Agent” means the Authority, or any successor Dissemination Agent
designated in writing by the Authority and which has filed with the Authority a written acceptance of such designation.
“Listed Events” means any of the events listed in Section 3(a). “MSRB” means the Municipal Securities Rulemaking Board, which has been designated
by the Securities and Exchange Commission as the sole repository of disclosure information for purposes of the Rule, or any other repository of disclosure information that may be designated by the Securities and Exchange Commission as such for purposes of the Rule in the future.
“Official Statement” means the final official statement executed by the Authority in
connection with the issuance of the Bonds. “Participating Underwriter” means the original underwriter of the Bonds required to comply
with the Rule in connection with offering of the Bonds.

F-2
“Rule” means Rule 15c2-12(b)(5) adopted by the Securities and Exchange Commission under the Securities Exchange Act of 1934, as it may be amended from time to time.
Section 3. Reporting of Significant Events. (a) The Authority shall give, or cause to be given, notice of the occurrence of any of the
following Listed Events with respect to the Bonds: (1) Principal and interest payment delinquencies. (2) Non-payment related defaults, if material. (3) Unscheduled draws on debt service reserves reflecting financial difficulties. (4) Unscheduled draws on credit enhancements reflecting financial difficulties. (5) Substitution of credit or liquidity providers, or their failure to perform. (6) Adverse tax opinions, the issuance by the Internal Revenue Service of
proposed or final determinations of taxability, Notices of Proposed Issue (IRS Form 5701-TEB) or other material notices or determinations with respect to the tax status of the security, or other material events affecting the tax status of the security.
(7) Modifications to rights of security holders, if material. (8) Bond calls, if material, and tender offers. (9) Defeasances. (10) Release, substitution, or sale of property securing repayment of the
securities, if material. (11) Rating changes. (12) Bankruptcy, insolvency, receivership or similar event of the Authority or other
obligated person. (13) The consummation of a merger, consolidation, or acquisition involving the
Authority or an obligated person, or the sale of all or substantially all of the assets of the Authority or an obligated person (other than in the ordinary course of business), the entry into a definitive agreement to undertake such an action, or the termination of a definitive agreement relating to any such actions, other than pursuant to its terms, if material.
(14) Appointment of a successor or additional trustee or the change of name of a
trustee, if material. (b) Whenever the Authority obtains knowledge of the occurrence of a Listed Event, the
Authority shall, or shall cause the Dissemination Agent (if not the Authority) to, file a notice of such occurrence with the MSRB, in an electronic format as prescribed by the MSRB, in a timely manner

F-3
not in excess of 10 business days after the occurrence of the Listed Event. Notwithstanding the foregoing, notice of Listed Events described in subsections (a)(8) and (9) above need not be given under this subsection any earlier than the notice (if any) of the underlying event is given to holders of affected Bonds under the Indenture.
(c) The Authority acknowledges that the events described in subparagraphs (a)(2),
(a)(7), (a)(8) (if the event is a bond call), (a)(10), (a)(13), and (a)(14) of this Section contain the qualifier “if material” and that subparagraph (a)(6) also contains the qualifier "material" with respect to certain notices, determinations or other events affecting the tax status of the Bonds. The Authority shall cause a notice to be filed as set forth in paragraph (b) above with respect to any such event only to the extent that it determines the event’s occurrence is material for purposes of U.S. federal securities law. Whenever the Authority obtains knowledge of the occurrence of any of these Listed Events, the Authority will as soon as possible determine if such event would be material under applicable federal securities law. If such event is determined to be material, the Authority will cause a notice to be filed as set forth in paragraph (b) above.
(d) For purposes of this Disclosure Certificate, any event described in paragraph (a)(12)
above is considered to occur when any of the following occur: the appointment of a receiver, fiscal agent, or similar officer for the Authority in a proceeding under the United States Bankruptcy Code or in any other proceeding under state or federal law in which a court or governmental authority has assumed jurisdiction over substantially all of the assets or business of the Authority, or if such jurisdiction has been assumed by leaving the existing governing body and officials or officers in possession but subject to the supervision and orders of a court or governmental authority, or the entry of an order confirming a plan of reorganization, arrangement, or liquidation by a court or governmental authority having supervision or jurisdiction over substantially all of the assets or business of the Authority.
Section 4. Provision of Annual Reports. (a) The Authority shall, or shall cause the Dissemination Agent to, not later than the
Annual Report Date, commencing March 31, 2018, with the report for the 2016-17 fiscal year, provide to the MSRB, in an electronic format as prescribed by the MSRB, an Annual Report that is consistent with the requirements of Section 5. The initial Annual Report for the 2016-17 fiscal year shall be satisfied by filing the Official Statement promptly following the issuance of the Bonds. Not later than 15 Business Days prior to the Annual Report Date, the Authority shall provide the Annual Report to the Dissemination Agent (if other than the Authority). If by 15 Business Days prior to the Annual Report Date the Dissemination Agent (if other than the Authority) has not received a copy of the Annual Report, the Dissemination Agent shall contact the Authority to determine if the Authority is in compliance with the previous sentence. The Annual Report may be submitted as a single document or as separate documents comprising a package, and may include by reference other information as provided in Section 5; provided that the audited financial statements of the Authority may be submitted separately from the balance of the Annual Report, and later than the Annual Report Date, if not available by that date. If the Authority’s fiscal year changes, it shall give notice of such change in the same manner as for a Listed Event under Section 3(c). The Authority shall provide a written certification with each Annual Report furnished to the Dissemination Agent to the effect that such Annual Report constitutes the Annual Report required to be furnished by the Authority hereunder.
(b) If the Authority does not provide (or cause the Dissemination Agent to provide) an
Annual Report by the Annual Report Date, the Authority, in a timely manner, shall provide (or

F-4
cause the Dissemination Agent to provide) to the MSRB, in an electronic format as prescribed by the MSRB, a notice in substantially the form attached as Exhibit A.
(c) With respect to each Annual Report, the Dissemination Agent shall: (i) determine each year prior to the Annual Report Date the then-applicable
rules and electronic format prescribed by the MSRB for the filing of annual continuing disclosure reports; and
(ii) if the Dissemination Agent is other than the Authority, file a report with the
Authority certifying that the Annual Report has been provided pursuant to this Disclosure Certificate, and stating the date it was provided.
Section 5. Content of Annual Reports. The Authority’s Annual Report shall contain or
incorporate by reference the following: (a) The Authority’s audited financial statements prepared in accordance with generally
accepted accounting principles as promulgated to apply to governmental entities from time to time by the Governmental Accounting Standards Board. If the Authority’s audited financial statements are not available by the Annual Report Date, the Annual Report shall contain unaudited financial statements in a format similar to the financial statements contained in the final Official Statement, and the audited financial statements shall be filed in the same manner as the Annual Report when they become available.
(b) Unless otherwise provided in the audited financial statements filed on or before the
Annual Report Date, financial information and operating data with respect to the Authority for the preceding fiscal year, substantially similar to that provided in the corresponding tables in the Official Statement:
(i) remaining and anticipated sources of CIP funding, which may be provided in
the same or similar form as Tables 5,6 and 7; (ii) any bonds issues in the most recently completed fiscal year that are payable
from SVCW Bond Payments; (iii) any change in the cost allocations of Members during the most recently
completed fiscal year; and (iv) average wastewater flow for the most recently completed fiscal year, which
may be provided in the same or similar form as Table 9.
(c) In addition to any of the information expressly required to be provided under this Disclosure Certificate, the Authority shall provide such further material information, if any, as may be necessary to make the specifically required statements, in the light of the circumstances under which they are made, not misleading.
(d) Any or all of the items listed above may be included by specific reference to other
documents, including official statements of debt issues of the Authority or related public entities, which are available to the public on the MSRB’s Internet web site or filed with the Securities and Exchange Commission. The Authority shall clearly identify each such other document so included by reference.

F-5
Section 6. Identifying Information for Filings with the MSRB. All documents provided to the MSRB under the Disclosure Certificate shall be accompanied by identifying information as prescribed by the MSRB.
Section 7. Termination of Reporting Obligation. The Authority’s obligations under this
Disclosure Certificate shall terminate upon the legal defeasance, prior redemption or payment in full of all of the Bonds. If such termination occurs prior to the final maturity of the Bonds, the Authority shall give notice of such termination in the same manner as for a Listed Event under Section 3(b).
Section 8. Dissemination Agent. The Authority may, from time to time, appoint or engage
a Dissemination Agent to assist it in carrying out its obligations under this Disclosure Certificate, and may discharge any Dissemination Agent, with or without appointing a successor Dissemination Agent. The initial Dissemination Agent shall be the Authority. Any Dissemination Agent may resign by providing 30 days’ written notice to the Authority.
Section 9. Amendment; Waiver. Notwithstanding any other provision of this Disclosure
Certificate, the Authority may amend this Disclosure Certificate, and any provision of this Disclosure Certificate may be waived, provided that the following conditions are satisfied:
(a) if the amendment or waiver relates to the provisions of Section 5(a), it may
only be made in connection with a change in circumstances that arises from a change in legal requirements, change in law, or change in the identity, nature, or status of an obligated person with respect to the Bonds, or type of business conducted;
(b) the undertakings herein, as proposed to be amended or waived, would, in
the opinion of nationally recognized bond counsel, have complied with the requirements of the Rule at the time of the primary offering of the Bonds, after taking into account any amendments or interpretations of the Rule, as well as any change in circumstances; and
(c) the proposed amendment or waiver either (i) is approved by holders of the
Bonds in the manner provided in the Indenture for amendments to the Indenture with the consent of holders, or (ii) does not, in the opinion of nationally recognized bond counsel, materially impair the interests of the holders or beneficial owners of the Bonds.
If the annual financial information or operating data to be provided in the Annual Report is
amended pursuant to the provisions hereof, the first Annual Report filed pursuant hereto containing the amended operating data or financial information shall explain, in narrative form, the reasons for the amendment and the impact of the change in the type of operating data or financial information being provided.
If an amendment is made to this Disclosure Certificate modifying the accounting principles
to be followed in preparing financial statements, the Annual Report for the year in which the change is made shall present a comparison between the financial statements or information prepared on the basis of the new accounting principles and those prepared on the basis of the former accounting principles. The comparison shall include a qualitative discussion of the differences in the accounting principles and the impact of the change in the accounting principles on the presentation of the financial information, in order to provide information to investors to

F-6
enable them to evaluate the ability of the Authority to meet its obligations. To the extent reasonably feasible, the comparison shall be quantitative.
A notice of any amendment made pursuant to this Section 9 shall be filed in the same
manner as for a Listed Event under Section 3(b). Section 10. Additional Information. Nothing in this Disclosure Certificate shall be deemed
to prevent the Authority from disseminating any other information, using the means of dissemination set forth in this Disclosure Certificate or any other means of communication, or including any other information in any Annual Report or notice of occurrence of a Listed Event, in addition to that which is required by this Disclosure Certificate. If the Authority chooses to include any information in any Annual Report or notice of occurrence of a Listed Event in addition to that which is specifically required by this Disclosure Certificate, the Authority shall have no obligation under this Disclosure Certificate to update such information or include it in any future Annual Report or notice of occurrence of a Listed Event.
Section 11. Default. If the Authority fails to comply with any provision of this Disclosure
Certificate, the Participating Underwriter or any holder or beneficial owner of the Bonds may take such actions as may be necessary and appropriate, including seeking mandate or specific performance by court order, to cause the Authority to comply with its obligations under this Disclosure Certificate. A default under this Disclosure Certificate shall not be deemed an Event of Default under the Indenture, and the sole remedy under this Disclosure Certificate in the event of any failure of the Authority to comply with this Disclosure Certificate shall be an action to compel performance.
Section 12. Duties, Immunities and Liabilities of Dissemination Agent. (a) The
Dissemination Agent shall have only such duties as are specifically set forth in this Disclosure Certificate, and the Authority agrees to indemnify and save the Dissemination Agent, its officers, directors, employees and agents, harmless against any loss, expense and liabilities which they may incur arising out of or in the exercise or performance of its powers and duties hereunder, including the costs and expenses (including attorneys’ fees) of defending against any claim of liability, but excluding liabilities due to the Dissemination Agent’s negligence or willful misconduct. The Dissemination Agent shall have no duty or obligation to review any information provided to it by the Authority hereunder, and shall not be deemed to be acting in any fiduciary capacity for the Authority, the Bond holders or any other party. The obligations of the Authority under this Section shall survive resignation or removal of the Dissemination Agent and payment of the Bonds.
(b) The Dissemination Agent shall be paid compensation by the Authority for its services
provided hereunder in accordance with its schedule of fees as amended from time to time, and shall be reimbursed for all expenses, legal fees and advances made or incurred by the Dissemination Agent in the performance of its duties hereunder.
Section 13. Beneficiaries. This Disclosure Certificate shall inure solely to the benefit of the
Authority, the Dissemination Agent, the Participating Underwriter and the holders and beneficial owners from time to time of the Bonds, and shall create no rights in any other person or entity.
F-7
Section 14. Counterparts. This Disclosure Certificate may be executed in several counterparts, each of which shall be regarded as an original, and all of which shall constitute one and the same instrument.
Date: February 22, 2018
SILICON VALLEY CLEAN WATER By: Name: Title:

F-8
EXHIBIT A
NOTICE OF FAILURE TO FILE ANNUAL REPORT
Name of Issuer: Silicon Valley Clean Water Name of Issue: Silicon Valley Clean Water (San Mateo County, California) 2018
Wastewater Revenue Bonds Date of Issuance: February 22, 2018 NOTICE IS HEREBY GIVEN that the Authority has not provided an Annual Report with respect to the above-named Bonds as required by the Authority Continuing Disclosure Certificate, dated February 22, 2018. The Authority anticipates that the Annual Report will be filed by ________________.
Dated:
DISSEMINATION AGENT: _________________ By: Its:
F-9
PARTICIPATING MEMBER CONTINUING DISCLOSURE CERTIFICATE
This CONTINUING DISCLOSURE CERTIFICATE (this “Disclosure Certificate”) is
executed and delivered by _________________ (the “Participating Member”) in connection with the issuance of the Silicon Valley Clean Water (San Mateo County, California) 2018 Wastewater Revenue Bonds (the “Bonds”). The Bonds are being issued pursuant to an Indenture of Trust, dated as of February 1, 2018 (the “Indenture”), by and between Silicon Valley Clean Water and ZB, National Association dba Zions Bank, as trustee. The Bonds are payable from revenues, including payments to be made by the Participating Member under a Financing Agreement (the “Financing Agreement”), between the Authority and the Participating Member.
The Participating Member covenants and agrees as follows: Section 1. Purpose of the Disclosure Certificate. This Disclosure Certificate is being
executed and delivered by the Participating Member for the benefit of the holders and beneficial owners of the Bonds and in order to assist the Participating Underwriter in complying with S.E.C. Rule 15c2-12(b)(5).
Section 2. Definitions. In addition to the definitions set forth above and in the Indenture,
which apply to any capitalized term used in this Disclosure Certificate unless otherwise defined in this Section, the following capitalized terms shall have the following meanings:
“Annual Report” means any Annual Report provided by the Participating Member pursuant
to, and as described in, Sections 3 and 4. “Annual Report Date” means the date that is nine months after the end of the Participating
Member’s fiscal year (currently March 31 based on the Participating Member’s fiscal year end of June 30).
“Dissemination Agent” means, initially, the Participating Member, or any successor
Dissemination Agent designated in writing by the Participating Member and which has filed with the Participating Member a written acceptance of such designation.
“MSRB” means the Municipal Securities Rulemaking Board, which has been designated
by the Securities and Exchange Commission as the sole repository of disclosure information for purposes of the Rule, or any other repository of disclosure information that may be designated by the Securities and Exchange Commission as such for purposes of the Rule in the future.
“Official Statement” means the final official statement executed by the Authority in
connection with the issuance of the Bonds. “Participating Underwriter” means the original underwriter of the Bonds required to comply
with the Rule in connection with offering of the Bonds. “Rule” means Rule 15c2-12(b)(5) adopted by the Securities and Exchange Commission
under the Securities Exchange Act of 1934, as it may be amended from time to time.

F-10
Section 3. Provision of Annual Reports. (a) The Participating Member shall, or shall cause the Dissemination Agent to, not later
than the Annual Report Date, commencing March 31, 2018, with the report for the 2016-17 fiscal year, provide to the MSRB, in an electronic format as prescribed by the MSRB, an Annual Report that is consistent with the requirements of Section 4. The initial Annual Report for the 2016-17 fiscal year shall be satisfied by filing the Official Statement promptly following the issuance of the Bonds. Not later than 15 Business Days prior to the Annual Report Date, the Participating Member shall provide the Annual Report to the Dissemination Agent (if other than the Participating Member). If by 15 Business Days prior to the Annual Report Date the Dissemination Agent (if other than the Participating Member) has not received a copy of the Annual Report, the Dissemination Agent shall contact the Participating Member to determine if the Participating Member is in compliance with the previous sentence. The Annual Report may be submitted as a single document or as separate documents comprising a package, and may include by reference other information as provided in Section 4; provided that the audited financial statements of the Participating Member may be submitted separately from the balance of the Annual Report, and later than the Annual Report Date, if not available by that date. If the Participating Member’s fiscal year changes, it shall give notice of such change in the same manner as for an Annual Report. The Participating Member shall provide a written certification with each Annual Report furnished to the Dissemination Agent to the effect that such Annual Report constitutes the Annual Report required to be furnished by the Participating Member hereunder.
(b) If the Participating Member does not provide (or cause the Dissemination Agent to
provide) an Annual Report by the Annual Report Date, the Participating Member, in a timely manner, shall provide (or cause the Dissemination Agent to provide) to the MSRB, in an electronic format as prescribed by the MSRB, a notice in substantially the form attached as Exhibit A.
(c) With respect to each Annual Report, the Dissemination Agent shall: (i) determine each year prior to the Annual Report Date the then-applicable
rules and electronic format prescribed by the MSRB for the filing of annual continuing disclosure reports; and
(ii) if the Dissemination Agent is other than the Participating Member, file a
report with the Participating Member certifying that the Annual Report has been provided pursuant to this Disclosure Certificate, and stating the date it was provided.
Section 4. Content of Annual Reports. The Annual Report for the Participating Member
shall contain or incorporate by reference the following: (a) The Participating Member’s audited financial statements prepared in accordance
with generally accepted accounting principles as promulgated to apply to governmental entities from time to time by the Governmental Accounting Standards Board. If the Participating Member’s audited financial statements are not available by the Annual Report Date, the Annual Report shall contain unaudited financial statements in a format similar to the financial statements contained in the final Official Statement, and the audited financial statements shall be filed in the same manner as the Annual Report when they become available.
(b) Unless otherwise provided in the audited financial statements filed on or before the
Annual Report Date, financial information and operating data with respect to the Participating

F-11
Member for the preceding fiscal year, substantially similar to that provided in the corresponding tables in the Official Statement:
(i) revenues by class of user for the Sewer Utility System for the most recently
completed fiscal year; (ii) the top ten Sewer Utility System users by revenue for the most recently
completed fiscal year; (iii) a description of any revisions to the wastewater rates which were adopted or
which took effect during the most recently completed fiscal year; (iv) the Sewer Utility System’s revenues and expenses and Net Revenues,
including debt service and coverage ratios, for the most recently completed fiscal year; and
(v) a description of any additional indebtedness incurred by the Participating
Member during the most recently completed fiscal year which is payable from revenues of the Sewer Utility System.
(c) In addition to any of the information expressly required to be provided under this
Disclosure Certificate, the Participating Member shall provide such further material information, if any, as may be necessary to make the specifically required statements, in the light of the circumstances under which they are made, not misleading.
(d) Any or all of the items listed above may be included by specific reference to other
documents, including official statements of debt issues of the Participating Member or related public entities, which are available to the public on the MSRB’s Internet web site or filed with the Securities and Exchange Commission. The Participating Member shall clearly identify each such other document so included by reference.
Section 5. Identifying Information for Filings with the MSRB. All documents provided to
the MSRB under the Disclosure Certificate shall be accompanied by identifying information as prescribed by the MSRB.
Section 6. Termination of Reporting Obligation. The Participating Member’s obligations
under this Disclosure Certificate shall terminate upon the legal defeasance, prior redemption or payment in full of all of the Bonds. If such termination occurs prior to the final maturity of the Bonds, the Participating Member shall give notice of such termination as follows: the Participating Member shall, or shall cause the Dissemination Agent (if not the Participating Member) to, file a notice of such termination with the MSRB, in an electronic format as prescribed by the MSRB.
Section 7. Dissemination Agent. The Participating Member may, from time to time,
appoint or engage a Dissemination Agent to assist it in carrying out its obligations under this Disclosure Certificate, and may discharge any Dissemination Agent, with or without appointing a successor Dissemination Agent. The initial Dissemination Agent shall be the Participating Member. Any Dissemination Agent may resign by providing 30 days’ written notice to the Participating Member.
F-12
Section 8. Amendment; Waiver. Notwithstanding any other provision of this Disclosure Certificate, the Participating Member may amend this Disclosure Certificate, and any provision of this Disclosure Certificate may be waived, provided that the following conditions are satisfied:
(a) if the amendment or waiver relates to the provisions of Sections 3(a) or 4, it
may only be made in connection with a change in circumstances that arises from a change in legal requirements, change in law, or change in the identity, nature, or status of an obligated person with respect to the Bonds, or type of business conducted;
(b) the undertakings herein, as proposed to be amended or waived, would, in
the opinion of nationally recognized bond counsel, have complied with the requirements of the Rule at the time of the primary offering of the Bonds, after taking into account any amendments or interpretations of the Rule, as well as any change in circumstances; and
(c) the proposed amendment or waiver either (i) is approved by holders of the
Bonds in the manner provided in the Indenture for amendments to the Indenture with the consent of holders, or (ii) does not, in the opinion of nationally recognized bond counsel, materially impair the interests of the holders or beneficial owners of the Bonds.
If the annual financial information or operating data to be provided in the Annual Report is
amended pursuant to the provisions hereof, the first Annual Report filed pursuant hereto containing the amended operating data or financial information shall explain, in narrative form, the reasons for the amendment and the impact of the change in the type of operating data or financial information being provided.
If an amendment is made to this Disclosure Certificate modifying the accounting principles
to be followed in preparing financial statements, the Annual Report for the year in which the change is made shall present a comparison between the financial statements or information prepared on the basis of the new accounting principles and those prepared on the basis of the former accounting principles. The comparison shall include a qualitative discussion of the differences in the accounting principles and the impact of the change in the accounting principles on the presentation of the financial information, in order to provide information to investors to enable them to evaluate the ability of the Participating Member to meet its obligations. To the extent reasonably feasible, the comparison shall be quantitative.
A notice of any amendment made pursuant to this Section shall be filed in the same
manner as for an Annual Report. Section 9. Additional Information. Nothing in this Disclosure Certificate shall be deemed
to prevent the Participating Member from disseminating any other information, using the means of dissemination set forth in this Disclosure Certificate or any other means of communication, or including any other information in any Annual Report, in addition to that which is required by this Disclosure Certificate. If the Participating Member chooses to include any information in any Annual Report in addition to that which is specifically required by this Disclosure Certificate, the Participating Member shall have no obligation under this Disclosure Certificate to update such information or include it in any future Annual Report.
F-13
Section 10. Default. If the Participating Member fails to comply with any provision of this Disclosure Certificate, the Participating Underwriter or any holder or beneficial owner of the Bonds may take such actions as may be necessary and appropriate, including seeking mandate or specific performance by court order, to cause the Participating Member to comply with its obligations under this Disclosure Certificate. A default under this Disclosure Certificate shall not be deemed an Event of Default under the Indenture, and the sole remedy under this Disclosure Certificate in the event of any failure of the Participating Member to comply with this Disclosure Certificate shall be an action to compel performance.
Section 11. Duties, Immunities and Liabilities of Dissemination Agent. (a) The Dissemination Agent shall have only such duties as are specifically set forth in
this Disclosure Certificate, and the Participating Member agrees to indemnify and save the Dissemination Agent, its officers, directors, employees and agents, harmless against any loss, expense and liabilities which they may incur arising out of or in the exercise or performance of its powers and duties hereunder, including the costs and expenses (including attorneys’ fees) of defending against any claim of liability, but excluding liabilities due to the Dissemination Agent’s negligence or willful misconduct. The Dissemination Agent shall have no duty or obligation to review any information provided to it by the Participating Member hereunder, and shall not be deemed to be acting in any fiduciary capacity for the Participating Member, the Bond holders or any other party. The obligations of the Participating Member under this Section shall survive resignation or removal of the Dissemination Agent and payment of the Bonds.
(b) The Dissemination Agent shall be paid compensation by the Participating Member
for its services provided hereunder in accordance with its schedule of fees as amended from time to time, and shall be reimbursed for all expenses, legal fees and advances made or incurred by the Dissemination Agent in the performance of its duties hereunder.
Section 12. Beneficiaries. This Disclosure Certificate shall inure solely to the benefit of
the Participating Member, the Dissemination Agent, the Participating Underwriter and the holders and beneficial owners from time to time of the Bonds, and shall create no rights in any other person or entity.
Section 13. Counterparts. This Disclosure Certificate may be executed in several
counterparts, each of which shall be regarded as an original, and all of which shall constitute one and the same instrument. Date: February 22, 2018
_____________________ By: Name: Title:
F-14
EXHIBIT A
NOTICE OF FAILURE TO FILE ANNUAL REPORT
Name of Issuer: Silicon Valley Clean Water Name of Issue: Silicon Valley Clean Water (San Mateo County, California) 2018 Wastewater Revenue Bonds Date of Issuance: February 22, 2018 NOTICE IS HEREBY GIVEN that the Participating Member has not provided an Annual Report with respect to the above-named Bonds as required by the Participating Member Continuing Disclosure Certificate, dated February 22, 2018. The Participating Member anticipates that the Annual Report will be filed by ________________.
Dated:
DISSEMINATION AGENT: ________________________________ By: Its:
F-15
EXHIBIT A
NOTICE OF FAILURE TO FILE ANNUAL REPORT
Name of Issuer: Silicon Valley Clean Water Name of Issue: Silicon Valley Clean Water (San Mateo County, California) 2018
Wastewater Revenue Bonds
Date of Issuance: February 22, 2018 NOTICE IS HEREBY GIVEN that the Participating Member has not provided an Annual Report with respect to the above-named Bonds as required by the Participating Member Continuing Disclosure Certificate, dated February 22, 2018. The Participating Member anticipates that the Annual Report will be filed by ________________.
Dated:
DISSEMINATION AGENT: _________________ By: Its:

[THIS PAGE INTENTIONALLY LEFT BLANK]

G-1
APPENDIX G
FORM OF BOND COUNSEL OPINION
February 22, 2018 Silicon Valley Clean Water 1400 Radio Road Redwood City, California 94065
OPINION: $140,955,000 Silicon Valley Clean Water (San Mateo County, California) 2018 Wastewater Revenue Bonds
Members of the Authority:
We have acted as bond counsel in connection with the issuance by Silicon Valley Clean
Water (the “Authority”) of its $140,955,000 aggregate principal amount of Silicon Valley Clean Water (San Mateo County, California) 2018 Wastewater Revenue Bonds (the “Bonds”). The Bonds have been issued by the Authority under the provisions of Article 4 (commencing with Section 6584) of Chapter 5 of Division 7 of Title 1 of the Government Code of the State of California (the “Bond Law”), an Indenture of Trust dated as of February 1, 2018 (the “Indenture”) between the Authority and ZB, National Association dba Zions Bank, as trustee, and a resolution adopted by the Commission of the Authority on January 18, 2018. We have examined the law and such certified proceedings and other papers as we deem necessary to render this opinion.
As to questions of fact material to our opinion, we have relied upon representations of the
Authority contained in the Indenture and in the certified proceedings and certifications of public officials and others furnished to us, without undertaking to verify the same by independent investigation.
Based upon the foregoing, we are of the opinion, under existing law, as follows: 1. The Authority is duly organized and validly existing as a joint powers authority under
the laws of the State of California, with the power to enter into the Indenture, perform the agreements on its part contained therein and issue the Bonds.
2. The Bonds constitute legal, valid and binding special obligations of the Authority
enforceable in accordance with their terms and payable solely from the sources provided therefor in the Indenture.
3. The Indenture has been duly approved by the Authority and constitutes a legal, valid
and binding obligation of the Authority enforceable against the Authority in accordance with its terms.

G-2
4. Under the Bond Law, the Indenture establishes a valid lien on and pledge of the
Revenues (as that term is defined in the Indenture) for the security of the Bonds. 5. Interest on the Bonds is excluded from gross income for federal income tax purposes
and is not an item of tax preference for purposes of the federal alternative minimum tax; although, in the case of tax years beginning prior to January 1, 2018, for the purpose of computing the alternative minimum tax imposed on certain corporations, such interest earned by a corporation prior to the end of its tax year in 2018 is taken into account in determining certain income and earnings. The opinions set forth in the preceding sentence are subject to the condition that the Authority comply with all requirements of the Internal Revenue Code of 1986 which must be satisfied subsequent to the issuance of the Bonds in order that interest thereon be, or continue to be, excluded from gross income for federal income tax purposes. The Authority has covenanted in the Indenture and in other instruments relating to the Bonds to comply with each of such requirements, and the Authority has full legal authority to make and comply with such covenants. Failure to comply with certain of such requirements may cause the inclusion of interest on the Bonds in gross income for federal income tax purposes to be retroactive to the date of issuance of the Bonds.
6. Interest on the Bonds is exempt from California personal income taxation. Except as set forth above, we express no opinion regarding any other tax consequences
arising with respect to the ownership or disposition of, or the amount, accrual or receipt of interest on, the Bonds.
The rights of the owners of the Bonds and the enforceability of the Bonds and the
Indenture may be subject to bankruptcy, insolvency, reorganization, moratorium and other similar laws affecting creditors' rights heretofore or hereafter enacted and may also be subject to the exercise of judicial discretion in accordance with principles of equity or otherwise in appropriate cases.
Respectfully submitted, A Professional Law Corporation

H-1
APPENDIX H
DTC AND THE BOOK-ENTRY ONLY SYSTEM
The following description of the Depository Trust Company (“DTC”), the procedures and record keeping with respect to beneficial ownership interests in the bonds described in this Official Statement (the “Bonds”), payment of principal, interest and other payments on the Bonds to DTC Participants or Beneficial Owners, confirmation and transfer of beneficial ownership interest in the Bonds and other related transactions by and between DTC, the DTC Participants and the Beneficial Owners is based solely on information provided by DTC. Accordingly, no representations can be made concerning these matters and neither the DTC Participants nor the Beneficial Owners should rely on the foregoing information with respect to such matters, but should instead confirm the same with DTC or the DTC Participants, as the case may be.
Neither the issuer of the Bonds (the “Issuer”) nor the trustee, fiscal agent or paying agent
appointed with respect to the Bonds (the “Agent”) take any responsibility for the information contained in this Appendix.
No assurances can be given that DTC, DTC Participants or Indirect Participants will
distribute to the Beneficial Owners (a) payments of interest, principal or premium, if any, with respect to the Bonds, (b) certificates representing ownership interest in or other confirmation or ownership interest in the Bonds, or (c) redemption or other notices sent to DTC or Cede & Co., its nominee, as the registered owner of the Bonds, or that they will so do on a timely basis, or that DTC, DTC Participants or DTC Indirect Participants will act in the manner described in this Appendix. The current "Rules" applicable to DTC are on file with the Securities and Exchange Commission and the current "Procedures" of DTC to be followed in dealing with DTC Participants are on file with DTC.
1. The Depository Trust Company (“DTC”), New York, NY, will act as securities depository
for the securities (the “Securities”). The Securities will be issued as fully-registered securities registered in the name of Cede & Co. (DTC’s partnership nominee) or such other name as may be requested by an authorized representative of DTC. One fully-registered Security certificate will be issued for each issue of the Securities, each in the aggregate principal amount of such issue, and will be deposited with DTC. If, however, the aggregate principal amount of any issue exceeds $500 million, one certificate will be issued with respect to each $500 million of principal amount, and an additional certificate will be issued with respect to any remaining principal amount of such issue.
2. DTC, the world’s largest securities depository, is a limited-purpose trust company
organized under the New York Banking Law, a “banking organization” within the meaning of the New York Banking Law, a member of the Federal Reserve System, a “clearing corporation” within the meaning of the New York Uniform Commercial Code, and a “clearing agency” registered pursuant to the provisions of Section 17A of the Securities Exchange Act of 1934. DTC holds and provides asset servicing for over 3.5 million issues of U.S. and non-U.S. equity issues, corporate and municipal debt issues, and money market instruments (from over 100 countries) that DTC’s participants (“Direct Participants”) deposit with DTC. DTC also facilitates the post-trade settlement among Direct Participants of sales and other securities transactions in deposited securities, through electronic computerized book-entry transfers and pledges between Direct Participants’ accounts. This eliminates the need for physical movement of securities certificates. Direct Participants include both U.S. and non-U.S. securities brokers and dealers, banks, trust

H-2
companies, clearing corporations, and certain other organizations. DTC is a wholly-owned subsidiary of The Depository Trust & Clearing Corporation (“DTCC”). DTCC is the holding company for DTC, National Securities Clearing Corporation and Fixed Income Clearing Corporation, all of which are registered clearing agencies. DTCC is owned by the users of its regulated subsidiaries. Access to the DTC system is also available to others such as both U.S. and non-U.S. securities brokers and dealers, banks, trust companies, and clearing corporations that clear through or maintain a custodial relationship with a Direct Participant, either directly or indirectly (“Indirect Participants”). DTC has a Standard & Poor’s rating of AA+. The DTC Rules applicable to its Participants are on file with the Securities and Exchange Commission. More information about DTC can be found at www.dtcc.com and www.dtc.org. The information contained on this Internet site is not incorporated herein by reference.
3. Purchases of Securities under the DTC system must be made by or through Direct
Participants, which will receive a credit for the Securities on DTC’s records. The ownership interest of each actual purchaser of each Security (“Beneficial Owner”) is in turn to be recorded on the Direct and Indirect Participants’ records. Beneficial Owners will not receive written confirmation from DTC of their purchase. Beneficial Owners are, however, expected to receive written confirmations providing details of the transaction, as well as periodic statements of their holdings, from the Direct or Indirect Participant through which the Beneficial Owner entered into the transaction. Transfers of ownership interests in the Securities are to be accomplished by entries made on the books of Direct and Indirect Participants acting on behalf of Beneficial Owners. Beneficial Owners will not receive certificates representing their ownership interests in Securities, except in the event that use of the book-entry system for the Securities is discontinued.
4. To facilitate subsequent transfers, all Securities deposited by Direct Participants with
DTC are registered in the name of DTC’s partnership nominee, Cede & Co., or such other name as may be requested by an authorized representative of DTC. The deposit of Securities with DTC and their registration in the name of Cede & Co. or such other DTC nominee do not effect any change in beneficial ownership. DTC has no knowledge of the actual Beneficial Owners of the Securities; DTC’s records reflect only the identity of the Direct Participants to whose accounts such Securities are credited, which may or may not be the Beneficial Owners. The Direct and Indirect Participants will remain responsible for keeping account of their holdings on behalf of their customers.
5. Conveyance of notices and other communications by DTC to Direct Participants, by
Direct Participants to Indirect Participants, and by Direct Participants and Indirect Participants to Beneficial Owners will be governed by arrangements among them, subject to any statutory or regulatory requirements as may be in effect from time to time. Beneficial Owners of Securities may wish to take certain steps to augment the transmission to them of notices of significant events with respect to the Securities, such as redemptions, tenders, defaults, and proposed amendments to the Security documents. For example, Beneficial Owners of Securities may wish to ascertain that the nominee holding the Securities for their benefit has agreed to obtain and transmit notices to Beneficial Owners. In the alternative, Beneficial Owners may wish to provide their names and addresses to the registrar and request that copies of notices be provided directly to them.
6. Redemption notices shall be sent to DTC. If less than all of the Securities within an
issue are being redeemed, DTC’s practice is to determine by lot the amount of the interest of each Direct Participant in such issue to be redeemed.
7. Neither DTC nor Cede & Co. (nor any other DTC nominee) will consent or vote with
respect to Securities unless authorized by a Direct Participant in accordance with DTC’s MMI
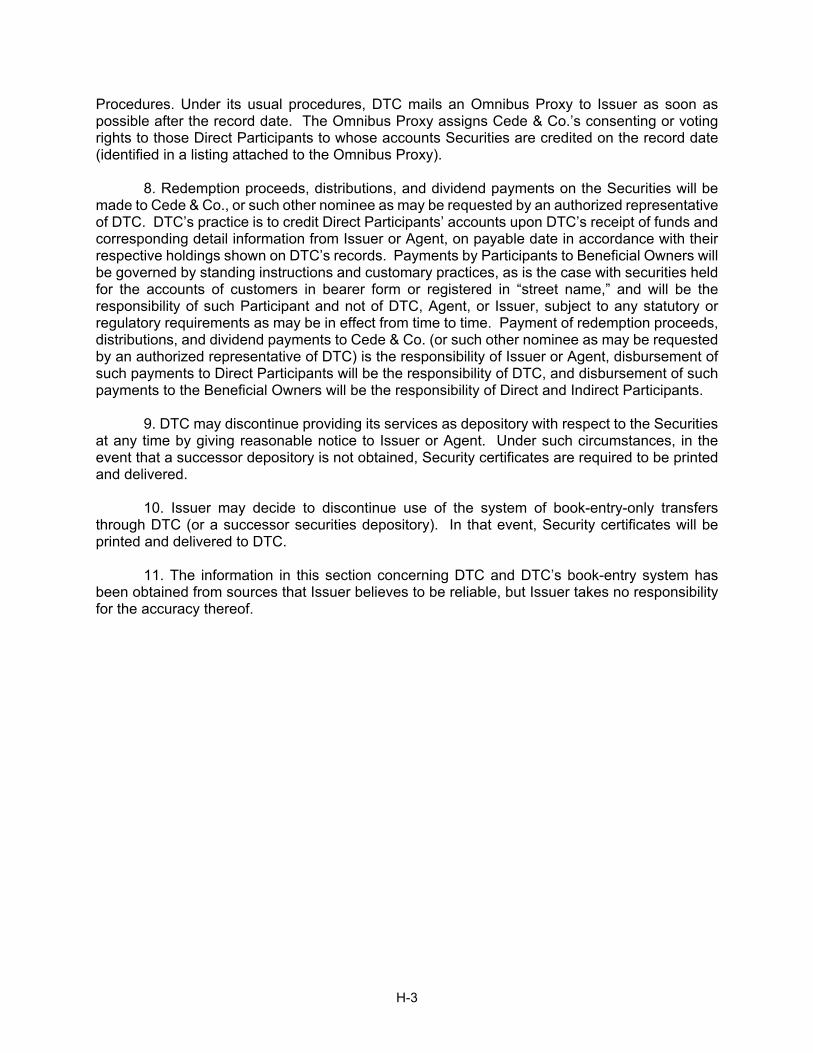
H-3
Procedures. Under its usual procedures, DTC mails an Omnibus Proxy to Issuer as soon as possible after the record date. The Omnibus Proxy assigns Cede & Co.’s consenting or voting rights to those Direct Participants to whose accounts Securities are credited on the record date (identified in a listing attached to the Omnibus Proxy).
8. Redemption proceeds, distributions, and dividend payments on the Securities will be
made to Cede & Co., or such other nominee as may be requested by an authorized representative of DTC. DTC’s practice is to credit Direct Participants’ accounts upon DTC’s receipt of funds and corresponding detail information from Issuer or Agent, on payable date in accordance with their respective holdings shown on DTC’s records. Payments by Participants to Beneficial Owners will be governed by standing instructions and customary practices, as is the case with securities held for the accounts of customers in bearer form or registered in “street name,” and will be the responsibility of such Participant and not of DTC, Agent, or Issuer, subject to any statutory or regulatory requirements as may be in effect from time to time. Payment of redemption proceeds, distributions, and dividend payments to Cede & Co. (or such other nominee as may be requested by an authorized representative of DTC) is the responsibility of Issuer or Agent, disbursement of such payments to Direct Participants will be the responsibility of DTC, and disbursement of such payments to the Beneficial Owners will be the responsibility of Direct and Indirect Participants.
9. DTC may discontinue providing its services as depository with respect to the Securities
at any time by giving reasonable notice to Issuer or Agent. Under such circumstances, in the event that a successor depository is not obtained, Security certificates are required to be printed and delivered.
10. Issuer may decide to discontinue use of the system of book-entry-only transfers
through DTC (or a successor securities depository). In that event, Security certificates will be printed and delivered to DTC.
11. The information in this section concerning DTC and DTC’s book-entry system has
been obtained from sources that Issuer believes to be reliable, but Issuer takes no responsibility for the accuracy thereof.

[THIS PAGE INTENTIONALLY LEFT BLANK]

APPENDIX I
Annual Financial Report for Silicon Valley Clean Water –
Fiscal Year Ended June 30, 2017

[THIS PAGE INTENTIONALLY LEFT BLANK]


This page intentionally left blank

Chavan & Associates, LLP Certified Public Accountants
1475 Saratoga Ave., Suite 180 San Jose, CA 95129
SILICON VALLEY CLEAN WATER
FINANCIAL STATEMENTS AND INDEPENDENT AUDITOR’S REPORT
JUNE 30, 2017
* * *

Silicon Valley Clean Water
Table of Contents June 30, 2017
Independent Auditor’s Report....................................................................................... 1 - 3 Management’s Discussion and Analysis ....................................................................... 5 - 15 Basic Financial Statements: Statement of Net Position .............................................................................................. 17 Statement of Activities and Changes in Net Position .................................................... 18 Statement of Cash Flows ............................................................................................... 19 Notes to Financial Statements ........................................................................................ 20 - 42
Required Supplementary Information: Schedule of Pension Contributions - CalPERS ............................................................ 44 Schedule of Proportionate Share of Net Pension Liability ........................................... 45 Supplementary Information: Combining Schedule of Net Position - Enterprise Funds ............................................. 47 - 48 Combining Schedule of Activities and Changes in Net Position - Enterprise Funds ... 49 - 50 Combining Schedule of Cash Flows - Enterprise Funds .............................................. 51 - 52 Schedule of Analysis of Net Position ........................................................................... 53 - 54 Independent Auditor’s Report on Internal Control over Financial Reporting and on Compliance and Other Matters Based on an Audit of Financial Statements Performed in Accordance with Government Auditing Standards ................................................................................. 56 - 57

1475 Saratoga Ave, Suite 180, San Jose, CA 95129 Tel: 408-217-8749 • E-Fax: 408-872-4159
[email protected] • www.cnallp.com
INDEPENDENT AUDITOR’S REPORT To the Commission of Silicon Valley Clean Water Redwood City, California Report on the Financial Statements We have audited the accompanying financial statements of the Silicon Valley Clean Water ("SVCW") as of and for the fiscal years ended June 30, 2017 and 2016, and the related notes to the financial statements, which collectively comprise SVCW’s basic financial statements as listed in the table of contents. Management’s Responsibility for the Financial Statements SVCW’s management is responsible for the preparation and fair presentation of these financial statements in accordance with accounting principles generally accepted in the United States of America; this includes the design, implementation, and maintenance of internal control relevant to the preparation and fair presentation of financial statements that are free from material misstatement, whether due to fraud or error. Auditor’s Responsibility Our responsibility is to express opinions on these financial statements based on our audit. We conducted our audit in accordance with auditing standards generally accepted in the United States of America, the standards applicable to financial audits contained in Government Auditing Standards, issued by the Comptroller General of the United States, and the State Controller's Minimum Audit Requirements for California Special Districts. Those standards require that we plan and perform the audit to obtain reasonable assurance about whether the financial statements are free from material misstatement. An audit involves performing procedures to obtain audit evidence about the amounts and disclosures in the financial statements. The procedures selected depend on the auditor’s judgment, including the assessment of the risks of material misstatement of the financial statements, whether due to fraud or error. In making those risk assessments, the auditor considers internal control relevant to SVCW’s preparation and fair presentation of the financial statements in order to design audit procedures that are appropriate in the circumstances, but not for the purpose of expressing an opinion on the effectiveness of SVCW’s internal control. Accordingly, we express no such opinion. An audit also includes evaluating the appropriateness of accounting policies used and the reasonableness of significant accounting estimates made by management, as well as evaluating the overall presentation of the financial statements.
Page 1 of 57

1475 Saratoga Ave, Suite 180, San Jose, CA 95129 Tel: 408-217-8749 • E-Fax: 408-872-4159
[email protected] • www.cnallp.com
We believe that the audit evidence we have obtained is sufficient and appropriate to provide a basis for our audit opinions. Opinion In our opinion, the financial statements referred to above present fairly, in all material respects, the respective financial position of SVCW, as of June 30, 2017, and the respective changes in financial position and, where applicable, cash flows thereof for the year then ended in accordance with accounting principles generally accepted in the United States of America. Other Matters Required Supplementary Information Accounting principles generally accepted in the United States of America require that the management’s discussion and analysis, schedule of pension contributions - CalPERS, schedule of proportionate share of net pension liability, and schedule of funding progress for the retiree healthcare plan, as listed in the table of contents, be presented to supplement the basic financial statements. Such information, although not a part of the basic financial statements, is required by the Governmental Accounting Standards Board who considers it to be an essential part of financial reporting for placing the basic financial statements in an appropriate operational, economic, or historical context. We have applied certain limited procedures to the required supplementary information in accordance with auditing standards generally accepted in the United States of America, which consisted of inquiries of management about the methods of preparing the information and comparing the information for consistency with management’s responses to our inquiries, the basic financial statements, and other knowledge we obtained during our audit of the basic financial statements. We do not express an opinion or provide any assurance on the information because the limited procedures do not provide us with sufficient evidence to express an opinion or provide any assurance. Supplementary Information Our audit was conducted for the purpose of forming opinions on the financial statements that collectively comprise SVCW’s financial statements as a whole. The supplementary information listed in the table of contents is presented for purposes of additional analysis and are not a required part of the financial statements. These schedules are the responsibility of management and were derived from and relate directly to the underlying accounting and other records used to prepare the financial statements. This information has been subjected to the auditing procedures applied in the audit of the financial statements and certain additional procedures, including comparing and reconciling such information directly to the underlying accounting and other records used to prepare the financial
Page 2 of 57

1475 Saratoga Ave, Suite 180, San Jose, CA 95129 Tel: 408-217-8749 • E-Fax: 408-872-4159
[email protected] • www.cnallp.com
statements or to the financial statements themselves, and other additional procedures in accordance with auditing standards generally accepted in the United States of America. In our opinion, this information is fairly stated in all material respects in relation to the financial statements as a whole. The Schedule of Analysis of Net Position has not been subjected to the auditing procedures applied in the audit of the basic financial statements and, accordingly, we do not express an opinion or provide any assurance on it. Other Reporting Required by Government Auditing Standards In accordance with Government Auditing Standards, we have also issued our report dated November 17, 2017 on our consideration of SVCW’s internal control over financial reporting and on our tests of its compliance with certain provisions of laws, regulations, contracts, and grant agreements and other matters. The purpose of that report is to describe the scope of our testing of internal control over financial reporting and compliance and the results of that testing, and not to provide an opinion on internal control over financial reporting or on compliance. That report is an integral part of an audit performed in accordance with Government Auditing Standards in considering SVCW’s internal control over financial reporting and compliance.
November 17, 2017 San Jose, California
Page 3 of 57

MANAGEMENT’S DISCUSSION AND ANALYSIS
Page 4 of 57

Silicon Valley Clean Water Management Discussion and Analysis
June 30, 2017
Silicon Valley Clean Water (the “Authority”, or “SVCW”) has issued its financial statements for the fiscal year ended June 30, 2017 in conformity with the format prescribed by the provisions of Government Accounting Standards Board Statement 34 (GASB 34). The Management of SVCW presents the following narrative overview and analysis of the financial activities, with comparative data for the fiscal year ended June 30, 2016. The Management Discussion and Analysis (MD&A) section is an overview of SVCW’s financial activities and is an integral part of the accompanying Basic Financial Statements. This information should be read in conjunction with the audited financial statements that follow this section. OVERVIEW OF THE BASIC FINANCIAL STATEMENTS SVCW’s revenues and expenses are recognized on a full accrual basis; revenues are recognized in the period in which they are earned and expenses are recognized in the period incurred. The basic financial statements are comprised of two components: Financial Statements and Notes to the Financial Statements. The Financial Statements report information about SVCW accounting using methods similar to those used by private sector companies. These statements offer short-term and long-term financial information about its activities and include:
The Statement of Net Position presents SVCW assets and liabilities, with the difference between the two reported as net position. This statement provides information about the nature and amounts of investments in resources (assets) and obligations to creditors (liabilities). It also provides the basis for evaluating the capital structure of the SVCW. Over time, increases or decreases in net position may serve as a useful indicator of whether the financial position of SVCW is improving or deteriorating.
The Statement of Activities and Changes in Net Position accounts for revenues and expenses and reflects the results of SVCW operations over the course of the fiscal year. This statement can be used as an indicator of the extent to which SVCW recovers its costs through charges.
The final required Financial Statement is the Statement of Cash Flows, with the primary purpose of providing information about SVCW’s cash receipts and cash payments during the reporting period. In addition to cash receipts and payments, this statement illustrates net changes in cash resulting from operations and investments. It also answers questions about the sources and uses of cash, and describes the change in cash balance during the reporting period.
The Notes to Financial Statements provide information that is not displayed on the face of the financial statements but is essential to a reader’s full understanding. ORGANIZATION AND BUSINESS SVCW is a joint exercise of powers authority that provides wastewater transmission, treatment, and effluent disposal to the cities of Belmont, Redwood City, and San Carlos, and the West Bay Sanitary District (collectively, the “Members”), all of which are located in the northern part of Silicon Valley between the cities of San Francisco and San Jose. SVCW’s wastewater treatment plant is located in the City of Redwood City and serves more than 200,000 people and businesses located predominantly in San Mateo County, California. SVCW operates in a robust Bay Area economy with a customer base that includes Oracle Corporation, EA Sports, and Facebook. In response to SVCW capital needs, ratepayers have already accommodated rate increases dedicated to large infrastructure improvements.
Page 5 of 57

Silicon Valley Clean Water Management Discussion and Analysis
June 30, 2017
SVCW owns and operates a regional wastewater treatment plant with an average dry weather flow permit capacity of 29 million gallons per day, an approximately nine-mile influent force main pipeline that conveys wastewater from the Members to SVCW’s treatment plant, five wastewater pump stations, and a 1.25 mile effluent disposal pipeline that discharges treated effluent into the San Francisco Bay. SVCW also provides recycled water to the City of Redwood City. A four-member “Commission” consisting of one appointed member from each of the Members’ governing bodies governs SVCW. Voting is proportional to the Members’ respective ownership interests in SVCW’s wastewater system. A proportionally-weighted vote of at least three-fourths of the total Commission votes is required to adopt or amend bylaws, rules, and regulations; to adopt or modify any budget; to approve any capital costs, materials and construction contracts, appropriations, or transfers of more than $50,000; to employ the manager and certain consultants; to sell or dispose of property; and to approve other designated items. Other actions of the Commission must be approved by a majority of total possible votes. Any amendment of the Joint Powers Agreement requires the concurrence of all Members. In addition, any amendment to the Joint Powers Agreement must also be approved by a 4/5 vote by each of the Members’ governing bodies. The Joint Powers Agreement sets forth how SVCW’s operating and capital costs are allocated to the Members. Operating costs are allocated to each Member based on a three-year average of each Member’s annual pro-rata share of total wastewater flow and strength loadings as measured by biological oxygen demand (“BOD”) and suspended solids (“SS”). As a result, the Budget for fiscal year 2017-18 allocates operating and maintenance costs to the Members as follows:
City of Redwood City 46.5% West Bay Sanitary District 27.9% City of San Carlos 12.8% City of Belmont 12.8%
Capital costs are allocated per Members’ share of capacity owned in various components of the wastewater system as established in the Joint Powers Agreement. All SVCW capital improvement expenditures are allocated as follows:
City of Redwood City 48.57% West Bay Sanitary District 26.84% City of San Carlos 15.14% City of Belmont 9.45%
The following table shows a history of average daily wastewater flow conveyed to SVCW from each Member for the last five fiscal years. Note that four years of an official drought were ended with heavy rains experienced in fiscal year 2016-17:
Member 2012-13 2013-14 2014-15 2015-16 2016-17Redwood City 6.4 6.6 6.1 6.4 7.8West Bay 3.5 3.5 3.6 3.8 3.9San Carlos 1.7 1.9 1.8 1.5 2.7Belmont 1.7 1.9 1.9 1.7 2.0Total 13.3 13.9 13.4 13.4 16.4
Page 6 of 57

Silicon Valley Clean Water Management Discussion and Analysis
June 30, 2017
FINANCIAL ANALYSIS Our analysis of SVCW begins on page 17 of the Financial Statements. One of the most important questions asked about SVCW’s finances is “Is SVCW as a whole better off or worse off as a result of the year’s activities?” The Statement of Net Position and the Statement of Activities and Changes in Net Position report information about SVCW’s activities in a way that will help answer this question. These two statements report the net position of SVCW and changes in them, which helps measure the financial health of the organization. Over time, increases or decreases in SVCW’s net position are one indicator of whether its financial health is improving or deteriorating. However, it is important to keep these indicators in context with other non-financial factors such as changes in economic conditions, population growth, climate, zoning, or the regulatory environment. SVCW’s fiscal year 2016-17 operating revenues and expenses were comparable both to the prior fiscal year as well as to the 2016-17 Budget. SVCW also invested $30.9 million cash into constructing assets associated with its ongoing Capital Improvement Program. Key projects included sectional replacement of the effluent pipeline, upgrades to the electrical power system, improvements to primary sedimentation tanks, and modernizing solids thickening processes. The Capital Improvement Program is largely funded through long-term borrowings and, to a lesser extent, member agency cash contributions. As of June 30, 2017, SVCW long-term debt was $201.8 million, a net increase of $2.6 million from prior year after $6.6 million in additional State Revolving Fund borrowings, premium amortization of $0.6 million, and principal payments of $3.4 million. SVCW Commission has an established reserve policy to protect its fiscal solvency. As of June 30, 2017, cash reserves were $28.8 million (a $3.8 million increase over the prior year) to prepare for required debt reserves and to ease economic uncertainty in the event of unforeseen large expenditures or catastrophic events. In addition, the Authority has a $5 million debt reserve associated with its 2009 bond issue. Like other governmental agencies, SVCW implemented Governmental Accounting Standards Board Statement No. 68 (GASB 68) in fiscal year 2014-15. The 2014-15 financial statements reflect a one-time $10.1 million adjustment for net pension liability. FINANCIAL HIGHLIGHTS SVCW net position increased during fiscal year 2016-17 by $2.51 million (3.18%) from the
previous year. Current Assets fell by $3.7 million as receivables associated with a State Water Board loan program were settled. Total Noncurrent Assets increased by $4.2 million, a change that included spending $15 million of Cash/bond proceeds held by Fiscal Agent on Construction in Progress, which increased $17 million. The Net Position balance also reflects a $2.8 million reduction in deferred inflows associated with prior years’ CalPERS pension earnings that were recognized in the 2016-17 fiscal year.
Operating revenues, inclusive of Members’ cash contributions in lieu of capital financing, decreased $11.95 million (23.8%) from the previous year. Whereas the prior year included $14.2 million of cash-in-lieu financing from Redwood City and Belmont, no such contributions were required in 2016-17. Excluding this item, overall Operating Revenue increased by $2.2 million for ordinary operations and paying increased debt service.
Page 7 of 57

Silicon Valley Clean Water Management Discussion and Analysis
June 30, 2017
Total expenses ended the fiscal year at $39.4 million, a $297 thousand decrease (0.7%) compared to the prior year. Depreciation increased by $1.3 million as SVCW placed new assets into service during the fiscal year. Operating expenses were $925 thousand less than prior year, specifically in personnel costs, as deferred inflows associated with CalPERS pension earnings were recognized in the 2016-17 fiscal year. Non-operating expenses declined by $720 thousand (8.0%) as a recent early bond refunding reduced interest expense.
Current cash balances increased $1.7 million (6.12%) as member agencies continued to contribute to the Capital Improvement Reserve during the year.
NET POSITION A summary of SVCW’s Statement of Net Position is presented in Table 1, which indicates a $2.5 million increase in SVCW’s net position from fiscal year 2015-16. Significant changes during the fiscal year included:
Current Assets plus Investment in Real Estate and an OPEB asset decreased by $3 million, largely from reduced receivables associated with a State Revolving Fund loan. The reimbursable SRF balance due to SVCW as of June 30, 2017 was $9.3 million.
Restricted assets decreased by $15 million (72.8%) from the prior year-end balance of $20.6 million as SVCW used bond cash proceeds on construction projects.
Capital assets, net of depreciation, increased by $18.5 million (8%) reflecting the continued investment in critical infrastructure improvements as SVCW proceeds with its long-term Capital Improvement Program.
Total SVCW liabilities increased by $1.34 million (0.6%), a net change that reflects additional State Revolving Fund borrowings of $6.1 million offset by $2.94 million in debt principal payments and $3.2 million less accounts payable at June 30, 2017.
Deferred Outflows and Deferred Inflows represent changes in the components of Authority’s pension liability. Specifically, the changes are to recognize in the total pension liability and in the pension plan’s fiduciary net position. The most significant change in deferred inflows and outflows was the impact of differences between past years’ projected investment earnings and the actual experiences. Such changes are spread to pension expense over a period of five years.
Page 8 of 57

Silicon Valley Clean Water Management Discussion and Analysis
June 30, 2017
Fiscal Year Fiscal Year Dollar Percent
2017 2016 Change Change
Current and other assets 48,000,613$ 51,048,297$ (3,047,684)$ -5.97%
Restricted assets 5,602,191 20,591,923 (14,989,732) -72.79%
Capital assets 251,171,625 232,622,646 18,548,979 7.97%
Total Assets 304,774,429 304,262,866 511,563 0.17%
Deferred Outflows 4,117,386 3,547,927 569,459 16.05%
Total Liabilities 225,860,283 224,521,135 1,339,148 0.60%
Deferred Inflows 1,352,904 4,125,769 (2,772,865) -67.21%
Net investment in capital assets 51,472,947 50,662,258 810,689 1.60%
Restricted 5,063,980 5,040,771 23,209 0.46%
Unrestricted 25,141,701 23,460,860 1,680,841 7.16% Total Net Position 81,678,628$ 79,163,889$ 2,514,739$ 3.18%
TABLE 1
Condensed Statement of Net Position
Table 2 below shows the activities associated with construction funds during the year. During 2016-17, member agencies collected $2.1 million in Stage 2 capacity fees associated with development in their communities. Members also contributed $1.8 million and $1.5 million, respectively, to Capital Reserves and pay-go capital projects, respectively. Approximately $11.9 million was received into the Capital Improvement Fund for debt service. As part of continued expenditures on its Capital Improvement Program, SVCW spent $30.8 million on capital projects during fiscal year 2016-17. Specific expenditures included sectional replacement of the effluent pipeline, upgrades to the electrical power system, improvements to primary sedimentation tanks, and modernizing solids thickening processes.
Capital
Capital Improvement
Reserve New Capital Replacement Stage 2 Program
(13 Fund) (14 Fund) (17 Fund) (15 Fund) (20-22 Fund) Totals
Member contributions -$ -$ -$ 2,138,907$ -$ 2,138,907$
Operating income 1,785,312 1,536,845 - - 11,877,963 15,200,120
Interest 23,665 1,224 15,903 13,260 31,766 85,818
Total Revenue 1,808,977 1,538,069 15,903 2,152,167 11,909,729 17,424,845
Cash to construction -$ 1,409,308$ -$ 108,128$ 29,338,785$ 30,856,221$
TABLE 2
Construction Fund Activity
Page 9 of 57
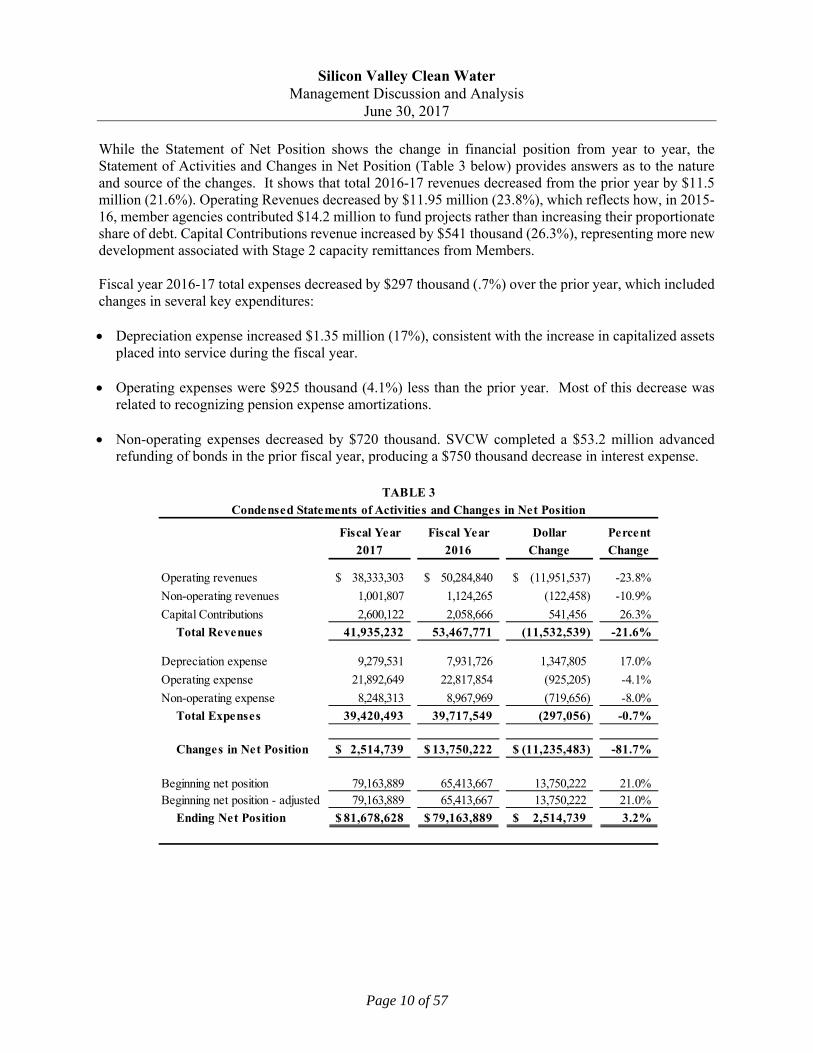
Silicon Valley Clean Water Management Discussion and Analysis
June 30, 2017
While the Statement of Net Position shows the change in financial position from year to year, the Statement of Activities and Changes in Net Position (Table 3 below) provides answers as to the nature and source of the changes. It shows that total 2016-17 revenues decreased from the prior year by $11.5 million (21.6%). Operating Revenues decreased by $11.95 million (23.8%), which reflects how, in 2015-16, member agencies contributed $14.2 million to fund projects rather than increasing their proportionate share of debt. Capital Contributions revenue increased by $541 thousand (26.3%), representing more new development associated with Stage 2 capacity remittances from Members. Fiscal year 2016-17 total expenses decreased by $297 thousand (.7%) over the prior year, which included changes in several key expenditures: Depreciation expense increased $1.35 million (17%), consistent with the increase in capitalized assets
placed into service during the fiscal year. Operating expenses were $925 thousand (4.1%) less than the prior year. Most of this decrease was
related to recognizing pension expense amortizations. Non-operating expenses decreased by $720 thousand. SVCW completed a $53.2 million advanced
refunding of bonds in the prior fiscal year, producing a $750 thousand decrease in interest expense.
Fiscal Year Fiscal Year Dollar Percent
2017 2016 Change Change
Operating revenues 38,333,303$ 50,284,840$ (11,951,537)$ -23.8%
Non-operating revenues 1,001,807 1,124,265 (122,458) -10.9%
Capital Contributions 2,600,122 2,058,666 541,456 26.3%
Total Revenues 41,935,232 53,467,771 (11,532,539) -21.6%
Depreciation expense 9,279,531 7,931,726 1,347,805 17.0%
Operating expense 21,892,649 22,817,854 (925,205) -4.1%
Non-operating expense 8,248,313 8,967,969 (719,656) -8.0%
Total Expenses 39,420,493 39,717,549 (297,056) -0.7%
Changes in Net Position 2,514,739$ 13,750,222$ (11,235,483)$ -81.7%
Beginning net position 79,163,889 65,413,667 13,750,222 21.0%Beginning net position - adjusted 79,163,889 65,413,667 13,750,222 21.0%
Ending Net Position 81,678,628$ 79,163,889$ 2,514,739$ 3.2%
TABLE 3
Condensed Statements of Activities and Changes in Net Position
Page 10 of 57

Silicon Valley Clean Water Management Discussion and Analysis
June 30, 2017
BUDGETARY HIGHLIGHTS The SVCW Commission adopts an annual Operating Fund budget that provides for current activities and establishes a short-term spending plan aligned with SVCW financial goals. Budgets are prepared on the accrual basis of accounting. Table 4 below compares actual and budgeted expenditures for the Operating Fund during the year ended June 30, 2017.
Dollar Percent
Actual Budget Variance Variance
Member Contributions 22,549,104$ 22,549,103$ 1$ 0.00%
Source Control Revenue 69,724 56,000 13,724 24.51%
Other Revenue 295,102 370,829 (75,727) -20.42%
Total Operating Revenue 22,913,930 22,975,932 (62,002) -0.27%
Operations 8,114,728 8,300,593 185,865 2.24%
Maintenance 5,845,384 5,932,900 87,516 1.48%
Laboratory 1,490,025 1,643,647 153,622 9.35%
Environmental Services 960,717 1,094,402 133,685 12.22%
Engineering 359,802 507,159 147,357 29.06%
Informationl Services 1,682,948 1,747,490 64,542 3.69%
Safety 331,500 370,779 39,279 10.59%
Administration 3,390,953 3,378,961 (11,992) -0.35%
Depreciation 9,279,531 9,279,531 - 0.00%
Total Operating Expenses 31,455,588 32,255,462 799,874 2.48%
Operating Income/(Loss) (8,541,658)$ (9,279,530)$ 737,872$ 7.95%
TABLE 4
FY 2016-2017 Actual vs Budget
Inclusive of $9.3 million in depreciation, SVCW reported an operating loss of $8.5 million, which was $737.8 thousand less than budgeted during fiscal year 2016-17. Member Contributions revenue matched Budget but Other Revenue ended the year $76 thousand (20.4%) less than budgeted due to timing of grant reimbursements from a California Energy Commission grant. Total expenditures were $799.8 thousand (2.5%) less than budgeted and was largely due to the timing of recognizing deferred inflows associated with CalPERS pension earnings.
Page 11 of 57
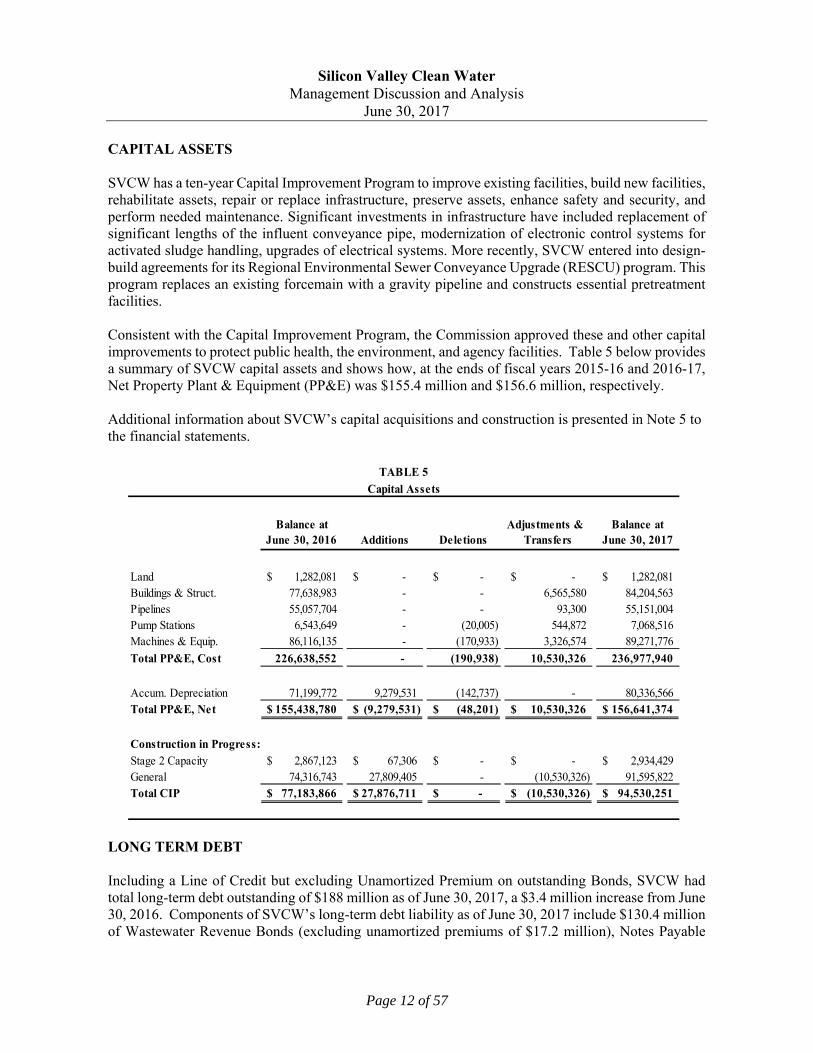
Silicon Valley Clean Water Management Discussion and Analysis
June 30, 2017
CAPITAL ASSETS SVCW has a ten-year Capital Improvement Program to improve existing facilities, build new facilities, rehabilitate assets, repair or replace infrastructure, preserve assets, enhance safety and security, and perform needed maintenance. Significant investments in infrastructure have included replacement of significant lengths of the influent conveyance pipe, modernization of electronic control systems for activated sludge handling, upgrades of electrical systems. More recently, SVCW entered into design-build agreements for its Regional Environmental Sewer Conveyance Upgrade (RESCU) program. This program replaces an existing forcemain with a gravity pipeline and constructs essential pretreatment facilities. Consistent with the Capital Improvement Program, the Commission approved these and other capital improvements to protect public health, the environment, and agency facilities. Table 5 below provides a summary of SVCW capital assets and shows how, at the ends of fiscal years 2015-16 and 2016-17, Net Property Plant & Equipment (PP&E) was $155.4 million and $156.6 million, respectively. Additional information about SVCW’s capital acquisitions and construction is presented in Note 5 to the financial statements.
Balance at Adjustments & Balance atJune 30, 2016 Additions Deletions Transfers June 30, 2017
Land 1,282,081$ -$ -$ -$ 1,282,081$ Buildings & Struct. 77,638,983 - - 6,565,580 84,204,563 Pipelines 55,057,704 - - 93,300 55,151,004 Pump Stations 6,543,649 - (20,005) 544,872 7,068,516 Machines & Equip. 86,116,135 - (170,933) 3,326,574 89,271,776
Total PP&E, Cost 226,638,552 - (190,938) 10,530,326 236,977,940
Accum. Depreciation 71,199,772 9,279,531 (142,737) - 80,336,566 Total PP&E, Net 155,438,780$ (9,279,531)$ (48,201)$ 10,530,326$ 156,641,374$
Construction in Progress:Stage 2 Capacity 2,867,123$ 67,306$ -$ -$ 2,934,429$ General 74,316,743 27,809,405 - (10,530,326) 91,595,822 Total CIP 77,183,866$ 27,876,711$ -$ (10,530,326)$ 94,530,251$
Capital Assets
TABLE 5
LONG TERM DEBT Including a Line of Credit but excluding Unamortized Premium on outstanding Bonds, SVCW had total long-term debt outstanding of $188 million as of June 30, 2017, a $3.4 million increase from June 30, 2016. Components of SVCW’s long-term debt liability as of June 30, 2017 include $130.4 million of Wastewater Revenue Bonds (excluding unamortized premiums of $17.2 million), Notes Payable
Page 12 of 57

Silicon Valley Clean Water Management Discussion and Analysis
June 30, 2017
obligations to the California Clean Water State Revolving Fund for approximately $54 million, and a line of credit of $3.5 million. When SVCW credit rates were last reviewed in November 2016, Moody’s upgraded its Wastewater Revenue Bonds rating to Aa2 from Aa3. Standard & Poor’s Ratings Services separately affirmed its ‘AA’ long-term rating with a stable outlook. Wastewater Revenue Bonds SVCW has $130.4 million outstanding in Wastewater Revenue Bonds par value, the proceeds for which were used to acquire and construct wastewater system improvements. These Bonds are limited obligations of SVCW, payable solely from and secured solely by the revenues pledged under the Indenture, consisting primarily of payments made by the City of Redwood, the City of San Carlos, and the West Bay Sanitary District (the "Participating Members). Table 6 below shows the total bonds outstanding for the fiscal years ended June 30, 2016 and 2017:
Bonds BondsIssue Maturity Interest Original Outstanding Issued Outstanding
Bond Date Date Rate Issue July 01, 2016 (Redeemed) June 30, 2017
2009 Revenue Bond 7/1/2009 8/1/2039 1.74-8.1% 55,855,000$ 4,925,000$ (1,160,000)$ 3,765,000$ 2014 Revenue Bond 3/6/2014 2/1/2044 3.0-5.0% 60,000,000 58,205,000 (1,010,000) 57,195,000 2015 Revenue Bond 11/24/2015 8/1/2045 2.0-5.0% 70,200,000 70,200,000 (770,000) 69,430,000
Total Wastewater Revenue Bonds 186,055,000$ 133,330,000$ (2,940,000)$ 130,390,000$
TABLE 6Wasterwater Revenue Bonds
State Water Resources Control Board Loan SVCW has financed three projects by entering into separate sale-repurchase agreements with the State Water Resources Control Board (SWRCB). Combined, the principal due on these agreements totaled $54 million as of June 30, 2017. The project funds, together with all accrued interest, are repaid in annual installments commencing one year after the completion of construction. In August 2011, SVCW secured SWRCB funding for the construction of an administration and plant control building. The outstanding liability was $9.5 million as of June 30, 2017 and is scheduled to be fully repaid by June 2033. In March 2012, SVCW entered a similar agreement with the SWRCB for up to $35.4 million for certain improvements to the wastewater treatment plant. As of June 30, 2017, SVCW had incurred $30.7 million in expenditures and the project was completed in July 2017. The total outstanding balance at completion was $31.5 million. The first annual payment of $1.89 million was made October 31, 2017 and the final payment is scheduled October 31, 2036.
Page 13 of 57

Silicon Valley Clean Water Management Discussion and Analysis
June 30, 2017
In May 2017, SVCW entered a third SWRCB agreement for up to $14 million to plan improvements to its conveyance system. As of June 30, 2017, SVCW had incurred the full $14 million in expenditures under this project by year-end. SVCW intends to consolidate this loan into a subsequent construction loan associated with conveyance projects in 2018. Line of Credit On May 29, 2017, SVCW secured a $30 million line of credit with Wells Fargo Bank. Advances on the line of credit provide for an interest rate based on either a fixed per annum rate of interest equal to the LIBOR rate plus the Applicable LIBOR Rate Margin, or a variable per annum rate of interest equal to the Base Rate plus the Applicable Base Rate Margin. SVCW had $3.5 million outstanding on the line of credit at June 30, 2017. More detailed information about SVCW’s long-term debt, Notes Payable, and Line of Credit is presented in note 6 to the financial statements. ECONOMIC FACTORS AND NEXT YEAR’S BUDGET The approved Operating Budget for fiscal year 2017-18 recommends expenditures based on a prioritization of needs, goals and objectives; it also anticipates external cost pressures and provides a roadmap to meet the needs of the community in the coming fiscal year. The Budget considered ordinary inflationary pressures, and incorporated savings from operational improvements. Personnel costs are relatively unchanged in terms of staffing levels, though adjusted to incorporate terms of a Memorandum of Understanding (MOU) between SVCW and the International Union of Operating Engineers Stationary Local 39, AFL-CIO. This MOU expires June 30, 2018. Each Member Agency has proactively raised sewer rates to support its allocable share of funding requirements for SVCW’s operations and Capital Improvement Program, as well to meet their own operating and capital needs. Table 7 compares the fiscal year 2017-18 Operating Fund Budget to the fiscal year 2016-17 actual results. Total 2017-18 Operating Expenses are anticipated to increase $1.7 million (5.5%) from prior year actual expenditures. The largest increase over 2016-17 actual expenditures is in personnel costs. In addition to a $900 thousand impact of recognizing the timing Deferred Inflows related to CalPERS pension earnings, the Budget provides $860 thousand for routine salary increases and filling of two vacant positions. Other non-personnel budgeted costs are generally consistent 2016-17 actuals as SVCW continues to incur savings from more efficient capital projects and equipment, as well as other process optimization efforts.
Page 14 of 57

Silicon Valley Clean Water Management Discussion and Analysis
June 30, 2017
FY 2017-2018 FY2016-2017 Dollar PercentBudget Actual Change Change
Member Contributions 23,291,325$ 22,549,104$ 742,221$ 3.3%
Source Control Revenue 56,486 69,724 (13,238) -19.0%
Other Revenues 565,122 295,102 270,020 91.5%
Total Operating Revenue 23,912,933 22,913,930 999,003 4.4%
Operations 8,781,725 8,114,728 666,997 8.2%
Maintenance 6,091,043 5,845,384 245,659 4.2%
Laboratory 1,721,762 1,490,025 231,737 15.6%
Environmental Services 1,095,886 960,717 135,169 14.1%
Engineering 554,380 359,802 194,578 54.1%
Information Systems 1,697,101 1,682,948 14,153 0.8%
Safety 381,463 331,500 49,963 15.1%
Administration 3,589,562 3,390,953 198,609 5.9%
Depreciation 9,279,531 9,279,531 - 0.0%
Total Operating Expenses 33,192,453 31,455,588 1,736,865 5.5%
Operating Income/(Loss) (9,279,520)$ (8,541,658)$ (737,862)$ -8.6%
TABLE 7
FY 2017-2018 Budget vs FY 2016-2017 Actual
CONTACTING SILICON VALLEY CLEAN WATER MANAGEMENT This financial report is designed to provide SVCW officers, investors, stakeholders, and other interested parties with a general overview of SVCW’s financial condition. If you have any questions about this report or need additional financial information, please contact the offices of the General Manager or the Chief Financial Officer at Silicon Valley Clean Water, (650) 832-6224, 1400 Radio Road, Redwood City, CA, 94065.
Page 15 of 57

BASIC FINANCIAL STATEMENTS
Page 16 of 57

Assets 2017 2016
Current Assets:
Cash and investments 30,047,972$ 28,315,756$
Accounts receivable 10,194,719 15,784,338
Interest receivable 514,607 524,026
Employee notes receivable 21,741 12,672
Deposits - 93,300
Inventory 1,828,192 1,720,615
Prepaid expenses 198,984 38,537
Total Current Assets 42,806,215 46,489,244
Noncurrent Assets:
Investment in real estate 2,552,962 2,552,962
Cash with fiscal agent 5,602,191 20,591,923
OPEB asset 2,641,436 2,006,091
Capital assets - net:
Depreciable capital assets:
Plant in service - net 155,359,294 154,156,699
Non-depreciable capital assets:
Land 1,282,081 1,282,081
Construction in progress:
Stage 2 2,934,429 2,867,123
General 91,595,821 74,316,743
Total Capital assets - net 251,171,625 232,622,646
Total Noncurrent Assets - Net 261,968,214 257,773,622
Total Assets 304,774,429$ 304,262,866$
Deferred Outflows of Resources
Pension Contributions and Adjustments 3,609,256$ 2,947,263$
Deferred Loss on Defeasance 508,130 600,664
Total Deferred Outflows of Resources 4,117,386$ 3,547,927$
Liabilities
Current Liabilities:
Accounts payable 3,062,607$ 6,218,324$
Accrued payroll and employee benefits 682,100 1,158,427
Accrued interest payable 4,166,921 4,220,963
Unearned revenue 297,280 1,246,444
Noncurrent liabilities due within one year 5,749,478 4,177,590
Total Current Liabilities 13,958,386 17,021,748
Noncurrent liabilities due in more than one year 211,901,897 207,499,387
Total Liabilities 225,860,283$ 224,521,135$
Deferred inflows of Resources
Pension Differences Between Actual and Expected Returns 1,352,904$ 4,125,769$
Net Position
Net Investment in Capital Assets 51,472,947$ 50,662,258$
Restricted for:
Debt service 5,063,980 5,040,771
Unrestricted 25,141,701 23,460,860
Total Net Position 81,678,628$ 79,163,889$
The notes to basic financial statements are an integral part of this statement
Silicon Valley Clean Water
Statement of Net Position
(With Comparative Totals as of June 30, 2016)
June 30, 2017
Page 17 of 57

2017 2016
Operating Revenues:
Member contributions for services 22,768,357$ 22,118,913$
Member contributions for cash reserves 3,315,348 3,158,796
Member contributions for debt service 11,877,963 10,513,768
Member contributions for cash in-lieu-of financing - 14,174,489
Sources control charges 69,724 42,065
Miscellaneous revenues 301,911 276,809
Total operating revenues 38,333,303 50,284,840
Operating Expenses:
Operations 8,043,786 8,469,525
Maintenance 5,690,268 5,734,661
Laboratory 1,437,783 1,594,084
Environmental services 914,870 958,571
Engineering 399,315 474,546
Information systems 1,655,229 1,525,354
Safety 322,260 335,727
Administration 3,429,138 3,696,801
Claims paid - 28,585
Depreciation 9,279,531 7,931,726
Total operating expenses 31,172,180 30,749,580
Operating Income (Loss) 7,161,123 19,535,260
Nonoperating Revenues (Expenses):
Grants 271,125 -
Stage 2 capacity fees 2,600,122 2,058,666
Interest by fund:
Operations fund 16,419 15,586
Stage 2 capacity fund 13,260 105,552
Capital improvement reserve fund 24,889 206,864
Self insurance fund 33 57
Operating reserve fund 15,903 49,093
Recycled water fund 29 38
Capital improvement fund 89,670 116,838
Net increase (decrease) in fair value of investments (57,904) 1,853
Interest expense (8,200,112) (8,950,017)
Premium amortization 628,383 628,384
Gain (loss) on disposal of fixed assets (48,201) (17,952)
Total nonoperating revenues (expenses) (4,646,384) (5,785,038)
Change in Net Position 2,514,739 13,750,222
Beginning Net Position 79,163,889 65,413,667
Ending Net Position 81,678,628$ 79,163,889$
The notes to basic financial statements are an integral part of this statement
Silicon Valley Clean Water
Statement of Activities and Changes in Net Position
(With Comparative Totals for the Fiscal Year Ended June 30, 2016)
For the Fiscal Year Ended June 30, 2017
Page 18 of 57

2017 2016
Cash Flows from Operating Activities:
Cash received from member agencies 43,123,993$ 52,042,284$
Cash paid to suppliers for goods and services and employees for services (23,564,270) (22,664,008)
Other cash received (paid) 301,911 257,434
Net Cash Provided (Used) by Operating Activities 19,861,634 29,635,710
Cash Flows from Capital and Related Financing Activities:
Cash received from member agencies other than for services 2,138,907 2,058,666
Cash received from grants 271,125 -
Cash paid for investment in real estate - (857)
Proceeds from capital debt 14,396,887 88,139,927
Interest paid on capital debt (8,161,620) (7,712,475)
Principal paid on capital debt (11,019,946) (60,795,599)
Purchases and construction of capital assets (30,856,221) (42,729,535)
Net Cash Provided (Used) by Capital and Related Financing Activities (33,230,868) (21,039,873)
Cash Flows from Investing Activities:
Investment income 111,718 503,952
Net Cash Provided (Used) by Investing Activities 111,718 503,952
Net Increase (Decrease) in Cash and Cash Equivalents (13,257,516) 9,099,789
Cash and Cash Equivalents Beginning 48,907,679 39,807,890
Cash and Cash Equivalents Ending 35,650,163$ 48,907,679$
Reconciliation of Operating Income (Loss) to Cash Flows Provided (Used)
by Operating Activities:
Operating Income (Loss) 7,161,123$ 19,535,260$
Adjustments to reconcile operating income (loss) to net cash provided
(used) by operating activities:
Depreciation 9,279,531 7,931,726
Amortization of issuance costs - 50,605
Depreciation and capital asset adjustments - (17,952)
Pension expense adjustment - GASB 68 (264,929) 650,160
Net change in:
Accounts receivable 6,050,834 780,069
Employee notes receivable (9,069) 8,790
Inventory (107,577) (149,011)
Prepaid expenses (160,447) (643)
Deposits 93,300 (413)
Net OPEB asset (635,345) (533,641)
Accounts payable (176,206) (76,500)
Accrued payroll and employee benefits (476,327) 147,368
Unearned revenue (949,164) 1,245,394
Accrued compensated absences 55,910 64,498
Net Cash Provided (Used) by Operating Activities 19,861,634$ 29,635,710$
The notes to basic financial statements are an integral part of this statement
Silicon Valley Clean Water
Statement of Cash Flows
(With Comparative Totals for the Fiscal Year Ended June 30, 2016)
For the Fiscal Year Ended June 30, 2017
Page 19 of 57

Silicon Valley Clean Water Notes to Financial Statements
June 30, 2017
NOTE 1 - NATURE OF ORGANIZATION Silicon Valley Clean Water (SVCW, or “the Authority”), formerly South Bayside System Authority, was founded in 1975 as the successor to the Strategic Consolidation Sewerage Plan. SVCW took title to all property of the Strategic Consolidation Sewerage Plan. SVCW maintains and operates sanitary sewerage pumping, transmission and outfall facilities constructed by the Strategic Consolidation Sewerage Plan. In addition, SVCW has constructed and is operating sewerage treatment plant facilities. The members of SVCW are the Cities of Belmont, Redwood City, San Carlos, and the West Bay Sanitary District. NOTE 2 - SUMMARY OF SIGNIFICANT ACCOUNTING POLICIES
Basis of Presentation and Accounting
All activities of SVCW are accounted for within enterprise funds. SVCW's financial statements include a Statement of Net Position, a Statement of Activities and Changes in Net Position and a Statement of Cash Flows. The financial statements are presented on an "economic resources" measurement focus and the accrual basis of accounting. Accordingly, all of SVCW's assets (including capital assets, as well as infrastructure assets), deferred outflows of resources, liabilities, deferred inflows of resources, and long-term liabilities are included in the accompanying Statement of Net Position. The Statement of Activities presents changes in net position. Under the accrual basis of accounting, revenues are recognized in the period in which they are earned while expenses are recognized in the period in which the liability is incurred.
Deferred outflows of resources is a consumption of net assets by SVCW that is applicable to a future reporting period. For example, prepaid items and deferred charges. Deferred inflows of resources is an acquisition of net assets by SVCW that is applicable to a future reporting period. For example, unearned revenue and advance collections. Unearned revenue arises when assets are received before revenue recognition criteria have been satisfied. Grants and entitlements received before eligibility requirements are met are recorded as deferred inflows from unearned revenue. SVCW applies all applicable GASB pronouncements for certain accounting and financial reporting guidance. In December of 2010, GASB issued GASB No. 62, Codification of Accounting and Financial Reporting Guidance Contained in Pre-November 30, 1989 FASB and AICPA Pronouncements. This statement incorporates pronouncements issued on or before November 30, 1989 into GASB authoritative literature. This includes pronouncements by the Financial Accounting Standards Board (FASB), Accounting Principles Board Opinions (APB), and the Accounting Research Bulletins of the American Institute of Certified Public Accountants' (AICPA) Committee on Accounting Procedure, unless those pronouncements conflict with or contradict with GASB pronouncements.
Statement of Net Position
The statement of net position is designed to display the financial position of SVCW. SVCW’s net position is classified into three categories as follows:
Net investment in capital assets - This component of net position consists of capital assets,
including restricted capital assets, net of accumulated depreciation and reduced by the outstanding balances of any bonds, notes, or other borrowings that are attributable to the acquisition, construction, or improvement of those assets. Deferred outflows of resources and
Page 20 of 57

Silicon Valley Clean Water Notes to Financial Statements
June 30, 2017
deferred inflows of resources that are attributable to the acquisition, construction, or improvement of those assets or related debt are also included in this component of net position, as applicable.
Restricted - This component of net position consists of constraints placed on an assets use through external constraints imposed by creditors (such as through debt covenants), grantors, contributors, or law and regulations of other governments, and reduced by liabilities and deferred inflows of resources related to those assets. It also pertains to constraints imposed by law or constitutional provisions or enabling legislation.
Unrestricted - This component of net position consists of the net amount of the assets, deferred outflows of resources, liabilities, and deferred inflows of resources that are not included in the determination of net investment in capital assets or the restricted component of net position. SVCW first applies restricted resources when an expense is incurred for purposes for which both restricted and unrestricted net position are available.
Statement of Revenues, Expenses, and Changes in Net Position The statement of revenues, expenses, and changes in net position is the operating statement for proprietary funds. This statement distinguishes between operating and non-operating revenues and expenses and presents a separate subtotal for operating revenues, operating expenses, and operating income. Operating revenues in the enterprise funds are those revenues that are generated from the primary operations of the fund. All other revenues are reported as non-operating revenues. Operating expenses are those expenses that are essential to the primary operations of the fund. All other expenses are reported as non-operating expenses.
Budgets and Budgetary Accounting SVCW adopted a one year budget which provides for the general operations of SVCW. Budgets are prepared on the accrual basis of accounting. Project-length financial plans are adopted for all capital projects. Cash and Cash Equivalents For the purposes of the statement of cash flows, cash represents balances that can be readily withdrawn without substantial notice or penalty. Cash equivalents are defined as short-term, highly liquid investments that are both readily convertible to known amounts of cash or so near their maturity that they present insignificant risk of changes in value because of changes in interest rates, and have an original maturity date of three months or less. In accordance with GASB Statement No. 40, Deposit and Investment Disclosures (Amendment of GASB No.3), certain disclosure requirements for deposits and investment risks were made in the areas of interest rate risk and credit risk. The credit risk disclosures include the following components; overall credit risk, custodial credit risk and concentrations of credit risk. In addition, other disclosures are specified including use of certain methods to present deposits and investments, highly sensitive investments, credit quality at year-end and other disclosures. Investments SVCW participates in various investments, including an investment pool managed by the State of California known as the Local Agency Investment Fund (LAIF), which has invested a portion of the pooled funds in structured notes and asset-backed securities. LAIF’s investments are subject to credit risk
Page 21 of 57

Silicon Valley Clean Water Notes to Financial Statements
June 30, 2017
with the full faith and credit of the State of California collateralizing these investments. In addition, the structured notes and asset-backed securities are subject to market risk as to change in interest rates. Investments are recorded at fair value in accordance with GASB Statement No. 72, Fair Value Measurement and Application. Accordingly, the change in fair value of investments is recognized as an increase or decrease to investment assets and investment income. This statement changed the definition of fair value and is effective for periods beginning after June 15, 2015. The following is a summary of the definition of fair value: Fair value is defined as the price that would be received to sell an asset or paid to transfer a liability in an orderly transaction. In determining this amount, three valuation techniques are available:
Market approach - This approach uses prices generated for identical or similar assets or liabilities. The most common example is an investment in a public security traded in an active exchange such as the NYSE.
Cost approach - This technique determines the amount required to replace the current asset. This
approach may be ideal for valuing donations of capital assets or historical treasures.
Income approach - This approach converts future amounts (such as cash flows) into a current discounted amount.
Each of these valuation techniques requires inputs to calculate a fair value. Observable inputs have been maximized in fair value measures, and unobservable inputs have been minimized. Receivables Receivables include amounts due from member assessments, services performed for other agencies, and from the state of California. All receivables are current and reported net of an allowance for uncollectible accounts. The allowance for uncollectible accounts was zero as of June 30, 2017. Inventories Inventories are valued using the average cost method. Inventories are recorded as expenses when consumed rather than when purchased. Capital Assets Property, plant and equipment purchased after June 30, 1992 are stated at cost. Prior acquisitions are stated at their appraised value as of June 30, 1992. Property, plant and equipment contributed to SVCW are stated at estimated fair value at the time of contribution. SVCW policy has set the capitalization threshold for reporting capital assets at $20,000. Depreciation is computed using the straight-line method over the estimated useful lives of the assets generally as outlined by the State Controller's Report on Fixed Assets. The purpose of depreciation is to spread the cost of plant and equipment equitably among all customers over the life of these assets, so that each customer's bill includes a pro rata share of the cost of these assets. The amount charged to depreciation expense each year represents that year's pro rata share of plant and equipment cost
Page 22 of 57

Silicon Valley Clean Water Notes to Financial Statements
June 30, 2017
Depreciation of all plant and equipment in service is charged as an expense against operations each year and the total amount of depreciation taken over the years, called accumulated depreciation, is reported on the statement of net position as a reduction in the book value of the capital assets. SVCW has assigned the useful lives listed below to plant and equipment:
Buildings and Structures 50-70 Pipelines 35 Pump Stations 7-25 Machinery and Equipment 5-10
Compensated Absences SVCW has a policy whereby an employee can accumulate unused vacation. Compensated absences are recorded as a liability when accrued. Accumulated vacation is computed using current employee accumulated vacation hours at current pay rates. SVCW does not offer payment for sick leave at termination or retirement. Pensions For purposes of measuring the net pension liability and deferred outflows/inflows of resources related to pensions, and pension expense, information about the fiduciary net position of the Authority’s California Public Employees’ Retirement System (CalPERS) plans (the Plans) and additions to/deductions from the Plans’ fiduciary net position have been determined on the same basis as they are reported by CalPERS. For this purpose, benefit payments (including refunds of employee contributions) are recognized when due and payable in accordance with the benefit terms. Investments are reported at fair value. Accounting Estimates The preparation of the financial statements in conformity with accounting principles generally accepted in the United States of America requires management to make estimates and assumptions that affect the amounts reported in the financial statements and accompanying notes. Subsequent Events Management has reviewed subsequent events and transactions that occurred after the date of the financial statements through the date the financial statements were issued. The financial statements include all events or transactions, including estimates, required to be recognized in accordance with generally accepted accounting principles. Management has determined that there are no non-recognized subsequent events that require additional disclosure, except as follows: New Accounting Pronouncements GASB Statement No. 77, Tax Abatement Disclosures. - Effective date: the requirements of this Statement are effective for reporting periods beginning after December 15, 2015 (earlier application was encouraged and was applied at the District).
Page 23 of 57

Silicon Valley Clean Water Notes to Financial Statements
June 30, 2017
This Statement requires governments that enter into tax abatement agreements to disclose the following information about the agreements:
Brief descriptive information, such as the tax being abated, the District under which tax abatements are provided, eligibility criteria, the mechanism by which taxes are abated, provisions for recapturing abated taxes, and the types of commitments made by tax abatement recipients
The gross dollar amount of taxes abated during the period Commitments made by a government, other than to abate taxes, as part of a tax abatement
agreement. The implementation of this statement did not have a significant impact on SVCW’s financial statements and did not result in any prior period restatements or adjustments. GASB Statement No. 78, Pensions Provided through Certain Multiple-Employer Defined Benefit Pension Plans - The objective of this Statement is to address a practice issue regarding the scope and applicability of GASB Statement No. 68, Accounting and Financial Reporting for Pensions. This issue is associated with pensions provided through certain multiple-employer defined benefit pension plans and to state or local governmental employers whose employees are provided with such pensions. Prior to the issuance of this GASB 78, the requirements of GASB 68 applied to the financial statements of all state and local governmental employers whose employees are provided with pensions through pension plans that are administered through trusts that meet the criteria in paragraph 4 of that statement. GASB 78 amends the scope and applicability of GASB 68 to exclude pensions provided to employees of state or local governmental employers through a cost-sharing multiple-employer defined benefit pension plan that (1) is not a state or local governmental pension plan, (2) is used to provide defined benefit pensions both to employees of state or local governmental employers and to employees of employers that are not state or local governmental employers, and (3) has no predominant state or local governmental employer (either individually or collectively with other state or local governmental employers that provide pensions through the pension plan). This Statement establishes requirements for recognition and measurement of pension expense, expenditures, and liabilities; note disclosures; and required supplementary information for pensions that have the characteristics described above. The implementation of this statement did not have a significant impact on SVCW’s financial statements and did not result in any prior period restatements or adjustments. Upcoming New Accounting Pronouncements GASB Statement No. 75, Accounting and Financial Reporting for Postemployment Benefits Other Than Pensions - The provisions in Statement 75 are effective for fiscal years beginning after June 15, 2017. The primary objective of this Statement is to improve accounting and financial reporting by state and local governments for postemployment benefits other than pensions (other postemployment benefits or OPEB). It also improves information provided by state and local governmental employers about financial support for OPEB that is provided by other entities. This Statement replaces the requirements of Statements No. 45, Accounting and Financial Reporting by Employers for Postemployment Benefits Other Than Pensions, as amended, and No. 57, OPEB Measurements by Agent Employers and Agent Multiple-Employer Plans, for OPEB. Statement No. 74, Financial Reporting for Postemployment Benefit Plans Other Than Pension Plans, establishes new accounting and financial reporting requirements for OPEB plans.
Page 24 of 57
Silicon Valley Clean Water Notes to Financial Statements
June 30, 2017
The scope of this Statement addresses accounting and financial reporting for OPEB that is provided to the employees of state and local governmental employers. This Statement establishes standards for recognizing and measuring liabilities, deferred outflows of resources, deferred inflows of resources, and expense/expenditures. For defined benefit OPEB, this Statement identifies the methods and assumptions that are required to be used to project benefit payments, discount projected benefit payments to their actuarial present value, and attribute that present value to periods of employee service. Note disclosure and required supplementary information requirements about defined benefit OPEB also are addressed. In addition, this Statement details the recognition and disclosure requirements for employers with payables to defined benefit OPEB plans that are administered through trusts that meet the specified criteria and for employers whose employees are provided with defined contribution OPEB. This Statement also addresses certain circumstances in which a nonemployer entity provides financial support for OPEB of employees of another entity. In this Statement, distinctions are made regarding the particular requirements depending upon whether the OPEB plans through which the benefits are provided are administered through trusts that meet the following criteria:
Contributions from employers and nonemployer contributing entities to the OPEB plan and earnings on those contributions are irrevocable.
OPEB plan assets are dedicated to providing OPEB to plan members in accordance with the benefit terms.
OPEB plan assets are legally protected from the creditors of employers, nonemployer contributing entities, the OPEB plan administrator, and the plan members.
SVCW is in the process of determining the impact this statement will have on the financial statements. GASB Statement No. 81, Irrevocable Split-Interest Agreements - The objective of this Statement is to improve accounting and financial reporting for irrevocable split-interest agreements by providing recognition and measurement guidance for situations in which a government is a beneficiary of the agreement. Split-interest agreements are a type of giving agreement used by donors to provide resources to two or more beneficiaries, including governments. Split-interest agreements can be created through trusts—or other legally enforceable agreements with characteristics that are equivalent to split-interest agreements—in which a donor transfers resources to an intermediary to hold and administer for the benefit of a government and at least one other beneficiary. Examples of these types of agreements include charitable lead trusts, charitable remainder trusts, and life-interests in real estate. This Statement requires that a government that receives resources pursuant to an irrevocable split-interest agreement recognize assets, liabilities, and deferred inflows of resources at the inception of the agreement. Furthermore, this Statement requires that a government recognize assets representing its beneficial interests in irrevocable split-interest agreements that are administered by a third party, if the government controls the present service capacity of the beneficial interests. This Statement requires that a government recognize revenue when the resources become applicable to the reporting period. The requirements of this Statement are effective for financial statements for periods beginning after December 15, 2016, and should be applied retroactively. Earlier application is encouraged. SVCW doesn’t believe this statement will have a significant impact on SVCW’s financial statements.
Page 25 of 57

Silicon Valley Clean Water Notes to Financial Statements
June 30, 2017
GASB Statement No. 82, Pension Issues - an amendment of GASB Statements No. 67, No. 68, and No. 73 - The objective of this Statement is to address certain issues that have been raised with respect to Statements No. 67, Financial Reporting for Pension Plans, No. 68, Accounting and Financial Reporting for Pensions, and No. 73, Accounting and Financial Reporting for Pensions and Related Assets That Are Not within the Scope of GASB Statement 68, and Amendments to Certain Provisions of GASB Statements 67 and 68. Specifically, this Statement addresses issues regarding (1) the presentation of payroll-related measures in required supplementary information, (2) the selection of assumptions and the treatment of deviations from the guidance in an Actuarial Standard of Practice for financial reporting purposes, and (3) the classification of payments made by employers to satisfy employee (plan member) contribution requirements. The requirements of this Statement are effective for reporting periods beginning after June 15, 2016, except for the requirements of GASB 82 for selection of assumptions in a circumstance in which an employer’s pension liability is measured as of a date other than the employer’s most recent fiscal year-end. In that circumstance, the requirements for the selection of assumptions are effective for that employer in the first reporting period in which the measurement date of the pension liability is on or after June 15, 2017. Earlier application is encouraged. SVCW doesn’t believe this statement will have a significant impact on SVCW’s financial statements. GASB Statement No. 83, Certain Asset Retirement Obligations - This Statement addresses accounting and financial reporting for certain asset retirement obligations (AROs). An ARO is a legally enforceable liability associated with the retirement of a tangible capital asset. A government that has legal obligations to perform future asset retirement activities related to its tangible capital assets should recognize a liability based on the guidance in this Statement. The requirements of this Statement are effective for financial statements for periods beginning after June 15, 2018. Earlier application is encouraged. SVCW doesn’t believe this statement will have a significant impact on SVCW’s financial statements. GASB Statement No. 84, Fiduciary Activities - The objective of this Statement is to improve guidance regarding the identification of fiduciary activities for accounting and financial reporting purposes and how those activities should be reported. This Statement establishes criteria for identifying fiduciary activities of all state and local governments. The focus of the criteria generally is on (1) whether a government is controlling the assets of the fiduciary activity and (2) the beneficiaries with whom a fiduciary relationship exists. Separate criteria are included to identify fiduciary component units and postemployment benefit arrangements that are fiduciary activities. The requirements of this Statement are effective for financial statements for periods beginning after December 15, 2018. Earlier application is encouraged. SVCW doesn’t believe this statement will have a significant impact on SVCW’s financial statements. GASB Statement No. 86, Certain Debt Extinguishment Issues - The primary objective of this Statement is to improve consistency in accounting and financial reporting for in-substance defeasance of debt by providing guidance for transactions in which cash and other monetary assets acquired with only existing resources—resources other than the proceeds of refunding debt—are placed in an irrevocable trust for the sole purpose of extinguishing debt. This Statement also improves accounting and financial reporting for prepaid insurance on debt that is extinguished and notes to financial statements for debt that is defeased in substance. The requirements of this Statement are effective for financial statements for periods beginning after June 15, 2017. Earlier application is encouraged. SVCW doesn’t believe this statement will have a significant impact on SVCW’s financial statements.
Page 26 of 57

Silicon Valley Clean Water Notes to Financial Statements
June 30, 2017
NOTE 3 - CASH AND INVESTMENTS SVCW’s cash and investments consisted of the following as of June 30, 2017 and 2016:
InvestmentCash and Investments June 30. 2017 June 30. 2016 Rating
Cash Deposits:Demand deposits 290,844$ 408,955$ n/aCash on hand 1,000 1,000 n/a
Total Cash Deposits 291,844 409,955 Investments:
US Treasuries 138,850 - n/aAgencies 25,366,854 18,636,582 A-/A3Commercial paper/corp bonds 2,398,117 2,672,468 A-/A3Municipal bonds/notes 3,911,208 2,307,210 A-/A3Money Market/Certificates of Deposit 2,026,757 6,435,233 n/aState of California Local Agency Investment 1,516,533 18,446,231 Not rated
Total Investments 35,358,319 48,497,724
Total Cash and Investments 35,650,163$ 48,907,679$
The following is a summary of the Authority’s cash and investments as of June 30, 2017:
Description Available Restricted Total
Cash and investments 30,047,972$ 5,602,191$ 35,650,163$
The following is a summary of the Authority’s investments by maturity as of June 30, 2017:
Maturity June 30. 2017 June 30. 20160-1 years 10,814,114$ 29,261,665$ 1-2 years 4,479,197 7,615,045 2-3 years 13,498,717 5,585,113 2-5 years 6,566,291 6,035,901
Total Investments 35,358,319$ 48,497,724$
Cash Deposits Interest bearing bank balances are insured up to $250,000 per bank by the Federal Deposit Insurance Company ("FDIC"). SVCW’s cash in bank did not exceed the insured limit as of June 30, 2017. All of SVCW’s deposits with financial institutions were held in collateralized accounts.
Page 27 of 57

Silicon Valley Clean Water Notes to Financial Statements
June 30, 2017
Fair Value Measurements GASB 72 established a hierarchy of inputs to the valuation techniques above. This hierarchy has three levels:
Level 1 inputs are quoted prices in active markets for identical assets or liabilities. Level 2 inputs are quoted market prices for similar assets or liabilities, quoted prices for identical
or similar assets or liabilities in markets that are not active, or other than quoted prices that are not observable
Level 3 inputs are unobservable inputs, such as a property valuation or an appraisal. The Entity has the following recurring fair value measurements as of June 30, 2017 and 2016:
California Local Agency Investment Fund (LAIF) of $1,516,533 and $18,446,231 were valued using Level 2 inputs.
Certificate of deposits and money market accounts of $2,026,757 and $6,435,233 were valued using Level 2 inputs.
Investments in agencies, commercial paper, corporate bonds, municipal bonds and notes of $31,815,029 and $23,616,260 were valued using Level 1 inputs.
Collateral and Categorization Requirements The California Government Code requires California banks and savings and loan associations to secure an agency’s deposits by pledging government securities as collateral. The market value of pledged securities must equal at least 110% of an agency’s deposits. California law also allows financial institutions to secure an agency’s deposits by pledging first trust deed mortgage notes having a value of at least 150% of an agency’s total deposits. Restricted Cash SVCW's restricted cash consisted of $5,602,191 in cash and investments as of June 30, 2017 held by trustees or fiscal agent, of which $5,063,980 is pledged for the payment or security of bonds. Local Agency Investment Fund LAIF allows local agencies such as SVCW to participate in a Pooled Money Investment Account managed by the State Treasurer’s Office and overseen by the Pooled Money Investment Board and State Treasurer investment committee. The Local Agency Investment Advisory Board oversees LAIF. The investments with LAIF are not classified for credit risk due to their diverse nature and are stated at cost, which approximates fair value. The total amount invested by all public agencies in LAIF, as of June 30, 2017, was approximately $77.6 billion. Of that amount, 99.23% is invested in non-derivative financial products and .77% in structured notes and asset-backed securities. Investment Policy SVCW's investment guidelines as defined by its written investment policy were approved by the Commission, who also establishes its implementation and direction. Monthly, the Board ratifies the investments that have been made.
Page 28 of 57

Silicon Valley Clean Water Notes to Financial Statements
June 30, 2017
SVCW’s investment policy follows the California Government Code which authorizes SVCW to invest in the following:
Maximum
MaximumInvestment in
One Authorized Investment Type Maturity Issuer Certificates of Deposit 1 years $ 2,000,000 Bankers' Acceptances 180 days 3,000,000 Commercial Paper 15 days 1,000,000 Treasury Bills, Notes and Bonds 5 years 2,000,000 Securities in U.S. Government Agencies 5 years - Passbook Savings Accounts - 250,000 Local Agency Investment Fund (LAIF) - 40,000,000
Risk Disclosures Limitations as they relate to interest rate risk, credit risk, and concentration of credit risk are described below: Interest Rate Risk - Interest rate risk is the risk that changes in market interest rates will adversely
affect the fair value of an investment. Generally, the longer the maturity of an investment, the greater the sensitivity of its fair value to the changes in market interest rates. In order to limit loss exposure due to Interest Rate Risk, the investment policy limits the length of maturity of investments.
Credit Risk - Credit risk is the risk of loss due to the failure of the security issuer. This is measured by
the assignment of a rating by a nationally recognized statistical rating organization. In order to limit loss exposure due to Credit Risk, the investment policy limits purchases of investments to those rated A-1 by Standard & Poor's or P-1 by Moody's Investors Service.
Custodial Credit Risk - Custodial credit risk is the risk that in the event of a bank failure, SVCW’s
deposits may not be returned to it. Or, in the case of investments, the risk of loss of the investment due failure, impairment or malfeasance of the third party whose name in which the investment is held and who has physical possession of the instrument. In order to limit loss exposure due to Custodial Credit Risk, the investment policy requires all securities be received and delivered using the standard delivery versus payment (DVP) procedure, and all securities be held by a third party bank or trust department under the terms of a custody or trustee agreement. None of SVCW's investments were subject to custodial credit risk.
Concentration of Credit Risk - See the chart above for SVCW’s limitations on the amount that can be
invested in any one issuer. As of June 30, 2017, 4% of SVCW’s cash was invested in LAIF, 71% in agencies, 7% in commercial paper and corporate bonds, 11% in municipal bonds and notes, 6% in money market accounts and government securities, and 1% was deposited in banks or was cash on hand.
Page 29 of 57

Silicon Valley Clean Water Notes to Financial Statements
June 30, 2017
NOTE 4 - EMPLOYEE NOTES RECEIVABLE All full-time and part-time SVCW employees are eligible to obtain an interest-free loan to purchase a computer or certain tools. All requests for loans must be approved by the Department Manager and Administrative Services Manager. Repayment of these loans is handled through payroll deductions which are spread equally over a two year period. Employees must pay off any outstanding balance of their loans upon ending employment with SVCW. As of June 30, 2017 and 2016, outstanding balances for notes receivable were $21,741 and $12,672, respectively. NOTE 5 - CAPITAL ASSETS (PROPERTY, PLANT AND EQUIPMENT) SVCW’s capital assets consisted of the following as of June 30, 2017:
Balance Adjustments/ BalanceCapital Assets July 01, 2016 Additions Deletions Transfer June 30, 2017Non-depreciable: Land 1,282,081$ -$ -$ -$ 1,282,081$
Construction in ProgressStage 2 2,867,123 67,306 - - 2,934,429 General 74,316,743 27,809,405 - (10,530,326) 91,595,822 Total Non-Depreciable 78,465,947 27,876,711 - (10,530,326) 95,812,332
Depreciable: Buildings and structures 77,638,983 - - 6,565,580 84,204,563 Pipelines 55,057,704 - - 93,300 55,151,004 Pump station 6,543,649 - (20,005) 544,872 7,068,516 Machinery and equipment 86,116,135 - (170,933) 3,326,574 89,271,776
Total Depreciable 225,356,471 - (190,938) 10,530,326 235,695,859 Less Accumulated Depreciation for:
Buildings and structures (32,934,853) (2,722,148) - - (35,657,001) Pipelines (6,469,594) (1,702,144) - - (8,171,738) Pump station (5,357,240) (154,532) 10,576 - (5,501,196) Machinery and equipment (26,438,085) (4,700,707) 132,161 - (31,006,631)
Total Accumulated Depreciation (71,199,772) (9,279,531) 142,737 - (80,336,566)
Total Depreciable PPE - Net 154,156,699 (9,279,531) (48,201) 10,530,326 155,359,293
Total PPE - Net 232,622,646$ 18,597,180$ (48,201)$ -$ 251,171,625$
Depreciation expense for the year ended June 30, 2017 and 2016 was $9,279,531 and $7,931,726, respectively.
Page 30 of 57

Silicon Valley Clean Water Notes to Financial Statements
June 30, 2017
NOTE 6 - NONCURRENT LIABILITIES SVCW’s noncurrent liabilities consisted of the following as of June 30, 2017:
Balance Balance Due Within
Description July 01, 2016 Additions Deductions June 30, 2017 One Year
Wastewater Revenue Bonds 133,330,000$ -$ 2,940,000$ 130,390,000 3,050,000$
Unamortized Premium 17,818,902 - 628,383 17,190,519 -
Note Payable 48,103,409 6,596,887 479,946 54,220,350 1,885,923
Line of Credit 3,300,000 7,800,000 7,600,000 3,500,000 -
Net Pension Obligation 8,367,022 5,641,649 2,471,720 11,536,951 -
Compensated Absences 757,644 55,911 - 813,555 813,555 Total Noncurrent Liabilities 211,676,977$ 20,094,447$ 14,120,049$ 217,651,375$ 5,749,478$
Wastewater Revenue Bonds SVCW’s Wastewater revenue bonds consisted of the following as of June 30, 2017:
Bonds BondsIssue Maturity Interest Original Outstanding OutstandingDate Date Rate Issue July 01, 2016 Issued Redeemed June 30, 2017
2009 Bond 2009 2039 1.74-8.1% 55,855,000$ 4,925,000$ -$ 1,160,000$ 3,765,000$
2014 Bond 2014 2044 3-5% 60,000,000 58,205,000 - 1,010,000 57,195,000
2015 Bond 2015 2045 2-5% 70,200,000 70,200,000 - 770,000 69,430,000 Total Wastewater Revenue Bonds 186,055,000$ 133,330,000$ -$ 2,940,000$ 130,390,000$
Waterwater Revenue Bond
2009 Wastewater Revenue Bonds In July 2009, SVCW issued $55,855,000 of Revenue Bonds. The Bonds were issued to finance the acquisition and construction of capital improvements to SVCW's wastewater system; fund the debt service reserve fund, and pay costs of issuing the Bonds. The Bonds are limited obligations of SVCW which are payable solely from and secured solely by the revenues pledged under the indenture, consisting primarily of payments made by the City of Redwood, the City of San Carlos, and the West Bay Sanitary District (the "Participating Members”). Annual principal and interest payments on the bonds are expected to require less than 10 percent of net revenues. 2014 Wastewater Revenue Bonds In March 2014, SVCW issued $60,000,000 of Revenue Bonds. The Bonds were issued to finance the acquisition and construction of capital improvements to SVCW's wastewater system and pay costs of issuing the Bonds. The Bonds are limited obligations of SVCW which are payable solely from and secured solely by the revenues pledged under the indenture, consisting primarily of payments made by the City of Redwood, the City of San Carlos, and the West Bay Sanitary District (the "Participating Members”). Annual principal and interest payments on the bonds are expected to require less than 10 percent of net revenues. 2015 Wastewater Revenue Bonds Wastewater Revenue Bonds in the amount of $70,200,000 were executed on November 24, 2015. The funds were used to refund the Authority's current outstanding Wastewater Revenue Bonds captioned 2008 Wastewater Revenue Bonds and 2009 Build America Bonds, and to finance certain improvements to the Authority's
Page 31 of 57
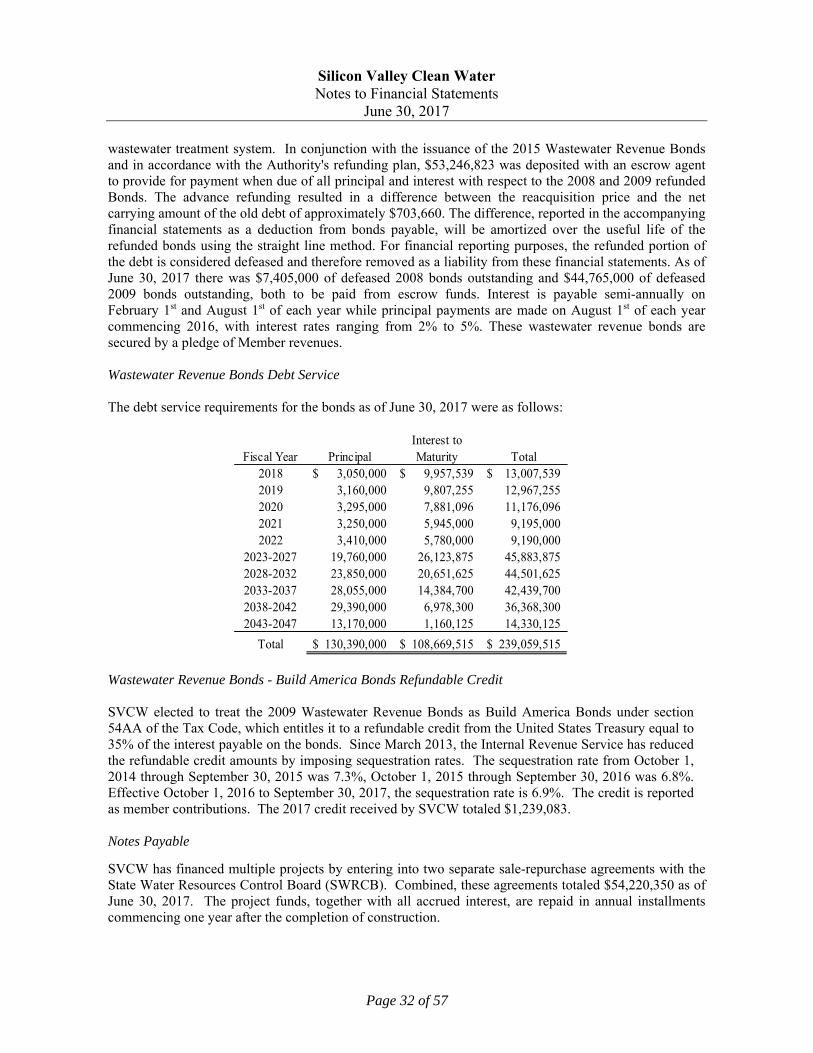
Silicon Valley Clean Water Notes to Financial Statements
June 30, 2017
wastewater treatment system. In conjunction with the issuance of the 2015 Wastewater Revenue Bonds and in accordance with the Authority's refunding plan, $53,246,823 was deposited with an escrow agent to provide for payment when due of all principal and interest with respect to the 2008 and 2009 refunded Bonds. The advance refunding resulted in a difference between the reacquisition price and the net carrying amount of the old debt of approximately $703,660. The difference, reported in the accompanying financial statements as a deduction from bonds payable, will be amortized over the useful life of the refunded bonds using the straight line method. For financial reporting purposes, the refunded portion of the debt is considered defeased and therefore removed as a liability from these financial statements. As of June 30, 2017 there was $7,405,000 of defeased 2008 bonds outstanding and $44,765,000 of defeased 2009 bonds outstanding, both to be paid from escrow funds. Interest is payable semi-annually on February 1st and August 1st of each year while principal payments are made on August 1st of each year commencing 2016, with interest rates ranging from 2% to 5%. These wastewater revenue bonds are secured by a pledge of Member revenues. Wastewater Revenue Bonds Debt Service The debt service requirements for the bonds as of June 30, 2017 were as follows:
Interest toFiscal Year Principal Maturity Total
2018 3,050,000$ 9,957,539$ 13,007,539$ 2019 3,160,000 9,807,255 12,967,255 2020 3,295,000 7,881,096 11,176,096 2021 3,250,000 5,945,000 9,195,000 2022 3,410,000 5,780,000 9,190,000
2023-2027 19,760,000 26,123,875 45,883,875 2028-2032 23,850,000 20,651,625 44,501,625 2033-2037 28,055,000 14,384,700 42,439,700 2038-2042 29,390,000 6,978,300 36,368,300 2043-2047 13,170,000 1,160,125 14,330,125
Total 130,390,000$ 108,669,515$ 239,059,515$
Wastewater Revenue Bonds - Build America Bonds Refundable Credit SVCW elected to treat the 2009 Wastewater Revenue Bonds as Build America Bonds under section 54AA of the Tax Code, which entitles it to a refundable credit from the United States Treasury equal to 35% of the interest payable on the bonds. Since March 2013, the Internal Revenue Service has reduced the refundable credit amounts by imposing sequestration rates. The sequestration rate from October 1, 2014 through September 30, 2015 was 7.3%, October 1, 2015 through September 30, 2016 was 6.8%. Effective October 1, 2016 to September 30, 2017, the sequestration rate is 6.9%. The credit is reported as member contributions. The 2017 credit received by SVCW totaled $1,239,083.
Notes Payable SVCW has financed multiple projects by entering into two separate sale-repurchase agreements with the State Water Resources Control Board (SWRCB). Combined, these agreements totaled $54,220,350 as of June 30, 2017. The project funds, together with all accrued interest, are repaid in annual installments commencing one year after the completion of construction.
Page 32 of 57
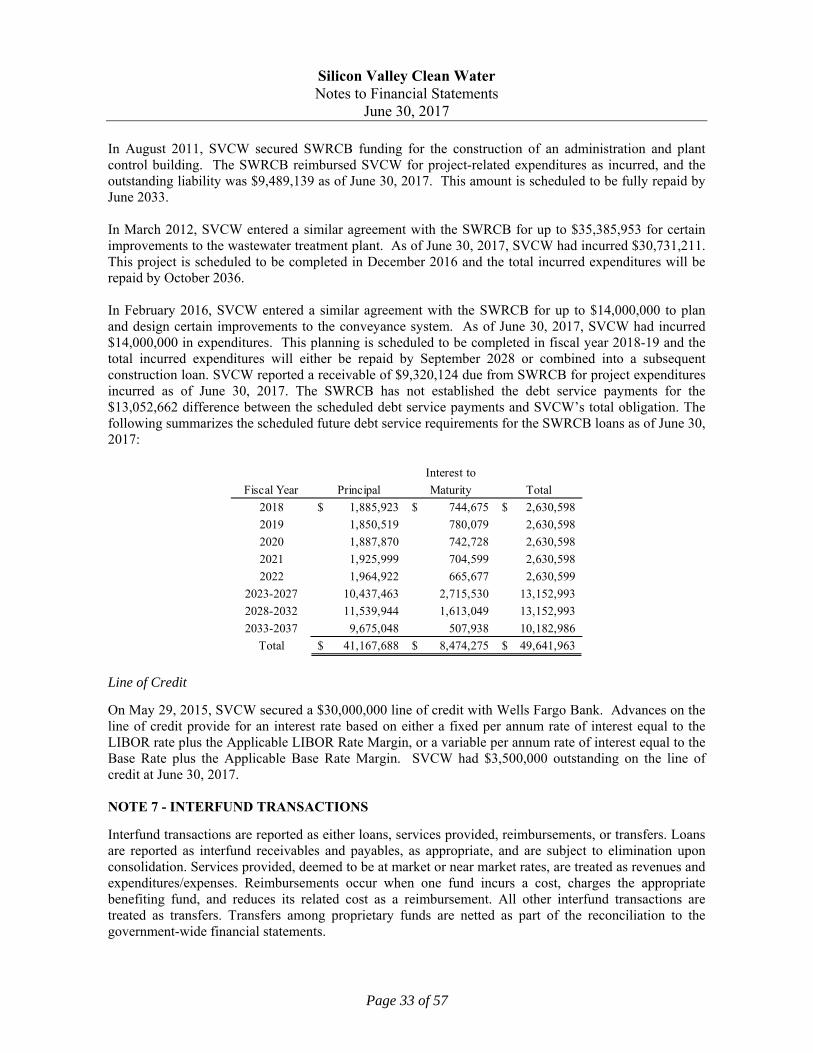
Silicon Valley Clean Water Notes to Financial Statements
June 30, 2017
In August 2011, SVCW secured SWRCB funding for the construction of an administration and plant control building. The SWRCB reimbursed SVCW for project-related expenditures as incurred, and the outstanding liability was $9,489,139 as of June 30, 2017. This amount is scheduled to be fully repaid by June 2033. In March 2012, SVCW entered a similar agreement with the SWRCB for up to $35,385,953 for certain improvements to the wastewater treatment plant. As of June 30, 2017, SVCW had incurred $30,731,211. This project is scheduled to be completed in December 2016 and the total incurred expenditures will be repaid by October 2036. In February 2016, SVCW entered a similar agreement with the SWRCB for up to $14,000,000 to plan and design certain improvements to the conveyance system. As of June 30, 2017, SVCW had incurred $14,000,000 in expenditures. This planning is scheduled to be completed in fiscal year 2018-19 and the total incurred expenditures will either be repaid by September 2028 or combined into a subsequent construction loan. SVCW reported a receivable of $9,320,124 due from SWRCB for project expenditures incurred as of June 30, 2017. The SWRCB has not established the debt service payments for the $13,052,662 difference between the scheduled debt service payments and SVCW’s total obligation. The following summarizes the scheduled future debt service requirements for the SWRCB loans as of June 30, 2017:
Line of Credit On May 29, 2015, SVCW secured a $30,000,000 line of credit with Wells Fargo Bank. Advances on the line of credit provide for an interest rate based on either a fixed per annum rate of interest equal to the LIBOR rate plus the Applicable LIBOR Rate Margin, or a variable per annum rate of interest equal to the Base Rate plus the Applicable Base Rate Margin. SVCW had $3,500,000 outstanding on the line of credit at June 30, 2017. NOTE 7 - INTERFUND TRANSACTIONS Interfund transactions are reported as either loans, services provided, reimbursements, or transfers. Loans are reported as interfund receivables and payables, as appropriate, and are subject to elimination upon consolidation. Services provided, deemed to be at market or near market rates, are treated as revenues and expenditures/expenses. Reimbursements occur when one fund incurs a cost, charges the appropriate benefiting fund, and reduces its related cost as a reimbursement. All other interfund transactions are treated as transfers. Transfers among proprietary funds are netted as part of the reconciliation to the government-wide financial statements.
Interest to
Fiscal Year Principal Maturity Total
2018 1,885,923$ 744,675$ 2,630,598$
2019 1,850,519 780,079 2,630,598
2020 1,887,870 742,728 2,630,598
2021 1,925,999 704,599 2,630,598
2022 1,964,922 665,677 2,630,599
2023-2027 10,437,463 2,715,530 13,152,993
2028-2032 11,539,944 1,613,049 13,152,993
2033-2037 9,675,048 507,938 10,182,986
Total 41,167,688$ 8,474,275$ 49,641,963$
Page 33 of 57

Silicon Valley Clean Water Notes to Financial Statements
June 30, 2017
Interfund Due-to/from Interfund receivables and payables as of June 30, 2017 were as follows:
Fund Description Due From Due ToOperations 9,073,378$ -$ Capital Improvement Program - 7,223,378 Recycled Water 63,722 - Self Insurance 212,342 - Construction Stage 2 958,256 - Capital Improvements 5,385,125 - Capital Improvement Program Reserve - 11,702,307 Operating Reserve 3,232,862 -
Totals 18,925,685$ 18,925,685$
Interfund Transfers Interfund transfers consist of transfers from funds receiving revenue to funds through which the resources are to be expended and transfers of capital assets upon completion of construction. Interfund transfers for the June 30, 2017 fiscal year were as follows:
Fund Description Transfers In Transfers Out
Operations 10,530,326 -$
Capital Improvement Program - 9,462,352
Capital Improvements - 1,067,974
Totals 10,530,326$ 10,530,326$
NOTE 8 - DEFINED BENEFIT PENSION PLAN
General Information about the Pension Plans Plan Description - All qualified permanent and probationary employees are eligible to participate in the Agency’s Miscellaneous Employee Pension Plans (the Plans); cost-sharing multiple employer defined benefit pension plans administered by the California Public Employees’ Retirement System (CalPERS). Benefit provisions under the Plans are established by State statute and Agency resolution. CalPERS issues publicly available reports that include a full description of the pension plans regarding benefit provisions, assumptions and membership information that can be found on the CalPERS website. Benefits Provided - CalPERS provides service retirement and disability benefits, annual cost of living adjustments and death benefits to plan members, who must be public employees and beneficiaries. Benefits are based on years of credited service, equal to one year of full time employment. Members with five years of total service are eligible to retire at age 55 with statutorily reduced benefits. All members are eligible for non-duty disability benefits after 10 years of service. The death benefit is one of the following: the Basic Death Benefit, the 1957 Survivor Benefit, or the Optional Settlement 2W Death Benefit. The cost of living adjustments for the Plans are applied as specified by the Public Employees’ Retirement Law.
Page 34 of 57
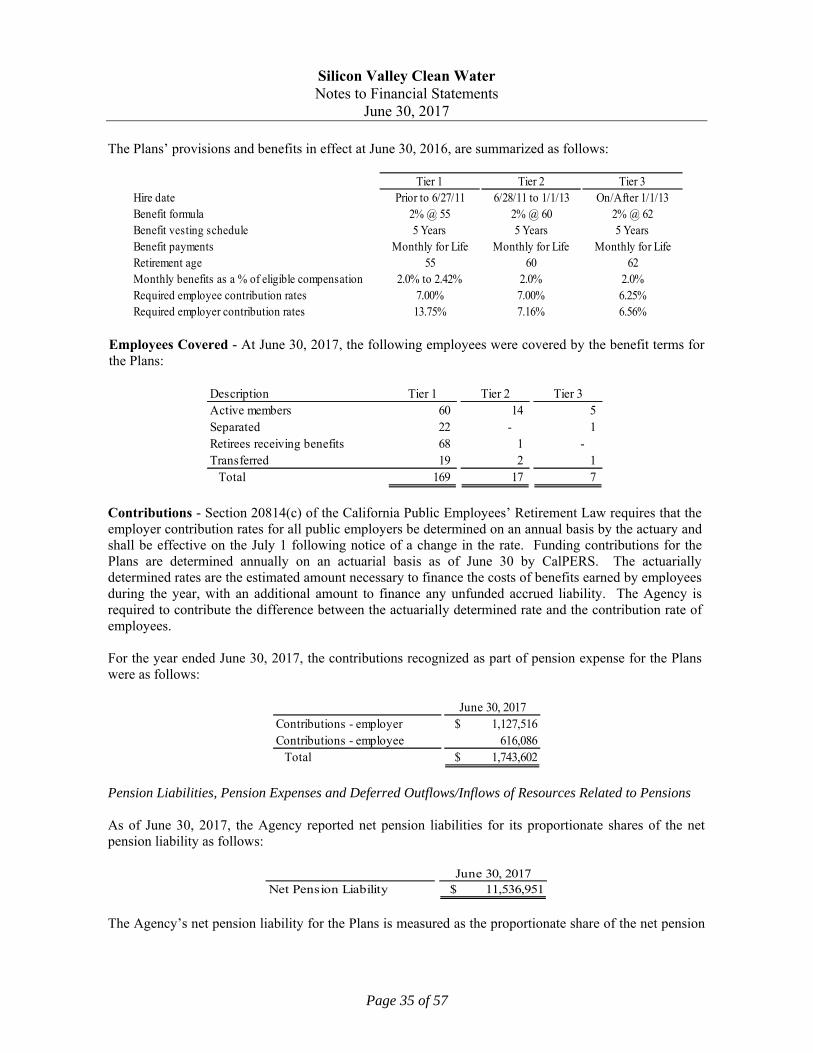
Silicon Valley Clean Water Notes to Financial Statements
June 30, 2017
The Plans’ provisions and benefits in effect at June 30, 2016, are summarized as follows:
Tier 1 Tier 2 Tier 3Hire date Prior to 6/27/11 6/28/11 to 1/1/13 On/After 1/1/13Benefit formula 2% @ 55 2% @ 60 2% @ 62Benefit vesting schedule 5 Years 5 Years 5 YearsBenefit payments Monthly for Life Monthly for Life Monthly for LifeRetirement age 55 60 62Monthly benefits as a % of eligible compensation 2.0% to 2.42% 2.0% 2.0%Required employee contribution rates 7.00% 7.00% 6.25%Required employer contribution rates 13.75% 7.16% 6.56%
Employees Covered - At June 30, 2017, the following employees were covered by the benefit terms for the Plans:
Description Tier 1 Tier 2 Tier 3Active members 60 14 5 Separated 22 - 1 Retirees receiving benefits 68 1 - Transferred 19 2 1
Total 169 17 7
Contributions - Section 20814(c) of the California Public Employees’ Retirement Law requires that the employer contribution rates for all public employers be determined on an annual basis by the actuary and shall be effective on the July 1 following notice of a change in the rate. Funding contributions for the Plans are determined annually on an actuarial basis as of June 30 by CalPERS. The actuarially determined rates are the estimated amount necessary to finance the costs of benefits earned by employees during the year, with an additional amount to finance any unfunded accrued liability. The Agency is required to contribute the difference between the actuarially determined rate and the contribution rate of employees. For the year ended June 30, 2017, the contributions recognized as part of pension expense for the Plans were as follows:
June 30, 2017Contributions - employer $ 1,127,516 Contributions - employee 616,086
Total $ 1,743,602
Pension Liabilities, Pension Expenses and Deferred Outflows/Inflows of Resources Related to Pensions As of June 30, 2017, the Agency reported net pension liabilities for its proportionate shares of the net pension liability as follows:
June 30, 2017Net Pension Liability $ 11,536,951
The Agency’s net pension liability for the Plans is measured as the proportionate share of the net pension
Page 35 of 57

Silicon Valley Clean Water Notes to Financial Statements
June 30, 2017
liability. The net pension liability of the Plan are measured as of June 30, 2016, and the total pension liability for the Plans used to calculate the net pension liability was determined by an actuarial valuation as of June 30, 2015 rolled forward to June 30, 2016 using standard update procedures. The Agency’s proportion of the net pension liability was based on a projection of the Agency’s long-term share of contributions to the pension plans relative to the projected contributions of all participating employers, actuarially determined. The Agency’s proportionate share of the net pension liability for the Plans as of June 30, 2015 and 2016 was as follows:
Proportion of Net Pension Liability
June 30, 2016 0.3050%June 30, 2017 0.3321%
Change in Proportions 0.0271%
For the year ended June 30, 2017, the Agency recognized pension expense of $986,288. At June 30, 2017, the Agency reported deferred outflows of resources and deferred inflows of resources related to pensions from the following sources:
Deferred Outflows of Resources
Deferred Inflows of Resources
1,251,217$ -$ Changes in assumptions - (382,091)
31,132 -
338,250 (970,814)
1,988,657 -
3,609,256$ (1,352,905)$
proportionate share of contributionsNet differences between projected and actual earnings
on plan investments
Total
Pension contributions subsequent to measurement date
Differences between expected and actual experiencesChange in employer's proportion and differences between
the employer’s contributions and the employer’s
The Agency reported $1,251,217 as deferred outflows of resources related to contributions subsequent to the measurement date that will be recognized as a reduction of the net pension liability in the year ended June 30, 2018. Other amounts reported as deferred outflows of resources and deferred inflows of resources related to pensions will be recognized as pension expense as follows:
Fiscal Year Ending:
Deferred Outflows/(inflows)
of Resources2018 (356,039)$ 2019 (45,077) 2020 891,166 2021 515,085
Total 1,005,135$
Page 36 of 57
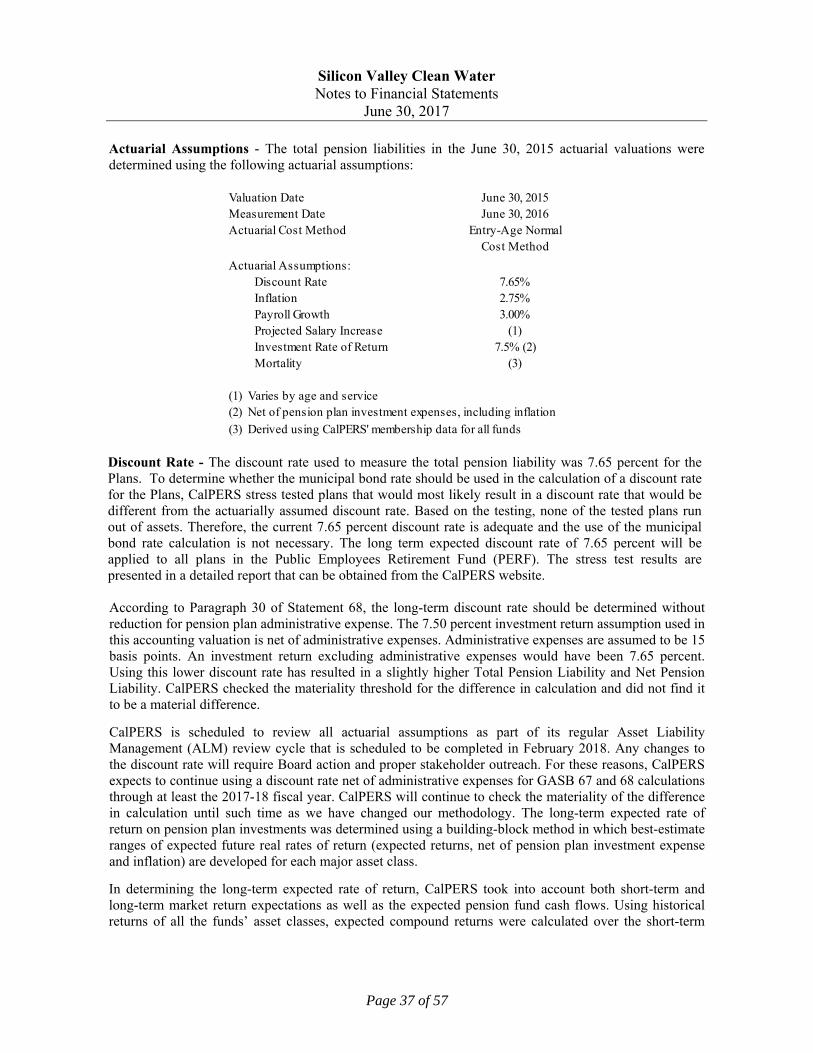
Silicon Valley Clean Water Notes to Financial Statements
June 30, 2017
Actuarial Assumptions - The total pension liabilities in the June 30, 2015 actuarial valuations were determined using the following actuarial assumptions:
Discount Rate - The discount rate used to measure the total pension liability was 7.65 percent for the Plans. To determine whether the municipal bond rate should be used in the calculation of a discount rate for the Plans, CalPERS stress tested plans that would most likely result in a discount rate that would be different from the actuarially assumed discount rate. Based on the testing, none of the tested plans run out of assets. Therefore, the current 7.65 percent discount rate is adequate and the use of the municipal bond rate calculation is not necessary. The long term expected discount rate of 7.65 percent will be applied to all plans in the Public Employees Retirement Fund (PERF). The stress test results are presented in a detailed report that can be obtained from the CalPERS website. According to Paragraph 30 of Statement 68, the long-term discount rate should be determined without reduction for pension plan administrative expense. The 7.50 percent investment return assumption used in this accounting valuation is net of administrative expenses. Administrative expenses are assumed to be 15 basis points. An investment return excluding administrative expenses would have been 7.65 percent. Using this lower discount rate has resulted in a slightly higher Total Pension Liability and Net Pension Liability. CalPERS checked the materiality threshold for the difference in calculation and did not find it to be a material difference. CalPERS is scheduled to review all actuarial assumptions as part of its regular Asset Liability Management (ALM) review cycle that is scheduled to be completed in February 2018. Any changes to the discount rate will require Board action and proper stakeholder outreach. For these reasons, CalPERS expects to continue using a discount rate net of administrative expenses for GASB 67 and 68 calculations through at least the 2017-18 fiscal year. CalPERS will continue to check the materiality of the difference in calculation until such time as we have changed our methodology. The long-term expected rate of return on pension plan investments was determined using a building-block method in which best-estimate ranges of expected future real rates of return (expected returns, net of pension plan investment expense and inflation) are developed for each major asset class. In determining the long-term expected rate of return, CalPERS took into account both short-term and long-term market return expectations as well as the expected pension fund cash flows. Using historical returns of all the funds’ asset classes, expected compound returns were calculated over the short-term
Valuation Date June 30, 2015Measurement Date June 30, 2016Actuarial Cost Method Entry-Age Normal
Cost Method
Actuarial Assumptions:Discount Rate 7.65%Inflation 2.75%Payroll Growth 3.00%Projected Salary Increase (1)Investment Rate of Return 7.5% (2)Mortality (3)
(3) Derived using CalPERS' membership data for all funds
(1) Varies by age and service(2) Net of pension plan investment expenses, including inflation
Page 37 of 57

Silicon Valley Clean Water Notes to Financial Statements
June 30, 2017
(first 10 years) and the long-term (11-60 years) using a building-block approach. Using the expected nominal returns for both short-term and long-term, the present value of benefits was calculated for each fund. The expected rate of return was set by calculating the single equivalent expected return that arrived at the same present value of benefits for cash flows as the one calculated using both short-term and long-term returns. The expected rate of return was then set equivalent to the single equivalent rate calculated above and rounded down to the nearest one quarter of one percent. The table below reflects the long-term expected real rate of return by asset class. The rate of return was calculated using the capital market assumptions applied to determine the discount rate and asset allocation. These rates of return are net of administrative expenses.
Sensitivity of the Proportionate Share of the Net Pension Liability to Changes in the Discount Rate - The following presents the Agency’s proportionate share of the net pension liability for the Plans, calculated using the discount rate for the Plans, as well as what the Agency’s proportionate share of the net pension liability would be if it were calculated using a discount rate that is 1-percentage point lower or 1-percentage point higher than the current rate:
1% Decrease 6.65%Net Pension Liability $ 18,727,001
Current Discount Rate 7.65%Net Pension Liability $ 11,536,951
1% Increase 8.65%Net Pension Liability $ 5,594,732
Pension Plan Fiduciary Net Position - Detailed information about each pension plan’s fiduciary net position is available in the separately issued CalPERS financial reports.
NewStrategic Real Return Real Return
Asset Class Allocation Years 1 - 10 (a) Years 11+ (b)
Global Equity 51.00% 5.25% 5.71%Global Fixed Income 20.00% 0.99% 2.43%Inflation Sensitive 6.00% 0.45% 3.36%Private Equity 10.00% 6.83% 6.95%Real Estate 10.00% 4.50% 5.13%Infrastructure and Forestland 2.00% 4.50% 5.09%Liquidity 1.00% -0.55% -1.05%
Total 100.00%
(b) An expected inflation of 3.0% used for this period.(a) An expected inflation of 2.5% used for this period.
Page 38 of 57

Silicon Valley Clean Water Notes to Financial Statements
June 30, 2017
NOTE 9 - OTHER POST EMPLOYMENT BENEFITS (OPEB) Plan Description SVCW’s Retiree Healthcare Plan (the Plan) is a single-employer defined benefit healthcare plan administered by SVCW. The plan provides healthcare benefits to eligible retirees and their dependents. Benefit provisions are established and may be amended through agreements and memorandums of understanding between SVCW, its management employees, and unions representing SVCW employees.
Funding Policy There is no statutory requirement for SVCW to prefund its OPEB obligation. SVCW has currently chosen to fund the program by depositing the Annual Required Contribution (ARC) into a trust fund administered by CalPERS. There are no employee contributions. For the fiscal year ending June 30, 2017, SVCW paid $329,595 for retiree healthcare plan benefits and contributed $420,000 in the OPEB trust fund. The ARC is an amount actuarially determined in accordance with the parameters of GASB Statement 45. The ARC is equal to the normal cost plus a 30-year amortization of the unfunded actuarial liability.
Eligibility Age 50
Service Required 5 years
Benefit Amount Was $125 monthly in 2016, $128 in 2017. Increases with the healthcare component of the Consumer Price Index thereafter. For union employees, the reimbursable amount decreases when the employee reaches Medicare eligibility age, or to the Bay Area Kaiser combination rate when the employee's spouse becomes Medicare eligible before the retiree.
Benefits End Paid for life (child benefits end at age 26)
Eligibility Age 50
Service Required 5 years
Benefit Amount Payment of any pre-Medicare PERS premium to a maximum of the Kaiser family premiums. With Medicare, the Kaiser Medicare premiums are the caps.
Benefits End Paid for life (child benefits end at age 26)
Eligibility Age 50
Service Required 5 years
Benefit Amount Same as for post-retirement death
Disability Benefit Same as retirement benefits shown above if service requirements are met.
Note: Employees hired after January 31, 2011 receive only the PERS Minimum.
PERS (PEMHCA) Minimum
Normal Retirement Benefit
Post-Retirement Death BenefitPayment of one-party or two-party premium to eligible surviving spouse/beneficiary for the life of the survivors. Child benefits cease at age 26. Same benefit limitation as above.
Pre-Retirement Death Benefit
Page 39 of 57
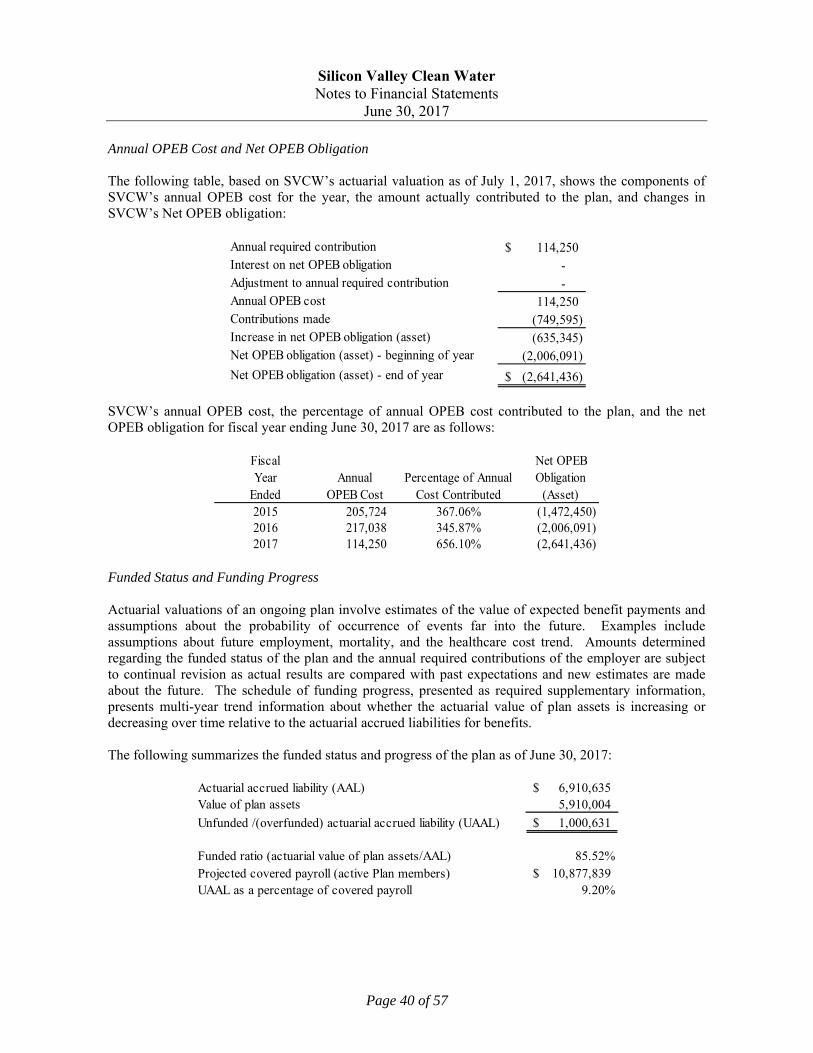
Silicon Valley Clean Water Notes to Financial Statements
June 30, 2017
Annual OPEB Cost and Net OPEB Obligation The following table, based on SVCW’s actuarial valuation as of July 1, 2017, shows the components of SVCW’s annual OPEB cost for the year, the amount actually contributed to the plan, and changes in SVCW’s Net OPEB obligation:
Annual required contribution 114,250$ Interest on net OPEB obligation - Adjustment to annual required contribution - Annual OPEB cost 114,250 Contributions made (749,595) Increase in net OPEB obligation (asset) (635,345) Net OPEB obligation (asset) - beginning of year (2,006,091)
Net OPEB obligation (asset) - end of year (2,641,436)$
SVCW’s annual OPEB cost, the percentage of annual OPEB cost contributed to the plan, and the net OPEB obligation for fiscal year ending June 30, 2017 are as follows:
Fiscal Net OPEBYear Annual Percentage of Annual Obligation
Ended OPEB Cost Cost Contributed (Asset)2015 205,724 367.06% (1,472,450) 2016 217,038 345.87% (2,006,091) 2017 114,250 656.10% (2,641,436)
Funded Status and Funding Progress Actuarial valuations of an ongoing plan involve estimates of the value of expected benefit payments and assumptions about the probability of occurrence of events far into the future. Examples include assumptions about future employment, mortality, and the healthcare cost trend. Amounts determined regarding the funded status of the plan and the annual required contributions of the employer are subject to continual revision as actual results are compared with past expectations and new estimates are made about the future. The schedule of funding progress, presented as required supplementary information, presents multi-year trend information about whether the actuarial value of plan assets is increasing or decreasing over time relative to the actuarial accrued liabilities for benefits. The following summarizes the funded status and progress of the plan as of June 30, 2017:
Actuarial accrued liability (AAL) 6,910,635$ Value of plan assets 5,910,004
Unfunded /(overfunded) actuarial accrued liability (UAAL) 1,000,631$
Funded ratio (actuarial value of plan assets/AAL) 85.52%Projected covered payroll (active Plan members) 10,877,839$ UAAL as a percentage of covered payroll 9.20%
Page 40 of 57

Silicon Valley Clean Water Notes to Financial Statements
June 30, 2017
Actuarial Methods and Assumptions Projections of benefits for financial reporting purposes are based on the substantive plan (the plan as understood by the employer and the plan members) and include the types of benefits provided at the time of each valuation and the historical pattern of sharing of benefit costs between the employer and plan members to that point. The actuarial methods and assumptions used are consistent with the long-term perspective of the calculations. In the actuarial valuation, the Projected Unit Credit actuarial cost method was used. The actuarial assumptions included a 7% investment rate of return, which is the expected long-term investment return on SVCW investments, a 2.75% general inflation assumption, and an annual aggregate payroll increase rate of 2.75%. The UAAL is being amortized as a level dollar amount over 30 years on a closed basis, beginning in 2009. Required Supplementary Information The following is the actuarially determined schedule of funding progress for the postemployment healthcare plan:
ActuarialAccrued UAAL as
Actuarial Liability Unfunded a PercentageActuarial Value of (AAL) AAL Funded Covered of CoveredValuation Assets Entry Age (UAAL) Ratio Payroll Payroll
Date (a) (b) (b-a) (a/b) (c) ((b-a/c))7/1/2013 3,976,332$ 7,163,800$ 3,187,468$ 55.51% 8,696,205$ 36.65%7/1/2015 4,401,750 6,931,933 2,530,183 63.50% 9,703,545 26.07%7/1/2017 5,910,004 6,910,635 1,000,631 85.52% 10,877,839 9.20%
NOTE 10 - RISK MANAGEMENT SVCW is a member of the California Sanitation Risk Management Authority (CSRMA) which covers the general liability claims up to $10,750,000, and provides coverage of Employment Practices Liability (EPL) up to $10,750,000. Excess public entity general liability insurance of $10,750,000 is obtained by CSRMA commercially, resulting in a total coverage of $25,000,000. SVCW has a self-insured retention of $10,000 per general liability claim and $25,000 per EPL claim. Once SVCW's self-insured retention is met, CSRMA becomes responsible for payment of all claims up to the limit. SVCW also has workers’ compensation insurance with CSRMA which covers workers' compensation claims up to $750,000. Excess public entity workers' compensation and employee's liability insurance are obtained by CSRMA commercially up to statutory limit and $25,000,000 respectively. SVCW has a self-insured retention of $750,000 per claim. The contributions made to each risk pool equal the ratio of their respective payrolls to the total payrolls of all entities participating in the same layer of each program, in each program year. Actual surpluses or losses are shared according to a formula developed from overall loss costs and spread to member entities on a percentage basis after retrospective rating. CSRMA's audited financial statements may be obtained by writing them at c/o Alliant Insurance Services, 100 Pine Street, 11th Floor, San Francisco, CA 94111.
Page 41 of 57

Silicon Valley Clean Water Notes to Financial Statements
June 30, 2017
NOTE 11 - COMMITMENTS AND CONTINGENCIES SVCW is at risk to be a defendant in various lawsuits which arise in the normal course of business. The final disposition of these legal actions ad claims was not determinable. However, in the opinion of management, the outcome of any litigation of these matters will not have a material effect on the financial position or changes in net position of the SVCW.
SVCW had outstanding construction contract commitments on capital projects totaling $9,063,374 at June 30, 2017.
Page 42 of 57

REQUIRED SUPPLEMENTARY INFORMATION
Page 43 of 57

2017 2016 2015
Contractually Required Contributions (Actuarially Determined) 1,251,217$ 1,127,516$ 1,031,475$
Contributions in Relation to Actuarially Determined Contributions 1,251,217 1,127,516 1,031,475
Contribution Deficiency (Excess) - - -
Covered Employee Payroll 10,137,714$ 9,454,067$ 9,115,492$
Contributions as a Percentage of Covered Payroll 12.34% 11.93% 11.32%
Notes to Schedule:
Valuation Date: June 30, 2015
Assumptions Used: Entry Age Method used for Actuarial Cost Method
Level Percentage of Payroll (Closed) Used Amortization Method
3.7 Years Remaining Amortization Period
Inflation Assumed at 2.75%
Investment Rate of Returns set at 7.5%
CalPERS mortality table using 20 years of membership data for all funds
** Fiscal year 2015 was the first year of implementation, therefore only three years are shown.
Silicon Valley Clean Water
Schedule of Pension Contributions - CalPERS
For the Fiscal Year Ended June 30, 2017
Page 44 of 57

2017 2016 2015
Proportion of Net Pension Liability 0.33211% 0.30498% 0.32474%
Proportionate Share of Net Pension Liability 11,536,951$ 8,367,040$ 8,025,843$
Covered Employee Payroll 10,137,714$ 9,454,067$ 9,115,492$
Proportionate Share of NPL
as a % of Covered Employee Payroll 113.80% 88.50% 88.05%
Plan's Fiduciary Net Position as a % of the TPL 78.40% 83.30% 84.62%
** Fiscal year 2015 was the first year of implementation, therefore only three years are shown.
Silicon Valley Clean Water
Schedule of Proportionate Share of Net Pension Liability
For the Fiscal Year Ended June 30, 2017
Page 45 of 57

This page intentionally left blank

SUPPLEMENTARY INFORMATION
Page 46 of 57

Capital
Improvement
Operating Program Capital Construction
Assets Reserve Reserve Improvements Stage 2
Current Assets:
Cash and investments 3,491,621$ 16,094,733$ -$ 9,220,579$
Accounts receivable - - - 461,215
Interest receivable - - - -
Employee notes receivable - - - -
Deposits - - - -
Due from other funds 3,232,862 - 5,385,125 958,256
Inventory - - - -
Prepaid expenses - - - -
Total Current Assets 6,724,483 16,094,733 5,385,125 10,640,050
Noncurrent Assets:
Investment in real estate - - - -
Cash with fiscal agent - - - -
OPEB asset - - - -
Capital assets - net:
Depreciable capital assets:
Plant in service - net - - - -
Non depreciable capital assets:
Land - - - -
Construction in progress:
Stage 2 - - - 2,934,429
General - - 1,931,274 -
Total Capital assets - net - - 1,931,274 2,934,429
Total Noncurrent Assets - Net - - 1,931,274 2,934,429
Total Assets 6,724,483$ 16,094,733$ 7,316,399$ 13,574,479$
Deferred Outflows of Resources
Pension Contributions and Adjustments -$ -$ -$ -$
Deferred Loss on Defeasance - - - -
Total Deferred Outflows of Resources -$ -$ -$ -$
Liabilities
Current Liabilities:
Accounts payable -$ -$ 171,698$ -$
Accrued payroll and employee benefits - - - -
Accrued interest payable - - - -
Due to other funds - 11,702,307 - -
Unearned revenue - 7,875 21,081 -
Noncurrent liabilities due within one year - - - -
Total Current Liabilities - 11,710,182 192,779 -
Noncurrent liabilities due in more than one year - - - -
Total Liabilities -$ 11,710,182$ 192,779$ -$
Deferred inflows of Resources
Pension Differences Between Actual and Expected Returns -$ -$ -$ -$
Net Position
Net Investment in Capital Assets -$ -$ 1,931,274$ 2,934,429$
Restricted for:
Debt service - - - -
Unrestricted 6,724,483 4,384,551 5,192,346 10,640,050
Total Net Position 6,724,483$ 4,384,551$ 7,123,620$ 13,574,479$
(Continued)
Silicon Valley Clean Water
Combining Schedule of Net Position
Enterprise Funds
June 30, 2017
Page 47 of 57

Assets
Current Assets:
Cash and investments
Accounts receivable
Interest receivable
Employee notes receivable
Deposits
Due from other funds
Inventory
Prepaid expenses
Total Current Assets
Noncurrent Assets:
Investment in real estate
Cash with fiscal agent
OPEB asset
Capital assets - net:
Depreciable capital assets:
Plant in service - net
Non depreciable capital assets:
Land
Construction in progress:
Stage 2
General
Total Capital assets - net
Total Noncurrent Assets - Net
Total Assets
Deferred Outflows of Resources
Pension Contributions and Adjustments
Deferred Loss on Defeasance
Total Deferred Outflows of Resources
Liabilities
Current Liabilities:
Accounts payable
Accrued payroll and employee benefits
Accrued interest payable
Due to other funds
Unearned revenue
Noncurrent liabilities due within one year
Total Current Liabilities
Noncurrent liabilities due in more than one year
Total Liabilities
Deferred inflows of Resources
Pension Differences Between Actual and Expected Returns
Net Position
Net Investment in Capital Assets
Restricted for:
Debt service
Unrestricted
Total Net Position
Capital
Self Recycled Improvement
Insurance Water Program Operation Total
-$ -$ -$ 1,241,039$ 30,047,972$
- - 9,328,124 405,380 10,194,719
- - 511,674 2,933 514,607
- - - 21,741 21,741
- - - - -
212,342 63,722 - 9,073,378 18,925,685
- - - 1,828,192 1,828,192
- - 97,300 101,684 198,984
212,342 63,722 9,937,098 12,674,347 61,731,900
- - 2,552,962 - 2,552,962
- - 5,602,191 - 5,602,191
- - - 2,641,436 2,641,436
- - - 155,359,294 155,359,294
- - - 1,282,081 1,282,081
- - - - 2,934,429
- - 89,664,547 - 91,595,821
- - 89,664,547 156,641,375 251,171,625
- - 97,819,700 159,282,811 261,968,214
212,342$ 63,722$ 107,756,798$ 171,957,158$ 323,700,114$
-$ -$ -$ 3,609,256$ 3,609,256$
- - 508,130 - 508,130
-$ -$ 508,130$ 3,609,256$ 4,117,386$
-$ 22,391$ 2,099,568$ 768,950$ 3,062,607$
- - 1,242 680,858 682,100
- - 4,166,921 - 4,166,921
- - 7,223,378 - 18,925,685
- 20,746 - 247,578 297,280
- - 4,935,923 813,555 5,749,478
- 43,137 18,427,032 2,510,941 32,884,071
- - 196,864,946 15,036,951 211,901,897
-$ 43,137$ 215,291,978$ 17,547,892$ 244,785,968$
-$ -$ -$ 1,352,904$ 1,352,904$
-$ -$ (106,534,131)$ 153,141,375$ 51,472,947$
- - 5,063,980 - 5,063,980
212,342 20,585 (5,556,899) 3,524,243 25,141,701
212,342$ 20,585$ (107,027,050)$ 156,665,618$ 81,678,628$
(Concluded)
Silicon Valley Clean Water
Combining Schedule of Net Position
Enterprise Funds
June 30, 2017
Page 48 of 57
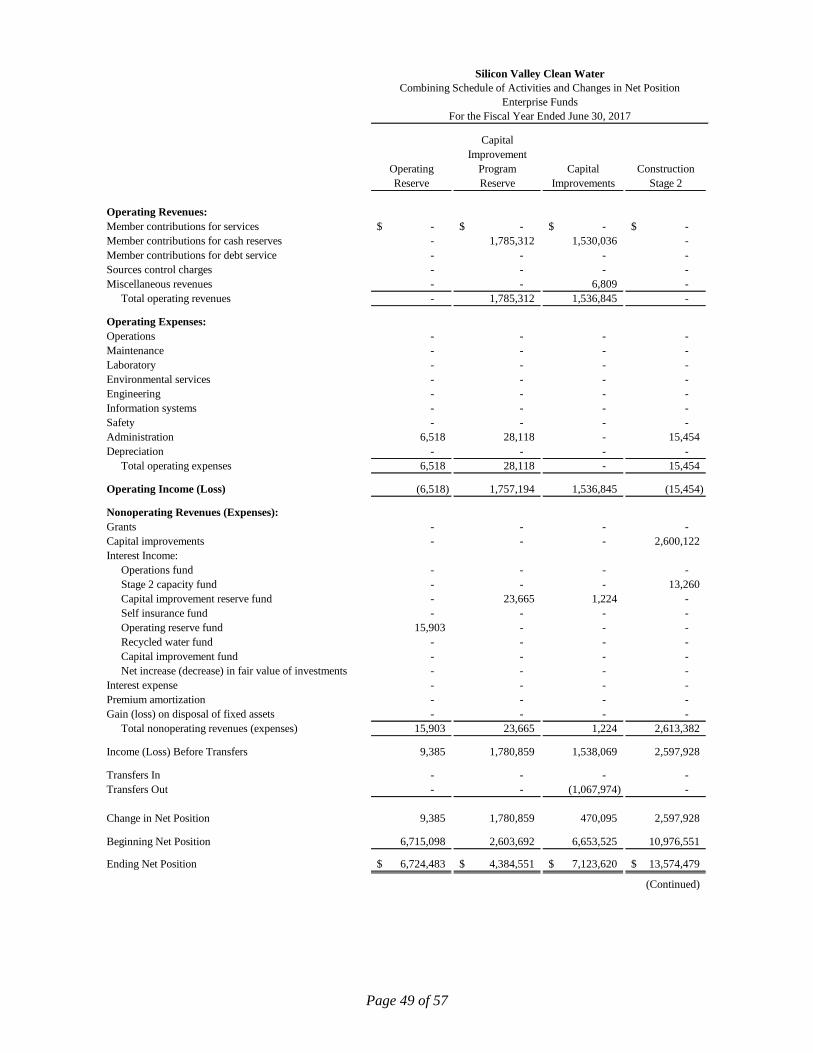
Capital
Improvement
Operating Program Capital Construction
Reserve Reserve Improvements Stage 2
Operating Revenues:
Member contributions for services -$ -$ -$ -$
Member contributions for cash reserves - 1,785,312 1,530,036 -
Member contributions for debt service - - - -
Sources control charges - - - -
Miscellaneous revenues - - 6,809 -
Total operating revenues - 1,785,312 1,536,845 -
Operating Expenses:
Operations - - - -
Maintenance - - - -
Laboratory - - - -
Environmental services - - - -
Engineering - - - -
Information systems - - - -
Safety - - - -
Administration 6,518 28,118 - 15,454
Depreciation - - - -
Total operating expenses 6,518 28,118 - 15,454
Operating Income (Loss) (6,518) 1,757,194 1,536,845 (15,454)
Nonoperating Revenues (Expenses):
Grants - - - -
Capital improvements - - - 2,600,122
Interest Income:
Operations fund - - - -
Stage 2 capacity fund - - - 13,260
Capital improvement reserve fund - 23,665 1,224 -
Self insurance fund - - - -
Operating reserve fund 15,903 - - -
Recycled water fund - - - -
Capital improvement fund - - - -
Net increase (decrease) in fair value of investments - - - -
Interest expense - - - -
Premium amortization - - - -
Gain (loss) on disposal of fixed assets - - - -
Total nonoperating revenues (expenses) 15,903 23,665 1,224 2,613,382
Income (Loss) Before Transfers 9,385 1,780,859 1,538,069 2,597,928
Transfers In - - - -
Transfers Out - - (1,067,974) -
Change in Net Position 9,385 1,780,859 470,095 2,597,928
Beginning Net Position 6,715,098 2,603,692 6,653,525 10,976,551
Ending Net Position 6,724,483$ 4,384,551$ 7,123,620$ 13,574,479$
(Continued)
Silicon Valley Clean Water
Combining Schedule of Activities and Changes in Net Position
Enterprise Funds
For the Fiscal Year Ended June 30, 2017
Page 49 of 57

Operating Revenues:
Member contributions for services
Member contributions for cash reserves
Member contributions for debt service
Sources control charges
Miscellaneous revenues
Total operating revenues
Operating Expenses:
Operations
Maintenance
Laboratory
Environmental services
Engineering
Information systems
Safety
Administration
Depreciation
Total operating expenses
Operating Income (Loss)
Nonoperating Revenues (Expenses):
Grants
Capital improvements
Interest Income:
Operations fund
Stage 2 capacity fund
Capital improvement reserve fund
Self insurance fund
Operating reserve fund
Recycled water fund
Capital improvement fund
Net increase (decrease) in fair value of investments
Interest expense
Premium amortization
Gain (loss) on disposal of fixed assets
Total nonoperating revenues (expenses)
Income (Loss) Before Transfers
Transfers In
Transfers Out
Change in Net Position
Beginning Net Position
Ending Net Position
Capital
Self Recycled Improvement
Insurance Water Program Operation Total
-$ 219,253$ -$ 22,549,104$ 22,768,357$
- - - - 3,315,348
- - 11,877,963 - 11,877,963
- - - 69,724 69,724
- - - 295,102 301,911
- 219,253 11,877,963 22,913,930 38,333,303
- 147,297 - 7,896,489 8,043,786
- 49,583 - 5,640,685 5,690,268
- 11,407 - 1,426,376 1,437,783
- - - 914,870 914,870
- - 108,395 290,920 399,315
- - - 1,655,229 1,655,229
- - - 322,260 322,260
- - - 3,379,048 3,429,138
- - - 9,279,531 9,279,531
- 208,287 108,395 30,805,408 31,172,180
- 10,966 11,769,568 (7,891,478) 7,161,123
- - - 271,125 271,125
- - - - 2,600,122
- - - 16,419 16,419
- - - - 13,260
- - - - 24,889
33 - - - 33
- - - - 15,903
- 29 - - 29
- - 89,670 - 89,670
- - (57,904) - (57,904)
- - (8,200,112) - (8,200,112)
- - 628,383 - 628,383
- - - (48,201) (48,201)
33 29 (7,539,963) 239,343 (4,646,384)
33 10,995 4,229,605 (7,652,135) 2,514,739
- - - 10,530,326 10,530,326
- - (9,462,352) - (10,530,326)
33 10,995 (5,232,747) 2,878,191 2,514,739
212,309 9,590 (101,794,303) 153,787,427 79,163,889
212,342$ 20,585$ (107,027,050)$ 156,665,618$ 81,678,628$
(Concluded)
For the Fiscal Year Ended June 30, 2017
Enterprise Funds
Combining Schedule of Activities and Changes in Net Position
Silicon Valley Clean Water
Page 50 of 57

Capital
Improvement
Operating Program Capital Construction
Reserve Reserve Improvements Stage 2
Cash Flows from Operating Activities:
Cash received from member agencies -$ 1,706,868$ 1,477,140$ -$
Cash paid to suppliers for goods and services and employees for services (6,518) (28,118) - (15,454)
Other cash received (paid) - - 6,809 -
Net Cash Provided (Used) by Operating Activities (6,518) 1,678,750 1,483,949 (15,454)
Cash Flows from Capital and Related Financing Activities:
Cash received from member agencies other than for services - - - 2,138,907
Cash received from grants - - - -
Contributions to (from) other funds (1,060) 77,795 (75,865) (24,268)
Proceeds from capital debt - net - - - -
Interest paid on capital debt - - - -
Principal paid on capital debt - - - -
Purchases and construction of capital assets - - (1,409,308) (108,128)
Net Cash Provided (Used) by Capital and Related Financing Activities (1,060) 77,795 (1,485,173) 2,006,511
Cash Flows from Noncapital Financing Activities:
Transfers in - - - -
Transfers out - - - -
Net Cash Provided (Used) by Noncapital Financing Activities - - - -
Cash Flows from Investing Activities:
Investment income 15,903 23,665 1,224 13,260
Net Cash Provided (Used) by Investing Activities 15,903 23,665 1,224 13,260
Net Increase (Decrease) in Cash and Cash Equivalents 8,325 1,780,210 - 2,004,317
Cash and Cash Equivalents Beginning 3,483,296 14,314,523 - 7,216,262
Cash and Cash Equivalents Ending 3,491,621$ 16,094,733$ -$ 9,220,579$
Reconciliation of Operating Income (Loss) to Cash Flows Provided (Used)
by Operating Activities:
Operating Income (Loss) (6,518)$ 1,757,194$ 1,536,845$ (15,454)$
Adjustments to reconcile operating income (loss) to net cash provided
(used) by operating activities:
Depreciation - - - -
Pension expense adjustment - GASB 68 - - - -
Net change in:
Accounts receivable - - - -
Employee notes receivable - - - -
Inventory - - - -
Prepaid expenses - - - -
Deposits - - - -
Net OPEB asset - - - -
Accounts payable - - - -
Accrued payroll and employee benefits - - - -
Unearned revenue - (78,444) (52,896) -
Accrued compensated absences - - - -
Net Cash Provided (Used) by Operating Activities (6,518)$ 1,678,750$ 1,483,949$ (15,454)$
Noncash Transactions:
Noncash transfers of capital assets -$ -$ (1,067,974)$ -$
(Continued)
Silicon Valley Clean Water
Combining Schedule of Cash Flows
Enterprise Funds
For the Fiscal Year Ended June 30, 2017
Page 51 of 57
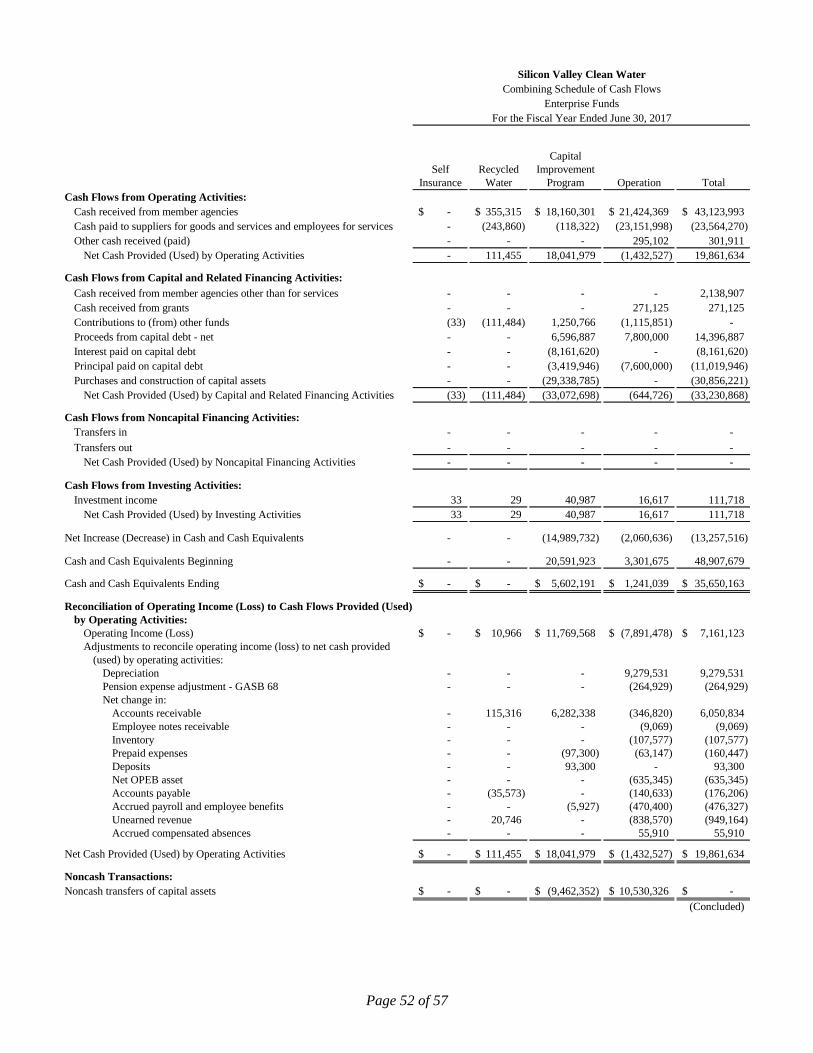
Cash Flows from Operating Activities:
Cash received from member agencies
Cash paid to suppliers for goods and services and employees for services
Other cash received (paid)
Net Cash Provided (Used) by Operating Activities
Cash Flows from Capital and Related Financing Activities:
Cash received from member agencies other than for services
Cash received from grants
Contributions to (from) other funds
Proceeds from capital debt - net
Interest paid on capital debt
Principal paid on capital debt
Purchases and construction of capital assets
Net Cash Provided (Used) by Capital and Related Financing Activities
Cash Flows from Noncapital Financing Activities:
Transfers in
Transfers out
Net Cash Provided (Used) by Noncapital Financing Activities
Cash Flows from Investing Activities:
Investment income
Net Cash Provided (Used) by Investing Activities
Net Increase (Decrease) in Cash and Cash Equivalents
Cash and Cash Equivalents Beginning
Cash and Cash Equivalents Ending
Reconciliation of Operating Income (Loss) to Cash Flows Provided (Used)
by Operating Activities:
Operating Income (Loss)
Adjustments to reconcile operating income (loss) to net cash provided
(used) by operating activities:
Depreciation
Pension expense adjustment - GASB 68
Net change in:
Accounts receivable
Employee notes receivable
Inventory
Prepaid expenses
Deposits
Net OPEB asset
Accounts payable
Accrued payroll and employee benefits
Unearned revenue
Accrued compensated absences
Net Cash Provided (Used) by Operating Activities
Noncash Transactions:
Noncash transfers of capital assets
Capital
Self Recycled Improvement
Insurance Water Program Operation Total
-$ 355,315$ 18,160,301$ 21,424,369$ 43,123,993$
- (243,860) (118,322) (23,151,998) (23,564,270)
- - - 295,102 301,911
- 111,455 18,041,979 (1,432,527) 19,861,634
- - - - 2,138,907
- - - 271,125 271,125
(33) (111,484) 1,250,766 (1,115,851) -
- - 6,596,887 7,800,000 14,396,887
- - (8,161,620) - (8,161,620)
- - (3,419,946) (7,600,000) (11,019,946)
- - (29,338,785) - (30,856,221)
(33) (111,484) (33,072,698) (644,726) (33,230,868)
- - - - -
- - - - -
- - - - -
33 29 40,987 16,617 111,718
33 29 40,987 16,617 111,718
- - (14,989,732) (2,060,636) (13,257,516)
- - 20,591,923 3,301,675 48,907,679
-$ -$ 5,602,191$ 1,241,039$ 35,650,163$
-$ 10,966$ 11,769,568$ (7,891,478)$ 7,161,123$
- - - 9,279,531 9,279,531
- - - (264,929) (264,929)
- 115,316 6,282,338 (346,820) 6,050,834
- - - (9,069) (9,069)
- - - (107,577) (107,577)
- - (97,300) (63,147) (160,447)
- - 93,300 - 93,300
- - - (635,345) (635,345)
- (35,573) - (140,633) (176,206)
- - (5,927) (470,400) (476,327)
- 20,746 - (838,570) (949,164)
- - - 55,910 55,910
-$ 111,455$ 18,041,979$ (1,432,527)$ 19,861,634$
-$ -$ (9,462,352)$ 10,530,326$ -$
(Concluded)
Silicon Valley Clean Water
Combining Schedule of Cash Flows
Enterprise Funds
For the Fiscal Year Ended June 30, 2017
Page 52 of 57

Fund / Location Belmont Redwood City San Carlos
West Bay
Sanitary
District Total
Operations (Fund 18)
Balance at June 30, 2016 13,155,181$ 75,823,363$ 21,735,637$ 40,993,727$ 151,707,908$
Member Agency Contributions 3,014,724 10,019,052 3,289,248 6,226,080 22,549,104
Other Miscellaneous Revenue 80,893 295,653 80,257 179,147 635,951
Unrealized Gain / (Loss) on Investments (356) (1,303) (354) (789) (2,802)
Interest Income 1,412 9,652 2,681 5,150 18,895
Capitalized Projects Transferred from other Funds 995,116 5,114,579 1,594,291 2,826,339 10,530,326
Gain / (Loss) on Asset Disposal (4,555) (23,411) (7,298) (12,937) (48,201)
Operating & Maintenance Costs (2,820,794) (10,309,648) (2,798,618) (6,246,994) (22,176,054)
Depreciation Expenditures (876,916) (4,507,068) (1,404,921) (2,490,626) (9,279,531)
Balance at June 30, 2017 13,544,704$ 76,420,870$ 22,490,924$ 41,479,097$ 153,935,596$
Retiree Medical Health Benefits Reserve (Fund 12)
Balance at June 30, 2016 258,946$ 926,769$ 324,584$ 569,223$ 2,079,521$
Contributions to Fund 12 97,235 355,380 96,470 215,338 764,422
Interest Income 41 146 51 89 327
Expenditures (14,533) (53,115) (14,418) (32,184) (114,250)
Balance at June 30, 2017 341,688$ 1,229,179$ 406,687$ 752,466$ 2,730,020$
Capital Improvement Program Reserve (Fund 13)
Balance at June 30, 2016 246,045$ 1,264,613$ 394,202$ 698,833$ 2,603,693$
Member Contributions - Replacement Reserve 140,544 722,376 225,180 365,926 1,454,026
Member Contributions - Debt Service Contributions 28,164 144,744 45,120 113,258 331,286
Change in Fair Value, Unrealized Gain/(Loss) (17,716) (91,054) (28,383) (50,317) (187,469)
Fees (2,657) (13,657) (4,257) (7,547) (28,118)
Interest Income 60 310 97 172 639
Interest Income - Distributed 19,892 102,237 31,869 56,497 210,494
Balance at June 30, 2017 414,332$ 2,129,570$ 663,828$ 1,176,821$ 4,384,551$
Construction Stage 2 (Fund 15)
Balance at June 30, 2016 530,131$ 6,359,481$ 819,493$ 3,267,446$ 10,976,551$
Member Purchases of Capacity - 799,342 1,264,099 536,681 2,600,122
Interest Income 84 1,096 234 535 1,949
Interest Income - Distributed 10,294 52,909 16,493 29,238 108,934
Interest / (Unrealized Loss) Investments (9,225) (47,416) (14,780) (26,202) (97,623)
Fees (1,460) (7,506) (2,340) (4,148) (15,453)
Capitalized Projects Transferred to Fund 18 - - - - -
Balance at June 30, 2017 529,824$ 7,157,907$ 2,083,198$ 3,803,551$ 13,574,480$
Self Insurance (Fund 16)
Balance at June 30, 2016 22,647$ 88,292$ 37,882$ 63,488$ 212,309$
Interest Income 4 14 6 10 33
Expenses / Claims - - - - -
Balance at June 30, 2017 22,651$ 88,306$ 37,888$ 63,498$ 212,342$
Operating & Capital Reserve (Fund 17)
Balance at June 30, 2016 759,000$ 3,305,490$ 857,987$ 1,792,622$ 6,715,098$
Member Contributions - - - - -
Unrealized Gain / (Loss) on Investment (3,643) (13,316) (3,615) (8,069) (28,644)
Fees (829) (3,030) (823) (1,836) (6,518)
Interest Income - Distributed 4,109 21,121 6,584 11,672 43,486
Interest Income 120 522 136 283 1,060
Balance at June 30, 2017 758,757$ 3,310,786$ 860,269$ 1,794,671$ 6,724,483$
Continued
Silicon Valley Clean Water
Schedule of Analysis of Net Position
Supplemental Schedule (Unaudited)
For the Year Ended June 30, 2017
Page 53 of 57

Fund / Location Belmont Redwood City San Carlos
West Bay
Sanitary
District Total
Silicon Valley Clean Water
Schedule of Analysis of Net Position
Supplemental Schedule (Unaudited)
For the Year Ended June 30, 2017
Revenue-Funded Capital Improvements (Fund 14)
Balance at June 30, 2016 686,931$ 3,316,982$ 768,961$ 1,880,651$ 6,653,525$
Member Contributions - Pay go capital projects 144,588 743,136 231,648 410,664 1,530,036
Miscellaneous Revenue 643 3,307 1,031 1,828 6,809
Interest Income 125 608 148 343 1,223
Capitalized Projects transferred to Fund 18 (100,924) (518,715) (161,691) (286,644) (1,067,974)
Balance at June 30, 2017 731,364$ 3,545,318$ 840,097$ 2,006,842$ 7,123,620$
Recycled Water (Fund 19)
Balance at June 30, 2016 -$ 9,590$ -$ -$ 9,590$
Interest Income - 29 - - 29
RWC Recycled Water O&M Contributions - 219,254 - - 219,254
RWC Recycled Water O&M Expenditures - (208,288) - - (208,288)
Balance at June 30, 2017 -$ 20,585$ -$ -$ 20,585$
Plant Capital Improvement Program (Fund 20)
Balance at June 30, 2016 5,520,932 (50,933,008) (19,804,296) (34,763,054) (99,979,426)$
Revenues:
Contributions to Debt Service - 6,430,596 1,983,153 3,464,213 11,877,962
Cash Contributions in lieu of Debt - - - - -
Unrealized Gain (Loss) (5,472) (28,124) (8,767) (15,542) (57,904)
Interest on Trustee Reserves - 56,934 17,734 31,019 105,688
Interest on Cash Contributions 15,492 7,987 (14,206) (25,291) (16,017)
Capitalized Projects Transferred to Fund 18 (894,192) (4,595,864) (1,432,600) (2,539,695) (9,462,352)
Interest Expense - (4,382,848) (1,365,216) (2,387,908) (8,135,971)
Other debt-related Expense - 410,596 127,897 223,705 762,199
Administrative Expense (18,707) (96,147) (29,971) (53,132) (197,957)
Non-capitalized expenditures (10,243) (52,646) (16,411) (29,093) (108,393)
Transfer Out To Fund 21 & 22 (856,815) (958,062) (1,814,877)
Balance at June 30, 2017 4,607,810$ (54,039,339)$ (20,542,682)$ (37,052,838)$ (107,027,049)$
West Bay Sanitary District Capital Impr. Program (Fund 21)
Balance at June 30, 2016 -$ -$ -$ (958,062)$ (958,062)$
Transfer in from Fund 20 - - - 958,062 958,062
Balance at June 30, 2017 -$ -$ -$ 0$ 0$
Redwood City Capital Impr. Program (Fund 22)
Balance at June 30, 2016 -$ (856,815)$ -$ -$ (856,815)$
Transfer In from Fund 20 - 856,815 - - 856,815
Balance at June 30, 2017 -$ -$ -$ -$ -$
Concluded
TOTAL NET POSITION - June 30, 2017 20,951,130$ 39,863,182$ 6,840,208$ 14,024,108$ 81,678,628$
Page 54 of 57

OTHER INDEPENDENT AUDITOR’S REPORT
Page 55 of 57

1475 Saratoga Ave, Suite 180, San Jose, CA 95129 Tel: 408-217-8749 • E-Fax: 408-872-4159
[email protected] • www.cnallp.com
INDEPENDENT AUDITOR’S REPORT ON INTERNAL CONTROL OVER FINANCIAL REPORTING AND ON COMPLIANCE AND OTHER MATTERS BASED ON AN AUDIT OF
FINANCIAL STATEMENTS PERFORMED IN ACCORDANCE WITH GOVERNMENT AUDITING STANDARDS
To the Commission Silicon Valley Clean Water We have audited, in accordance with auditing standards generally accepted in the United States of America and the standards applicable to financial audits contained in Government Auditing Standards issued by the Comptroller General of the United States, the financial statements of the Silicon Valley Clean Water (SVCW) as of and for the year ended June 30, 2017, and the related notes to the financial statements, which collectively comprise SVCW’s basic financial statements, and have issued our report thereon dated November 17, 2017. Internal Control over Financial Reporting In planning and performing our audit of the financial statements, we considered SVCW’s internal control over financial reporting (internal control) to determine the audit procedures that are appropriate in the circumstances for the purpose of expressing our opinions on the financial statements, but not for the purpose of expressing an opinion on the effectiveness of SVCW’s internal control. Accordingly, we do not express an opinion on the effectiveness of SVCW’s internal control. A deficiency in internal control exists when the design or operation of a control does not allow management or employees in the normal course of performing their assigned functions, to prevent, or detect and correct misstatements on a timely basis. A material weakness is a deficiency, or a combination of deficiencies, in internal control, such that there is a reasonable possibility that a material misstatement of the entity’s financial statements will not be prevented, or detected and corrected on a timely basis. A significant deficiency is a deficiency, or a combination of deficiencies, in internal control that is less severe than a material weakness, yet important enough to merit attention by those charged with governance. Our consideration of internal control over financial reporting was for the limited purpose described in the first paragraph of this section and was not designed to identify all deficiencies in internal control over financial reporting that might be material weaknesses or significant deficiencies. Given these limitations, during our audit we did not identify any deficiencies in internal control over financial reporting that we consider to be material weaknesses. However, material weaknesses may exist that have not been identified. Compliance and Other Matters As part of obtaining reasonable assurance about whether SVCW’s financial statements are free of material misstatement, we performed tests of its compliance with certain provisions of laws, regulations, contracts, and grant agreements, noncompliance with which could have a direct and material effect on the determination of financial statement amounts. However, providing an opinion on compliance with those provisions was not an objective of our audit, and accordingly, we do not express such an opinion. The results of our tests disclosed no instances of noncompliance or other matters that are required to be reported under Government Auditing Standards.
Page 56 of 57

1475 Saratoga Ave, Suite 180, San Jose, CA 95129 Tel: 408-217-8749 • E-Fax: 408-872-4159
[email protected] • www.cnallp.com
Purpose of this Report The purpose of this report is solely to describe the scope of our testing of internal control and compliance and the results of that testing, and not to provide an opinion on the effectiveness of the entity’s internal control or on compliance. This report is an integral part of an audit performed in accordance with Government Auditing Standards in considering the entity’s internal control and compliance. Accordingly, this communication is not suitable for any other purpose.
November 17, 2017 San Jose, California
Page 57 of 57

This page intentionally left blank


APPENDIX J
Comprehensive Annual Financial Report for the City of Redwood City – Fiscal Year Ended June 30, 2017

[THIS PAGE INTENTIONALLY LEFT BLANK]

Comprehensive Annual Financial ReportFiscal Year Ended June 30, 2017

City of Redwood City Comprehensive Annual Financial Report
June 30, 2017
City of Redwood City
Redwood City, California
Comprehensive Annual Financial Report
For the Fiscal Year Ended June 30, 2017

TABLE OF CONTENTSCity of Redwood CityComprehensive Annual Financial ReportFor the fiscal year ended June 30, 2017
PageI. INTRODUCTORY SECTION
Finance Director’s Letter of Transmittal ................................................................................................... iGFOA Certificate of Achievement for Excellence in Financial Reporting.................................................. viiPrincipal Officials ..................................................................................................................................... viiiFinance Division Staff .............................................................................................................................. ixOrganization Charts ................................................................................................................................. xCity of Redwood City Core Purpose......................................................................................................... xii
II. FINANCIAL SECTION
A. Independent Auditors’ Report .......................................................................................................... 1
B. Management’s Discussion and Analysis......................................................................................... 4
C. Basic Financial Statements:
Government-Wide Financial Statements:Statement of Net Position............................................................................................................. 21Statement of Activities.................................................................................................................. 22
Fund Financial Statements:Governmental Fund Financial Statements:
Balance Sheet ........................................................................................................................ 25Reconciliation of the Governmental Funds Balance Sheet
to the Government-Wide Statement of Net Position ......................................................... 26Statement of Revenues, Expenditures and Changes in Fund Balances ................................. 27Reconciliation of the Governmental Statement of Revenues,
Expenditures, and Changes in Fund Balances to the Government-WideStatement of Activities ...................................................................................................... 28

TABLE OF CONTENTSCity of Redwood CityComprehensive Annual Financial ReportFor the fiscal year ended June 30, 2017
Page
II. FINANCIAL SECTION, Continued
Proprietary Fund Financial Statements:Statement of Net Position........................................................................................................30Statement of Revenues, Expenses and Changes in Net Position ...........................................31Statement of Cash Flows ........................................................................................................32
Fiduciary Fund Financial Statements:Statement of Fiduciary Net Position ........................................................................................33Statement of Changes in Fiduciary Net Position .....................................................................34
Notes to the Basic Financial Statements.............................................................................................35
D. Required Supplementary Information (Unaudited):Budgets and Budgetary Accounting....................................................................................................86Defined Benefit Pension Plan .............................................................................................................90Other Post Employment Benefits (OPEB)...........................................................................................93
E. Supplementary Information:
General Fund:Comparative Balance Sheet..........................................................................................................96Comparative Schedule of Revenues, Expenditures and
Changes in Fund Balances – Budget .....................................................................................97Schedule of Revenues Compared with Budget (GAAP Basis) and Actual.....................................98Schedule of Expenditures Compared with Budget (GAAP Basis) and Actual................................99
Non-Major Governmental Funds:Combining Balance Sheet........................................................................................................... 102Combining Statement of Revenues, Expenditures and Changes in Fund Balances.................... 106
Budgeted Non-Major Funds:Combining Schedule of Revenues, Expenditures and
Changes in Fund Balances – Budget and Actual ................................................................. 110
TABLE OF CONTENTSCity of Redwood CityComprehensive Annual Financial ReportFor the fiscal year ended June 30, 2017
Page
II. FINANCIAL SECTION, Continued
Internal Service Funds:Combining Statement of Net Position ......................................................................................... 120Combining Statement of Revenues, Expenses and Changes in Net Position ............................. 121Combining Statement of Cash Flows .......................................................................................... 122
Agency Funds:Combining Statement of Changes in Assets and Liabilities......................................................... 124
III. STATISTICAL SECTION (Unaudited)
Statistical Category Narrative ................................................................................................................. 125Schedule 1 - Net Position by Component – Last Ten Fiscal Years ......................................................... 126Schedule 2 – Changes in Net Position – Last Ten Fiscal Years ............................................................. 128Schedule 3 – Fund Balances – Governmental Funds – Last Ten Fiscal Years....................................... 130Schedule 4 – Changes in Fund Balances – Governmental Funds – Last Ten Fiscal Years.................... 132Schedule 5 – Assessed Value and Estimated Actual Value of Taxable Property -
Last Ten Fiscal Years ....................................................................................................... 134Schedule 6 – Direct and Overlapping Debt – Last Ten Fiscal Years....................................................... 135Schedule 7 – Principal Property Tax Payers – Last Ten Fiscal Years..................................................... 136Schedule 8 – Property Tax Levies and Collections – Last Ten Fiscal Years........................................... 137Schedule 9 – Ratios of Outstanding Debt by Type – Last Ten Fiscal Years ........................................... 138Schedule 10 – Direct and Overlapping Governmental Activities Debt..................................................... 139Schedule 11 – Legal Debt Margin Information – Last Ten Fiscal Years.................................................. 140Schedule 12 – Pledged-Revenue Coverage – Last Ten Fiscal Years..................................................... 141Schedule 13 – Demographic and Economic Statistics – Last Ten Calendar Years................................. 143Schedule 14 – Principal Employers – Current and Nine Years Ago........................................................ 144Schedule 15 – Full Time Equivalent Employees by Function – Last Ten Fiscal Years............................ 145Schedule 16 – Operating Indicators by Function/Program – Last Ten Fiscal Years................................ 146Schedule 17 – Capital Asset Statistics by Function/Program – Last Ten Fiscal Years ........................... 147Schedule 18 – Construction Values – Last Ten Fiscal Years.................................................................. 148
i
Office of Administrative Services 1017 Middlefield Road Redwood City, California 94063 Telephone: (650) 780-7070 Fax: (650) 366-2447 E-mail: [email protected] December 11, 2017 Honorable Mayor Ian Bain Members of the City Council, City Manager, and Citizens of the City of Redwood City Redwood City, California I am pleased to submit for your information and consideration the Comprehensive Annual Financial Report of the City of Redwood City for the fiscal year ended June 30, 2017. This report contains a complete set of audited financial statements, prepared by the City's Finance Division in accordance with Generally Accepted Accounting Principles (GAAP) as promulgated by the Government Accounting Standards Board (GASB). The responsibility for both the accuracy of the printed data and the completeness and fairness of the presentation including all disclosures rests with the management of the City. It is our opinion that: the data presented is accurate in all material respects; that it is presented in a manner designed to fairly set forth the financial positions and results of operations of the City and its related entities as measured by the financial activities of their various funds; and that all disclosures necessary for the reader to gain a full understanding of their financial activities have been included. To provide a reasonable basis for making those representations, City management has established a comprehensive internal control framework designed both to protect the government’s assets from loss, theft or misuse and to compile sufficient reliable information for the preparation of the City’s financial statements in conformity with GAAP. Badawi and Associates, a firm of independent, licensed and Certified Public Accountants, has audited the City’s financial statements for the fiscal year ended June 30, 2017. The objective of the independent audit is to provide reasonable assurance that the financial statements of the City and related entities are free of material misstatement. The auditors concluded, based upon their audit, that there was a reasonable basis for rendering an unmodified opinion on the City’s basic financial statements as of and for the fiscal year ended June 30, 2017. The independent auditor’s report is located at the front of the financial section of this report on page 1. Accounting principles generally accepted in the United States of America require that management provide a narrative introduction, overview, and analysis to accompany the basic financial statements in the form of a Management’s Discussion and Analysis (MD&A). This transmittal letter is designed to complement the MD&A and should be read in conjunction with it. Redwood City’s MD&A can be found immediately following the report of the independent auditors on page 4. The notes to the financial statements are provided in the financial section and are considered essential to fair presentation and adequate disclosure. REPORTING ENTITY AND ITS SERVICES Redwood City is a San Francisco Bay Area community located in the heart of Silicon Valley. With a population of over 85,000, Redwood City is the third largest city within the County of San Mateo. The City of Redwood City was incorporated in 1867 and became a Charter City in 1929. It operates under a council-manager form of government and is a full service City, providing a range of services that include police and fire protection,

ii
recreation and parks, libraries, street maintenance and construction, infrastructure improvements, planning and zoning, water delivery, port facilities, and storm drains. Although the City maintains sewer lines and pump stations, the sewer plant and treatment services are provided by the Silicon Valley Clean Water Authority (formerly the South Bayside System Authority), a joint powers authority of which Redwood City is an equity holder. The financial reporting entity includes all funds of the primary government (i.e. the City of Redwood City) as well as its component units. The City Council serves in separate session as the governing bodies of the Successor Agency to the Redevelopment Agency of Redwood City, the Redwood City Facilities and Infrastructure Authority, and the Public Financing Authority, although these agencies are legal entities apart from the City. Debt service paid during the fiscal year is presented in the debt service fund. Under the City Charter, the City Council appoints the Board of Port Commissioners to oversee the operations of the Port of Redwood City, which is considered a department of the City of Redwood City. The Port of Redwood City is an enterprise activity and is presented as an enterprise fund. Financial information for separate legal entities related to the City, including the Redwood City Facilities and Infrastructure Authority, Redwood City Public Financing Authority, and Successor Agency to the Redevelopment Agency of Redwood City, is blended in the City's financial statements in accordance with Governmental Accounting Standards Board Statement No. 14. FINANCIAL INFORMATION Accounting System and Budgetary Control The City's accounting records for governmental operations are maintained on a modified accrual basis, with the revenues being recorded when both measurable and available, and expenditures being recorded when the services or goods are received and the liabilities are incurred. Accounting records for the City's enterprises are maintained on the accrual basis. In developing and modifying the City's accounting system, consideration is given to the adequacy of internal accounting controls. Internal accounting controls are designed to provide reasonable, but not absolute, assurance regarding 1) the safeguarding of assets against loss from unauthorized use or disposition, and 2) the reliability of financial records for preparing financial statements and maintaining accountability for assets. Because the cost of internal controls should not outweigh their benefits, the City’s controls have been designed to provide reasonable, rather than absolute, assurance that the financial statements will be free from material misstatement. The concept of reasonable assurance recognizes that the evaluation of costs and benefits requires estimates and judgments by management. Within this framework, we believe that the City's internal accounting controls adequately safeguard assets and provide reasonable assurance of proper recording of financial transactions. As demonstrated by the statements and schedules included in the financial section of this report, the City of Redwood City continues to meet its responsibility for sound financial management. Beginning with the financial statements for FY 2014-15, the City, along with other governmental agencies, was required to implement a new accounting standard, Governmental Accounting Standards Board Statement No. 68 (GASB 68). GASB 68 required all governmental agencies to record the unfunded pension liability on their balance sheet (i.e. Statement of Net Position). More detailed information regarding the City’s pension liability is described in Note 9.
iii
FACTORS AFFECTING FINANCIAL CONDITION Local Economy The local economy is strong. As of June 30, 2017, the unemployment rate in San Mateo County dropped from 3.3% to 2.9%, and Redwood City’s unemployment rate was 2.7%. Both San Mateo County and Redwood City unemployment rates are consistently lower than the State’s unemployment rate of 4.9% and the national rate of 4.5%. The number of employed residents in the County increased slightly from 430,900 in June 2016 to 435,300 in June 2017. The Redwood City commercial real estate market continues to exhibit signs of high demand with the citywide vacancy rate stable at 3.8% as of the second quarter 2017. Vacancy rates as of June 2017 in Redwood City’s downtown area are stable due to new construction of retail space, with retail vacancy up slightly to 3.4% from 2.5% last year. The office space vacancy rate in downtown has dropped to 1.5% as of June 2017 compared to 4.4% as of June 2016. We believe these indicators paint a positive picture of the local economy and provide a solid underpinning for steady economic growth continuing into the near future. Recognizing that local and regional growth have exacerbated long-term mobility and affordable housing challenges, the City Council has taken numerous steps to address these issues over the past several years. Over the past fiscal year, application of the housing impact fee (adopted in 2016) allowed for funds to be granted to non-profits, allowing for a 55-unit and a 7-unit apartment building to be purchased, and deed restricted for affordable housing for at least 55 years. In addition, 105 additional deed-restricted affordable units were approved downtown, and another 117 are under construction. Additional affordable housing units are currently under review outside the downtown area. The City Council has also directed staff to complete a citywide transportation study and will undertake several related planning projects, including the El Camino Real Corridor Plan and the Downtown Transit Center and Broadway Streetcar/Urban Circulator Study. Economic Development Initiatives With the adoption of the Downtown Precise Plan in 2011, Downtown Redwood City has become a vibrant district where Redwood City residents enjoy working, living, and playing. The opening of the Crossing 900 Building, and four other office buildings under construction totaling 500,000 new square feet, has made downtown a desirable location for new businesses to locate. The close proximity to a Caltrain station, easy freeway access, and central location to San Francisco and San Jose make Redwood City one of the fastest growing locations for startup businesses to locate. In addition to the new office developments, Redwood City is also seeing a growth in housing. New housing units in the Downtown, along with several new projects located in close proximity, are helping to not only meet a much-needed regional housing need, but also provide housing for the City’s growing employment base. Phase I of the Stanford Redwood City project is under construction and consists of 570,000 square feet of office space, a 1,057 space parking structure, a fitness center, a childcare facility, and a 2.4 acre publicly-accessible open space. As part of the development, Stanford is providing over $15 million in community benefits for such things as education, sustainability, public transportation studies, affordable housing and more. The City expects greater revenues from development related fees, as the Council adopted an updated fee schedule that goes into effect in FY 2017-18.
iv
Long-Term Financial Planning Maintaining a sustainable budget and prudently planning for the City’s current and long-term needs is a top priority for Redwood City. The City continues to focus strategically on appropriate funding strategies for annual operations, a robust capital improvement program, and future liabilities. Each year, the City prepares a five-year forecast to project revenue and expenditure trends. These forecasts are an integral part of the annual budget process as the City seeks to establish and implement its priorities in a fiscally sustainable manner. The City reviews major cost drivers to anticipate and control expenses to the full extent possible and makes fiscal decisions within the framework of the forecast. The City also monitors its revenue sources to identify and plan for trends. A summary of major revenue sources and other significant financial planning items is below. Sales Tax Sales tax is an important source of general fund revenue as it accounts for about 19% of total General Fund revenues. When compared to FY 2016-17 budget, actual revenues generated approximately 2.7% less revenue than expected. Sales tax revenue decreased by 2.1%. Even though there was significant growth in the food products category, activities in all other categories resulted in decreasing revenues during the same period. Several factors are negatively affecting the generation of sales tax revenue, nationally and locally. The increasingly rapid growth of online sales transactions, currently exempt from sales tax, is eroding the tax base; changing demographics are causing greater spending in non-taxable categories of goods and services among all age groups; and the numbers and types of transactions that are exempt from sales tax is also increasing. Given the cyclical nature of the local economy, the stabilizing of the rate of new vehicle sales, and the aforementioned factors, it is anticipated that sales tax revenue will remain flat or possibly even decline in the near future. Property Taxes Property tax accounts for 37% of City revenue and is a key indicator of the City’s economic outlook. Projections for secured taxes in Redwood City in FY 2017-18 call for a 1% increase over FY 2016-17 actuals with indications that growth in assessed value will continue in FY 2017-18 due to strong real estate sales, property improvements, and development. Utilities Users Taxes This City collects a voter-approved Utilities User Tax (UUT) on gas, electricity, cable and telecommunications services. UUT revenue increased 2% in FY 2016-17 compared to FY 2015-16, driven by an increase in utility rates and usage, although other sources of UUT revenues such as wireless and cable services continue to decline. Following the passage of Assembly Bill 1717 in 2014, the City entered into an agreement with the State Board of Equalization for the collection of our UUT on prepaid wireless services. The City began collecting revenue on prepaid wireless in January 2016 and will continue until AB 1717 sunsets in 2020. This revenue source amounted to $159,337 for FY 2016-17. While traditional UUT revenue has been dedicated on an annual basis to support the City’s capital improvement program, the City has committed this particular new source of UUT revenue to affordable housing. Educational Revenue Augmentation Fund Refunds In FY 1992-93 and FY 1993-94, the State shifted property taxes from cities, counties, and special districts to school districts to supplant funding that the State was providing to school districts. The funds shifted from these local governments are placed into the Educational Revenue Augmentation Fund (ERAF) by the County Controller. The Controller then disburses these funds to school districts based upon the formula prescribed by State law. Any funds remaining in ERAF (after the distribution to the school districts) are returned to the cities, county, and special districts in proportion to the amount they contributed to ERAF. This return of property tax revenue is difficult to anticipate due to complicated State school funding formulas and at risk of reduction or elimination by State action. In FY 2015-16 and FY 2016-17, the City received $4.8 million and $4.9 million respectively. This level
v
of funding was higher than can be expected in the future due to various one-time factors and recent and potential changes in school financing, which the County Controller has indicated could significantly reduce this revenue source in FY 2017-18 and future years. The City’s policy is to budget what can reasonably be estimated, which is approximately $2.5 million, or about 51% of the FY 2016-17 actual amount received. The City Council has directed that any additional funds be used to offset the cost of relocation benefits and other costs associated with ending residential uses at Docktown Marina. Successor Agency to the Redevelopment Agency As Successor Agency, the City continues to focus on the disposition of the $10.3 million in funds that had been in the former Redevelopment Agency’s possession and which were encumbered for below-market housing through an agreement with the Legal Aid Society. The control of these funds has been in dispute with the State of California Department of Finance (DOF) since the Redevelopment Agency was dissolved in FY 2011-12. The City filed suit against the State of California challenging the DOF’s position that these funds are unencumbered and must be remitted to the County Controller. Although the State prevailed in the Superior Court trial, the City has filed an appeal. The appeal is fully briefed and the City is awaiting a court date. In the meantime, new State legislation (SB107) was passed in September 2015 requiring that all obligations determined by the DOF be paid in order for successor agencies to receive the benefits of a finding of completion. The City remitted the funds prior to the end of calendar year 2015 for distribution to the taxing entities while it continues to pursue its appeal. The City advised the taxing entities to hold the funds in case the City prevails in this appeal. The City also continues to work with the State of California regarding the disposition of several former Redevelopment Agency land parcels. Relevant Financial Policies In FY 2016-17, the City Council adopted a general fund reserve policy, where the unreserved portion of the general fund’s fund balance shall be 15% of anticipated General Fund revenues. Any excess balance above a 15% reserve threshold was approved to be utilized to set up a Section 115 Trust Account to fund pension expenses. As a result of implementing GASB 54, these unreserved amounts are now reported under the category “Unassigned Fund Balances.” In recent fiscal years, the City has used balances in excess of the reserve policy to pay down unfunded liabilities. In addition, the City Council adopted a Debt Disclosure Policy and updated the Investment Policy. The City reviews these policies regularly and uses them to maintain sound fiscal practices. The City has also established cash management, accounting, budgetary and risk management policies and practices that are essential to the City’s long-term fiscal health. These financial policies and practices also promote public confidence and increase the City’s credibility in the eyes of bond rating agencies and potential investors. Such policies also provide the resources to react to financial needs in a prudent manner. The City also elected to change investment practices by hiring a third party to provide independent, professional investment management services. The purpose is to create a more strategic investment policy, and to diversify the City’s investments. Appropriation Limit Article XIIIB of the California State Constitution, which became effective in FY 1979-80, and which was modified (by Proposition 111) in November 1989, establishes, by formula, an appropriation limit for governmental agencies. Using the appropriations of FY 1978-79 as the base year, the limit is modified by the change in the composite consumer price index, population, and the value of commercial property development within the City

vi
limits during each fiscal year. Article XIIIB also sets the guidelines as to what is to be included in the appropriation limits. The appropriation limit for Redwood City for FY 2016-17 was $648,487,191 while the actual appropriations subject to the limit amounted to $97,696,342. The 2016-17 appropriation limit increased from FY 2015-16 due primarily to the increase (5.37%) in per capital personal income, one of the factors used in calculating the change in the appropriation limit. OTHER INFORMATION Annual Independent Audit The annual audit of the books and financial records of the City was completed by Badawi and Associates, certified public accountants appointed by the City Council. The independent auditor's report is part of this report, starting on page 1. Awards The Government Finance Officers Association (GFOA) awarded a Certificate of Achievement for Excellence in Financial Reporting to the City of Redwood City for its Comprehensive Annual Financial Report (CAFR) for the fiscal year ended June 30, 2016. This is the 30th consecutive year that Redwood City has received this prestigious award. In order to be awarded a certificate of achievement, a government must publish an easily readable and efficiently organized comprehensive annual financial report. This report must satisfy both accounting principles generally accepted in the United States of America and applicable legal requirements. A certificate of achievement is valid for a period of one year only. We believe that our current CAFR continues to meet the certificate of achievement program's requirements and are submitting it to the GFOA to determine its eligibility for another certificate. Acknowledgements The preparation of this report could not have been achieved without the skillful, dedicated and efficient services of the entire staff of the Finance Division. I would like to extend special recognition to Derek Rampone for his professionalism and leadership in overseeing this process. Special thanks must also be expressed to Jennifer Chang, Molly Flowerday, Carolyne Kerans, Jun Nguyen, and Sylvia Peters for their important contributions, and to Nancy Murguia for her support with the publication of this document. I would also like to thank and commend the City Council and City Manager for their ongoing interest and support in planning and conducting the financial operations of the City in a responsible and progressive manner in the best interests of the residents of Redwood City. Respectfully submitted,
Kimbra McCarthy Assistant City Manager of Administrative Services City of Redwood City Redwood City, California
vii

viii
CITY OF REDWOOD CITY - REDWOOD CITY, CALIFORNIA
PRINCIPAL OFFICIALS AS OF JUNE 30, 2017
CITY COUNCIL
John Seybert, Mayor ................................................................................November 2018 Ian Bain, Vice Mayor ................................................................................November 2020 Alicia C. Aguirre ........................................................................................November 2020 Janet Borgens ...........................................................................................November 2020 Jeffrey Gee ...............................................................................................November 2018 Diane Howard ..........................................................................................November 2018 Shelly Masur .............................................................................................November 2020
CITY MANAGER Melissa Stevenson Diaz
DEPARTMENT DIRECTORS
Assistant City Manager/Administrative Services.....................................Kimbra McCarthy Assistant City Manager/Community Development .................................Aaron Aknin City Clerk ..................................................................................................Silvia Vonderlinden Fire Chief ..................................................................................................Stan Maupin Library ......................................................................................................Derek Wolfgram Parks, Recreation, and Community Services ...........................................Chris Beth Police Chief ..............................................................................................JR Gamez Public Works ............................................................................................Ramana Chinnakotla
CITY ATTORNEY Veronica Ramirez
City of Redwood City 1017 Middlefield Road Redwood City, California 94063 Telephone: (650) 780-7070 Fax: (650) 366-2447 E-Mail: [email protected] Web Site: www.redwoodcity.org
ix
CITY OF REDWOOD CITY - REDWOOD CITY, CALIFORNIA
FINANCE DIVISION STAFF As of June 30, 2017
Derek Rampone ...................................................Financial Services Manager Jennifer Chang .....................................................Senior Accountant Carolyne Kerans ...................................................Senior Accountant Sylvia Bravo Peters ..............................................Management Analyst Molly Flowerday ..................................................Acting Accountant Gina Clark .............................................................Account Technician Anna Indy .............................................................Account Technician Lisa Crudo .............................................................Account Clerk
Nancy Murguia ....................................................Secretary
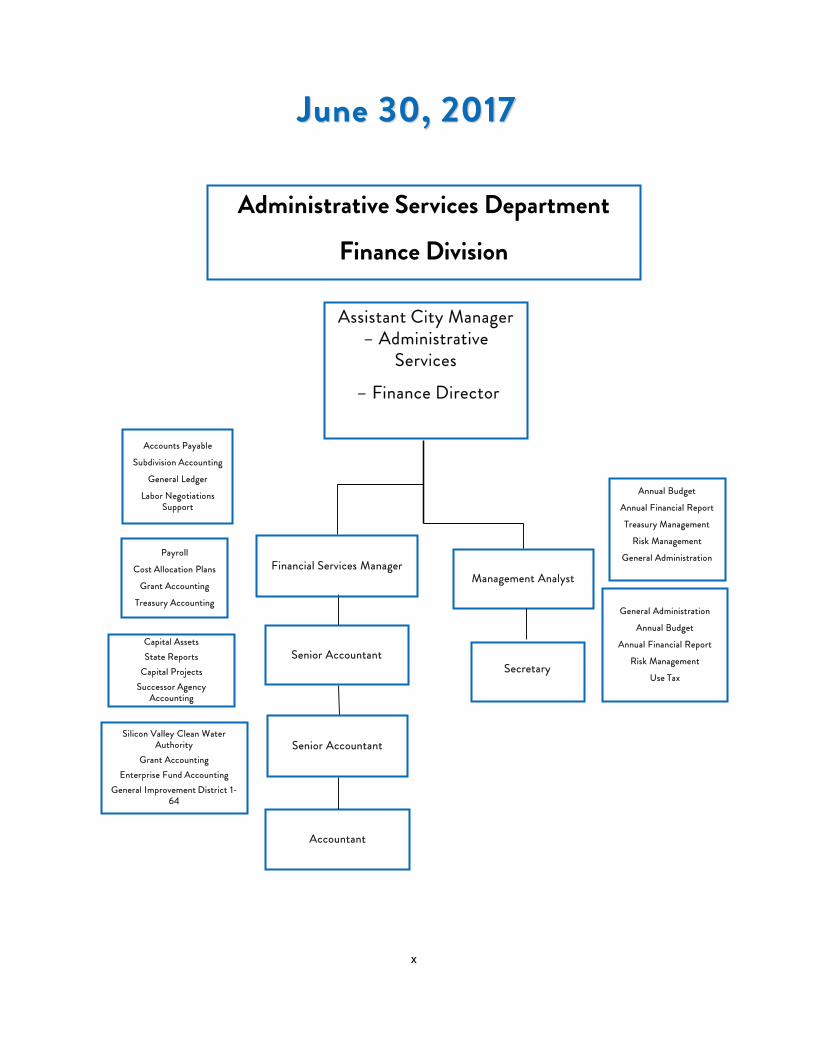
June 30, 2017
Administrative Services Department
Finance Division
Assistant City Manager – Administrative
Services
– Finance Director
Management Analyst
Accounts Payable
Subdivision Accounting
General Ledger
Labor Negotiations Support
General Administration
Annual Budget
Annual Financial Report
Risk Management
Use Tax
Senior Accountant
,
Annual Budget
Annual Financial Report
Treasury Management
Risk Management
General Administration
Accountant
Silicon Valley Clean Water Authority
Grant AccountingEnterprise Fund Accounting
General Improvement District 1-64
Secretary
Financial Services Manager
Senior Accountant
Capital AssetsState Reports
Capital ProjectsSuccessor Agency
Accounting
Payroll
Cost Allocation Plans
Grant Accounting
Treasury Accounting
x

June 30, 2017RESIDENTS
CITY COUNCILJohn D. Seybert, Mayor
Ian Bain, Vice Mayor
Alicia C. AguirreJanet Borgens
Jeffrey GeeDiane HowardShelly Masur
Senior Affairs Commission
Port Commission
Planning Commission
Parks, Rec. and
Community Services
Commission
Library BoardBoard of Building Review
Civic Cultural Commission
Housing and Human
Concerns Committee
Architectural Advisory
Committee
Historic Resources Advisory
Committee
Port
City AttorneyCity Manager,
City Clerk
Assistant City Manager
Library
Deputy City Manager
Complete Streets Advisory
Committee
Assistant City Manager
Parks,Recreation and
Community Services
Police Public Works
ServicesFireCommunity
DevelopmentAdministrative
Services
xi

xii�
CORE�PURPOSE�
Build�a�Great�Community�Together�
CORE�VALUES�
Excellence:�Passion�to�Do�Our�Best�in�Each�Moment�
Integrity:�Do�the�Right�Thing,�Not�the�Easy�Thing�
Service:�We�Care�and�It�Makes�a�Difference�
Creativity:�Freedom�to�Imagine�and�Courage�to�Act�

Address:����������� � ������� ������������������������������Phone:���������������������Fax: 510.768.8249
INDEPENDENT AUDITORS’ REPORT
To the Honorable Mayor and Members of City Council of the City of Redwood City Redwood City, California
Report on the Financial Statements We have audited the accompanying financial statements of the governmental activities, the business-type activities, each major fund, and the aggregate remaining fund information of the City of Redwood City, California (City), as of and for the fiscal year ended June 30, 2017, and the related notes to the financial statements, which collectively comprise the City’s basic financial statements as listed in the table of contents.
Management’s Responsibility for the Financial Statements
Management is responsible for the preparation and fair presentation of these financial statements in accordance with accounting principles generally accepted in the United States of America; this includes the design, implementation, and maintenance of internal control relevant to the preparation and fair presentation of financial statements that are free from material misstatement, whether due to fraud or error.
Auditor’s Responsibility
Our responsibility is to express opinions on these financial statements based on our audit. We did not audit the City’s investment in the Silicon Valley Clean Water Authority, which represents 37 percent, 39 percent and zero percent, respectively, of the City’s assets, net position, and revenues of the Sewer Utility Fund and 11 percent, 16 percent, and zero percent, respectively, of the assets, net position, and revenues of the business-type activities. The City’s investment in the Silicon Valley Clean Water Authority was audited by other auditors whose report has been furnished to us, and our opinion, insofar as it relates to the amount included for the City’s investment in the Silicon Valley Clean Water Authority, is based solely on the report of the other auditors. We conducted our audit in accordance with auditing standards generally accepted in the United States of America and the standards applicable to financial audits contained in Government Auditing Standards, issued by the Comptroller General of the United States. Those standards require that we plan and perform the audit to obtain reasonable assurance about whether the financial statements are free from material misstatement.
An audit involves performing procedures to obtain audit evidence about the amounts and disclosures in the financial statements. The procedures selected depend on the auditor’s judgment, including the assessment of the risks of material misstatement of the financial statements, whether due to fraud or error. In making those risk assessments, the auditor considers internal control relevant to the entity’s preparation and fair presentation of the financial statements in order to design audit procedures that are appropriate in the circumstances, but not for the purpose of expressing an opinion on the effectiveness of the entity’s internal control. Accordingly, we express no such opinion. An audit also includes evaluating the appropriateness of accounting policies used and the reasonableness of significant accounting estimates made by management, as well as evaluating the overall presentation of the financial statements.
1
Honorable Mayor and Members of City Council of the City of Redwood City
Redwood City, California Page 2
We believe that the audit evidence we have obtained is sufficient and appropriate to provide a basis for our audit opinions. Opinions In our opinion, the financial statements referred to above present fairly, in all material respects, the respective financial position of the governmental activities, the business-type activities, each major fund, and the aggregate remaining fund information of the City, as of June 30, 2017, and the respective changes in financial position, and, where applicable, cash flows thereof for the year then ended in accordance with accounting principles generally accepted in the United States of America. Other Matters Required Supplementary Information Accounting principles generally accepted in the United States of America require that the management’s discussion and analysis, budgetary comparison information, pension information, and schedules of funding progress other post-employment benefit plans on pages 4 to 18 and 86 to 93 be presented to supplement the basic financial statements. Such information, although not a part of the basic financial statements, is required by the Governmental Accounting Standards Board, who considers it to be an essential part of financial reporting for placing the basic financial statements in an appropriate operational, economic, or historical context. We have applied certain limited procedures to the required supplementary information in accordance with auditing standards generally accepted in the United States of America, which consisted of inquiries of management about the methods of preparing the information and comparing the information for consistency with management’s responses to our inquiries, the basic financial statements, and other knowledge we obtained during our audit of the basic financial statements. We do not express an opinion or provide any assurance on the information because the limited procedures do not provide us with sufficient evidence to express an opinion or provide any assurance. Other Information Our audit was conducted for the purpose of forming opinions on the financial statements that collectively comprise the City’s basic financial statements. The introductory section, general fund comparative statements, general fund comparative budgetary schedules on pages 95-99, combining and individual nonmajor fund financial statements, budgetary comparison information for non-major funds, and statistical section, are presented for purposes of additional analysis and are not a required part of the basic financial statements.
2
Honorable Mayor and Members of City Council of the City of Redwood City
Redwood City, California Page 3
The general fund comparative statements, comparative budgetary schedules on pages 95-99, combining and individual nonmajor fund financial statements, and budgetary comparison information for non-major funds are the responsibility of management and were derived from and relate directly to the underlying accounting and other records used to prepare the basic financial statements. Such information has been subjected to the auditing procedures applied in the audit of the basic financial statements and certain additional procedures, including comparing and reconciling such information directly to the underlying accounting and other records used to prepare the basic financial statements or to the basic financial statements themselves, and other additional procedures in accordance with auditing standards generally accepted in the United States of America. In our opinion, the general fund comparative statements, combining and individual nonmajor fund financial statements, and budgetary comparison information for non-major funds are fairly stated in all material respects in relation to the basic financial statements as a whole. The introductory and statistical sections have not been subjected to the auditing procedures applied in the audit of the basic financial statements and, accordingly, we do not express an opinion or provide any assurance on them. Other Reporting Required by Government Auditing Standards In accordance with Government Auditing Standards, we have also issued our report dated December 11, 2017, on our consideration of the City’s internal control over financial reporting and on our tests of its compliance with certain provisions of laws, regulations, contracts, and grant agreements and other matters. The purpose of that report is to describe the scope of our testing of internal control over financial reporting and compliance and the results of that testing, and not to provide an opinion on internal control over financial reporting or on compliance. That report is an integral part of an audit performed in accordance with Government Auditing Standards in considering City’s internal control over financial reporting and compliance.
Badawi and Associates Certified Public Accountants Oakland, California December 11, 2017
3

MANAGEMENT’S DISCUSSION AND ANALYSIS
4
This section of the City’s Comprehensive Annual Financial Report presents a narrative overview and analysis of the City’s financial activities for the fiscal year ended June 30, 2017. We encourage readers to consider the information presented here in conjunction with the accompanying transmittal letter and basic financial statements.
FISCAL YEAR 2016-17 FINANCIAL HIGHLIGHTS
During fiscal year 2016-17, the City experienced continued growth in revenues as the local economy continued to grow. Financial highlights of the fiscal year include the following:
� The City’s total net position increased $25.9 million in FY 2016-17, after a $30.6 million increase in the preceding fiscal year. At June 30, 2017, net position totaled $422.0 million, comprised of $165.2 million for governmental activities and $256.8 for business-type activities.
� Total City revenues, including program and general revenues, were $232.7 million, a decrease of $200 thousand over the prior fiscal year, while total expenses were $206.7 million, an increase of $4.5 million from FY 2015-16.
� Net position in governmental activities increased $5.5 million, while net position in business-type activities increased $20.4 million.
� Governmental program revenues were $38.0 million, which reflected a decrease of $2.9 million over the prior fiscal year.
� Governmental general revenues increased to $103.3 million in FY 2016-17, up $5.9 million from the prior fiscal year.
� Governmental program expenses increased to $134.1 million in FY 2016-17, up $7.8 million from the prior fiscal year.
� Total revenues from business-type activities decreased to $91.3 million in FY 2016-17, down $3.3 million from the prior fiscal year.
� Total expenses of business-type activities decreased to $73.6 million in FY 2016-17, a $3.3 million decrease over the prior fiscal year.
� General fund revenues of $129.6 million increased by $11.2 million over the prior fiscal year. � General fund expenditures of $112.1 million increased by $10.5 million over the prior fiscal year. � General fund balance of $32.4 million at June 30, 2017 increased by $3.9 million over the prior
fiscal year.
OVERVIEW OF THE COMPREHENSIVE ANNUAL FINANCIAL REPORT This Comprehensive Annual Financial Report is in six parts:
1. Introductory section, which includes the transmittal letter and general information 2. Management’s Discussion and Analysis 3. The Basic Financial Statements, which include the government-wide and the fund financial
statements, along with the notes to these financial statements 4. Required supplementary information 5. Combining statements for non-major governmental funds and fiduciary funds 6. Statistical information
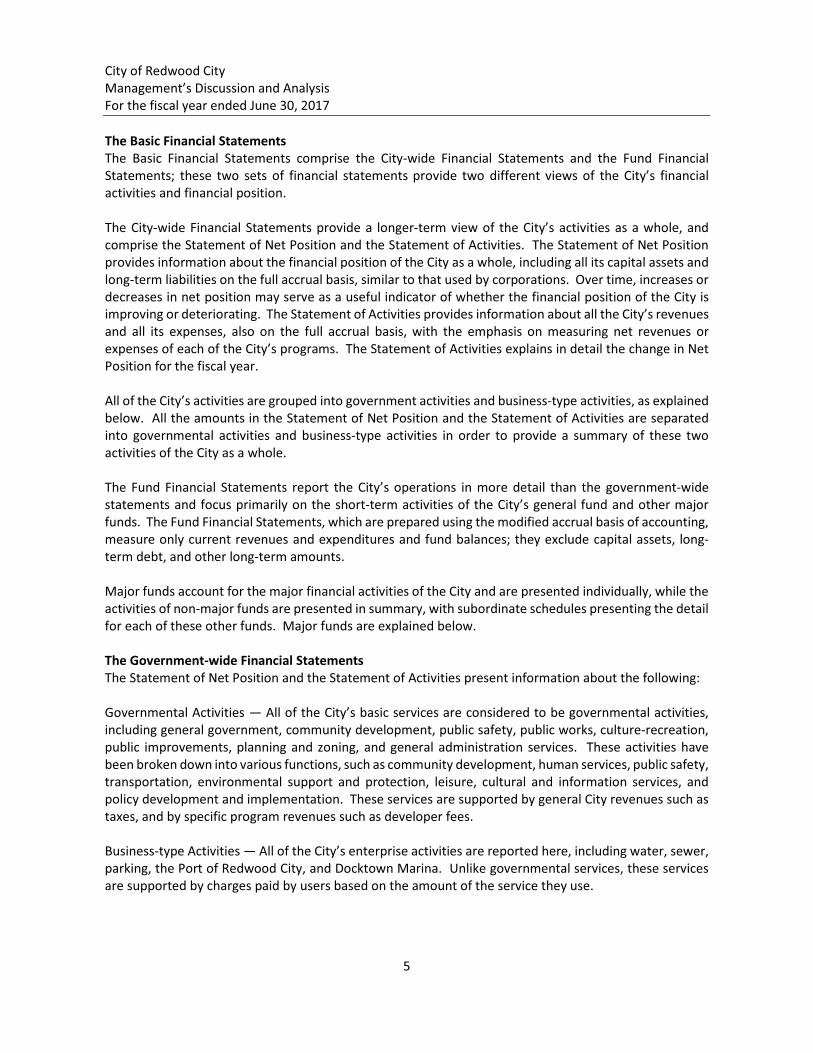
City of Redwood City Management’s Discussion and Analysis For the fiscal year ended June 30, 2017
5
The Basic Financial Statements The Basic Financial Statements comprise the City-wide Financial Statements and the Fund Financial Statements; these two sets of financial statements provide two different views of the City’s financial activities and financial position. The City-wide Financial Statements provide a longer-term view of the City’s activities as a whole, and comprise the Statement of Net Position and the Statement of Activities. The Statement of Net Position provides information about the financial position of the City as a whole, including all its capital assets and long-term liabilities on the full accrual basis, similar to that used by corporations. Over time, increases or decreases in net position may serve as a useful indicator of whether the financial position of the City is improving or deteriorating. The Statement of Activities provides information about all the City’s revenues and all its expenses, also on the full accrual basis, with the emphasis on measuring net revenues or expenses of each of the City’s programs. The Statement of Activities explains in detail the change in Net Position for the fiscal year. All of the City’s activities are grouped into government activities and business-type activities, as explained below. All the amounts in the Statement of Net Position and the Statement of Activities are separated into governmental activities and business-type activities in order to provide a summary of these two activities of the City as a whole. The Fund Financial Statements report the City’s operations in more detail than the government-wide statements and focus primarily on the short-term activities of the City’s general fund and other major funds. The Fund Financial Statements, which are prepared using the modified accrual basis of accounting, measure only current revenues and expenditures and fund balances; they exclude capital assets, long-term debt, and other long-term amounts. Major funds account for the major financial activities of the City and are presented individually, while the activities of non-major funds are presented in summary, with subordinate schedules presenting the detail for each of these other funds. Major funds are explained below. The Government-wide Financial Statements The Statement of Net Position and the Statement of Activities present information about the following: Governmental Activities — All of the City’s basic services are considered to be governmental activities, including general government, community development, public safety, public works, culture-recreation, public improvements, planning and zoning, and general administration services. These activities have been broken down into various functions, such as community development, human services, public safety, transportation, environmental support and protection, leisure, cultural and information services, and policy development and implementation. These services are supported by general City revenues such as taxes, and by specific program revenues such as developer fees. Business-type Activities — All of the City’s enterprise activities are reported here, including water, sewer, parking, the Port of Redwood City, and Docktown Marina. Unlike governmental services, these services are supported by charges paid by users based on the amount of the service they use.

City of Redwood City Management’s Discussion and Analysis For the fiscal year ended June 30, 2017
6
Government-wide financial statements are prepared on the full accrual basis, which means they measure the flow of all economic resources of the City as a whole. The government-wide financial statements may be found on pages 21-22 of this report. Fund Financial Statements A fund is a grouping of related accounts that is used to maintain control over resources that have been segregated for specific activities or objectives. The City of Redwood City, like other state and local governments, uses fund accounting to ensure and demonstrate compliance with finance-related legal requirements. All of the funds of the City of Redwood City can be divided into three categories: governmental funds, proprietary funds, and fiduciary funds. Fund financial statements provide detailed information about each of the City’s most significant funds, called major funds. The concept of major funds, and the determination of which are major funds, was established by GASB Statement 34 and replaces the concept of combining like funds and presenting them in total. Instead, each major fund is presented individually, with all non-major funds summarized and presented only in a single column. Subordinate schedules present the detail of these non-major funds. Major funds present the major activities of the City for the fiscal year, and may change from fiscal year to fiscal year as a result of changes in the pattern of the City’s activities. Governmental fund financial statements are prepared on the modified accrual basis, which means they measure only current financial resources and uses. Capital assets and other long-lived assets, along with long-term liabilities, are not presented in the governmental fund financial statements. Unlike the government-wide financial statements, governmental fund financial statements focus on near-term inflows and outflows of spendable resources, as well as on balances of spendable resources available at the end of the fiscal year. Such information may be useful in evaluating the City’s near-term financing requirements. Because the focus of governmental funds is narrower than that of the government-wide financial statements, it is useful to compare the information presented for governmental funds with similar information presented for governmental activities in the government-wide financial statements. By doing so, readers may better understand the long-term impact of the City’s near-term financing decisions. Both the governmental fund balance sheet and the governmental fund statement of revenues, expenditures, and changes in fund balances provide a reconciliation to facilitate this comparison between governmental funds and governmental activities. The City of Redwood City maintains 23 individual governmental funds. Information is presented separately in the governmental fund balance sheet and in the governmental fund statement of revenues, expenditures, and changes in fund balances for the General Fund and the Capital Outlay Fund, which meet the criteria to be considered major funds. Data from the other 21 governmental funds are combined into a single, aggregated presentation. Individual fund data for each of these non-major governmental funds is provided in the form of combining statements elsewhere in this report. The City of Redwood City adopts an annual appropriated budget for its General Fund. A budgetary comparison statement has been provided for the General Fund.

City of Redwood City Management’s Discussion and Analysis For the fiscal year ended June 30, 2017
7
The governmental fund financial statements may be found on pages 25 and 27 of this report. Proprietary funds are maintained in two ways. Enterprise funds are used to report the same functions presented as business-type activities in the government-wide financial statements. The City uses enterprise funds to account for water, sewer, parking, Port, and Docktown Marina operations. Internal services funds are used to account for costs of the City’s equipment services, the City’s insurance program, the costs of the City’s telephone/communications and information technology services, maintenance and repair of buildings, custodial services, and employee benefits. Because these services predominantly benefit governmental rather than business-type functions, they have been included within governmental activities in the government-wide financial statements. The proprietary fund financial statements may be found on pages 30-32 of this report. Since the City’s internal service funds provide goods and services only to the City’s governmental and business-type activities, their activities are reported only in total at the fund level. Internal service funds may not be major funds because their revenues are derived from other City funds. These revenues are eliminated in the City-wide financial statements and any related profits or losses are returned to the activities which created them, along with any residual net position of the internal service funds. Comparisons of budget and actual financial information are presented only for the general fund and other major funds that are special revenue funds. For the fiscal year ended June 30, 2017 there were no major special revenue funds. Fiduciary Funds The City maintains fiduciary funds that consist of a Private Purpose Trust Fund and Agency Funds. The Private Purpose Trust Fund accounts for the activity of the former Redevelopment Agency of Redwood City, while the Agency Funds account for tax free employee and employer contributions made under the provisions of section 125 of the Internal Revenue Code (cafeteria benefits fund), and for transactions involving the Pacific Shores Community Facilities District, the Shores Transportation Improvement District, the One Marina Community Facilities District, and the Community Benefit Improvement District. The City’s fiduciary activities are reported in the separate Statement of Fiduciary Net Position, Statement of Changes in Fiduciary Net Position, and the Agency Funds Statement of Changes in Assets and Liabilities. The accounting used for fiduciary funds is much like that used for proprietary funds. These activities are excluded from the City’s other financial statements because the City cannot use these assets to finance its own operations. The fiduciary fund financial statements may be found on pages 33-34 of this report. Notes to the Financial Statements Notes to the Financial Statements provide additional information that is essential to a full understanding of the data provided in the government-wide and fund financial statements. The Notes to the Financial Statements may be found on pages 35-85 of this report.
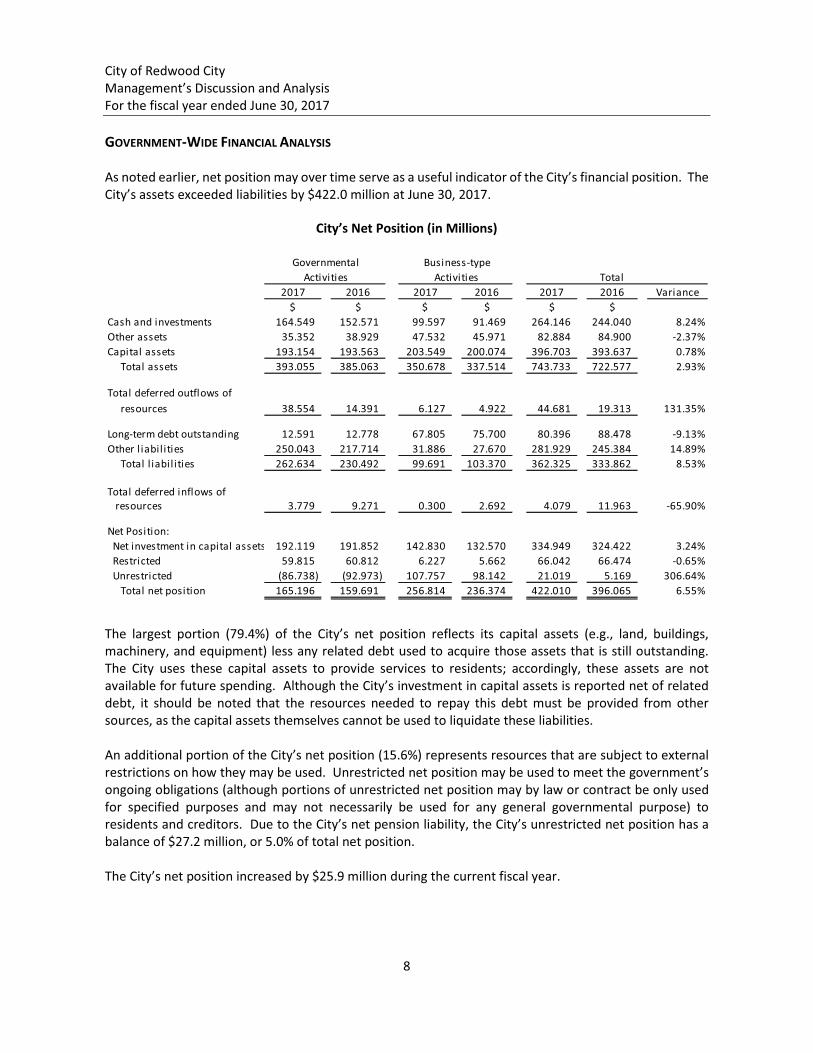
City of Redwood City Management’s Discussion and Analysis For the fiscal year ended June 30, 2017
8
GOVERNMENT-WIDE FINANCIAL ANALYSIS As noted earlier, net position may over time serve as a useful indicator of the City’s financial position. The City’s assets exceeded liabilities by $422.0 million at June 30, 2017.
City’s Net Position (in Millions)
The largest portion (79.4%) of the City’s net position reflects its capital assets (e.g., land, buildings, machinery, and equipment) less any related debt used to acquire those assets that is still outstanding. The City uses these capital assets to provide services to residents; accordingly, these assets are not available for future spending. Although the City’s investment in capital assets is reported net of related debt, it should be noted that the resources needed to repay this debt must be provided from other sources, as the capital assets themselves cannot be used to liquidate these liabilities. An additional portion of the City’s net position (15.6%) represents resources that are subject to external restrictions on how they may be used. Unrestricted net position may be used to meet the government’s ongoing obligations (although portions of unrestricted net position may by law or contract be only used for specified purposes and may not necessarily be used for any general governmental purpose) to residents and creditors. Due to the City’s net pension liability, the City’s unrestricted net position has a balance of $27.2 million, or 5.0% of total net position. The City’s net position increased by $25.9 million during the current fiscal year.
Governmental Business-typeActivities Activities Total
2017 2016 2017 2016 2017 2016 Variance$ $ $ $ $ $
Cash and investments 164.549 152.571 99.597 91.469 264.146 244.040 8.24%Other assets 35.352 38.929 47.532 45.971 82.884 84.900 -2.37%Capital assets 193.154 193.563 203.549 200.074 396.703 393.637 0.78% Total assets 393.055 385.063 350.678 337.514 743.733 722.577 2.93%
Total deferred outflows of resources 38.554 14.391 6.127 4.922 44.681 19.313 131.35%
Long-term debt outstanding 12.591 12.778 67.805 75.700 80.396 88.478 -9.13%Other l iabil ities 250.043 217.714 31.886 27.670 281.929 245.384 14.89% Total l iabil ities 262.634 230.492 99.691 103.370 362.325 333.862 8.53%
Total deferred inflows of resources 3.779 9.271 0.300 2.692 4.079 11.963 -65.90%
Net Position: Net investment in capital assets 192.119 191.852 142.830 132.570 334.949 324.422 3.24% Restricted 59.815 60.812 6.227 5.662 66.042 66.474 -0.65% Unrestricted (86.738) (92.973) 107.757 98.142 21.019 5.169 306.64% Total net position 165.196 159.691 256.814 236.374 422.010 396.065 6.55%
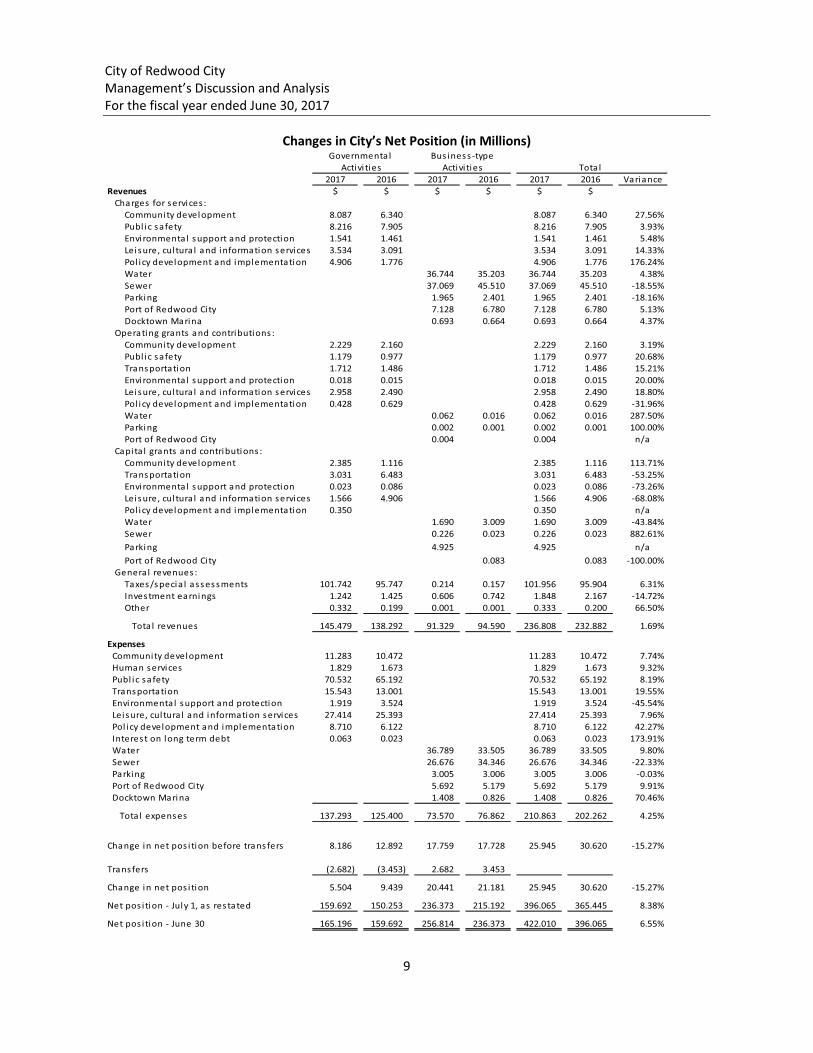
City of Redwood City Management’s Discussion and Analysis For the fiscal year ended June 30, 2017
9
Changes in City’s Net Position (in Millions)
Governmenta l Bus iness -type Activi ties Activi ties Tota l
2017 2016 2017 2016 2017 2016 VarianceRevenues $ $ $ $ $ $ Charges for services : Community development 8.087 6.340 8.087 6.340 27.56% Publ ic safety 8.216 7.905 8.216 7.905 3.93% Envi ronmenta l support and protection 1.541 1.461 1.541 1.461 5.48% Leisure, cul tura l and information services 3.534 3.091 3.534 3.091 14.33% Pol icy development and implementation 4.906 1.776 4.906 1.776 176.24% Water 36.744 35.203 36.744 35.203 4.38% Sewer 37.069 45.510 37.069 45.510 -18.55% Parking 1.965 2.401 1.965 2.401 -18.16% Port of Redwood Ci ty 7.128 6.780 7.128 6.780 5.13% Docktown Marina 0.693 0.664 0.693 0.664 4.37% Operating grants and contributions : Community development 2.229 2.160 2.229 2.160 3.19% Publ ic safety 1.179 0.977 1.179 0.977 20.68% Transportation 1.712 1.486 1.712 1.486 15.21% Envi ronmenta l support and protection 0.018 0.015 0.018 0.015 20.00% Leisure, cul tura l and information services 2.958 2.490 2.958 2.490 18.80% Pol icy development and implementation 0.428 0.629 0.428 0.629 -31.96% Water 0.062 0.016 0.062 0.016 287.50% Parking 0.002 0.001 0.002 0.001 100.00% Port of Redwood Ci ty 0.004 0.004 n/a Capi ta l grants and contributions : Community development 2.385 1.116 2.385 1.116 113.71% Transportation 3.031 6.483 3.031 6.483 -53.25% Envi ronmenta l support and protection 0.023 0.086 0.023 0.086 -73.26% Leisure, cul tura l and information services 1.566 4.906 1.566 4.906 -68.08% Pol icy development and implementation 0.350 0.350 n/a Water 1.690 3.009 1.690 3.009 -43.84% Sewer 0.226 0.023 0.226 0.023 882.61% Parking 4.925 4.925 n/a Port of Redwood Ci ty 0.083 0.083 -100.00% Genera l revenues : Taxes/specia l assessments 101.742 95.747 0.214 0.157 101.956 95.904 6.31% Investment earnings 1.242 1.425 0.606 0.742 1.848 2.167 -14.72% Other 0.332 0.199 0.001 0.001 0.333 0.200 66.50%
Tota l revenues 145.479 138.292 91.329 94.590 236.808 232.882 1.69%
Expenses Community development 11.283 10.472 11.283 10.472 7.74% Human services 1.829 1.673 1.829 1.673 9.32% Publ ic safety 70.532 65.192 70.532 65.192 8.19% Transportation 15.543 13.001 15.543 13.001 19.55% Envi ronmenta l support and protection 1.919 3.524 1.919 3.524 -45.54% Leisure, cul tura l and information services 27.414 25.393 27.414 25.393 7.96% Pol icy development and implementation 8.710 6.122 8.710 6.122 42.27% Interest on long term debt 0.063 0.023 0.063 0.023 173.91% Water 36.789 33.505 36.789 33.505 9.80% Sewer 26.676 34.346 26.676 34.346 -22.33% Parking 3.005 3.006 3.005 3.006 -0.03% Port of Redwood Ci ty 5.692 5.179 5.692 5.179 9.91% Docktown Marina 1.408 0.826 1.408 0.826 70.46%
Tota l expenses 137.293 125.400 73.570 76.862 210.863 202.262 4.25%
Change in net pos i tion before transfers 8.186 12.892 17.759 17.728 25.945 30.620 -15.27%
Transfers (2.682) (3.453) 2.682 3.453 Change in net pos i tion 5.504 9.439 20.441 21.181 25.945 30.620 -15.27%
Net pos i tion - July 1, as restated 159.692 150.253 236.373 215.192 396.065 365.445 8.38%
Net pos i tion - June 30 165.196 159.692 256.814 236.373 422.010 396.065 6.55%

City of Redwood City Management’s Discussion and Analysis For the fiscal year ended June 30, 2017
10
GOVERNMENTAL ACTIVITIES Governmental activities prior to transfers increased the City’s net position by $8.2 million. Including transfers, governmental activities net position increased $5.5 million. Transfers out of governmental activities and into business-type activities during FY 2016-17 consisted of the transfer out of the General Fund to the Docktown Marina fund of $2.4 million to cover litigation settlement expenses related to ending residential uses at the marina, a transfer out of the General Fund to the Water Fund in the amount of $200 thousand to support operations, and a transfer out of the General Fund to the Parking Fund in the amount of $100 thousand to support operations. Key elements of the increase/decrease in revenues for governmental activities are as follows: General governmental revenues (non-program) increased by 6.1%, or $5.9 million from FY 2015-16, as almost all broad categories of general revenues increased, other than franchise taxes, property transfer taxes, motor vehicle in lieu tax, and investment earnings, which all decreased. Within the broad categories, property taxes increased $4.6 million, sales taxes increased $1.3 million (including transportation-related sales taxes that were not included in prior fiscal year calculations), franchise taxes decreased $28 thousand, property transfer taxes decreased $136 thousand, business license taxes increased $98 thousand, utility users’ taxes increased $195 thousand, transient occupancy taxes increased $101 thousand, motor vehicle in lieu tax decreased $132 thousand, and investment earnings decreased $183 thousand, and other revenues increased $133 thousand. Community development revenues increased due to an increase in building permits issued and an increase in capital grants and contributions. Public safety revenues increased primarily due to an increase in fees collected for full fire services provided by Redwood City to the City of San Carlos through an agreement between the Cities. Transportation revenues decreased due to a decrease in Measure A grant revenues received. Environmental support and protection revenues increased slightly due to an increase in property tax revenues in the various maintenance district funds. Leisure, cultural and information services decreased primarily due to a large decrease in the receipt of Park Impact Fees. Policy development and implementation revenue increased due to including $4.1 million of right-of-way rent received from the Water and Sewer Funds, which had been eliminated (consolidated) in prior fiscal year CAFRs. The increase in revenue was offset by the elimination (consolidation) of lease revenue of $700 thousand in the Public Financing Authority Debt Service Fund that was previously reported in this function. Key elements of the increase/decrease in expenses for governmental activities are as follows: Total governmental activities expenses were up $11.9 million, or 9.5%, due to increases in almost all functions, except environmental support and protection. Interest on long-term debt increased slightly to $63 thousand. Community development expenses increased $811 thousand primarily due to increases in community planning, strategic planning, administration, general engineering, subdivision engineering, and code enforcement. Human services expenses increased slightly ($156 thousand) due to general increases related to supplies and services costs. Public safety expenses increased by $5.3 million primarily due to increases in all police expenditure accounts, as well as an increase in all fire expenditure accounts. A large component of these increased expenses is the recording of the increase in the City’s CalPERS retirement obligation. Transportation expenses increased $2.5 million due to including street tree maintenance expenditures in this category instead of in leisure, cultural, and information services as it had been presented in prior fiscal years. Transportation expenses also increased as a result of increased

City of Redwood City Management’s Discussion and Analysis For the fiscal year ended June 30, 2017
11
expenditures in the Capital Outlay Fund (for non-capitalized transportation project expenditures), the Special Gas Tax Street Improvement Fund, the Transportation Fund, and the Traffic Mitigation Fees Fund, offset by a decrease in the Transportation Grants Fund and Traffic Mitigation Fees Fund. Environmental support and protection decreased $1.6 million mostly due to an increase in the internal service funds’ operating income in FY 2016-17, of which a large portion of this income is offset against environmental support and protection expenses. Leisure, cultural, and information services increased $2.0 million due to increased costs to operate the Library, including the literary services and neighborhood libraries and outreach. Also included in this increase are increases in various Parks, Recreation, and Community Services Department categories, such as community services and special interest programming/marketing. Policy development and implementation increased $2.6 million due to increases in management/policy execution and the decrease in the reimbursement from other funds in FY 2016-17 as a result of not eliminating the $4.1 million of right-of-way rent received from the Water and Sewer Funds, which had been previously presented as an offset to policy development and implementation expenses. The increases in policy development and implementation expenses was partially offset by a decrease in legal services and less expenditures in the capital outlay fund related to non-capitalized policy development and implementation expenditures (projects). During FY 2016-17 there was an increase of $40 thousand in interest expense related to the outstanding 2013 Public Financing Authority Refunding Lease. BUSINESS-TYPE ACTIVITIES Business-type activities prior to transfers increased the City’s net position by $17.8 million in FY 2016-17. Key elements accounting for increases or decreases in revenues and expenses are as follows: Business-type revenues increased primarily due to the increase in utility rates and a large increase in parking in-lieu fees collected. There was a decrease in Sewer Fund revenues in FY 2016-17 due to a small increase in the value of our investment in the Silicon Valley Clean Water Authority (SVCWA) of $153 thousand during the FY 2016-17, compared to an increase of $10.8 million in FY 2015-16. A large part of this increase in the value of the investment in FY 2015-16 was due to our contribution of $10 million to partially supplant our portion of the bond issued by the Authority in FY 2015-16. Port revenues increased by $269 thousand mostly due to increased user fees. The water utility’s expenses were higher in FY 2016-17 due to an increase in the rates charged for water by the San Francisco Public Utilities Commission, an increase in employee costs, supplies and services, depreciation, and insurance costs and claims, offset by decreases in maintenance, utility costs, and contractual services. Sewer utility expenses increased by $3.1 million, not including the $10.8 million payment to SVCWA in FY 2015-16. The increase consists of an increase in payments to SVCWA for wastewater treatment, and debt service reimbursement for SVCWA debt issued for wastewater system capital improvements, as well as an increase in employee costs, maintenance, supplies and services, depreciation, and insurance costs and claims, offset by decreases in utility costs and non-capitalized project costs. The expenses of the parking fund essentially stayed the same, with a decrease of only $773 from the prior fiscal year.

City of Redwood City Management’s Discussion and Analysis For the fiscal year ended June 30, 2017
12
The expenses of the Port of Redwood City experienced a slight increase of $513 thousand due to an increase in employee costs, maintenance, and depreciation, offset by decreases in utility costs, contractual services, supplies and services, and insurance and claims. During fiscal year 2016-17, the Docktown Marina expenses increased by $582 thousand, primarily due to an increase in contractual services related to ending residential uses of the marina, offset by a decrease in employee costs.
FINANCIAL ANALYSIS OF THE CITY’S FUNDS As noted earlier, the City uses fund accounting to ensure and demonstrate compliance with finance-related legal requirements. Governmental Funds The general government functions are contained in the general, special revenue, debt service, and capital project funds. The focus of the City’s governmental funds is to provide information on near-term inflows, outflows, and balances of spendable resources by using the modified accrual basis of accounting. Such information is useful in assessing the City’s financing requirements. In particular, unassigned fund balance may serve as a useful measure of the City’s net resources available for spending at the end of the fiscal year. At June 30, 2017, the City’s governmental funds reported combined fund balances of $130.6 million, which reflects an increase of $5.7 million from the beginning fund balance. Governmental fund revenues increased $8.8 million this fiscal year to $145.7 million. Significant increases occurred in the general fund, low and moderate income housing asset fund, and community benefits fund, which were offset by a large decrease in the parks impact and in lieu fee fund. Expenditures, including capital outlay, increased $4.6 million this fiscal year to $136.3 million. A large part of the increase was attributable to the $10.5 million expenditure increase in the general fund, described below, offset by decreases in every other fund except the traffic safety fund, transportation fund, redwood shores maintenance fund, supplemental law enforcement services fund, traffic mitigation fees fund, low and moderate income housing asset fund, planning cost recovery fund, and the new art in public places fund. The general fund is the primary operating fund of the City. At June 30, 2017, unassigned fund balance of the general fund was $29.4 million, while total fund balance increased to $32.4 million from a beginning fund balance of $28.4 million, as a result of revenues and transfers in of $130.4 million, exceeding expenditures and transfers out of $126.4 million. Unassigned fund balance increased $4.2 million during the current fiscal year, providing additional resources available for ongoing operations when compared to the prior fiscal year. During FY 2016-17, the City Council approved a reduction in the General Fund reserve from 20% to 15%, with the excess balance being utilized to set up a Section 115 Trust Account to fund pension expenses. It is expected that at least $8.8 million will be deposited into this Trust Account in FY 2017-18. As a measure of the general fund’s liquidity, it may be useful to compare both unassigned fund balance and total fund balance to total fund expenditures. Unassigned fund balance represents 26.2% of total fund expenditures, while total fund balance represents 28.9% of that same amount. The following are the major funds that qualified under the reporting criteria for major funds selection:
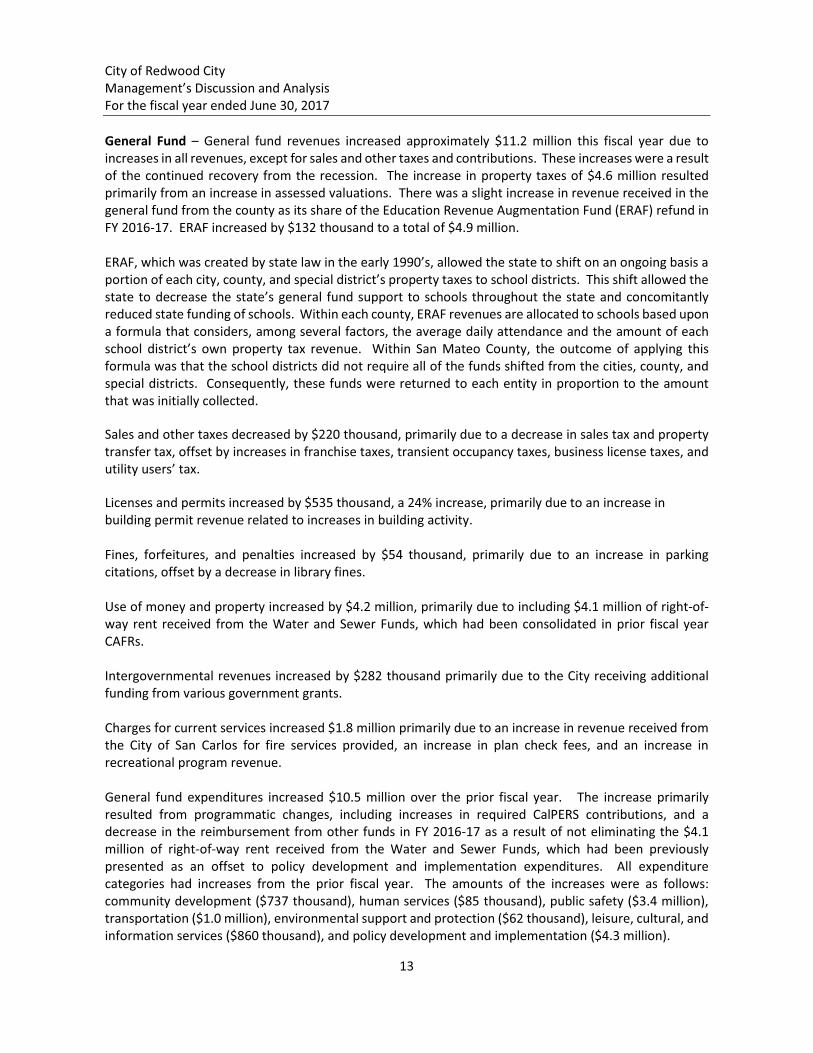
City of Redwood City Management’s Discussion and Analysis For the fiscal year ended June 30, 2017
13
General Fund – General fund revenues increased approximately $11.2 million this fiscal year due to increases in all revenues, except for sales and other taxes and contributions. These increases were a result of the continued recovery from the recession. The increase in property taxes of $4.6 million resulted primarily from an increase in assessed valuations. There was a slight increase in revenue received in the general fund from the county as its share of the Education Revenue Augmentation Fund (ERAF) refund in FY 2016-17. ERAF increased by $132 thousand to a total of $4.9 million. ERAF, which was created by state law in the early 1990’s, allowed the state to shift on an ongoing basis a portion of each city, county, and special district’s property taxes to school districts. This shift allowed the state to decrease the state’s general fund support to schools throughout the state and concomitantly reduced state funding of schools. Within each county, ERAF revenues are allocated to schools based upon a formula that considers, among several factors, the average daily attendance and the amount of each school district’s own property tax revenue. Within San Mateo County, the outcome of applying this formula was that the school districts did not require all of the funds shifted from the cities, county, and special districts. Consequently, these funds were returned to each entity in proportion to the amount that was initially collected.
Sales and other taxes decreased by $220 thousand, primarily due to a decrease in sales tax and property transfer tax, offset by increases in franchise taxes, transient occupancy taxes, business license taxes, and utility users’ tax.
Licenses and permits increased by $535 thousand, a 24% increase, primarily due to an increase in building permit revenue related to increases in building activity. Fines, forfeitures, and penalties increased by $54 thousand, primarily due to an increase in parking citations, offset by a decrease in library fines. Use of money and property increased by $4.2 million, primarily due to including $4.1 million of right-of-way rent received from the Water and Sewer Funds, which had been consolidated in prior fiscal year CAFRs. Intergovernmental revenues increased by $282 thousand primarily due to the City receiving additional funding from various government grants. Charges for current services increased $1.8 million primarily due to an increase in revenue received from the City of San Carlos for fire services provided, an increase in plan check fees, and an increase in recreational program revenue. General fund expenditures increased $10.5 million over the prior fiscal year. The increase primarily resulted from programmatic changes, including increases in required CalPERS contributions, and a decrease in the reimbursement from other funds in FY 2016-17 as a result of not eliminating the $4.1 million of right-of-way rent received from the Water and Sewer Funds, which had been previously presented as an offset to policy development and implementation expenditures. All expenditure categories had increases from the prior fiscal year. The amounts of the increases were as follows: community development ($737 thousand), human services ($85 thousand), public safety ($3.4 million), transportation ($1.0 million), environmental support and protection ($62 thousand), leisure, cultural, and information services ($860 thousand), and policy development and implementation ($4.3 million).

City of Redwood City Management’s Discussion and Analysis For the fiscal year ended June 30, 2017
14
Transfers out of the general fund decreased by $3.2 million in FY 2016-17 primarily due to a decrease of $3.0 million in the transfer to the self-insurance internal service fund to cover increased workers’ compensation costs. Capital Outlay Fund – This fund accounts for resources provided to finance general governmental capital projects. In FY 2016-17, the capital outlay fund generated $1.3 million in revenue, most of which was from public, educational, and governmental fees, interest income, and contributions. This fund was also the recipient of $8.9 million of transfers from the general fund from the Utility Users’ Tax, which has been allocated to support the City’s infrastructure. Total outlays were $8.7 million, of which $3.7 million met the City’s criteria for capitalization. The balance ($5.0 million) was expended on non-capitalized projects in FY 2016-17. Total outlays in the prior fiscal year (FY 2014-15) were $12.8 million. Of the capital outlay fund’s $29.6 million fund balance, $26.7 million was committed to capital projects, and $2.9 million was assigned to capital projects. Proprietary Funds – Enterprise fund net position totaled $256.8 million at the end of the fiscal year, an increase of $20.4 million over the prior fiscal year balance of $236.4 million. Enterprise operating revenues were $83.6 million this fiscal year, an increase of $3.8 million over last fiscal year, while net non-operating revenues (expenses) were a negative $2.5 million compared to a positive $8.8 million the prior fiscal year. Net non-operating revenues (expenses) experienced a $11.2 million decrease primarily due to a decrease in investment revenues of $289 thousand, and a decrease in the change in the investment in SVCWA of $10.6 million (current fiscal year increase of $153 thousand versus an increase of $10.8 million in the prior fiscal year). Enterprise fund operating expenses were $70.2 million this fiscal year, down $3.7 million from the prior fiscal year, primarily due to lower operating expenses in the sewer utility fund ($7.7 million), offset by increases in operating expenses in the water utility fund ($3.2 million), the port fund ($150 thousand), and the Docktown Marina fund ($582 thousand). Water Utility – The water utility fund realized operating income of $2.3 million in the current fiscal year, down from the operating income of $4.0 million in the prior fiscal year. Operating revenues increased by $1.5 million, while operating expenses increased by $3.2 million. After non-operating revenues (expenses), capital contributions, and transfers into the water fund, net position increased by $2.4 million. Sewer Utility – The sewer utility fund realized operating income of $10.4 million in the current fiscal year, up from the operating income of $406 thousand in the prior fiscal year. Operating revenues increased by $2.3 million, while operating expenses decreased by $7.7 million from the prior fiscal year, primarily due to the City’s $10.0 million contribution to SVCWA in the prior fiscal year, which was reported as an operating expense. During the current fiscal year, there was no debt issue at SVCWA. After non-operating revenues (expenses), capital contributions, and transfers out of the sewer fund, net position increased by $10.5 million. Parking Fund – Operating revenues decreased by $436 thousand this fiscal year to $2.0 million, while operating expenses were comparable to last year, decreasing by $773 to $3.0 million. After non-operating revenues (expenses), capital contributions, and transfers into the parking fund, net position increased by $4.3 million.

City of Redwood City Management’s Discussion and Analysis For the fiscal year ended June 30, 2017
15
Port Fund – Operating revenues were up $348 thousand while operating expenses were up $149 thousand over FY 2015-16. After non-operating revenues (expenses), net position increased by $1.5 million. Docktown Marina – Operating revenues increased by $30 thousand while operating expenses increased by $582 thousand. During FY 2016-17, the General Fund transferred $2.4 million into the Docktown Marina Fund in relation to a litigation settlement agreement to end residential uses at the marina. After non-operating revenues (expenses) and transfers into the Docktown Marina fund, net position increased by $1.7 million, primarily due to the $2.4 million transfer from the General Fund. GENERAL FUND BUDGETARY HIGHLIGHTS Property taxes exceeded budget by $2.2 million primarily due to the continued strength of the housing market. Sales and other taxes were less than budget by $444 thousand primarily due to shortfalls in transient occupancy tax and sales tax. Licenses and permits were less than budget by $509 thousand due to building permits and fire permits coming in lower than expected. Use of money and property revenue was less than budget by $13 thousand due to greater investment earnings than expected as investment returns continued to rise, but lower than expected rents and concessions revenue. Intergovernmental revenue was greater than budget by $1.1 million, primarily due to higher than expected governmental grants received in the current fiscal year. Charges for current services were greater than budget by $1.6 million primarily due to recreation program fees exceeding expectations, offset by garbage collection revenues falling short of budget. Other revenue was under budget by $291 thousand due to miscellaneous revenues falling short of expected receipts, offset by higher than expected contributions. Expenditures, overall, were $844 thousand less than budgeted primarily due to accurate budgeting by most departments. Unexpected shortfalls in community development, transportation, environmental support and protection and leisure, cultural, and information services were more than offset by budget savings in human services, public safety, and policy development and implementation. CAPITAL ASSETS AND DEBT ADMINISTRATION Capital Assets At the end of FY 2016-17, the City had $393.6 million, net of depreciation, invested in a broad range of capital assets used in governmental and business-type activities, as shown in the table below. Additional information on the City’s capital assets can be found in Note 4 of this report.

City of Redwood City Management’s Discussion and Analysis For the fiscal year ended June 30, 2017
16
Capital Assets at fiscal Year-end (in Millions)
Governmental Activities – Streets increased due to the completion of the Depot Circle improvements project, the Broadway roadway improvements project, and the City’s acceptance of developer improvements at several sites throughout the City. Equipment increased due to the replacement and addition of 18 vehicles through the equipment replacement program. Improvements increased due to the completion of a new citywide telephone system and the new HVAC at the Fair Oaks Community Center. Parks and bridges increased due to the completion of the renovation of Red Morton Park and the replacement of the synthetic turf fields and lighting systems. Traffic signals and Storm drains increased due to the City’s acceptance of developer improvements at several sites throughout the City. Construction in progress increased primarily due to work on the Blomquist extension project, the improvements to the Armory at Red Morton Park, renovations to several tennis courts, upgrades to the playground at the Redwood Shores Library, and the Linden Park renovation. Business-Type Activities –Equipment increased slightly due to the purchase of equipment at the Port. Increases in the improvements category were due to the completion of a portion of the replacement of the water distribution system, the sewer collection system, the sewer rehabilitation program, the collection system replacement program, and the utility relocation project in the Jefferson Garage. Construction in progress increased primarily due to work done on the Walnut Street Interceptor Replacement program.
Governmental Business-Type Activities Activities Total
2017 2016 2017 2016 2017 2016 Variance$ $ $ $ $ $
Land 31.397 31.397 3.180 3.180 34.577 34.577 0.00%Streets 116.873 114.667 116.873 114.667 1.92%Construction in progress 21.616 24.539 14.116 10.008 35.732 34.547 3.43%Buildings 83.309 83.309 62.467 62.467 145.776 145.776 0.00%Equipment 25.627 24.622 1.709 1.684 27.336 26.306 3.92%Improvements 9.049 7.884 201.516 196.336 210.565 204.220 3.11%Harbor improvements 4.774 4.774 4.774 4.774 0.00%Parks, bridges, etc. 38.703 32.210 38.703 32.210 20.16%Traffic signals 3.096 2.641 3.096 2.641 17.23%Storm drains 12.420 12.190 12.420 12.190 1.89%Less accumulated depreciation (148.936) (139.895) (84.213) (78.376) (233.149) (218.271) 6.82%
Total capital assets 193.154 193.564 203.549 200.073 396.703 393.637 0.78%
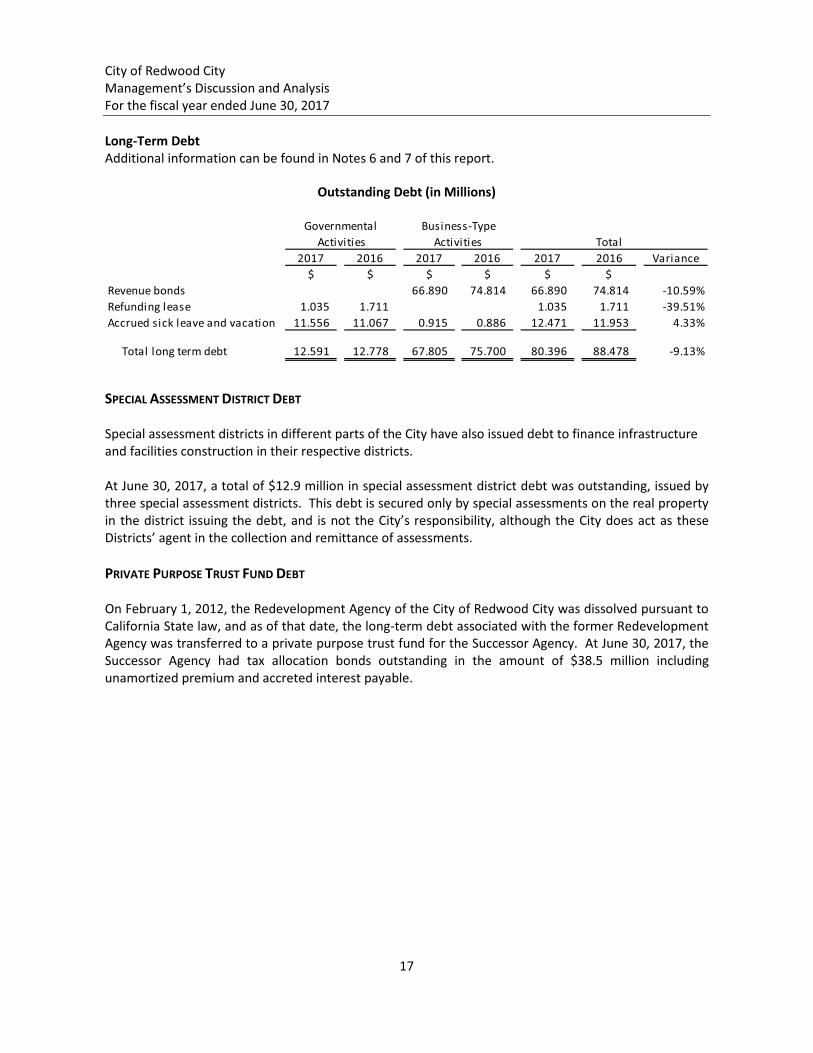
City of Redwood City Management’s Discussion and Analysis For the fiscal year ended June 30, 2017
17
Long-Term Debt Additional information can be found in Notes 6 and 7 of this report.
Outstanding Debt (in Millions)
SPECIAL ASSESSMENT DISTRICT DEBT Special assessment districts in different parts of the City have also issued debt to finance infrastructure and facilities construction in their respective districts. At June 30, 2017, a total of $12.9 million in special assessment district debt was outstanding, issued by three special assessment districts. This debt is secured only by special assessments on the real property in the district issuing the debt, and is not the City’s responsibility, although the City does act as these Districts’ agent in the collection and remittance of assessments. PRIVATE PURPOSE TRUST FUND DEBT On February 1, 2012, the Redevelopment Agency of the City of Redwood City was dissolved pursuant to California State law, and as of that date, the long-term debt associated with the former Redevelopment Agency was transferred to a private purpose trust fund for the Successor Agency. At June 30, 2017, the Successor Agency had tax allocation bonds outstanding in the amount of $38.5 million including unamortized premium and accreted interest payable.
Governmental Business-Type Activities Activities Total
2017 2016 2017 2016 2017 2016 Variance$ $ $ $ $ $
Revenue bonds 66.890 74.814 66.890 74.814 -10.59%Refunding lease 1.035 1.711 1.035 1.711 -39.51%Accrued sick leave and vacation 11.556 11.067 0.915 0.886 12.471 11.953 4.33%
Total long term debt 12.591 12.778 67.805 75.700 80.396 88.478 -9.13%
City of Redwood City Management’s Discussion and Analysis For the fiscal year ended June 30, 2017
18
ECONOMIC OUTLOOK AND NEXT FISCAL YEAR’S BUDGET Redwood City, like many cities, relies heavily upon property taxes and sales taxes to finance general governmental activities. In FY 2016-17, these two revenue streams accounted for approximately 40.5% and 17.2% of general fund revenues respectively. In FY 2016-17, the City experienced a significant gain in property tax revenue, with an increase of 9.6% in the general fund. However, general fund sales tax revenue decreased by 2.1%. The increase in property tax revenue is attributed to the turnover of real estate properties and booming housing market. The decrease in sales tax revenue reflects a change in consumer spending habits, where online purchasing is growing and consumers are spending more on non-taxable “experiences” rather than material goods. Moreover, pension costs are escalating and the City has other liabilities and funding commitments to address. As a result, maintaining the long-term fiscal stability of the City remains a top priority. The adopted FY 2017-18 general fund budget projects a surplus of $2.0 million, and relies on ongoing revenue to fund ongoing expenses, uses one-time revenue for one-time expenses, and maintains a prudent general fund reserve of 15%. For the foreseeable future, the City's pension contributions are estimated to increase annually due to changes in actuarial assumptions and investment methodologies made by the California Public Employees Retirement System. Moreover, it is unknown when another recession will occur, but certain factors point to a slowing of the economy over the next few years. These factors will be taken into consideration when developing the FY 2018-19 budget and Financial Sustainability Plan. CONTACTING THE CITY’S FINANCIAL MANAGEMENT This Comprehensive Annual Financial Report is intended to provide citizens, taxpayers, investors, and creditors with a general overview of the City’s finances. Questions about this report should be directed to the Finance Division, at 1017 Middlefield Road, Redwood City, CA 94063.

�
�������������
������
City�of�Redwood�City�Comprehensive�Annual�Financial�Report�
June�30,�2017�� �
19
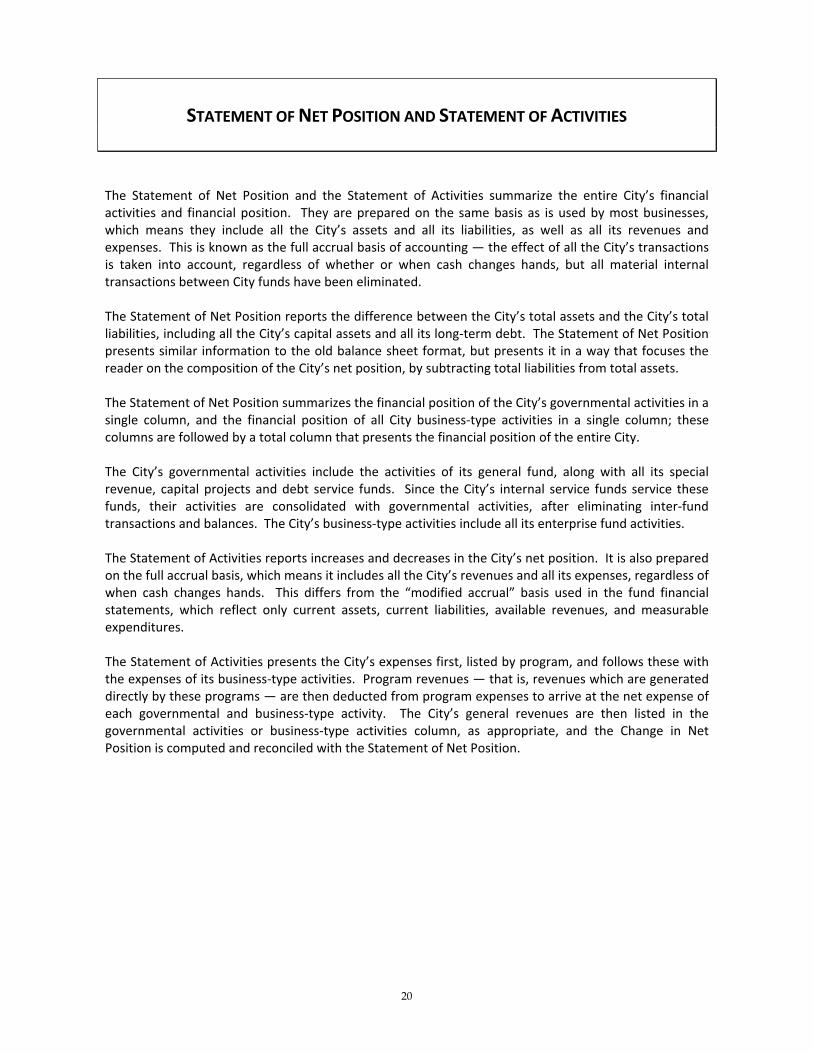
�
�STATEMENT�OF�NET�POSITION�AND�STATEMENT�OF�ACTIVITIES�
���The� Statement� of� Net� Position� and� the� Statement� of� Activities� summarize� the� entire� City’s� financial�activities� and� financial� position.� � They�are�prepared�on� the� same�basis�as� is�used� by�most�businesses,�which� means� they� include� all� the� City’s� assets� and� all� its� liabilities,� as� well� as� all� its� revenues� and�expenses.��This�is�known�as�the�full�accrual�basis�of�accounting�—�the�effect�of�all�the�City’s�transactions�is� taken� into� account,� regardless� of� whether� or� when� cash� changes� hands,� but� all� material� internal�transactions�between�City�funds�have�been�eliminated.��The�Statement�of�Net�Position�reports�the�difference�between�the�City’s�total�assets�and�the�City’s�total�liabilities,�including�all�the�City’s�capital�assets�and�all�its�long�term�debt.��The�Statement�of�Net�Position�presents�similar� information�to�the�old�balance�sheet�format,�but�presents�it� in�a�way�that�focuses�the�reader�on�the�composition�of�the�City’s�net�position,�by�subtracting�total�liabilities�from�total�assets.��The�Statement�of�Net�Position�summarizes�the�financial�position�of�the�City’s�governmental�activities�in�a�single� column,� and� the� financial� position� of� all� City� business�type� activities� in� a� single� column;� these�columns�are�followed�by�a�total�column�that�presents�the�financial�position�of�the�entire�City.��The� City’s� governmental� activities� include� the� activities� of� its� general� fund,� along� with� all� its� special�revenue,� capital� projects� and� debt� service� funds.� � Since� the� City’s� internal� service� funds� service� these�funds,� their� activities� are� consolidated� with� governmental� activities,� after� eliminating� inter�fund�transactions�and�balances.��The�City’s�business�type�activities�include�all�its�enterprise�fund�activities.��The�Statement�of�Activities�reports�increases�and�decreases�in�the�City’s�net�position.��It�is�also�prepared�on�the�full�accrual�basis,�which�means�it�includes�all�the�City’s�revenues�and�all�its�expenses,�regardless�of�when� cash� changes� hands.� � This� differs� from� the� “modified� accrual”� basis� used� in� the� fund� financial�statements,� which� reflect� only� current� assets,� current� liabilities,� available� revenues,� and� measurable�expenditures.��The�Statement�of�Activities�presents�the�City’s�expenses�first,�listed�by�program,�and�follows�these�with�the�expenses�of�its�business�type�activities.��Program�revenues�—�that�is,�revenues�which�are�generated�directly�by�these�programs�—�are�then�deducted�from�program�expenses�to�arrive�at�the�net�expense�of�each� governmental� and� business�type� activity.� � The� City’s� general� revenues� are� then� listed� in� the�governmental� activities� or� business�type� activities� column,� as� appropriate,� and� the� Change� in� Net�Position�is�computed�and�reconciled�with�the�Statement�of�Net�Position.��
20

CITY�OF�REDWOOD�CITY,�CALIFORNIASTATEMENT�OF�NET�POSITION
JUNE�30,�2017
Governmental Business�Type�Activities Activities Total
$ $ � $ASSETS
Cash�and�investments�available�for�operations 160,367,657 93,088,210 253,455,867Cash�and�investments,�restricted 4,180,968 6,508,765 10,689,733Receivables�(net�of�allowance�for�uncollectibles):
Taxes�and�assessments���current 6,541,184 6,541,184Accounts 1,954,240 6,237,526 8,191,766Loans 9,399,022 9,399,022Accrued�interest 2,068,832 7 2,068,839Due�from�other�governmental�agencies 5,458,339 2,486,085 7,944,424
Internal�balances 1,800,000 (1,800,000)Advances�to�RDA�successor�agency 1,441,204 1,441,204Inventory�of�supplies�at�cost 120,852 120,852Deposits 535,000 10,360 545,360Prepaid�items�and�other�assets 291,984 335,312 627,296Land�held�for�redevelopment 5,741,208 5,741,208Investment�in�sewer�authority 39,863,182 39,863,182Investment�in�sewer�capacity�rights 400,000 400,000Capital�assets:
Nondepreciable 53,012,815 17,296,364 70,309,179Depreciable�buildings,�property,�equipment�and�infrastructure,�net 140,141,631 186,252,642 326,394,273
Total�assets 393,054,936 350,678,453 743,733,389
DEFERRED�OUTFLOWS�OF�RESOURCESDeferred�charge�on�refundings 1,690,925 1,690,925Deferred�outflows���pension 22,505,712 2,762,901 25,268,613Deferred�pension�contributions 16,048,151 1,673,401 17,721,552
Total�deferred�outflows�of�resources 38,553,863 6,127,227 44,681,090
LIABILITIESAccounts�payable 7,011,429 6,542,422 13,553,851Accrued�interest�payable 7,811 875,552 883,363Accrued�payroll 2,374,210 2,374,210Deposits�payable 9,445,040 1,201,133 10,646,173Unearned�revenue 6,060,384 2,213,542 8,273,926Insurance�claims�payable:
Due�in�one�year 4,674,166 4,674,166Due�in�more�than�one�year 19,096,327 19,096,327
Accrued�sick�leave�and�vacation:Due�in�one�year 446,269 451,939 898,208Due�in�more�than�one�year 11,110,175 463,554 11,573,729
Net�OPEB�obligation�due�in�more�than�one�year 6,488,784 735,912 7,224,696Net�Pension�liability 194,884,366 20,317,825 215,202,191Long�Term�Debt:
Due�in�one�year 687,180 2,773,483 3,460,663Due�in�more�than�one�year 347,486 64,116,108 64,463,594
Total�liabilities 262,633,627 99,691,470 362,325,097
DEFERRED�INFLOWS�OF�RESOURCESDeferred�inflows���pension 3,778,714 300,422 4,079,136
Total�deferred�inflows�of�resources 3,778,714 300,422 4,079,136
NET�POSITIONNet�investment�in�capital�assets 192,119,780 142,830,042 334,949,822Restricted�for:
Capital�projects 10,571,067 5,400,889 15,971,956Transportation 10,061,476 10,061,476Environmental�support 2,638,226 2,638,226Leisure,�cultural,�and�information�services 18,146,734 18,146,734Debt�service 826,308 826,308Community�development�projects 16,788,633 16,788,633Public�safety 314,484 314,484Housing�purposes 844,008 844,008Other�purposes 450,389 450,389
Total�restricted� 59,815,017 6,227,197 66,042,214
Unrestricted� (86,738,339) 107,756,549 21,018,210
Total�net�position 165,196,458 256,813,788 422,010,246
See�accompanying�notes�to�financial�statements
21

CITY�OF�REDWOOD�CITY,�CALIFORNIASTATEMENT�OF�ACTIVITIES
FOR�THE�FISCAL�YEAR�ENDED�JUNE�30,�2017
Net�(Expense)�Revenue�andProgram�Revenues Changes�in�Net�Position
Operating CapitalOverhead Charges�for Grants�and� �Grants�and Governmental� Business�Type
Functions/Programs Expenses Charges Services Contributions Contributions Activities Activities Total$ $ $ $ $ $ $ $
Governmental�Activities:Community�development�� 11,283,201 8,087,438 2,229,031 2,384,506 1,417,774 $1,417,774Human�services 1,829,157 (1,829,157) (1,829,157)Public�safety� 70,531,632 8,215,731 1,179,369 (61,136,532) (61,136,532)Transportation 15,543,459 1,712,031 3,030,427 (10,801,001) (10,801,001)Environmental�support�and�protection 1,873,886 45,043 1,541,388 17,972 23,392 (336,177) (336,177)Leisure,�cultural�and�information�services 27,413,602 3,534,018 2,958,353 1,566,230 (19,355,001) (19,355,001)Policy�development�and�implementation 9,722,747 (1,013,051) 4,906,365 427,669 350,000 (3,025,662) (3,025,662)Interest�on�long�term�debt 63,308 (63,308) (63,308)
Total�Governmental�Activities 138,260,992 (968,008) 26,284,940 8,524,425 7,354,555 (95,129,064) (95,129,064)
Business�Type�Activities:Water�Utility�Fund 36,206,753 581,880 36,744,157 61,904 1,689,862 1,707,290 1,707,290Sewer�Utility�Fund 26,412,632 262,899 37,068,780 226,185 10,619,434 10,619,434Parking�Fund 2,912,895 92,061 1,964,629 1,568 4,925,000 3,886,241 3,886,241Port�of�Redwood�City 5,692,117 7,127,814 4,134 1,439,831 1,439,831Docktown�Marina 1,376,969 31,168 693,355 (714,782) (714,782)
Total�Business�Type�Activities 72,601,366 968,008 83,598,735 67,606 6,841,047 16,938,014 16,938,014
Total 210,862,358 109,883,675 8,592,031 14,195,602 (95,129,064) 16,938,014 (78,191,050)
General�revenues:Taxes:��Property�taxes 52,616,638 213,553 52,830,191��Sales�taxes 24,825,685 24,825,685��Franchise�taxes 4,321,659 4,321,659��Property�transfer�taxes 809,638 809,638��Business�license�taxes 2,581,968 2,581,968��Utility�users�taxes 9,827,780 9,827,780��Transient�occupancy�taxes 6,552,893 6,552,893��Motor�vehicle�in�lieu�tax 205,123 205,123Investment�Earnings 1,242,098 606,423 1,848,521Other� 332,294 658 332,952
Transfers (2,681,630) 2,681,630
Total�general�revenues�and�transfers 100,634,146 3,502,264 104,136,410
Change�in�Net�Position 5,505,082 20,440,278 25,945,360
Net�position�Beginning 159,691,376 236,373,510 396,064,886
Net�position�Ending 165,196,458 256,813,788 422,010,246
See�accompanying�notes�to�financial�statements22

�
�������������
������
City�of�Redwood�City�Comprehensive�Annual�Financial�Report�
June�30,�2017�� �
23

��
GOVERNMENTAL�FUND�FINANCIAL�STATEMENTS��
��Major� funds� are� defined� generally� as� having� significant� activities� or� balances� in� the� current� year.� � No�distinction�is�made�between�fund�types.��The�governmental�funds�described�below�were�determined�to�be�major�funds�by�the�City�in�FY�2016�17.����GENERAL�FUND�The�general�fund�is�the�general�operating�fund�of�the�City.��It�is�used�to�account�for�all�financial�resources�except�those�to�be�accounted�for�in�another�fund.��CAPITAL�OUTLAY�FUND�This�fund�accounts�for�all�miscellaneous�capital�improvement�projects�that�are�financed�by�the�general�fund.��
24

CITY�OF�REDWOOD�CITY,�CALIFORNIAGOVERNMENTAL�FUNDS
BALANCE�SHEETJUNE�30,�2017
Capital Non�Major Total�General Outlay Governmental Governmental
Fund Fund Funds Funds$ $ $ $
ASSETSCash�and�investments�available�for�operations 40,428,443 28,045,229 50,871,266 119,344,938Cash�and�investments,�restricted 4,180,968 4,180,968Receivables�(net�of�allowance�for�uncollectibles):
Taxes�and�assessments���current 6,269,171 272,013 6,541,184Accounts 1,884,492 8,090 1,892,582Loans 1,035,949 214,286 8,148,787 9,399,022Accrued�interest 640,653 362,050 1,057,917 2,060,620Due�from�other�governmental�agencies 3,553,792 1,622,694 5,176,486
Due�from�other�funds 373,981 839,137 1,213,118Advances�to�RDA�successor�agency 1,441,204 1,441,204Prepaid�items 95,865 120,473 3,922 220,260Land�held�for�redevelopment 5,741,208 5,741,208
Total�Assets 54,282,346���������� 31,022,379 71,906,865 157,211,590
LIABILITIESAccounts�payable 3,701,631 925,570 1,789,689 6,416,890Accrued�payroll 2,374,210 2,374,210Deposits�payable 8,930,525 503,427 11,088 9,445,040Due�to�other�funds 839,137 373,981 1,213,118Unearned�revenue 6,028,080 32,304 6,060,384Accrued�sick�leave�and�vacation 36,254 2,645 38,899
Total�Liabilities 21,909,837 1,431,642 2,207,062 25,548,541
DEFERRED�INFLOWS�OF�RESOURCESUnavailable�revenue���interest 1,044,137 1,044,137
Total�Deferred�Inflows�of�Resources 1,044,137 1,044,137
FUND�BALANCESNonspendable:
Loans 1,035,949 1,035,949Prepaid�items 95,865 120,473 3,922 220,260
Restricted�for:Community�development 15,744,496 15,744,496Public�safety 314,484 314,484Transportation 10,061,476 10,061,476Environmental�support�and�protection 2,638,226 2,638,226Leisure,�cultural�and�information�services 18,146,734 18,146,734Capital�projects 10,571,067 10,571,067Housing�purposes 844,008 844,008Other�purposes 96,338 354,051 450,389
Committed�to:General�plan 837,563 837,563Capital�projects 26,622,674 2,725,442 29,348,116Community�benefits 2,284,739 2,284,739Human�services�financial�assistance 718,302 718,302Debt�service 505 505Housing�purposes 1,867,915 1,867,915
Assigned�to:Capital�projects 2,847,590 2,383,321 5,230,911Other�purposes 884,838 884,838
Unassigned: 29,421,956 (3,022) 29,418,934
TOTAL�FUND�BALANCES 32,372,509 29,590,737 68,655,666 130,618,912
Total�Liabilities,�Deferred�Inflowsof�Resources�and�Fund�Balances 54,282,346 31,022,379 71,906,865 157,211,590
See�accompanying�notes�to�financial�statements
25

CITY�OF�REDWOOD�CITY,�CALIFORNIARECONCILIATION�OF�THE
GOVERNMENTAL�FUNDS���BALANCE�SHEETWITH�THE�STATEMENT�OF�NET�POSITION
JUNE�30,�2017
$
TOTAL�FUND�BALANCES����TOTAL�GOVERNMENTAL�FUNDS 130,618,912
Amounts�reported��for�Governmental�Activities�in�the�Statement�of�Net�Position�are�different�from�those�reported�in�the�Governmental�Funds�above�because�of�the�following:
CAPITAL�ASSETSCapital�assets�used�in�Governmental�Activities�are�not�current�assets�or�financial�resources�and�therefore�are�not�
reported�in�the�Governmental�Funds.�Capital�assets,�net�of�Internal�Service�Fund�of�$8,519,713� 184,634,733
ALLOCATION�OF�INTERNAL�SERVICE�FUND�NET�POSITIONInternal�service�funds�are�not�governmental�funds.��However,�they�are�used�by�management�to�charge�the�costs�of�certain�activities,�
such�as�insurance�and�central�services�and�maintenance,�to�individual�governmental�funds.��The�assets�and�liabilities�of�the��Internal�Service�Funds�are�therefore�included�in�Governmental�Activities�in�the�Statement�of�Net�Position. 12,160,112
ACCRUAL�OF�NON�CURRENT�REVENUES�AND�EXPENSESThe�amounts�below�are�revenues�in�the�statement�of�activities�that�do�not�provide�current�financial�resources�and�therefore
are�not�reported�as�revenues�in�the�Governmental�Funds:Interest�revenue 1,044,137
LONG�TERM�ASSETS�AND�LIABILITIESThe�assets�and�liabilities�below�are�not�due�and�payable�in�the�current�period�and�therefore�are�not�reported�in�the�Governmental�Funds:
Long�term�debt (1,034,666)Interest�payable (7,811)Accrued�sick�leave�and�vacation,�net�of�Internal�Service�Fund�of�$1,011,176 (10,506,369)Net�OPEB�obligation,�net�of�Internal�Service�Fund�of�$491,322 (5,997,462)Net�Pension�liability,�net�of�Internal�Service�Fund�of�$17,596,466 (177,287,900)
DEFERRED�OUTFLOWS�OF�RESOURCES���Deferred�employer�pension�contributions,�net�of�Internal�Service�Fund�of�$1,336,335 14,711,816
DEFERRED�OUTFLOWS�OF�RESOURCES���Pension,�net�of�Internal�Service�Fund�of�$2,282,989 32,242,568
DEFERRED�INFLOWS�INFLOWS�OF�RESOURCES���Pension,�net�of�Internal�Service�Fund�of�$416,947 (15,381,612)
NET�POSITION�OF�GOVERNMENTAL�ACTIVITIES 165,196,458
See�accompanying�notes�to�financial�statements
26

CITY�OF�REDWOOD�CITY,�CALIFORNIAGOVERNMENTAL�FUNDS
STATEMENT�OF�REVENUES,�EXPENDITURESAND�CHANGES�IN�FUND�BALANCE
FOR�THE�FISCAL�YEAR�ENDED�JUNE�30,�2017
Capital Non�Major TotalGeneral Outlay Governmental Governmental
Fund Fund Funds Funds$ $ $ $
REVENUESProperty�taxes/special�assessments 52,433,667 1,541,388 53,975,055Sales�and�other�taxes 43,966,255 71,498 44,037,753Licenses�and�permits 2,806,816 359,665 1,022,714 4,189,195Fines,�forfeitures�and�penalties 822,066 167,545 989,611Use�of�money�and�property 4,682,075 317,312 1,116,363 6,115,750Intergovernmental 5,758,016 23,392 6,462,372 12,243,780Charges�for�current�services 18,101,567 33,358 1,656,606 19,791,531Contributions 278,923 600,000 2,680,741 3,559,664Other 773,303 9,453 5,883 788,639
Total�Revenues 129,622,688 1,343,180 14,725,110 145,690,978
EXPENDITURESCurrent�Operations:
Community�development�� 9,028,749 233,715 1,725,347 10,987,811Human�services 1,608,705 100,000 1,708,705Public�safety� 67,914,463 90,621 181,634 68,186,718Transportation 1,294,270 3,863,922 6,083,129 11,241,321Environmental�support�and�protection 306,872 414,205 1,439,521 2,160,598Leisure,�cultural�and�information�services 23,956,812 198,375 352,679 24,507,866Policy�development�and�implementation 7,929,797 221,744 289,113 8,440,654
Capital�outlay 63,546 3,660,814 4,641,443 8,365,803Debt�service:
Principal�retirement 676,920 676,920Interest�and�fiscal�charges 38,772 23,186 61,958
Total�Expenditures 112,141,986 8,683,396 15,512,972 136,338,354
EXCESS�(DEFICIENCY)�OF�REVENUESOVER�EXPENDITURES 17,480,702 (7,340,216) (787,862) 9,352,624
OTHER�FINANCING�SOURCES�(USES)Transfers�in 716,554 8,897,388 2,383,071 11,997,013Transfers�(out) (14,262,818) (937,044) (470,216) (15,670,078)
Total�Other�Financing�Sources�(Uses) (13,546,264) 7,960,344 1,912,855 (3,673,065)
NET�CHANGE�IN�FUND�BALANCES 3,934,438 620,128 1,124,993 5,679,559
Fund�balances���beginning 28,438,071 28,970,609 67,530,673 124,939,353
Fund�balances���ending 32,372,509 29,590,737 68,655,666 130,618,912
See�accompanying�notes�to�financial�statements27

CITY�OF�REDWOOD�CITY,�CALIFORNIARECONCILIATION�OF�THE
�NET�CHANGE�IN�FUND�BALANCES���TOTAL�GOVERNMENTAL�FUNDS�WITH�THE�STATEMENT�OF�ACTIVITIES
FOR�THE�FISCAL�YEAR�ENDED�JUNE�30,�2017
The�schedule�below�reconciles�the�Net�Changes�in�Fund�Balances�reported�on�the�Governmental�Funds�Statement�of�Revenues,�Expenditures�andChanges�in�Fund�Balance,�which�measures�only�changes�in�current�assets�and�current�liabilities�on�the�modified�accrual�basis,�with�the�Change
$
5,679,559
Amounts�reported�for�governmental�activities�in�the�Statement�of�Activities�are�different�because�of�the�following
CAPITAL�ASSETS�TRANSACTIONS
is�capitalized�and�allocated�over�their�estimated�useful�lives�and�reported�as�depreciation�expense.The�capital�outlay�expenditures�are�therefore�added�back�to�fund�balance 8,082,678Depreciation�expense�is�deducted�from�the�fund�balance
(Depreciation�expense�is�net�of�internal�service�fund�depreciation�of(8,040,239)
Loss�on�sale�of�capital�assets (2,154)
LONG�TERM�DEBT�PROCEEDS�AND�PAYMENTS
Repayment�of�debt�principal�is�added�back�to�fund�balance 676,920
ACCRUAL�OF�NON�CURRENT�ITEMS
therefore�are�not�reported�as�revenue�or�expenditures�in�governmental�funds�(net�change)Change�in�compensated�absences (453,824)Change�in�interest�payable (1,350)
8,17514,711,816
(18,081,821)
ALLOCATION�OF�INTERNAL�SERVICE�FUND�ACTIVITY
Internal�Service�Funds�are�used�by�management�to�charge�the�costs�of�certain�activities,�such�as�equipment�acquisition,�maintenance,
of�their�transactions�with�governmental�funds�is�reported�with�governmental�activities,�because�they�service�those�activities2,925,322
5,505,082
See�accompanying�notes�to�financial�statements
in�Net�Position�of�Governmental�Activities�reported�in�the�Statement�of�Activities,�which�is�prepared�on�the�full�accrual�basis.
Governmental�Funds�report�capital�outlays�as�expenditures.�However,�in�the�Statement�of�Activities�the�cost�of�those�assets�
Interest�receivable�and�intergovernmental�revenue
The�amounts�below�included�in�the�Statement�of�Activities�do�not�provide�or�(require)�the�use�of�current�financial�resources�and�
Deferred�pension�contributions
NET�CHANGE�IN�FUND�BALANCES���TOTAL�GOVERNMENTAL�FUNDS
$1,310,890�which�has�already�been�allocated�to�serviced�funds.)
and�insurance�to�individual�funds.�The�portion�of�the�net�revenue�(expense)�of�these�Internal�Service�Funds�arising�out
Change�in�Net�Position���All�Internal�Service�Funds
CHANGE�IN�NET�POSITION�OF�GOVERNMENTAL�ACTIVITIES
Pension�expense
28

��
PROPRIETARY�FUND�FINANCIAL�STATEMENTS��
�ENTERPRISE�FUNDS��WATER�UTILITY�FUND�This� fund� is�used� to�account� for� the�provision�of�water�services� to� the�residents�of�Redwood�City�and�some� residents� of� areas� adjacent� to� the� City.� � All� activities� necessary� to� provide� such� services� � are�accounted� for� in� these� funds,� including,� but� not� limited� to,� administration,� operations,� maintenance,�capital�improvements,�financing,�and�billing/collections.��SEWER�UTILITY�FUND�This� fund� is�used�to�account� for� the�provision�of�sewer�services� to� the�residents�of�Redwood�City�and�some� residents� of� areas� adjacent� to� the� City.� � All� activities� necessary� to� provide� such� services� are�accounted� for� in� these� funds,� including,� but� not� limited� to,� administration,� operations,� maintenance,�capital�improvements,�financing,�and�billing/collections.��PARKING�FUND�This�fund�is�used�to�account�for�on�street�and�off�street�parking�operations�within�the�boundaries�of�the�central�business�district�of�the�City.��All�activities�necessary�to�provide�metered�parking�within�the�district�are� accounted� for� in� these� funds,� including,� but� not� limited� to,� administration,� operations� and�maintenance,�capital�improvements,�meter�collection,�and�financing�including�related�debt�service.��The�authority�for�the�formation�of�the�district�and�the�issuance�of�revenue�bonds�are�contained�in�the�State�of�California’s�Streets�and�Highway�Code.��PORT�OF�REDWOOD�CITY�(PORT�FUND)�This�fund�is�used�to�account�for�Port�activities�within�the�Port�Department�as�defined�in�the�City�Charter.�These� activities� include,� but�are� not� limited� to,� administration,� maintenance� and� operations,� and� Port�improvements.� �Management�of�the�Port�of�Redwood�City�is�provided�by�the�Port�Commission,�whose�members� are� appointed� for� four�year� terms� by� the� City� Council.� The� only� limitation� to� the�commissioner’s�authority�is�the�power�to�levy�taxes,�which�must�be�approved�by�the�City�Council.��Also,�the�City�Charter�provides�that�the�City�Treasurer�is�the�Port�Treasurer�and�the�City�Attorney�is�the�Port�Attorney.� � This� fund� is� included� in� this� report� because� both� the� Bureau� of� Census� and� the� State� of�California� require� the� City� to� include� a� summary� of� the� Port’s� financial� transactions� in� the� respective�reports.��DOCKTOWN�MARINA�This� fund� is� used� to� account� for� the� operation� of� the� Docktown� Marina� including� administration,�operations,�maintenance�and�billing/collections.��INTERNAL�SERVICE�FUNDS��These� funds� are� used� to� account� for� the� financing� of� goods� and� services� provided� by� one� City�department� to� others� on� a� cost� reimbursement� basis.� � Internal� service� funds� are� included� with�enterprise�funds�as�both�use�the�same�accounting�and�financial�reporting.�
29
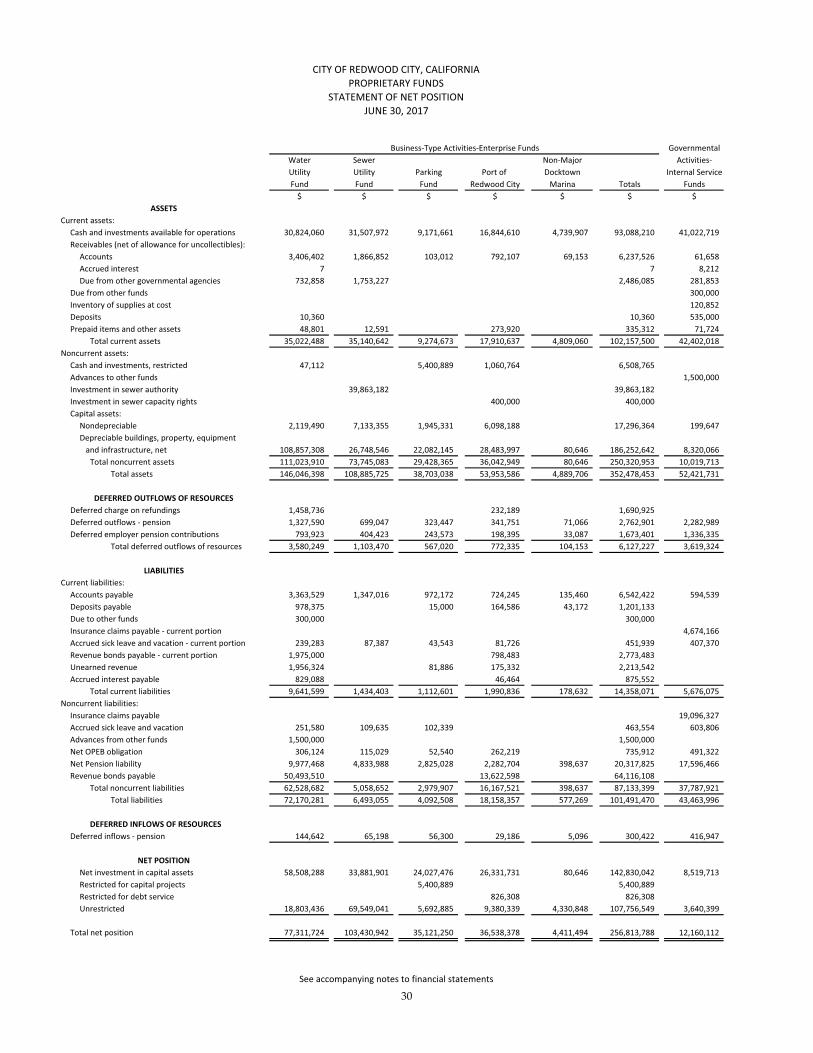
CITY�OF�REDWOOD�CITY,�CALIFORNIAPROPRIETARY�FUNDS
STATEMENT�OF�NET�POSITIONJUNE�30,�2017
Business�Type�Activities�Enterprise�Funds GovernmentalWater Sewer Non�Major Activities�Utility Utility Parking Port�of� Docktown Internal�ServiceFund Fund Fund Redwood�City Marina Totals Funds
$ $ $ $ $ $ $ASSETS
Current�assets:Cash�and�investments�available�for�operations 30,824,060 31,507,972 9,171,661 16,844,610 4,739,907 93,088,210 41,022,719Receivables�(net�of�allowance�for�uncollectibles):
Accounts 3,406,402 1,866,852 103,012 792,107 69,153 6,237,526 61,658Accrued�interest 7 7 8,212Due�from�other�governmental�agencies 732,858 1,753,227 2,486,085 281,853
Due�from�other�funds 300,000Inventory�of�supplies�at�cost 120,852Deposits 10,360 10,360 535,000Prepaid�items�and�other�assets 48,801 12,591 273,920 335,312 71,724
Total�current�assets 35,022,488 35,140,642 9,274,673 17,910,637 4,809,060 102,157,500 42,402,018Noncurrent�assets:
Cash�and�investments,�restricted 47,112 5,400,889 1,060,764 6,508,765Advances�to�other�funds 1,500,000Investment�in�sewer�authority 39,863,182 39,863,182Investment�in�sewer�capacity�rights 400,000 400,000Capital�assets:
Nondepreciable 2,119,490 7,133,355 1,945,331 6,098,188 17,296,364 199,647Depreciable�buildings,�property,�equipment���and�infrastructure,�net 108,857,308 26,748,546 22,082,145 28,483,997 80,646 186,252,642 8,320,066
Total�noncurrent�assets 111,023,910 73,745,083 29,428,365 36,042,949 80,646 250,320,953 10,019,713Total�assets 146,046,398 108,885,725 38,703,038 53,953,586 4,889,706 352,478,453 52,421,731
DEFERRED�OUTFLOWS�OF�RESOURCESDeferred�charge�on�refundings 1,458,736 232,189 1,690,925Deferred�outflows���pension 1,327,590 699,047 323,447 341,751 71,066 2,762,901 2,282,989Deferred�employer�pension�contributions 793,923 404,423 243,573 198,395 33,087 1,673,401 1,336,335
Total�deferred�outflows�of�resources 3,580,249 1,103,470 567,020 772,335 104,153 6,127,227 3,619,324
LIABILITIESCurrent�liabilities:
Accounts�payable 3,363,529 1,347,016 972,172 724,245 135,460 6,542,422 594,539Deposits�payable 978,375 15,000 164,586 43,172 1,201,133Due�to�other�funds 300,000 300,000Insurance�claims�payable���current�portion 4,674,166Accrued�sick�leave�and�vacation���current�portion 239,283 87,387 43,543 81,726 451,939 407,370Revenue�bonds�payable���current�portion 1,975,000 798,483 2,773,483Unearned�revenue 1,956,324 81,886 175,332 2,213,542Accrued�interest�payable 829,088 46,464 875,552
Total�current�liabilities 9,641,599 1,434,403 1,112,601 1,990,836 178,632 14,358,071 5,676,075Noncurrent�liabilities:
Insurance�claims�payable 19,096,327Accrued�sick�leave�and�vacation 251,580 109,635 102,339 463,554 603,806Advances�from�other�funds 1,500,000 1,500,000Net�OPEB�obligation 306,124 115,029 52,540 262,219 735,912 491,322Net�Pension�liability 9,977,468 4,833,988 2,825,028 2,282,704 398,637 20,317,825 17,596,466Revenue�bonds�payable 50,493,510 13,622,598 64,116,108
Total�noncurrent�liabilities 62,528,682 5,058,652 2,979,907 16,167,521 398,637 87,133,399 37,787,921Total�liabilities 72,170,281 6,493,055 4,092,508 18,158,357 577,269 101,491,470 43,463,996
DEFERRED�INFLOWS�OF�RESOURCESDeferred�inflows���pension 144,642 65,198 56,300 29,186 5,096 300,422 416,947
NET�POSITIONNet�investment�in�capital�assets 58,508,288 33,881,901 24,027,476 26,331,731 80,646 142,830,042 8,519,713Restricted�for�capital�projects 5,400,889 5,400,889Restricted�for�debt�service 826,308 826,308Unrestricted 18,803,436 69,549,041 5,692,885 9,380,339 4,330,848 107,756,549 3,640,399
Total�net�position 77,311,724 103,430,942 35,121,250 36,538,378 4,411,494 256,813,788 12,160,112
See�accompanying�notes�to�financial�statements
30

CITY�OF�REDWOOD�CITY,�CALIFORNIAPROPRIETARY�FUNDS
STATEMENT�OF�REVENUES,�EXPENSESAND�CHANGES�IN�FUND�NET�POSITION
FOR�THE�FISCAL�YEAR�ENDED�JUNE�30,�2017
Business�Type�Activities�Enterprise�Funds GovernmentalWater Sewer Non�Major Activities�Utility Utility Parking Port�of Docktown Internal�ServiceFund Fund Fund Redwood�City Marina Totals Funds
$ $ $ $ $ $ $Operating�Revenues:
Charges�for�services 36,744,157 37,068,780 1,964,629 7,127,814 693,355 83,598,735 32,900,770
Total�Operating�Revenues 36,744,157 37,068,780 1,964,629 7,127,814 693,355 83,598,735 32,900,770
Operating�Expenses:Employee�services 5,393,814 2,993,100 1,306,107 1,509,962 205,562 11,408,545 14,073,752Maintenance 1,471,824 891,596 80,203 192,541 21,575 2,657,739 944,851Water�purchases 16,883,197 16,883,197Utilities 947,541 726,078 108,296 227,572 59,757 2,069,244 32,081Contractual�services 1,195,090 16,531,985 390,461 373,274 885,003 19,375,813 4,385,605Supplies�and�services 3,703,147 2,632,383 417,187 510,136 160,225 7,423,078 3,241,254Noncapitalized�projects 3,663 1,611,375 889 13,751 1,629,678Depreciation�and�amortization 3,027,920 670,287 564,852 1,562,952 32,258 5,858,269 1,310,890Insurance�and�claims 1,816,839 618,727 136,961 293,092 30,006 2,895,625 7,440,813
Total�Operating�Expenses 34,443,035 26,675,531 3,004,956 4,669,529 1,408,137 70,201,188 31,429,246
Operating�Income�(Loss) 2,301,122 10,393,249 (1,040,327) 2,458,285 (714,782) 13,397,547 1,471,524
Nonoperating�Revenues�(Expenses):Gain�(loss)�on�disposal�of�capital�assets (18,287)Property�taxes 213,553 213,553Grant�revenue 61,904 1,568 4,134 67,606Investment�earnings 8,478 225,234 83,774 107,911 27,914 453,311 255,384Interest�expense (2,132,723) (595,005) (2,727,728)Increase�(decrease)�in�investment�in�sewer�authority 153,112 153,112Insurance�recovery 658 658 53,088ContributionsOther (212,875) (427,583) (640,458)
Net�Nonoperating�Revenues�(Expenses) (2,274,558) 378,346 298,895 (910,543) 27,914 (2,479,946) 290,185
Net�Income�(Loss)�Before�Capital�Contributions����and�Transfers 26,564 10,771,595 (741,432) 1,547,742 (686,868) 10,917,601 1,761,709
Capital�contributions 1,689,862 226,185 4,925,000 6,841,047 172,178Transfers�in 691,113 101,815 2,406,537 3,199,465 1,000,000Transfers�(out) (517,835) (517,835) (8,565)
Total�Capital�Contributions�and�Transfers 2,380,975 (291,650) 5,026,815 2,406,537 9,522,677 1,163,613
Change�in�net�position 2,407,539 10,479,945 4,285,383 1,547,742 1,719,669 20,440,278 2,925,322
Total�net�position�beginning 74,904,185 92,950,997 30,835,867 34,990,636 2,691,825 236,373,510 9,234,790
Total�net�position�ending 77,311,724 103,430,942 35,121,250 36,538,378 4,411,494 256,813,788 12,160,112
See�accompanying�notes�to�financial�statements
31

CITY�OF�REDWOOD�CITY,�CALIFORNIAPROPRIETARY�FUNDS
COMBINING�STATEMENT�OF�CASH�FLOWSINCREASE�(DECREASE)�IN�CASH�AND�CASH�EQUIVALENTS�
FOR�THE�FISCAL�YEAR�ENDED�JUNE�30,�2017
Governmental�Water Sewer Non�Major Activities���Utility ��Utility���� ��Parking���� Port�of Docktown Internal�ServiceFund ���Fund������ ���Fund������ Redwood�City Marina Totals Funds
Cash�flows�from�operating�activities: $ $ $ $ $ $ $��Cash�received�from�customers 35,742,186 36,148,617 1,918,784 7,062,837 633,134 81,505,558��Cash�received�from�interfund�services�provided 32,992,107��Cash�payments�to�suppliers�for�goods�and�services (23,877,870) (20,635,363) (576,123) (1,382,475) (1,075,134) (47,546,965) (15,428,400)��Cash�payments�to�employees�for�services (5,251,690) (2,899,551) (1,246,467) (1,330,764) (199,791) (10,928,263) (13,785,639)��Right�of�way�compensation (2,262,500) (1,865,119) (42,000) (4,169,619)����Net�cash�provided�by�(used�in)�operating�activities��������������� 4,350,126 10,748,584 54,194 4,349,598 (641,791) 18,860,711 3,778,068Cash�flows�from�noncapital�financing�activities:��Nonoperating�grant�revenue 61,904 1,568 4,134 67,606��Insurance�recovery 658 658 53,088��Property�taxes 213,553 213,553��Transfers�in 691,113 101,815 2,406,537 3,199,465 1,000,000��Transfers�out (517,835) (517,835) (8,565)��Advances�to�other�funds (300,000) (300,000) 300,000��Other (212,875) (427,583) (640,458)����Net�cash�provided�by�(used�in)�noncapital�financing�activities 240,800 (517,835) 316,936 (423,449) 2,406,537 2,022,989 1,344,523Cash�flows�from�capital�and�related�financing�activities:��Acquisition�and�construction�of�capital�assets (2,781,050) (4,516,806) (1,267,836) (768,287) (9,333,979) (879,560)��Contributions 1,689,862 226,185 4,925,000 6,841,047 172,178��Principal�retirements (7,153,940) (770,416) (7,924,356)��Interest�paid� (2,203,986) (610,928) (2,814,914)��Proceeds�from�sale�of�capital�assets����Net�cash�used�in�capital�and�related�financing�activities� (10,449,114) (4,290,621) 3,657,164 (2,149,631) (13,232,202) (707,382)Cash�flows�from�investing�activities:��Interest�on�investments 31,978 225,236 83,774 107,911 27,915 476,814 252,931����Net�cash�provided�by�investing�activities 31,978 225,236 83,774 107,911 27,915 476,814 252,931����Net�increase�(decrease)�in�cash�and�cash�equivalents (5,826,210) 6,165,364 4,112,068 1,884,429 1,792,661 8,128,312 4,668,140����Cash�and�cash�equivalents�at�beginning�of�year 36,697,382 25,342,608 10,460,482 16,020,945 2,947,246 91,468,663 36,354,579����Cash�and�cash�equivalents�at�end�of�year 30,871,172 31,507,972 14,572,550 17,905,374 4,739,907 99,596,975 41,022,719
Financial�statement�presentation:Cash�and�investments�available�for�operations 30,824,060������ 31,507,972����� 9,171,661������ 16,844,610����� 4,739,907���������� 93,088,210������ 41,022,719�����Cash�and�investments,�restricted 47,112��������������� �������������������������� 5,400,889������ 1,060,764������� ���������������������������� 6,508,765�������� ��������������������������
����Cash�and�cash�equivalents�at�end�of�year 30,871,172������ 31,507,972����� 14,572,550���� 17,905,374����� 4,739,907���������� 99,596,975������ 41,022,719�����
Reconciliation�of�Net�Cash�Flow�from�Operating�ActivitiesOperating�income�(loss) 2,301,122 10,393,249 (1,040,327) 2,458,285 (714,782) 13,397,547 1,471,524Adjustments�to�reconcile�operating�income�to�net�cash���������provided�by�operating�activities:����Depreciation 3,027,920 670,287 564,852 1,562,952 32,258 5,858,269 1,310,890����Change�in�assets�and�liabilities:������Decrease�(increase)�in�accounts�receivable (461,620) (157,482) (47,645) (66,922) (60,926) (794,595) 163,388������Decrease�(increase)�in�due�from�other�governmental�agencies (547,638) (762,681) (1,310,319) (72,051)������Decrease�(increase)�in�inventory/prepaid�expenses/deposits (8,115) 956,763 25,161 973,809 (23,288)������Increase�(decrease)�in�vacation�&�sick�leave�payable 3,641 23,010 2,930 81,726 111,307 55,018������Increase�(decrease)�in�accounts�payable������������� (110,954) (445,101) 515,874 188,979 95,183 243,981 (14,159)������Increase�(decrease)�in�customer�deposits 7,287 1,800 1,893 705 11,685������Increase�(decrease)�in�unearned�revenue 52 52������Increase�(decrease)�in�deferred�employer�contributions 851,905 397,983 181,195 (32,759) 55,629 1,453,953 1,456,296������Increase�(decrease)�in�other�pension�deferred�outflows (1,327,590) (699,047) (323,447) (341,751) (71,066) (2,762,901) (2,282,989)������Increase�(decrease)�in�other�pension�deferred�inflows (1,308,666) (624,070) (317,293) (91,696) (49,866) (2,391,591) (2,166,568)������Increase�(decrease)�in�net�pension�liability 1,922,834 995,673 516,255 500,752 71,074 4,006,588 3,226,356������Increase�(decrease)�in�net�OPEB�obligation 31,463 31,463������Increase�(decrease)�in�insurance�claims�payable 653,651��������Total�adjustments 2,049,004 355,335 1,094,521 1,891,313 72,991 5,463,164 2,306,544����Net�cash�provided�by�(used�in)�operating�activities 4,350,126 10,748,584 54,194 4,349,598 (641,791) 18,860,711 3,778,068
Noncash�investing,�capital�and�financing�activities:Noncash�capital�contributions 207,190 23,046 230,236Gain�(loss)�on�disposal�of�equipment (18,287)Increase�(decrease)�in�investment�in�sewer�authority 153,112 153,112
See�accompanying�notes�to�financial�statements
32

CITY�OF�REDWOOD�CITYFIDUCIARY�FUNDS
STATEMENT�OF�NET�POSITIONJUNE�30,�2017
Successor�AgencyPrivate�Purpose Agency
Trust�Fund Funds$ $
ASSETSCash�and�Investments,�restricted 7,700,311 2,343,045Accounts 1,167Accrued�Interest�Receivable 5,187Deposits 29,505Non�depreciable�capital�assets 2,560,739Depreciable�capital�assets,�net� 13,138,577Unamortized�bond�issuance�costs 497,072
Total�Assets 23,903,053 2,372,550
LIABILITIESAccounts�payable 362,144Advances�from�City 1,441,204Long�term�debt:
Due�in�one�year 3,505,000Due�in�more�than�one�year 34,952,383
Due�to�Bondholders 1,862,587Employee�Benefit�Plans�Payable 60,581Due�to�Community�Benefit�Improvement�District 449,382
Total�Liabilities 40,260,731 2,372,550
NET�POSITIONHeld�in�trust�for�other�governments (16,357,678)
See�accompanying�notes�to�financial�statements
33

CITY�OF�REDWOOD�CITYFIDUCIARY�FUNDS
STATEMENT�OF�CHANGES�IN�NET�POSITIONFOR�THE�FISCAL�YEAR�ENDED�JUNE�30,�2017
Successor�AgencyPrivate�Purpose
Trust�Fund$
ADDITIONS
Property�taxes 6,109,943��������Investment�earnings 72,566
Total�additions 6,182,509
DEDUCTIONS
Community�development 758,584Depreciation 515,979Interest�and�fiscal�agency�expenses�of�former�redevelopment�agency 2,797,941
Total�deductions 4,072,504
Change�in�net�position 2,110,005
Net�position���beginning,�as�restated (18,467,683)
Net�position���ending (16,357,678)
See�accompanying�notes�to�financial�statements
34

City�of�Redwood�City�Notes�to�the�Basic�Financial�Statements�For�the�fiscal�year�ended�June�30,�2017
�
��
NOTE�1�–�SUMMARY�OF�SIGNIFICANT�ACCOUNTING�POLICIES��A. Reporting�Entity��The�City�of�Redwood�City�was�incorporated�in�1867,�became�a�Charter�City�in�1929,�and�operates�under�a� council�manager� form� of� government.� The� City� has� defined� its� reporting� entity� in� accordance� with�generally� accepted� accounting� principles� (“GAAP”)� in� the� United� States� of� America,� which� provide�guidance�for�determining�which�governmental�activities,�organizations,�and�functions�should�be�included�in� the� reporting� entity.� In� evaluating� how� to� define� the� City� for� financial� reporting� purposes,�management�has�considered�all�potential�component�units.�The�primary�criteria�for�including�a�potential�component� unit� within� the� reporting� entity� are� the� governing� body’s� financial� accountability� and� a�financial�benefit�or�burden�relationship�and�whether�it�is�misleading�to�exclude.�A�primary�government�is�financially� accountable� and� shares� a� financial� benefit� or� burden� relationship� if� it� appoints� a� voting�majority�of�an�organization’s�governing�body�and� it� is�able�to� impose� its�will�on�the�organization,�or� if�there� is� a� potential� for� the� organization� to� provide� specific� financial� benefits� to,� or� impose� specific�financial� burdens� on� the� primary� government.� A� primary� government� may� also� be� financially�accountable� if�an�organization� is� fiscally�dependent�on�the�primary�government�regardless�of�whether�the� organization� has� a� separately� elected� governing� board,� a� governing� board� appointed� by� a� higher�level� of� government,� or� a� jointly� appointed� board,� and� there� is� a� potential� for� the� organization� to�provide�specific�financial�benefits�to,�or�impose�specific�financial�burdens�on�the�primary�government.��Based�upon�the�application�of�these�criteria,�the�following�is�a�brief�description�of�each�component�unit�included� within� the� City’s� reporting� entity.� All� such� component� units� have� been� “blended”� as� though�they�are�part�of�the�primary�government�because�the�component�unit’s�governing�body�is�substantially�the� same� as� the� City’s� primary� government� and� there� is� a� financial� benefit� or� burden� relationship�between�the�City�and�the�component�unit,�management�of�the�City�has�operational�responsibilities�for�the� component� unit,� and/or� the� component� units� provide� services� entirely� to� the� City� or� otherwise�exclusively�benefits�the�City,�even�though�it�does�not�provide�services�directly�to�it.��Redwood� City� Facilities� and� Infrastructure� Authority� (RCFISA)� was� established� in� 1986� to� finance� the�construction�of�certain�public� facilities�such�as�the�Main�Fire�Station,�City�Hall,�and�Main�Library.�After�acquiring� certain� properties� from� the� City,� RCFISA� leased� them� back� to� the� City.� The� lease� money�provided� the� funds� for� the� debt� service� for� the� certificates� of� participation� issued� by� the� RCFISA� to�acquire�the�properties�from�the�City.��The�Public�Financing�Authority�(PFA)�was�established�in�1991�to�finance�construction�of�the�new�Police�Facility,�to�finance�the�defeasance�of�outstanding�certificates�of�participation�issued�by�the�RCFISA,�and�to�issue�tax�increment�bonds�on�behalf�of�the�former�Redevelopment�Agency.�The�PFA�has�since�issued�various�types�of�debt�on�behalf�of�the�City�and�the�former�Redevelopment�Agency.��The� Port� of� Redwood� City� was� established� under� the� City� Charter� as� a� department� of� the� City� and� is�managed�by�the�Port�Commission�of�Redwood�City,�whose�members�are�appointed�by�the�City�Council.�This� commission� is� a� semi�autonomous� body� and� has� full� authority� to� manage� the� Port.� Its� financial�system�is�maintained�separately�from�the�City�by�the�Port’s�own�financial�staff.�The�Port’s�treasurer�and�legal� counsel� are� the� City’s� Finance� Director� and� the� City� Attorney,� respectively.� The� financial�transactions� of� the� Port� are� incorporated� as� an� enterprise� fund.� Financial� statements� for� the� Port� of�Redwood�City�may�be�obtained�from�the�Port�at�675�Seaport�Blvd.,�Redwood�City,�CA�94063.�
35

City�of�Redwood�City�Notes�to�the�Basic�Financial�Statements�For�the�fiscal�year�ended�June�30,�2017
�
��
�
NOTE�1�–�SUMMARY�OF�SIGNIFICANT�ACCOUNTING�POLICIES�(CONTINUED)��
Separate�financial�statements�are�not�prepared�for�other�component�units.��
B. Basis�of�Presentation��
The� City’s� basic� financial� statements� are� prepared� in� conformity� with� accounting� principles� generally�accepted� in� the� United� States� of� America.� The� Governmental� Accounting� Standards� Board� is� the�acknowledged� standard� setting� body� for� establishing� accounting� and� financial� reporting� standards�followed�by�governmental�entities�in�the�U.S.A.�
�These�statements�require�that�the�financial�statements�described�below�be�presented.�
�Government�wide� Statements:� The� Statement� of� Net� Position� and� the� Statement� of� Activities� display�information� about� the� primary� government� (the� City)� and� its� component� units.� � These� statements�include� the� financial� activities� of� the� overall� City� government,� except� for� fiduciary� activities.� Certain�eliminations�have�been�made�as�prescribed�by�GASB�Statement�No.�34�in�regards�to�interfund�activities,�payables,�and�receivables.�All� internal�balances�in�the�Statement�of�Net�Position�have�been�eliminated�except� those� representing� balances� between� the� governmental� activities,� which� are� presented� as�internal�balances�and�eliminated�in�the�total�primary�government�column.�These�statements�distinguish�between� the� governmental� and� business�type� activities� of� the� City.� � Governmental� activities� generally�are� financed� through� taxes,� intergovernmental� revenues,� and� other� non�exchange� transactions.�Business�type�activities�are�financed�in�whole�or�in�part�by�fees�charged�to�external�parties.�
�The�Statement�of�Activities�presents�a�comparison�between�direct�expenses�and�program�revenues�for�each�segment�of�the�business�type�activities�of�the�City�and�for�each�function�of�the�City’s�governmental�activities.� Direct� expenses� are� those� that� are� specifically� associated� with� a� program� or� function� and,�therefore,�are�clearly�identifiable�to�a�particular�function.�Program�revenues�include�(a)�charges�paid�by�the� recipients� of� goods� or� services� offered� by� the� programs,� (b)� grants� and� contributions� that� are�restricted� to� meeting� the� operational� needs� of� a� particular� program,� and� (c)� fees,� grants,� and�contributions�that�are�restricted�to�financing�the�acquisition�or�construction�of�capital�assets.�Revenues�that�are�not�classified�as�program�revenues,�including�all�taxes,�are�presented�as�general�revenues.�
�Fund� Financial� Statements:� The� fund� financial� statements� provide� information� about� the� City’s� funds,�including�fiduciary�funds�and�blended�component�units.�Separate�statements�for�each�fund�category—�governmental,�proprietary,�and�fiduciary—are�presented.�The�emphasis�of�fund�financial�statements�is�on�major�individual�funds,�each�of�which�is�displayed�in�a�separate�column.�All�remaining�governmental�and�enterprise�funds�are�aggregated�and�reported�as�non�major�funds.�
�Proprietary� funds� distinguish� operating� revenues� and� expenses� from� non�operating� items.� Operating�revenues,�such�as�charges�for�services,�result�from�exchange�transactions�associated�with�the�principal�activity� of� the� fund.� Exchange� transactions� are� those� in� which� each� party� receives� and� gives� up�essentially�equal�values.�Non�operating�revenues,�such�as�subsidies�and�investment�earnings,�result�from�non�exchange� transactions� or� ancillary� activities.� Operating� expenses� for� proprietary� funds� are� those�expenses�that�are�essential�to�the�primary�operations�of�the�funds.�All�other�expenses�are�reported�as�non�operating�expenses.�
36

City�of�Redwood�City�Notes�to�the�Basic�Financial�Statements�For�the�fiscal�year�ended�June�30,�2017
�
��
�
NOTE�1�–�SUMMARY�OF�SIGNIFICANT�ACCOUNTING�POLICIES�(CONTINUED)��C. Major�Funds��GASB� Statement� No.� 34� defines� major� funds� and� requires� that� the� City’s� major� governmental� and�business�type�funds�be� identified�and�presented�separately� in�the�fund�financial�statements.�All�other�funds,�called�non�major�funds,�are�combined�and�reported�in�a�single�column,�regardless�of�their�fund��type.��Major�funds�are�defined�as�funds�that�have�assets,�liabilities,�revenues,�or�expenditures/expenses�equal�to�ten�percent�of�their�fund�type�total�and�five�percent�of�the�grand�total.�The�general�fund�is�always�a�major�fund.��The�City�may�also�select�other�funds�it�believes�should�be�presented�as�major�funds.��The�City�reported�the�following�major�governmental�funds�in�the�accompanying�financial�statements:��General�fund�is�to�account�for�all�financial�resources�except�those�to�be�accounted�for�in�another�fund.���It�is�the�general�operating�fund�of�the�City.��Capital�outlay�fund�is�to�account�for�all�miscellaneous�capital�improvement�projects�that�are�financed�by�the�general�fund.�
�The� City� reported� all� of� its� enterprise� funds� except� the� Docktown� Marina� Fund� as� major� funds� in� the�accompanying�financial�statements:�
�Water�utility�fund�is�to�account�for�the�provision�of�water�services�to�the�residents�of�Redwood�City.�
�Sewer�utility�fund�is�to�account�for�the�provision�of�sewer�services�to�the�residents�of�Redwood�City.�
�Parking�fund�is�to�account�for�on�street�and�off�street�parking�operations�within�the�boundaries�of�the�central�business�district�of�the�City.�
�Port�of�Redwood�City�(Port�fund)�is�to�account�for�Port�activities�within�the�Port�Department�including,�but�not�limited�to,�administration,�maintenance�and�operations,�and�Port�improvements.�
�The�City�also�reports�the�following�fund�types:�
�Internal� service� funds� �� Internal� service� funds� are� used� to� account� for� costs� of� the� City’s� equipment�services,� the� City’s� insurance� program,� the� costs� of� the� City’s� telephone/communications� and�information�technology�services,�maintenance�and�repair�of�buildings,�custodial�services,�and�employee�benefits.�These�services�are�provided�to�departments�and�other�governments�on�a�cost�reimbursement�basis.�
�Fiduciary�funds�–�These�funds�are�used�to�account�for�assets�held�by�the�City�in�a�trustee�capacity�or�as�an�agent� for� individuals,�private�organizations,�other�governmental�units,�and/or�other� funds.�The�City�maintains�one�private�purpose�trust�fund�to�account�for�activities�of�the�Successor�Agency�to�the�former�Redevelopment�Agency.�
��
37

City�of�Redwood�City�Notes�to�the�Basic�Financial�Statements�For�the�fiscal�year�ended�June�30,�2017
�
��
�NOTE�1�–�SUMMARY�OF�SIGNIFICANT�ACCOUNTING�POLICIES�(CONTINUED)��C. Major�Funds,�Continued�
�The� City� also� maintains� five� agency� funds� �� Employee� Benefit� Plans� Fund,� Pacific� Shores� Community�Facilities� District� Fund,� the� Shores� Transportation� Improvement� District� Fund,� the� One� Marina�Community�Facilities�District�Fund,�and�the�Community�Benefit�Improvement�District�Fund���as�an�agent�of�the�bondholders,�City�employees,�or�the�Downtown�Redwood�City�Community�Benefit� Improvement�District.�
�D. Basis�of�Accounting�
�The� government�wide� and� proprietary� fund� financial� statements� are� reported� using� the� economic�resources� measurement� focus� and� the� full� accrual� basis� of� accounting.� Revenues� are� recorded� when�earned�and�expenses�are�recorded�at�the�time�liabilities�are�incurred,�regardless�of�when�the�related�cash�flows�take�place.��Governmental� funds� are� reported� using� the� current� financial� resources� measurement� focus� and� the�modified�accrual�basis�of�accounting.�Under�this�method,�revenues�are�recognized�when�measurable�and�available.� The� City� considers� all� revenues� reported� in� the� governmental� funds� to� be� available� if� the�revenues�are�collected�within�90�days�after�year�end.��The� City’s� fiduciary� funds� consist� of� one� private� purpose� trust� fund� and� agency� funds� which� use� the�accrual�basis�of�accounting.�The�private�purpose�trust� fund�uses�the�economic�resources�measurement�focus,�whereas�the�agency�funds�do�not�have�a�measurement�focus.�
�Expenditures�are�recorded�when�the�related�fund�liability�is�incurred,�except�for�principal�and�interest��on�general� long�term� debt,� claims�and� judgments,�and� compensated�absences,� �which�are� � recognized� �as��expenditures�to��the�extent�they��have�matured.�
�General� capital� asset� acquisitions� are� reported� as� expenditures� in� governmental� funds.� Proceeds� of�general�long�term�debt�and�acquisitions�under�capital�leases�are�reported�as�other�financing�sources.�
�Non�exchange�transactions,�in�which�the�City�gives�or�receives�value�without�directly�receiving�or�giving�equal�value�in�exchange,�include�property�taxes,�grants,�entitlements,�and�donations.�On�an�accrual�basis,�revenue�from�property�taxes�is�recognized�in�the�fiscal�year�for�which�the�taxes�are�levied.�
�Revenue�from�grants,�entitlements,�and�donations� is� recognized� in�the�fiscal�year� in�which�all�eligibility�requirements� have� been� satisfied.� Other� revenues� susceptible� to� accrual� include� other� taxes,�intergovernmental�revenues,�interest,�and�charges�for�services.�
�Grant�revenues�are�recognized�in�the�fiscal�year�in�which�all�eligibility�requirements�are�met.�Under�the�terms� of� grant� agreements,� the� City� may� fund� certain� programs� with� a� combination� of� cost��reimbursement� grants,� categorical� block� grants,� and� general� revenues.� Thus,� both� restricted� and�unrestricted�net�position�may�be�available�to�finance�program�expenditures/expenses.�The�City’s�policy�is�to�first�apply�restricted�resources�to�such�programs,�followed�by�unrestricted�resources�if�necessary.�
�Certain�indirect�costs�are�included�in�program�expenses�reported�for�individual�functions�and�activities.�
38
City�of�Redwood�City�Notes�to�the�Basic�Financial�Statements�For�the�fiscal�year�ended�June�30,�2017
�
��
�NOTE�1�–�SUMMARY�OF�SIGNIFICANT�ACCOUNTING�POLICIES�(CONTINUED)�
�E. Compensated�Absences�
�In�compliance�with�Governmental�Accounting�Standards�Board�Statement�No.�16,�the�City�has�established�a� liability� for�accrued�sick� leave�and�vacation� in�relevant� funds.�For�governmental�activities,� the�current�liability�for�the�payouts�made�after�June�30,�2016�for�those�employees�retired�on�or�before�June�30,�2016�appears� in� the� respective� funds� and� the� long�term� liability� appears� in� the� government�� wide� financial�statements.� This� liability� is� set�up� for� the�current�employees�at� the�current� rates�of�pay.� �An�employee�may�accumulate�vacation�up�to�two�years�entitlement�and�sick�leave�up�to�960�or�1,920�hours�depending�on�the�bargaining�unit�(with�the�exception�that�Battalion�Chiefs�who�work�24�hour�shifts�may�accumulate�up�to�2,400�hours�of�sick�leave).�
�An�employee�may�elect� to�receive�compensation� in� lieu�of�sick� leave�credits� for�any�calendar�year�with�payment�equal�to�varying�amounts�from�25%�to�50%�of�the�year’s�unused�sick�leave,�depending�upon�the�employee’s� sick� leave� usage� during� the� year.� In� addition� to� sick� leave,� payouts� are� made� for� unused�administrative�holidays�and�accrued�compensatory�time.�
�If� sick� leave� and� vacation� are� not� used� by� the� employee� or� paid� out� during� the� term� of� employment,�compensation�is�payable�to�the�employee�at�the�time�of�separation.�Such�compensation�is�calculated�at�the� employee’s� prevailing� rate� at� the� time� of� retirement� or� termination.� Whereas� vacation� is�compensated�at�100%�of�accumulated�hours,�sick�leave�is�compensated�at�50%�of�accumulated�hours�at�retirement�depending�upon�varying� restrictions�of� the�bargaining�units.� Upon� termination�only�accrued�vacations�are�compensated.�Each�year�an�adjustment�to�the�liability� is�made�based�on�pay�rate�changes�and�adjustments�for�the�current�portion.�The�general�fund�is�primarily�responsible�for�the�repayment�of�the�governmental�portion�of�the�compensated�absences.�
�Individual� proprietary� funds� are� responsible� for� the� repayment� of� the� liability� attributable� to� their�respective�funds.�
�F. Cash�and�Cash�Equivalents�
�The�City�pools�cash�resources�from�all�funds�in�order�to�facilitate�the�management�of�cash.�The�balance�in�the�pooled�cash�account� is�available�to�meet�current�operating�requirements.�Cash� in�excess�of�current�requirements�is�invested�in�various�interest�bearing�accounts�and�other�investments�for�varying�terms.�
�In�accordance�with�GASB�Statement�No.�40,�Deposit�and�Investment�Disclosures�(Amendment�of�GASB�No.�3),�certain�disclosure�requirements�for�Deposits�and�Investment�Risks�were�made�in�the�following�areas:�
a. Interest�Rate�Risk�b. Credit�Risk�
i. Overall�ii. Custodial�Credit�Risk�
iii. Concentrations�of�Credit�Risk�������
39
City�of�Redwood�City�Notes�to�the�Basic�Financial�Statements�For�the�fiscal�year�ended�June�30,�2017
�
��
�NOTE�1�–�SUMMARY�OF�SIGNIFICANT�ACCOUNTING�POLICIES�(CONTINUED)��F.� Cash�and�Cash�Equivalents,�Continued��In� addition,� other� disclosures� are� specified� including� use� of� certain� methods� to� present� deposits� and�investments,�highly�sensitive�investments,�credit�quality�at�year�end,�and�other�disclosures.��In�accordance�with�GASB�Statement�No.�31,�Accounting�and�Financial�Reporting�for�Certain�Investments�and�for�External�Investment�Pools,�highly�liquid�market�investments�with�maturities�of�one�year�or�less�at�time�of�purchase�are�stated�at�amortized�cost.��All�other�investments�are�stated�at�fair�value.��The�City�categorizes� the� fair� value� measurements� of� its� investments� based� on� the� hierarchy� established� by�generally�accepted�accounting�principles.�The� fair�value�hierarchy,�which�has� three� levels,� is�based�on�the� valuation� inputs� used� to� measure� an� asset’s� fair� value:� Level� 1� inputs� are� quoted� prices� in� active�markets� for� identical� assets;� Level� 2� inputs� are� significant� other� observable� inputs;� Level� 3� inputs� are�significant�unobservable�inputs.�The�City�does�not�have�any�investments�that�are�measured�using�Level�3�inputs.�
�The� City� participates� in� an� investment� pool� managed� by� the� State� of� California� titled� Local� Agency�Investment�Fund�(LAIF)�which�has�invested�a�portion�of�the�pooled�funds�in�Structured�Notes�and�Asset��Backed�Securities.�LAIF’s�investments�are�subject�to�credit�risk�with�the�full�faith�and�credit�of�the�State�of� California� collateralizing� these� investments.� In� addition,� these� Structured� Notes� and� Asset�Backed�Securities�are�subject�to�market�risk�as�to�the�change�in�interest�rates.��Cash� equivalents� are� considered� amounts� in� demand� deposits� and� short�term� investments� with� a�maturity� date� within� three� months� of� the� date� acquired� by� the� City� and� are� presented� as� “Cash� and�Investments”�in�the�accompanying�Basic�Financial�Statements.��For�purposes�of�the�statement�of�cash�flows,�cash�equivalents�are�defined�as�investments�with�original�maturities�of�90�days�or�less,�which�are�readily�convertible�to�known�amounts�of�cash.�The�City�considers�all� pooled� cash� and� investments� (consisting� of� cash� and� investments� and� restricted� cash� and�investments)� held� by� the� City� as� cash� and� cash� equivalents� because� the� pool� is� used� essentially� as� a�demand�deposit�account�from�the�standpoint�of�the�funds.�The�City�also�considers�all�non�pooled�cash�and�investments�(consisting�of�cash�with�fiscal�agent�and�restricted�cash�and�investments�held�by�fiscal�agent)�as�cash�and�cash�equivalents�because�investments�meet�the�criteria�for�cash�equivalents�defined�above.��Inventories� are� stated� at� moving� average� cost.� The� cost� is� recorded� as� expenditure� at� the� time� an�individual�inventory�item�is�consumed.�As�inventories�must�be�maintained�at�a�certain�level,�an�amount�for� inventories� is� recorded� as� non�spendable� in� the� general� fund� balances.� Consequently,� these� non�spendable�fund�balance�amounts�are�not�available�for�appropriation.��General� fund� inventories� consist� of� stationery.� Equipment� services� fund� inventory� consists� of� tires,�batteries,�testing�equipment,�automotive�parts,�and�small�tools.�
40
City�of�Redwood�City�Notes�to�the�Basic�Financial�Statements�For�the�fiscal�year�ended�June�30,�2017
�
�
�
NOTE�1�–�SUMMARY�OF�SIGNIFICANT�ACCOUNTING�POLICIES�(CONTINUED)��
G. ���Inventories�and�Prepaid�Items��Under� the� consumption� method,� certain� payments� to� vendors� reflect� costs� applicable� to� future�accounting� periods� and� are� recorded� as� prepaid� items� in� both� government�wide� and� fund� financial�statements.�The�cost�of�prepaid�items�is�recorded�as�expenditures/expenses�when�consumed�rather�than�when�purchased.��H. Property�Taxes��Property� taxes� attach� as� an� enforceable� lien� on� property� as� of� January� 1,� and� are� collected� for� a� 12�month�period�effective�July�1�by�the�San�Mateo�County�tax�collector.�Taxes�are�billed�once�a�year�in�late�October�and�are�payable� in� two�equal� installments�due�by�December�10�and�April�10�of� the� following�year.��The�taxes�not�paid�by�those�dates�are�subject�to�a�penalty�of�10%.��In� September� of� 1993,� the� County� of� San� Mateo� Board� of� Supervisors� adopted� the� “Teeter� Plan”� for�secured�property�taxes.�Under�the�Teeter�Plan,�the�state�law�allows�the�county�to�advance�to�the�cities�all�property�taxes�billed,�regardless�of�whether�the�taxes�have�been�paid.�The�county�then�is�entitled�to�keep� all� penalties� and� interest� accruing� on� delinquent� taxes.� Property� taxes� on� unsecured� taxable�property�are�not�affected�by�this�change.�
�Under�Proposition�13,�adopted�by�the�voters�in�a�statewide�ballot�in�1978,�assessed�value�is�increased�by�the�cost�of�living�index,�not�to�exceed�2%�as�of�January�1�each�year�except�for�those�properties�that�have�changed� ownership� during� the� 12�month� period� since� the� lien� date.� City� property� tax� revenues� are�recognized�when�levied�to�the�extent�that�they�result�in�current�receivables.�
�I. Unbilled�Service�Receivables��In� the� water� and� sewer� utilities,� residential� customers� are� billed� bi�monthly� and� all� commercial� and�industrial�customers�monthly.�Revenue�is�recorded�as�billed�to�customers�on�a�cyclical�basis.��No�accrual�is� made� for� unbilled� services.� There� were� no� unbilled� services� in� Port,� parking,� Docktown� Marina,� or�internal�service�funds�as�of�June�30,�2016.��There�is�no�accrual�for�unbilled�water�services�as�of�June�30,�2016;�revenues�cannot�be�recognized�since�water�meters�are�not�read�at�such�date.�Management�believes�that�the�revenue�from�unbilled�services�does�not�have�a�material�effect�on�total�revenue.��J. Capital�Assets��All�capital�assets�are�valued�at�historical�cost�or�estimated�historical�cost� if�actual�historical�cost� is�not�available.��Donated�assets�are�valued�at�acquisition�value�on�the�date�donated.��The�City’s�policy� is�to�capitalize�all�assets�with�costs�exceeding�certain�minimum�thresholds,�$5,000�for�machinery� and� equipment,� $100,000� for� buildings,� improvements,� and� infrastructure,� and� with� useful�lives�exceeding�two�years.�
����
41

City�of�Redwood�City�Notes�to�the�Basic�Financial�Statements�For�the�fiscal�year�ended�June�30,�2017
�
�
�
NOTE�1�–�SUMMARY�OF�SIGNIFICANT�ACCOUNTING�POLICIES�(CONTINUED)��
J. Capital�Assets,�Continued��With� the� implementation� of� GASB� Statement� No.� 34,� the� City� recorded� all� of� its� public� domain�(infrastructure)�capital�assets�placed�in�service�after�June�30,�1980,�which�include�roads,�bridges,�curbs�and�gutters,�streets�and�sidewalks,�drainage�systems,�and�lighting�systems�using�the�basic�approach.��The�purpose�of�depreciation�is�to�spread�the�cost�of�capital�assets�equitably�among�all�users�over�the�life�of�these�assets.�The�amount�charged�to�depreciation�expense�each�year�represents�that�year’s�pro�rata�share�of� the�cost�of�capital�assets.�GASB�Statement�No.�34�requires� that�all� capital�assets�with� limited�useful�lives�be�depreciated�over�their�estimated�useful�lives.�Depreciation�is�provided�using�the�straight�line� method� which� means� the� cost� of� the� asset� is� divided� by� its� expected� useful� life� in� years� and� the�result�is�charged�to�expense�each�year�until�the�asset�is�fully�depreciated.��The�City�has�assigned�the�useful�lives�listed�as�follows�to�capital�assets:�
�Buildings� 20�50���Years� Storm�Drains 40���Years Traffic�Signals� 20���YearsImprovements� 33�60���Years� Bridges 30���Years Streets� 20���YearsEquipment� 2�15���Years� Parks 25���Years �
��
K. Deferred�Outflows/Inflows�of�Resources��
In� addition� to� assets,� the� statement� of� financial� position� will� sometimes� report� a� separate� section� for�deferred�outflows�of�resources.�This�separate�financial�statement�element�represents�a�consumption�of�net�position�that�applies�to�a�future�period(s)�and�so�will�not�be�recognized�as�an�outflow�of�resources�(expense/expenditure)� until� then.� The� City� has� deferred� outflows� of� resources� related� to� the�unamortized� losses� on� refunding� of� debt.� The� losses� on� refunding� result� from� the� difference� in� the�carrying�value�of�refunded�debt�and�its�reacquisition�price.�This�amount�is�deferred�and�amortized�over�the� shorter� of� the� life� of� the� refunded� or� the� refunding� debt.� The� City� also� has� deferred� outflows� of�resources� related� to� employer� pension� contributions� and� other� amounts� related� to� pension� actuarial�valuations.��In�addition�to�liabilities,�the�statement�of�financial�position�will�sometimes�report�a�separate�section�for�deferred�inflows�of�resources.�This�separate�financial�statement�element�represents�an�acquisition�of�net�position� that� applies� to� a� future� period(s)� and� so� will� not� be� recognized� as� an� inflow� of� resources�(revenues)� until� that� time.� The� City� has� deferred� inflows� of� resources� related� to� unavailable� revenues�reported�under�the�modified�accrual�basis�of�accounting�in�the�governmental�funds�balance�sheet.�The�governmental� funds� report� unavailable� revenues� from� property� taxes,� advances� from� the� federal� and�state� governments,� and� other� sources� as� appropriate.� These� amounts� are� deferred� and� recognized� as�revenues� in�the�period�the�amounts�become�available.�The�City�also�has�deferred� inflows�of�resources�related�to�pension�actuarial�valuations.�
42
City�of�Redwood�City�Notes�to�the�Basic�Financial�Statements�For�the�fiscal�year�ended�June�30,�2017
�
�
�
NOTE�1�–�SUMMARY�OF�SIGNIFICANT�ACCOUNTING�POLICIES�(CONTINUED)��
L. Interfund�Transactions��
Interfund�transactions�are�reflected�as�loans,�services�provided�or�used,�reimbursements,�or�transfers.��
Loans� reported� as� receivables� and� payables� are� referred� to� as� either� “due� to/from� other� funds”� (the�current� portion� of� interfund� loans)� or� “advances� to/from� other� funds”� (the� noncurrent� portion� of�interfund�loans)�as�appropriate�and�are�subject�to�elimination�upon�consolidation.�Any�residual�balances�outstanding� between� the� governmental� activities� and� the� business�type� activities� are� reported� in� the�government�wide�financial�statements�as�“internal�balances.”�
�Services�provided�or�used,�deemed�to�be�at�market�or�near�market�rates,�are�treated�as�revenues�and�expenditures�or�expenses.�
�Reimbursements� occur� when� the� funds� responsible� for� particular� expenditures� or� expenses� repay� the�funds�that�initially�paid�for�them.��Such�reimbursements�are�reflected�as�expenditures�or�expenses�in�the�reimbursing�fund�and�reductions�to�expenditures�or�expenses�in�the�reimbursed�fund.�
�All�other�interfund�transactions�are�treated�as�transfers.�Transfers�between�governmental�or�proprietary�funds�are�netted�as�part�of�the�reconciliation�to�the�government�wide�presentation.�
�M. Use�of�Estimates�
�The� preparation� of� the� basic� financial� statements� in� conformity� with� generally� accepted� accounting�principles�requires�management�to�make�estimates�and�assumptions.�These�estimates�and�assumptions�affect� the� reported� amounts� of� assets� and� liabilities� and� the� disclosure� of� contingent� assets� and�liabilities.�In�addition,�estimates�affect�the�reported�amount�of�expenses.�Actual�results�could�differ�from�these�estimates�and�assumptions.�
�N. Pensions�
�For�purposes�of�measuring�the�net�pension� liability�and�deferred�outflows/inflows�of�resources�related��to�pensions,�and�pension�expense,� information�about� the� fiduciary�net�position�of� the�City’s�California�Public� Employees’� Retirement� System� (CalPERS)� plans� (Plans)� and� additions� to� /deductions� from� the�Plans’�fiduciary�net�position�have�been�determined�on�the�same�basis�as�they�are�reported�by�CalPERS.�For�this�purpose,�benefit�payments�(including�refunds�of�employee�contributions)�are�recognized�when�due�and�payable�in�accordance�with�the�benefit�terms.��Investments�are�reported�at�fair�value.�
�
43

City�of�Redwood�City�Notes�to�the�Basic�Financial�Statements�For�the�fiscal�year�ended�June�30,�2017
�
��
�NOTE�1�–�SUMMARY�OF�SIGNIFICANT�ACCOUNTING�POLICIES�(CONTINUED)����
O. Implementation�of�New�GASB�Pronouncements��In� FY� 2016�17� the� City� adopted� the� following� new� accounting� standard� in� order� to� conform� to� the�following�Governmental�Accounting�Standards�Board�Statement:��
GASB�Statement�No.�74,�Financial�Reporting�for�Postemployment�Benefit�Plans�Other�Than�Pension�Plans–�The� objective� of� this� Statement� is� to� improve� the� usefulness� of� information� about� postemployment�benefits�other�than�pensions�(other�postemployment�benefits�or�OPEB)�included�in�the�general�purpose�external�financial�reports�of�state�and�local�governmental�OPEB�plans�for�making�decisions�and�assessing�accountability.� This� Statement� results� from� a� comprehensive� review� of� the� effectiveness� of� existing�standards�of�accounting�and�financial�reporting�for�all�postemployment�benefits�(pensions�and�OPEB)�with�regard�to�providing�decision�useful�information,�supporting�assessments�of�accountability�and�interperiod�equity,�and�creating�additional�transparency.�The�requirements�of�this�statement�were�not�applicable�to�the�City.��GASB� Statement� No.� 77,� Tax� Abatement� Disclosure�� This� Statement� addresses� the� financial� statements�prepared� by� state� and� local� governments� in� conformity� with� generally� accepted� accounting� principles�provide�citizens�and�taxpayers,�legislative�and�oversight�bodies,�municipal�bond�analysts,�and�others�with�information� they� need� to� evaluate� the� financial� health� of� governments,� make� decisions,� and� assess�accountability.� This� information� is� intended,� among� other� things,� to� assist� these� users� of� financial�statements� in� assessing� (1)� whether� a� government’s� current�year� revenues� were� sufficient� to� pay� for�current�year� services� (known� as� interperiod� equity),� (2)� whether� a� government� complied� with� finance�related� legal� and� contractual� obligations,� (3)� where� a� government’s� financial� resources� come� from� and�how�it�uses�them,�and�(4)�a�government’s�financial�position�and�economic�condition�and�how�they�have�changed�over�time.�There�was�no�impact�on�net�position�as�a�result�of�implementation�of�this�statement.��GASB� Statement� No.� 78,� Pension� Provided� through� Certain� Multiple�Employer� Defined� Benefit� Pension�Plans–�The�objective�of�this�Statement�is�to�address�a�practice�issue�regarding�the�scope�and�applicability�of� Statement� No.� 68,� Accounting� and� Financial� Reporting� for� Pensions.� This� issue� is� associated� with�pensions�provided�through�certain�multiple�employer�defined�benefit�pension�plans�and�to�state�or�local�governmental� employers� whose� employees� are� provided� with� such� pensions.� The� requirements� of� this�statement�were�not�applicable�to�the�City.��GASB�Statement�No.�80,�Blending�Requirements�for�Certain�Component�Units�–�An�Amendment�of�GASB�Statement� No.� 14� �� The� objective� of� this� Statement� is� to� improve� financial� reporting� by� clarifying� the�financial�statement�presentation�requirements�for�certain�component�units.�This�Statement�amends�the�blending�requirements�established�in�paragraph�53�of�Statement�No.�14,�The�Financial�Reporting�Entity,�as�amended.�This�Statement�amends�the�blending�requirements�for�the�financial�statement�presentation�of�component� units� of� all� state� and� local� governments.� The� additional� criterion� requires� blending� of� a�component�unit�incorporated�as�a�not�for�profit�corporation�in�which�the�primary�government�is�the�sole�corporate�member.�The�additional�criterion�does�not�apply�to�component�units� included�in�the�financial�reporting� entity� pursuant� to� the� provisions� of� Statement� No.� 39,� Determining� Whether� Certain�Organizations�Are�Component�Units.�The�requirements�of�this�statement�were�not�applicable�to�the�City.������
44

City�of�Redwood�City�Notes�to�the�Basic�Financial�Statements�For�the�fiscal�year�ended�June�30,�2017
�
��
���NOTE�2�–�CASH�AND�INVESTMENTS��The�following�is�a�summary�of�pooled�cash�and�investments,�including�cash�and�investments�with�fiscal�agent�at�June�30,�2017:��
Governmental Business�Type FiduciaryActivities Activities Funds Total
$ $ $ $Cash�and�investments 160,366,034������������ 93,088,210��������������������� ��������������������������� 253,454,244������
Restricted�cash�and�investments 4,180,968����������������� 6,508,765����������������������� 10,043,356�������� 20,733,089��������
Total�cash�and�investments 164,547,002������������ 99,596,975��������������������� 10,043,356�������� 274,187,333������
Government�Wide�Statement�of�Net�Position
���Cash�and�investments�as�of�June�30,�2017�consist�of�the�following:��
Deposits:Cash�on�hand 10,659$������������������Deposits�with�financial�institution 3,293,273���������������
Total�deposits 3,303,932���������������
Investments:����San�Mateo�Investment�Pool 45,476,002�������������
Local�Agency�Investment�funds 77,966,510�������������Federal�Agency�Securities 65,807,602�������������U.S.�Treasury�Notes 58,483,915�������������Corporate�Notes 10,407,496�������������Bank�Acceptance 4,732,460���������������Money�Market 105,369������������������
Total�investments 262,979,354�����������
Total�City�Treasury 266,283,286�����������
Cash�with�fiscal�agent 7,904,047���������������
Total�cash�and�investments 274,187,333$��������
�A. Cash�and�Deposits�
�The�carrying�amount�of�the�City’s�cash�and�deposits,�including�restricted�cash,�was�$3,293,273�at�June�30,�2017.� Bank� balances� before� reconciling� items� were� $4,114,348� at� June� 30,� 2017.� Of� the� total� bank�balances,�$500,000�was�insured�or�held�by�the�City�or�its�agent�in�the�City's�name.������
45
City�of�Redwood�City�Notes�to�the�Basic�Financial�Statements�For�the�fiscal�year�ended�June�30,�2017
�
��
�NOTE�2�–�CASH�AND�INVESTMENTS�(CONTINUED)��A. Cash�and�Deposits,�Continued�
�All� cash� deposits� in� banks� are� fully� insured� or� collateralized.� � California� state� law� requires� that� public�fund� deposits� be� collateralized� by� either� government� securities� with� a� value� equal� to� 110%� of� the�deposits�or�first�trust�deed�mortgage�notes�having�a�value�equal�to�150%.�Per�state�law�each�institution�must�use�a�third�party�(which�may�be�the�institution’s�trust�department)�to�hold�the�pledged�collateral�in�a�pool�to�secure�all�the�institution’s�public�fund�deposits.�The�code�states�that�collateral�pledged�in�this�manner� shall�have� the� effect�of�perfecting�a� security� interest� in� such� collateral� superior� to� those�of�a�general�creditor.�Thus,�collateral�for�cash�is�considered�to�be�held�in�the�City’s�name.��Banks�and�savings�and� loans� in� California� are� subject� to� state�mandated� reporting� requirements� to� ensure� that� the�required� levels�of� control� are�maintained.� The�City�may� waive� collateral� requirements� for� deposits,�which�are�fully�insured�with�each�financial�institution�up�to�$250,000�by�the�Federal�Deposit�Insurance�Corporation�(FDIC).�
�Cash� balances� from� all� funds� are� combined� and� invested� to� the� extent� possible� pursuant� to� the� City�Council�approved�investment�policy�and�guidelines�and�state�government�code.�The�earnings�from�these�investments�are�allocated�monthly� to�each� fund�based�on�an�average�of�monthly�opening�and�closing�balances�of�cash�and�investments.�Investments�are�stated�at�fair�value.�All�enterprise�fund�investments�are�considered�to�be�liquid�investments�for�cash�flow�purposes.�
�Interest� Rate� Risk.� As� a� means� of� limiting� its� exposure� to� fair� value� losses� arising� from� rising� interest�rates,�the�City’s�investment�policy�provides�that�final�maturities�of�securities�cannot�exceed�three�years.�Specific�maturities�of�investments�depend�on�liquidity�needs.���B. Investments��
�
As�of�June�30,�2017,�the�City�had�the�following�investments�by�maturity:��
Cash�and�Investments Total �1�year�or�Less� �1���2�years� �2��3�years� �5�years�or�More�
County�of�San�Mateo�Investment�Pool 45,476,002������������ 45,476,002����������California�Local�Agency�Investment�Fund 77,966,510������������ 77,966,510����������U.S.�Agencies,�Securities,�and�Corporate�Notes:�
Federal�Agency�Securities 65,807,602������������ 2,992,140������������ 35,822,700���������� 15,167,205���������� 11,825,557���������U.S.�Treasury�Notes 58,483,915������������ 2,962,803������������ 55,521,112����������Corporate�Notes 10,407,496������������ 4,910,136������������ 590,413��������������� 4,906,947�������������Bank�Acceptance 4,732,460�������������� 4,732,460������������Money�Market 105,369������������������ 105,369����������������
Total 262,979,354$�������� 136,182,617$������ 39,375,916$�������� 75,595,264$�������� 11,825,557$��������
Investment�Maturities�(in�years)
�
�����
46

City�of�Redwood�City�Notes�to�the�Basic�Financial�Statements�For�the�fiscal�year�ended�June�30,�2017
�
��
�NOTE�2�–�CASH�AND�INVESTMENTS�(CONTINUED)��B. Investments,�Continued�
�Credit�Risk�–�Defined�as�the�risk�of�loss�of�value�of�an�investment�due�to�a�downgrade�of�its�rating�or�the�failure� or� impairment� of� its� issuer.� Credit� Risk� shall� be� mitigated� by� investing� in� investment� grade�securities�and�by�diversifying�the�investment�portfolio�so�that�failure�of�any�one�issue�does�not�unduly�harm� the� City’s� capital� base� and� cash� flow.� In� order� to� limit� loss� exposure� due� to� Credit� Risk,� the�investment�policy�limits�purchases�of�commercial�paper�investments�to�those�rated�A�1�by�Standard�and�Poor's�or�P�1�by�Moody's�Investor's�Service,�and�corporate�bonds�to�those�rated�A�or�better�by�Standard�and�Poor's�or�Moody's�Investor's�Service.�
�Under�the�provisions�of�the�City’s�investment�policy,�and�in�accordance�with�California�Government�Code,�the�following�investments�are�authorized:��
� � � � �
Maximum� � Maximum�Maximum� Percentage�of� Investment�in�
�� Authorized�Investment�Type� �� Maturity� �� Portfolio� �� One�Issuer� �
United�States�Treasury�Obligations� 5�years� No�limit� No�limit�Federal�Agency�or�Government�Sponsored�Enterprises�(GSEs)� N/A 70% 35%Local�Agency�Investment�Fund� N/A No�limit $65�MillionSan�Mateo�County�Pool� N/A No�limit $50�MillionState�and�Local�Agency�Bonds� N/A 20% 2%Money�Market�and�Mutual�Funds� N/A 20% 5%U.S.�Medium�Term�Notes� 3�years 20% 2%Certificates�of�Deposit� 3�years 10% 2%Prime�Commercial�Paper� 270�days 10% 2%Bankers’�Acceptances� 180�days 10% 2%Repurchase�Agreements� 90�days 10% No�limit
���
�The�City’s�investments�are�rated�by�the�nationally�recognized�statistical�rating�organizations�as�follows:��
� Moody’s S&P� FitchU.S.�Agencies,�Securities,�and�Corporate�Notes: �Federal�Home�Loan�Bank� Aaa� AA+� �Federal�National�Mortgage�Association� Aaa� AA+� AAA�Federal�Home�Loan�Mortgage�Corporation� Aaa� AA+� AAA�Federal�Farm�Credit� Aaa� AA+� AAA�U.S.�Treasury�Securities� Aaa� AA+� AAA�External�Investment�Pools:� � � �San�Mateo�County�Investment�Fund� Not�Rated� AAAf/S1� Not�Rated�California�Local�Agency�Investment�Fund Not�Rated Not�Rated� Not�Rated
�
����
47

City�of�Redwood�City�Notes�to�the�Basic�Financial�Statements�For�the�fiscal�year�ended�June�30,�2017
�
��
�NOTE�2�–�CASH�AND�INVESTMENTS�(CONTINUED)��Custodial�Credit�Risk.��For�an�investment,�custodial�credit�risk�is�the�risk�that,�in�the�event�of�the�failure�of� the� counter� party,� the� City� will� not� be� able� to� recover� the� value� of� its� investments� or� collateral�securities�that�are�in�the�possession�of�an�outside�party.�All�securities,�with�the�exception�of�the�County�Pool�and�LAIF,�are�held�by�third�party�custodians�(Union�Bank�of�California�Trust�Division,�U.S.�Bank�and�Bank�of�New�York).��Union�Bank,�U.S.�Bank,�and�Bank�of�New�York�are�registered�members�of�the�Federal�Reserve�Bank.��The�securities�held�by�Union�Bank,�U.S.�Bank,�and�Bank�of�New�York�are�in�street�name,�and�an�account�number�assigned�to�the�City�identifies�ownership.�None�of�the�City’s�investments�were�subject�to�custodial�credit�risk.��In� fiscal�year�1997�98,� the�City�adopted�Governmental�Accounting�Standards�Board�Statement�No.�31,�which�requires�that�the�City's� investments�be�carried�at�fair�value� instead�of�cost.�Under�GASB�31,�the�City�must�adjust�the�carrying�value�of� its� investments�to�reflect�their�fair�value�at�each�fiscal�year�end,�and�it�must�include�the�effects�of�these�adjustments�in�income�for�that�fiscal�year.�The�adjustment�from�carrying�value�to�fair�value�was�an�unrealized�loss�of�$905,581�as�of�June�30,�2017.��GASB�31�applies�to�all�the�City's�investments,�even�if�they�are�held�to�maturity�and�redeemed�at�full�face�value.�Since�the�City's�policy�is�to�hold�all� investments�to�maturity,�the�fair�value�adjustments�required��by�GASB�31�result�in�accounting�gains�or�losses�(called�"recognized"�gains�or�losses)�which�do�not�reflect�actual�sales�of�the�investments�(called�"realized"�gains�or�losses).�Thus,�recognized�gains�or�losses�on�an�investment�purchased�at�par�will�now�reflect�changes�in�its�value�at�each�succeeding�fiscal�year�end,�but�these�recognized�gains�or�losses�will�net�to�zero�if�the�investment�is�held�to�maturity.�By�following�the�requirements�of�GASB�31,�the�City�is�reporting�the�amount�of�resources�which�would�actually�have�been�available�if�it�had�been�required�to�liquidate�all�its�investments�at�any�fiscal�year�end.��External�Investment�Pools��The� City� is� a� voluntary� participant� in� the� Local� Agency� Investment� Fund� (LAIF)� that� is� regulated� by�California� Government� Code� Section� 16429� under� the� oversight� of� the� Treasurer� of� the� State� of�California.��The�City�reports�its�investment�in�LAIF�at�the�fair�value�amount�provided�by�LAIF.�The�balance�available�for�withdrawal�is�based�on�the�accounting�records�maintained�by�LAIF,�which�are�recorded�on�an�amortized�cost�basis.� Included�in�LAIF’s� investment�portfolio�are�collateralized�mortgage�obligation,�mortgage�backed�securities,�other�asset�backed�securities,�loans�to�certain�state�funds,�and�floating�rate�securities�issued�by�federal�agencies,�government�sponsored�enterprises,�supranational�obligations,�and�corporations.���
�These�investments�may�include�the�following:�
�Structured�Notes���are�debt�securities�(other�than�asset�backed�securities)�whose�cash�flow�characteristics�(coupon�rate,�redemption�amount,�or�stated�maturity)�depend�upon�one�or�more�indices�and/or�that�have�embedded�forwards�or�options.�
�Asset�Backed�Securities���the�bulk�of�which�are�mortgage�backed�securities,�entitle�their�purchasers�to�receive�a�share�of�the�cash�flows�from�a�pool�of�assets�such�as�principal�and�interest�repayments�from�a�pool�of�mortgages�(such�as�Collateralized�Mortgage�Obligations)�or�credit�card�receivables.�
���
48
City�of�Redwood�City�Notes�to�the�Basic�Financial�Statements�For�the�fiscal�year�ended�June�30,�2017
�
��
�NOTE�2�–�CASH�AND�INVESTMENTS�(CONTINUED)�
�As�of�June�30,�2017,�the�City�had�$77,966,510�(estimated�fair�value)� invested�in�LAIF.�LAIF�had�invested�2.89%�of�the�pool�investment�funds�in�Structured�Notes�and�Asset�Backed�Securities.�LAIF�determines�fair�value� on� its� investment� portfolio� based� on� market� quotations� for� those� securities� where� market�quotations�are�readily�available�and�based�on�amortized�cost�or�best�estimate�for�those�securities�where�market� value� is� not� readily� available.� The� City� valued� its� investments� in� LAIF� as� of� June� 30,� 2017,� by�multiplying� its� account� balance� with� LAIF� times� a� fair� value� factor� determined� by� LAIF.� The� fair� value�factor� was� determined� by� dividing� all� LAIF� participants’� total� aggregate� fair� value� by� total� aggregate�amortized�costs.��Accordingly,� as� of� June� 30,�2017,� the� City’s� investment� in� LAIF� at� fair�value� amounted� to� $77,966,510�using� a� LAIF� fair� value� factor� of� 0.998940671.� � The� fair� value� of� the� City’s� position� in� the� pool� is�materially�equivalent�to�the�value�of�the�pool�shares.��The� City� is� also� a� voluntary� participant� in� the� San� Mateo� County� Investment� Fund� that� is� regulated� by�California�Government�Code�Section�16429�under�oversight�of�the�Treasurer�of�the�County�of�San�Mateo.�The� City� reports� its� investment� in� the� San� Mateo� County� Investment� Fund� at� the� fair� value� amount�provided� by� County� of� San� Mateo.� Included� in� the� San� Mateo� County� Investment� Fund� investment�portfolio�are�US�Treasury�Notes,�Obligations� issued�by�agencies�of� the�United�States�Government,�LAIF,�Corporate� Notes,� Commercial� Paper,� collateralized� mortgage� obligations,� mortgage�� backed� securities,�other� asset�backed� securities,� and� floating� rate� securities� issued� by� federal� agencies,� government�sponsored�enterprises,�repurchase�agreements,�and�corporations.��Investment�Valuation�
�Investments�(except�for�money�market�accounts,�time�deposits,�and�commercial�paper)�are�measured�at�fair� value� on� a� recurring� basis.� Recurring� fair� value� measurements,� are� those� that� Governmental�Accounting�Standards�Board�(GASB)�Statements�require�or�permit�in�the�statement�of�net�position�at�the�end� of� each� reporting� period.� Fair� value� measurements� are� categorized� based� on� the� valuation� inputs�used� to� measure� an� asset’s� fair� value:� Level� 1� inputs� are� quoted� prices� in� active� markets� for� identical�assets;�Level�2�inputs�are�significant�other�observable�inputs;�Level�3�inputs�are�significant�unobservable�inputs.�Investment�fair�value�measurements�at�June�30,�2017�are�described�on�the�following�page.��Investments� included� in� LAIF� and� San� Mateo� County� Pool� as� well� as� restricted� cash� and� investments�included� money� market� accounts� and� guaranteed� investment� contracts� are� not� subject� to� fair� value�measurement.�����������������
49

City�of�Redwood�City�Notes�to�the�Basic�Financial�Statements�For�the�fiscal�year�ended�June�30,�2017
�
��
�NOTE�2�–�CASH�AND�INVESTMENTS�(CONTINUED)��Investment�Valuation,�Continued��
Investment�Type Fair�Value �Level�1� Level�2 Level�3
Investments�subject�to�levelsCommercial�paper/Bank�acceptance 4,732,460$���������������� 4,732,460$�������������Corporate�Notes 10,407,496��������������� 10,407,496�����������Federal�Farm�Credit�Bank 2,982,810����������������� 2,982,810��������������Federal�Home�Loan�Bank 7,972,210������������������� 7,972,210���������������Federal�Home�Loan�Mortgage�Corporation 26,139,172����������������� 26,139,172�������������Federal�National�Mortgage�Association 28,713,410����������������� 28,713,410�������������Money�Market 105,369���������������������� 105,369������������������US�Treasury�Notes 58,483,915����������������� 58,483,915���������Total�investments�subject�to�levels 139,536,842������������ 58,483,915������� 81,052,927�����������
Investment�not�subject�to�levelsSan�Mateo�County�Pool 45,476,002�����������������Local�Agency�Investment�Fund 77,966,510�����������������
Total�investments� 262,979,354$����������� 58,483,915$������ 81,052,927$����������
Fair�Value�Measurement�Using
��
Treasury�securities�categorized�as�Level�1�are�valued�based�on�prices�quoted�in�active�markets�for�those�securities.� Federal� Farm� Credit� Bank� Bonds,� Federal� Home� Loan� Banks,� Federal� Home� Loan� Mortgage�Corporate�Notes,�Federal�National�Mortgage�Association�Notes�and�Corporate�Notes�categorized�as�Level�2�are�valued�based�on�matrix�pricing�which�use�observable�market�inputs�such�as�yield�curves�and�market�indices� that� are� derived� principally� from� or� corroborated� by� observable� market� data� by� correlation� to�other�means.�
�C. Restricted�Cash�
�The�City’s�restricted�cash�consisted�of�$7,904,047�in�cash�and�investments�as�of�June�30,�2017�held�by�trustees�or�fiscal�agents.�The�City�had�$12,829,042�in�restricted�cash�and�investments�held�by�the�City.�This�restricted�cash�is�pledged�for�the�payment�or�security�of�certain�bonds,�certificates�of�participation,�and� lease� obligations.� The� California� government� code� provides� that� these� monies,� in� the� absence� of�specific�statutory�provisions�governing�the�issuance�of�bonds,�certificates,�or�leases,�may�be�invested�in�accordance� with� the� ordinance,� resolutions,� or� indentures� specifying� the� types� of� investments� its�trustees�or�fiscal�agents�may�make.�In�some�situations,�these�investments�differ�from�those�permitted�by�the�City�investment�policy.� Included�in�these�investments�at�June�30,�2017�is�a�guaranteed�investment�contract�with�a�maturity�date� in�fiscal�year�2035�authorized�in�the�bond�indenture�and�by�City�Council�prior�to�purchase.�
�������
50
City�of�Redwood�City�Notes�to�the�Basic�Financial�Statements�For�the�fiscal�year�ended�June�30,�2017
�
��
�NOTE�3���LOANS�RECEIVABLE��As�of�June�30,�2017,�loans�receivable�consists�of�the�following:�
����������������������������
A. Wyndham�Place�First�Time�Homebuyer�Loan�Program��
The�City�established�a�First�Time�Homebuyer�Program�during�fiscal�year�1995�on�a�specific�development�sponsored�by�the�former�Redevelopment�Agency�called�Wyndham�Place.�The�program�currently�involves�the�resale�of�Wyndham�units�where�the�City�has�First�Right�of�Refusal.�The�City�exercises�its�First�Right�of�Refusal�and�markets�the�units�to�qualified�buyers.�
�A�portion�of�the�City’s�Shared�Appreciation�is�used�to�assist�the�new�buyer�in�the�Resale�Program.�While�the� initial�program�in�1995�made�0%�interest� loans,�current�buyers� in�the�Resale�Program�are�assisted�according�to�the�needs�of�the�borrower.�Depending�on�the�borrower’s�ability�to�secure�private�financing�for�a�first�mortgage,�the�City�loan�is�underwritten�based�on�the�borrower’s�spendable�income.�
�These�loans�bear�no�interest�and�are�secured�by�second�deeds�of�trust�on�the�property,�and�typically,�no�payments� are� due� until� five� years� after� the� date� of� purchase.� As� of� June� 30,� 2017� the� City� has�outstanding�loans�of�$333,447�to�eleven�Wyndham�Place�buyers.�
�B. City�Centre�Plaza�Loans�
�The� former� Redevelopment� Agency� sold� several� parcels� of� land� to� the� developers� of� the� City� Centre�Plaza� project� (a� residential� and� commercial� development)� for� $1,700,000� in� 1996.� The� developers�constructed�City�Center�Plaza,�which�contains�81�affordable�housing�units,�a�childcare�facility,�residential�and�commercial�parking,�and�17,900�square�feet�of�retail�space.�The�promissory�note�from�Mezes�Court�Associate� in�the�amount�of�$1,445,000� is� to�be�repaid�through�2028�from�surplus�revenues�generated���by�the�housing�project�and�accrued�interest�at�3%,�with�$371,076�due�to�the�City’s�Low�and�Moderate�Income�Housing�Asset�Fund,�and�$1,073,924�due�to�the�Successor�Agency�Private�Purpose�Trust� Fund.�The�loan�was�fully�paid�off�during�fiscal�year�2017.���
Government�Wide�$
Wyndham�Place�First�Time�Homebuyer�Loan�Program 333,447First�Time�Homebuyer�Silent�Loan�Program 274,960Loans�with�Non�profits�and�For�Profit�Organizations 1,133,153Housing�Rehabilitation�Loans 1,146,924Shores�Childcare�Loan 1,035,948First�Community�Housing�Loan 2,627,000PAL�Loan 214,286Kainos�Home�and�Training�Center�Loans 1,893,222HIP�Housing�Development�Corporation�Loan 92,197HIP�Housing���Oxford 103,600Mental�Health�Association�of�San�Mateo�County�Loan 600,0001512�Stafford�Loan 1,577,750Mezes�Court�Association 259,757Allowance�for�Uncollectible�Loans (1,893,222)������������������
Total 9,399,022
51

City�of�Redwood�City�Notes�to�the�Basic�Financial�Statements�For�the�fiscal�year�ended�June�30,�2017
�
��
�NOTE�3���LOANS�RECEIVABLE�(CONTINUED)��C. First�Time�Homebuyer�Silent�Loan�Program��In� 2000,� the� former� Redevelopment� Agency� established� a� First� Time� Homebuyer� Silent� Loan� Program.�Loans�are�deferred�for�the�first�five�years,�and�then�amortized�at�4%�interest�over�the�remaining�25�years.�An�Equity�Participation� requirement� shares�appreciation� based�on� the�amount�of� the�Agency’s�original�loan�amount.���At�June�30,�2017,�there�were�outstanding�loans�to�four�homebuyers�totaling�$274,960.���D. Loans�with�Non�profits�and�For�Profit� Organizations��The� City� and� former� Redevelopment� Agency� loaned� $500,000� to� MP� Redwood� Court� Associates� and�$650,000�to�Hallmark�Apartments�LLP.�The�MP�Redwood�Court�Associates�loan�agreement�was�entered�into�in�July�2003�for�the�repair�and�rehabilitation�of�housing�units.�The�loan�term�is�55�years�and�bears�0%�interest.��The�loan�to�Hallmark�Apartments�LLP�has�interest�deferred�for�the�first�30�years�after���which�it�bears� interest�at�3%�until� the�December�2058�maturity.�The�outstanding�balance�at� June�30,�2017�was�$1,133,153.���
E. Housing�Rehabilitation�Loans��The� City� and� former� Redevelopment� Agency� have� outstanding� loans� for� housing� rehabilitation� in� the�amount�of�$1,146,924.���
F. Shores�Childcare�Loan��The�City�entered�into�an�agreement�with�Shores�Childcare,�LLC�whereby�$3,200,000�was�loaned�to�Shores�Childcare,�LLC�for�construction�of�a�childcare�facility�on�City�owned�land�in�the�Redwood�Shores�area.�The�term�of�the�loan�is�20�years�maturing�January�2023,�with�interest�payable�quarterly�and�calculated�based�on�the�quarterly�rate�of�the�State�of�California�Local�Agency�Investment�Fund�plus�250�basis�points.��The�outstanding�balance�of�the�loan�at�June�30,�2017�was�$1,035,949.��
�G. First�Community�Housing�Loan�
�The�City�entered�into�an�agreement�with�First�Community�Housing�whereby�$2,627,000�($200,000�from�Community� Development� Block� Grant,� $1,927,000� from� the� former� Redevelopment� Agency� low� and�moderate� housing� fund,� $500,000� pass�through� from� County� of� San� Mateo)� was� loaned� to� First�Community� Housing� for� construction� of� the� Villa� Montgomery� housing� development� at� El� Camino� and�Vera� Avenue.� The� portion� of� the� loan� attributable� to� the� former� Redevelopment� Agency� has� been�transferred�to�the�City’s�Low�and�Moderate�Income�Housing�Asset�fund.�The�loan�bears�interest�at�3%�for�40� years.� The� loan� will� be� repaid� annually� from� 70%� of� the� project’s� net� cash� flow.� The� outstanding�balance�of�the�loan�at�June�30,�2017�was�$2,627,000.�
������
52

City�of�Redwood�City�Notes�to�the�Basic�Financial�Statements�For�the�fiscal�year�ended�June�30,�2017
�
��
�NOTE�3���LOANS�RECEIVABLE�(CONTINUED)�
�H. Police�Activities�League�Loan�
�In� March� 2006,� the� City� paid� off� a� construction� loan� in� the� amount� of� $1,500,000� that� the� Police�Activities� League� (PAL),� a� separate,� private,� non�profit� agency,� entered� into� with� Bay� Area� Bank� to�partially�finance�the�construction�of�the�new�PAL�community�center�at�Taft�School.�The�City�Council�and�PAL�agreed�that�one�half�of�the�amount,�or�$750,000,�will�be�paid�back�to�the�City�by�PAL�over�a�period�of�15�years.��The�outstanding�balance�of�the�loan�at�June�30,�2017�was�$214,286.�
��
I. Kainos�Home�and�Training�Center�Loan��
In��1989�90,��the��City��entered��into��an��agreement��with��Kainos��Home��and��Training��Center���whereby�$548,000� from� Community� Development� Block� Grant� was� loaned� to� acquire� and� rehabilitate� property���at�2555�Middlefield�Road.��In�2013�14,�Kainos�Home�and�Training�Center�sold�2555�Middlefield�Road,�and�used�the�proceeds�from�the�sale�to�purchase�2761�Fair�Oaks�Avenue.�The�current�City�loan�is�structured�as�a�lien�transfer�of�the�original�amount�plus�the�shared�equity�of�$437,722�from�2555�Middlefield�Road�to� 2761� Fair� Oaks� Avenue,� totaling� $985,722.� � The� loan� bears� no� interest� and� is� due� and� payable� on�March�29,�2039.�
�In�1997�98,�the�City�entered�into�an�agreement�with�Kainos�Home�and�Training�Center�whereby�$57,500�from�Community�Development�Block�Grant�was�loaned�to�acquire�property�at�2033�Jefferson�Avenue�for�Kainos�Home�and�Training�Center.� �The�loan�is�deferred�and�payable�upon�the�sale�of�the�property,�at�which�time�the�City�would�receive�repayment�of�the�loan�plus�any�accrued�equity�based�on�the�prorated�City�share.�In��2010�11,��the��City��entered��into��an��agreement��with��Kainos��Home��and��Training��Center���whereby�$400,000� from�the�City’s�HOME�and�CDBG�grant�programs�were� loaned� to�acquire�property� located�at�1122�Valota�Road�in�Redwood�City�for�special�needs�housing.��The�loan�is�deferred�for�a�term�of�55�years�at�0%�interest.��In��2012�13,��the��City��entered��into��an��agreement��with��Kainos��Home��and��Training��Center���whereby�$450,000�from�HOME�grant�was�loaned�to�acquire�property�located�at�1033�Redwood�Avenue�for�special�needs�housing.��The�loan�is�deferred�for�a�term�of�30�years�at�0%�interest.��The�loans�to�Kainos�Home�and�Training�Center�are�intended�to�be�forgiven�upon�maturity,�and�therefore,�an�allowance�for�uncollectible�loans�has�been�set�up�in�the�amount�of�$1,893,222.���
J. HIP�Housing�Development�Corporation�(HHDC)�Loan��
In�March�2013,�the�City�entered�into�an�agreement�with�HHDC�whereby�$92,197�from�HOME�investment�Partnership�Act�(HOME)�funds�were�loaned�to�assist�in�the�rehabilitation�of�a�12�unit�apartment�building�located� at� 1157�1161� Willow� Road� in� Menlo� Park.� The� loan� is� deferred� for� a� term� of� 30� years� at� 3%�interest.�The�outstanding�balance�of�the�loan�at�June�30,�2017�was�$92,197.��In� August� 2015,� the� City� entered� into� an� agreement� with� HHDC� whereby� $103,600� from� HOME�investment�Partnership�Act�(HOME)�funds�were� loaned�to�assist� in�the�rehabilitation�of�rental�housing�property�located�at�1505�1509�Oxford�Street�in�Redwood�City.��
53
City�of�Redwood�City�Notes�to�the�Basic�Financial�Statements�For�the�fiscal�year�ended�June�30,�2017
�
��
�NOTE�3���LOANS�RECEIVABLE�(CONTINUED)��K. Mental�Health�Association�of�San�Mateo�County�(MHA)� Loan��In� July,� 2013,� the� City� entered� into� an� agreement� with� MHA� whereby� $400,000� from� Community�Development� Block� Grant� (CDBG)� was� loaned� to� assist� with� the� acquisition� of� a� vacant� commercial�property�located�at�105�5th�Avenue�in�Redwood�City.�The�loan�is�deferred�for�a�term�of�30�years�at�0%�interest.���In� 2016�2017,� the� City� entered� into� a� second� agreement� with� MHA� whereby� an� additional� $200,000�from� Community� Development� Block� Grant� (CDBG)� was� loaned� for� the� property� located� at� 105� 5th�Avenue�in�Redwood�City.��The�loan�is�deferred�for�a�term�of�30�years�at�0%�interest.��
�L. Mezes�Court�Association��The� City� entered� into� an� agreement� with� Mezes� Court� Associates� on� November� 24,� 2015� whereby�$259,757�from�Community�Development�Block�Grant�was�loaned�to�acquire�property�at�950�Main�Street�for�affordable�rental�housing�as�set�forth� in�the�loan�agreement�evidencing�the�loan.�The� loan�accrues�interest� from� December�1,� 2016� at� the� rate� of� two� percent� (2%)� annual,� simple� interest� for� 57�years.�Principal�and�interest�are�payable�in�full�on�the�date�which�57�years�from�the�date�of�recordation�of�the�Deed�of�Trust�or�the�date�of�sale�of�property.���
M. Stafford�Loan��In� June,� 2017,� the� City� entered� into� an� agreement� with� HHDC� whereby� $1,577,750� from� the� City’s�Affordable�Housing�Fund�and�HOME�and�CDBG�grant�programs�were�loaned�to�assist�with�the�acquisition�of�real�property�located�at�1512�Stafford�Street�in�Redwood�City.�The�loan�is�deferred�for�a�term�of�55�years�at�3%�interest.��The�outstanding�balance�of�the�loan�at�June�30,�2017�was�$1,577,750�
54

City�of�Redwood�City�Notes�to�the�Basic�Financial�Statements�For�the�fiscal�year�ended�June�30,�2017
�
�
�
NOTE�4�–�CAPITAL�ASSETS��A. Summary�Capital�assets�at�June�30�are�comprised�of�the�following:��
Balance BalanceJune�30,�2016 Additions Retirements Transfers June�30,�2017
Government�activitiesCapital�assets�not�being�depreciated:��Land 31,397,153$���� �$��������������������� �$�������������������� �$���������������������� 31,397,153$�����Construction�in�progress,�Property 24,539,131������� 6,808,434������� ������������������������ (9,731,903)������� 21,615,662�����������Total�capital�assets�not�being�depreciated 55,936,284������� 6,808,434������� ������������������������ (9,731,903)������� 53,012,815������
Capital�assets�being�depreciated:��Buildings 83,309,015������� ������������������������������� ������������������������ �������������������������� 83,309,015��������Accumulated�depreciation (30,085,717)����� (1,660,212)������ ������������������������ �������������������������� (31,745,929)������Improvements�other�than�buildings 7,883,555���������� ������������������������������� ������������������������ 1,165,186��������� 9,048,741�����������Accumulated�depreciation (2,189,136)�������� (418,140)���������� ������������������������ �������������������������� (2,607,276)���������Parks 29,962,322������� ������������������������������� ������������������������ 6,493,142��������� 36,455,464��������Accumulated�depreciation (17,089,061)����� (1,051,892)������ ������������������������ �������������������������� (18,140,953)������Streets 114,666,789���� 1,088,120������� ������������������������ 1,117,593��������� 116,872,502�����Accumulated�depreciation (68,823,186)����� (4,073,743)������ ������������������������ �������������������������� (72,896,929)������Bridges 2,248,335���������� ������������������������������� ������������������������ �������������������������� 2,248,335�����������Accumulated�depreciation (1,974,940)�������� (74,945)������������� ������������������������ �������������������������� (2,049,885)���������Traffic�Signals 2,640,545���������� 455,198������������ ������������������������ �������������������������� 3,095,743�����������Accumulated�depreciation ��������������������������������� (83,156)������������� ������������������������ �������������������������� (2,278,349)���������Storm�Drains 12,189,946������� 229,909������������ ������������������������ �������������������������� 12,419,855��������Accumulated�depreciation (2,484,261)�������� (356,910)���������� ������������������������ �������������������������� (2,841,171)���������Machinery�&�Equipment 24,621,604 407,830 (357,979) 955,982 25,627,437��������Accumulated�depreciation (15,053,123) (1,632,130) 310,284 �������������������������� (16,374,969)����
��Net�capital�assets�being�depreciated 137,627,494 (7,170,071) (47,695) 9,731,903 140,141,631
Governmental�activity�capital�assets,�net� 193,563,778 (361,637) (47,695) �������������������������� 193,154,446
Business�Type�ActivitiesCapital�assets�not�being�depreciated:��Land 3,180,272 ������������������������� ������������������������ ���������������������������������� ����������3,180,272�
��Construction�in�progress 10,008,331 9,149,473 (299,866)���������� (4,741,846) �������14,116,092�
���Total�capital�assets�not�being�depreciated 13,188,603 9,149,473 (299,866)���������� (4,741,846) 17,296,364
Capital�assets�being�depreciated��Harbor�Improvements 4,773,955���������� ������������������������� ������������������������ �������������������������� ����������4,773,955�
����Accumulated�depreciation (3,174,880)�������� (121,465)���������� ������������������������ �������������������������� ��������(3,296,345)
��Buildings 62,466,683������� ������������������������� ������������������������ �������������������������� �������62,466,683�
����Accumulated�depreciation (14,392,501)����� (1,288,972)������ ������������������������ �������������������������� �����(15,681,473)
��Machinery�and�equipment 1,683,597���������� 46,319��������������� (20,724)������������� �������������������������� ����������1,709,192�
����Accumulated�depreciation (1,553,336)�������� (52,868)������������� 20,724�������������� �������������������������� ��������(1,585,480)
��Improvements�other�than�buildings 196,336,355���� 441,621������������ (3,569)���������������� 4,741,846��������� ����201,516,253�
����Accumulated�depreciation (59,255,179)����� (4,394,964)������ ������������������������ �������������������������� �����(63,650,143)
Net�capital�assets�being�depreciated 186,884,694 (5,370,329) (3,569) 4,741,846 186,252,642
Business�type�activity�capital�assets,net 200,073,297 3,779,144 (303,435.00)�� �������������������������� 203,549,006
55

City�of�Redwood�City�Notes�to�the�Basic�Financial�Statements�For�the�fiscal�year�ended�June�30,�2017
�
�
�NOTE�4�–�CAPITAL�ASSETS�(CONTINUED)��
B. Depreciation�Allocation��Depreciation�expense�was�charged�to�functions�and�programs�based�on�their�usage�of�the�related�assets.�The�amounts�allocated�to�each�function�or�program�is�as�follows:��Governmental�Activities��
Community�Development �$����������������197,513�Human�Services ����������������������85,175�
Public�Safety ����������������1,019,803�
Transportation ����������������4,012,081�
Leisure,�cultural,�and�information�services ����������������2,837,765�
Policy�development�and�implementation ��������������������807,483�
Environmental�support�and�protection ��������������������391,308�
Total�Depreciation�Expense�Governmental�Activities �$�������������9,351,128�
�������������������������������
�Business�Type�Activities�
�����������������������Water�Utility�Fund �$���������������������3,027,920�
Sewer�Utility�fund ����������������������������670,287�
Parking�Fund ����������������������������564,852�
Dock�Town ������������������������������32,258�
Port�of�Redwood�City ������������������������1,562,951�
Total�Depreciation�Expense�Business�Type��Activities �$���������������������5,858,268��
��
NOTE�5�–�INVESTMENT�IN�SILICON�VALLEY�CLEAN�WATER�AUTHORITY��Redwood� City� has� an� investment� of� $32,705,275� in� Silicon� Valley� Clean� Water� Authority� (SVCW),� a�California�joint�powers�authority�(JPA)�with�the�cities�of�San�Carlos,�Belmont,�and�the�West�Bay�Sanitation�District.� � � � In�addition,�it�has�an�additional�investment�of�$7,157,907,�in�SVCW�stage�II�construction.�The�City’s� investment� in�SVCW�was�adjusted�to�reflect�a�net� increase� in�the� investment�of�$153,114.� �Every�fiscal�year�the�City�adjusts�the�investment�based�on�the�City’s�proportion�of�financial�activity�at�SVCW.����SVCW�operates�and�maintains�a�sewer�plant,�which�was�jointly�constructed�with�federal�and�state�grants�and�contributions�from�participating�entities.�SVCW�is�run�by�its�board�of�directors,�which�is�comprised�of�four�members.�The�city�councils�of�each�member�city�and�the�board�of�the�West�Bay�Sanitation�District�each�select�one�of�their�own�members�to�serve�on�this�board.�No�member�agency�has�control�of�SVCW’s�budget,�finances,�or�operations.��The�board�acts�autonomously�of�the�respective�member�agencies.���
56

City�of�Redwood�City�Notes�to�the�Basic�Financial�Statements�For�the�fiscal�year�ended�June�30,�2017
�
�
�NOTE�5�–�INVESTMENT�IN�SILICON�VALLEY�CLEAN�WATER�AUTHORITY�(CONTINUED)��During�the�fiscal�year�ended�June�30,�2017,�the�City�contributed�$10,019,052�toward�the�cost�of�operating�and� maintaining� the� facility� and� paid� debt� principal� and� interest� of� $5,701,084� that� included� the� state�revolving� fund� loan�and� the� financing� agreements� to� finance� the�construction�and� rehabilitation�of� the�SVCW’s�wastewater�system.����At�June�30,�2017,�the�total�obligation�for�the�2009,�2014�and�2015�revenue�bonds�is�$130,890,000.��The�City’s� direct� obligation� is� $68,488,754.� � For� the� fiscal� year� 2017�18,� the� City� is� obligated� to� pay� debt�principal� and� interest� payments� totaling� $5,225,548.� � The� financing� agreements� for� these� bonds� are�secured� by� a� pledge� of� the� City’s� Sewer� Enterprise� Fund� Net� Revenue� as� defined� under� the� financing�agreements.� �For�the�fiscal�year�2016�17,�gross�Sewer�Fund�revenues,�including�operating�revenues�and�non�operating� interest� earnings,� amounted� to� $37,294,014.� � The� operating� and� maintenance� costs,�including�operating�expenses,�transfers�out�for�overhead�and�administrative�cost�but�excluding�interest,�and� depreciation� or� amortization� amounted� to� $26,523,079.� � Net� revenues� available� for� debt� services�amounted�to�$10,770,935,�which�represented�coverage�of�2.03�times�over�the�total�of�debt�services�of�$5,302,806.��In� October� 2015,� SVCW� issued� the� 2015� wastewater� revenue� bonds� in� the� amount� of� $70.2� million.��Pursuant� to� the� financing� agreement,� the� City’s� allocable� share� of� the� 2015� bonds� is� approximately�51.3%.� � Of� the� total� bond� proceeds,� $8.5� million� will� be� used� to� refund,� on� an� advance� basis,� certain�maturities� of� the� 2008� Bonds� and� approximately� $49.8� million� will� be� used� to� refund,� on� an� advance�crossover�basis,�certain�maturities�of�the�2009�Bonds.��Proceeds�associated�with� the�Refunded�2008�Bonds�have�been�deposited� into�the�“2008�Escrow�Fund”�for�principal�and�interest�payments�through�August�1,�2017,�when�the�remaining�proceeds�will�be�applied�to�pay�the�redemption�price�of�the�outstanding�Refunded�2008�Bonds�in�full.��As�result�of�the�deposit�and�the�application�of�funds�under�the�escrow�agreement�relating�to�the�Refunded�2008�Bonds,�the�Refunded�2008�bonds�are�considered�fully�defeased�upon�the�issuance�of�the�2015�bonds�and�are�no�longer�secured�by�revenues�that�were�originally�pledged�for�the�payment�of�the�2008�Bonds.��Proceeds�associated�with� the�Refunded�2009�Bonds�have�been�deposited� into�the�“2009�Escrow�Fund”�until� the� crossover� date� of� August� 1,� 2019,� when� all� of� the� outstanding� Refunded� 2009� Bonds� will� be�redeemed,�without�premium.��Prior�to�the�crossover�date,�the�Refunded�2009�Bonds�will�continue�to�be�secured� by� and� payable� from� the� revenues� that� were� originally� pledged� for� the� payment� of� the� 2009�Bonds.����Audited� financial� statements�are�available� from�Silicon�Valley�Clean�Water�Authority,�1400�Radio�Road,�Redwood�City,�CA�94065.���
�
57

City�of�Redwood�City�Notes�to�the�Basic�Financial�Statements�For�the�fiscal�year�ended�June�30,�2017
�
�
�NOTE�5�–�INVESTMENT�IN�SILICON�VALLEY�CLEAN�WATER�AUTHORITY�(CONTINUED)��The�condensed�unaudited�financial�information�of�the�JPA�as�of�June�30,�2017�is�as�follows:��
Total�Assets $�����������������304,774,427�
Deferred�Outflows�of�Resources ������������������������4,117,386�
Total�Liabilities �������������������225,860,283�
Deferred�Inflows�of�Resources ������������������������1,352,904�
Total�Net�Position $�������������������81,678,626�
Total�Operating�Revenues $�������������������38,333,303�
Total�Operating�Expenses ���������������������31,172,180�
Total�Operating�Income�(loss) ������������������������7,161,123�
Other�Income�(loss) �����������������������(4,646,384)
Net�Income�(loss) $���������������������2,514,739��
��������������������������������������
�������������������������������������
Cumulative�Agency�Balances:
Belmont 20,951,130$������������������San�Carlos �����������������������6,840,208�
Redwood�City ���������������������39,863,182�
West�Bay�Sanitation�District ���������������������14,024,106�
Total�Net�Position �$�����������������81,678,626��
��
NOTE�6�–�GOVERNMENTAL�ACTIVITIES�LONG�TERM�DEBT��
A. Description��
Redwood� City� has� no� outstanding� general� obligation� bonds.� The� following� is� the� only� long�term�obligation�of�the�City.�
�2013�Public�Financing�Authority�Refunding�lease�–�In�May�2013,�the�City�entered�into�a�lease�agreement�with� BBVA� Compass� Bank� in� the� amount� of� $3,360,000� to� refund� the� 2003� Public� Financing� Authority�Bonds.�Net�proceeds�of�$3,292,748�plus�the�2003�Public�Financing�Authority�Bond�Reserve�were�utilized�for�the�purpose�of�establishing�an�irrevocable�escrow�to�refund�$5,880,000�of�the�City’s�2003�Public�Financing�Authority�Bonds.�Principal�is�due�in�annual�installments�of�$347,486�to�$687,180,�with�total�principal�and�interest�remaining�on�the�lease�in�the�amount�of�$2,450,768�through�July�15,�2018.��Payments�are�made�from� the� Public� Financing� Authority� Refunding� Lease� Debt� Service� fund� out� � � of� lease� payment� revenue�received� from� the� general� fund,� requiring� less� than� 10%� of� net� revenues.� The� refunding� resulted� in� a�decrease� in�total�debt�service�payments�of�$347,302�and�an�economic�gain�of�$270,485.�
�
58

City�of�Redwood�City�Notes�to�the�Basic�Financial�Statements�For�the�fiscal�year�ended�June�30,�2017
�
�
�NOTE�6�–�GOVERNMENTAL�ACTIVITIES�LONG�TERM�DEBT�(CONTINUED)�
�B. Changes�in�Long�Term�Obligations�
�As�of�June�30,�2017,�the�City�had�the�following�long�term�obligations�outstanding:�
�Interest�
RateBeginning�Balance Additions Retirements
Ending�Balance
Due�within�One�year
Governmental�Activities: % $ $ $ $ $Revenue��Bonds2013�PFA�Refunding�Lease 1.51 1,711,586 676,920 1,034,666 687,180
Total�Bonds�and�Loans 1,711,586 676,920 1,034,666 687,180
Accrued�Sick�Leave�and�Vacation 11,066,600 922,640 432,796������� 11,556,444 446,269
Total�Governmental�Activities�Long�Term�Debt 12,778,186 922,640 1,109,716 12,591,110 1,133,449
��
At� year�end,� $1,011,176� of� internal� service� fund� compensated� absences� is� included� in� the� above�amounts.� For� the� governmental� activities,� compensated� absences� are� generally� liquidated� by� the�general�fund.�
�C. Annual�Repayment�Requirements�for�Long�Term�Debt�
�
Fiscal
Year�EndJune�30 Principle Interest
$ $
2018 687,180 13,039
2019 347,486 2,624
1,034,666 15,663
Refunding�Lease
���
NOTE�7�–�BUSINESS�TYPE�ACTIVITIES�LONG�TERM�DEBT��
A. Description��
Revenue�Bonds:��
Port��of��Redwood��City��2012��Revenue��Bonds��–��In��June��2012,��bonds�were�issued�in�the�amount�of�$10,000,000�to�finance�construction�of�the�Port’s�Wharf�1�&�2�Redevelopment�Project.�The�bonds�are�due�in�annual�installments�of�$386,916�to�$725,679�through�2032,�with�total�principal�and�interest�remaining�of�$11,134,407.�The�bonds�are�payable�out�of�net�revenues�of�the�Port,�which�are�expected�to�equal�at�least�120%�of�the�annual�debt�service�requirement.�
�
59
City�of�Redwood�City�Notes�to�the�Basic�Financial�Statements�For�the�fiscal�year�ended�June�30,�2017
�
�
�NOTE�7�–�BUSINESS�TYPE�ACTIVITIES�LONG�TERM�DEBT�(CONTINUED)�
�Port��of��Redwood��City��2015��Revenue��Bonds��–��In��June��2015,��bonds�were�issued�in�the�amount�of�$6,940,000� to� (a)� refund� the� 1999� Bonds,� (b)� purchase� the� 2016� Reserve� Fund� Policy� in� lieu� of� cash�funding� a� reserve� fund� for� the� 2016� Bonds,� and� (c)� pay� a� portion� of� the� costs� of� issuance� of� the� 2016�Bonds.� The� bonds� are� due� in� annual� installments� of� $385,000� to� $611,000� through� 2030,� with� total�principal�and� interest� remaining�of�$7,845,983.�The�bonds�are�payable�out�of�net� revenues�of� the�Port,�which�are�expected�to�equal�at�least�120%�of�the�annual�debt�service�requirement.�
�Water�Revenue�Bonds�Series�2007A�–�In�February�2007,�Redwood�City�Public�Financing�Authority�issued�$15,150,000�of�bonds�to�finance�a�portion�of�the�City’s�recycled�water�project.�Principal�and�interest�was�payable� in� 28� annual� installments� of� $728,072� to� $950,950� from� August� 2007� through� February� 2035.�During�the�year,�these�were�refunded�with�the�issuance�of�Series�2017�bonds.�
Water� Revenue� Bonds� Series� 2013� –� In� June� 2013,� Redwood� City� Public� Financing� Authority� issued�$26,870,000� of� bonds� to� refund� the� remaining� Water� Revenue� Bonds� Series� 2005A.� The� refunding�resulted��in��a��decrease��of��total� �debt��service��payments��of��$2,386,569��and��an��economic��gain��of�$1,231,113.��Principal�and�interest�is�payable�in�21�annual�installments�of�$1,584,262�to�$2,063,000���from�August� 2013� through� February� 2034,� with� total� principal� and� interest� remaining� of� $35,032,912.� The�bonds�are�payable�out�of�net�revenues�of�the�water�utility�fund�which�are�expected�to�equal�at�least�120%�of�the�annual�debt�service�requirement.�
�Water� Revenue� Bonds� Series� 2015� –� In� May� 2015,� Redwood� City� Public� Financing� Authority� issued�$20,235,000� of� bonds� to� refund� the� remaining� Water� Revenue� Bonds� Series� 2006A.� The� refunding�resulted��in��a��decrease��of��total� �debt��service��payments��of��$3,243,691��and��an��economic��gain��of�$2,117,710.��Principal�and�interest�is�payable�in�20�annual�installments�of�$1,205,491�to�$1,421,544�from�August�2016�through�February�2035�with�total�principal�and�interest�remaining�of�$25,558,981.�The�bonds�are�payable�out�of�net�revenues�of�the�water�utility�fund�which�are�expected�to�equal�at�least�120%�of�the�annual�debt�service�requirement.��Water�Revenue�Bonds�Series�2017�–� In�February,�2017,�Redwood�City�Public�Financing�Authority�issued�$6,300,000� of� bonds� to� refund� the� outstanding� Water� Revenue� Bonds� Series� 2007A.� The� refunding�resulted��in��a��decrease��of��total� �debt��service��payments��of��$8,191,968��and��an��economic��gain��of�$1,169,839.� � Principal� and� interest� is� payable� in� 18� annual� installments� of� 493,588� to� $496,800� from�February� 2018� through� February� 2035� with� total� principal� and� interest� remaining� of� $8,877,694.� The�bonds�are�payable�out�of�net�revenues�of�the�water�utility�fund�which�are�expected�to�equal�at�least�120%�of�the�annual�debt�service�requirement.�
�Pledges�of�Future�Revenues�–�The�pledge�of�future�water�utility�fund�revenues�ends�upon�repayment�of�the�$69.5�million�in�remaining�debt�service�on�the�bonds�which�is�scheduled�to�occur�in�fiscal�year�2035�36.�For�fiscal�year�2016�17,�water�utility�fund�operating�revenues�amounted�to�$36,744,157�and�operating�expenses�excluding�depreciation�and�amortizations�amounted�to�$31,415,115.�Net�revenues�available�for�debt�service�amounted�to�$5,329,042�which�represented�a�coverage�ratio�of�1.34�over�the�$3,974,194�in�debt�service.�
�
60

City�of�Redwood�City�Notes�to�the�Basic�Financial�Statements�For�the�fiscal�year�ended�June�30,�2017
�
�
�
NOTE�7�–�BUSINESS�TYPE�ACTIVITIES�LONG�TERM�DEBT�(CONTINUED)��
The� pledge�of� future�Port�of�Redwood�City� fund� revenues�ends� upon� repayment�of� the�$19�million� in�remaining�debt�service�on�the�bonds�which�is�scheduled�to�occur�in�fiscal�year�2031�32.��Port�of�Redwood�City� fund�operating�revenues�amounted�to�$7,127,814�and�operating�expenses�excluding�depreciation,�amortizations,� and� subvention� to� the� City� amounted� to� $3,106,577.� Net� revenues� available� for� debt�service�amounted�to�$4,021,237�which�represented�a�coverage�ratio�of�2.98�over�the�$1,349,331�in�debt�service.�
�B. Changes�in�Debt�
�Interest Within
Rate Additions Retirements One�YearBusiness�type�Activities: %
Revenue�BondsPort�of�Redwood�City�2012�Series 4.20�4.20 8,637,370$����� �$���������������� 386,916$������������� 8,250,454$���������� 403,483$������Port�of�Redwood�City�2015�Series 2.00�4.00 6,575,000������� ������������������ 385,000���������������� 6,190,000������������ 395,000�������Water�Revenue�Bonds�Series�2007A 4.00�4.50 12,060,000���� ������������������ 12,060,000��������� ������������������������ �����������������Water�Revenue�Refunding�Bonds�Series�2013 3.00�5.00 24,305,000���� ������������������ 920,000���������������� 23,385,000���������� 955,000�������Water�Revenue�Refunding�Bonds�Series�2015 3.00�4.00 19,525,000���� ������������������ 735,000���������������� 18,790,000���������� 755,000�������Water�Revenue�Refunding�Bonds�Series�2017 2.00�5.00 �������������������� 6,300,000����� ������������������������� 6,300,000������������ 265,000�������
Unamortized�Premium�Water 3,732,452������� 477,557��������� 216,499���������������� 3,993,510������������ �����������������Unamortized�Discount�Port (20,873)����������� ������������������ (1,500)������������������� (19,373)���������������� �����������������
74,813,949������ 6,777,557������� 14,701,915����������� 66,889,591���������� 2,773,483������
Accrued�Sick�Leave�and�Vacation: 885,914���������� 459,639��������� 430,060���������������� 915,493��������������� 451,939�������
Total�Business�type�Activities�Long�Term�Debt 75,699,863$��� 7,237,196$���� 15,131,975$�������� 67,805,084$�������� 3,225,422$���
Beginning�Balance Ending�Balance
����
C. Annual�Repayment�Requirements�for�Business�type�Activities�Long�Term� Debt���
�����
Business�Type�Activities:
Year�EndJune�30 Principal Interest
$ $2018 2,773,483������������������������� 2,549,043������������2019 2,825,759������������������������� 2,486,485������������2020 2,938,775������������������������� 2,378,768������������2021 3,057,563������������������������� 2,264,131������������2022 3,177,155������������������������� 2,144,889������������
2023�2027 18,025,303���������������������� 8,598,722������������2028�2032 20,927,416���������������������� 4,438,828������������2033�2036 9,190,000������������������������� 673,656�����������������
62,915,454���������������������� 25,534,521���������
Revenue�Bonds
61

City�of�Redwood�City�Notes�to�the�Basic�Financial�Statements�For�the�fiscal�year�ended�June�30,�2017
�
�
�
NOTE�8�–�DEBT�WITHOUT�CITY�COMMITMENT��
A. Successor�Agency�Private�Purpose�Trust�Fund�Debt��
Tax�Increment�Bonds:�2003�Tax�Allocation�Bonds�–�In�October�2003,�the�former�Redevelopment�Agency�issued�$33,997,448�in�bonds� to� finance� various� downtown� improvements.� These� bonds� consist� of� current� coupon� bonds� and�capital� appreciation� bonds.� The� current� coupon� bonds� pay� interest�only� through� January� 15,� 2010.�Principal�on� the�current�coupon�bonds� is�paid� in�annual� installments�of�$1,225,000� to�$3,045,000� from�July� 15,� 2010� to� July� 15,� 2014.� Payments� reflecting� interest� and� principal� on� the� capital� appreciation�bonds� are� due� in� annual� installments� of� $3,505,000� to� $3,510,000� from� July� 15,� 2016� through� July� 15,�2032.� � Total� principal� and� interest� remaining� on� the� bonds� is� $56,090,000.� � Payments� are� made� from�property�tax�increment�generated�by�the�former�redevelopment�agency�fund.�
�B. Community�Facilities�District�(Mello�Roos)�Bonds�
�On�October�17,�2000,� the�Community�Facilities�District� (CFD)� issued�$21,000,000�of�bonds�on�behalf�of�the�developer�of� the�Pacific�Shores�Project� to� fund�various�transportation�system�improvements�within�the�City's�right�of�way�that�were�required�as�a�condition�of�the�development.��In�July�2012�the�CFD�issued�$5,555,000�Community�Facilities�District�No.�2000�1�Pacific�Shores�Special�Tax�Refunding�Bonds,� Series�2012� to� refund� $8,655,000�of� the�Series�2000A�bonds.�The� refunding� reduced�annual� debt� service� payments� by� approximately� 25%� or� $52,000,� and� resulted� in� an� economic� gain� of�$398,000,�which�equates�to�7.61%�of� the�refunding�bonds.� � In�September�2016,� the�final�payment�was�made�and�this�obligation�was�paid�in�full.��On�January�17,�2001,�the�Shores�Transportation�Improvement�District�issued�$5,045,000�of�Phase�I�CFD�bonds,�and�on�September�3,�2003�the�District�issued�$7,505,000�of�Phase�II�CFD�bonds.�The�proceeds�of�these� bonds� were� used� to� fund� various� transportation� projects� that� are� required� under� development�agreements�with�commercial�property�owners�in�the�Redwood�Shores�area�of�the�City.�
�In�December�2012�the�Shores�Transportation�District� issued�$10,275,000�Redwood�Shores�Community�Facilities� District� No.� 99�1� Special� Tax� Refunding� Bonds,� Series� 2012B� to� refund� $3,640,000� of� the�outstanding�Series�2001A�Bonds�and�$6,675,000�of�the�outstanding�Series�2003A�Bonds.�The�refunding�reduced�annual�debt�service�payments�by�approximately�16%�or�$140,000,�and�resulted�in�an�economic�gain�of�$1.7�million,�which�equates�to�16.62%�of�the�refunding�bonds.�
�These�bonds�are�solely�obligations�of�the�property�owners�in�this�district�and�are�not�obligations�of�the�City,�nor�has�any�political� subdivision�of� the�State�of�California�pledged� its� full� faith�and�credit� for� the�payment� of� these� bonds.� The� City’s� only� responsibilities� with� respect� to� any� delinquent� assessment�installments�are�solely�advancing�funds�from�the�reserve�fund�(established�with�bond�proceeds)�to�the�redemption�fund,�to�the�extent�that�such�funds�are�available,�and�instituting�foreclosure�proceedings.�
�The�City�is�not�required�to�advance�available�funds�of�the�City�for�payment�of�principal�or�interest�or�to�purchase� land� at� a� delinquent� foreclosure� assessment� sale.� As� of� June� 30,� 2017,� the� outstanding�principal�amount�was�$8,595,000.����
62

City�of�Redwood�City�Notes�to�the�Basic�Financial�Statements�For�the�fiscal�year�ended�June�30,�2017
�
�
�NOTE�8�–�DEBT�WITHOUT�CITY�COMMITMENT�(CONTINUED)��On� April� 5,� 2011,� the� Community� Facilities� District� (CFD)� issued� $5,760,000� of� bonds� on� behalf� of� the�developer� of� the� One� Marina� Project� to� fund� various� transportation� system� improvements� within� the�City's�right�of�way�that�were�required�as�a�condition�of�the�development.��These�bonds�are�solely�obligations�of�the�property�owners�in�this�district�and�are�not�obligations�of�the�City,�nor�has�any�political� subdivision�of� the�State�of�California�pledged� its� full� faith�and�credit� for� the�payment� of� these� bonds.� The� City’s� only� responsibilities� with� respect� to� any� delinquent� assessment�installments�are�solely�advancing�funds�from�the�reserve�fund�(established�with�bond�proceeds)�to�the�redemption�fund,�to�the�extent�that�such�funds�are�available,�and�instituting�foreclosure�proceedings.��In� June�2016,�Community�Facilities�District�No.�2010�1� issued�$4,350,000�Community�Facilities�District�No.�2010�1�(One�Marina)�2016�Special�Tax�Refunding�Bonds�to�refund�the�outstanding�2011�Bonds.��The�City�is�not�required�to�advance�available�funds�of�the�City�for�payment�of�principal�or�interest�or�to�purchase� land� at� a� delinquent� foreclosure� assessment� sale.� As� of� June� 30,� 2017,� the� outstanding�principal�amount�was�$4,350,000.���NOTE�9�–�EMPLOYEE�BENEFITS�
�
A. Pension�Plan��
General�Information�about�the�Pension�Plan:�Plan�Description�–�All�qualified�permanent�and�probationary�employees�are�eligible�to�participate� in� the�City’s� separate� Safety� (police� and� fire)� and� Miscellaneous� (all� other)� Plans,� � agent� � multiple�employer��defined� benefit� pension� plans� administered� by� the� California� Public� Employees’� Retirement� System�(CalPERS),� which� acts� as� a� common� investment� and� administrative� agent� for� its� participating� member�employers.� Benefit� provisions� under� the� Plans� are� established� by� State� statute� and� Local� Government�resolution.� CalPERS� issues� publicly� available� reports� that� include� a� full� description� of� the� pension� plans�regarding�benefit�provisions,�assumptions,�and�membership�information�that�can�be�found�on�the�CalPERS�website.�
�Benefits� Provided� –� CalPERS� provides� service� retirement� and� disability� benefits,� annual� cost� of� living�adjustments� and� death� benefits� to� plan� members,� who� must� be� public� employees� and/or� their�beneficiaries.�Benefits�are�based�on�years�of�credited�service,�equal�to�one�year�of�full�time�employment.�Members�with�five�years�of�total�service�are�eligible�to�retire�at�age�50�with�statutorily�reduced�benefits.��All�members�are�eligible�for�non�duty�disability�benefits�after�10�years�of�service.�The�death�benefit�is�one�of�the�following:�the�Basic�Death�Benefit,�the�1957�Survivor�Benefit,�or�the�Optional�Settlement�2W�Death�Benefit.� The� cost� of� living� adjustments� for� each� plan� are� applied� as� specified� by� the� Public� Employees’�Retirement�Law�(PERL).�
63

City�of�Redwood�City�Notes�to�the�Basic�Financial�Statements�For�the�fiscal�year�ended�June�30,�2017
�
�
�
NOTE�9�–�EMPLOYEE�BENEFITS�(CONTINUED)��The�plans’�provisions�and�benefits�in�effect�at�June�30,�2017�are�summarized�as�follows:���
Public�Safety�Tier�1 Public�Safety�Tier�2 Public�Safety�Tier�3Benefit�Vesting�Schedule 5�years�of�service 5�years�of�service 5�years�of�serviceBenefit�payments Monthly�for�life Monthly�for�life Monthly�for�lifeRetirement�age 50 50 50Benefit�factor�for�each�year�of�serviceas�a�%�of�annual�salary 3% 2.4%�3% 2%�2.7%Required�employee�contribution�rates 9% 9% 12%Required�employer�contribution�rates 22.033% 22.033% 22.033%
Miscellaneous�Tier�1 Miscellaneous�Tier�2 Miscellaneous�Tier�3Benefit�Vesting�Schedule 5�years�of�service 5�years�of�service 5�years�of�serviceBenefit�payments Monthly�for�life Monthly�for�life Monthly�for�lifeRetirement�age 50 50 52Benefit�factor�for�each�year�of�serviceas�a�%�of�annual�salary 2%�2.7% 1.092%�2.418% 1%�2.5%Required�employee�contribution�rates 8% 7% 5.75%Required�employer�contribution�rates 9.274% 9.274% 9.274%
Beginning�in�fiscal�year�2016,�CalPERS�collects�employer�contributions�for�the�Plan�as�a�percentage�of�payroll�for�the�normal�cost�portion�as�noted�in�the�rates�above�and�as�a�dollar�amount�for�contributions�toward� the� unfunded� liability.� The� dollar� amounts� are� billed� on� a� monthly� basis.� The� City’s� required�contribution�for�the�unfunded�liability�was�$5,603,992�and�$5,225,128�for�the�safety�and�miscellaneous�plans�respectively�in�fiscal�year�2017.�
The�City’s�Tier�2�plans�for�public�safety�and�miscellaneous�cover�new�employees�hired�on�or�after�October�13,�2011.�
�The�City’s�Tier�3�plans�for�public�safety�and�miscellaneous�cover�new�employees�hired�on�or�after�January�1,�2013�pursuant�to�the�Public�Employees’�Pension�Reform�Act�of�2013.�
�Police�and�fire�safety�employees�hired�before�October�13,�2011�(Tier�1)�are�covered�under�the�"3%�at�50"�formula.� Under� this� retirement� plan,� an� employee's� retirement� earnings� at� age� 50� are� calculated� by�multiplying�3%� by� the�employee's�years� of� service.�This�percentage� factor� increases�with� the�employee's�age�upon�retirement.�
�Police�and�fire�safety�employees�hired�on�or�after�October�13,�2011�(Tier�2)�are�covered�under�the�“3%�at�55”�formula.�Under�this�retirement�plan,�an�employee’s�retirement�earnings�at�age�55�are�calculated�by�multiplying�3%�by�the�employee’s�years�of�service.�An�employee�with�five�years�of�service�is�eligible�to�retire� at� age� 50� at� a� reduced� pension� amount.� The� pension� amount� increases� with� age� and� length� of�service,�with�the�maximum�percentage�factor�equal�to�3%.�
�Police�and�fire�safety�employees�hired�on�or�after�January�1,�2013�(Tier�3)�are�covered�under�the�“2.7%�at�57”�formula.�Under�this�retirement�plan,�an�employee’s�retirement�earnings�at�age�57�are�calculated�by� multiplying� 2.7%� by� the� employee’s� years� of� service.� � An� employee� with� five� years� of� service� is�eligible�to�retire�at�age�50�at�a�reduced�pension�amount.�The�pension�amount� increases�with�age�and�length�of�service,�with�a�maximum�percentage�factor�equal�to�2.7%�at�age�57.�
64

City�of�Redwood�City�Notes�to�the�Basic�Financial�Statements�For�the�fiscal�year�ended�June�30,�2017
�
�
�NOTE�9�–�EMPLOYEE�BENEFITS�(CONTINUED)��Miscellaneous� employees� hired� before� October� 13,� 2011� (Tier� 1)� are� covered� under� the� "2.7%� at� 55"�formula.��Under�this�retirement�plan,�an�employee's�retirement�earnings,�at�age�55,�are�calculated�by�multiplying�2.7%�by�the�employee's�years�of�service.�An�employee�with�five�years�of�service�is�eligible�to�retire� at� age� 50� at� a� reduced� pension� amount.� The� pension� amount� increases� with� age� and� length� of�service.�
�Miscellaneous�employees�hired�on�or�after�October�13,�2011�(Tier�2)�are�covered�under�the�“2%�at�60”�formula.� Under� this� retirement� plan,� an� employee’s� retirement� earnings� at� age� 60� are� calculated� by�multiplying�2%�by�the�employee’s�years�of�service.�An�employee�with�five�years�of�service�is�eligible�to�retire� at� age� 50� at� a� reduced� pension� amount.� The� pension� amount� increases� with� age� and� length� of�service.�
�Miscellaneous�employees�hired�on�or�after� January� 1,�2013� (Tier�3)�are�covered�under� the�“2%�at�62”�formula.� Under� this� retirement� plan,� an� employee’s� retirement� earnings� at� age� 62� are� calculated� by�multiplying�2%�by�the�employee’s�years�of�service.�An�employee�with�five�years�of�service�is�eligible�to�retire� at� age� 52� at� a� reduced� pension� amount.� The� pension� amount� increases� with� age� and� length� of�service,�with�a�maximum�percentage�factor�equal�to�2.5%�at�age�67.�
�Employees�Covered�–�At�June�30,�2017,�the�following�employees�were�covered�by�the�benefit�terms�for�each�Plan:��
Miscellaneous SafetyInactive�employees�or�beneficiaries�currently�receiving�benefits 398 174Inactive�employees�entitled�to�but�not�yet�receiving�benefits 457 60Active�employees 512 339
Total ��������������������������1,367� 573�
�
Contributions�–�Section�20814(C)�of�the�California�PERL�requires�that�the�employer�contribution�rates�for�all�public�employers�be�determined�on�an�annual�basis�by�the�actuary�and�shall�be�effective�on�the�July�1�following� notice� of� a� change� in� the� rate.� The� total� plan� contributions� are� determined� through� CalPERS’�annual�actuarial�valuation�process.�The�actuarially�determined�rate�is� the�estimated�amount�necessary�to�finance�the�costs�of�benefits�earned�by�employees�during�the�year,�with�additional�amount�to�finance�any�unfunded�accrued�liability.�The�employer�is�required�to�contribute�the�difference�between�the�actuarially�determined� rate� and� the� contribution� rate� of� employees.� For� the� measurement� period� ended� June� 30,�2016�(the�measurement�date),�the�average�active�employee�contribution�rate�is�7.83�percent�of�annual�pay�for�the�Miscellaneous�Plan�and�9.04�percent�of�annual�pay�for�the�Safety�Plan,�and�employer�contribution�rate�is�9.27�percent�of�annual�payroll�for�the�Miscellaneous�Plan�and�22.03�percent�of�annual�payroll�for�the�Safety�Plan.�
�Net�Pension�Liability:�The�City’s�net�pension�liability�for�each�Plan�is�measured�as�the�total�pension�liability,� less�the�pension�plan’s� fiduciary� net� position.� The� net� pension� liability� of� each� of� the� Plans� is� measured� as� of� June� 30,�2016,� using� an� annual� actuarial� valuation� as� of� June� 30,� 2015� rolled� forward� to� June� 30,� 2016� using�standard�update�procedures.�A�summary�of�principal�assumptions�and�methods�used�to�determine�the�net�pension�liability�is�shown�below.�
�65

City�of�Redwood�City�Notes�to�the�Basic�Financial�Statements�For�the�fiscal�year�ended�June�30,�2017
�
��
�
NOTE�9�–�EMPLOYEE�BENEFITS�(CONTINUED)��
Actuarial� Assumptions� –� The� total� pension� liabilities� in� the� June� 30,� 2015� actuarial� valuation� were�determined�using�the�following�assumptions:��
Miscellaneous SafetyValuation�Date June�30,�2015 June�30,�2015Measurement�Date June�30,�2016 June�30,�2016Actuarial�Cost�MethodActuarial�Assumptions:�
Discount�Rate 7.65% 7.65%Inflation 2.75% 2.75%Salary�IncreasesInvestment�Rate�of�Return 7.50% 7.50%
Mortality�(1)
Post�Retirement�Benefit�Increase
Entry�Age�Normal�Cost�Method
Varies�by�Entry�Age�and�Service�
Derived�using�CalPERS'�Membership�Data�for�all�Funds
Contract�COLA�up�to�2.75%�until�Purchasing�Power�Protection�Allowance�Floor�on�Purchasing�Power�applies,�2.75%�thereafter
(1)�The�mortality�table�used�was�developed�based�on�CalPERS'�specific�data.�The�table�includes�20�years�of�mortality�improvements�using�Society�of�Actuaries�Scale�BB.
��The� underlying� mortality� assumptions� and� all� other� actuarial� assumptions� used� in� the� June� 30,� 2015�valuation�were�based�on�the�results�of�a�January�2014�actuarial�experience�study�for�the�period�1997�to�2011.��Further�details�of�the�Experience�Study�can�be�found�on�the�CalPERS�website.�
�
Discount�Rate�–�The�discount�rate�used�to�measure�the�total�pension�liability�was�7.65%�for�each�Plan.����To�determine�whether�the�municipal�bond�rate�should�be�used�in�the�calculation�of�a�discount�rate�for�each� plan,� CalPERS� stress� tested� plans� that� would� most� likely� result� in� a� discount� rate� that� would� be�different�from�the�actuarially�assumed�discount�rate.�Based�on�the�testing,�none�of�the�tested�plans�run�out�of�assets.�Therefore,�the�current�7.65%�discount�rate�is�adequate�and�the�use�of�the�municipal�bond�rate�calculation� is�not�necessary.�The� long�term�expected�discount� rate�of�7.65%�will�be�applied�to�all�plans�in�the�Public�Employees�Retirement�Fund.�The�stress�test�results�are�presented�in�a�detailed�report�that�can�be�obtained�from�the�CalPERS�website.�
�
The� long�term� expected� rate� of� return� on� pension� plan� investments� was� determined� using� a� building��block�method� in�which�best�estimate�ranges�of�expected�future�real� rates�of�return�(expected�returns,�net�of�pension�plan�investment�expense�and�inflation)�are�developed�for�each�major�asset�class.�
�In� determining� the� long�term� expected� rate� of� return,�CalPERS� took� into�account�both� short�term�and�long�term�market�return�expectations�as�well�as�the�expected�pension�fund�cash�flows.�Using�historical�returns�of�all�the�funds’�asset�classes,�expected�compound�returns�were�calculated�over�the�short�term�(first� 10� years)� and� the� long�term� (11�60� years)� using� a� building�block� approach.� Using� the� expected�nominal�returns�for�both�short�term�and�long�term,�the�present�value�of�benefits�was�calculated�for�each�fund.� The� expected� rate� of� return� was� set� by� calculating� the� single� equivalent� expected� return� that�arrives�at�the�same�present�value�of�benefits�for�cash�flows�as�the�one�calculated�using�both�short�term�and�long�term�returns.�The�expected�rate�of�return�was�then�set�equivalent�to�the�single�equivalent�rate�calculated�above�and�rounded�down�to�the�nearest�one�quarter�of�one�percent.�
66

City�of�Redwood�City�Notes�to�the�Basic�Financial�Statements�For�the�fiscal�year�ended�June�30,�2017
�
��
�
NOTE�9�–�EMPLOYEE�BENEFITS�(CONTINUED)��
The�table�below�reflects� the� long�term�expected�real� rate�of� return�by�asset�class.� �The�rate�of� return�was�calculated�using�the�capital�market�assumptions�applied�to�determine�the�discount�rate�and�asset�allocation.��These�rates�of�return�are�net�of�administrative�expenses.��
NewStrategic Real�Return Real�Return
Asset�Class� Allocation Years�1���10(a) Years�11+(b)
Global�Equity 51.00% 5.25% 5.71%Global�Fixed�Income 20.00% 0.99% 2.43%Inflation�Sensitive 6.00% 0.45% 3.36%Private�Equity 10.00% 6.83% 6.95%Real�Estate 10.00% 4.50% 5.13%Infrastructure�and�Forestland 2.00% 4.50% 5.09%Liquidity 1.00% �0.55% �1.05%
Total 100%
(a)�An�expected�inflation�of�2.5%�used�for�this�period.(b)�An�expected�inflation�of�3.0%�used�for�this�period. �
��
Changes�in�the�Net�Pension�Liability:��
The�changes�in�the�Net�Pension�Liability�for�each�Plan�follow:��
Miscellaneous�Plan:
Total�Pension Plan�Fiduciary Net�PensionLiability Net�Position Liability/(Asset)
Balance�at�June�30,�2016�(1) $�������������274,601,243� $��������������198,433,873� �$��������������76,167,370�Changes�in�the�year:Service�cost ��������������������4,988,704� �������������������4,988,704�
Interest�on�the�total�pension�liability ������������������20,902,896� �����������������20,902,896�Differences�between�actual�and�expected�experience ��������������������2,720,291� �������������������2,720,291�Plan�to�Plan�Resource�Movement ����������������������������8,562� ��������������������������(8,562)Contribution���employer ���������������������7,063,347� ������������������(7,063,347)Contribution���employee ���������������������2,605,290� ������������������(2,605,290)
Net�investment�income ���������������������1,020,359� ������������������(1,020,359)
Administrative�expenses �����������������������(120,935) �����������������������120,935�Benefit�payments�,�including�refunds�of�employee�contributions ����������������(13,150,802) �����������������(13,150,802)Net�changes ������������������15,461,089� ��������������������(2,574,179) �����������������18,035,268�
Balance�at�June�30,�2017 $�������������290,062,332� $��������������195,859,694� �$��������������94,202,638�
Increase�(Decrease)
67
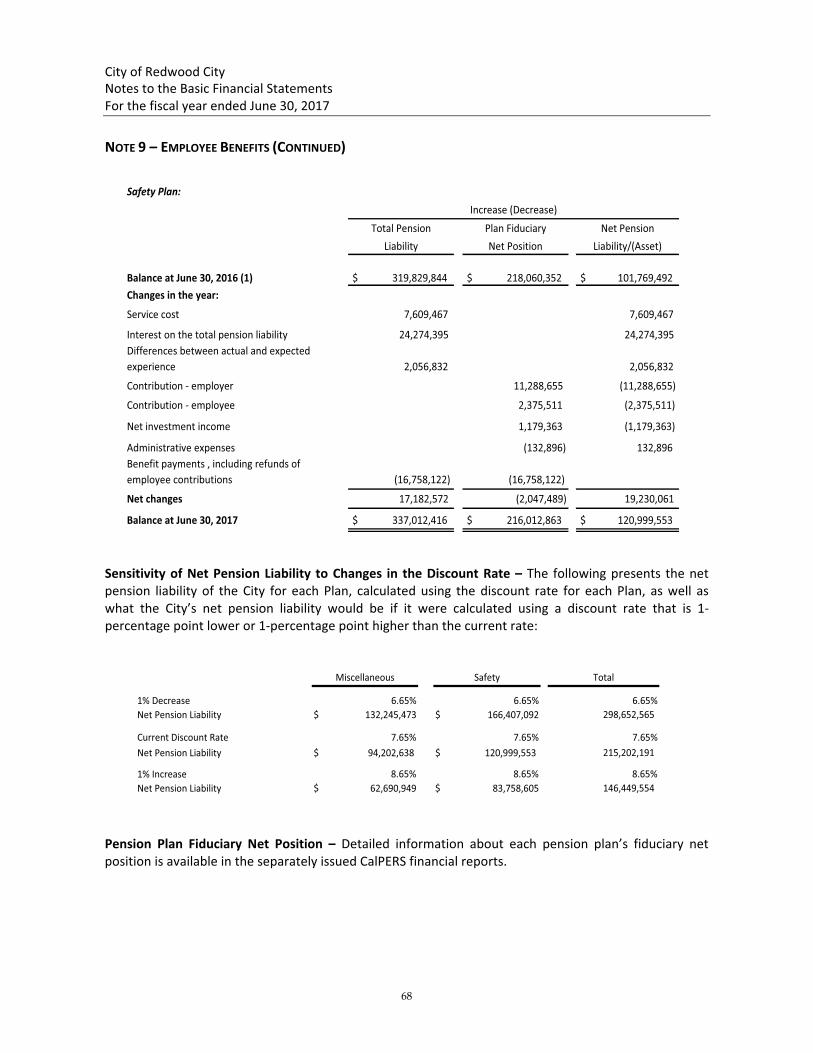
City�of�Redwood�City�Notes�to�the�Basic�Financial�Statements�For�the�fiscal�year�ended�June�30,�2017
�
��
�NOTE�9�–�EMPLOYEE�BENEFITS�(CONTINUED)�
�Safety�Plan:
Total�Pension Plan�Fiduciary Net�PensionLiability Net�Position Liability/(Asset)
Balance�at�June�30,�2016�(1) $��������������319,829,844� $��������������218,060,352� �$�������������101,769,492�Changes�in�the�year:
Service�cost ����������������������7,609,467� ���������������������7,609,467�
Interest�on�the�total�pension�liability ��������������������24,274,395� �������������������24,274,395�Differences�between�actual�and�expected�experience ����������������������2,056,832� ���������������������2,056,832�
Contribution���employer ��������������������11,288,655� �����������������(11,288,655)
Contribution���employee ����������������������2,375,511� �������������������(2,375,511)
Net�investment�income ����������������������1,179,363� �������������������(1,179,363)
Administrative�expenses ������������������������(132,896) ������������������������132,896�Benefit�payments�,�including�refunds�of�employee�contributions ������������������(16,758,122) ������������������(16,758,122)
Net�changes ��������������������17,182,572� ���������������������(2,047,489) �������������������19,230,061�
Balance�at�June�30,�2017 $��������������337,012,416� $��������������216,012,863� �$�������������120,999,553�
Increase�(Decrease)
��Sensitivity�of�Net�Pension�Liability� to�Changes� in� the�Discount� Rate�–� The� following�presents� the�net�pension� liability� of� the� City� for� each� Plan,� calculated� using� the� discount� rate� for� each� Plan,� as� well� as�what� the� City’s� net� pension� liability� would� be� if� it� were� calculated� using� a� discount� rate� that� is� 1��percentage�point�lower�or�1�percentage�point�higher�than�the�current�rate:��
�
1%�Decrease 6.65% 6.65% 6.65%Net�Pension�Liability $ ��������������132,245,473� $ ���������������166,407,092� 298,652,565������������������
Current�Discount�Rate 7.65% 7.65% 7.65%Net�Pension�Liability $ �������������94,202,638� $ �����������120,999,553� 215,202,191������������������
1%�Increase 8.65% 8.65% 8.65%Net�Pension�Liability $ ������������������62,690,949� $ �����������������83,758,605� 146,449,554������������������
Miscellaneous Safety Total
��Pension� Plan� Fiduciary� Net� Position� –� Detailed� information� about� each� pension� plan’s� fiduciary� net�position�is�available�in�the�separately�issued�CalPERS�financial�reports.��
68

City�of�Redwood�City�Notes�to�the�Basic�Financial�Statements�For�the�fiscal�year�ended�June�30,�2017
�
��
�
NOTE�9�–�EMPLOYEE�BENEFITS�(CONTINUED)��
Pension�Expenses�and�Deferred�Outflows/Inflows�of�Resources�Related�to�Pensions:��For� the� fiscal� year� ended� June� 30,� 2017,� the� City� recognized� pension� expense� of� $8,864,628� for� the�Miscellaneous� Plan� and� $13,755,299� for� the� Safety� Plan.� At� June� 30,� 2017,� the� City� reported� deferred�outflows�of�resources�and�deferred�inflows�of�resources�related�to�pensions�from�the�following�sources:�
�Deferred�Outflows�of�
ResourcesDeferred�Inflows�of�
ResourcesPension�contributions�subsequent�to�measurement�date �$�������������������17,721,552�Changes�of�Assumptions ��������������������3,937,518�Differences�between�Expected�and�Actual�Experiences �������������������������3,328,061� ������������������������141,618�Net�differences�between�projected�and�actual�earnings�on�plan�investments ����������������������21,940,552�
Total 42,990,165$������������������ 4,079,136$�������������������
�$17,721,552� reported� as� deferred� outflows� of� resources� related� to� contributions� subsequent� to� the�measurement�date�will�be�recognized�as�a�reduction�of�the�net�pension�liability�in�the�fiscal�year�ended�June� 30,� 2018.� Other� amounts� reported� as� deferred� outflows� of� resources� and� deferred� inflows� of�resources�related�to�pensions�will�be�recognized�as�pension�expenses�as�follows:��
��������������������������������������������������������������
Fiscal�Year�EndingJune�30:
2018 �$��������������������1,649,511�
2019 �����������������������3,020,849�
2020 ���������������������10,663,904�
2021 �����������������������5,855,213� ��
Payable�to�Pension�Plan:��As�of�June�30,�2017,�the�City�reported�a�payable�of�$0�for�the�outstanding�amount�of�contributions�to�the�pension�plan�required�for�the�fiscal�year�ended�June�30,�2017.�
���
69
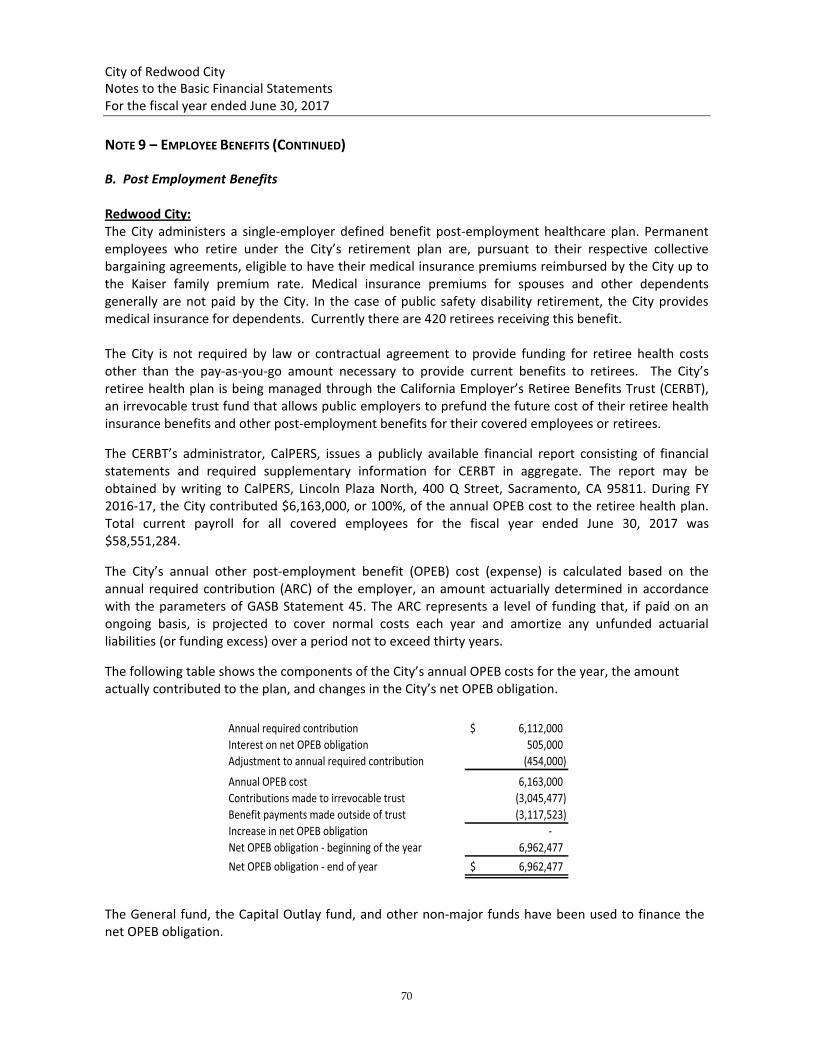
City�of�Redwood�City�Notes�to�the�Basic�Financial�Statements�For�the�fiscal�year�ended�June�30,�2017
�
��
�NOTE�9�–�EMPLOYEE�BENEFITS�(CONTINUED)�
�
B.��Post�Employment�Benefits��
Redwood�City:�The� City� administers� a� single�employer� defined� benefit� post�employment� healthcare� plan.� Permanent�employees� who� retire� under� the� City’s� retirement� plan� are,� pursuant� to� their� respective� collective�bargaining�agreements,�eligible�to�have�their�medical�insurance�premiums�reimbursed�by�the�City�up�to�the� Kaiser� family� premium� rate.� Medical� insurance� premiums� for� spouses� and� other� dependents�generally� are� not� paid� by� the� City.� In� the� case� of� public� safety� disability� retirement,� the� City� provides�medical�insurance�for�dependents.��Currently�there�are�420�retirees�receiving�this�benefit.�
�The� City� is� not� required� by� law� or� contractual� agreement� to� provide� funding� for� retiree� health� costs�other� than� the� pay�as�you�go� amount� necessary� to� provide� current� benefits� to� retirees.� � The� City’s�retiree�health�plan�is�being�managed�through�the�California�Employer’s�Retiree�Benefits�Trust�(CERBT),�an�irrevocable�trust�fund�that�allows�public�employers�to�prefund�the�future�cost�of�their�retiree�health�insurance�benefits�and�other�post�employment�benefits�for�their�covered�employees�or�retirees.�
�
The� CERBT’s� administrator,� CalPERS,� issues� a� publicly� available� financial� report� consisting� of� financial�statements� and� required� supplementary� information� for� CERBT� in� aggregate.� The� report� may� be�obtained� by� writing� to� CalPERS,� Lincoln� Plaza� North,� 400� Q� Street,� Sacramento,� CA� 95811.� During� FY�2016�17,�the�City�contributed�$6,163,000,�or�100%,�of�the�annual�OPEB�cost�to�the�retiree�health�plan.�Total� �current��payroll� �for� �all� �covered��employees� �for� �the� �fiscal� �year��ended��June��30,� �2017��was�$58,551,284.�
�
The� City’s� annual� other� post�employment� benefit� (OPEB)� cost� (expense)� is� calculated� based� on� the�annual� required� contribution� (ARC)� of� the�employer,� an� amount� actuarially�determined� in� accordance�with� the�parameters�of�GASB�Statement�45.�The�ARC�represents�a� level�of� funding� that,� if�paid�on�an�ongoing� basis,� is� projected� to� cover� normal� costs� each� year� and� amortize� any� unfunded� actuarial�liabilities�(or�funding�excess)�over�a�period�not�to�exceed�thirty�years.�
�
The�following�table�shows�the�components�of�the�City’s�annual�OPEB�costs�for�the�year,�the�amount�actually�contributed�to�the�plan,�and�changes�in�the�City’s�net�OPEB�obligation.��
Annual�required�contribution 6,112,000$������������������Interest�on�net�OPEB�obligation 505,000Adjustment�to�annual�required�contribution (454,000)Annual�OPEB�cost 6,163,000������������������Contributions�made�to�irrevocable�trust (3,045,477)Benefit�payments�made�outside�of�trust (3,117,523)Increase�in�net�OPEB�obligation �������������������������������Net�OPEB�obligation���beginning�of�the�year 6,962,477Net�OPEB�obligation���end�of�year 6,962,477$�����������������
����������������������������������The�General� fund,�the�Capital�Outlay�fund,�and�other�non�major�funds�have�been�used�to�finance�the�net�OPEB�obligation.�
�
70
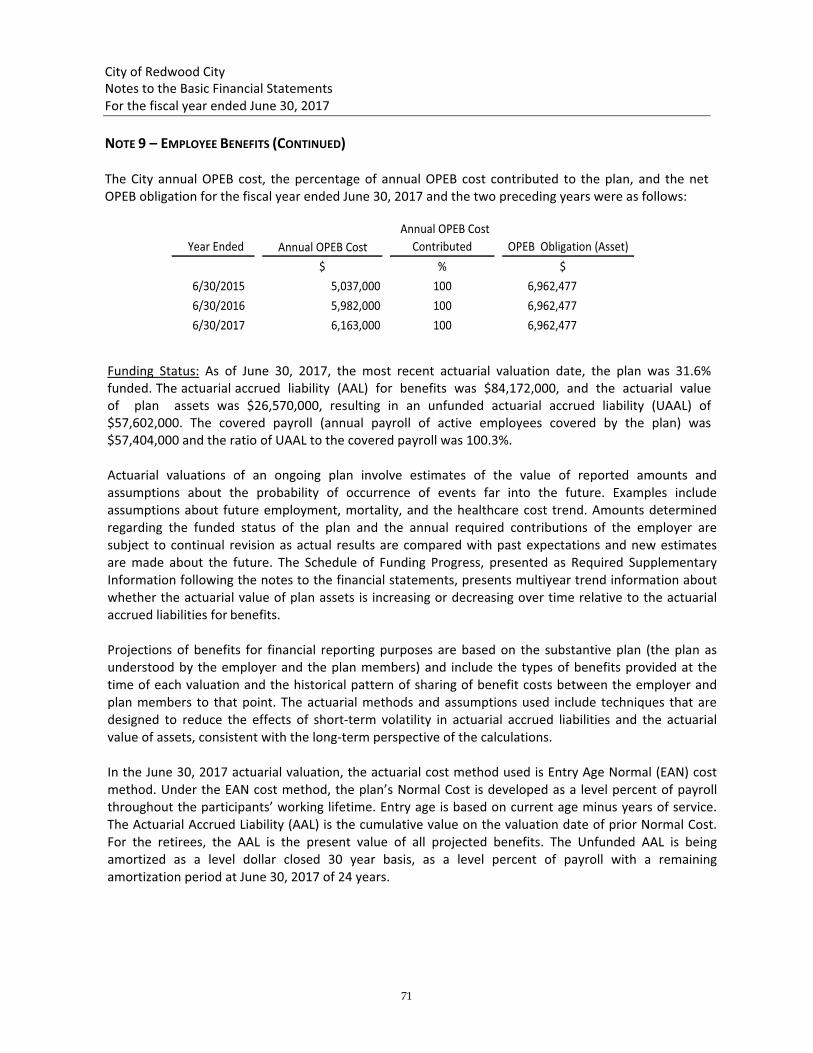
City�of�Redwood�City�Notes�to�the�Basic�Financial�Statements�For�the�fiscal�year�ended�June�30,�2017
�
��
�
NOTE�9�–�EMPLOYEE�BENEFITS�(CONTINUED)��
The� City� annual� OPEB� cost,� the� percentage� of� annual� OPEB� cost� contributed� to� the� plan,� and� the� net�OPEB�obligation�for�the�fiscal�year�ended�June�30,�2017�and�the�two�preceding�years�were�as�follows:��
��Year�Ended� �Annual�OPEB�Cost��Annual�OPEB�Cost�
Contributed� OPEB��Obligation�(Asset)�$ % $
6/30/2015 ����������������������5,037,000� 100 �������6,962,477�6/30/2016 ����������������������5,982,000� 100 �������6,962,477�6/30/2017 ����������������������6,163,000� 100 �������6,962,477�
��
Funding� Status:� As� of� June� 30,� 2017,� the� most� recent� actuarial� valuation� date,� the� plan� was� 31.6%�funded.�The�actuarial�accrued��liability��(AAL)��for��benefits��was��$84,172,000,��and��the��actuarial��value��of� � plan� � assets� was� $26,570,000,� resulting� in� an� unfunded� actuarial� accrued� liability� (UAAL)� of�$57,602,000.� The� covered� payroll� (annual� payroll� of� active� employees� covered� by� the� plan)� was�$57,404,000�and�the�ratio�of�UAAL�to�the�covered�payroll�was�100.3%.�
�Actuarial� valuations� of� an� ongoing� plan� involve� estimates� of� the� value� of� reported� amounts� and�assumptions� about� the� probability� of� occurrence� of� events� far� into� the� future.� Examples� include�assumptions�about� future�employment,�mortality,�and� the�healthcare�cost� trend.�Amounts�determined�regarding� the� funded� status� of� the� plan� and� the� annual� required� contributions� of� the� employer� are�subject� to� continual� revision�as�actual� results�are�compared�with�past� expectations�and�new�estimates�are� made� about� the� future.� The� Schedule� of� Funding� Progress,� presented� as� Required� Supplementary�Information�following�the�notes�to�the�financial�statements,�presents�multiyear�trend�information�about�whether�the�actuarial�value�of�plan�assets�is� increasing�or�decreasing�over�time�relative�to�the�actuarial�accrued�liabilities�for�benefits.��Projections� of� benefits� for� financial� reporting� purposes� are� based� on� the� substantive� plan� (the� plan� as�understood�by� the�employer�and�the�plan�members)�and� include� the� types�of�benefits�provided�at� the�time�of�each�valuation�and�the�historical�pattern�of�sharing�of�benefit�costs�between�the�employer�and�plan� members� to� that� point.� The� actuarial� methods� and�assumptions�used� include� techniques� that�are�designed� to� reduce� the� effects� of� short�term� volatility� in� actuarial� accrued� liabilities� and� the� actuarial�value�of�assets,�consistent�with�the�long�term�perspective�of�the�calculations.��In�the�June�30,�2017�actuarial�valuation,�the�actuarial�cost�method�used�is�Entry�Age�Normal�(EAN)�cost�method.�Under�the�EAN�cost�method,�the�plan’s�Normal�Cost� is�developed�as�a� level�percent�of�payroll�throughout�the�participants’�working�lifetime.�Entry�age�is�based�on�current�age�minus�years�of�service.�The�Actuarial�Accrued�Liability�(AAL)�is�the�cumulative�value�on�the�valuation�date�of�prior�Normal�Cost.�For� the� retirees,� the� AAL� is� the� present� value� of� all� projected� benefits.� The� Unfunded� AAL� is� being�amortized� as� a� level� dollar� closed� 30� year� basis,� as� a� level� percent� of� payroll� with� a� remaining�amortization�period�at�June�30,�2017�of�24�years.�
��
71

City�of�Redwood�City�Notes�to�the�Basic�Financial�Statements�For�the�fiscal�year�ended�June�30,�2017
�
��
�
NOTE�9�–�EMPLOYEE�BENEFITS�(CONTINUED)��
GASB�45�requires�the�interest�rate�to�represent�the�underlying�expected�return�for�the�source�of�funds�used� to� pay� benefits.� The� actuarial� methods� and� assumptions� included� a� 6.75%� interest� rate,� annual�inflation�at�3%�per�annum,�aggregate�payroll�assumed�to� increase�at�3.00%�per�annum,�and�an�annual�healthcare�trend�rate�of�7.5%���7.8%�for�2017,�reduced�gradually�each�year�with�an�ultimate�rate�of�5%�for�2021�and� thereafter.�The�study�also�used�assumptions� for� the�salary�merit�and� longevity� increases,�and�demographic�assumptions�such�as�mortality,�withdrawal,�and�disability�based�on�CalPERS�1997��2011�Experience�Study.�Retirement�assumption�was�also�based�on�CalPERS�1997�2011�Experience�Study.�For�employees� hired� before� October� 24,� 2011� it� was� assumed� Miscellaneous� Plan� 2.7%� at� 55� years,� with�expected� retirement� age� of� approximately� 57.8,� and� Public� Safety� 3%� at� 50� years,� with� expected�retirement�age�of�approximately�54�for�Police�and�55.4�for�Fire.��For�employees�hired�on�or�after�October�24,�2011�it�was�assumed�Miscellaneous�Plan�2%�at�60�years,�with� expected� retirement� age� of� approximately� 61� years,� and� Public� Safety� 3%� at� 55� years,� with��expected�retirement�age�of�approximately�59.9�for�Police�and�56.2�for�Fire.�
�Port�of�Redwood�City:��Plan�Description��The� other� post�employment� benefits� (other� than� pension)� offered� by� the� Port� are� limited� to�reimbursement�of�medical�premiums�only.�Eligibility�extends�to�those�employees�hired�before�January�1,�2011�who,�prior�to�retirement,�have�(a)�worked�ten�or�more�consecutive�years�at�the�Port�on�a�full�time�basis,�and�(b)�are�enrolled�in�the�Port’s�medical�plan,�and�(c)�age�55�or�older,�and�(d)�have�not�been�voluntarily�or� involuntarily� terminated� from�employment�at� the�Port.�Spouses�and/or�dependents�are�ineligible.�
�The�reimbursement�of�medical�premiums�is�limited�to�the�lesser�of�(a)�the�medical�insurance�premium�paid�by�the�eligible�retiree,�or�(b)�the�Port’s�cost�to�provide�medical�coverage�for�an�active�employee�of�the� same� age� as� the� retiree,� or� (c)� the� insurance� premium� for� a� Medicare� supplement� plan� at� the�retiree’s�earliest�Medicare�eligibility�age,�whether�or�not�the�retiree�enrolls�in�Medicare.��Funding�Policy,�Status�and�Progress��The� accounting� rules� governing� other� post�employment� benefits� (OPEB)� do� not� require� mandatory�funding�of� the�actuarial�accrued� liability�or�annual�required�contribution.�During�the�fiscal�year�ended�June�30,�2011,� the�Port�adopted�a�comprehensive� funding�policy� for�post�employment�benefits�other�than�pension.�The�policy�addresses�the�selection�of�a�Section�115�Trust,�prefunding�strategy,�valuation�frequency,� valuation� methodology,� disbursements,� and� administrative� matters.� The� Section� 115� Trust�selected�was�the�CalPERS�California�Employer’s�Retiree�Benefit�Trust�Program�(CERBT).��
72

City�of�Redwood�City�Notes�to�the�Basic�Financial�Statements�For�the�fiscal�year�ended�June�30,�2017
�
�
�
NOTE�9�–�EMPLOYEE�BENEFITS�(CONTINUED)��
Annual�OPEB�Cost�and�Net�OPEB�Obligation��
For�the�fiscal�year�ended�June�30,�2017,�the�Port’s�annual�OPEB�cost�was�$39,863;�of�this�amount�$8,400�was� expensed� and� paid� for� the� current� retiree,� and� the� remaining� $31,463� net� OPEB� obligation� was�expensed� and� recorded� as� a� liability.� Combined� with� the� $230,756� net� OPEB� obligation� as� of� June� 30,�2016,�the�total�net�OPEB�obligation�as�of�June�30,�2017�was�$262,219.�
�The�annual�required�contribution�was�determined�as�part�of�the�July�1,�2015,�actuarial�valuation�using�the�Entry�Age�Actuarial�Cost�Method�and�assumptions�consistent�with�the�CalPERS�OPEB�Assumptions�Model.�The�actuarial�assumptions� included�(a)�salary� increases�of�3.00%�per�year,�(b)�a�discount�rate�of�5%,�(c)�100%�of�eligible�employees�assumed�to�elect�coverage�upon�retirement�and�to�remain�covered�for� life,�(d)�retirement,�withdrawal,�and�mortality�rates�based�on�CalPERS�Assumption�model�for�the�classification�“public�agency�miscellaneous�2.7%�at�55”,�and�(e)�medical�premium�inflation�rates�ranging�from�9%�to�6%�over� time.� The� actuarial� present� value� of� future� benefits� was� calculated� for� each� individual� using� the�economic�assumptions�and�specific�member�data,�then�aggregated.�The�amortization�component�of�the�unfunded�actuarial�accrued�liability�was�based�on�a�30�year�amortization�period.�
�The� following� table� shows� the� components� of� the� Port’s� annual� OPEB� costs� for� the� year,� the� amount�actually�contributed�to�the�plan,�and�changes�in�the�Port’s�net�OPEB�obligation:��
Normal�Cost 10,181$���������������Amortization�of�unfunded�actuarial�accrued�liability 31,055Annual�required�contribution 41,236�����������������Interest�on�beginning�net�OPEB�obligation����������������������� 11,538�����������������Annual�required�contribution�adjustment������������������������������������ (12,911)����������������Annual�OPEB�expense 39,863�����������������Actual�current�year�employer�payment�������������������������������������������������������������� (8,400)������������������Decrease�in�OPEB�obligation 31,463�����������������Net�OPEB�obligation�at�June�30,�2016 230,756���������������Net�OPEB�obligation�at�June�30,�2017 262,219$�������������
Actuarial�accrued�liabilities 565,987$�������������Actuarial�value�of�plan�assets �����������������������������
Unfunded�actuarial�accrued�liabilities�(UAAL) 565,987$�������������
Funded�Ratio 0%
Covered�Payroll 609,562$�������������
UAAL�as�a�%�of�Covered�Payroll 92.85%
Annual�OPEB�Cost�and�Net�OPEB�Obligation
OPEB�Unfunded�Actuarial�Accrued�Liabilities
����
73

City�of�Redwood�City�Notes�to�the�Basic�Financial�Statements�For�the�fiscal�year�ended�June�30,�2017
�
�
�NOTE�9�–�EMPLOYEE�BENEFITS�(CONTINUED)��The�Port’s�annual�OPEB�cost,�the�percentage�of�annual�OPEB�cost�contributed�to�the�plan�for�2017�and�the�two�preceding�fiscal�years�were�as�follows:���
��Year�Ended� �Annual�OPEB�Cost��Annual�OPEB�Cost�
Contributed�OPEB��Obligation�(Asset)�
$ % $6/30/2015 ������������������������������35,737� 15.8 �����202,238�6/30/2016 ������������������������������37,624� 24.2 230,756������������������������6/30/2017 ������������������������������39,863� 21.1 262,219������������������������
��
Actuarial�valuations�of�an�ongoing�plan�involve�estimates�of�the�value�of�expected�benefit�payments�and�assumptions� about� the� probability� of� occurrence� of� events� far� into� the� future.� Examples� include�assumptions�about� future�employment,�mortality,�and�the�healthcare�cost� trend.�Amounts�determined�regarding�the�funded�status�of�the�plan�and�the�annual�required�contributions�of�the�new�employer�are�subject� to�continual� revision�as�actual� results�are�compared�with�past�expectations�and�new�estimates�are� made� about� the� future.� The� schedule� of� funding� progress,� presented� as� required� supplementary�information�following�the�notes�to�the�financial�statements,�presents�multi�year�trend�information�about�whether�the�actuarial�value�of�plan�assets�is�increasing�or�decreasing�over�time�relative�to�the�actuarial�accrued�liabilities.�
�Projections� of� benefits� for� financial� reporting� purposes� are� based� on� the� substantive� plan� (the� plan� as�understood�by�the�employer�and�the�plan�participants)�and�include�the�types�of�benefits�provided�at�the�time�of�each�valuation�and�the�historical�pattern�of�sharing�of�benefit�costs�between�the�employer�and�plan�participants�to�that�point.��The�actuarial�methods�and�assumptions�used�include�techniques�that�are�designed� to� reduce� the� effects� of� short�term� volatility� in� actuarial� accrued� liabilities� and� the� actuarial�value�of�assets,�consistent�with�the�long�term�perspective�of�the�calculations.�
�C. Cafeteria�Benefit�Plan�
�
The� City� has� a� cafeteria� benefit� plan� established� pursuant� to� section� 125� of� the� IRS� code.� � Under� this���plan�eligible�employees�may�direct�a�contribution,�made�by�the�City�or�elect�to�contribute�pre�tax�dollars,�into�any�combination�of�the�following�three�benefit�categories:�
�
1. Medical�Insurance�Premium�Account�2. Out�of�Pocket�Medical�Spending�Account�3. Dependent�Care�Spending�Account�
�
Under� no� circumstances� may� an� employee� direct� more� than� $5,000� annually� into� the� Dependent� Care�Spending�Account�and�$2,550�annually�into�the�Medical�Spending�Account.�This�cap�applies�to�both�City�contributions� and� employee� pre�tax� contributions.� There� are� no� legal� limits� on� contributions� to� the�Health�Premium�Account.�
��������
74

City�of�Redwood�City�Notes�to�the�Basic�Financial�Statements�For�the�fiscal�year�ended�June�30,�2017
�
�
�
NOTE�9�–�EMPLOYEE�BENEFITS�(CONTINUED)��
All� regular� full�time� and� part�time� employees� employed� on� a� regular� and� continuous� basis,� including�certain�contractual�employees,�are�eligible�to�participate� in�this�plan.�Temporary�and�casual�employees�are�not�eligible.��The�plan�year�adopted�by�the�City�begins�on�January�1�and�ends�December�31.�
�
To�obtain�reimbursement�of�expenses�incurred�within�a�plan�year�within�the�spending�accounts�(items�2�or�3),�employees�must�submit�claims�within�90�days�of�the�end�of�the�plan�year�or�separation�of�service�from�the�City,�whichever�occurs�first.�Funds�unclaimed�after�90�days�of�the�close�of�the�plan�year�are�then�remitted�to�the�City.�
�D. Deferred�Compensation�Plans�
�
City�employees�may�defer�a�portion�of�their�compensation�under�four�separate,�optional�City�sponsored�deferred� compensation� plans� created� in� accordance� with� Internal� Revenue� Code� Section� 457.� Under�these�plans,�participants�are�not�taxed�on�the�deferred�portion�of�their�compensation�until�distributed�to�them;�distributions�may�be�made�only�at�termination,�retirement,�death,�or�in�an�emergency�as�defined�by�the�plans.�
�Effective� January�1,�1998,� the�City� signed� new�deferred�compensation�plan�administration�agreements�with� the� deferred� compensation� providers� to� provide� for� the� administration� and� management� of�employees’� deferred� compensation� plan� assets.� These� agreements� incorporate� changes� in� the� law�governing�deferred�compensation�plan�assets�which�now�require�plan�assets�to�be�held�for�the�exclusive�benefit�of�plan�participants�and�their�beneficiaries.�Since�the�assets�held�under�these�new�plans�are�not�the�City’s�property�and�are�not�subject�to�claims�by�general�creditors�of�the�City,�they�have�been�excluded�from�these�financial�statements.�
�
Effective� January� 28,� 2003,� the� City� implemented� a� retirement� enhancement� plan� (401�A� defined�contribution�plan)� for�certain�executive�management�employees.� In�February�2005,�a�plan�amendment�was� adopted� to� extend� the� 401�A� plan� to� all� members� of� the� executive� management� employee�classification.�Under� this�plan,� the�City�contributes�2%�of� the�employees’� compensation� into� the�401�A�plan.�
�Effective�October�1,�2002�for�the�Redwood�City�Management�Employees�Association,�the�City�contributes�an�amount�equal�to�2%�of�the�base�monthly�salary�to�a�deferred�compensation�plan�offered�by�the�City�to�members�of�the�Association.�
�� �
75

City�of�Redwood�City�Notes�to�the�Basic�Financial�Statements�For�the�fiscal�year�ended�June�30,�2017
�
�
�
NOTE�10�–�NET�POSITION�AND�FUND�BALANCES��
GASB�Statement�No.�63�adds�the�concept�of�net�position,�which�is�measured�on�the�full�accrual�basis,�to�the�concept�of�fund�balance,�which�is�measured�on�the�modified�accrual�basis.�
�A. Net�Position�
�
Net�position�is�the�excess�of�all�the�City’s�assets�over�all�its�liabilities,�regardless�of�fund.�Net�position�is�divided� into�three�captions.�These�captions�apply�only�to�net�position,�which� is�determined�only�at� the�government�wide�level�and�are�described�below:�
�
Net�investment�in�capital�assets�describes�the�portion�of�net�position�which�is�represented�by�the�current�net�book� value� of� the� City’s� capital� assets,� less� the� outstanding� balance� of� any� debt� issued� to� finance� these�assets.�
�
Restricted�describes�the�portion�of�net�position�which�is�restricted�as�to�use�by�the�terms�and�conditions�of�agreements� with� outside� parties,� governmental� regulations,� laws,� or� other� restrictions� which� the� � City�cannot�unilaterally�alter.�These�principally�include�developer�fees�received�for�use�on�capital�projects,�debt�service�requirements,�and�redevelopment�funds�restricted�to�low�and�moderate�income�purposes.��At�June�30,�2017,�restricted�net�position�for�the�governmental�activities�was�$59,815,017.�
�Unrestricted�describes�the�portion�of�net�position�which�is�not�restricted�as�to�use.�
�
B. Fund�Balances��
In�the�fund�financial�statements,�fund�balances�represent�the�net�current�assets�of�each�fund.�Net�current�assets�generally�represent�a�fund’s�cash�and�receivables,�less�its�liabilities.�As�prescribed�by�GASB�Statement�No.�54,�governmental�funds�report�fund�balance�in�classifications�based�primarily�on�the�extent�to�which�the�City�is�bound�to�honor�constraints�on�the�specific�purposes�for�which�amounts�in�the�funds� can�be�spent.�As�of�June�30,�2017,�fund�balances�for�governmental�funds�are�made�up�of�the�following:�
�
Nonspendable� Fund� Balance� –� includes� amounts� that� are� (a)� not� in� spendable� form,� or� (b)� legally� or�contractually� required�to�be�maintained� intact.�The�“not� in� spendable� form”� criterion� includes� items� that�are�not�expected�to�be�converted�to�cash,�for�example:�inventories,�prepaid�amounts,�and�long�term�loans�receivable.�
�Restricted�Fund�Balance�–�includes�amounts�that�can�be�spent�only�for�the�specific�purposes�stipulated�by�external�resource�providers,�constitutionally�or�through�enabling�legislation.�Restrictions�may�effectively�be�changed�or�lifted�only�with�the�consent�of�resource�providers.�
�Committed�Fund�Balance�–�includes�amounts�that�can�only�be�used�for�the�specific�purposes�determined�by�a�formal�action,�adopting�a�resolution,�of�the�City’s�highest�level�of�decision�making�authority,�the�City�Council.� Commitments� may� be� changed� or� lifted� only� by� the� City� adopting� another� resolution,� as� a�resolution�imposed�the�constraint�originally.�
�Assigned�Fund�Balance�–�comprises�amounts�intended�to�be�used�by�the�City�for�specific�purposes�that�are�neither�restricted�nor�committed.� Intent�is�expressed�by�the�City�Council�or�City�Manager,�to�which�the� City� Council� has� delegated� the� authority� through� a� resolution,� to� assign� amounts� to� be� used� for�specific�purposes.�
��
76
City�of�Redwood�City�Notes�to�the�Basic�Financial�Statements�For�the�fiscal�year�ended�June�30,�2017
�
�
�NOTE�10�–�NET�POSITION�AND�FUND�BALANCES�(CONTINUED)�
�Pursuant� to� the� authority� delegated� by� City� Council,� the� City� Manager� determines� the� amount� of�assigned�fund�balances,�which�includes�items�such�as�encumbrances,�and�constrained�amounts�when�it�is�the�City’s�intent�to�use�proceeds�or�collections�for�a�specific�purpose,�and�residual�fund�balances,�if�any,�of�special�revenue,�capital�projects�and�debt�service�funds�which�have�not�been�restricted�or�committed.�
�Unassigned�Fund�Balance�–�is�the�residual�classification�for�the�general�fund�and�includes�all�amounts�not�contained� in�the�other�classifications.�Unassigned�amounts�are�technically�available�for�any�purpose.� In�other� governmental� funds,� if� expenditures� exceed� amounts� restricted,� committed,� or� assigned,� the�negative�amount�is�reflected�as�negative�unassigned�fund�balance.�Within�the�unassigned�fund�balance�of�the�general�fund,�the�City�Council�has�established�a�minimum�balance�representing�a�level�not�less�than�15%�of�the�following�fiscal�year’s�budgeted�general�fund�revenues.�
�In�circumstances�when�an�expenditure�is�made�for�a�purpose�for�which�amounts�are�available��in�multiple�fund� balance� classifications,� fund� balance� is� generally� depleted� in� the� order� of� restricted,� committed,�assigned,�and�unassigned.�
�C. Deficit�Fund�Equity/Net�Position�
�The�Successor�Agency�private�purpose�trust�fund�had�negative�net�position�of�$16,357,678�due�to�long��term�debt�outstanding�for�bonds�used�to�finance�various�downtown�improvements.�
�The�planning�cost�recovery�fund�had�a�negative�fund�balance�of�$3,022.�
�The�internal�services�fund�had�a�negative�net�position�of�$12,203,090�due�to�the�net�pension�liability.�
��
NOTE�11�–�FUNDS�WITH�EXPENDITURES�EXCEEDING�APPROPRIATIONS��
Community�Development,�Finance,�Library,�Parks,�Recreation�and�Community�Services,�and�Public�Works�expenditures� exceeded� appropriations� in� the� general� fund� primarily� due� to� unbudgeted� program�expenditures�for�which�there�were�sufficient�revenues�available.� �
77

City�of�Redwood�City�Notes�to�the�Basic�Financial�Statements�For�the�fiscal�year�ended�June�30,�2017
�
�
�NOTE�12�–�INTERFUND�TRANSFERS�AND�TRANSACTIONS�
�A. Transfers�
�The�following�interfund�transfers�were�made�during�the�year:��Fund�Receiving�Transfers Fund�Making�Transfers Amount�Transferred
General�Fund Non�major��Governmental�Funds 470,216 (1)
Capital�Outlay�Fund 237,773 (1)
Internal�Service�Funds 8,565 (2)
Capital�Outlay�Fund General�Fund 8,897,388 (3)
Non�major��Governmental�Funds General�Fund 1,683,800 (1)
Capital�Outlay�Fund 699,271 (1)�(3)
Water�Fund General�Fund 173,278 (1)
Sewer�Fund 517,835 (1)
Docktown�Marina General�Fund 2,406,537 (1)
Parking�Fund General�Fund 101,815 (1)
Internal�Service�Funds General�Fund 1,000,000 (1)
Total�Interfund�Transfers 16,196,478
��
The�reasons�for�these�transfers�are�set�forth�below:�(1)�Allocation�of�funds�to�support�operations.�(2)�Reimburse�General�Fund�for�interest�earned�by�funds�supported�by�the�General�Fund.�(3)�Allocation�of�funds�to�construct/purchase�general�capital�assets.�
��
B. Short�Term�Due�to/From�other�Funds��
At� the� end� of� the� fiscal� year� the� general� fund� had� net� utility� users� tax� receivable� in� the� amount� of�$839,137.�The�policy�of�the�City�Council�dictates�the�transfer�of�utility�users�tax�to�the�capital�outlay�fund,�and�once�the�revenue�is�received,�the�general�fund�will�transfer�the�cash�to�the�capital�outlay�fund.�During�FY�2016�17,�the�low�and�moderate�income�housing�asset�fund�borrowed�$373,981�from�the�general�fund�as�a�short�term�borrowing�related�to�a�loan�disbursement�for�affordable�housing.�The�$300,000�is�related�to�the�long�term�advance�and�is�the�current�portion�due.��
Receivable�Fund Payable�Fund Amount�Due�to/From
$
Capital�Outlay�Fund General�Fund 839,137����������������������������
General�Fund Non�Major�Governmental�Funds 373,981����������������������������
Internal�Service�Funds Water�Utility�Fund 300,000����������������������������1,513,118�������������������������
��
���
78

City�of�Redwood�City�Notes�to�the�Basic�Financial�Statements�For�the�fiscal�year�ended�June�30,�2017
�
�
�NOTE�12�–�INTERFUND�TRANSFERS�AND�TRANSACTIONS�(CONTINUED)�
�C. Long�Term�Interfund�Loans�
�Fund�Receiving�Advance Fund�Making�Advance Amount�of�Advance
$
Water�Utility�Fund Internal�Service�Funds 1,500,000�����������������������
Total�Long�term�Interfund�Loans 1,500,000������������������������
��
During�FY�2012�13,�the�equipment�services�internal�service�fund�advanced�$3,000,000�to�the�water�utility�enterprise�fund�for�the�implementation�of�the�Automated�Meter�Infrastructure�Project�to�replace�water�meters.�During�FY�2013�14�the�water�utility�enterprise�fund�repaid�$300,000�to�the�equipment�services�internal� service� fund.� � During� FY� 2016�17� the� water� utility� enterprise� fund� repaid� $300,000� to� the�equipment� services� internal� service� Fund.� As� of� June� 30,� 2017,� $300,000� of� this� advance� is� considered�current.��NOTE�13�–�RISK�MANAGEMENT�AND�SELF�INSURANCE�FUND�
�A. Workers’�Compensation�and�Property� Insurance�
�The� City� is� self�insured� for� workers’� compensation� for� the� first� $350,000� per� occurrence� and� has� a�commercial�insurance�policy�that�covers�the�City’s�exposure�above�the�retained�limits�up�to�the�statutory�limits�required�by�the�State�of�California.�The�City�paid�$606,926�during�FY�2016�17�for�the�coverage.�
�The�City’s�workers’�compensation�policy�includes�coverage�for�the�Port�of�Redwood�City.�The�Port�carries�property�and�liability�insurance�policies�with�limits�of�$15,000,000�and�$150,000,000,�respectively.�
�B. General�Liability�and�Automobile�
�The�City�is�a�member�of�the�Bay�Cities�Joint�Powers�Insurance�Authority�(BCJPIA),�which�is�an�insurance�pool� consisting� of� 19� San� Francisco� Bay� Area� government� agencies,� which� the� City� uses� for� general�liability�and�auto�liability�coverage.�In�FY�2016�17�the�City�maintained�a�$350,000�self�insured�retention�with�coverage�from�$350,000�to�$1,000,000�through�the�BCJPIA.�The�purpose�of� the�pool� is� to�provide�certain� levels�of� liability�coverage,�claims�administration,�and�loss�control�support�to�member�agencies.�Annually,�each�agency�pays�an�actuarially�determined�premium�based�upon�a�formula�which�takes� into�account�loss�experience,�annual�payroll,�and�population.��This�premium�pays�for�administrative�costs�and�funds�liability�reserves.��The�premium�paid�in�FY�2016�17�was�$852,412.�
�The�BCJPIA�belongs�to�the�California�Affiliated�Risk�Management�Authority�(CARMA)�which� is�an�excess�liability�pool�comprised�of�the�BCJPIA�and�four�other�local�government�insurance�pools.��CARMA�provides�coverage� from� $1,000,001� to� $28,000,000.� A� layer� from� $1,000,001� to� $4,000,000� is� self�� insured� by�CARMA,� the� layer� from� $4,000,001� to� $28,000,000� is� reinsured� through� agreements� with� commercial�insurers.�
��
79

City�of�Redwood�City�Notes�to�the�Basic�Financial�Statements�For�the�fiscal�year�ended�June�30,�2017
�
�
�NOTE�13�–�RISK�MANAGEMENT�AND�SELF�INSURANCE�FUND�(CONTINUED)��The�City�also�carries�all�risk�coverage�on�buildings�and�their�contents�at�replacement�cost�value.�
�Audited�financial�statements�are�available�from�the�Bay�Cities�Joint�Powers�Insurance�Authority�at�1750�Creekside�Oaks�Drive,�Suite�200,�Sacramento,�CA�95833.�The�following�is�the�BCJPIA�condensed�audited�financial�results�for�the�year�ended�June�30,�2017:�
�Assets 35,252,474$��������
Reserves�for�Claims 20,100,376����������
Liabilities(1) 3,924,302������������
Net�Position�Unrestricted 11,227,796����������
Member�Contributions 13,223,178����������
Other�Income 716,027����������������
Claims�and�Claim�Adjustment�Expenses�(2) 6,544,436������������
Operating�Expenses(3) 6,934,541������������
Change�in�Net�Position 460,228����������������
(1)Excluding�claims�liabilities
(2)Including�change�in�unpaid�claims
(3)Excluding�claims�and�claim�adjustment�expenses ��
C. Self�Insurance�Fund��
The� City� maintains� a� self�insurance� internal� service� fund� for� its� workers’� compensation� and� general�liability� self�insurance� programs.� This� fund� accounts� for� revenues� from� departmental� charges� and�operating�expenses,�including�settlements�within�the�City’s�self�insured�retentions.�Reserves�for�incurred�but� not� reported� claims� are� maintained� within� this� fund.� These� reserves� are� based� on� an� actuarial�analysis�performed�by�Richard�E.�Sherman�&�Associates,�Inc.�in�accordance�with�GASB�10.�
�Changes�in�the�self�insurance�fund’s�claims�payable�liability�for�fiscal�years�ended�2015,�2016,�and�2017�were:�
�Beginning�Balance���Current�Year�
Claims/Changes�in�Estimates�
�Claim�Payments� Ending��Balance�
$ $ $ $2014�15 18,454,723 6,671,124 ����������(4,222,289) 20,903,5582015�16 20,903,558 7,782,145 ����������(5,568,861) 23,116,8422016�17 23,116,842 4,486,534 (3,822,883)��������� 23,770,493
��
Settlements�have�not�exceeded�coverage�for�each�of�the�past�three�fiscal�years.�������
80

City�of�Redwood�City�Notes�to�the�Basic�Financial�Statements�For�the�fiscal�year�ended�June�30,�2017
�
�
�NOTE�14�–�DISSOLUTION�OF�THE�REDWOOD�CITY�REDEVELOPMENT�AGENCY�
�As� part� of� the� FY� 2011�12� State� Budget� package,� and� in� an� effort� to� help� solve� the� State’s� budget�problems,� the� California� legislature� enacted� and� the� Governor� signed� two� companion� bills� addressing�redevelopment,�AB�X1�26�(Dissolution�Act)�and�AB�X1�27�(Voluntary�Program�Act),�which�took�effect�on�June�29,�2011.�
�The� Dissolution� Act� immediately� suspended� all� new� redevelopment� activities� and� incurrence� of�indebtedness,�and�eliminated�redevelopment�agencies�as�of�October�1,�2011.�
�The� Voluntary� Program� Act� allows� the� community� that� created� the� redevelopment� agency� to� avoid�dissolution� by� opting� to� pay� a� substantial� community� remittance� beginning� FY� 2011�12� and� each� year�thereafter.�
�On�July�18,�2011,� the�California�Redevelopment�Association,� the�League�of�California�Cities,�and�others�filed� a� Petition� for� Writ� of� Mandate� in� the� Supreme� Court� of� the� State� of� California� (California�Redevelopment� Association,� et� al.� v.� Ana� Matosantos,� et� al.,� Case� No.� 5194861),� challenging� the�constitutionality�of� the�companion�bills,� the�Dissolution�Act,�and� the�Voluntary�Program�Act,�on�behalf���of�cities,�counties,�and�redevelopment�agencies,�and�requesting�a�stay�of�their�enforcement.�
�On�December�29,�2011,�the�California�Supreme�Court�upheld�the�Dissolution�Act�and�found�the�Voluntary�Program�Act�to�be�unconstitutional�and�extended�the�date�of�dissolution�to�February�1,�2012.�
�The�Dissolution�Act�provides�that�upon�dissolution�of�a�redevelopment�agency,�either�the�city�or�another�unit�of�local�government�will�agree�to�serve�as�the�“Successor�Agency”�to�hold�the�assets�until�they�are�distributed�to�other�units�of�state�and�local�government.�The�City�Council�elected�to�become�Successor�Agency�on�August�22,�2011�with�resolution�15141,�and�reconfirmed�this�action�on�January�23,�2012�with�resolution�15164.�
�Under� the� Dissolution� Act,� redevelopment� agencies� in� the� State� of� California� cannot� enter� into� new�projects,� obligations,� or� commitments.� Subject� to� the� control� of� a� newly� established� oversight� board,�remaining�assets�can�only�be�used�to�pay�enforceable�obligations�in�existence�at�the�date�of�dissolution�(including�the�completion�of�any�unfinished�projects�that�were�subject�to�legally�enforceable�contractual�commitments).�
�In�FY�2010�11,�prior�to�AB�X1�26�becoming� law,�$3.3�million�of� real�property�assets� (vacant� land)�were�transferred�from�the�RDA’s�Low�and�Moderate�Income�Housing�Fund�to�the�City�in�an�attempt�to��protect�these�assets�from�being�diverted�for�the�benefit�of�the�State.�AB�X1�26,�however,�specifically�disallowed�such�transfers.�Accordingly,�the�assets�were�transferred�to�the�Low�and�Moderate�Income�Housing�Asset�Fund�in�FY�2011�12.�
�Prior� to� the� dissolution� of� the� redevelopment� agency,� under� an� agreement� with� San� Mateo� County� to�receive�a�cumulative�$25�million�of�the�County’s�share�of�tax�increment�and�an�agreement�with�the�Legal�Aid� Society� to� deposit� the� first� $11.9� million� of� the� $25� million� into� the� Low� and� Moderate� Income�Housing�Fund,�the�agency�had�deposited�$10.3�million�into�the�Low�and�Moderate�Income�Housing���Fund�as� of� June� 30,� 2011.� � Pursuant� to� the� agreement� with� the� Legal� Aid� Society� to� restrict� these� funds� to�housing,� after� the� dissolution� of� the� redevelopment� agency� these� funds� were� deposited� into� a� new�����
81

City�of�Redwood�City�Notes�to�the�Basic�Financial�Statements�For�the�fiscal�year�ended�June�30,�2017
�
�
�NOTE�14�–�DISSOLUTION�OF�THE�REDWOOD�CITY�REDEVELOPMENT�AGENCY�(CONTINUED)��fund,�Housing�Legal�Aid�Society�Fund,�to�be�used�for�housing�purposes.�The�State�Department�of�Finance�(DOF)�has�disputed�that�these�funds�are�restricted�for�housing,�and�the�City�has�filed�a�lawsuit�against�the�State�of�California�on�this�matter.�On�October�30,�2013�the�Superior�Court�Judge�hearing�the�lawsuit�filed�against�the�State�of�California�Department�of�Finance�concerning�the�$10.3�million�the�City�is�holding�in�the�Housing�Legal�Aid�Society�Fund�as�part�of�the�dissolution�of�the�former�Redevelopment�Agency�issued�a� tentative� ruling� in� favor� of� the� State� of� California.� On� November� 6,� 2013� the� Judge� then� issued� a�“Request�for�Further�Briefing”�to�be�held�on�November�22,�2013.�On�January�4,�2014�the�Superior�Court�Judge�ruled�in�favor�of�the�State�of�California.�In�April�2014,�the�City�filed�an�appeal,�and�as�of�the�date�of�this� report,� a� ruling� on� the� appeal� has� not� been� issued.� � In� December� 2015,� the� City� remitted� $10.3�million�to�the�DOF,�under�protest,�in�order�for�the�Successor�Agency�to�receive�a�finding�of�completion.��In�future�fiscal�years,�successor�agencies�will�only�be�allocated�revenue�in�the�amount�that�is�necessary�to�pay�the�estimated�annual�installment�payments�on�enforceable�obligations�of�the�former�redevelopment�agency�until�all�enforceable�obligations�of�the�prior�redevelopment�agency�have�been�paid�in�full�and�all�assets�have�been�liquidated.�
�The�City’s�former�Redevelopment�Agency�had�entered�into�agreements�with�certain�public�entities�whose�jurisdictions�were�within�the�territory�of�the�former�Redevelopment�Agency�under�which�these�entities�received�a�specified�share�of�the�property�tax�increment�received�by�the�former�Redevelopment�Agency.��Under�Assembly�Bill�X1�26�the�responsibility�for�making�these�payments�has�been�shifted�to���the�County�of�San�Mateo.�
�The�following�is�a�summary�of�the�capital�assets�of�the�Successor�Agency:��
Beginning�Balance Additions Retirements Transfers Ending�Balance
Capital�assets�not�being�depreciated: $ $ $ $ $
Land 3,126,664������������ ��������������������� (565,925)������������� ����������������� 2,560,739������������
Total�capital�assets�not�being�depreciated 3,126,664������������ ��������������������� (565,925)������������� ����������������� 2,560,739������������
Capital�assets�being�depreciated:
Improvements�other�than�buildings 13,231,503���������� ��������������������� ������������������������ ����������������� 13,231,503����������
Accumulated�depreciation (3,020,773)����������� (356,054)���������� ������������������������ ����������������� (3,376,827)�����������
Traffic�Signals 208,691���������������� ��������������������� ������������������������ ����������������� 208,691���������������
Accumulated�depreciation (78,260)����������������� (10,435)������������ ������������������������ ����������������� (88,695)����������������
Storm�Drains 4,101,302������������ ��������������������� ������������������������ ����������������� 4,101,302������������
Accumulated�depreciation (1,281,659)����������� (102,533)���������� ������������������������ ����������������� (1,384,192)�����������
Machinery�&�Equipment 953,244���������������� ��������������������� ������������������������ ����������������� 953,244���������������
Accumulated�depreciation (459,492)�������������� (46,957)������������ ������������������������ ����������������� (506,449)��������������
Net�capital�assets�being�depreciated 13,654,556���������� (515,979)���������� ������������������������ ����������������� 13,138,577����������
Total�capital�assets,net 16,781,220���������� (515,979)���������� (565,925)������������� ����������������� 15,699,316����������
�
82

City�of�Redwood�City�Notes�to�the�Basic�Financial�Statements�For�the�fiscal�year�ended�June�30,�2017
�
�
�NOTE�14�–�DISSOLUTION�OF�THE�REDWOOD�CITY�REDEVELOPMENT�AGENCY�(CONTINUED)�
The�following�is�a�summary�of�the�long�term�obligations�of�the�Successor�Agency.��
Tax�Increment�Bonds:�2003�Tax�Allocation�Bonds�–�In�October�2003,�the�former�Redevelopment�Agency�issued�$33,997,448�in�bonds� to� finance� various�downtown� improvements.� These� bonds� consist� of� current� coupon� bonds� and�capital� appreciation� bonds.� The� current� coupon� bonds� pay� interest�only� through� January� 15,� 2010.�Principal�on�the�current�coupon�bonds� is�paid� in�annual� installments�of�$1,225,000�to�$3,045,000�from�July� 15,� 2010� to� July� 15,� 2014.� Payments� reflecting� interest� and� principal� on� the� capital� appreciation�bonds�are�due� in�annual� installments� of�$3,505,000� to�$3,510,000� from� July�15,�2016� through� July� 15,�2032.� � Total� principal� and� interest� remaining� on� the� bonds� is� $63,029,814.� � Payments� are� made� from�property�tax�increment�generated�by�the�former�redevelopment�agency�fund.��Change�in�Debt:��
WithinInterest Rate Additions Retirements One Year
% $ $ $ $ $
Tax Increment Bonds2003 Tax Allocation Bonds 3.50-5.80 19,944,779 - 1,889,861 18,054,918 1,773,916 Accreted interest payable 19,507,026 2,018,233 1,615,138 19,910,121 1,731,084 Unamortized Premium 523,116 - 30,772 492,344 - Total Bonds 39,974,921 2,018,233 3,535,771 38,457,383 3,505,000
Beginning Balance
Ending Balance
��Annual�Repayment�Requirements�for�Long�Term�Debt:��
������������������������������������������������������������������
Year�End30�Jun Principle Interest
$ $
2018 1,773,916����������������� 1,731,084�����������
2019 1,663,894����������������� 1,841,106�����������2020 1,557,657����������������� 1,947,343�����������
2021 1,450,684����������������� 2,054,316�����������
2022 1,352,544����������������� 2,152,456�����������
2023�2027 5,512,687����������������� 12,017,312���������
2028�2032 4,064,618����������������� 13,465,383���������
2033�2036 678,918�������������������� 2,826,082�����������
18,054,918�������������� 38,035,082���������
Tax�Increment�Bonds
�Amounts�due�to�the�City�of�Redwood�City��
During� FY� 2004�05,� the� capital� outlay� fund� advanced� $3,000,000� to� the� redevelopment� agency� fund� to�finance�various�downtown�improvements.�During�FY�2008�09�the�Redevelopment�Agency�repaid�$115,622�of�the�advance,�during�FY�2009�10�the�Redevelopment�Agency�repaid�$238,439,�and�during�FY�2010�11�the�Redevelopment� Agency� repaid� $248,364.� During� FY� 2011�12� the� Redevelopment� Agency� was� dissolved�and�the�advance�payable�was�transferred�to�the�successor�agency�private�purpose�trust�fund.�Prior�to�the�dissolution�the�Redevelopment�Agency�repaid�$128,032.�During�FY�2016�17�the�Successor�Agency�repaid�$828,339�to�the�capital�outlay�fund.�
�
83

City�of�Redwood�City�Notes�to�the�Basic�Financial�Statements�For�the�fiscal�year�ended�June�30,�2017
�
�
�NOTE�14�–�DISSOLUTION�OF�THE�REDWOOD�CITY�REDEVELOPMENT�AGENCY�(CONTINUED)�
�During� FY� 2009�10,� the� low� and� moderate� income� housing� fund� advanced� $2,812,838� to� the�redevelopment�agency�fund�to�partially�finance�the�amount�taken�away�from�the�Redevelopment�Agency�by�the�State�of�California.�During�FY�2010�11�the�Redevelopment�Agency�repaid�$562,568�to�the�low�and�moderate� income� housing� fund.� During� FY� 2011�12� the� Redevelopment� Agency� was� dissolved� and� the�advance�receivable�was�transferred�to�the�low�and�moderate�income�housing�asset�fund,�and�the�advance�payable� was� transferred� to� the� successor� agency� private� purpose� trust� fund.� During� FY� 2011�12� the�Successor�Agency�repaid�$562,567�to�the�low�and�moderate�income�housing�asset�fund.�During�FY�2016�17�the�Successor�Agency�repaid�$1,687,703�to�the�low�and�moderate�income�housing�asset�fund.��NOTE�15�–�LITIGATION�AND�CONTINGENT�LIABILITIES�
�The�City�generally� follows�the�practice�of�recording� liabilities�resulting�from�claims�and� legal�actions�only�when�they�become�fixed�or�determinable�in�amount.�
�The� City� is� involved� in� various� lawsuits.� � Although� the� outcome� of� these� lawsuits� is� not� presently�determinable,�it�is�the�opinion�of�management�and�legal�counsel,�that�the�resolution�of�these�matters�will�not�have�a�material�adverse�effect�on�the�City’s�financial�statements.�In�the�opinion�of�the�City�Attorney,�the�City�has�adequate�legal�defenses�and/or�reserves�to�cover�such�liability�if�it�does�arise.��The�City�has�received�various�state�and�federal�funds�for�specific�purposes�that�are�subject�to�review�and�audit� by� the� grantor� agencies.� � Although� such� audits� could� generate� expenditure� disallowances� under�terms�of�the�grants,�it�is�believed�that�any�required�reimbursement�will�not�be�material.�
�NOTE�16�–�CONSTRUCTION,�OTHER�SIGNIFICANT�COMMITMENTS�AND�ENCUMBRANCES�
�As�of�June�30,�2017,�the�City�has�the�following�significant�commitments:�
�$924,826�–�Professional�services�related�to�Planning�Cost�Recovery�$442,722�–�Professional�services�related�to�outsourced�Building�Regulation�and�Code�Enforcement�services�$339,532�–�Professional�services�related�to�the�101/84�Highway�Interchange�project�$337,842�–�Professional�services�related�to�Transportation�Planning�
�Purchase�orders�are�issued�throughout�the�fiscal�year�to�encumber�the�budgets�in�the�governmental�funds.�Following�are�the�outstanding�encumbrances�as�of�June�30,�2017:��
�����������������������������������������������������
Major�Funds: $
General�Fund 1,056,649
Capital�Outlay�Fund 1,713,123
Total�Major�Funds �����������������2,769,772�
Non�Major�Funds �����������������3,497,019�
Total�Encumbrances �����������������6,266,791��
84

City�of�Redwood�City�Notes�to�the�Basic�Financial�Statements�For�the�fiscal�year�ended�June�30,�2017
�
�
�
NOTE�17�–�SOUTH�BAYSIDE�WASTE�MANAGEMENT�AUTHORITY��
The� City� is� a� member� of� the� South� Bayside� Waste� Management� Authority� (SBWMA),� a� joint� powers�authority�established�to�purchase�the�solid�waste�transfer�station�located�in�San�Carlos,�California�from�Browning�Ferris�Industries.�Currently�there�are�12�public�entities�that�are�members�of�this�organization.�Each�of�these�members�also,�by�individual�and�separate�legislative�action,�has�entered�into�a�franchise�agreement�with�Recology�for�solid�waste�collection�within�their�respective�jurisdictions.�
�The� SBWMA� issued� $20� million� in� bonds� in� 1999� to� provide� funds� for� the� purchase� of� the� transfer�station.�The�debt� issued�by� the�SBWMA� is�not�an�obligation�of�any�of� the�member�entities.�During�FY�2009�10,� SBWMA� issued� $58.5� million� in� bonds� to� finance� improvements� at� the� solid� waste� transfer�station,�and�the�remaining�balance�of�the�1999�bonds�were�retired.�
�The�SBWMA�also�serves�as�a�regional�forum�for�member�entities�to�collectively�pursue�other�solid�waste�management� matters� such� as� rate� setting,� solid� waste� reduction,� and� meeting� recycling� goals� as�required�by�state�law.�
�Audited�financial�statements�are�available�from�the�SBWMA,�c/o�the�City�of�San�Carlos,�600�Elm�Street,�San�Carlos,�CA�94070.�The�following�is�SBWMA’s�condensed�unaudited�financial�results�for�the�fiscal�year�ended�June�30,�2017:��
$
Total�assets 75,297,751�������������
Total�liabilities 53,647,487�������������Total�net�position 21,650,264�������������
��
NOTE�18�–�RELATED�PARTY�TRANSACTIONS��
In� June� 2000,� the� City’s� former� Redevelopment� Agency� authorized� a� First� Time� Homebuyer� Program�targeted� to� City� employees� and� school� teachers� from� the� Redwood� City� Elementary� School� District.�Under�the�program,�the�Agency�offered�first�time�homebuyers�financial�assistance�in�the�purchase�of�a�home�within�the�City�of�Redwood�City.�These�loans�bear�no�interest�and�are�secured�by�third�deeds�of�trust� on� the� property.� No� payments� are� due� until� five� years� after� the� date� of� purchase.� This� loan�program�is�extended�to�City�employees�who�meet�the�criteria�of�the�program.�As�of�June�30,�2017,�one�employee�had�a�loan�due�to�the�City�in�the�amount�of�$31,322.�
���
85

�
��
��
NOTE�1�–�BUDGETS�AND�BUDGETARY�ACCOUNTING��
Formal�budgetary�integration�is�employed�as�a�management�control�device�during�the�year�for�the�general�fund,�special�revenue�funds,�debt�service�funds,�and�capital�projects�funds.�
�Budgets�are�adopted�on�a�basis�consistent�with�generally�accepted�accounting�principles�(GAAP)�for�the�general,�special�revenue,�and�debt�service�funds.�Capital�projects�funds’�budgets�are�adopted�on�a�project�length�basis�and�are�not�presented�here.�As�the�Housing�Legal�Aid�Society�Fund�was�created�after� the�February�1,�2012�dissolution�of�the�former�Redevelopment�Agency�and�is�currently�under�litigation,�there�is�no�adopted�budget�for�this�fund.�
�The�City�Manager�submits�a�recommended�operating�budget�in�May�each�year�to�the�City�Council�for�the�fiscal�year�commencing�the�following�July�1,�showing�proposed�expenditures�by�programs�and�the�means�of�financing�them.�
�The�City�Council�conducts�budget�study�sessions,�which�are�open�for�public�comment,�before�adopting�the�budget.�Once�the�budget�is�adopted,�expenditures�may�not�legally�exceed�appropriations�at�program�level�except�when�the�excess�is�attributable�to�a�particular�activity�for�which�the�City�has�been�reimbursed.�This�is�especially�apparent�in�the�Community�Development�Program�where�developers�reimburse�the�City�through�sub�division�fees�and�environmental�impact�report�fees.�
�At�the�request�of�the�department�head�through�the�City�Manager,�the�City�Council�may,�by�resolution,�transfer� appropriations� between� sub�programs� and� funds.� Any� increase� or� decrease� to� the� total�appropriations�provided�for�in�the�budget�must�also�be�carried�through�by�resolution�passed�by�the�City�Council.�The�City�Manager�may�authorize�the�transfer�of�funds�between�object�categories�within�a�sub��program�of�a�department.�The�adoption�and�administration�of�the�Port�of�Redwood�City�budget,�unless�property�tax�revenues�are�requested,�is�exclusively�under�the�control�of�the�Board�of�Port�Commissioners.�
�Budgeted�amounts�are�as�originally�adopted,�or�as�amended�by�the�City�Council�during�the�fiscal�year.�Individual�amendments�were�not�material�in�relation�to�the�original�appropriations.�
�All�unexpended�appropriations�lapse�at�the�end�of�the�fiscal�year.�Appropriations�for�capital�projects�or�appropriations�that�are�encumbered�are�re�appropriated�and�carried�over�in�the�following�year’s�budget.���
�REQUIRED�SUPPLEMENTARY�INFORMATION�
86

CITY�OF�REDWOOD�CITY,�CALIFORNIAGENERAL�FUND
SCHEDULE�OF�REVENUES,�EXPENDITURESAND�CHANGES�IN�FUND�BALANCES
BUDGET�AND�ACTUALFOR�THE�FISCAL�YEAR�ENDED�JUNE�30,�2017
Variance�withBudgeted�Amounts Final�Budget
PositiveOriginal� Final Actual�Amounts (Negative)
$ $ $ $Fund�balance,�July�1 28,438,071 28,438,071 28,438,071
Resources�(inflows):Property�taxes/special�assessments 47,237,938 50,266,640 52,433,667 2,167,027Sales�and�other�taxes 44,657,817 44,410,305 43,966,255 (444,050)Licenses�and�permits 2,886,000 3,316,000 2,806,816 (509,184)Fines,�forfeitures�and�penalties 704,000 689,000 822,066 133,066Use�of�money�and�property 4,694,619 4,694,619 4,682,075 (12,544)Intergovernmental 3,618,339 4,677,928 5,758,016 1,080,088Charges�for�current�services 15,568,456 16,469,228 18,101,567 1,632,339Contributions 144,433 278,923 134,490Other 1,199,077 1,199,077 773,303 (425,774)
Amounts�available�for�appropriation 120,566,246 125,867,230 129,622,688 3,755,458
Charges�to�appropriations�(outflows):
Current�Operations:City�Council:
City�Council 340,779 340,779 323,447 17,332Human�Services�Assistance 59,800 159,800 59,847 99,953
Total�City�Council 400,579 500,579 383,294 117,285
City�Manager:Management/Policy�execution/
Organizational�Efficiencies 1,109,222 1,109,222 925,225 183,997Communications/Community�Engagement 1,018,277 1,018,277 1,039,045 (20,768)Economic�development 401,629 401,629 346,145 55,484
Total�City�Manager 2,529,128 2,529,128 2,310,415 218,713
City�Attorney 1,833,705 1,833,705 1,579,927 253,778
City�Clerk:City�Clerk 719,599 742,080 717,582 24,498Elections 66,791 96,791 53,309 43,482Council�support 35,357 35,357 67,512 (32,155)
Total�City�Clerk 821,747 874,228 838,403 35,825
(Continued)
87

CITY�OF�REDWOOD�CITY,�CALIFORNIAGENERAL�FUND
SCHEDULE�OF�REVENUES,�EXPENDITURESAND�CHANGES�IN�FUND�BALANCES
BUDGET�AND�ACTUALFOR�THE�FISCAL�YEAR�ENDED�JUNE�30,�2017
Variance�withBudgeted�Amounts Final�Budget
PositiveOriginal� Final Actual�Amounts (Negative)
$ $ $ $
Community�development:Planning 1,425,268 1,438,268 1,648,540 (210,272)Strategic�planning 736,498 736,498 822,106 (85,608)Building�regulation 2,802,999 3,262,999 2,554,115 708,884Administration 305,747 305,747 1,038,038 (732,291)General�engineering 355,179 355,179 334,066 21,113Subdivision�engineering 515,752 515,752 524,298 (8,546)Code�enforcement 1,036,610 1,436,610 1,168,808 267,802Redevelopment 709,046 809,046 977,550 (168,504)
Total�Community�Development 7,887,099 8,860,099 9,067,521 (207,422)
Finance:Financial�services 1,497,559 1,510,759 1,546,051 (35,292)Administrative�support�services 1,254,393 1,254,393 1,358,394 (104,001)Public�Financing�Authority�lease�payments 744,678 744,678 771,053 (26,375)
Total�Finance 3,496,630 3,509,830 3,675,498 (165,668)
Fire:Administration 1,151,712 1,181,069 1,180,955 114Operations 19,046,641 19,457,160 19,383,098 74,062San�Carlos�Fire 7,063,107 7,063,107 7,011,007 52,100Prevention 1,076,272 1,063,455 987,891 75,564Training 284,037 320,409 321,698 (1,289)Emergency�medical�services 29,155 29,155 26,596 2,559Emergency�operations 131,757 213,220 206,509 6,711
Total�Fire 28,782,681 29,327,575 29,117,754 209,821
Human�Resources 1,525,132 1,527,632 1,413,384 114,248
Library:Administrative�services�unit 1,577,730 1,577,730 1,483,695 94,035Downtown�library 3,425,546 3,527,231 3,613,743 (86,512)Literacy�services�unit 1,155,175 1,360,633 1,457,742 (97,109)Neighborhood�libraries�and�outreach 2,290,770 2,334,009 2,340,256 (6,247)
Total�Library 8,449,221 8,799,603 8,895,436 (95,833)
(Continued)
88

CITY�OF�REDWOOD�CITY,�CALIFORNIAGENERAL�FUND
SCHEDULE�OF�REVENUES,�EXPENDITURESAND�CHANGES�IN�FUND�BALANCES
BUDGET�AND�ACTUALFOR�THE�FISCAL�YEAR�ENDED�JUNE�30,�2017
Variance�withBudgeted�Amounts Final�Budget
PositiveOriginal� Final Actual�Amounts (Negative)
$ $ $ $
Parks,�Recreation�and�Community�Services:Human�Services 1,403,556 1,554,106 1,548,858 5,248Administration 960,445 1,034,217 1,115,755 (81,538)Civic�Cultural�Commission 58,896 58,896 58,668 228Landscape�maintenance 4,832,202 4,832,202 4,794,297 37,905Youth�and�teen�services 2,743,130 2,806,130 2,935,660 (129,530)Sports�and�aquatics 2,425,268 2,425,268 2,534,071 (108,803)Special�interest�programming/marketing 1,640,867 1,685,300 1,937,590 (252,290)Community�services 1,691,609 1,691,609 1,720,053 (28,444)
Total�Parks,�Recreation�and����Community�Services 15,755,973 16,087,728 16,644,952 (557,224)
Police:Administration 7,881,321 7,881,321 7,839,014 42,307Records 1,158,185 1,158,185 1,000,142 158,043Training 618,585 618,585 667,171 (48,586)Property/Evidence 348,007 348,007 345,678 2,329Police�Activities�League 128,235 128,235 101,286 26,949Patrol�services 24,132,544 24,274,544 22,558,950 1,715,594Criminal�investigation 5,391,571 5,391,571 6,312,753 (921,182)
Total�Police 39,658,448 39,800,448 38,824,994 975,454
Public�Works:Street�system�maintenance 296,932 296,932 303,344 (6,412)Street�cleaning 256,192 256,192 257,380 (1,188)Sidewalk�maintenance/Replacement 21,592 21,592 21,592Street�tree�maintenance 837,865 922,865 969,334 (46,469)Downtown/Entry�feature�maintenance 31,889 31,889 32,224 (335)Storm�water�collection/Disposal 16,566 16,566 17,268 (702)
Total�Public�Works 1,461,036 1,546,036 1,601,142 (55,106)
Reimbursement�from�Other�Funds (2,210,734) (2,210,734) (2,210,734)
Total�charges�to�appropriations 110,390,645 112,985,857 112,141,986 843,871
OTHER�FINANCING�SOURCES�(USES)Transfers�in 550,564 650,564 716,554 65,990Transfers�(out) (10,685,762) (13,968,962) (14,262,818) (293,856)
Total�Other�Financing�Sources�(Uses) (10,135,198) (13,318,398) (13,546,264) (227,866)
Fund�balance,�June�30 28,478,474 28,001,046 32,372,509 4,371,463
89

NOTE�2�–�DEFINED�BENEFIT�PENSION�PLANS
A.�Schedule�of�Changes�in�Net�Pension�Liability�and�Related�Ratios�During�the�Measurement�Period
Miscellaneous�Plan
Measurement�Period(1)
2015�16 2014�15 2013�14
TOTAL�PENSION�LIABILITY
Service�Cost 4,988,704$�������� 4,787,766$�������� 4,962,237$��������
Interest 20,902,896�������� 19,792,491�������� 18,925,939��������
Changes�of�Benefit�Terms ������������������������ ���������������������������� ����������������������������
Difference�Between�Expected�and�Actual�Experience 2,720,291���������� (546,244)������������ ����������������������������
Changes�of�Assumptions ������������������������ (4,797,291)��������� ����������������������������
Benefit�Payments,�Including�Refunds�of�Employee�Contributions (13,150,802)������� (12,621,036)������� (11,534,695)�������
Net�Change�in�Total�Pension�Liability 15,461,089�������� 6,615,686���������� 12,353,481��������
Total�Pension�Liability���Beginning 274,601,243������ 267,985,557������ 255,632,076������
Total�Pension�Liability���Ending�(a) 290,062,332$��� 274,601,243$��� 267,985,557$���
PLAN�FIDUCIARY�NET�POSITION
Contributions���Employer 7,063,347$�������� 6,882,313$�������� 6,449,302$��������
Contributions���Employee 2,605,290���������� 2,372,657���������� 2,592,457����������
Net�Investment�Income(2)
1,020,359���������� 4,413,116���������� 29,955,563��������
Benefit�Payments,�Including�Refunds�of�Employee�Contributions (13,150,802)������� (12,621,036)������� (11,534,695)�������
Other�Changes�in�Fiduciary�Net�Position (112,373)������������ (205,162)������������ ����������������������������
Net�Change�in�Fiduciary�Net�Position (2,574,179)��������� 841,888�������������� 27,462,627��������
Plan�Fiduciary�Net�Position���Beginning 198,433,873������ 197,591,985������ 170,129,358������
Plan�Fiduciary�Net�Position���Ending�(b) 195,859,694$��� 198,433,873$��� 197,591,985$���
Plan�Net�Position�Liability/(Asset)���Ending�(a)���(b) 94,202,638$������ 76,167,370$������ 70,393,572$������
Plan�Fiduciary�Net�Position�as�a�Percentage�of�the�Total�Pension�Liability 67.52% 72.26% 73.73%
Covered�Payroll 31,484,407$������ 28,944,841$������ 28,592,551$������
Plan�Net�Pension��Liability/(Asset)�as�a�Percentage�of�Covered�Payroll 299.20% 263.15% 246.20%
(1)��Historical�information�is�required�only�for�measurement�periods�for�which�GASB�68�is�applicable.(2)��Net�of�administrative�expenses.
REQUIRED�SUPPLEMENTARY�INFORMATION
90
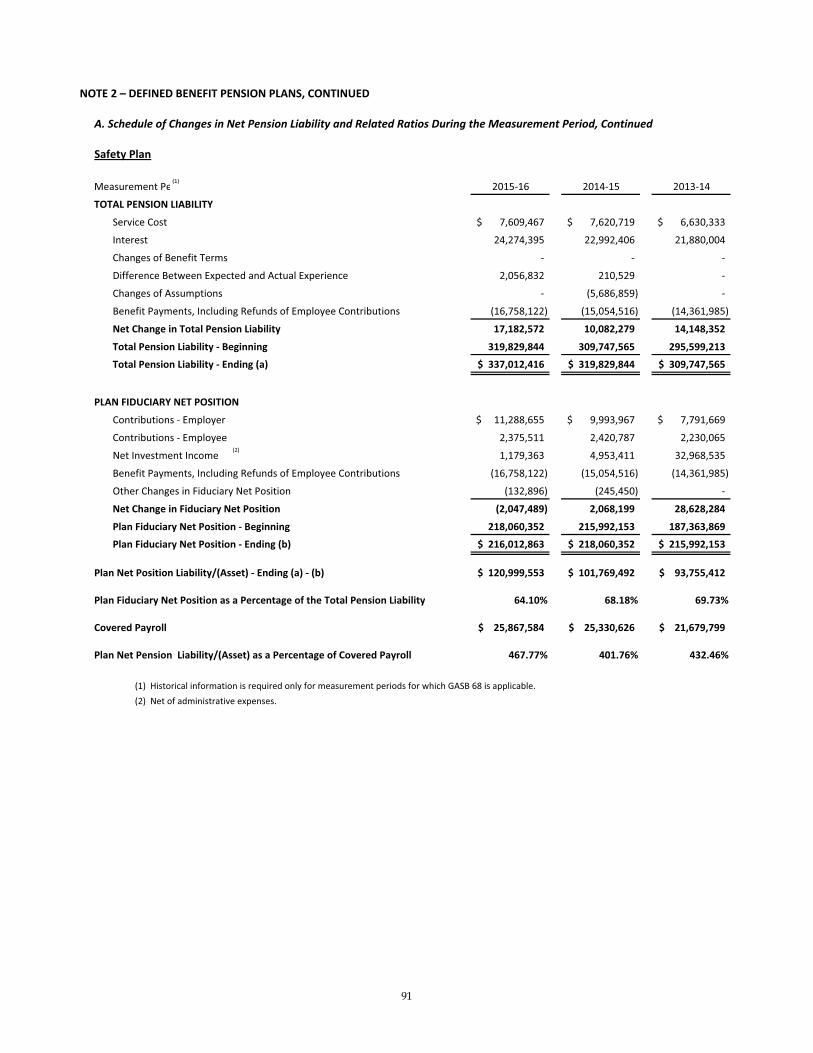
NOTE�2�–�DEFINED�BENEFIT�PENSION�PLANS,�CONTINUED
A.�Schedule�of�Changes�in�Net�Pension�Liability�and�Related�Ratios�During�the�Measurement�Period,�Continued
Safety�Plan
Measurement�Pe(1)
2015�16 2014�15 2013�14
TOTAL�PENSION�LIABILITY
Service�Cost 7,609,467$�������� 7,620,719$�������� 6,630,333$��������
Interest 24,274,395�������� 22,992,406�������� 21,880,004��������
Changes�of�Benefit�Terms ���������������������������� ���������������������������� ����������������������������
Difference�Between�Expected�and�Actual�Experience 2,056,832���������� 210,529�������������� ����������������������������
Changes�of�Assumptions ���������������������������� (5,686,859)��������� ����������������������������
Benefit�Payments,�Including�Refunds�of�Employee�Contributions (16,758,122)������� (15,054,516)������� (14,361,985)�������
Net�Change�in�Total�Pension�Liability 17,182,572�������� 10,082,279�������� 14,148,352��������
Total�Pension�Liability���Beginning 319,829,844����� 309,747,565����� 295,599,213�����
Total�Pension�Liability���Ending�(a) 337,012,416$��� 319,829,844$��� 309,747,565$���
PLAN�FIDUCIARY�NET�POSITION
Contributions���Employer 11,288,655$������ 9,993,967$�������� 7,791,669$��������
Contributions���Employee 2,375,511���������� 2,420,787���������� 2,230,065����������
Net�Investment�Income(2)
1,179,363���������� 4,953,411���������� 32,968,535��������
Benefit�Payments,�Including�Refunds�of�Employee�Contributions (16,758,122)������� (15,054,516)������� (14,361,985)�������
Other�Changes�in�Fiduciary�Net�Position (132,896)������������ (245,450)������������ ����������������������������
Net�Change�in�Fiduciary�Net�Position (2,047,489)��������� 2,068,199���������� 28,628,284��������
Plan�Fiduciary�Net�Position���Beginning 218,060,352����� 215,992,153����� 187,363,869�����
Plan�Fiduciary�Net�Position���Ending�(b) 216,012,863$��� 218,060,352$��� 215,992,153$���
Plan�Net�Position�Liability/(Asset)���Ending�(a)���(b) 120,999,553$��� 101,769,492$��� 93,755,412$�����
Plan�Fiduciary�Net�Position�as�a�Percentage�of�the�Total�Pension�Liability 64.10% 68.18% 69.73%
Covered�Payroll 25,867,584$����� 25,330,626$����� 21,679,799$�����
Plan�Net�Pension��Liability/(Asset)�as�a�Percentage�of�Covered�Payroll 467.77% 401.76% 432.46%
(1)��Historical�information�is�required�only�for�measurement�periods�for�which�GASB�68�is�applicable.(2)��Net�of�administrative�expenses.
91

NOTE�2�–�DEFINED�BENEFIT�PENSION�PLANS,�CONTINUED
B.�Schedule�of�Plan�Contributions
Miscellaneous�Plan2016�17 (1) 2015�16 2014�15
Actuarially�determined�contribution 7,428,605$��������������������� 6,923,087$����������������������� 6,799,358$�������������Contribution�in�relation�to�the�actuariallydetermined�contributions (7,428,605)��������������������� (6,923,087)����������������������� (6,799,358)��������������Contribution�deficiency�(excess) �$��������������������������������� �$������������������������������������ �$�������������������������
Covered�payroll 34,756,799�������������������� 31,484,407���������������������� 28,944,841�������������
Contributions�as�a�percentage�of�covered�payroll 21.37% 21.66% 23.49%
Safety�Plan2016�17 (1) 2015�16 2014�15
Actuarially�determined�contribution 10,292,946$������������������ 10,439,692$��������������������� 9,667,759$�������������Contribution�in�relation�to�the�actuariallydetermined�contributions (10,292,946)������������������ (10,439,692)�������������������� (9,667,759)��������������Contribution�deficiency�(excess) �$��������������������������������� �$������������������������������������ �$�������������������������
Covered�payroll 27,341,479�������������������� 25,867,584���������������������� 25,330,626�������������
Contributions�as�a�percentage�of�covered�payroll 38% 40.36% 38.17%
(1)�Historial�information�is�required�only�for�measurement�periods�for�which�GASB�68�is�applicable.
Notes�to�SchedulesMiscellaneous�Plan Safety�Plan
Actuarial�cost�method Entry�Age�Normal Entry�Age�Normal
Amortization�method Level�percentage�of�payroll Level�percentage�of�payroll
Remaining�amortization�period 21�Years�as�of�valuation�date 29�Years�as�of�valuation�date
Asset�valuation�method 15�year�smoothed�market 15�year�smoothed�market
Inflation 2.75% 2.75%
Salary�increasesPayroll�growthInvestment�rate�of�return 7.50%,�net�of�pension�plan�investment�expense;�including�inflation
Retirement�age
Mortality
The�probabilities�of�retirement�are�based�on�the�2010�
The�probabilities�of�mortality�are�based�on�the�2010�CalPERS�
Varies�by�Entry�Age�and�Service3.00%
92

NOTE�3�–�OTHER�POST�EMPLOYMENT�BENEFITS�(OPEB)
A�schedule�of�funding�progress�for�the�past�three�actuarial�valuations�is�presented�below.
City�of�Redwood�City
UnfundedActuarial�
Unfunded Liability�as�Actuarial Actuarial Actuarial� Actuarial� Percentage�of�Valuation Asset Accrued� Accrued� Funded Covered Covered
Date�* Value Liability Liability Ratio Payroll�** Payroll
2011 4,429,000$������ 53,083,000$��� 48,654,000$��� 0.0% 44,961,408$��� 108.2%����������������2013 11,001,000$��� 56,177,000$��� 45,176,000$��� 19.6% 48,399,901$��� 93.3%������������������2015 18,382,000$��� 70,852,000$��� 52,470,000$��� 25.9% 51,466,341$��� 102.0%����������������
*��Based�on�the�most�recent�actuarial�valuation�available**�Annual�payroll�of�active�employees�covered�by�the�plan
Port�of�Redwood�CityUnfundedActuarial�
Unfunded Liability�as�Actuarial Actuarial Actuarial� Actuarial� Percentage�of�Valuation Asset Accrued� Accrued� Funded Covered Covered
Date�* Value Liability Liability Ratio Payroll�** Payroll
7/1/2011 �$���������������������� 334,371$��������� 334,371$��������� 0.0% 631,539$��������� 52.9%������������������7/1/2013 �$���������������������� 349,824$��������� 349,824$��������� 0.0% 636,746$��������� 54.9%������������������7/1/2015 �$���������������������� 565,987$��������� 565,987$��������� 0.0% 645,077$��������� 87.7%������������������
*��Based�on�the�most�recent�actuarial�valuation�available**�Annual�payroll�of�active�employees�covered�by�the�plan
93
�
�������������
������
City�of�Redwood�City�Comprehensive�Annual�Financial�Report�
June�30,�2017�� �
94

�
�
�GENERAL�FUND�
���The�general�fund�accounts�for�resources�traditionally�associated�with�governments�that�are�not�required�to�be�accounted�for�in�another�fund.��Library�operations,�whose�expenditures�must�be�approved�by�the�Library�Board,�are�accounted�for�as�part�of�this�fund�along�with�the�general�governmental�expenditures�not�accounted�for�in�other�funds.���
�
�
�
�
�
�
�
�
�
�
�
�
�
�
�
�
�
�
�
�
�
�
�
95

CITY�OF�REDWOOD�CITY,�CALIFORNIAGENERAL�FUND
COMPARATIVE�BALANCE�SHEETJUNE�30,�2017�AND�2016
2017 �� ���� 2016ASSETS $ $
Cash�and�investments�available�for�operations 40,428,443 35,852,795Receivables�(net�of�allowance�for�uncollectibles):����Taxes�and�assessments���current 6,269,171 9,141,396����Accounts 1,884,492 1,643,694����Loans 1,035,949 1,205,478����Accrued�interest 640,653 279,016����Due�from�other�governmental�agencies 3,553,792 3,122,201Due�from�other�funds 373,981Prepaid�expenditures 95,865 86,385
����Total�Assets 54,282,346 51,330,965
LIABILITIES��Accounts�payable 3,701,631 3,984,399��Accrued�payroll 2,374,210 4,352,304��Deposits�payable 8,930,525 7,720,787��Due�to�other�funds 839,137 503,870��Unearned�revenue 6,028,080 6,301,397��Accrued�sick�leave�and�vacation���current 36,254 30,137
����Total�Liabilities 21,909,837 22,892,894
FUND�BALANCE
Nonspendable:���Loans 1,035,949 1,205,478���Inventory���Prepaid�items 95,865 86,385Restricted�for:��Other�purposes 96,338 96,338Committed�to:���General�plan 837,563 837,563Assigned�to:���Other�purposes 884,838 978,967Unassigned:���City�Council�directed�minimum�balance 18,279,679 22,644,769���Residual�balance 11,142,277 2,588,571
����Total�Fund�Balance 32,372,509 28,438,071
����Total�Liabilities�and�Fund�Balance 54,282,346 51,330,965
96

CITY�OF�REDWOOD�CITY,�CALIFORNIAGENERAL�FUND
COMPARATIVE�SCHEDULE�OF�REVENUES,�EXPENDITURES,�AND�CHANGES�IN�FUND�BALANCESBUDGET�(GAAP�BASIS)�AND�ACTUAL
FOR�THE�FISCAL�YEARS�ENDED�JUNE�30,�2017�AND�2016������������������������������������������������������
2017 ������ 2016 �������Variance�with �Variance�withFinal�Budget Final�Budget
Positive Positive���Budget���� ����Actual���� (Negative) ����Budget���� ����Actual���� (Negative)
REVENUES $ $ $ $ $ $��Property�taxes 50,266,640 52,433,667 2,167,027 43,718,163 47,851,873 4,133,710��Sales�and�other�taxes 44,410,305 43,966,255 (444,050) 43,982,092 44,186,332 204,240��Licenses�and�permits 3,316,000 2,806,816 (509,184) 2,398,000 2,272,333 (125,667)��Fines,�forfeitures�and�penalties 689,000 822,066 133,066 636,000 767,857 131,857��Uses�of�money�and�property 4,694,619 4,637,547 (57,072) 248,500 488,369 239,869��Net�increases�(decreases)�in�fair�value�of�investments � 44,528 44,528 � 81,346 81,346��Intergovernmental 4,677,928 5,758,016 1,080,088 5,416,470 5,475,525 59,055��Charges�for�current�services 16,469,228 18,101,567 1,632,339 15,792,237 16,280,079 487,842��Other 1,343,510 1,052,226 (291,284) 808,362 1,031,302 222,940
����Total�revenues 125,867,230 129,622,688 3,755,458 112,999,824 118,435,016 5,435,192
EXPENDITURES��Community�development 8,860,099 9,067,521 (207,422) 8,346,775 8,330,099 16,676��Human�services 1,713,906 1,608,705 105,201 1,512,878 1,524,187 (11,309)��Public�safety 69,128,023 67,942,748 1,185,275 64,852,309 64,498,662 353,647��Transportation 1,241,389 1,294,270 (52,881) 321,249 290,747 30,502��Environmental�support�and�protection 304,647 306,872 (2,225) 276,679 245,121 31,558��Leisure,�cultural,�and�information�services 23,333,225 23,991,530 (658,305) 23,128,264 23,131,471 (3,207)��Policy�development�and�implementation 8,404,568 7,930,340 474,228 4,774,147 3,663,652 1,110,495
����Total�expenditures 112,985,857 112,141,986 843,871 103,212,301 101,683,939 1,528,362
EXCESS�(DEFICIENCY)�OF�REVENUES�OVER���(UNDER)�EXPENDITURES 12,881,373 17,480,702 4,599,329 9,787,523 16,751,077 6,963,554
OTHER�FINANCING�SOURCES�(USES)��Transfers�in 650,564 716,554 65,990 520,993 527,271 6,278��Transfers�(out) (13,968,962) (14,262,818) (293,856) (17,711,223) (17,445,633) 265,590
����Total�Other�Financing�Sources�(Uses) (13,318,398) (13,546,264) (227,866) (17,190,230) (16,918,362) 271,868
EXCESS�(DEFICIENCY)�OF�REVENUES�AND��OTHER�SOURCES�OVER�(UNDER)���EXPENDITURES�AND�OTHER�USES (437,025) 3,934,438 4,371,463 (7,402,707) (167,285) 7,235,422
Fund�balance�at�beginning�of�fiscal�year 28,438,071 28,605,356
Fund�balance�at�end�of�fiscal�year 32,372,509 28,438,071
97

CITY�OF�REDWOOD�CITY,�CALIFORNIAGENERAL�FUND
SCHEDULE�OF�REVENUES�COMPARED�WITH�BUDGET�(GAAP�BASIS)�AND�ACTUALFOR�THE�FISCAL�YEAR�ENDED�JUNE�30,�2017
WITH�COMPARATIVE�AMOUNTS�FOR�THE�FISCAL�YEAR�ENDED�JUNE�30,�2016����
2017Variance�withFinal�Budget
Positive 2016���Budget���� Actual (Negative) Actual
Property�Taxes: $ $ $ $��Property�taxes���secured�and�unsecured 50,266,640 52,433,667 2,167,027 47,851,873
����Total�Property�Taxes 50,266,640 52,433,667 2,167,027 47,851,873
Sales�and�Other�Taxes:��Sales�tax 23,115,000 22,289,163 (825,837) 22,778,475��Franchises 1,831,600 1,904,813 73,213 1,893,634��Transient�occupancy�tax 6,864,770 6,552,893 (311,877) 6,451,477��Property�transfer�tax 675,000 809,638 134,638 946,259��Business�license�tax 2,370,800 2,581,968 211,168 2,483,708��Utility�users�tax 9,553,135 9,827,780 274,645 9,632,779
����Total�Sales�and�Other�Taxes 44,410,305 43,966,255 (444,050) 44,186,332
Licenses�and�Permits:��Building�permits 3,310,000 2,802,609 (507,391) 2,268,773��Fire�and�other�permits����������������������������� 6,000 4,207 (1,793) 3,560
����Total�Licenses�and�Permits 3,316,000 2,806,816 (509,184) 2,272,333
Fines,�Forfeitures�and�Penalties:��Parking�fines��������������������������������������� 689,000 822,066 133,066 767,857
����Total�Fines,�Forfeitures�and�Penalties 689,000 822,066 133,066 767,857
Uses�of�Money�and�Property: ���Right�of�way�rent 4,127,619 4,127,619��Rent�and�concessions 467,000 277,088 (189,912) 228,567��Interest�income 100,000 232,840 132,840 259,802
����Total�Uses�of�Money�and�Property 4,694,619 4,637,547 (57,072) 488,369
Net�Increase�(Decrease)�in�Fair�Value�of�Investments 44,528 44,528 81,346
Intergovernmental:��Motor�vehicle�in�lieu�tax 58,256 58,256 33,020��Public�safety�sales�tax 680,000 750,082 70,082 734,945��Police�training�allowance 10,000 10,198 198 26,841��Homeowners'�property�tax�relief 175,000 179,590 4,590 178,179��State�mandated�programs�grant 30,338 30,338 150,928��Grants���County,�State,�and�Federal 3,412,928 4,301,664 888,736 3,944,820��Abandoned�vehicle�fees 219 219��Port�contribution 400,000 427,669 27,669 406,792
����Total�Intergovernmental� 4,677,928 5,758,016 1,080,088 5,475,525
Charges�for�Current�Services:��Fire�services������������������������������� 7,157,731 7,145,422 (12,309) 6,834,649��Police�services����������������������������� 155,000 247,908 92,908 313,208��Plan�checking 2,435,000 2,348,883 (86,117) 1,430,244��Garbage�collections���net 2,518,591 2,370,984 (147,607) 2,409,618��Engineering�services��Planning�services 565,000 696,512 131,512 591,745��Library�fees 13,130 13,130 11,319��Recreation�programs 2,612,056 3,666,710 1,054,654 3,141,864��Other�current�service�charges 1,025,850 1,612,018 586,168 1,547,432
����Total�Charges�for�Current�Services 16,469,228 18,101,567 1,632,339 16,280,079
Other:��Contributions 144,433 278,923 134,490 431,924��Miscellaneous 1,199,077 773,303 (425,774) 599,378
����Total�Other 1,343,510 1,052,226 (291,284) 1,031,302
Total�Revenue 125,867,230 129,622,688 3,755,458 118,435,016
98

CITY�OF�REDWOOD�CITY,�CALIFORNIAGENERAL�FUND
SCHEDULE�OF�EXPENDITURES�COMPARED�WITH�BUDGET�(GAAP�BASIS)�AND�ACTUALFOR�THE�FISCAL�YEAR�ENDED�JUNE�30,�2017
WITH�COMPARATIVE�AMOUNTS�FOR�THE�FISCAL�YEAR�ENDED�JUNE�30,�2016
2017�Variance�with ��Final�Budget
Positive 2016Budget Actual (Negative) Actual
Community�Development: $ $ $ $��Community�planning 1,438,268 1,648,540 (210,272) 1,434,604��Strategic�planning 736,498 822,106 (85,608) 205,272��Building�regulation 3,262,999 2,554,115 708,884 2,577,558��Administration�������������������������������������� 305,747 1,038,038 (732,291) 882,614��General�engineering 355,179 334,066 21,113 312,029��Subdivision�engineering 515,752 524,298 (8,546) 434,695��Code�enforcement 1,436,610 1,168,808 267,802 776,281��Redevelopment 809,046 977,550 (168,504) 1,707,046
����Total�Community�Development 8,860,099 9,067,521 (207,422) 8,330,099
Human�Services:��Human�services�assistance�program 159,800 59,847 99,953 34,800��Social�services�center 1,554,106 1,548,858 5,248 1,489,387
����Total�Human�Services 1,713,906 1,608,705 105,201 1,524,187
Public�Safety:��Law�enforcement 39,800,448 38,824,994 975,454 36,635,654��Fire�safety 29,327,575 29,117,754 209,821 27,863,008
����Total�Public�Safety 69,128,023 67,942,748 1,185,275 64,498,662
Transportation:��Street�system/sidewalk�maintenance,�repair 1,241,389 1,294,270 (52,881) 290,747
���Total�Transportation 1,241,389 1,294,270 (52,881) 290,747
Environmental�Support�and�Protection:��Street�cleaning/storm�water�collection,�disposal 304,647 306,872 (2,225) 400,055
���Total�Environmental�Support�and�Protection 304,647 306,872 (2,225) 400,055
Leisure,�Cultural,�and�Information�Services:��Parks�and�recreation 14,533,622 15,096,094 (562,472) 15,079,784��Information�services 8,799,603 8,895,436 (95,833) 8,051,687
����Total�Leisure,�Cultural,�and�Information�Services 23,333,225 23,991,530 (658,305) 23,131,471
Policy�Development�and�Implementation:��Legislative/policy�determination� 340,779 323,447 17,332 325,363��Management/policy�execution 2,529,128 2,310,415 218,713 1,737,727��Legislative�services/records�management 874,228 838,403 35,825 813,378��Financial�services 1,510,759 1,546,051 (35,292) 1,574,113��Legal�services 1,833,705 1,579,927 253,778 2,025,581��Human�Resources 1,527,632 1,413,384 114,248 1,369,595��Other�administrative�support�services��������������� 1,999,071 2,129,447 (130,376) 1,904,803��Less�reimbursements�from�other�funds (2,210,734) (2,210,734) (6,086,908)
�����Total�Policy�Development�and�Implementation����� 8,404,568 7,930,340 474,228 3,663,652
������Total�Expenditures 112,985,857 112,141,986 843,871 101,838,873
99
�
�
NON�MAJOR�GOVERNMENTAL�FUNDS��
�SPECIAL�REVENUE�FUNDS��
Special� revenue� funds�are�used� to�account� for� revenue�derived� from�specific� taxes�or�other�dedicated�revenue�sources�(other�than�for�major�capital�projects)�that�are�restricted�by�law�or�administrative�action�to�expenditures�for�specified�purposes.�
�
Special�Gas�Tax�Street�Improvement�Fund�–�This�fund�accounts�for�revenue�received�from�the�State�of�California�derived�from�gasoline�taxes.��These�funds�may�only�be�used�for�street�purposes�as�specified�in�the�State�of�California�Streets�and�Highway�Code.��
Transportation�Grants� Fund� –�This� fund�accounts� for�grants�and�developer� contributions� received� for�specific�transportation�projects.��
Grants� Fund� –� This� fund� accounts� for� grants� received� for� specific� purposes.� � These� include� funds�received�under�the�Housing�and�Community�Development�Act.��
Traffic� Safety� Fund� –� This� fund� accounts� for� revenues� received� from� traffic� fines� and� used� for� traffic�safety�programs.��
Transportation� Fund� –� This� fund� accounts� for� the� City’s� share� of� special� sales� tax� for� transportation.��Expenditures�from�this�fund�may�only�be�incurred�on�transportation�related�programs.��
Seaport� Landscape� Maintenance� Fund� –� This� fund� accounts� for� funds� to� be� provided� by� property�owners�in�the�Seaport�Boulevard�area�for�maintenance�of�landscaping�on�Seaport�Boulevard.��
Seaport�Centre�Maintenance�Fund�–�This�fund�accounts�for�funds�provided�by�property�owners�in�the�Seaport� Centre� area� for� the� maintenance� and� repair� of� drains� and� sewer� lines� connecting� the� Centre�facilities�to�the�public�facilities.��
Redwood�Shores�Maintenance�Fund�–�This�fund�accounts�for�funds�collected�from�property�owners�in�the�Redwood�Shores�area�for�the�maintenance�of�various�public�areas.��
Redwood�Shores�Landscape�Maintenance�Fund�–�This�fund�accounts�for�funds�collected�from�property�owners�for�landscape�maintenance�of�certain�areas�in�Redwood�Shores.��
Supplemental� Law� Enforcement� Services� Fund� –� This� fund� accounts� for� funds� from� the� State� of�California�“Citizens�Option�for�Public�Safety”�program.��
Traffic� Mitigation� Fees� Fund� –� This� fund� accounts� for� developer� contributions� received� for� general�transportation�projects.��Low�and�Moderate� Income�Housing�Asset�Fund�–�This� fund�accounts� for� the�restricted�and�obligated�balances� (other� than� the� Legal� Aid� Society� balance)� of� the� former� redevelopment� agency� low� and�moderate� income� housing� fund� that� were� transferred� to� the� City� after� the� dissolution� of� the�redevelopment�agency�on�February�1,�2012.��Planning� Cost� Recovery� Fund� –� This� fund� accounts� for� fees� charged� for� reimbursement� of� the�expenditures�associated�with�processing�planning�applications�related�to�major�projects.��Community�Benefits�Fund�–�This�fund�accounts�for�funds�committed�by�the�City�to�enhance�community�programs.���
100

�
SPECIAL�REVENUE�FUNDS�(CONTINUED)��Housing�Legal�Aid�Society�Fund�–�This� fund�accounts� for�revenues�previously�deposited� in� the�former�redevelopment� agency� low� and� moderate� income� housing� fund� pursuant� to� an� agreement� with� the�Legal�Aid�Society�to�set�aside�general�tax�increment�revenue�for�housing�purposes.��After�the�February�1,�2012�dissolution�of� the�redevelopment�agency,� this� fund�was�created�to�account� for� this�accumulated�balance.��DEBT�SERVICE�FUNDS��
Debt�service�funds�are�used�to�account�for�the�payment�of�interest�and�principal�on�general�debt�of�the�City�and�related�entities.��Public�Financing�Authority�2013�Refunding�Lease�Fund�–�This�fund�accounts�for�a�lease�entered�into�to�refund�the�2003�Public�Financing�Authority�bonds.��This�lease�is�secured�by�lease�payment�from�the�City.���
CAPITAL�PROJECTS�FUNDS��
Capital�project�funds�are�established�to�account�for�resources�used�for�the�acquisition�and�construction�of� capital� facilities� by� the� City� except� for� those� financed� by� the� proprietary� funds� or� special� revenue�funds.� �Funding�for�these�projects� is�provided�by�the�general� fund�and�by�special�assessment�districts.�Currently�the�City�has�the�following�funds:��Facilities�Fee�Construction�Fund�–�This�fund�derives�its�revenue�from�fees�collected�from�the�developers�in�the�Redwood�Shores�area.��Funds�are�used�for�improvements�to�roads,�drainage,�water,�traffic�lights,�canals,�etc.�in�the�area.��Parks� Impact�and�In�Lieu�Fee�Fund�–�This� fund�accounts�for�parks� impact�fees�and�Quimby�Act� in� lieu�fees�charged�to�developers�on�new�development�projects,�to�enable�the�City�to�expand�and�improve�its�system�of�parks,�parkland,�and�recreational�facilities�to�provide�services�to�future�development.��Shores�Transportation� Improvement�District�Fund�–�This� fund�accounts� for�community� facility�district�bonds� that� were� issued� and� developer� contributions� that� were� received� by� the� City� to� fund� various�transportation�projects�in�the�Redwood�Shores�area.��One�Marina�Community�Facilities�District�Fund�–�This�fund�accounts�for�certain�public�infrastructure�improvements�within�the�One�Marina�district�that�are�financed�by�community�facilities�district�bonds,�and�developer�contributions.��Art�in�Public�Places�Fund�–�This�fund�accounts�for�revenues�and�expenditures�related�to�the�Art�in�Public�Places�Ordinance.
101
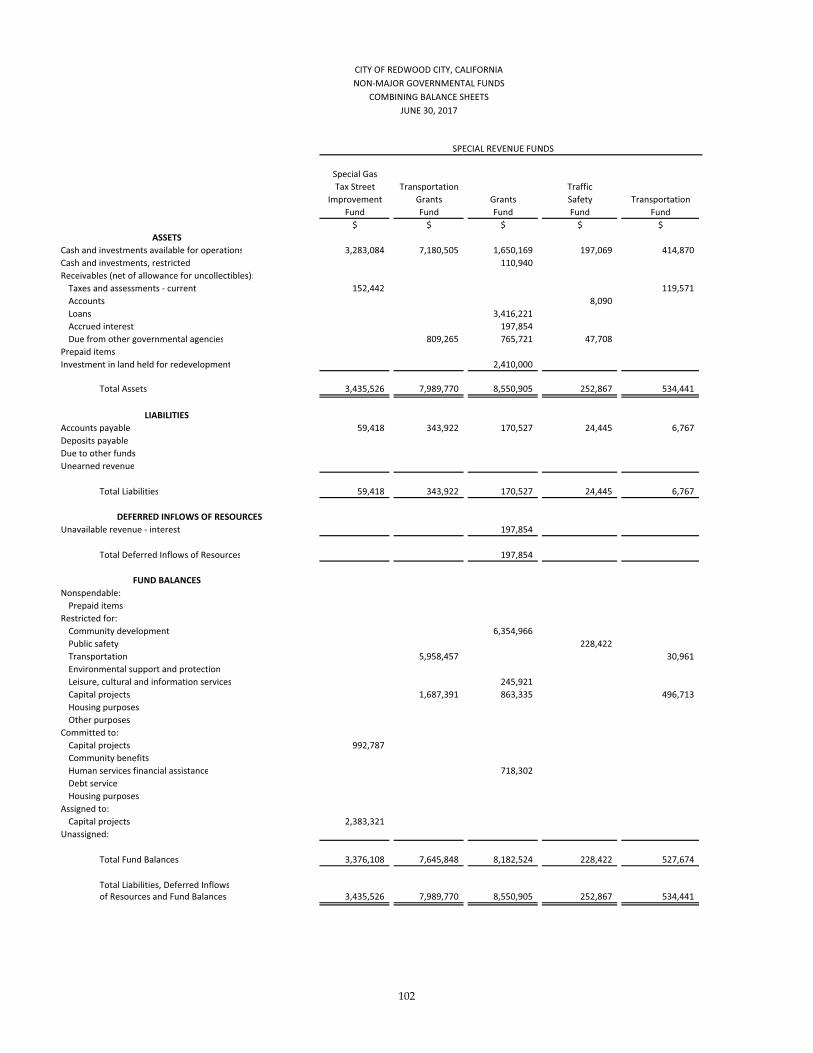
CITY�OF�REDWOOD�CITY,�CALIFORNIANON�MAJOR�GOVERNMENTAL�FUNDS
COMBINING�BALANCE�SHEETSJUNE�30,�2017
SPECIAL�REVENUE�FUNDS
Special�GasTax�Street Transportation Traffic
Improvement Grants Grants Safety TransportationFund Fund Fund Fund Fund
$ $ $ $ $ASSETS
Cash�and�investments�available�for�operations 3,283,084 7,180,505 1,650,169 197,069 414,870Cash�and�investments,�restricted 110,940Receivables�(net�of�allowance�for�uncollectibles):
Taxes�and�assessments���current 152,442 119,571Accounts 8,090Loans 3,416,221Accrued�interest 197,854Due�from�other�governmental�agencies 809,265 765,721 47,708
Prepaid�itemsInvestment�in�land�held�for�redevelopment 2,410,000
Total�Assets 3,435,526 7,989,770 8,550,905 252,867 534,441
LIABILITIESAccounts�payable 59,418 343,922 170,527 24,445 6,767Deposits�payableDue�to�other�fundsUnearned�revenue
Total�Liabilities 59,418 343,922 170,527 24,445 6,767
DEFERRED�INFLOWS�OF�RESOURCESUnavailable�revenue���interest� 197,854
Total�Deferred�Inflows�of�Resources 197,854
FUND�BALANCESNonspendable:
Prepaid�itemsRestricted�for:
Community�development 6,354,966Public�safety 228,422Transportation 5,958,457 30,961Environmental�support�and�protectionLeisure,�cultural�and�information�services 245,921Capital�projects 1,687,391 863,335 496,713Housing�purposesOther�purposes
Committed�to:Capital�projects 992,787Community�benefitsHuman�services�financial�assistance 718,302Debt�serviceHousing�purposes
Assigned�to:Capital�projects 2,383,321
Unassigned:
Total�Fund�Balances 3,376,108 7,645,848 8,182,524 228,422 527,674
Total�Liabilities,�Deferred�Inflowsof�Resources�and�Fund�Balances 3,435,526 7,989,770 8,550,905 252,867 534,441
102

SPECIAL�REVENUE�FUNDS�
Seaport Seaport Redwood Redwood Supplemental TrafficLandscape Centre Shores Shores Law�Enforcement Mitigation
Maintenance Maintenance Maintenance Landscape Services FeesFund Fund Fund Mtc.�Fund Fund Fund
$ $ $ $ $ $
566,722 1,921,117 1,385,916 48,461 121,296 4,775,6134,070,028
13,781
3,922
570,644 1,921,117 1,385,916 48,461 121,296 8,859,422
443 99 46,329 8,949 35,234 227,80311,088
443 99 46,329 8,949 35,234 238,891
3,922
86,0624,072,058
565,255 1,448,883 584,576 39,512
1,024 472,135 755,011 4,548,473
570,201 1,921,018 1,339,587 39,512 86,062 8,620,531
570,644 1,921,117 1,385,916 48,461 121,296 8,859,422
103
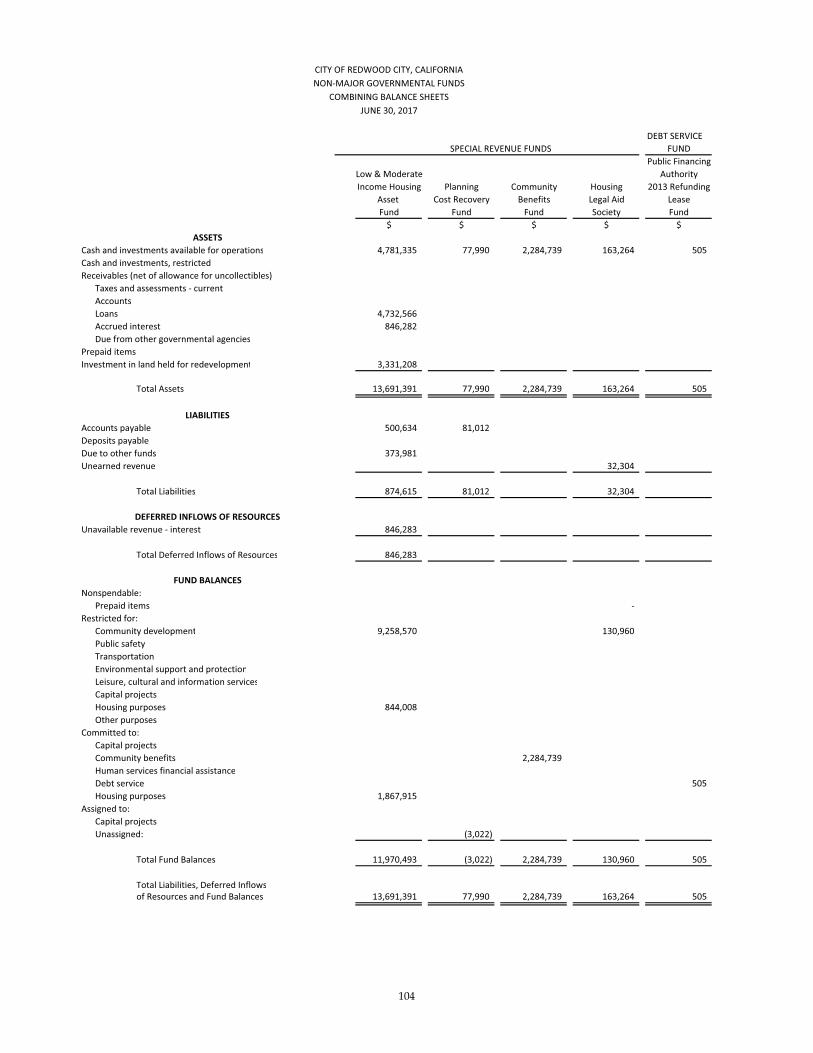
CITY�OF�REDWOOD�CITY,�CALIFORNIANON�MAJOR�GOVERNMENTAL�FUNDS
COMBINING�BALANCE�SHEETSJUNE�30,�2017
DEBT�SERVICESPECIAL�REVENUE�FUNDS FUND
Public�FinancingLow�&�Moderate AuthorityIncome�Housing Planning Community Housing 2013�Refunding
Asset� Cost�Recovery Benefits Legal�Aid LeaseFund Fund Fund Society Fund
$ $ $ $ $ASSETS
Cash�and�investments�available�for�operations 4,781,335 77,990 2,284,739 163,264 505Cash�and�investments,�restrictedReceivables�(net�of�allowance�for�uncollectibles):
Taxes�and�assessments���currentAccountsLoans 4,732,566Accrued�interest 846,282Due�from�other�governmental�agencies
Prepaid�itemsInvestment�in�land�held�for�redevelopment 3,331,208
Total�Assets 13,691,391 77,990 2,284,739 163,264 505
LIABILITIESAccounts�payable 500,634 81,012Deposits�payableDue�to�other�funds 373,981Unearned�revenue 32,304��������������
Total�Liabilities 874,615 81,012 32,304
DEFERRED�INFLOWS�OF�RESOURCESUnavailable�revenue���interest� 846,283
Total�Deferred�Inflows�of�Resources 846,283
FUND�BALANCESNonspendable:
Prepaid�items ���������������������������Restricted�for:
Community�development 9,258,570 130,960������������Public�safetyTransportationEnvironmental�support�and�protectionLeisure,�cultural�and�information�servicesCapital�projectsHousing�purposes 844,008Other�purposes
Committed�to:Capital�projectsCommunity�benefits 2,284,739Human�services�financial�assistanceDebt�service 505Housing�purposes 1,867,915
Assigned�to:Capital�projectsUnassigned: (3,022)
���Total�Fund�Balances 11,970,493 (3,022) 2,284,739 130,960 505
Total�Liabilities,�Deferred�Inflowsof�Resources�and�Fund�Balances 13,691,391 77,990 2,284,739 163,264 505
104

CAPITAL�PROJECTS�FUNDSOne�Marina Total
Parks�Impact Shores Community Art�in�Facilities�Fee and�In�Lieu Transportation Facilities Public NonmajorConstruction Fee Improvement District Places Governmental
Fund Fund District�Fund Fund Fund Funds$ $ $ $ $ $
423,592 19,765,742 594,700 1,232,954 1,623 50,871,2664,180,968
272,0138,090
8,148,7871,057,9171,622,694
3,9225,741,208
423,592 19,765,742 594,700 1,232,954 1,623 71,906,865
283,857 250 1,789,68911,088
373,98132,304
283,857 250 2,207,062
1,044,137
1,044,137
3,922
15,744,496314,484
10,061,4762,638,226
17,900,813 18,146,73469,541 1,581,072 96,372 10,571,067
844,008354,051 354,051
498,328 1,232,954 1,373 2,725,4422,284,739
718,302505
1,867,915
2,383,321(3,022)
423,592 19,481,885 594,700 1,232,954 1,373 68,655,666
423,592 19,765,742 594,700 1,232,954 1,623 71,906,865
105

SPECIAL�REVENUE�FUNDS
Special�Gas � � � �Tax�Street Transportation � Traffic �
Improvement Grants Grants Safety TransportationFund Fund Fund Fund Fund
$ $ $ $ $REVENUES
Property�taxes/special�assessmentsSales�and�other�taxes 71,498Licenses�and�permitsFines,�forfeitures�and�penalties 167,545Use�of�money�and�property (10,925) 45,826 47,151 (3,470) 42,738Intergovernmental 1,704,348 1,046,718 1,125,115 1,714,942Contributions 1,311,476 47,198Charges�for�current�services 44,097 175,951Other 479 4,532
Total�Revenues 1,737,520 2,404,020 1,172,745 344,558 1,876,376
EXPENDITURESCurrent�Operations:
Community�development�� 697,670 148,343Human�services 100,000Public�safety�Transportation 2,353,760 382,954 1,636,048 1,480,655Environmental�support�and�protection 400,055 299,677 3,255Leisure,�cultural�and�information�servicesPolicy�development�and�implementation 251,673
Capital�outlay 572,446 596,629 622 487,465Debt�service:
Principal�retirementInterest�and�fiscal�charges
Total�Expenditures 3,326,261 1,279,260 801,547 1,636,048 2,368,136
EXCESS�(DEFICIENCY)�OF�REVENUESOVER�EXPENDITURES (1,588,741) 1,124,760 371,198 (1,291,490) (491,760)
OTHER�FINANCING�SOURCES�(USES)Transfers�in 661,532 1,492,266Transfers�(out) (100,000)
Total�Other�Financing�Sources�(Uses) 661,532 (100,000) 1,492,266
Net�change�in�fund�balances (927,209) 1,124,760 271,198 200,776 (491,760)
Fund�balances���beginning 4,303,317 6,521,088 7,911,326 27,646 1,019,434
Fund�balances���ending 3,376,108 7,645,848 8,182,524 228,422 527,674
CITY�OF�REDWOOD�CITY,�CALIFORNIANON�MAJOR�GOVERNMENTAL��FUNDS
COMBINING�STATEMENT�OF�REVENUES,�EXPENDITURESAND�CHANGES�IN�FUND�BALANCES
FOR�THE�FISCAL�YEAR�ENDED�JUNE�30,�2017
106

SPECIAL�REVENUE�FUNDS
Seaport Seaport Redwood Redwood�Shores Supplemental TrafficLandscape Centre Shores Landscape Law�Enforcement Mitigation
Maintenance Maintenance Maintenance Maintenance Services FeesFund Fund Fund Fund Fund Fund
$ $ $ $ $ $
212,438 186,948 899,520 242,482
2,269 17,757 25,049 1,520 (6,128) (44,841)3,381 205,439 555,179
214,707 204,705 927,950 244,002 199,311 510,338
4,425 8,776
181,634229,712
194,820 58,507 483,207268,312
1,994,356
199,245 67,283 483,207 268,312 181,634 2,224,068
15,462 137,422 444,743 (24,310) 17,677 (1,713,730)
32,197(370,216)
(370,216) 32,197
15,462 137,422 74,527 7,887 17,677 (1,713,730)
554,739 1,783,596 1,265,060 31,625 68,385 10,334,261
570,201 1,921,018 1,339,587 39,512 86,062 8,620,531
(Continued)
107

CITY�OF�REDWOOD�CITY,�CALIFORNIANON�MAJOR�GOVERNMENTAL��FUNDS
COMBINING�STATEMENT�OF�REVENUES,�EXPENDITURESAND�CHANGES�IN�FUND�BALANCES
FOR�THE�FISCAL�YEAR�ENDED�JUNE�30,�2017
DEBT�SERVICESPECIAL�REVENUE�FUNDS FUND
Public�FinancingLow�&�Moderate AuthorityIncome�Housing Planning Community Housing 2013�Refunding
Asset� Cost�Recovery Benefits Legal�Aid LeaseFund Fund Fund Society Fund
$ $ $ $ $REVENUES
Property�taxes/special�assessmentsSales�and�other�taxesLicenses�and�permitsFines,�forfeitures�and�penaltiesUse�of�money�and�property 129,602 7,916 12,079 700,106IntergovernmentalContributions 1,321,067Charges�for�current�services 863,438 573,120Other 367 505
Total�Revenues 993,407 573,120 1,328,983 12,079 700,611
EXPENDITURESCurrent�Operations:
Community�development�� 289,781 576,142 210Human�servicesPublic�safety�TransportationEnvironmental�support�and�protectionLeisure,�cultural�and�information�servicesPolicy�development�and�implementation
Capital�outlay 1,950Debt�service:
Principal�retirement 676,920Interest�and�fiscal�charges 23,186
Total�Expenditures 291,731 576,142 210 700,106
EXCESS�(DEFICIENCY)�OF�REVENUESOVER�EXPENDITURES 701,676 (3,022) 1,328,983 11,869 505
OTHER�FINANCING�SOURCES�(USES)Transfers�in 159,337Transfers�(out)
Total�Other�Financing�Sources�(Uses) 159,337
Net�change�in�fund�balances 861,013 (3,022) 1,328,983 11,869 505
Fund�balances���beginning 11,109,480 955,756 119,091
Fund�balances���ending 11,970,493 (3,022) 2,284,739 130,960 505
108

�������CAPITAL�PROJECTS�FUNDSOne�Marina Total
Parks�Impact Shores Community Art�in�Facilities�Fee and�In�Lieu Transportation Facilities Public NonmajorConstruction Fee Improvement�District District Places Governmental
Fund Fund Fund Fund Fund Funds$ $ $ $ $ $
1,541,38871,498
1,022,714 1,022,714167,545
37,727 112,991 (9,248) 8,170 74 1,116,363107,250 6,462,372
1,000 2,680,7411,656,606
5,883
37,727 1,242,955 (9,248) 8,170 1,074 14,725,110
1,725,347100,000181,634
6,083,1291,439,521
84,367 352,67937,440 289,113
987,975 4,641,443
676,92023,186
1,072,342 37,440 15,512,972
37,727 170,613 (9,248) 8,170 (36,366) (787,862)
37,739 2,383,071(470,216)
37,739 1,912,855
37,727 170,613 (9,248) 8,170 1,373 1,124,993
385,865 19,311,272 603,948 1,224,784 67,530,673
423,592 19,481,885 594,700 1,232,954 1,373 68,655,666
109
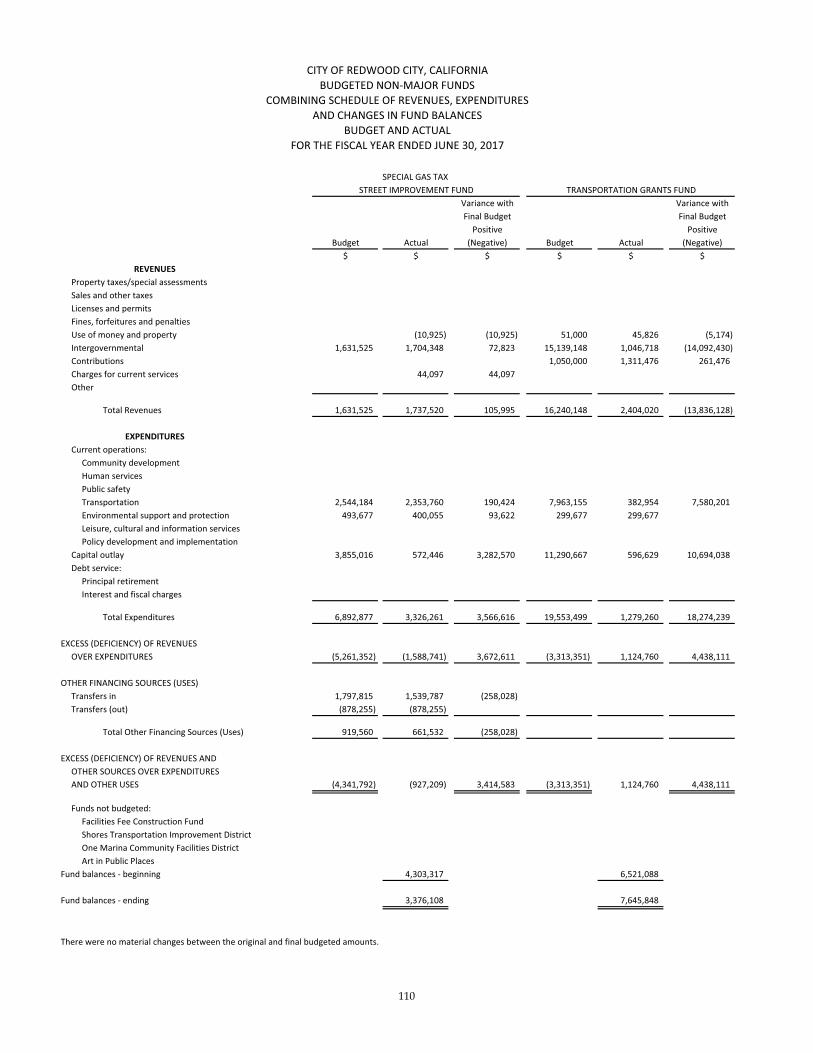
CITY�OF�REDWOOD�CITY,�CALIFORNIABUDGETED�NON�MAJOR�FUNDS
COMBINING�SCHEDULE�OF�REVENUES,�EXPENDITURESAND�CHANGES�IN�FUND�BALANCES
BUDGET�AND�ACTUALFOR�THE�FISCAL�YEAR�ENDED�JUNE�30,�2017
SPECIAL�GAS�TAX�STREET�IMPROVEMENT�FUND TRANSPORTATION�GRANTS�FUND
Variance�with Variance�withFinal�Budget Final�Budget
Positive PositiveBudget Actual (Negative) Budget Actual (Negative)
$ $ $ $ $ $REVENUES
Property�taxes/special�assessmentsSales�and�other�taxesLicenses�and�permitsFines,�forfeitures�and�penaltiesUse�of�money�and�property (10,925) (10,925) 51,000 45,826 (5,174)Intergovernmental 1,631,525 1,704,348 72,823 15,139,148 1,046,718 (14,092,430)Contributions 1,050,000 1,311,476 261,476Charges�for�current�services 44,097 44,097Other
Total�Revenues 1,631,525 1,737,520 105,995 16,240,148 2,404,020 (13,836,128)
EXPENDITURESCurrent�operations:
Community�development��Human�servicesPublic�safety�Transportation 2,544,184 2,353,760 190,424 7,963,155 382,954 7,580,201Environmental�support�and�protection 493,677 400,055 93,622 299,677 299,677Leisure,�cultural�and�information�servicesPolicy�development�and�implementation
Capital�outlay 3,855,016 572,446 3,282,570 11,290,667 596,629 10,694,038Debt�service:
Principal�retirementInterest�and�fiscal�charges
Total�Expenditures 6,892,877 3,326,261 3,566,616 19,553,499 1,279,260 18,274,239
EXCESS�(DEFICIENCY)�OF�REVENUESOVER�EXPENDITURES (5,261,352) (1,588,741) 3,672,611 (3,313,351) 1,124,760 4,438,111
OTHER�FINANCING�SOURCES�(USES)Transfers�in 1,797,815 1,539,787 (258,028)Transfers�(out) (878,255) (878,255)
Total�Other�Financing�Sources�(Uses) 919,560 661,532 (258,028)
EXCESS�(DEFICIENCY)�OF�REVENUES�ANDOTHER�SOURCES�OVER�EXPENDITURESAND�OTHER�USES (4,341,792) (927,209) 3,414,583 (3,313,351) 1,124,760 4,438,111
Funds�not�budgeted:Facilities�Fee�Construction�FundShores�Transportation�Improvement�DistrictOne�Marina�Community�Facilities�DistrictArt�in�Public�Places
Fund�balances���beginning 4,303,317 6,521,088
Fund�balances���ending 3,376,108 7,645,848
There�were�no�material�changes�between�the�original�and�final�budgeted�amounts.
110

�
�
�
�
�
�
GRANTS�FUND TRAFFIC�SAFETY�FUND TRANSPORTATION�FUNDVariance�with Variance�with Variance�withFinal�Budget Final�Budget Final�Budget
Positive Positive PositiveBudget Actual (Negative) Budget Actual (Negative) Budget Actual (Negative)
$ $ $ $ $ $ $ $ $
1,774,800 71,498 (1,703,302)
270,000 167,545 (102,455)25,000 47,151 22,151 (5,000) (3,470) 1,530 5,000 42,738 37,738
1,175,000 1,125,115 (49,885) 1,714,942 1,714,94247,198 47,198
2,000 175,951 173,951479 479 4,532 4,532
1,200,000 1,172,745 (27,255) 267,000 344,558 77,558 1,779,800 1,876,376 96,576
2,919,059 697,670 2,221,389 171,792 148,343 23,449100,000 (100,000)
1,646,048 1,636,048 10,000 1,442,968 1,480,655 (37,687)3,255 (3,255)
249,596 251,673 (2,077)863,335 622 862,713 899,799 487,465 412,334
3,782,394 801,547 2,980,847 1,646,048 1,636,048 10,000 2,764,155 2,368,136 396,019
(2,582,394) 371,198 2,953,592 (1,379,048) (1,291,490) 87,558 (984,355) (491,760) 492,595
1,384,147 1,492,266 108,119(100,000) (100,000)
(100,000) (100,000) 1,384,147 1,492,266 108,119
(2,682,394) 271,198 2,953,592 5,099 200,776 195,677 (984,355) (491,760) 492,595
7,911,326 27,646 1,019,434
8,182,524 228,422 527,674
(Continued)
111

CITY�OF�REDWOOD�CITY,�CALIFORNIABUDGETED�NON�MAJOR�FUNDS
COMBINING�SCHEDULE�OF�REVENUES,�EXPENDITURESAND�CHANGES�IN�FUND�BALANCES
BUDGET�AND�ACTUALFOR�THE�FISCAL�YEAR�ENDED�JUNE�30,�2017
SEAPORT�LANDSCAPE�MAINTENANCE�FUND SEAPORT�CENTRE�MAINTENANCE�FUNDVariance�with Variance�withFinal�Budget Final�Budget
Positive PositiveBudget Actual (Negative) Budget Actual (Negative)
$ $ $ $ $ $REVENUES
Property�taxes/special�assessments 212,500 212,438 (62) 187,000 186,948 (52)Sales�and�other�taxesLicenses�and�permitsFines,�forfeitures�and�penaltiesUse�of�money�and�property 4,000 2,269 (1,731) 15,000 17,757 2,757IntergovernmentalContributionsCharges�for�current�servicesOther
Total�Revenues 216,500 214,707 (1,793) 202,000 204,705 2,705
Current�operations:Community�development�� 4,219 4,425 (206) 4,285 8,776 (4,491)Human�servicesPublic�safety�TransportationEnvironmental�support�and�protection 229,135 194,820 34,315 117,743 58,507 59,236Leisure,�cultural�and�information�servicesPolicy�development�and�implementation
1,024 1,024 467,135 467,135Debt�service:
Principal�retirementInterest�and�fiscal�charges
Total�Expenditures 234,378 199,245 35,133 589,163 67,283 521,880
EXCESS�(DEFICIENCY)�OF�REVENUESOVER�EXPENDITURES (17,878) 15,462 33,340 (387,163) 137,422 524,585
OTHER�FINANCING�SOURCES�(USES)Transfers�inTransfers�(out)
Total�Other�Financing�Sources�(Uses)
EXCESS�(DEFICIENCY)�OF�REVENUES�ANDOTHER�SOURCES�OVER�EXPENDITURESAND�OTHER�USES (17,878) 15,462 33,340 (387,163) 137,422 524,585
Funds�not�budgeted:Facilities�Fee�Construction�FundShores�Transportation�Improvement�DistrictOne�Marina�Community�Facilities�DistrictArt�in�Public�Places
Fund�balances���beginning 554,739 1,783,596
Fund�balances���ending 570,201 1,921,018
There�were�no�material�changes�between�the�original�and�final�budgeted�amounts.
112

�����
REDWOOD�SHORES� SUPPLEMENTAL�LAWREDWOOD�SHORES�MAINTENANCE�FUND LANDSCAPE�MAINTENANCE�FUND ENFORCEMENT�SERVICES�FUND
Variance�with Variance�with Variance�withFinal�Budget Final�Budget Final�Budget
Positive Positive PositiveBudget Actual (Negative) Budget Actual (Negative) Budget Actual (Negative)
$ $ $ $ $ $ $ $ $
834,223 899,520 65,297 243,475 242,482 (993)
11,000 25,049 14,049 1,520 1,520 (6,128) (6,128)3,700 3,381 (319) 125,000 205,439 80,439
848,923 927,950 79,027 243,475 244,002 527 125,000 199,311 74,311
188,734 181,634 7,100
553,301 483,207 70,094276,676 268,312 8,364
755,011 755,011
1,308,312 483,207 825,105 276,676 268,312 8,364 188,734 181,634 7,100
(459,389) 444,743 904,132 (33,201) (24,310) 8,891 (63,734) 17,677 81,411
33,201 32,197 (1,004)(338,564) (370,216) (31,652)
(338,564) (370,216) (31,652) 33,201 32,197 (1,004)
(797,953) 74,527 872,480 7,887 7,887 (63,734) 17,677 81,411
1,265,060 31,625 68,385
1,339,587 39,512 86,062
(Continued)
113
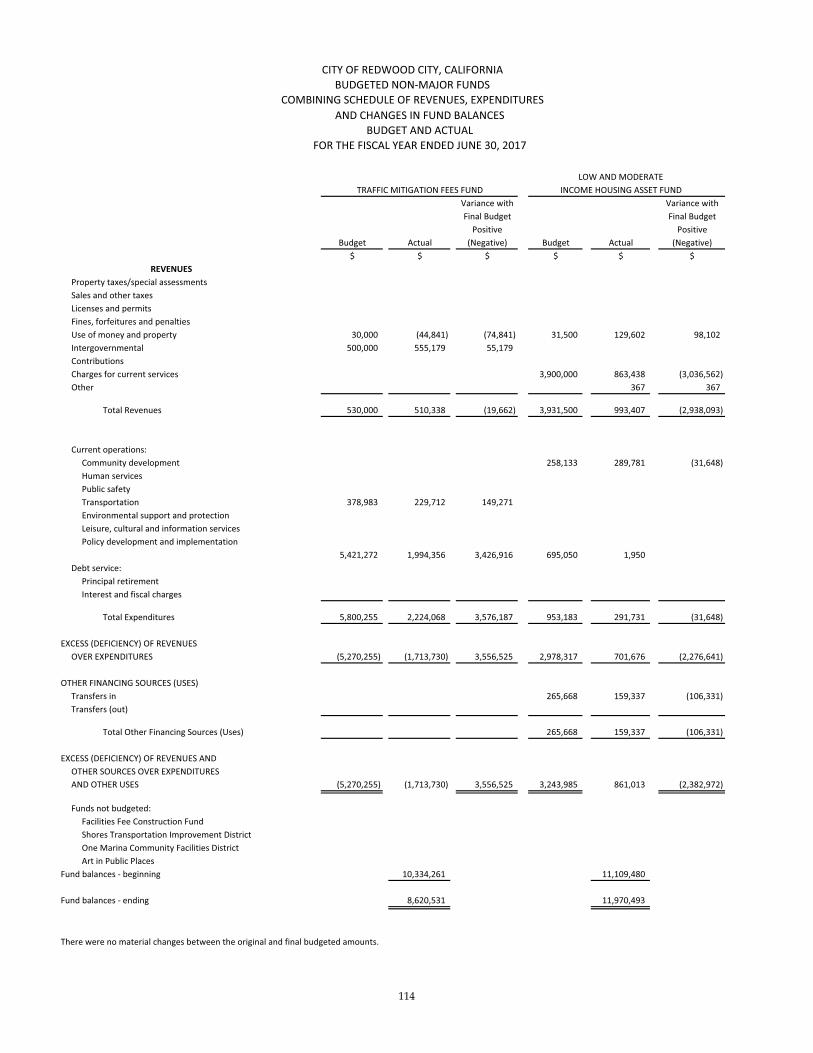
AND�CHANGES�IN�FUND�BALANCESBUDGET�AND�ACTUAL
FOR�THE�FISCAL�YEAR�ENDED�JUNE�30,�2017
LOW�AND�MODERATE� TRAFFIC�MITIGATION�FEES�FUND INCOME�HOUSING�ASSET�FUND
Variance�with Variance�withFinal�Budget Final�Budget
Positive PositiveBudget Actual (Negative) Budget Actual (Negative)
$ $ $ $ $ $REVENUES
Property�taxes/special�assessmentsSales�and�other�taxesLicenses�and�permitsFines,�forfeitures�and�penaltiesUse�of�money�and�property 30,000 (44,841) (74,841) 31,500 129,602 98,102Intergovernmental 500,000 555,179 55,179ContributionsCharges�for�current�services 3,900,000 863,438 (3,036,562)Other 367 367
Total�Revenues 530,000 510,338 (19,662) 3,931,500 993,407 (2,938,093)
Current�operations:Community�development�� 258,133 289,781 (31,648)Human�servicesPublic�safety�Transportation 378,983 229,712 149,271Environmental�support�and�protectionLeisure,�cultural�and�information�servicesPolicy�development�and�implementation
5,421,272 1,994,356 3,426,916 695,050 1,950Debt�service:
Principal�retirementInterest�and�fiscal�charges
Total�Expenditures 5,800,255 2,224,068 3,576,187 953,183 291,731 (31,648)
EXCESS�(DEFICIENCY)�OF�REVENUESOVER�EXPENDITURES (5,270,255) (1,713,730) 3,556,525 2,978,317 701,676 (2,276,641)
OTHER�FINANCING�SOURCES�(USES)Transfers�in 265,668 159,337 (106,331)Transfers�(out)
Total�Other�Financing�Sources�(Uses) 265,668 159,337 (106,331)
EXCESS�(DEFICIENCY)�OF�REVENUES�ANDOTHER�SOURCES�OVER�EXPENDITURESAND�OTHER�USES (5,270,255) (1,713,730) 3,556,525 3,243,985 861,013 (2,382,972)
Funds�not�budgeted:Facilities�Fee�Construction�FundShores�Transportation�Improvement�DistrictOne�Marina�Community�Facilities�DistrictArt�in�Public�Places
Fund�balances���beginning 10,334,261 11,109,480
Fund�balances���ending 8,620,531 11,970,493
There�were�no�material�changes�between�the�original�and�final�budgeted�amounts.
CITY�OF�REDWOOD�CITY,�CALIFORNIABUDGETED�NON�MAJOR�FUNDS
COMBINING�SCHEDULE�OF�REVENUES,�EXPENDITURES
114
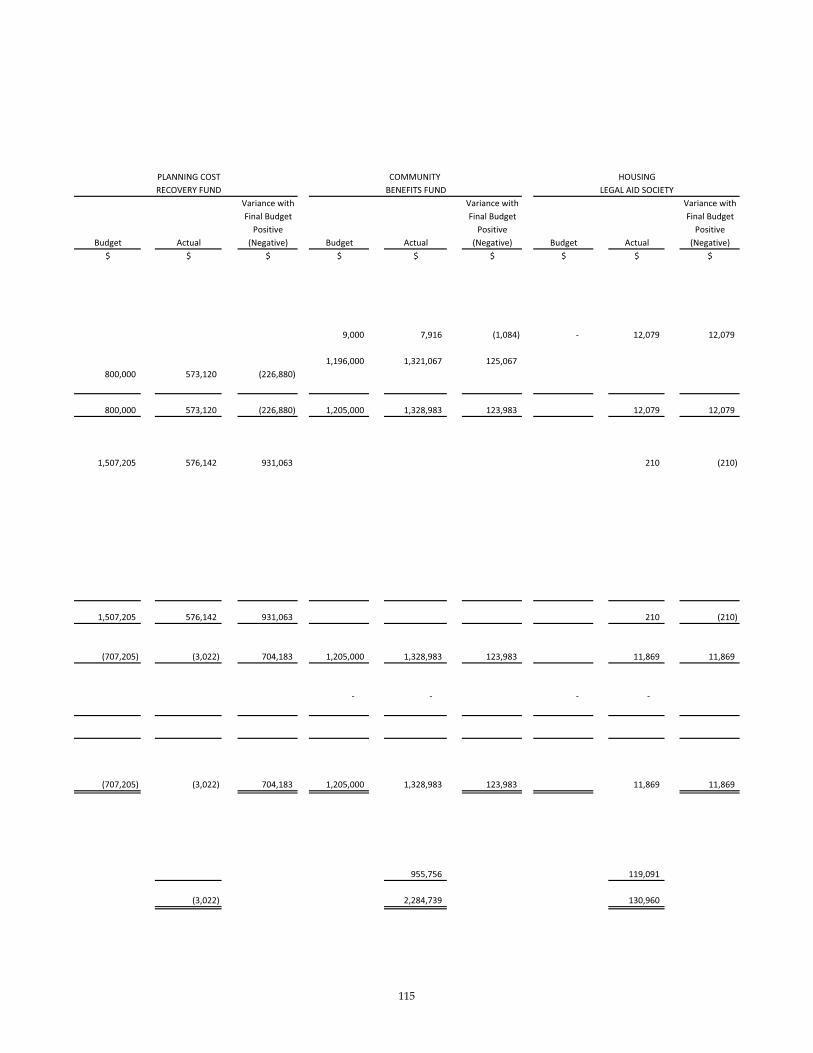
PLANNING�COST COMMUNITY� HOUSINGRECOVERY�FUND BENEFITS�FUND LEGAL�AID�SOCIETY
Variance�with Variance�with Variance�withFinal�Budget Final�Budget Final�Budget
Positive Positive PositiveBudget Actual (Negative) Budget Actual (Negative) Budget Actual (Negative)
$ $ $ $ $ $ $ $ $
9,000�������������� 7,916��������������� (1,084) ������������������� 12,079���������� 12,079
1,196,000������ 1,321,067�������� 125,067800,000 573,120 (226,880)
800,000 573,120 (226,880) 1,205,000 1,328,983 123,983 12,079 12,079
1,507,205 576,142 931,063 210 (210)
1,507,205 576,142 931,063 210 (210)
(707,205) (3,022) 704,183 1,205,000 1,328,983 123,983 11,869 11,869
������������������� �������������������� ������������������� �����������������
(707,205) (3,022) 704,183 1,205,000 1,328,983 123,983 11,869 11,869
955,756 119,091
(3,022) 2,284,739 130,960
115
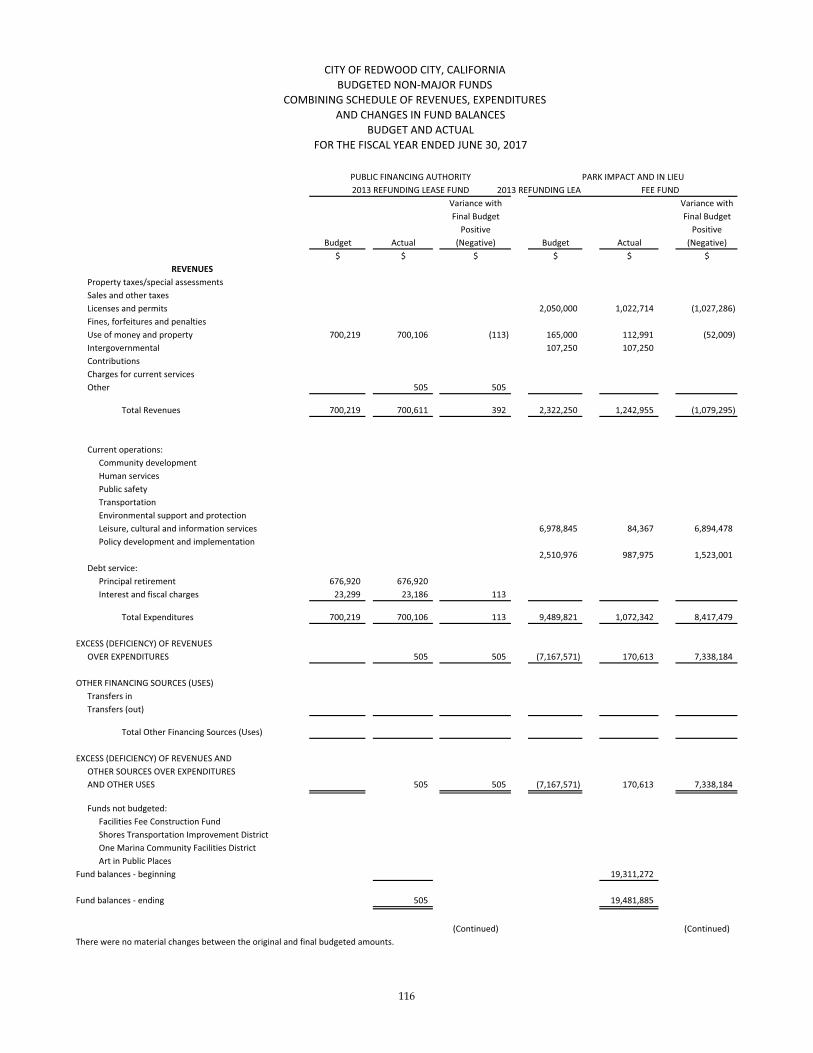
PUBLIC�FINANCING�AUTHORITY PARK�IMPACT�AND�IN�LIEU2013�REFUNDING�LEASE�FUND 2013�REFUNDING�LEAS FEE�FUND
Variance�with Variance�withFinal�Budget Final�Budget
Positive PositiveBudget Actual (Negative) Budget Actual (Negative)
$ $ $ $ $ $REVENUES
Property�taxes/special�assessmentsSales�and�other�taxesLicenses�and�permits 2,050,000 1,022,714 (1,027,286)Fines,�forfeitures�and�penaltiesUse�of�money�and�property 700,219 700,106 (113) 165,000 112,991 (52,009)Intergovernmental 107,250 107,250ContributionsCharges�for�current�servicesOther 505 505
Total�Revenues 700,219 700,611 392 2,322,250 1,242,955 (1,079,295)
Current�operations:Community�development��Human�servicesPublic�safety�TransportationEnvironmental�support�and�protectionLeisure,�cultural�and�information�services 6,978,845 84,367 6,894,478Policy�development�and�implementation
2,510,976 987,975 1,523,001Debt�service:
Principal�retirement 676,920 676,920Interest�and�fiscal�charges 23,299 23,186 113
Total�Expenditures 700,219 700,106 113 9,489,821 1,072,342 8,417,479
EXCESS�(DEFICIENCY)�OF�REVENUESOVER�EXPENDITURES 505 505 (7,167,571) 170,613 7,338,184
OTHER�FINANCING�SOURCES�(USES)Transfers�inTransfers�(out)
Total�Other�Financing�Sources�(Uses)
EXCESS�(DEFICIENCY)�OF�REVENUES�ANDOTHER�SOURCES�OVER�EXPENDITURESAND�OTHER�USES 505 505 (7,167,571) 170,613 7,338,184
Funds�not�budgeted:Facilities�Fee�Construction�FundShores�Transportation�Improvement�DistrictOne�Marina�Community�Facilities�DistrictArt�in�Public�Places
Fund�balances���beginning 19,311,272
Fund�balances���ending 505 19,481,885
(Continued) (Continued)There�were�no�material�changes�between�the�original�and�final�budgeted�amounts.
BUDGET�AND�ACTUALAND�CHANGES�IN�FUND�BALANCES
FOR�THE�FISCAL�YEAR�ENDED�JUNE�30,�2017
CITY�OF�REDWOOD�CITY,�CALIFORNIABUDGETED�NON�MAJOR�FUNDS
COMBINING�SCHEDULE�OF�REVENUES,�EXPENDITURES
116

TOTALSVariance�withFinal�Budget
PositiveBudget Actual (Negative)
$ $ $
1,477,198 1,541,388 64,1901,774,800 71,498 (1,703,302)2,050,000 1,022,714 (1,027,286)
270,000 167,545 (102,455)1,041,719 1,079,640 37,921
18,681,623 6,462,372 (12,219,251)2,246,000 2,679,741 433,7414,702,000 1,656,606 (3,045,394)
5,883 5,883
32,243,340 14,687,387 (17,555,953)
4,864,693 1,725,347 (3,139,346)100,000 (100,000)
188,734 181,634 7,10013,975,338 6,083,129 7,892,209
1,693,533 1,439,521 254,0127,255,521 352,679 6,902,842
249,596 251,673 (2,077)26,759,285 4,641,443 22,117,842
676,920 676,92023,299 23,186 113
55,686,919 15,475,532 33,932,695
(23,443,579) (788,145) 22,655,434
3,480,831 3,223,587 (257,244)(1,316,819) (1,348,471) 31,652
2,164,012 1,875,116 (225,592)
(21,279,567) 1,086,971 22,429,842
423,592594,700
1,232,9541,373
65,316,076
68,655,666
117

�
�������������
������
City�of�Redwood�City�Comprehensive�Annual�Financial�Report�
June�30,�2017�� �
118

�
�INTERNAL�SERVICE�FUNDS�
���Internal�service�funds�are�used�to�account�for�the�financing�of�goods�and�services�provided�by�one�City�department�to�others�on�a�cost�reimbursement�basis.�
�Equipment� Services� Fund� –� This� fund� accounts� for� the� costs� of� operation,� maintenance,� and�replacement� of� automotive� equipment� used� by� other� departments.� � Such� costs� are� billed� to� the�consuming� departments� at� a� rate� that� includes� operation,� maintenance,� and� an� amount� necessary� to�provide� replacement� of� the� equipment� at� a� future� date.� � Additional� equipment� is� budgeted� by� the�consuming�department�and�is�then�transferred�to�the�equipment�services�fund�after�purchase.��Self�Insurance�Fund�–�This� fund�accounts� for�the�City’s� total� insurance�program�which� includes,�but� is�not� limited� to,� workers’� compensation,� comprehensive� automobile� and� general� liability,� marinas,� and�property� and� crime� insurance.� � Included� are� administrative� costs� and� costs� associated� with� self�insurance�and�the�purchase�of�excess�insurance�to�adequately�protect�the�City.� �User�departments�are�charged� for�workers’� compensation� insurance�at� rates�based�on� loss�experience�and�on�departmental�budget�size.��Internal� Services� Fund� –� This� fund� accounts� for� the� costs� of� operation� of� the� City’s�telephone/communications� service,� maintenance� and� repair� of� buildings,� custodial� services,� and�information�technology�services.� �The�costs�are�billed�to�the�user�departments�based�on�actual�use�by�the�departments.��Employee� Benefits� Fund� –� This� fund� is� used� to� account� for� providing� City� workers� with� self�insured�dental� and� vision� benefits,� unemployment� insurance,� and� health� insurance� to� retired� City� employees.
119

CITY�OF�REDWOOD�CITY,�CALIFORNIAINTERNAL�SERVICE�FUNDS
COMBINING�STATEMENT�OF�NET�POSITIONJUNE�30,�2017
�Equipment���� ���Self������� Internal Employee ���� ���Services���� �Insurance���� ��Services���� Benefits ���� �����Fund������ ����Fund������ ����Fund������ Fund ���� Total
ASSETS $ $ $ $ $Current�assets:��Cash�and�investments�available�for�operations 13,863,057 25,051,041 503,130 1,605,491 41,022,719��Receivables�(net�of�allowance�for�uncollectibles):����Accounts 61,658 61,658����Accrued�interest 8,212 8,212����Due�from�other�governmental�agencies 41,797 240,056 281,853��Due�from�other�funds 300,000 300,000��Inventory�of�supplies�at�cost 120,852 120,852��Deposits 535,000 535,000��Prepaid�items�and�other�assets 20,220 51,504 71,724������Total�current�assets 14,354,138 25,647,699 794,690 1,605,491 42,402,018
Noncurrent�assets:��Advances�to�other�funds 1,500,000 1,500,000��Capital�assets: �����Construction�in�progress 199,647 199,647���Equipment,�net 7,599,747 720,319 8,320,066������Net�capital�assets 7,799,394 720,319 8,519,713������Total�noncurrent�assets 9,299,394 720,319 10,019,713��������Total�assets 23,653,532 25,647,699 1,515,009 1,605,491 52,421,731
DEFERRED�OUTFLOWS�OF�RESOURCESDeferred�outflows���pension 245,600 103,245 1,934,144 2,282,989Deferred�pension�contributions 156,169 65,637 1,114,529 1,336,335��������'Total�deferred�outflows�of�resources 401,769 168,882 3,048,673 3,619,324
LIABILITIESCurrent�liabilities:��Accounts�payable 124,384 260,377 209,261 517 594,539��Insurance�claims�payable���current�portion 4,674,166 4,674,166��Accrued�sick�leave�and�vacation���current�portion 41,699 365,671 407,370��Unearned�revenue������Total�current�liabilities 166,083 4,934,543 574,932 517 5,676,075Noncurrent�liabilities:��Insurance�claims�payable 19,096,327 19,096,327��Accrued�sick�leave�and�vacation 80,594 523,212 603,806��Net�OPEB�obligation 74,492 25,994 390,836 491,322��Net�pension�liability 1,878,239 819,314 14,898,913 17,596,466��������Total�noncurrent�liabilities����������������� 2,033,325 19,941,635 15,812,961 37,787,921
���������Total�liabilities������������������������ 2,199,408 24,876,178 16,387,893 517 43,463,996
DEFERRED�INFLOWS�OF�RESOURCESDeferred�inflows���pension�actuarial 26,127 11,941 378,879 416,947
NET�POSITIONInvested�in�capital�assets 7,799,394 720,319 8,519,713Unrestricted 14,030,372 928,462 (12,923,409) 1,604,974 3,640,399
Total�net�position 21,829,766��������� 928,462������������� (12,203,090)��������� 1,604,974������� 12,160,112�������
120

CITY�OF�REDWOOD�CITY,�CALIFORNIAINTERNAL�SERVICE�FUNDS
COMBINING�STATEMENT�OF�REVENUES,�EXPENSES,�AND�CHANGES�IN�FUND�NET�POSITION
FOR�THE�FISCAL�YEAR�ENDED�JUNE�30,�2017
Equipment Self Internal Employee �� � �Services Insurance ��Services� Benefits �� �
Fund Fund ����Fund�� Fund �� Total ���$ $ $ $ $
OPERATING�REVENUES��Charges�for�services 4,730,140 9,117,074 10,295,106 8,758,450 32,900,770
OPERATING�EXPENSES��Employee�services 1,026,723 468,172 8,485,517 4,093,340 14,073,752��Maintenance 47,413 16,113 881,325 944,851��Utilities 19,312 2,696 10,073 32,081��Contractual�services 20,766 1,230,415 55,691 3,078,733 4,385,605��Supplies�and�services 1,409,105 532,780 1,299,369 3,241,254��Depreciation 1,167,892 142,998 1,310,890��Insurance�and�claims 171,280 6,243,411 208,728 817,394 7,440,813
����Total�operating�expenses 3,862,491 8,493,587 11,083,701 7,989,467 31,429,246
Operating�Income�(Loss) 867,649 623,487 (788,595) 768,983 1,471,524
NONOPERATING�REVENUES�(EXPENSES)��Gain�(loss)�on�disposal�of�capital�assets (12,553) (5,734) (18,287)��Investment�earnings 138,076 76,141 2,367 38,800 255,384��Insurance�recovery 53,088 53,088
����Net�Nonoperating�Revenues�(Expenses) 178,611 76,141 (3,367) 38,800 290,185
Net�Income�(Loss)�Before�Capital�Contributions����and�Transfers 1,046,260 699,628 (791,962) 807,783 1,761,709
Capital�contributions 172,178 172,178Transfers�in 1,000,000 1,000,000Transfers�(out) (8,565) (8,565)
���Total�Capital�Contributions�and�Transfers 1,000,000 163,613 1,163,613
Change�in�net�position 1,046,260 1,699,628 (628,349) 807,783 2,925,322
Net�position���beginning 20,783,506 (771,166) (11,574,741) 797,191 9,234,790
Net�position���ending 21,829,766������ 928,462���������� (12,203,090)������ 1,604,974������� 12,160,112�����
121

CITY�OF�REDWOOD�CITY,�CALIFORNIAINTERNAL�SERVICE��FUNDS
COMBINING�STATEMENT�OF�CASH�FLOWSINCREASE�(DECREASE)�IN�CASH�AND�CASH�EQUIVALENTS�
FOR�THE�FISCAL�YEAR�ENDED�JUNE�30,�2017
Equipment Self Internal EmployeeServices Insurance Services Benefits
Fund Fund Fund Fund Total$ $ $ $ $
Cash�flows�from�operating�activities:��Cash�received�from�interfund�services�provided ������ 4,709,860 9,278,842 10,244,955 8,758,450 32,992,107��Cash�payments�to�suppliers�for�goods�and�services (1,678,730) (7,504,531) (2,349,529) (3,895,610) (15,428,400)��Cash�payments�to�employees�for�services (987,197) (456,724) (8,248,378) (4,093,340) (13,785,639)
����Net�cash�provided�by�(used�in)�operating�activities��������������� 2,043,933 1,317,587 (352,952) 769,500 3,778,068
Cash�flows�from�noncapital�financing�activities��Insurance�recovery 53,088 53,088��Transfers�in 1,000,000 1,000,000��Transfers�out (8,565) (8,565)��Advances�to�other�funds 300,000 300,000��Contributions
����Net�cash�provided�by�(used�in)�non�capital�financing�activities 353,088 1,000,000 (8,565) 1,344,523
Cash�flows�from�capital�and�related�financing�activities:��Acquisition�and�construction�of�capital�assets (708,807) (170,753) (879,560)��Contributions 172,178 172,178��Proceeds�from�sale�of�capital�assets
��Net�cash�used�in�capital�and�related�financing�activities (708,807) 1,425 (707,382)
Cash�flows�from�investing�activities:��Interest�on�investments 135,623 76,141 2,367 38,800 252,931����Net�cash�provided�by�investing�activities 135,623 76,141 2,367 38,800 252,931
����Net�increase�(decrease)�in�cash�and�cash�equivalents 1,823,837 2,393,728 (357,725) 808,300 4,668,140
����Cash�and�cash�equivalents�at�beginning�of�year 12,039,220 22,657,313 860,855 797,191 36,354,579
����Cash�and�cash�equivalents�at�end�of�year ��� 13,863,057 25,051,041 503,130 1,605,491 41,022,719
Reconciliation�of�Net�Cash�Flow�from�Operating�Activities
Operating�income�(loss) 867,649 623,487 (788,595) 768,983 1,471,524Adjustments�to�reconcile�operating�income(loss)�to���net�cash�provided�by�operating�activities:����Depreciation 1,167,892 142,998 1,310,890����Change�in�assets�and�liabilities:������Decrease�(increase)�in�accounts�receivable 1,620 161,768 163,388������Decrease�(increase)�in�due�from�other�governmental�agencies (21,900) (50,151) (72,051)������Decrease�(increase)�in�inventory/prepaid�expense/deposits (14,766) (5,000) (3,522) (23,288)������Increase�(decrease)�in�vacation�&�sick�leave�payable 12,285 42,733 55,018������Increase�(decrease)�in�accounts�payable 3,912 (127,767) 109,179 517 (14,159)������Increase�(decrease)�in�deferred�outflows���pension (245,600) (103,245) (1,934,144) (2,282,989)������Increase�(decrease)�in�deferred�employer�contributions 118,141 58,781 1,279,374 1,456,296������Increase�(decrease)�in�deferred�inflows���pension (245,750) (108,105) (1,812,713) (2,166,568)������Increase�(decrease)�in�net�pension�liability 400,450 164,017 2,661,889 3,226,356������Increase�(decrease)�in�insurance�claims�payable 653,651 653,651
��������Total�adjustments 1,176,284 694,100 435,643 517 2,306,544
Net�cash�provided�by�(used�in)�operating�activities ���� 2,043,933 1,317,587 (352,952) 769,500 3,778,068
Noncash�investing,�capital�and�financing�activities:�Gain�(loss)�on�disposal�of�equipment (12,553) (5,734) (18,287)
122

�
�AGENCY�FUNDS�
���Agency�funds�are�used�to�account�for�assets�held�by�government�in�a�trustee�capacity�or�as�an�agent�for�an�individual.�
�Employee� Benefit� Plans� Fund� –� This� fund� is� used� to� account� for� contributions� to� certain� employee�benefit� categories� established� by� the� City� under� Section� 125� of� the� Internal� Revenue� Code� for� the�employees�and�their�dependents.���Pacific�Shores�Community�Facilities�District�Fund�–�This�fund�accounts�for�the�Mello�Roos�Pacific�Shores�Project�special�tax�bonds�that�were�issued�to�fund�various�transportation�system�improvements�within�the�City's�right�of�way�in�the�Pacific�Shores�district.��Shores� Transportation� Improvement� District� Fund� –� This� fund� accounts� for� the� Mello�Roos� Shores�Transportation�Improvement�special�tax�bonds�that�were�issued�to�fund�various�transportation�projects�in�the�Redwood�Shores�area.��One�Marina�Community�Facilities�District�Fund�–�This�fund�accounts�for�the�Mello�Roos�One�Marina�Project�special�tax�bonds�that�were�issued�to�fund�certain�public�infrastructure�improvements�projects�within�the�One�Marina�district.��Community�Benefit�Improvement�District�Fund�–�This�fund�accounts�for�the�assessments�collected�on�behalf�of�the�Downtown�Redwood�City�Community�Benefit�Improvement�District�which�was�established�to�enhance�and�support�the�City’s�Downtown�business�district.����������������������
�
�
� �
123

CITY�OF�REDWOOD�CITY,�CALIFORNIAAGENCY�FUNDS
COMBINING�STATEMENT�OF�CHANGES�IN�ASSETS�AND�LIABILITIESFOR�THE�FISCAL�YEAR�ENDED�JUNE�30,�2017
�Balance �Balance�June�30,�2016 ���Additions� �Withdrawals� �June�30,�2017
EMPLOYEE�BENEFIT�PLANS $ $ $ $ASSETSCash�and�Investments,�restricted��Cafeteria�Benefits�Plan 42,539 323,550 (335,013) 31,076Deposits 29,505 29,505Total�Assets 72,044 323,550 (335,013) 60,581
LIABILITIESCafeteria�Benefits�Plan�Payable 72,044 323,550 (335,013) 60,581Total�Liabilities 72,044 323,550 (335,013) 60,581
PACIFIC�SHORES�COMMUNITY�FACILITIES�DISTRICTASSETSCash�and�Investments,�restricted 1,463,000 130 (1,447,800) 15,330Total�Assets 1,463,000 130 (1,447,800) 15,330
LIABILITIESDue�to�Bondholders 1,463,000 130 (1,447,800) 15,330Total�Liabilities 1,463,000 130 (1,447,800) 15,330
SHORES�TRANSPORTATION�IMPROVEMENT�DISTRICTASSETSCash�and�Investments,�restricted 1,349,796 779,802 (732,763) 1,396,835Total�Assets 1,349,796 779,802 (732,763) 1,396,835
LIABILITIESDue�to�Bondholders 1,349,796 779,802 (732,763) 1,396,835Total�Liabilities 1,349,796 779,802 (732,763) 1,396,835
ONE�MARINA�COMMUNITY�FACILITIES�DISTRICTASSETSCash�and�Investments,�restricted 302,948 272,863 (125,389) 450,422Total�Assets 302,948 272,863 (125,389) 450,422
LIABILITIESDue�to�Bondholders 302,948 272,863 (125,389) 450,422Total�Liabilities 302,948 272,863 (125,389) 450,422
COMMUNITY�BENEFIT�IMPROVEMENT�DISTRICTASSETSCash�and�Investments,�restricted 88,051 899,039 (537,708) 449,382Total�Assets 88,051 899,039 (537,708) 449,382
LIABILITIESDue�to�Community�Benefit�Improvement�District 88,051 899,039 (537,708) 449,382Total�Liabilities 88,051 899,039 (537,708) 449,382
TOTAL�FOR�ALL�FUNDSASSETSCash�and�Investments,�restricted 3,246,334 2,002,521 � (3,053,284) 2,343,045Deposits 29,505 29,505Total�Assets 3,275,839 2,002,521 (2,753,261) 2,372,550
LIABILITIESDue�to�Bondholders 3,115,744 1,052,795 (2,305,952) 1,862,587Employee�Benefit�Plans�Payable 72,044 323,550 (335,013) 60,581Due�to�Community�Benefit�Improvement�District 88,051 899,039 (537,708) 449,382Total�Liabilities 3,275,839 2,275,384 (3,178,673) 2,372,550
124
Statistical Section
This part of the City of Redwood City's comprehensive annual financial report presents detailed informationas a context for understanding what the information in the financial statements, note disclosures, and required supplementary information says about the City's overall financial health.
Contents Pages
Financial Trends 126-133These schedules contain trend information to help the reader understand how the City's financial performance and well-being have changed over time.
Revenue Capacity 134-137These schedules contain information to help the reader assess the factors affecting the City's ability to generate its property and sales taxes.
Debt Capacity 138-142These schedules present information to help the reader assess the affordability of the City's current levels of outstanding debt and the City's ability to issue additional debt in the future.
Demographic and Economic Information 143-145These schedules offer demographic and economic indicators to help the reader understand the environment within which the City's financial activities take place and to help make comparisons over time and with other governments.
Operating Information 146-148These schedules contain information about the City's operations and resources to help the reader understand how the City's financial information relates to the services the City provides and the activities it performs.
Sources: Unless otherwise noted, the information in these schedules is derived from the comprehensive annual financial reports for the relevant year.
125

Schedule 1CITY OF REDWOOD CITY, CALIFORNIANET POSITION BY COMPONENTLast Ten Fiscal Years(accrual basis of accounting)
2008 2009 2010 2011 2012$ $ $ $ $
Governmental activitiesNet investment in capital assets 156,560,228 161,627,155 169,093,206 169,197,701 185,512,524Restricted 50,323,338 52,368,702 54,628,813 48,959,550 39,238,667Unrestricted 63,104,332 49,292,416 37,166,449 42,990,998 48,138,559
Total governmental activities net position 269,987,898 263,288,273 260,888,468 261,148,249 272,889,750
Business-type activitiesNet investment in capital assets 78,785,990 81,617,178 90,877,809 101,835,656 107,036,885Restricted 5,785,576 5,548,281 5,660,219 5,838,632 5,868,399Unrestricted 66,030,719 55,230,314 64,022,824 65,532,636 69,695,347
Total business-type activities net position 150,602,285 142,395,773 160,560,852 173,206,924 182,600,631
Primary governmentNet investment in capital assets 235,346,218 243,244,333 259,971,015 271,033,357 292,549,409Restricted 56,108,914 57,916,983 60,289,032 54,798,182 45,107,066Unrestricted 129,135,051 104,522,730 101,189,273 108,523,634 117,833,906
Total primary government net position 420,590,183 405,684,046 421,449,320 434,355,173 455,490,381
Fiscal Year
126
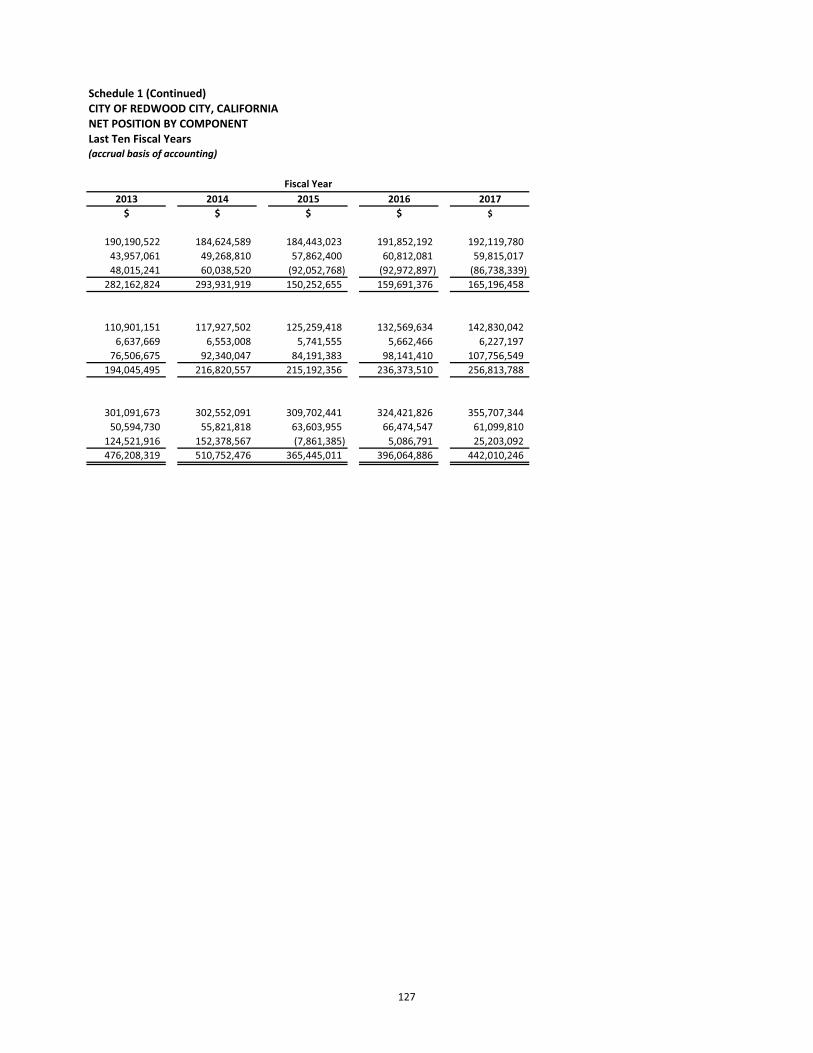
Schedule 1 (Continued)CITY OF REDWOOD CITY, CALIFORNIANET POSITION BY COMPONENTLast Ten Fiscal Years(accrual basis of accounting)
2013 2014 2015 2016 2017$ $ $ $ $
190,190,522 184,624,589 184,443,023 191,852,192 192,119,78043,957,061 49,268,810 57,862,400 60,812,081 59,815,01748,015,241 60,038,520 (92,052,768) (92,972,897) (86,738,339)
282,162,824 293,931,919 150,252,655 159,691,376 165,196,458
110,901,151 117,927,502 125,259,418 132,569,634 142,830,0426,637,669 6,553,008 5,741,555 5,662,466 6,227,197
76,506,675 92,340,047 84,191,383 98,141,410 107,756,549194,045,495 216,820,557 215,192,356 236,373,510 256,813,788
301,091,673 302,552,091 309,702,441 324,421,826 355,707,34450,594,730 55,821,818 63,603,955 66,474,547 61,099,810
124,521,916 152,378,567 (7,861,385) 5,086,791 25,203,092 476,208,319 510,752,476 365,445,011 396,064,886 442,010,246
Fiscal Year
127
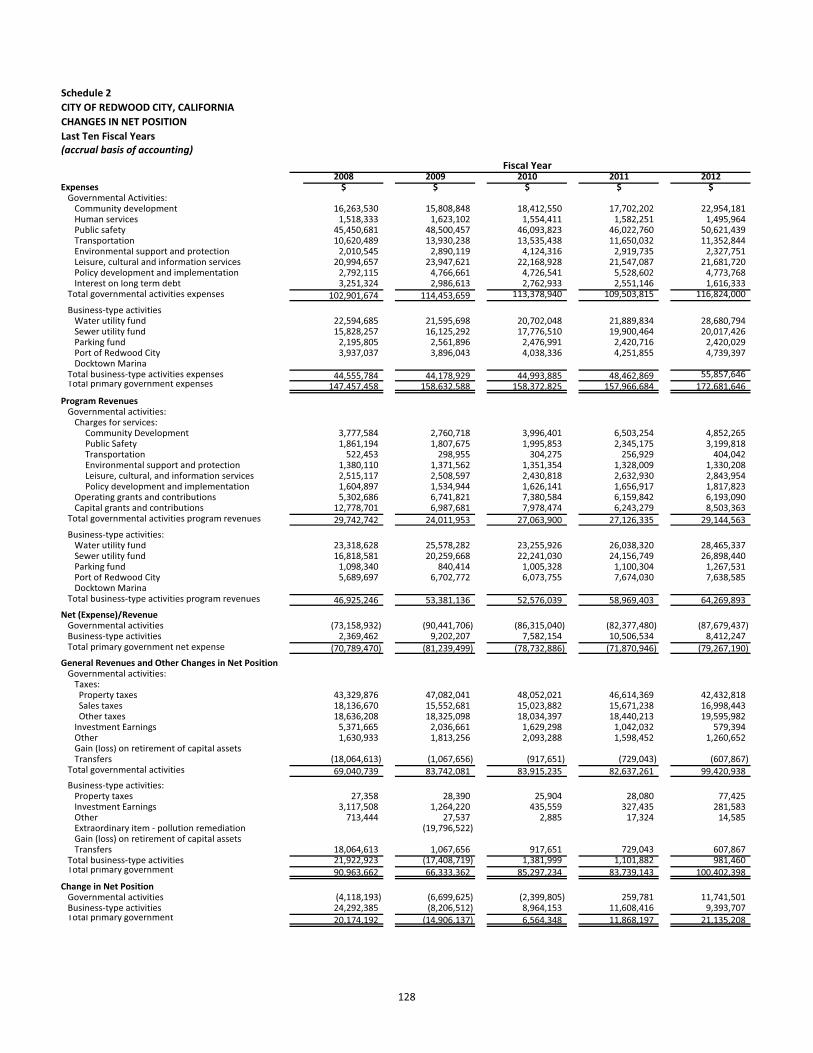
Schedule 2CITY OF REDWOOD CITY, CALIFORNIACHANGES IN NET POSITIONLast Ten Fiscal Years(accrual basis of accounting)
Fiscal Year2008 2009 2010 2011 2012
Expenses $ $ $ $ $Governmental Activities:
Community development 16,263,530 15,808,848 18,412,550 17,702,202 22,954,181Human services 1,518,333 1,623,102 1,554,411 1,582,251 1,495,964Public safety 45,450,681 48,500,457 46,093,823 46,022,760 50,621,439Transportation 10,620,489 13,930,238 13,535,438 11,650,032 11,352,844Environmental support and protection 2,010,545 2,890,119 4,124,316 2,919,735 2,327,751Leisure, cultural and information services 20,994,657 23,947,621 22,168,928 21,547,087 21,681,720Policy development and implementation 2,792,115 4,766,661 4,726,541 5,528,602 4,773,768Interest on long term debt 3,251,324 2,986,613 2,762,933 2,551,146 1,616,333
Total governmental activities expenses 102,901,674 114,453,659 113,378,940 109,503,815 116,824,000
Business-type activitiesWater utility fund 22,594,685 21,595,698 20,702,048 21,889,834 28,680,794Sewer utility fund 15,828,257 16,125,292 17,776,510 19,900,464 20,017,426Parking fund 2,195,805 2,561,896 2,476,991 2,420,716 2,420,029Port of Redwood City 3,937,037 3,896,043 4,038,336 4,251,855 4,739,397Docktown Marina
Total business-type activities expenses 44,555,784 44,178,929 44,993,885 48,462,869 55,857,646Total primary government expenses 147,457,458 158,632,588 158,372,825 157,966,684 172,681,646
Program RevenuesGovernmental activities:
Charges for services: Community Development 3,777,584 2,760,718 3,996,401 6,503,254 4,852,265Public Safety 1,861,194 1,807,675 1,995,853 2,345,175 3,199,818Transportation 522,453 298,955 304,275 256,929 404,042Environmental support and protection 1,380,110 1,371,562 1,351,354 1,328,009 1,330,208Leisure, cultural, and information services 2,515,117 2,508,597 2,430,818 2,632,930 2,843,954Policy development and implementation 1,604,897 1,534,944 1,626,141 1,656,917 1,817,823
Operating grants and contributions 5,302,686 6,741,821 7,380,584 6,159,842 6,193,090Capital grants and contributions 12,778,701 6,987,681 7,978,474 6,243,279 8,503,363
Total governmental activities program revenues 29,742,742 24,011,953 27,063,900 27,126,335 29,144,563Business-type activities:
Water utility fund 23,318,628 25,578,282 23,255,926 26,038,320 28,465,337Sewer utility fund 16,818,581 20,259,668 22,241,030 24,156,749 26,898,440Parking fund 1,098,340 840,414 1,005,328 1,100,304 1,267,531Port of Redwood City 5,689,697 6,702,772 6,073,755 7,674,030 7,638,585Docktown Marina
Total business-type activities program revenues 46,925,246 53,381,136 52,576,039 58,969,403 64,269,893Net (Expense)/Revenue
Governmental activities (73,158,932) (90,441,706) (86,315,040) (82,377,480) (87,679,437)Business-type activities 2,369,462 9,202,207 7,582,154 10,506,534 8,412,247Total primary government net expense (70,789,470) (81,239,499) (78,732,886) (71,870,946) (79,267,190)
General Revenues and Other Changes in Net PositionGovernmental activities:
Taxes: Property taxes 43,329,876 47,082,041 48,052,021 46,614,369 42,432,818 Sales taxes 18,136,670 15,552,681 15,023,882 15,671,238 16,998,443 Other taxes 18,636,208 18,325,098 18,034,397 18,440,213 19,595,982Investment Earnings 5,371,665 2,036,661 1,629,298 1,042,032 579,394Other 1,630,933 1,813,256 2,093,288 1,598,452 1,260,652Gain (loss) on retirement of capital assetsTransfers (18,064,613) (1,067,656) (917,651) (729,043) (607,867)
Total governmental activities 69,040,739 83,742,081 83,915,235 82,637,261 99,420,938 Business-type activities:
Property taxes 27,358 28,390 25,904 28,080 77,425Investment Earnings 3,117,508 1,264,220 435,559 327,435 281,583Other 713,444 27,537 2,885 17,324 14,585Extraordinary item - pollution remediation (19,796,522)Gain (loss) on retirement of capital assetsTransfers 18,064,613 1,067,656 917,651 729,043 607,867
Total business-type activities 21,922,923 (17,408,719) 1,381,999 1,101,882 981,460Total primary government 90,963,662 66,333,362 85,297,234 83,739,143 100,402,398
Change in Net PositionGovernmental activities (4,118,193) (6,699,625) (2,399,805) 259,781 11,741,501Business-type activities 24,292,385 (8,206,512) 8,964,153 11,608,416 9,393,707Total primary government 20,174,192 (14,906,137) 6,564,348 11,868,197 21,135,208
128
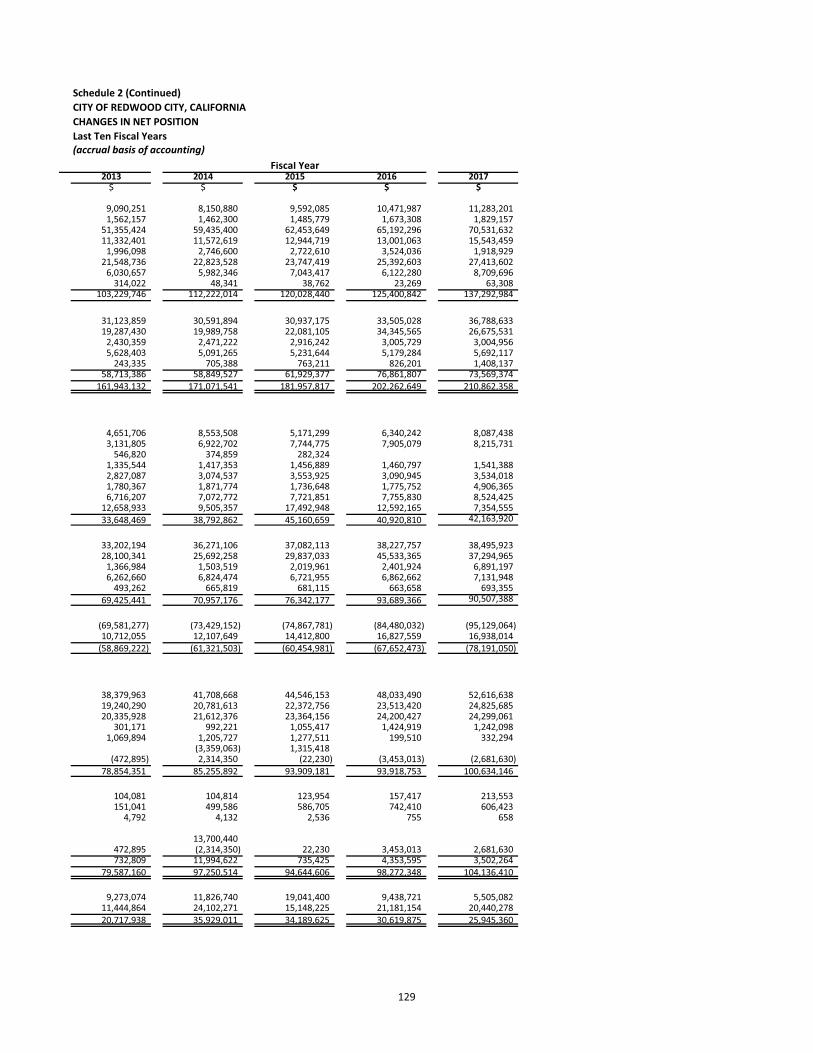
Schedule 2 (Continued)CITY OF REDWOOD CITY, CALIFORNIACHANGES IN NET POSITIONLast Ten Fiscal Years(accrual basis of accounting)
Fiscal Year2013 2014 2015 2016 2017
$ $ $ $ $
9,090,251 8,150,880 9,592,085 10,471,987 11,283,2011,562,157 1,462,300 1,485,779 1,673,308 1,829,157
51,355,424 59,435,400 62,453,649 65,192,296 70,531,63211,332,401 11,572,619 12,944,719 13,001,063 15,543,459
1,996,098 2,746,600 2,722,610 3,524,036 1,918,92921,548,736 22,823,528 23,747,419 25,392,603 27,413,602
6,030,657 5,982,346 7,043,417 6,122,280 8,709,696314,022 48,341 38,762 23,269 63,308
103,229,746 112,222,014 120,028,440 125,400,842 137,292,984
31,123,859 30,591,894 30,937,175 33,505,028 36,788,63319,287,430 19,989,758 22,081,105 34,345,565 26,675,531
2,430,359 2,471,222 2,916,242 3,005,729 3,004,9565,628,403 5,091,265 5,231,644 5,179,284 5,692,117
243,335 705,388 763,211 826,201 1,408,137 58,713,386 58,849,527 61,929,377 76,861,807 73,569,374 161,943,132 171,071,541 181,957,817 202,262,649 210,862,358
4,651,706 8,553,508 5,171,299 6,340,242 8,087,4383,131,805 6,922,702 7,744,775 7,905,079 8,215,731
546,820 374,859 282,3241,335,544 1,417,353 1,456,889 1,460,797 1,541,3882,827,087 3,074,537 3,553,925 3,090,945 3,534,0181,780,367 1,871,774 1,736,648 1,775,752 4,906,3656,716,207 7,072,772 7,721,851 7,755,830 8,524,425
12,658,933 9,505,357 17,492,948 12,592,165 7,354,555 33,648,469 38,792,862 45,160,659 40,920,810 42,163,920
33,202,194 36,271,106 37,082,113 38,227,757 38,495,92328,100,341 25,692,258 29,837,033 45,533,365 37,294,965
1,366,984 1,503,519 2,019,961 2,401,924 6,891,1976,262,660 6,824,474 6,721,955 6,862,662 7,131,948
493,262 665,819 681,115 663,658 693,355 69,425,441 70,957,176 76,342,177 93,689,366 90,507,388
(69,581,277) (73,429,152) (74,867,781) (84,480,032) (95,129,064)10,712,055 12,107,649 14,412,800 16,827,559 16,938,014
(58,869,222) (61,321,503) (60,454,981) (67,652,473) (78,191,050)
38,379,963 41,708,668 44,546,153 48,033,490 52,616,63819,240,290 20,781,613 22,372,756 23,513,420 24,825,68520,335,928 21,612,376 23,364,156 24,200,427 24,299,061
301,171 992,221 1,055,417 1,424,919 1,242,0981,069,894 1,205,727 1,277,511 199,510 332,294
(3,359,063) 1,315,418(472,895) 2,314,350 (22,230) (3,453,013) (2,681,630)
78,854,351 85,255,892 93,909,181 93,918,753 100,634,146
104,081 104,814 123,954 157,417 213,553151,041 499,586 586,705 742,410 606,423
4,792 4,132 2,536 755 658
13,700,440472,895 (2,314,350) 22,230 3,453,013 2,681,630
732,809 11,994,622 735,425 4,353,595 3,502,264 79,587,160 97,250,514 94,644,606 98,272,348 104,136,410
9,273,074 11,826,740 19,041,400 9,438,721 5,505,08211,444,864 24,102,271 15,148,225 21,181,154 20,440,278
20,717,938 35,929,011 34,189,625 30,619,875 25,945,360
129

Schedule 3CITY OF REDWOOD CITY, CALIFORNIAFUND BALANCES - GOVERNMENTAL FUNDSLast Ten Fiscal Years(modified accrual basis of accounting)
2008 2009 2010$ $ $
General FundReserved 5,554,149 4,630,992 3,732,535Unreserved 40,900,734 34,464,505 20,991,436Total general fund 46,454,883 39,095,497 24,723,971
All Other Governmental FundsReserved 25,925,282 25,660,144 26,067,203Unreserved, reported in:
Special revenue funds 24,369,952 28,419,218 32,706,733Debt service funds 46,511 78,418 40,589Capital projects funds 26,565,268 21,189,395 18,520,889
Total all other governmental funds 76,907,013 75,347,175 77,335,414
Total governmental funds 123,361,896 114,442,672 102,059,385
2011 2012 2013$ $ $
General FundNonspendable 5,522,056 1,902,685 1,785,184 RestrictedCommitted 864,057 551,640 370,927 Assigned 775,772 151,178 148,534Unassigned 17,687,858 17,219,050 19,449,097Total general fund 24,849,743 19,824,553 21,753,742
All Other Governmental FundsNonspendable 16,740,323
Restricted 39,829,153 39,468,697 43,969,746Committed 22,014,259 24,806,534 22,494,438Assigned 3,064,843 7,424,963 7,817,738Unassigned (3,181,518)Total all other governmental funds 78,467,060 71,700,194 74,281,922
Total Governmental Funds 103,316,803 91,524,747 96,035,664
Notes:The City began to classify fund balances into specifically defined calssifications whenit implemented GASB Statement No. 54 in FY 2010-11.
Fiscal Year
Fiscal Year
130

Schedule 3 (Continued)CITY OF REDWOOD CITY, CALIFORNIAFUND BALANCES - GOVERNMENTAL FUNDSLast Ten Fiscal Years(modified accrual basis of accounting)
2014 2015 2016 2017$ $ $ $
1,608,733 1,387,892 1,291,863 1,131,8141,230 96,338 96,338
536,108 700,783 837,563 837,563223,061 283,563 978,967 884,838
21,480,940 26,231,888 25,233,340 29,421,95623,848,842 28,605,356 28,438,071 32,372,509
105,702 124,39549,268,810 55,913,000 59,678,286 58,674,54229,788,888 34,613,371 22,446,882 34,219,577
8,128,032 8,060,682 14,270,412 5,230,911(3,022)
87,185,730 98,587,053 96,501,282 98,246,403
111,034,572 127,192,409 124,939,353 130,618,912
Fiscal Year
131

Schedule 4CITY OF REDWOOD CITY, CALIFORNIACHANGES IN FUND BALANCES - GOVERNMENTAL FUNDSLast Ten Fiscal Years
2008 2009 2010 2011 2012$ $ $ $ $
Property taxes/special assessments 44,573,382 48,371,857 49,351,469 47,906,240 43,732,410Sales and other taxes 34,567,051 31,674,430 30,964,483 31,575,135 34,231,492Licenses and permits 1,557,547 902,723 875,019 1,097,906 1,266,183Fines, forfeitures and penalties 977,774 921,566 1,216,604 1,404,168 1,313,826Use of money and property 8,445,701 4,995,104 4,264,447 3,813,336 2,302,262Intergovernmental 13,523,007 10,397,158 13,711,717 9,126,252 10,223,281Contributions 1,190,376 540,186 829,561 1,850,469 3,971,547Charges for current services 7,843,245 7,326,776 8,395,583 11,227,564 10,830,462Other 1,166,364 2,173,942 1,608,439 1,028,902 750,414Total Revenues 113,844,447 107,303,742 111,217,322 109,029,972 108,621,877
EXPENDITURESCurrent Operations:
Community development 15,866,328 15,305,951 18,155,500 17,440,348 22,125,748Human services 1,433,258 1,511,733 1,465,105 1,504,568 1,389,422Public safety 44,390,736 46,713,987 45,500,450 45,470,647 49,175,285Transportation 6,158,706 8,866,814 8,552,901 6,729,077 6,472,378Environmental support and protection 1,958,690 2,863,738 4,152,609 2,916,577 2,260,457Leisure, cultural and information services 19,236,180 21,873,848 20,479,455 19,876,261 19,585,039Policy development and implementation 918,430 2,785,266 3,299,086 3,979,560 2,617,522
Capital outlay 17,326,293 9,894,551 5,025,308 4,902,938 7,665,302Debt service:
Principal retirement 4,067,321 3,747,321 14,657,321 3,182,321 3,275,000Interest and fiscal charges 1,945,514 1,608,310 1,378,637 1,007,650 930,487Bond issuance costs
Total Expenditures 113,301,456 115,171,519 122,666,372 107,009,947 115,496,640
EXCESS (DEFICIENCY) OF REVENUESOVER EXPENDITURES 542,991 (7,867,777) (11,449,050) 2,020,025 (6,874,763)
OTHER FINANCING SOURCES (USES)Transfers in 13,557,675 14,275,221 28,655,915 13,288,203 18,062,351Transfers (out) (14,139,291) (15,326,668) (29,590,152) (14,050,840) (18,655,801)Sale of property 30Bond proceeds/Refunding LeaseSale of capital assets
Total Other Financing Sources (Uses) (581,616) (1,051,447) (934,237) (762,607) (593,450)
Extraordinary gain (loss) (4,323,843)
NET CHANGE IN FUND BALANCES (38,625) (8,919,224) (12,383,287) 1,257,418 (11,792,056)
Debt service as a percentage ofnon-capital expenditures 6.26% 5.09% 13.63% 4.10% 3.90%
REVENUES
Fiscal Year
132

Schedule 4 (Continued)CITY OF REDWOOD CITY, CALIFORNIACHANGES IN FUND BALANCES - GOVERNMENTAL FUNDSLast Ten Fiscal Years
2013 2014 2015 2016 2017$ $ $ $ $
39,709,199 43,092,377 45,973,909 49,312,670 53,975,05537,072,870 39,970,312 43,307,531 44,186,332 44,037,753
1,897,584 2,561,642 1,467,814 7,151,286 4,189,1951,198,611 887,309 878,334 983,449 989,6112,476,647 1,771,829 1,918,899 2,164,743 6,115,750
10,505,927 10,835,761 12,416,110 13,265,046 12,243,7807,743,498 8,301,860 11,363,481 2,296,073 3,559,664
10,411,028 15,345,006 16,420,416 16,900,849 19,791,531557,739 623,242 708,967 621,247 788,639
111,573,103 123,389,338 134,455,461 136,881,695 145,690,978
8,595,743 7,864,788 9,479,762 10,320,807 10,987,8111,462,092 1,347,136 1,400,276 1,624,187 1,708,705
49,368,709 56,115,246 61,713,585 65,020,500 68,186,7186,452,755 6,714,370 8,685,224 9,099,717 11,241,3211,959,881 2,601,280 2,525,916 2,360,169 2,160,598
19,778,480 20,789,647 22,013,436 23,537,162 24,507,8665,470,098 3,598,453 5,202,537 4,259,132 8,440,654
10,502,338 5,310,292 6,162,302 14,730,024 8,365,803
5,880,000 324,742 656,858 666,814 676,920326,059 31,755 43,348 74,696 61,958
67,252109,863,407 104,697,709 117,883,244 131,693,208 136,338,354
1,709,696 18,691,629 16,572,217 5,188,487 9,352,624
13,223,617 13,632,786 12,241,110 10,795,891 11,997,013(13,782,396) (17,325,507) (14,448,618) (18,237,434) (15,670,078)
3,360,0001,793,128
2,801,221 (3,692,721) (414,380) (7,441,543) (3,673,065)
4,510,917 14,998,908 16,157,837 (2,253,056) 5,679,559
6.25% 0.36% 0.63% 0.63% 0.58%
Fiscal Year
133

Schedule 5CITY OF REDWOOD CITY, CALIFORNIAASSESSED VALUE AND ESTIMATED ACTUAL VALUE OF TAXABLE PROPERTYLast Ten Fiscal Years
Real Property Personal PropertyLess: Total Taxable % Increase/ Effective
Fiscal State Locally Locally Tax Exempt Assessed (Decrease) Direct TaxYear Assessed Assessed Assessed Property Value Over Prior Year Rate*
$ $ $ $ $ % %
2008 5,003,014 13,671,991,606 586,031,204 541,024,340 13,722,001,484 8.35 0.24392009 5,003,014 14,734,164,661 676,178,812 642,703,087 14,772,643,400 7.66 0.23502010 5,003,014 14,885,525,123 757,610,502 664,018,869 14,984,119,770 1.43 0.23972011 5,003,014 14,673,871,469 770,364,641 704,940,601 14,744,298,523 (1.60) 0.23732012 1,466,946 14,712,120,582 674,899,038 646,459,575 14,742,026,991 (0.02) 0.20302013 1,466,946 15,154,966,352 763,901,657 766,118,316 15,154,216,639 2.80 0.21012014 1,466,946 16,187,528,735 785,538,767 726,787,642 16,247,746,806 7.22 0.19212015 1,466,946 17,089,497,213 816,665,290 791,008,571 17,116,620,878 5.35 0.19202016 1,591,555 18,644,533,868 801,908,976 731,483,833 18,716,550,566 9.35 0.19442017 1,591,555 20,475,454,077 844,061,306 758,856,031 20,562,250,907 9.86 0.1930
California to the Educational Revenue Augmentation Fund used to support K-14 education.
Source: San Mateo County Assessor's records
* The direct tax rate calculation does not include the property tax amount that is shifted from local agencies by the State of
The amount shown above includes assessed value data for both the City and the Successor Agency to the former Redevelopment Agency.
Note: In 1978 the voters of the State of California passed Proposition 13 which limited basic property tax to a total maximum rate of 1% based upon the assessed value of the property being taxed. Each year, the assessed value of property may be increased by an "inflation factor" (limited to a maximum of 2%). With few exceptions, property is only reassessed at the time that it is sold to a new owner. At that point, the new assessed value is the purchase price. The estimated market value of taxable property is not available.
134

Schedule 6
CITY OF REDWOOD CITY, CALIFORNIADIRECT AND OVERLAPPING PROPERTY TAX RATESLast Ten Fiscal Years(rate per $100 of assessed values)
2008 2009 2010 2011 2012 2013 2014 2015 2016 2017Direct RatesCity 0.2439 0.2350 0.2397 0.2373 0.2030 0.2101 0.1921 0.1920 0.1944 0.1930County and All Others* 0.7561 0.7650 0.7603 0.7627 0.7970 0.7899 0.8079 0.8080 0.8056 0.8070Total Direct Rate 1.0000 1.0000 1.0000 1.0000 1.0000 1.0000 1.0000 1.0000 1.0000 1.0000Overlapping RatesMidPeninsula Open Space** 0.0008 0.0006Elementary School 0.0250 0.0229 0.0238 0.0249 0.0255 0.0256 0.0240 0.0230 0.0158 0.0461High School 0.0205 0.0282 0.0277 0.0311 0.0358 0.0356 0.0313 0.0433 0.0434 0.0391Community College 0.0171 0.0165 0.0182 0.0193 0.0199 0.0194 0.0194 0.0190 0.0250 0.0247Total Overlapping Rate 0.0626 0.0676 0.0697 0.0753 0.0812 0.0806 0.0747 0.0853 0.0850 0.1105
Total Direct and Overlapping Rate 1.0626 1.0676 1.0697 1.0753 1.0812 1.0806 1.0747 1.0853 1.0850 1.1105
Source: San Mateo County Assessor's records (tax rate area 009-001)
* Elementary School, High School, Community College, MidPeninsula Open Space District, Bay Area Air Pollution, County Harbor District, Mosquito Abatement District, Sequoia Hospital District, and County Education tax.
** MidPeninsula Regional Open Space issued general obligation bonds through voter approved Measure AA in 2015-16.
Fiscal Year
135
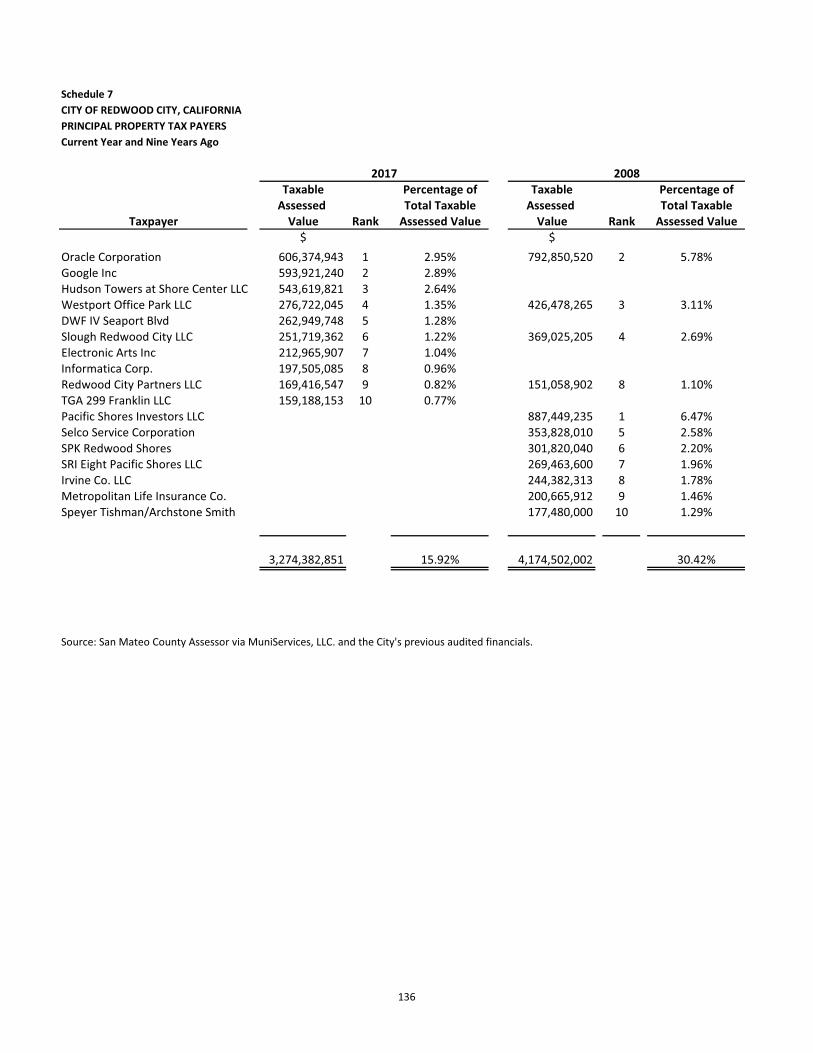
Schedule 7CITY OF REDWOOD CITY, CALIFORNIAPRINCIPAL PROPERTY TAX PAYERSCurrent Year and Nine Years Ago
2017 2008Taxable Percentage of Taxable Percentage of
Assessed Total Taxable Assessed Total TaxableTaxpayer Value Rank Assessed Value Value Rank Assessed Value
$ $Oracle Corporation 606,374,943 1 2.95% 792,850,520 2 5.78%Google Inc 593,921,240 2 2.89%Hudson Towers at Shore Center LLC 543,619,821 3 2.64%Westport Office Park LLC 276,722,045 4 1.35% 426,478,265 3 3.11%DWF IV Seaport Blvd 262,949,748 5 1.28%Slough Redwood City LLC 251,719,362 6 1.22% 369,025,205 4 2.69%Electronic Arts Inc 212,965,907 7 1.04% Informatica Corp. 197,505,085 8 0.96% Redwood City Partners LLC 169,416,547 9 0.82% 151,058,902 8 1.10%TGA 299 Franklin LLC 159,188,153 10 0.77%Pacific Shores Investors LLC 887,449,235 1 6.47%Selco Service Corporation 353,828,010 5 2.58%SPK Redwood Shores 301,820,040 6 2.20%SRI Eight Pacific Shores LLC 269,463,600 7 1.96%Irvine Co. LLC 244,382,313 8 1.78%Metropolitan Life Insurance Co. 200,665,912 9 1.46%Speyer Tishman/Archstone Smith 177,480,000 10 1.29%
3,274,382,851 15.92% 4,174,502,002 30.42%
Source: San Mateo County Assessor via MuniServices, LLC. and the City's previous audited financials.
136
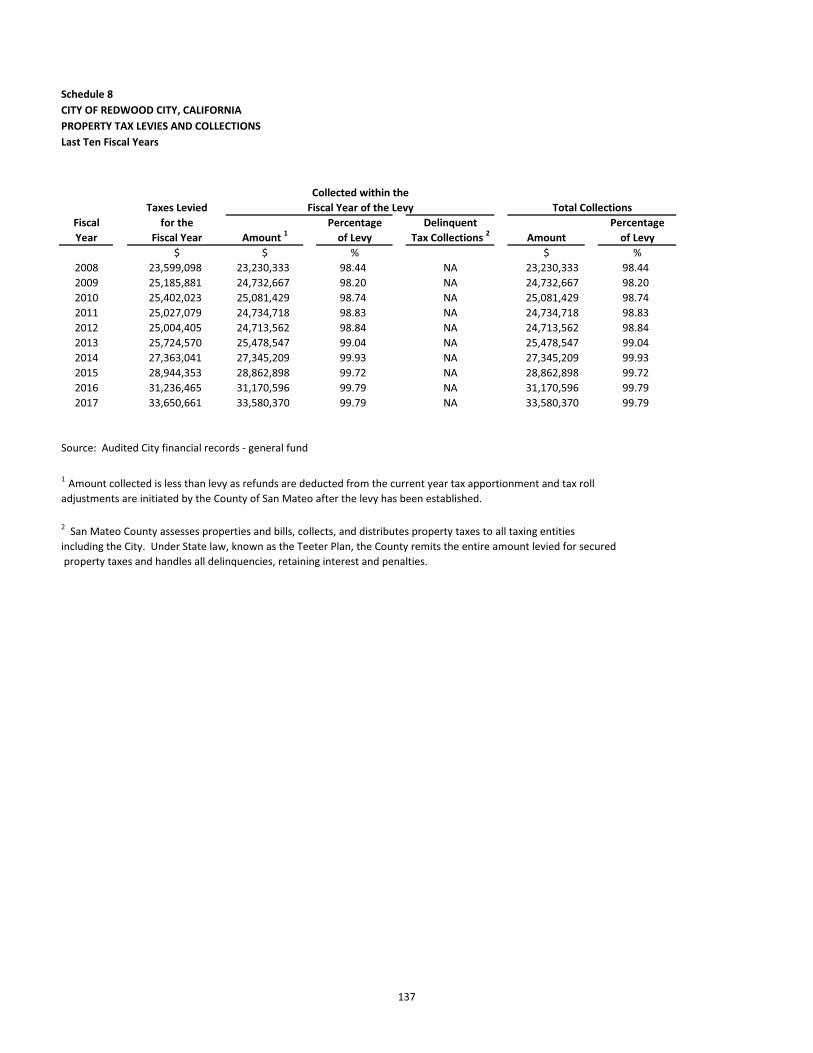
Schedule 8CITY OF REDWOOD CITY, CALIFORNIAPROPERTY TAX LEVIES AND COLLECTIONSLast Ten Fiscal Years
Collected within theTaxes Levied Fiscal Year of the Levy Total Collections
Fiscal for the Percentage Delinquent PercentageYear Fiscal Year Amount 1 of Levy Tax Collections 2 Amount of Levy
$ $ % $ %2008 23,599,098 23,230,333 98.44 NA 23,230,333 98.442009 25,185,881 24,732,667 98.20 NA 24,732,667 98.202010 25,402,023 25,081,429 98.74 NA 25,081,429 98.742011 25,027,079 24,734,718 98.83 NA 24,734,718 98.832012 25,004,405 24,713,562 98.84 NA 24,713,562 98.842013 25,724,570 25,478,547 99.04 NA 25,478,547 99.042014 27,363,041 27,345,209 99.93 NA 27,345,209 99.932015 28,944,353 28,862,898 99.72 NA 28,862,898 99.722016 31,236,465 31,170,596 99.79 NA 31,170,596 99.792017 33,650,661 33,580,370 99.79 NA 33,580,370 99.79
Source: Audited City financial records - general fund
1 Amount collected is less than levy as refunds are deducted from the current year tax apportionment and tax roll adjustments are initiated by the County of San Mateo after the levy has been established.
2 San Mateo County assesses properties and bills, collects, and distributes property taxes to all taxing entities including the City. Under State law, known as the Teeter Plan, the County remits the entire amount levied for secured property taxes and handles all delinquencies, retaining interest and penalties.
137

Schedule 9CITY OF REDWOOD CITY, CALIFORNIARATIOS OF OUTSTANDING DEBT BY TYPELast Ten Fiscal Years(amounts expressed in thousands, except per capita amount)
Governmental Activities Business-Type Activities
Tax Total Debt/Revenue Refunding GID Increment Revenue Primary Per Personal
Bonds Lease Bonds Bonds* Loans* Bonds Loans Govt Capita Income$ $ $ $ $ $ $ $ $ %
2008 22,493 170 45,998 212 81,981 1,903 152,757 1,977 4.952009 20,228 46,133 169 80,141 1,876 148,547 1,909 4.792010 9,807 43,423 127 78,236 1,848 133,441 1,698 4.372011 7,892 43,767 85 76,266 1,819 129,829 1,671 4.202012 5,882 84,217 1,789 91,888 1,174 2.942013 3,360 81,346 1,758 86,464 1,093 2.702014 3,035 80,393 424 83,852 1,038 2.512015 2,378 77,749 80,127 979 2.352016 1,712 74,814 76,526 890 1.722017 1,035 66,890 67,925 794 1.61
*Tax Increment Bonds and Loans were transferred from Governmental Funds to a Private Purpose Trust Fund in 2012.
138
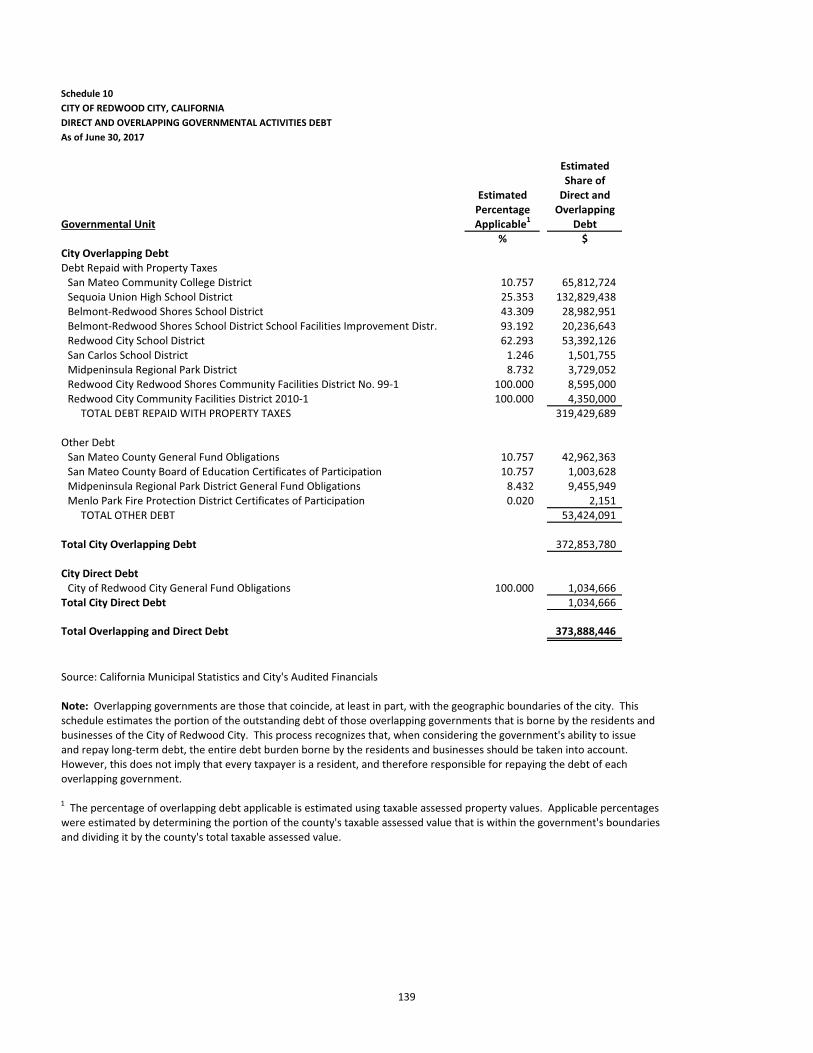
CITY OF REDWOOD CITY, CALIFORNIADIRECT AND OVERLAPPING GOVERNMENTAL ACTIVITIES DEBTAs of June 30, 2017
EstimatedShare of
Estimated Direct andPercentage Overlapping
Governmental Unit Applicable1 Debt% $
City Overlapping DebtDebt Repaid with Property Taxes
San Mateo Community College District 10.757 65,812,724Sequoia Union High School District 25.353 132,829,438Belmont-Redwood Shores School District 43.309 28,982,951Belmont-Redwood Shores School District School Facilities Improvement Distr. 93.192 20,236,643Redwood City School District 62.293 53,392,126San Carlos School District 1.246 1,501,755Midpeninsula Regional Park District 8.732 3,729,052Redwood City Redwood Shores Community Facilities District No. 99-1 100.000 8,595,000Redwood City Community Facilities District 2010-1 100.000 4,350,000 TOTAL DEBT REPAID WITH PROPERTY TAXES 319,429,689
Other DebtSan Mateo County General Fund Obligations 10.757 42,962,363San Mateo County Board of Education Certificates of Participation 10.757 1,003,628Midpeninsula Regional Park District General Fund Obligations 8.432 9,455,949Menlo Park Fire Protection District Certificates of Participation 0.020 2,151 TOTAL OTHER DEBT 53,424,091
Total City Overlapping Debt 372,853,780
City Direct DebtCity of Redwood City General Fund Obligations 100.000 1,034,666
Total City Direct Debt 1,034,666
Total Overlapping and Direct Debt 373,888,446
Source: California Municipal Statistics and City's Audited Financials
Note: Overlapping governments are those that coincide, at least in part, with the geographic boundaries of the city. Thisschedule estimates the portion of the outstanding debt of those overlapping governments that is borne by the residents and businesses of the City of Redwood City. This process recognizes that, when considering the government's ability to issue and repay long-term debt, the entire debt burden borne by the residents and businesses should be taken into account. However, this does not imply that every taxpayer is a resident, and therefore responsible for repaying the debt of each overlapping government.
1 The percentage of overlapping debt applicable is estimated using taxable assessed property values. Applicable percentages were estimated by determining the portion of the county's taxable assessed value that is within the government's boundaries and dividing it by the county's total taxable assessed value.
Schedule 10
139

Schedule 11CITY OF REDWOOD CITY, CALIFORNIALEGAL DEBT MARGIN INFORMATIONLast Ten Fiscal Years
Total Total Total Net DebtNet Debt Legal Debt Applicable to Limit
Fiscal Year Debt Limit Applicable to Limit Margin as % of Debt Limit$ $ $ %
2007-08 534,863,468 534,863,4682008-09 578,075,493 578,075,4932009-10 586,805,199 586,805,1992010-11 579,346,467 579,346,4672011-12 577,068,246 577,068,2462012-13 597,012,561 597,012,5612013-14 636,545,042 636,545,0422014-15 671,536,104 671,536,1042015-16 729,301,290 729,301,2902016-17 799,541,510 799,541,510
Legal Debt Margin Calculation for FY 2016-17
Assessed value 20,562,250,907Add back: exempt real property 758,856,031Total assessed value 21,321,106,938
Debt limit (3.75% of total assessed value) 799,541,510Debt applicable to limit: General obligation bonds Less: Amount set aside for repayment of general obligation debt Total net debt applicable to limit Legal debt margin 799,541,510
Note: Under state finance law, the city's outstanding general obligation debt should not exceed 15% of total assessed property value. However, the city has established a more conservative internal limit of not more than 3.75%. By law, the general obligation debt subject to the limitation may be offset by amounts set aside for repaying general obligation bonds.
140

Schedule 12CITY OF REDWOOD CITY, CALIFORNIAPLEDGED-REVENUE COVERAGELast Ten Fiscal Years
Water Revenue Bonds Less: Net
Fiscal Gross Operating Available Coverage Year Revenue Expenses Revenue Principal Interest Ratio
$ $ $ $ $2008 22,582,850 17,465,038 5,117,812 1,560,000 2,690,956 1.20 2009 23,403,532 17,304,434 6,099,098 1,620,000 2,754,920 1.39 2010 23,063,981 17,421,429 5,642,552 1,675,000 2,938,691 1.22 2011 26,004,880 18,597,779 7,407,101 1,730,000 2,930,765 1.59 2012 28,110,646 22,103,449 6,007,197 1,795,000 2,868,003 1.292013 33,167,501 23,321,874 9,845,627 1,865,000 2,802,852 2.112014 35,655,559 23,173,261 12,482,298 1,845,000 2,269,566 3.032015 35,323,680 25,430,020 9,893,660 1,905,000 2,943,480 2.042016 35,508,299 28,248,490 7,259,809 1,995,000 2,214,629 1.722017 36,752,635 31,411,452 5,341,183 2,080,000 2,352,256 1.21
Notes: Details regarding the City's outstanding debt can be found in the notes to the financial statements.Operating expenses do not include interest, depreciation, amortization expenses, or noncapitalized project costs.
earnings per the Proprietary Funds Statements of Revenues, Expenses and Changes in Fund Net Position for all years listed above.
Debt Service
*For transparency and consistency, Schedule 12 has been restated to reflect gross operating revenues and investment
141

Schedule 12 (Continued)CITY OF REDWOOD CITY, CALIFORNIAPLEDGED-REVENUE COVERAGELast Ten Fiscal Years
Port Revenue BondsLess: Net
Fiscal Gross Operating Available Coverage Year Revenues Expenses1 Revenue Principal Interest Ratio2
$ $ $ $ $2008 6,188,729 2,529,213 3,659,516 250,385 524,033 4.73 2009 5,967,743 2,516,939 3,450,804 266,528 512,090 4.43 2010 5,729,278 2,648,046 3,081,232 277,721 499,137 3.97 2011 5,820,715 2,561,439 3,259,276 288,969 485,389 4.21 2012 6,159,871 2,746,082 3,413,789 305,273 471,085 4.40 2013 6,262,660 2,703,564 3,559,096 644,144 875,483 2.34 2014 6,824,474 2,786,181 4,038,293 646,186 819,930 2.75 2015 6,721,955 3,033,231 3,688,724 710,341 807,953 2.43
2016* 6,779,863 2,823,939 3,955,924 772,130 630,193 2.82 2017 7,127,814 3,106,577 4,021,237 771,916 577,965 2.98
Tax Increment BondsProperty
Tax CoverageIncrement Principal Interest Ratio
$ $ $2008 8,416,294 1,210,000 988,415 3.83 2009 7,921,159 1,270,000 929,730 3.60
2010 3 7,953,318 4,195,000 886,687 1.57 2011 7,552,777 1,225,000 632,713 4.07
2012 4 1,265,000 585,975 2013 4 2,480,000 511,075 2014 4 2,895,000 385,481 2015 4 3,045,000 229,556 2016 4 3,142,669 292,144 2017 1,889,861 1,615,139
2 Debt service coverage is calculated using maximum annual debt service as required for the annual disclosure report.3 In FY 2009-10, the 1997 Tax Increment Bonds were paid off resulting in additional principal payment of $2,865,000.
Redevelopment Agency is no longer in existence to receive tax increment revenue.
*2016 Port Operating Expenses were restated in FY 2017.
and is disbursed according to the provisions of AB X1 26 and AB 1484, the clean-up legislation thatbecame law effective June 27, 2012. Under these laws the Successor Agencies to the RedevelopmentAgencies now receive funding from the RPTTF to pay these types of debt obligations as the
Debt Service
Debt Service
4 As a result of the California Supreme Court upholding AB X1 26, Redevelopment Agencies were eliminated as ofJanuary 31, 2012. Consequently, all former tax increment revenue is retained by the County of San Mateo Controller's Office and deposited into the "Redevelopment Property Tax Trust Fund" (RPTTF)
1 Port operating expenses above exclude $406,792 subvention to the City and depreciation.
142

Schedule 13CITY OF REDWOOD CITY, CALIFORNIADEMOGRAPHIC AND ECONOMIC STATISTICSLast Ten Calendar Years
PerCapita Number of
Calendar Personal Personal Unemployment Water SystemYear Population Income ($000) Income Rate Customers
$ $ %2008 77,269 3,087,824 39,962 5.00 23,7102009 77,819 3,098,753 39,820 8.90 23,7182010 78,568 3,052,053 38,846 9.10 23,7842011 77,712 3,091,772 39,785 8.70 23,9722012 78,244 3,125,218 39,942 7.10 24,1192013 79,074 3,204,632 40,527 5.40 24,2962014 80,768 3,342,018 41,378 4.20 24,3472015 81,838 3,408,940 41,655 3.00 24,4722016 85,992 4,459,975 51,865 3.00 24,4852017 85,601 4,206,433 49,140 2.70 24,508
Sources: Population is provided by the State of California Department of Finance. Population numbers in this schedule reflect the Department of Finance's annual adjustments. Personal income and per capita personal income is provided by United States Census Data via MuniServices, LLC and is adjusted for inflation.The unemployment rate for the City of Redwood City is provided by the State of California Employee Development Department and is not seasonally adjusted. The number of water system customers is provided by the City's utility billing system.
143

Schedule 14CITY OF REDWOOD CITY, CALIFORNIAPRINCIPAL EMPLOYERSCurrent and Nine Years Ago
% of Total City % of Total CityEmployer Employees* Rank Employment Employees** Rank Employment
Oracle Corporation 6,581 1 13.54% 8,000 1 19.51%County of San Mateo 2,052 2 4.22% 2,200 2 5.37%Kaiser Foundation Hospitals 1,701 3 3.50% 1,800 4 4.39%Electronic Arts 1,478 4 3.04% 1,826 3 4.45%Sequoia Hospital 915 5 1.88% 1,154 5 2.81%Box Inc. 870 6 1.79% Redwood City School District 751 7 1.55% 1,050 6 2.56%Stanford Hospital & Clinics 750 8 1.54%Equinix 479 9 0.99%Sequoia Union High School District 442 10 0.91% 700 10 1.71%Informatica 1,000 7 2.44%OpenWave Systems 900 8 2.20%Broad Vision 759 9 1.85%
**2008 Data from Redwood City Chamber of Commerce.
2017 2008
Source: *As of 2015, data from City of Redwood City Business License Database; non-profit organizations' data was via published annual reports or direct inquiry to the organization.
144

Schedule 15CITY OF REDWOOD CITY, CALIFORNIAFULL TIME EQUIVALENT EMPLOYEES BY FUNCTION/DEPARTMENTLast Ten Fiscal Years
Function 2008 2009 2010 2011 2012 2013 2014 2015 2016
Community Development 71.63 73.48 72.68 71.53 69.33 62.63 64.76 56.98 64.31Human Services 7.20 7.92 7.92 7.82 7.82 7.82 7.82 7.82 7.82Public Safety* 203.42 204.32 194.57 178.50 180.34 181.84 207.00 210.00 213.00Transportation 22.90 23.10 18.85 17.15 16.05 16.05 16.09 16.09 16.29Environmental Support/Protection 8.25 8.25 7.95 5.95 5.85 3.15 3.55 3.71 4.71Leisure/Cultural/Information Services 135.16 156.96 142.08 128.65 127.94 124.74 103.80 104.59 106.23Policy Development/Implementation 63.57 65.54 63.94 59.52 60.42 59.57 80.90 83.69 87.05Water 35.90 35.35 35.45 32.45 30.85 35.05 30.97 34.37 34.77Sewer 15.20 16.20 16.20 16.20 15.70 18.40 17.88 18.62 18.92Parking 5.47 5.55 5.45 5.35 5.65 5.65 5.65 5.65 5.65Docktown Marina** 0.13 0.13Port 11.00 10.00 10.00 10.00 10.00 10.00 9.00 9.00 8.00
Total 579.70 606.67 575.09 533.12 529.95 524.90 547.42 550.65 566.88
Fiscal YearDepartment*** 2017
City Council 7.00City Manager 7.49City Attorney 6.83City Clerk 4.41Administrative Services 41.99Community Development 70.31Fire 93.00Library 40.72Parks, Recreation, Community Svcs 71.66Police 128.00Public Works 97.39Port 8.00
576.80
with FTE in 2013-14.
***City began to report FTE by Department in FY 2016-17.
Source: Redwood City Adopted Budget
**The City took over the management of Doctown Marina in FY 2012-13, and began supporting operations
Fiscal Year
* Redwood City began providing fire services to the residents of San Carlos in FY 2013-14 as a result of a shared services agreement between the two cities.
145
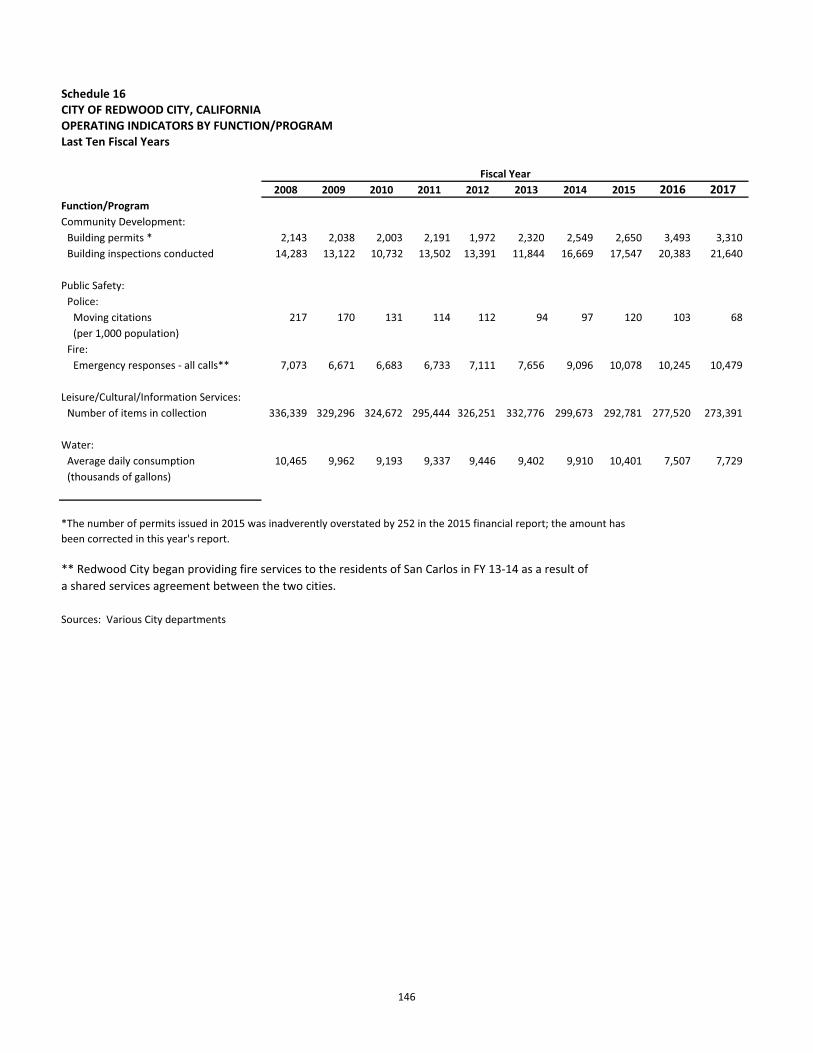
Schedule 16CITY OF REDWOOD CITY, CALIFORNIAOPERATING INDICATORS BY FUNCTION/PROGRAMLast Ten Fiscal Years
2008 2009 2010 2011 2012 2013 2014 2015 2016 2017Function/ProgramCommunity Development:
Building permits * 2,143 2,038 2,003 2,191 1,972 2,320 2,549 2,650 3,493 3,310Building inspections conducted 14,283 13,122 10,732 13,502 13,391 11,844 16,669 17,547 20,383 21,640
Public Safety:Police:
Moving citations 217 170 131 114 112 94 97 120 103 68(per 1,000 population)
Fire:Emergency responses - all calls** 7,073 6,671 6,683 6,733 7,111 7,656 9,096 10,078 10,245 10,479
Leisure/Cultural/Information Services:Number of items in collection 336,339 329,296 324,672 295,444 326,251 332,776 299,673 292,781 277,520 273,391
Water:Average daily consumption 10,465 9,962 9,193 9,337 9,446 9,402 9,910 10,401 7,507 7,729(thousands of gallons)
Sources: Various City departments
** Redwood City began providing fire services to the residents of San Carlos in FY 13-14 as a result of a shared services agreement between the two cities.
*The number of permits issued in 2015 was inadverently overstated by 252 in the 2015 financial report; the amount has been corrected in this year's report.
Fiscal Year
146

Schedule 17CITY OF REDWOOD CITY, CALIFORNIACAPITAL ASSET STATISTICS BY FUNCTION/PROGRAMLast Ten Fiscal Years
2008 2009 2010 2011 2012 2013 2014 2015 2016 2017Function/ProgramPublic Safety:
Police:Number of stations 1 1 1 1 1 1 1 1 1 1
Fire:Number of stations* 5 5 5 5 5 5 7 7 7 7
TransportationMiles of streets 155 155 155 155 155 155 155 155 155 155Number of street lights** 8,500 8,500 8,500 8,500 4,512 4,512 5,035 5,055 5,076 5076
Leisure/Cultural/Information ServicesNumber of parks 37 23 23 24 24 24 24 25 25 25Number of libraries 4 4 4 4 4 4 4 4 4 4Number of recreation center facilities 5 5 5 5 5 5 5 5 5 5
WaterMiles of water mains 264 264 264 264 264 264 262 262 262 262Miles of recycled water system lines 13 15 15 15 15 15 17 17 18 18
SewerMiles of sanitary sewers 185 193 193 193 193 193 196 198 198 198Miles of storm sewers 103 129 129 129 129 129 130 133 133 133
Sources: Various city departments
Notes: * In FY 2013-14 Redwood City entered into a shared services agreement with the City of San Carlos. Redwood City provides fire services to the residents of San Carlos out of the two fire stations located in San Carlos.
**In 2012 the Public Works Services division employed a consultant to create a physical inventory of street lights. Criteria was updated and applied for a more accurate count of the number of street lights in the City's right-of-way. Inventories were refined and lights were added through the LED conversion process in 2014.
Fiscal Year
147

Schedule 18CITY OF REDWOOD CITY, CALIFORNIACONSTRUCTION VALUESLast Ten Fiscal Years
Residential All Other Residences/Additions Other BuildingsConstruction Construction and Alterations Additions/Alterations
Number Number Number TotalFiscal Number Property of Permits Property of Permits Property of Permits Property PropertyYear of Units Value Issued Value Issued Value Issued Value Values
$ $ $ $ $2008 33 10,698,818 14 38,772,000 1,002 24,882,578 291 79,925,295 154,278,6912009 36 17,739,134 2 590,000 1,028 20,000,165 972 36,405,222 74,734,5212010 39 15,495,398 5 6,048,354 1,098 21,065,615 861 26,436,017 69,045,3842011 47 25,629,952 5 1,078,000 1,088 25,554,042 1,051 35,938,801 88,200,7952012 200 40,914,805 22 402,509 912 21,119,778 1,011 64,738,238 127,175,3302013 605 126,141,306 3 19,333,650 1,226 28,200,872 1,041 56,330,964 230,006,7922014 426 82,816,188 5 94,930,847 1,270 30,617,300 1,213 73,184,001 281,548,3362015 86 194,571,550 8 36,583,115 1,485 37,474,855 1,071 119,773,839 388,403,3592016 120 133,448,208 14 44,186,444 1,762 51,966,358 1,597 116,225,763 345,826,7732017 85 29,578,614 10 16,375,200 1,463 41,937,060 1,419 271,670,621 359,561,495
Source: Redwood City's Community Development Department
148

Building a Great Community Together

[THIS PAGE INTENTIONALLY LEFT BLANK]

APPENDIX K
Comprehensive Annual Financial Report for the City of San Carlos – Fiscal Year Ended June 30, 2017
[THIS PAGE INTENTIONALLY LEFT BLANK]
2016-2017COMPREHENSIVE
ANNUAL FINANCIAL REPORT
SAN CARLOS, CALIFORNIA� �

This Page Left Intentionally Blank

CITY OF SAN CARLOS, CALIFORNIA
COMPREHENSIVE ANNUAL FINANCIAL REPORT
FOR THE FISCAL YEAR ENDED JUNE 30, 2017
Prepared by
CITY OF SAN CARLOS FINANCE DIVISION

This Page Left Intentionally Blank

CITY OF SAN CARLOS
Comprehensive Annual Financial Report For the Fiscal Year Ended June 30, 2017
Table of Contents
Page�
INTRODUCTORY SECTION: Letter of Transmittal ................................................................................................................................ v Directory of Officials ............................................................................................................................... xii The Residents of the City of San Carlos ............................................................................................... xiii Administrative Services ......................................................................................................................... xiv Certificate of Achievement for Excellence in Financial Reporting (GFOA) .......................................... xv
FINANCIAL SECTION: Independent Auditor’s Report on Basic Financial Statements ....................................................... 1 Management’s Discussion and Analysis ........................................................................................... 5 Basic Financial Statements: Government Wide Financial Statements: Statement of Net Position ...................................................................................................... 21 Statement of Activities ........................................................................................................... 22 Fund Financial Statements: Governmental Funds: Balance Sheet .................................................................................................................... 26 Reconciliation of the Governmental Funds – Balance Sheet with the Statement of Net Position .............................................................................................. 28 Statement of Revenues, Expenditures, and Changes in Fund Balances .......................... 30 Reconciliation of the Net Change in Fund Balances – Total Governmental Funds with the Statements of Activities ......................................................................... 32 Budgetary Comparison Statement by Department – General Fund .................................. 34

CITY OF SAN CARLOS
Comprehensive Annual Financial Report For the Fiscal Year Ended June 30, 2017
Table of Contents
Page FINANCIAL SECTION (Continued): Proprietary Funds: Statement of Net Position .................................................................................................. 38 Statement of Revenues, Expenses and Changes in Net Position .................................... 39 Statement of Cash Flows ................................................................................................... 40 Fiduciary Funds: Statement of Fiduciary Net Position ................................................................................... 42 Statement of Changes in Fiduciary Net Position ............................................................... 43 Notes to Basic Financial Statements ........................................................................................... 45 Required Supplementary Information:
Schedule of the Proportionate Share of the Net Pension Liability – CalPERS Cost Sharing Plan ........................................................................................... 93 Schedule of Plan Contributions – CalPERS Cost Sharing Plan ................................................. 94 Schedule of Changes in the Net Pension Liability and Related Ratios –
PARS Longevity Recognition Plan .................................................................................. 95 Schedule of Plan Contributions – PARS Longevity Recognition Plan ........................................ 96 Schedule of Plan Contributions – Other Post-Employment Benefits .......................................... 97 Schedule of Funding Progress – Other Post-Employment Benefits ........................................... 97 Supplementary Information:
Major Governmental Funds, Other than the General Fund: Capital Improvement – Budgetary Comparison Schedule ..................................................... 101 Housing – Budgetary Comparison Schedule ......................................................................... 102 Non-major Governmental Funds: Combining Balance Sheet ............................................................................................... 104 Combining Statement of Revenues, Expenditures, and Changes in Fund Balances ......................................................................................................... 108

CITY OF SAN CARLOS
Comprehensive Annual Financial Report For the Fiscal Year Ended June 30, 2017
Table of Contents
Page FINANCIAL SECTION (Continued): Budgetary Comparison Schedules – Special Revenue Funds: NPDES ............................................................................................................................. 111
Police Grants ................................................................................................................... 112 San Carlos Library Tenant ............................................................................................... 113 Capital Project Funds Equipment Replacement .................................................................................................. 114 Measure A ........................................................................................................................ 115 Gas Tax ........................................................................................................................... 116 Park Fee .......................................................................................................................... 117 Parking In-Lieu ................................................................................................................. 118 Debt Service Funds San Carlos Library Bonds ................................................................................................ 119 Internal Service Funds: Combining Statements of Net Position ............................................................................ 122 Combining Statements of Revenues, Expenses and Changes in Net Position ............... 123 Combining Statements of Cash Flows ............................................................................. 124 Fiduciary Funds: Combining Statement of Changes in Assets and Liabilities – Agency Funds .................. 126
STATISTICAL SECTION: Net Position by Component – Last Ten Fiscal Years .......................................................... 130 Changes in Net Position – Last Ten Fiscal Years ................................................................ 132 Fund Balances of Governmental Funds – Last Ten Fiscal Years ....................................... 136 Changes in Fund Balance of Governmental Funds – Last Ten Fiscal Years ...................... 138 Assessed and Estimated Actual Value of Taxable Property – Last Ten Fiscal Years ......... 140

CITY OF SAN CARLOS
Comprehensive Annual Financial Report For the Fiscal Year Ended June 30, 2017
Table of Contents
Page STATISTICAL SECTION (Continued): Direct and Overlapping Property Tax Rates – Last Ten Fiscal Years ................................. 141 Top Ten Property Tax Payers – Current Year and Ten Years Ago ..................................... 142 Property Tax Levies and Collections – Last Ten Fiscal Years ............................................ 143 Ratio of Outstanding Debt by Type – Last Ten Fiscal Years ............................................... 144 Ratio of General Bonded Debt Outstanding – Last Ten Fiscal Years ................................. 145 Pledged-Revenue Coverage – Sewer Fund – SVCW – 2008, 2009, 2014 and 2015 Financing Agreement – Last Seven Fiscal
Years ............................................................................................................................... 146 Computation of Direct and Overlapping Debt ...................................................................... 147
Computation of Legal Bonded Debt Margin ......................................................................... 148
Demographic and Economic Statistics – Last Ten Fiscal Years ......................................... 149
Principal Employers ............................................................................................................. 150
Full Time Equivalent City Employees by Function – Last Ten Fiscal Years ........................ 151
Operating Indicators by Function/Program – Last Ten Fiscal Years ................................... 152 Capital Assets by Function/Program – Last Ten Fiscal Years ............................................. 153 �

November 27, 2017
To the Members of the City Council and Residents of San Carlos:
It is the policy of the City of San Carlos to annually publish a complete set of financial statements presented in conformity with Generally Accepted Accounting Principles (“GAAP”) and audited in accordance with generally accepted auditing standards by an independent firm of certified public accountants. Pursuant to that requirement, we hereby issue the comprehensive annual financial statements of the City of San Carlos (“the City”) for the fiscal year ended June 30, 2017.
This report consists of management’s representations concerning the finances of the City. Consequently, management assumes full responsibility for the completeness and reliability of all the information presented in this report. To provide a reasonable basis for making these representations, management of the City has established a comprehensive internal control framework that is designed both to protect the City’s assets from loss, theft, or misuse and to compile sufficiently reliable information for the preparation of the City’s financial statements in conformity with GAAP. Because the cost of internal controls should not outweigh their benefits, the City’s comprehensive framework of internal controls has been designed to provide reasonable rather than absolute assurance that the financial statements will be free from material misstatement. As management, we assert that, to the best of our knowledge and belief, this financial report is complete and reliable in all material respects.
The City’s financial statements have been audited by Maze & Associates, a firm of certified public accountants. The goal of the independent audit is to provide reasonable assurance that the financial statements of the City for the fiscal year that ended June 30, 2017 are free of material misstatement.The independent audit involved: examining, on a test basis, evidence supporting the amounts and disclosures in the financial statements; assessing the accounting principles used and significant estimates made by management; and evaluating the overall financial statement presentation. The independent auditor concluded, based upon the audit, that there was a reasonable basis for rendering an unmodified opinion that the City’s financial statements for the fiscal year that ended June 30, 2017 were fairly presented in conformity with GAAP. The independent auditor’s report is presented as the first component of the financial section of this report.
GAAP requires that management provide a narrative introduction, overview and analysis to accompany the basic financial statements in the form of Management’s Discussion and Analysis (“MD&A”). This letter of transmittal is designed to complement the MD&A and should be read inconjunction with it. The City’s MD&A can be found immediately following the report of the independent auditors.
Profile of the Government
The City, incorporated in 1925, is located in the San Francisco Bay Area region of the State of California, which is considered to be one of the most expensive areas of the state and country in which to live. The area also is renowned worldwide for technological innovation as home to Silicon
�
Valley. The City currently occupies a land area of six square miles and serves a population ofapproximately 29,000. The City is a General Law city, and empowered to levy a transient occupancy tax on hotel/motel stays and a business registration fee on for-profit businesses within its boundaries. It also is empowered by State statute to extend its corporate limits by annexation, which occurs periodically when deemed appropriate by the City Council.
The City has operated under the council-manager form of government since 1925. Policy-making and legislative authority are vested in a City Council consisting of the Mayor, selected by the Council, and four other Council Members. The City Council is responsible for, among other things, passing ordinances, adopting the budget, appointing advisory commissions/committees, and hiring both the City Manager and City Attorney. The City Manager is responsible for carrying out the policies and ordinances of the City Council, for overseeing the day-to-day operations of the City, and for appointing the heads of the various departments. The City Council is elected on a non-partisan,at large basis. Council Members serve four-year staggered terms, with two or three Council Members elected every two years. The Mayor and Vice-Mayor are selected from among the five Council Members to serve one-year terms.
The City provides a full range of services, including: police and fire; the construction and maintenance of highways, streets and other infrastructure; and recreational activities and cultural events.
Budget Process
The goals of the biennial budget process are to identify necessary and/or desirable service increaseoptions and identify possible service reduction options, which are all combined to reach a balanced and sustainable budget. Each City department is provided with a base budget with certain inflationary increases and is given an opportunity to request additional funding if needed. The City Manager, Assistant City Manager, Administrative Services Director and the Financial Services Manager meet with each department individually to discuss and finalize the proposed budget recommendations. In the second year of the two-year budget cycle, departments are given another opportunity to review their projections and budgets and request additional funding if needed. Those recommendations are also reviewed by the City Manager and Administrative Services Director. TheCity Manager then presents the proposed biennial budget or mid-cycle review budget to the Councilfor review prior to the end of May every year. The Council holds a public hearing on the proposed budget and adopts a final budget by the end of June, the close of the City’s fiscal year. The appropriated budget is prepared by fund, function/program (e.g., public safety) and department (e.g., Community Development). Department heads may make transfers of appropriations within a department. Transfers of appropriations between departments, but within the same fund, can be approved administratively (by the Administrative Services Director or City Manager).
Transfers between funds require the approval of the City Council. Budget-to-actual comparisons are presented in the supplementary section of the accompanying financial statements for each individual governmental fund for which an appropriated annual budget has been adopted.
Economic Condition and Outlook
The information presented in the financial statements is perhaps best understood when it isconsidered from the broader perspective of the specific environment of which the City operates.
Local EconomyThe unemployment rate in San Mateo County has decreased from 3.3% in 2016 to 2.9% in 2017.The San Carlos unemployment rate is at the same level as the County at 2.9%. This compares with
��
an unemployment rate of 4.9% for California and 4.4% for the nation during the same period. As of June 2017, there were an estimated 434,900 jobs in the County, an increase of 4,000 jobs from a year earlier. According to the California Employment Development Department, the total number of jobs located in the West Bay counties of San Francisco and San Mateo expanded by 8,900, to a total of 1,007,300 between June 2016 and June 2017.
The National Association of Realtors released a report that shows the national median existing home price of $263,800 in June 2017. This number reflects an increase of 6.8% from June 2016.However, the median sales price of existing homes in San Carlos is $1,680,000; a 9.2% increasefrom the same period a year ago.
Unemployment and real estate markets reflect a local economy that is expanding and as such we expect continued solid growth that will over time translate into higher municipal revenues.
State Budget Overview
The Fiscal Year 2017-18 budget reflects the State’s continuing concern about the dangers of overspending and the pending recession that will likely follow the last eight years of economic expansion. After four years of balanced budgets with small budget surpluses, this year’s budget projects a $1.6 billion deficit for the fiscal year that started July 1, 2017. State revenues are still growing and projected to grow. However, the trajectory of that growth is declining and the budget lays out some tough choices to rein in spending in the face of the deficit and lower growth. The state’s Rainy Day Fund will receive more funding this year, but it will be only at 66% of its required balance.
Several factors make State budgeting in California challenging. Although the State has the most progressive tax structure in the nation, that in turn results in more volatility because of the reliance on capital gains. Income, sales and corporation taxes comprise the “big three” revenue sources for California. This year there is more uncertainty resulting from the impacts of unknown changes that continue to be made by the Trump Administration. The State budget cannot fully account for how new federal policies will impact California.
Important issues for California cities include the allocation of $2.8 billion in transportation funds under Senate Bill (SB) 1 and the cannabis trailer bill, SB 94, which reconciled existing medical marijuana law with recently enacted Proposition 64. Negotiations about long-term water conservation are ongoing, with a number of policy bills moving forward, but none yet in place. In addition, the State budget does not include meaningful funding for affordable housing to address our region’s housing crisis. This issue is expected to remain open and the topic of intense debate throughout the remainder of the year.
Sales Tax
Sales tax is a critical revenue source as it accounts for approximately 27.7% of total general fund revenues. Local general sales tax in fiscal year 2017 was $10.8 million, an 8.4% increase as compared to the fiscal year 2016 amount of $9.9 million. The increase reflects stable economic growth and increased amount of online purchases. Based on the latest sales tax data, sales tax growth will be higher in the coming year. Receipts from fuel/service stations, building and construction, and restaurant sales categories continue to show solid gains, reflecting the rising household income and the increased spending on home improvements, fuel consumption, and dining. The acceleration in online shopping for merchandise shipped from out-of-state makes the
���
countywide use tax allocation one of the larger components of sales and use tax gains for the Cityand is expected to increase in the upcoming year.
Property Tax
According to the information from our independent third-party consultant, while the median existing home prices have increased by 9.2% from 2017, the inventory of homes available for sale remains low, keeping the growth at a moderate level. The gross assessed values of properties in San Carlos have increased by 9.1% in 2017 as compared to a 7.8% increase countywide. Property tax increased by $0.7 million compared to the prior year due to the increase in assessed values.
Financial Policies
In June 2008, the City Council approved financial policies formalizing long standing practices that had been used in the past to prepare the budget. The policies were established to ensure that the City's finances are managed in a manner that will: (1) continue to provide for the delivery of quality services; (2) maintain and enhance service delivery as the community grows in accordance with the General Plan; (3) guarantee a balanced budget annually assuring that the City is always living within its means; and (4) establish reserves necessary to meet known and unknown future obligations.These financial policies are reviewed and updated as needed every two years as part of the biennial budget process.
Financial ControlThe Finance Division of the City is responsible for establishing and maintaining an appropriate internal control structure surrounding the safeguarding of assets and the reliability of financial records for preparing the financial statements in conformity with GAAP and maintaining asset accountability. The internal control structure is designed to provide reasonable, but not absolute, assurance that these objectives are met. The concept of reasonable assurance recognizes that: (1) the cost of a control should not exceed the benefits likely to be derived; and (2) the valuation of costs and benefits requires estimates and judgments by management. We believe the City's systems of internal accounting controls adequately safeguard assets and provide reasonable assurance that financial transactions are properly recorded.
Cash ManagementIn accordance with the Municipal Code of the City and under authority granted by the City Council, the City Administrative Services Director is responsible for investing the unexpended cash in the City Treasury. The investment of the funds of the City of San Carlos is directed to the goals of safety, liquidity, and yield. The authority governing investments for municipal governments is set forth in the California Government Code, Sections 53601 through 53659.
The primary objective of the investment policy of the City of San Carlos is the Safety of Principal. Investments shall be placed in those securities as outlined by type and maturity sector in the City’s Investment Policy. Effective cash flow management and resulting cash investment practices are recognized as essential to good fiscal management and control. The City's portfolio shall be designed and managed in a manner responsive to the public trust and consistent with State and local law. Portfolio management requires continual analysis and as a result the balance between the various investments and maturities may change to give the City the optimum combination of necessary liquidity and optimal yield based on cash flow projections.
����
Risk Management
Comprehensive general liability coverage is secured through the Association of Bay AreaGovernments (“ABAG”) Plan (“Plan”), a non-profit public benefits corporation established to provide liability insurance, claims, risk management, and legal defense services to participating members.Cities contract with the Plan through a liability coverage agreement that is very similar to a comprehensive general liability, commercial auto, and public officials' errors and omissions policies.The Plan provides $5,000,000 of general and automobile liability coverage per occurrence and $25,000,000 excess liability coverage per occurrence (providing a total of $30,000,000 per occurrence) and is responsible for paying claims in excess of the City's $100,000 deductible.
For Workers’ Compensation coverage, the City participates in the Cities Group, created by a joint powers agreement to provide Workers Compensation coverage of up to $10,000,000 per occurrence in excess of $1,500,000 for safety officers and $1,000,000 for miscellaneous employees. The Group acts as administrator, claim adjuster, and provider of other risk management services as required by State law. Each member of the Group pays a premium commensurate with the level of coverage requested and shares surpluses and deficits proportionately to its participation in the Group. Additional information concerning the City's participation in risk pools for liability and Workers' Compensation is provided in Note 12 to the financial statements.
Long-term Financial Planning and Major Initiatives
Long-term Financial Planning
The City Council and City management continue to emphasize “structural balance” in the City’s financial planning. The City has established economic reserves to meet future opportunities and unexpected changes and has structurally aligned its revenues and expenditures to provide for a sustainable financial balance. To that end, the City has taken the following steps over the years:
� Budget revenues conservatively and expenditures at full cost;� Maintain the condition of City facilities and infrastructure to optimize the use and minimize
future repair/replacement costs;� Maintain a highly motivated, talented, and well-trained workforce to serve the needs of the
community;� Retain municipal ownership of commercial properties and use ground leases to diversify the
City’s revenue stream;� Secure outside funding and/or low-cost debt financing, and set aside City resources to pay
for capital improvement program projects; and� Limit the growth of on-going expenses for City services to a financially sustainable level.
Major Events and Initiatives
Highlights of the City’s major events and initiatives that were completed or in progress as of June 30, 2017 or soon after the year-end are as follows:
In September 2016, the City launched a free commuter shuttle service. This service runs to/from the Caltrain station to various stops on the east side to serve businesses during the morning and afternoon commute hours. This shuttle is generously funded by a two-year grant through the San Mateo County Transportation Authority Measure A Local Shuttle Program and partnerships between the City and Commute.org, Nugen, Natera, Novartis and the Sutter Health Palo Alto Medical Foundation.
��

The City is currently in the design process to convert the Holly Street/Highway 101 Interchange from a four-quadrant cloverleaf design into ramps with signalized intersections and construct a new pedestrian and bicycle overcrossing. The goal is to increase vehicle safety and capacity, while also reducing pedestrian and bicycle conflicts. Funding for this project has been raised through Measure A Highway funds, Transportation Development Act Article III Pedestrian and Bicycle funds, Bicycle Pedestrian Improvement Program funds, Bike Path Program funds, Active Transportation Programfunds, and funds from the City’s Traffic Mitigation Fee and Successor Agency 2007 bond proceeds.
The City completed a project to remove over 7,000 cubic years of sediment accumulated over 25 years from the Holly Street East and West channels and Belmont and Cordilleras Creeks. This project maximized flow capacity for runoff and prevented flooding of the east part of the city.
Park Maintenance staff responded to the call to reduce water consumption in City parks by creating a water savings bank that resulted in a 30% water reduction. Staff also focused on eliminating unnecessary decorative turf areas, substituting drought resistant plantings and modifying irrigation systems from spray to drip operation.
Construction on four large developments began during this past fiscal year:
� The Wheeler Plaza development began in March 2017. This project will bring 109 condominium housing units to San Carlos along with 196 dedicated parking spaces. The project will also consist of a two-level public parking structure with 252 public parking spaces that will include electric vehicle charging stations and covered bicycle parking – resulting in an increase of 65 parking spaces in the Downtown. 10,000 new square feet of commercial space along San Carlos Avenue will also be added, in addition to a downtown plaza with public access. The project is estimated to be completed in Fall 2018.
� The Marriott Residence Inn and Suites development began in May 2016 at the Landmark Site close to the Holly/101 Interchange. The hotel will include 204 guest rooms, with associated surface parking and site landscaping. The entire project is expected to be completed by December 2017.
� The San Carlos Transit Village development began in May 2016. The San Carlos Transit Village will include 202 residential multi-family housing units (10% of which will be below-market rate housing), in addition to a small amount of commercial, office, and retail space. The project will be one of the first major mixed-use transit-oriented developments adjacent to a Caltrain station on the peninsula.
� The Honda Dealership construction began in April 2016 at 775 Industrial Way. The project proposes to develop an inventory parking lot and showroom and is expected to be completed in early 2018.
The City has approved an application from Windy Hill Property Ventures for a new Class A office complex on Industrial Road at the corner of Bransten Road, called Meridian 25. The project will include demolition of existing industrial buildings and construction of two new office buildings with landscaping, space for outdoor amenities, bicycle parking spaces, and a six-level parking structure that can accommodate approximately 1,510 vehicles. Construction is anticipated to begin Summer 2018.
In June 2017, the City Council approved the Hilton Garden Inn Hotel Project at 1091 Industrial Road. The seven-story hotel includes a lobby with guest dining services, offices, and utility rooms on the first floor, five small meeting rooms on the second floor, guest rooms on the third floor, guest rooms
�

xi
and a pool with fitness facilities on the fourth floor and guest rooms on floors five, six, and seven. The development includes 162 guest rooms with an attached four-level (above grade) parking structure. Construction is anticipated to begin in April 2018.
Financial Awards and Acknowledgements
The Government Finance Officers Association ("GFOA") awarded a Certificate of Achievement for Excellence in Financial Reporting to the City for its Comprehensive Annual Financial Report ("CAFR") for the fiscal year ended June 30, 2016. This was the 23rd consecutive year that the City has received this prestigious award. To be awarded a Certificate of Achievement, the City published an easily readable and efficiently organized CAFR. This report satisfied both GAAP and applicable legal requirements.
A Certificate of Achievement is valid for a period of one year only. We believe that our current CAFR continues to meet the Certificate of Achievement Program's requirements and we are submitting it to the GFOA to determine its eligibility for another certificate.
This report represents the culmination of months of work by dedicated staff in the Administrative Services Department-Finance Division. Special thanks go to Financial Services Manager, Carrie Tam, Senior Accountants Tammy Mak and Paul Harris, Accounting Technicians Hannah Li and Karen Cao, Administrative Assistant Melissa Keefe, City Treasurer Michael Galvin, and the audit staff at Maze & Associates. Credit also must be given to City Council for its unfailing support for maintaining the highest standards of professionalism in the management of the City's finances.
Respectfully submitted,
Jeff D. Maltbie City Manager

City�of�San�Carlos�
�Directory�of�Officials�
�June�30,�2017�
�
�
�
CITY�COUNCIL��
����������� ������
�������������������� �����
�����������������������������
�������������������������
������������������������
�
�
�
CITY�CLERK��
������� ��������������������������������������
�
�
�
CITY�TREASURER��
������������ �������!��������
�
�
�
ADMINISTRATION��
��""� ����������� ���#���
!����$��������%��������� ���#���
���#������������������%��������
���#���������$��������"�
�������� ��&��������%&������ ��'�� �����������
%���(������$����)�������������������
����*�������$�����*������������
%��'� ��������������� ���+�������������
'���� ��+���,������"�
�
�
�
�
�
���
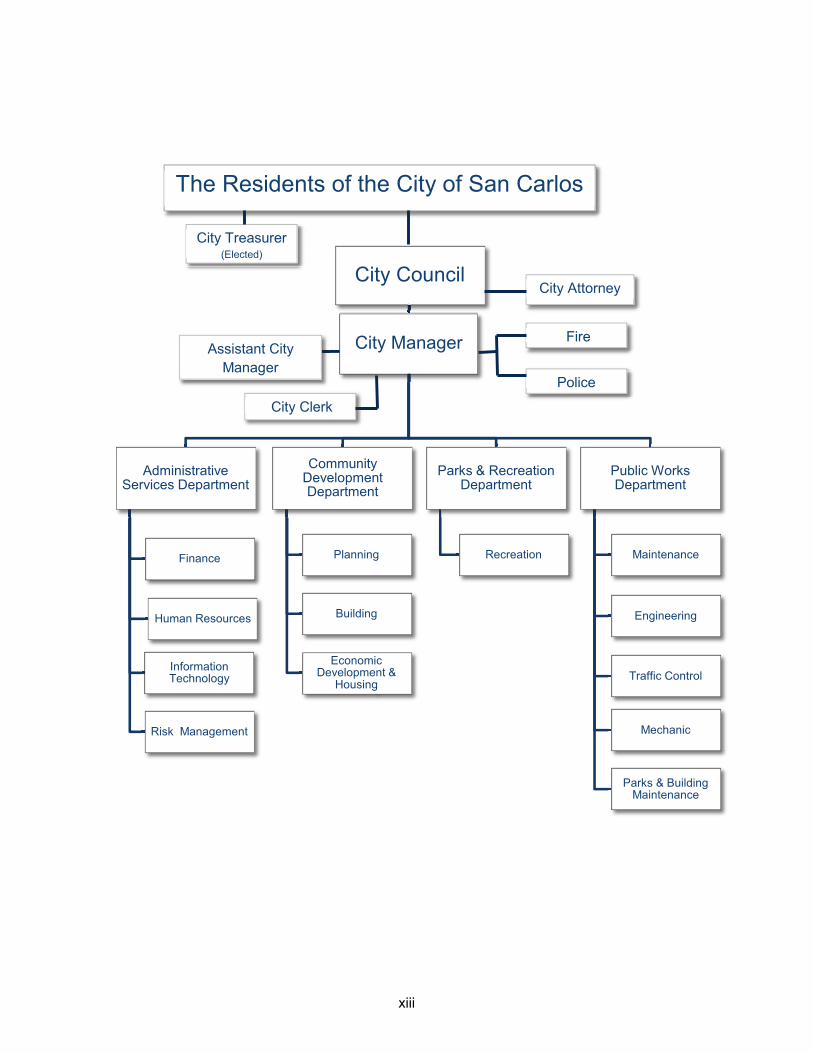
City Council
City Manager
Administrative Services Department
Finance
Human Resources
Information Technology
Risk Management
Community Development Department
Planning
Building
Economic Development &
Housing
Parks & Recreation Department
Recreation
Public Works Department
Maintenance
Engineering
Traffic Control
Mechanic
Parks & Building Maintenance
The Residents of the City of San Carlos
Fire
Police
City Clerk
City Attorney
City Treasurer (Elected)
Assistant City Manager
����

Administrative Services
���������� ������ ���� ���� ����
������� ���� ������ ��
�������� � ��
������
����������� ���� ������ ��
� ����������������
� ����������������
�������� �������������
�������� �����������
���������� �������������������
������������ �������������� ��
� ������� ��������
�� �������������
�� �������������
���������� ������
� ������������ � ��
������
���

xv
Government Finance Officers Association
Certificate of Achievement for Excellence
in Financial Reporting
Presented to
City of San Carlos
California
For its Comprehensive Annual Financial Report
for the Fiscal Year Ended
JUQe 30, 2016
~/.~ Executive Director/CEO
't
rf

This Page Left Intentionally Blank
INDEPENDENT AUDITOR’S REPORT To the Honorable Members of the City Council City of San Carlos, California Report on the Financial Statements We have audited the accompanying financial statements of the governmental activities, the business-type activities, each major fund, and the aggregate remaining fund information of the City of San Carlos, California, as of and for the year ended June 30, 2017, and the related notes to the financial statements, which collectively comprise the City’s basic financial statements as listed in the Table of Contents. Management’s Responsibility for the Financial Statements Management is responsible for the preparation and fair presentation of these financial statements in accordance with accounting principles generally accepted in the United States of America; this includes the design, implementation, and maintenance of internal control relevant to the preparation and fair presentation of the financial statements that are free from material misstatement, whether due to fraud or error. Auditor’s Responsibility Our responsibility is to express opinions on these financial statements based on our audit. We conducted our audit in accordance with auditing standards generally accepted in the United States of America and the standards applicable to financial audits contained in Government Auditing Standards, issued by the Comptroller General of the United States. Those standards require that we plan and perform the audit to obtain reasonable assurance about whether the financial statements are free from material misstatement. An audit involves performing procedures to obtain audit evidence about the amounts and disclosures in the financial statements. The procedures selected depend on the auditor’s judgment, including the assessment of the risks of material misstatement of the financial statements, whether due to fraud or error. In making those risk assessments, the auditor considers internal control relevant to the City’s preparation and fair presentation of the financial statements in order to design audit procedures that are appropriate in the circumstances, but not for the purpose of expressing an opinion on the effectiveness of the City’s internal control. Accordingly, we express no such opinion. An audit also includes evaluating the appropriateness of accounting policies used and the reasonableness of significant accounting estimates made by management, as well as evaluating the overall presentation of the financial statements. We believe that the audit evidence we have obtained is sufficient and appropriate to provide a basis for our audit opinions.
�

Opinions In our opinion, the financial statements referred to above present fairly, in all material respects, the respective financial position of the governmental activities, the business-type activities, each major fund, and the aggregate remaining fund information of the City as of June 30, 2017, and the respective changes in financial position and, where applicable, cash flows thereof and the respective budgetary comparisons listed in the Table of Contents as part of the basic financial statements for the year then ended in accordance with accounting principles generally accepted in the United States of America. Other Matters Required Supplementary Information Accounting principles generally accepted in the United States of America require that Management’s Discussion and Analysis and other required supplementary information as listed in the Table of Contents be presented to supplement the basic financial statements. Such information, although not a part of the basic financial statements, is required by the Governmental Accounting Standards Board, who considers it to be an essential part of financial reporting for placing the basic financial statements in an appropriate operational, economic or historical context. We have applied certain limited procedures to the required supplementary information in accordance with auditing standards generally accepted in the United States of America, which consisted of inquiries of management about the methods of preparing the information and comparing the information for consistency with management’s responses to our inquiries, the basic financial statements, and other knowledge we obtained during our audit of the basic financial statements. We do not express an opinion or provide any assurance on the information because the limited procedures do not provide us with sufficient evidence to express an opinion or provide any assurance. Other Information Our audit was conducted for the purpose of forming opinions on the financial statements that collectively comprise the City’s basic financial statements. The Introductory Section, Supplemental Information, and Statistical Section listed in the Table of Contents are presented for purposes of additional analysis and are not a required part of the basic financial statements. The Supplemental Information is the responsibility of management and was derived from and relates directly to the underlying accounting and other records used to prepare the basic financial statements. Such information has been subjected to the auditing procedures applied in the audit of the basic financial statements and certain additional procedures, including comparing and reconciling such information directly to the underlying accounting and other records used to prepare the basic financial statements or to the basic financial statements themselves, and other additional procedures in accordance with auditing standards generally accepted in the United States of America. In our opinion, the Supplemental Information is fairly stated in all material respects in relation to the basic financial statements as a whole. The Introductory and Statistical Sections have not been subjected to the auditing procedures applied in the audit of the basic financial statements and, accordingly, we do not express an opinion or provide any assurance on them.
Other Reporting Required by Government Auditing Standards
In accordance with Government Auditing Standards, we have also issued our report dated October 26, 2017 on our consideration of the City’s internal control over financial reporting and on our tests of its compliance with certain provisions of laws, regulations, contracts, and grant agreements and other matters. The purpose of that report is to describe the scope of our testing of internal control over financial reporting and compliance and the results of that testing, and not to provide an opinion on internal control over financial reporting or on compliance. That report is an integral part of an audit performed in accordance with Government Auditing Standards in considering the City’s internal control over financial reporting and compliance.
Pleasant Hill, California October 26, 2017
!

This Page Left Intentionally Blank

MANAGEMENT’S DISCUSSION AND ANALYSIS (MD&A)
This section of the City’s Comprehensive Annual Financial Report presents an overview and analysis of the City’s financial activities for the fiscal year ending June 30, 2017. We encourage readers to consider the information presented here in conjunction with the accompanying transmittal letter and basic financial statements.
FINANCIAL HIGHLIGHTS
City-wide:
� Total City assets increased by $12.9 million to $269.3 million, of which $222.1 millionrepresented governmental assets and $47.2 million represented business-type assets.
� City deferred outflows related to pension increased by $4.2 million to $9.2 million, of which$8.1 million represented governmental deferred outflows related to pension and $1.1 millionrepresented business-type deferred outflows related to pension.
� Total City liabilities increased by $5.1 million to $60.5 million, of which $54.4 million weregovernmental liabilities and $6.1 million were business-type liabilities.
� City deferred inflows related to pension decreased by $0.3 million to $1.8 million, of which $1.7million were governmental deferred inflows related to pension and $0.1 million were business-type deferred inflows related to pension.
� The City’s assets and deferred outflows of resources exceeded the liabilities and deferredinflows by $216.2 million (net position), which increased by $12.3 million. Of this amount,$33.8 million represents unrestricted net position, which may be used to meet thegovernment’s ongoing obligations to residents and creditors.
� City-wide revenues were $65.9 million, of which $49.0 million were generated bygovernmental activities that decreased by $2.1 million, and $16.9 million were generated bybusiness-type activities.
� City-wide expenses were $50.9 million, of which $41.3 million were incurred by governmentalactivities and $9.6 million were increased by business-type activities.
� Loss on the sale of capital assets incurred by governmental activities was $2.7 million.
Fund Level:
� Governmental funds increased by $8.7 million to $68.4 million. Of this amount, $2.7 million, or3.9%, was unassigned fund balance and available for spending at the City’s discretion.
� Governmental Fund revenues were $49.0 million, a decrease of $2.4 million from the prioryear.
� Governmental Fund expenditures were $40.9 million, a decrease of $14.7 million from theprior year.
� Enterprise Fund net position increased by $6.6 million to $42.1 million. Of this amount, $14.4million, or 34.1%, was unassigned fund balance and available for spending at the City’sdiscretion.
"

� Enterprise Fund operating revenues were $16.8 million in fiscal year 2017 compared to $16.8million in the prior year.
� Enterprise Fund operating expenditures were $11.4 million, a decrease of $0.2 million from$11.6 million from the prior year.
OVERVIEW OF THE FINANCIAL STATEMENTS
The annual report consists of four parts: 1) introductory section; 2) management’s discussion and analysis (this section); 3) basic financial statements; 4) required supplementary information; 5) optional section that presents combining statements for non-major governmental funds and internal service funds; and 6) statistical section.
The basic financial statements include two kinds of statements that present different views of the City:
� The first two statements are government-wide financial statements that provide both long-termand short-term information about the City’s overall financial status.
� The remaining statements are fund financial statements that focus on individual parts of the Citygovernment, reporting the City’s operations in more detail than the government-wide statements.
o The governmental funds statements tell how general government services, like publicsafety, were financed in the short term and what remains for future spending.
o Proprietary fund statements offer short- and long-term financial information about theactivities the government operates like businesses, such as the sewer system.
o Fiduciary fund statements provide information about fiduciary relationships – like theagency funds of the City – in which the City acts solely as agent or trustee for the benefit ofothers, to whom the resources belong.
The financial statements also include notes that explain some of the information in the financial statements and provide more detailed data. The statements are followed by a section of required supplementary information that provides additional financial and budgetary information.
Figure A-1 summarizes the major features of the City’s financial statements, including the portion of the City government they cover and the types of information they contain. The remainder of this overview section of the MD&A explains the structure and contents of each of the statements.
Figure A-1 City of San Carlos Comprehensive Annual Financial Report (CAFR)
IntroductorySection
Government-wideFinancial Statements
Governmental Funds Proprietary Funds Fiduciary Funds
Balance Sheet
Reconciliation of the Governmental
Funds Balance SheetStatement of Revenues,
Expendituresand Changes in Fund Balance
Statement of Revenues, Expenses and Changes
in Fund Net PositionReconciliation of the Net
Changes in Fund Balances Statement of Cash Flows
Statistical�Section
NOTES TO THE FINANCIAL STATEMENTS
INFORMATION ON INDIVIDUAL NON-MAJOR FUNDS AND OTHER SUPPLEMENTARY INFORMATION
Statement of Fiduciary Net Postion
Statement ofChanges in
Fiduciary Net Position
STATISTICAL SECTION
Com
preh
ensi
ve A
nnua
l Fin
anci
al R
epor
t (C
AFR
)
Introductory Sections
FinancialSection
Management's Discussion and Analysis
Fund Financial Statements
REQUIRED SUPPLEMENTARY INFORMATION
Statement of Net Position
Statement of Activities
Statement of Net Postion
#
Reporting the City as a Whole
The accompanying government-wide financial statements include two statements that present financial data for the City as a whole. One of the most important questions asked about the City’s finances is: “Is the City, as a whole, better off or worse off as a result of the year’s activities?” The Statement of Net Position and the Statement of Activities report information about the City as a whole and about its activities in a way that helps answer this question. These statements include all assets and deferred outflows of resources and liabilities and deferred inflows of resources using the accrual basis of accounting, which is similar to the accounting used by most private-sector companies. All of the current year’s revenues and expenses are taken into account regardless of when cash is received or paid.
These two statements report the City’s net position and the changes in it. One can think of the City’s net position – the difference between assets, deferred outflows of resources and liabilities and deferred inflows of resources – as one way to measure the City’s financial health, or financial position. Over time, increases and decreases in the City’s net position are one indicator of whether its financial health is improving or deteriorating. One will need to consider other non-financial factors, such as changes in the City’s property tax base and the condition of the City’s roads, to assess the overall health of the City.
In the Statement of Net Position and the Statement of Activities, we divide the City’s services into two kinds of activities:
� Governmental activities – Most of the City’s basic services are reported here. Sales taxes,property taxes, state subventions and other revenues finance most of these activities.
� Business-type activities – The City charges a fee to customers to help cover all or most of the costof the services.
Reporting the City’s Most Significant Funds
The fund financial statements provide detailed information about the City’s most significant funds – not the City as a whole. Some funds are required to be established by State law or by bond covenants. However, City Council establishes many other funds to help control and manage money for particular purposes or to show that the City is meeting administrative responsibilities for using certain taxes, grants or other money. The City’s two kinds of funds – governmental and proprietary – use different accounting approaches.
� Governmental funds – Most of the City’s basic services are reported in governmental funds, whichfocus on how money flows into and out of those funds and the balances left at year-end that areavailable for spending. These funds are reported using an accounting method called modifiedaccrual accounting, which measures cash and all other current financial assets that can readily beconverted to cash. The governmental fund statements provide a detailed short-term view of theCity’s general government operations and the basic services it provides. Governmental fundinformation helps determine whether there are more or fewer financial resources that can be spentin the near future to finance the City’s programs. The relationship or differences betweengovernmental activities (reported in the Statement of Net Position and the Statement of Activities)and governmental funds are described in the reconciliation that follows the fund financialstatements.
$

�
� Proprietary funds – When the City charges customers for the services it provides – whether to outside customers or to other units of the City – these services are generally reported in proprietary funds. Proprietary funds are reported in the same way that all activities are reported in the Statement of Net Position and the Statement of Activities. In fact, the City’s enterprise funds (a component of proprietary funds) are the same as the business-type activities reported in the government-wide statements, but provide more detail and additional information, such as cash flows, for proprietary funds. Internal service funds (the other component of proprietary funds) are used to report activities that provide supplies and services for the City’s other programs and activities.
Reporting the City’s Fiduciary Responsibilities The City is an agent for certain assets held for, and under the control of, other organizations and individuals. All of the City’s fiduciary activities are reported in a separate Statement of Fiduciary Net Position. These activities are excluded from the City’s other financial statements because the City cannot use these assets to finance its operations. The City is responsible for ensuring that the assets reported in these funds are used for their intended purposes. Agency Funds include: the Pulgas Drainage Assessment District Special Tax Bonds; the City/County Association of Governments of San Mateo County; and the South Bayside Waste Management Authority (SBWMA). The Private Purpose Trust Fund is used to report resources held in trust for the Successor Agency of the former Redevelopment Agency (RDA). Government-Wide Statement Summaries Net position may over time serve as a useful indicator of a City’s financial position. The City’s assets and deferred outflows of resources exceeded liabilities and deferred inflows of resources by $216.2 million at June 30, 2017.
Net Position Table 1 below reflects the City’s net position as of June 30, 2017 and June 30, 2016:
Table 1 City’s Comparative Statement of Net Position
June 30, 2017 and 2016 (Amounts in Millions)
Total% Change
2017 2016 2017 2016 2017 2016Current and other assets 78.3$ 68.9$ 19.5$ 20.8$ 97.8$ 89.7$ 9.0%Capital assets 143.8 144.9 27.7 21.8 171.5 166.7 2.9% Total Assets 222.1 213.8 47.2 42.6 269.3 256.4 5.0%
Deferred outflows related to pension 8.1 4.3 1.1 0.7 9.2 5.0 84.0% Total deferred outflow 8.1 4.3 1.1 0.7 9.2 5.0 84.0%
Current and other liabilities 7.9 6.4 1.3 3.2 9.2 9.6 -4.2%Long-term obligations 46.5 41.3 4.8 4.5 51.3 45.8 12.0% Total Liabilities 54.4 47.7 6.1 7.7 60.5 55.4 9.2%Deferred inflows related to pension 1.7 1.9 0.1 0.2 1.8 2.1 -14.3% Total deferred inflow 1.7 1.9 0.1 0.2 1.8 2.1 -14.3%
Net Position: Net investment in capital assets 139.8$ 140.6$ 27.7$ 21.8$ 167.5$ 162.4$ 3.1% Restricted 14.9 13.6 - - 14.9 13.6 9.6% Unrestricted 19.4 14.3 14.4 13.6 33.8 27.9 21.1%
Total Net Position 174.1$ 168.5$ 42.1$ 35.4$ 216.2$ 203.9$ 6.0%
Governmental Business - Type AllActivities Activities Government
%
The largest portion of the net position (77.5%) reflects the City’s $167.5 million investment in capital assets less any capital-related outstanding debt. Capital assets are the aggregated value of land, buildings and improvements that are used to provide services. Their value is reported net of related debt because the funds to repay the debt come from other sources. The City’s capital assets cannot be sold and used to liquidate liabilities. This portion for the net position increased by $5.1 million, or 3.1%, over the prior year mainly because of the addition in capital assets associated with the construction projects that were underway, such as the Sewer Capacity Assurance Improvements and the Sewer System Network Updates.
Another portion of the City’s net position is subject to external restrictions, such as debt covenants, grantor’s stipulations, or enabling legislation, on how they may be used. As of June 30, 2017, the restricted assets were 6.9%, or $14.9 million, of the total net position. Of this amount, $9.6 million is restricted for low and moderate income housing, $1.4 million for capital projects such as street repair and maintenance and $0.7 million for debt service. The remaining amount relates to Police grants and the Park In-Lieu fees.
The unrestricted net position of $33.8 million represents the remaining balance of the net position. Included in this portion of the net position is $6.7 million associated with the investment in the Silicon Valley Clean Water (SVCW) joint venture under the business-type activities; this amount is not readily available for day-to-day operational spending. The remaining portion of the unrestricted net position may be used to meet the City’s ongoing and unexpected expenses, including sewer expenses, facility and infrastructure improvements, pension-related liabilities, property acquisition and emergency repairs and replacement.
At the end of the current fiscal year, the City is able to report positive balances in all three categories of net position, both for the government as a whole and for its separate governmental and business-type activities. The City reported positive balances in these categories for the prior fiscal year as well.
&

Statement of Activities and Changes in Net Position The City’s net position increased by $12.3 million to $216.2 million during the current fiscal year as indicated in the Statement of Activities and Changes in Net Position (see Table 2 below).
Table 2 Statement of Activities and Changes in Net Position
June 30, 2017 and 2016 (Amounts in Millions)
Governmental AllActivities Activities Government % change
2017 2016 2017 2016 2017 2016Program Revenues: Charges for Services 8.7$ 9.9$ 16.8$ 16.8$ 25.5$ 26.7$ -4.5% Operating Grants & Contributions 2.1 1.7 - - 2.1 1.7 23.5% Capital Grants & Contributions 2.4 4.3 - - 2.4 4.3 -44.2%General Revenues: Property Taxes 12.8 12.1 - - 12.8 12.1 5.8% Other Taxes 16.9 15.9 - - 16.9 15.9 6.3% Other General Revenues 6.1 7.2 0.1 0.1 6.2 7.3 -15.1% Total Revenues 49.0$ 51.1$ 16.9$ 16.9$ 65.9$ 68.0$ -3.1%Program Expenses: General Government 6.3$ 6.0$ -$ -$ 6.3$ 6.0$ 5.0% Community Development 4.7 4.1 - - 4.7 4.1 14.6% Public Safety 18.3 17.4 - - 18.3 17.4 5.2% Public Works 8.0 8.3 - - 8.0 8.3 -3.6% Parks & Recreation 3.9 2.4 - - 3.9 2.4 62.5% Sewer Operations - - 9.6 14.1 9.6 14.1 -31.9% Interest Expenses 0.1 0.3 - - 0.1 0.3 -73.3% Total Expenses 41.3$ 38.5$ 9.6$ 14.1$ 50.9$ 52.6$ -3.3% Inc/(Dec) in Net Position before transfers and extraordinary gain 7.7$ 12.6$ 7.3$ 2.8$ 15.0$ 15.4$ -2.5% Loss on Sale of Capital Assets (2.7) - - - (2.7) - n/a Transfers 0.6 0.6 (0.6) (0.6) - - 0% Change in Net Position 5.6$ 13.2$ 6.7$ 2.2$ 12.3$ 15.4$ -20.0% Beginning Net Position 168.5$ 160.0$ 35.4$ 34.1$ 203.9$ 194.1$ 5.0% Restatement of Net Position - (4.7) - (0.9) - (5.6) -100.0% Ending Net Position 174.1$ 168.5$ 42.1$ 35.4$ 216.2$ 203.9$ 6.0%
Business-Type
The Statement of Activities presents program revenues and expenses and general revenues in detail. All of these are elements in the Changes in Net Position summarized in Table 2.
As of June 30, 2017, the City’s total net position was $216.2 million. This is an increase of $12.3 million, or 6.0%, from the prior year. The changes in net position are explained in the following paragraphs. Total revenue of all government-wide activities was $65.9 million, a decrease of $2.1 million, or 3.1%, while the total expense of all government-wide activities decreased by $1.7 million, or 3.3%, to $50.9 million.
Governmental Activities
Net position in the governmental activities totaled $174.1 million, an increase of $5.6 million, or 3.3%, from the prior year.
Total revenue for the City’s governmental activities before extraordinary gain and transfers decreased by $2.1 million, or 4.1%, to $49.0 million. Total governmental activity expenses increased by $2.8 million, or 7.2%, to $41.3 million. The loss on the sale of a capital asset was $2.7 million and transfers into governmental activities from the sewer fund were $0.6 million.
�'

As shown in the Statement of Activities, the amount that taxpayers ultimately financed for these activities through City taxes was $29.7 million, as some of the cost was paid by those who directly benefited from the programs ($8.7 million), or by other governments and organizations that subsidized certain programs with grants and contributions ($4.5 million), or by other general revenues ($6.1 million).
The reasons for significant changes in the revenues and expenses of the City’s governmental activities are as follows:
� Property taxes increased by $0.8 million, or 6.2%, to $12.8 million due to the increase in theassessed value for properties.
� Sales taxes increased by $0.9 million, or 8.1%, to $11.6 million in comparison with the prior yearmainly due to the stable economic growth and the revenue from new large building andconstruction retail businesses in the city.
� Charges for Services decreased by $1.2 million, or 12.1%, to $8.7 million, mainly from decreasedrevenues related to building plan checks and permits, encroachment permits and traffic impactmitigation fees collected on large scale development projects, such as the Transit Village and theLandmark Hotel, which began in the prior fiscal year. Revenue related to development activitiescan fluctuate from year to year depending on the timing of large construction projects and whendevelopers pull their permits. The development-related decreases were offset by increases inrecreation class revenue.
� Capital Grants and Contributions decreased by $1.9 million, or 44.2%, to $2.4 million, due toseveral grants received in the prior year from the California Department of Transportation for theSan Carlos Streetscape and Pedestrian Improvement Phase 1, El Camino Landscaping andLighting and East Side Community/Transit Connectivity projects. These projects were completedin the prior year. During the previous fiscal year, the City of Redwood City contributed to the StormDrain Maintenance project but no external funding was received in the current fiscal year.
� Operating Grants and Contributions increased by $0.4 million, or 23.5%, to $2.1 million, due to anincrease in the below market rate housing fee from several new construction projects forcondominiums.
� Other general revenues decreased by $1.1 million, or 15.3%, from the prior year. The decrease isprimarily a result of one-time revenue received in the prior year associated with the extension of alease agreement with the Inns of America in the amount of $0.8 million and $0.3 million for a digitalbillboard.
� Governmental expenses totaled $41.3 million in the fiscal year 2016-17, an increase of $2.8million from the prior year’s expenses of $38.5 million. The increase is mainly associated withincreases in Other Post-Employment Benefits (OPEB) and increases in pension expensesprimarily in the Parks and Recreation, Community Development and Public Works departments,and increases in costs for contracted services for public safety.
� Governmental activities included a loss on the sale of a capital asset in the amount of $2.7 million.This transaction was part of a Development Agreement and as such a property in the downtownwas sold to developers for $1 to encourage additional housing and economic development. Thesale will result in a long term benefit to the City and the region. A more detailed explanation of theloss on the sale of capital assets can be found in Note 5A.
��

�
Business-Type Activities
Business-type activities’ total net position for fiscal year 2016-17 was $42.1 million, an increase of $6.7 million, or 18.9%, from the prior year. The change in net position for fiscal year 2016-17 is $6.7 million. Although there was no sewer rate increase this year, the net position went up due to lower sewer infrastructure repair and maintenance expenses from the timing of capital improvement projects. The City’s investment in SVCW was also adjusted to reflect a net increase in the investment of $1.7 million, which was primarily due to the increase in the pass-through amounts for large scale development capacity. Every year the City adjusts this investment based on the City’s proportion of financial activity in SVCW.
Charges�for�Services
$8.7�18% Grants�&�
Entitlements$4.5�9%
Property�Tax$12.8�26%
Other�Taxes$16.9�35%
Other�General�Revenues
$6.1�12%
Revenues�by�Source�for�Governmental�Activities
($�in�millions)
General�Government
$6.3�15%
Community�Development
$4.7�12%
Public�Safety$18.3�44%
Public�Works$8.0�19%
Parks�&�Recreation
$3.9�10%
Interest�Expense
$0.1�0%
Expenses�for�Governmental�Activities($�in�millions)
�

The unrestricted portion of the ending net position includes $6.7 million in investment in the SVCW joint venture that is not readily available for day-to-day operational spending. As of June 30, 2017, SVCW has a balance of $130.4 million in long-term debt that it reports in its financial statements. Of that amount, the City’s share of the obligation is approximately $22.5 million. Since the City reports the SVCW joint venture as net investment, this obligation is not directly reported in the City’s financial statements as long-term debt. More information can be found in Note 13C to the Financial Statements.
Financial Analysis of the City’s Funds
As noted earlier, the City uses fund accounting to provide proper financial management of the City’s resources and to demonstrate compliance with finance-related legal requirements.
Governmental Funds
The General Fund is the chief operating fund of the City. At the end of the current fiscal year, total fund balance in the General Fund was $32.1 million, representing an increase of $2.4 million, or 8.1%, higher than the fiscal year 2015-16 fund balance of $29.6 million. This increase is explained in the following paragraphs.
Governmental funds’ total revenues were $8.1 million higher than the total expenditures. The General Fund revenues this year were $38.9 million, a decrease of $0.5 million, or 1.2%, from the prior year. The General Fund expenditures totaled $33.2 million, a decrease of $8.1 million, or 19.6%, from prior year expenditures of $41.3 million. The prior year expenditures included a loan payoff of $9.0 million related to the Landmark Hotel.
As a comparison, the increase in revenue between the fiscal years 2015 and 2016 was 15.5%, and the increase in expenditures was 41.9%. The previous year’s one-time loan payoff made up the majority of the difference in expenditures. When the loan payment is excluded, the total expenditures in the previous year would be $32.3 million, or an increase of $0.9 million compared to the current year’s amount of $33.2 million. The following chart shows the revenues and expenses over the years:
(Amounts in Millions)
FY 14 FY 15 FY 16 FY 17Total Revenues 31.5$ 34.1$ 39.4$ 38.9$ Dollar Change N/A 2.6$ 5.3$ (0.5)$
Percentage Change N/A 8.3% 15.5% -1.3%
General Fund Actual Revenues
31.50
34.10
39.40 38.90
27.3029.10
32.30
33.20
$24$26$28$30$32$34$36$38$40
2014 2015 2016 2017
Am
ount
s in
Mill
ions
Fiscal Year
General Fund Revenues & Expenditures
Revenue
�!

�
Significant changes in the revenues of the City’s General Fund from the prior year are as follows: � Property taxes increased by $0.7 million, or 7.1%, due to a general increase in the assessed
property values
� Sales tax increased by $0.8 million, or 8.4%, in comparison with the prior year mainly because of economic growth and the opening of large building and construction retail businesses in the city.
� Revenues from other agencies have decreased by $0.2 million, or 87.6%, since in the previous year. The City received a one-time reimbursement totaling $0.2 million from the State for mandated costs incurred during the 1990s through 2004.
� Charges for services decreased by $0.3 million, or 7.2%. In the previous year, there were development fees collected for several major new commercial and residential developments, including the Transit Village and Landmark Hotel projects, which are currently underway.
� Use of Money and Property decreased by $1.0 million, or 36.1%. The decrease is primarily a result of one-time payments of $0.75 million to extend a lease agreement with the Inns of America and $0.3 million for a digital billboard received in the prior year.
� Revenues from Licenses and Permits decreased by $0.6 million, or 23.7%. Similar to the reason for the decrease in the charges for services, fees collected in the prior year for building, electrical, plumbing, encroachment and mechanical permits were higher due to the on-set of several large projects. Those projects are currently under construction.
� Business Registration increased by $0.1 million, or 13.6%, due to an increased effort to collect delinquent business registration fees.
� Vehicle In-Lieu increased by $0.2 million, or 6.9%, compared to the prior year due to higher assessed values on properties. In May 2004, Gov. Schwarznegger proposed a swap of city and county vehicle license fees revenues for additional property tax share as a part of a state-local budget agreement. Each year, a portion of this revenue increases in proportion to the growth in assessed value.
� Other general revenues decreased by $0.3 million, or 16.5%, from the prior year. The decrease is primarily a result of a previous year one-time rebate payment from the San Mateo County Sheriff’s Office and a receipt of interest payment for the Association of Bay Area Governments (ABAG) loan from the developer of the Landmark property.
(Amounts in Millions)
FY 14 FY 15 FY 16 FY 17Total Expenditures 27.3$ 29.1$ 32.3$ * 33.2$ Dollar Change N/A 1.8$ 3.2$ 0.9$
Percentage Change N/A 6.6% 11.0% 2.8%
General Fund Actual Expenditures
*General Fund actual expenditures for Fiscal Year 2016 excludes repayment of ABAG loan.
Significant changes in the expenditures of the City’s General Fund from the prior year are as follows: � General Government expenditures have decreased slightly by $0.1 million, or 1.7%. The decrease
is primarily associated with the one-time relocation payments made to the Landmark property tenants in the previous year.
�(

� Community Development expenditures rose by $0.1 million, or 3.1%, as a result of new and filledpositions that were vacant in the prior year and increases in professional services for contractorsto assist with economic development and planning projects. This cost increase was offset by feescollected from developers.
� Public Safety expenditures are $0.5 million, or 2.8%, higher than the previous year. The primaryreason for the change is contract increases for fire, police and dispatch services.
� Public Works expenditures have increased by $0.4 million, or 10.3%. The majority of the increaseis associated with professional services related to plan review and surveys performed bycontractors in the Engineering Division and additional costs related to park maintenance.
Capital Improvement Fund – This fund has a fund balance of $16.5 million at the close of fiscal year 2016-17, which represents an increase of $4.2 million from the prior year. The primary reason for the increase in the fund is the decrease in capital project expenses. Last year, there were some large capital projects, such as the Adult Community Center Renovation Project, the Replacement of the City Hall Cooling Tower, Storm Drain Maintenance and the El Camino Real Landscaping and Lighting Project. Capital projects this fiscal year were deferred to future fiscal years as it has become difficult to find contractors to perform services. There was also a transfer of $3.4 million this year compared to a $2.5 million transfer from the General Fund to the Capital Improvement Fund in the previous year to fund capital projects. Revenue from other agencies decreased since there were fewer grant reimbursements this year compared to the previous fiscal year for capital projects. Licenses and permits or traffic impact mitigation fees also decreased compared to the prior year due to fewer large scale development projects in the current fiscal year.
Housing Capital Projects Fund – This fund is used to account for affordable housing-related financial activities. As of June 30, 2017, it has a fund balance of $9.6 million, which is restricted for housing purposes. The fund balance increased by $0.5 million compared to the prior year due to additional revenue received related to the Housing In-Lieu fees for the construction of two residential condominiums.
Other Governmental Funds – The total fund balance of $10.2 million for the Other Governmental Funds for this fiscal year increased by $1.6 million mainly because of fewer expenditures on construction projects such as the Annual Street Resurfacing and Traffic Marking and Striping projects. The delay of the purchase of the fire engine in the Equipment Replacement Fund also contributed to the increase of fund balances.
Major Enterprise Fund – The City’s proprietary fund statements provide the same type of information found in the government-wide financial statements. The Sewer Fund is the only enterprise fund reported in the proprietary funds Statement of Revenues, Expenses and Changes in Fund Net Position.
The Sewer Fund’s total net position at the end of the fiscal year was $42.1 million, an increase of $6.7 million, or 18.9%. The revenues in the Sewer Fund of $16.8 million remained consistent compared to the previous fiscal year as there was no increase in the sewer rates. The positive change in net position is largely a result of the timing of large capital infrastructure expenses.
Also, as stated previously, the City recorded an adjustment in the investment in SVCW during this fiscal year of $1.7 million. More detail on the investment can be found in Note 13C. Included in the $42.1 million ending net position is $6.7 million in investment in the SVCW joint venture that is not readily available for day-to-day operational spending.
Internal Service Funds – The City uses internal service funds to account for risk management, including worker’s compensation, general liability and property insurance. The Longevity Benefits Fund is used to account for other post-employment benefits (OPEB) for retired employees.
�"

General Fund Budgetary Highlights
The final General Fund budget differs from the original adopted budget by $0.5 million mainly because of amendments approved by City Council during the year. The increase in budgeted expenditures consisted of the following changes:
� Increase in the Community Development budget by $0.3 million. The primary reasons for thechanges are: (1) professional services for an amendment to the Strategic Zoning Ordinance toaddress development standards in the Single-Family, Downtown Core and Mixed-UseNeighborhood Zoning Districts, and for the creation, membership and appointment process ofan ad hoc House Size Advisory Committee (HSAC); (2) carry forward of funds for consultingfees to provide construction oversight and communication services; and (3) lease expense forthe SAMTRANS parking lot to help alleviate parking issues in the Downtown Core.
� Increase in the Public Works budget by $0.1 million for professional services for managementof the Open Space vegetation to remove fallen trees and reduce the chance of fires duringpeak seasons.
� Increase in the transfer out from the General Fund to the Capital Projects Fund by $0.1 millionfor the Highlands Park Playground Renovation and Restroom Replacement project.
Major deviations between the final budget of the General Fund and its actual operating results were as follows:
Total revenues were greater than the final budget by $2.2 million, or 5.9%. The City’s policy is to budget conservatively. Revenues are estimated using accepted standards and estimates provided by the State, other governmental agencies and outside consultants.
� Property taxes exceeded budget by $1.4 million, or 14.7%. The increases reflect higher securedtax rolls and property transfer activities.
� Sales taxes were greater than the budget by $0.7 million, or 7.3%, due to the stable economicgrowth and revenue received from new large building and construction retail businesses in thecity.
� Vehicle In-Lieu exceeded budget by $0.4 million, or 17.4%, due to higher assessed propertyvalues.
� Business registration exceeded budget by $0.1 million, or 9.6%, due to increased efforts oncollecting delinquent business registrations fees.
� Other revenue exceeded budget by $0.2 million, or 17.0%, due to increases in costreimbursements mainly from the County of San Mateo for the Successor Agency fees and fromthe joint power authorities.
� Franchise fee revenue exceeded budget by $0.1 million, or 5.5%, due to increases in solid wasterates and utilities.
� Transient occupancy taxes were less than budget by $0.4 million, or 19.3%, because of the delayin the completion of construction of the new Marriott Residence Inn and Suites Hotel (formerlyknown as the Landmark Hotel).
� Use of money and property revenues were less than budget by $0.3 million, or 14.2%, due to thetiming of a new digital billboard that was expected to be completed this fiscal year.
� Current charges for services were less than budget by $0.2 million, or 5.1%, due to the timing ofdevelopment fees for large construction projects that were expected to begin or be completed inthis fiscal year. As noted previously, the timing of these projects can vary depending on thedeveloper.
� License and permits slightly exceeded the budget by $0.1 million, or 2.6%, due to new residentialand commercial building projects and renovations of existing properties.
�#

�
Total expenditures were under budget by $3.8 million, or 10.4%.
� Salaries and benefits were under budget by $1.5 million, or 10.3%, due to the salary and benefit savings realized from vacant positions during the fiscal year.
� Operating expenditures were under budget by $2.2 million, or 9.1%, primarily in professional services due to the delays in the start and completion of certain projects and major developments, and cost savings from fuel, contracted public safety services and legal services.
Capital Assets and Debt Administration
Capital Assets
The City’s investment in capital assets for government and business-type activities amounts to $171.5 million as of June 30, 2017. The investment in capital assets includes land, buildings, machinery and equipment, park facilities, roads and streets. The total increase in capital assets for fiscal year 2016-17 is $4.8 million, or 2.9%. The increase relates to the current year capital assets additions. The increase is offset by the increase in depreciation and retirement of capital assets.
%Change
2017 2016 2017 2016 2017 2016Land and other assets not being depreciated 71.0$ 71.4$ 0.2$ 0.2$ 71.2$ 71.6$ -0.6%
Facilities, infrastructure and equpment, net of depreciation 72.8 73.5 27.5 21.6 100.3 95.1 5.5%
Total 143.8$ 144.9$ 27.7$ 21.8$ 171.5$ 166.7$ 2.9%
(Amounts in Millions)
Capital AssetsJune 30, 2017 and 2016
Activities Activities GovernmentGovernmental Business Type All
For the government-wide statement of net position presentation, all depreciable capital assets are depreciated from the acquisition date to the end of the current fiscal year.
Governmental fund financial statements record capital asset purchases as expenditures. Ongoing infrastructure projects are accounted for in construction-in-progress. Additional information about the City’s capital assets can be found in Note 5 to the financial statements. Long-Term Obligations
At the end of the fiscal year 2016-17, the City had total outstanding long-term obligations of $3.9 million, a decrease of 7.1%, due to the pay down of the bond.
%Change
2017 2016
2015 GO Refunding Bond 3.9 4.2 -7.1%
Total 3.9$ 4.2$ -7.1%
Outstanding Long-Term ObligationsJune 30, 2017 and 2016
(Amounts in Millions)
ActivitiesGovernmental
In February 2015, the Standard & Poor’s Rating Services has affirmed its “AAA” rating, with a stable outlook, on the City’s General Obligation debt. As of June 30, 2017, the City’s general obligation limit is $333 million, 3.75%, of total assessed valuation subject to taxation. With outstanding debt of $3.9 million subject to the legal debt limit, the City is not at risk of exceeding its legal debt limit.
�$
Additional information on the City’s long-term debt can be found in Note 7 to the accompanying financial statements.
Economic Factors and Next Year’s Budgets and Rates
The following key economic factors were considered in developing the fiscal year 2017-18 budget:
� Revenue Projections: The overall growth of the General Fund revenue is projected to beapproximately 11.7% higher than the fiscal year 2016-17 revised budget based on the steadyexpansion of the local economy, the increased construction and remodeling activities and theupward property tax and sales tax trends. The City is also expected to receive a tentativesettlement from the Pacific Gas and Electric Company for Natural Gas Transmission Line #147.The settlement money received will be placed into a restricted fund to be used toward futurecommunity benefit projects. Additional information about the settlement can be found in Note 14D.
� Expenditures: The overall General Fund expenditure is budgeted to be 4.2% higher than in thefiscal year 2016-17. The salary and benefits expenditure increases are based on the knownMemorandum of Understanding (MOU) provisions negotiated with bargaining groups andincreases in pension costs. CalPERS agencies that participate in the pension fund have beeninformed by CalPERS that pension costs will be increasing significantly due to the decrease in thediscount rate. There is also a projected increase to operating experiences in professional servicesfor known contract arrangements and anticipated needs for utilities, office and field programsupplies, equipment leases, facilities maintenance programs and training.
� Capital Improvement Project Funds: An update of the five-year Capital Improvement Plan wasincluded as part of the fiscal year 2016-18 budget process and revised during the review of themid-year budget. Changes to the existing project budget and the addition of new projects totaling$6.5 million were approved. The new projects include projects such as: (1) PedestrianEnhancement at Arroyo/Cedar and Hemlock/Orange Pathway; (2) Rail Corridor South of ArroyoAvenue Landscape Improvement; (3) Traffic Study – General Plan Environmental Impact ReportTraffic Update; (4) City Hall Dog Park Dust Control; (5) Arguello Park Play Area Surfacing; (6)Guardrail Installation at 7 Winding Way; (7) Cashiering System Replacement; (8) Chilton ParkMaster Plan; (9) Permit Management and Inspection Coordination Application (TrakIt) Upgrade;and (10) Fuel Station Upgrade.
� Sewer Rate Adjustments: Per City Council’s decision during the wastewater rate settingdiscussions in 2016, there will be a 5% sewer rate increase in fiscal year 2017-18. The revenuesare used to fund capital improvements and the City’s share of the SVCW’s sewer treatment plantimprovements.
Contacting the City’s Financial Management
This financial report is designed to provide our residents, taxpayers, customers, investors and creditors with a general overview of the City’s finances and to show the City’s accountability for the money it receives. Questions about this report or additional financial information can be obtained by contacting the Administrative Services Department at:
City of San Carlos Administrative Services Department
600 Elm Street San Carlos, CA 94070
(650) 802-4128
�%

CITY OF SAN CARLOS
STATEMENT OF NET POSITION AND STATEMENT OF ACTIVITIES
The Statement of Net Position and the Statement of Activities summarize the entire City’s financial activities and financial position.
The Statement of Net Position reports the difference between the City’s total assets and deferred outflows of resources and the City’s total liabilities and deferred inflows of resources, including all the City’s capital assets and all its long-term debt. The Statement of Net Position summarizes the financial position of all of the City’s Governmental Activities in a single column, and the financial position of all of the City’s Business-Type Activities in a single column; these columns are followed by a Total column that presents the financial position of the entire City.
The City’s Governmental Activities include the activities of its General Fund, along with all its Special Revenue, Capital Projects and Debt Service Funds. Since the City’s Internal Service Funds service these Funds, their activities are consolidated with Governmental Activities, after eliminating inter-fund transactions and balances. The City’s Business-Type Activities include all its Enterprise Fund activities.
The Statement of Activities reports increases and decreases in the City’s net position. It is also prepared on the full accrual basis, which means it includes all the City’s revenues and all its expenses, regardless of when cash changes hands. This differs from the “modified accrual” basis used in the Fund financial statements, which reflect only current assets, current liabilities, deferred outflows/inflows of resources, available revenues and measurable expenditures.
The Statement of Activities presents the City’s expenses first, listed by program, and follows these with the expenses of its business-type activities. Program revenues – that is, revenues which are generated directly by these programs – are then deducted from program expenses to arrive at the net expense of each governmental and business-type program. The City’s general revenues are then listed in the Governmental Activities or Business-type Activities column, as appropriate, and the Change in Net Position is computed and reconciled with the Statement of Net Position.
Both these Statements include the financial activities of the City and San Carlos Housing Authority, which is legally separate but is a component unit of the City because it is controlled by the City, which is financially accountable for the activities of these entities.
�&

This Page Left Intentionally Blank

CITY OF SAN CARLOS
STATEMENT OF NET POSITIONJUNE 30, 2017
Primary GovernmentGovernmental Business-Type
Activities Activities TotalAssets:Cash and investments 72,884,773$ 12,298,405$ 85,183,178$ Receivables:
Accounts 2,164,531 543,676 2,708,207Notes 1,328,772 - 1,328,772Down payment assistance loan program 729,290 - 729,290
Prepaid items 380,712 - 380,712Property held for resale 732,986 - 732,986Net OPEB asset - healthcare 21,540 3,219 24,759Investment in SVCW - 6,680,080 6,680,080Capital assets, not being depreciated:
Land 62,344,159 153,734 62,497,893Rights of way 2,413,714 - 2,413,714Construction in progress 6,244,921 37,431 6,282,352
Capital assets, net of depreciation 72,831,789 27,549,138 100,380,927
Total Assets 222,077,187 47,265,683 269,342,870
Deferred Outflows of Resources:Deferred pension related items 8,134,623 1,064,462 9,199,085
Total Deferred Outflowsof Resources 8,134,623 1,064,462 9,199,085
Liabilities:Accounts payable and accrued liabilities 3,687,210 1,223,338 4,910,548Accrued benefits 47,878 - 47,878Deposits payable 2,662,639 - 2,662,639Unearned revenue 434,531 - 434,531Non-Current Liabilities:
Due within one year 1,006,103 37,287 1,043,390Due in more than one year 4,332,849 24,858 4,357,707Net pension liability 42,198,906 4,810,091 47,008,997
Total Liabilities 54,370,116 6,095,574 60,465,690
Deferred Inflows of Resources:Deferred pension related items 1,749,146 134,144 1,883,290
Total Deferred Inflowsof Resources 1,749,146 134,144 1,883,290
Net Position:Net investment in capital assets 139,749,356 27,740,303 167,489,659Restricted for:
Public safety 220,910 - 220,910Parks and recreation 2,947,624 - 2,947,624Public works 1,424,405 - 1,424,405Debt Service 739,933 - 739,933Housing 9,580,579 - 9,580,579
Unrestricted 19,429,741 14,360,124 33,789,865
Total Net Position $ 174,092,548 $ 42,100,427 216,192,975$
See Notes to Financial Statements
�

CITY OF SAN CARLOS
STATEMENT OF ACTIVITIESFOR THE YEAR ENDED JUNE 30, 2017
Program RevenuesOperating Capital
Charges for Grants and Grants andFunctions/Programs Expenses Services Contributions ContributionsGovernmental Activities:
General government 6,329,346$ 1,297,282$ -$ -$Public safety 18,375,585 618,102 130,684 -Community development 4,700,675 3,618,051 683,805 -Parks and recreation 3,858,835 1,630,102 38,529 932,032Public works 7,978,435 1,502,215 1,240,562 1,484,784Interest on long-term debt 81,837 - - -
Total Governmental Activities 41,324,713 8,665,752 2,093,580 2,416,816
Business-type Activities:Sewer 9,663,209 16,793,613 - -
Total Business-type Activities 9,663,209 16,793,613 - -
Total Primary Government 50,987,922$ 25,459,365$ 2,093,580$ 2,416,816$
General revenues:Taxes:
Property taxes, levied for general purposeTransient occupancy taxesSales taxesFranchise taxes
Motor vehicle in lieu - unrestrictedUse of money and propertyLoss on sale of capital assetsMiscellaneous
Transfers
Total general revenues and transfers
Change in Net Position
Net Position, beginning of the year
Net Position, end of the Year
See Notes to Financial Statements
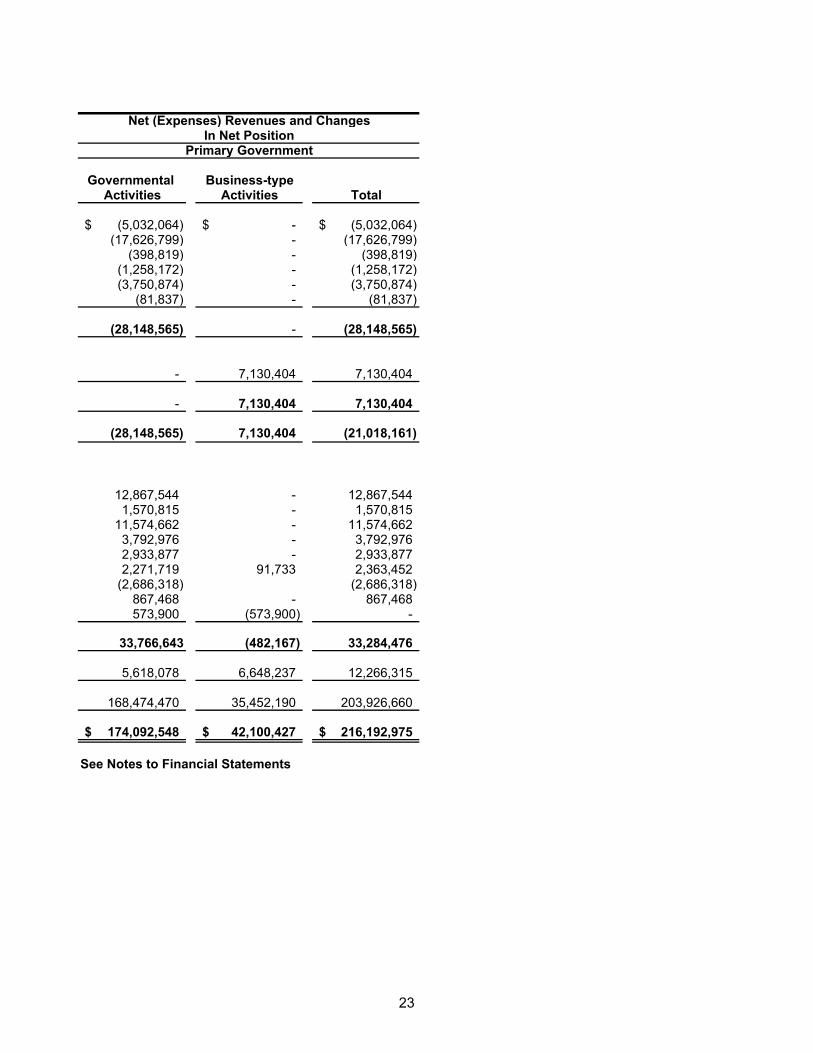
Net (Expenses) Revenues and ChangesIn Net Position
Primary Government
Governmental Business-typeActivities Activities Total
(5,032,064)$ -$ (5,032,064)$ (17,626,799) - (17,626,799)
(398,819) - (398,819)(1,258,172) - (1,258,172)(3,750,874) - (3,750,874)
(81,837) - (81,837)
(28,148,565) - (28,148,565)
- 7,130,404 7,130,404
- 7,130,404 7,130,404
(28,148,565) 7,130,404 (21,018,161)
12,867,544 - 12,867,5441,570,815 - 1,570,815
11,574,662 - 11,574,6623,792,976 - 3,792,9762,933,877 - 2,933,8772,271,719 91,733 2,363,452
(2,686,318) (2,686,318)867,468 - 867,468573,900 (573,900) -
33,766,643 (482,167) 33,284,476
5,618,078 6,648,237 12,266,315
168,474,470 35,452,190 203,926,660
174,092,548$ 42,100,427$ 216,192,975$
See Notes to Financial Statements
!

This Page Left Intentionally Blank

FUND FINANCIAL STATEMENTS
Only individual major funds are presented in the Fund Financial Statements, while non-major funds are combined in a single column. Major funds are defined generally as having significant activities or balances in the current year.
MAJOR GOVERNMENTAL FUNDS The funds described below were determined to be Major Funds by the City. Individual non-major funds may be found in the Supplemental section. GENERAL FUND – The primary fund of the City used to account for all revenue and expenditures not legally restricted as to use. A broad range of municipal activities are provided through this fund including City Manager, City Attorney, Administrative Services, City Clerk, Community Development, Public Safety, Public Works, and Parks and Recreation. CAPITAL IMPROVEMENT CAPITAL PROJECTS FUND – This fund is used to account for major capital projects not provided for in one of the other capital projects funds. HOUSING CAPITAL PROJECTS FUND – This fund is used to account for development fees that must be used to finance affordable housing for City residents and the housing activities assumed by the City when the former Redevelopment Agency was dissolved.
"

CITY OF SAN CARLOS
BALANCE SHEETGOVERNMENTAL FUNDSJUNE 30, 2017
Capital Projects Funds
CapitalGeneral Improvement Housing
Assets:Cash and investments 35,872,092$ 16,798,559$ 8,239,784$ Receivables:
Accounts 1,924,075 169,397 506Notes - - 1,328,772Down payment assistance loan program - - 729,290
Prepaid items 380,712 - -Property held for resale - - 732,986
Total Assets 38,176,879$ 16,967,956$ 11,031,338$
Liabilities, Deferred Inflows, of Resources,and Fund Balances:
Liabilities:Accounts payable and accrued liabilities 2,878,028$ 436,367$ 39,914$ Accrued benefits 47,878 - -Deposits payable 2,658,710 - 3,929Unearned revenues 434,531 - -
Total Liabilities 6,019,147 436,367 43,843
Deferred Inflows of Resources:Unavailable revenues 105,052 1,406,916
Total Deferred Inflows of Resources 105,052 1,406,916
Fund Balances:Nonspendable:
Prepaid items 380,712 - -Restricted for:
Public Safety - - -Parks and recreation - - -Public works - - -Debt service - - -Housing - - 9,580,579
Committed to:General government - - -Community development - - -Capital projects - 16,531,589 -Emergency reserve 4,440,000 - -Strategic property acquisition 7,691,795 - -
Assigned to:Unfunded liabilities 7,750,000 - -Facility/infrastructure improvements 7,591,500 - -Emergency reserve 1,500,000
Unassigned 2,698,673 - -
Total Fund Balances 32,052,680 16,531,589 9,580,579Total Liabilities, Deferred Inflows of
Resources, and Fund Balances $ 38,176,879 $ 16,967,956 $ 11,031,338
See Notes to Financial Statements
#

CITY OF SAN CARLOS
BALANCE SHEETGOVERNMENTAL FUNDSJUNE 30, 2017
Assets:Cash and investments Receivables:
AccountsNotesDown payment assistance loan program
Prepaid itemsProperty held for resale
Total Assets
Liabilities, Deferred Inflows, of Resources,and Fund Balances:
Liabilities:Accounts payable and accrued liabilitiesAccrued benefitsDeposits payableUnearned revenues
Total Liabilities
Deferred Inflows of Resources:Unavailable revenues
Total Deferred Inflows of Resources
Fund Balances:Nonspendable:
Prepaid itemsRestricted for:
Public SafetyParks and recreationPublic worksDebt serviceHousing
Committed to:General governmentCommunity developmentCapital projectsEmergency reserveStrategic property acquisition
Assigned to:Unfunded liabilitiesFacility/infrastructure improvementsEmergency reserve
Unassigned
Total Fund BalancesTotal Liabilities, Deferred Inflows of
Resources, and Fund Balances
See Notes to Financial Statements
Other Total Governmental Governmental
Funds Funds
10,484,985$ 71,395,420$
32,941 2,126,919- 1,328,772- 729,290- 380,712- 732,986
10,517,926$ 76,694,099$
283,649$ 3,637,958$ - 47,878- 2,662,639- 434,531
283,649 6,783,006
26,864 1,538,832
26,864 1,538,832
- 380,712
220,910 220,910 2,947,624 2,947,624 1,424,405 1,424,405
739,933 739,933 - 9,580,579
1,665,665 1,665,665 144,636 144,636
3,064,240 19,595,829 - 4,440,000 - 7,691,795
- 7,750,000 - 7,591,500
1,500,000 - 2,698,673
10,207,413 68,372,261
$ 10,517,926 $ 76,694,099
$

CITY OF SAN CARLOS
RECONCILIATION OF THE GOVERNMENTAL FUNDS BALANCE SHEETWITH THE STATEMENT OF NET POSITIONJUNE 30, 2017
Fund balances of governmental funds 68,372,261$
Amounts reported for governmental activities in the statement of net position aredifferent because:
Capital assets net of depreciation have not been included as financial resourcesin governmental fund activity. 143,834,583
Long-term debt and compensated absencesthat have not been included in governmental fund activity
Bonds payable (4,085,227) Compensated absences (656,555)
Net Pension Liability and other deferred itemsProportionate share of net pension liability (42,198,906) Deferred outflows related to pensions 8,134,623 Deferred inflows related to pensions (1,749,146)
Governmental funds report all OPEB contributions as expenditures,however, in the statement of net position any excesses or deficiencies in contributions in relation to the Annual Required Contribution (ARC) are recorded as a asset or a liability.
Healthcare 21,540
Accrued interest payable for the current portion of interest due on long-term debt has not been reported in the governmental funds. (39,625)
Revenues reported as unavailable revenue in the governmental funds and recognizedin the statement of activities. These are included in the intergovernmental revenuesin the governmental fund activity. 1,538,832
Internal service funds are used by management to charge the costs of certain activities, such as equipment management and self-insurance, to individual funds. These assets and liabilities of the internal service funds must be added to the statement of net position. 920,168
Net Position of Governmental Activities 174,092,548$
See Notes to Financial Statements
%

This Page Left Intentionally Blank
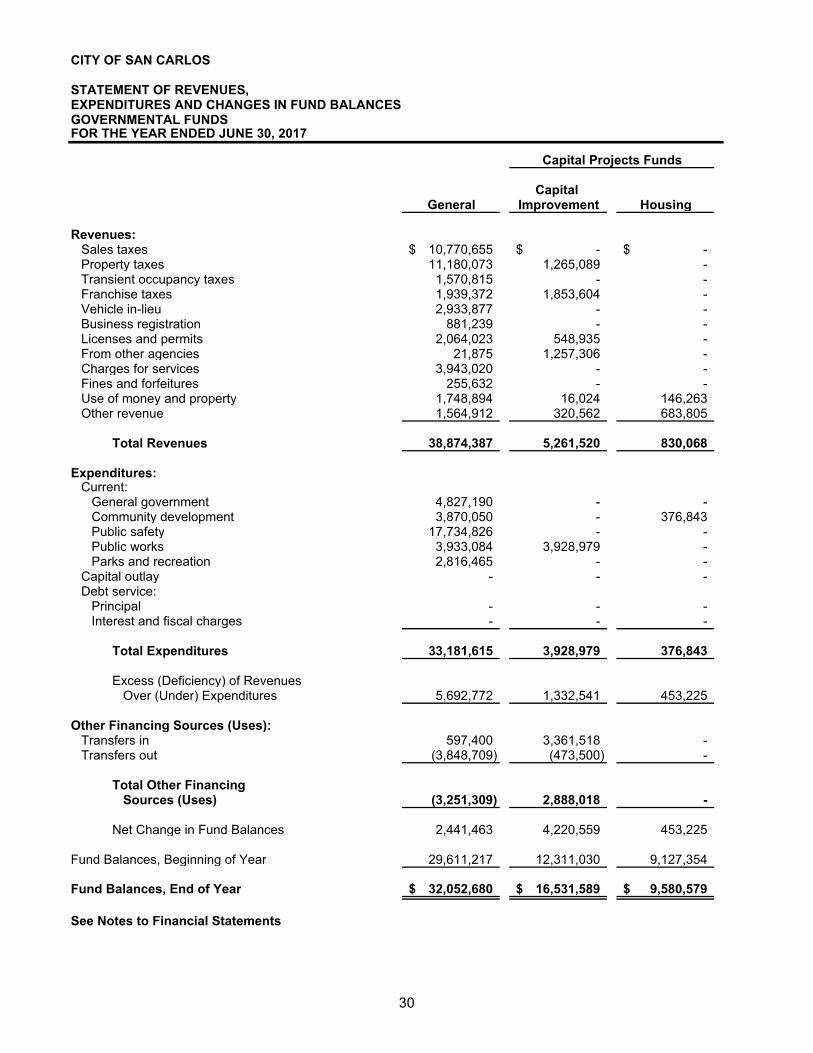
CITY OF SAN CARLOS
STATEMENT OF REVENUES,EXPENDITURES AND CHANGES IN FUND BALANCESGOVERNMENTAL FUNDSFOR THE YEAR ENDED JUNE 30, 2017
Capital Projects Funds
Capital General Improvement Housing
Revenues:Sales taxes 10,770,655$ -$ -$Property taxes 11,180,073 1,265,089 -Transient occupancy taxes 1,570,815 - -Franchise taxes 1,939,372 1,853,604 -Vehicle in-lieu 2,933,877 - -Business registration 881,239 - -Licenses and permits 2,064,023 548,935 -From other agencies 21,875 1,257,306 -Charges for services 3,943,020 - -Fines and forfeitures 255,632 - -Use of money and property 1,748,894 16,024 146,263 Other revenue 1,564,912 320,562 683,805
Total Revenues 38,874,387 5,261,520 830,068
Expenditures:Current:
General government 4,827,190 - -Community development 3,870,050 - 376,843 Public safety 17,734,826 - -Public works 3,933,084 3,928,979 -Parks and recreation 2,816,465 - -
Capital outlay - - -Debt service:
Principal - - -Interest and fiscal charges - - -
Total Expenditures 33,181,615 3,928,979 376,843
Excess (Deficiency) of Revenues Over (Under) Expenditures 5,692,772 1,332,541 453,225
Other Financing Sources (Uses):Transfers in 597,400 3,361,518 -Transfers out (3,848,709) (473,500) -
Total Other Financing Sources (Uses) (3,251,309) 2,888,018 -
Net Change in Fund Balances 2,441,463 4,220,559 453,225
Fund Balances, Beginning of Year 29,611,217 12,311,030 9,127,354
Fund Balances, End of Year 32,052,680$ 16,531,589$ 9,580,579$
See Notes to Financial Statements
!'

CITY OF SAN CARLOS
STATEMENT OF REVENUES,EXPENDITURES AND CHANGES IN FUND BALANCESGOVERNMENTAL FUNDSFOR THE YEAR ENDED JUNE 30, 2017
Revenues:Sales taxesProperty taxesTransient occupancy taxesFranchise taxesVehicle in-lieuBusiness registrationLicenses and permitsFrom other agenciesCharges for servicesFines and forfeituresUse of money and propertyOther revenue
Total Revenues
Expenditures:Current:
General governmentCommunity developmentPublic safetyPublic worksParks and recreation
Capital outlayDebt service:
PrincipalInterest and fiscal charges
Total Expenditures
Excess (Deficiency) of Revenues Over (Under) Expenditures
Other Financing Sources (Uses):Transfers in Transfers out
Total Other Financing Sources (Uses)
Net Change in Fund Balances
Fund Balances, Beginning of Year
Fund Balances, End of Year
See Notes to Financial Statements
Other TotalGovernmental Governmental
Funds Funds
804,007$ 11,574,662$ 422,382 12,867,544
- 1,570,815 - 3,792,976 - 2,933,877 - 881,239
17,079 2,630,037 1,474,613 2,753,794
9,600 3,952,620 - 255,632
283,915 2,195,096 1,044,648 3,613,927
4,056,244 49,022,219
13,025 4,840,215 3,769 4,250,662
92,839 17,827,665 1,068,780 8,930,843
- 2,816,465 1,887,675 1,887,675
250,000 250,000 99,485 99,485
3,415,573 40,903,010
640,671 8,119,209
1,887,191 5,846,109 (950,000) (5,272,209)
937,191 573,900
1,577,862 8,693,109
8,629,551 59,679,152
10,207,413$ 68,372,261$
!�

CITY OF SAN CARLOS
RECONCILIATION OF THE NET CHANGE IN FUND BALANCES –TOTAL GOVERNMENTAL FUNDSWITH THE STATEMENT OF ACTIVITIESJUNE 30, 2017
Net change in fund balances - total governmental funds 8,693,109$
Amounts reported for governmental activities in the statement of activities aredifferent because:
Governmental Funds report capital outlays as expenditures. However, in the statementof activities, the costs of those assets are allocated over their estimated useful livesas depreciation expense. This is the amount by which capital outlays exceeded depreciation in the current period.
Capital outlay 4,340,819 Depreciation expense (2,235,331) Retirement of capital assets (3,199,373)
The issuance of long-term debt provides current financial resources to governmental funds, while repayment of principal long-term debt consumes the current financial resources of governmental funds. Neither transaction, however, has any effect on net position.
Principal repaid on bonds 250,000 Premium on debt obligations 14,523
Pension expense related to the proportionate share of net pension liability is recorded on the economic resources basis of accounting and, therefore, employer cash contributionsare added back to fund balance. (2,408,106)
Accrued interest for long-term liabilities. This is the net change in accrued interestfor the current period. 3,125
Compensated absences expenses reported in the statement of activities do notrequire the use of current financial resources and, therefore, are not reported as expenditures in governmental funds. (99,708)
Governmental funds report all contributions in relation to the annual required contribution (ARC) for OPEB as expenditures, however in the statement of activities only the ARC is an expense. 13,538
Revenues reported as unavailable revenue in the governmental funds and recognizedin the statement of activities. These are included in the intergovernmental revenuesin the governmental fund activity. 20,789
Internal service funds are used by management to charge the costs of certain activities, such as equipment management and self-insurance, to individual funds. The net revenues (expenses) of the internal service funds are reported with governmental activities. 224,693
Change in net position of governmental activities 5,618,078$
See Notes to Financial Statements
!

This Page Left Intentionally Blank

CITY OF SAN CARLOS
BUDGETARY COMPARISON STATEMENT BY DEPARTMENTGENERAL FUNDFOR THE YEAR ENDED JUNE 30, 2017
Variance WithBudgeted Amounts Final Budget
PositiveOriginal Final Actual Amounts (Negative)
Revenues:Sales taxes 10,037,700$ 10,037,700$ 10,770,655$ 732,955$ Property taxes 9,744,600 9,744,600 11,180,073 1,435,473 Transient occupancy taxes 1,947,000 1,947,000 1,570,815 (376,185)Franchise taxes 1,837,500 1,837,500 1,939,372 101,872 Vehicle in lieu 2,500,000 2,500,000 2,933,877 433,877 Business registration 804,100 804,100 881,239 77,139 Licenses and permits 2,011,200 2,011,200 2,064,023 52,823 From other agencies 48,800 48,800 21,875 (26,925)Charges for current services 3,856,200 4,156,200 3,943,020 (213,180)Fines and forfeitures 258,400 258,400 255,632 (2,768)Use of money and property 2,038,900 2,038,900 1,748,894 (290,006)Other revenue 1,212,300 1,337,235 1,564,912 227,677
Total Revenues 36,296,700 36,721,635 38,874,387 2,152,752
Expenditures:Current
General government:City Council 275,500 275,500 146,036 129,464 City Manager 1,308,700 1,419,635 1,240,057 179,578 City Clerk 443,600 443,600 360,803 82,797 Administrative Services 3,187,800 3,181,143 2,885,265 295,878 General government 67,300 67,300 60 67,240 City Treasurer 17,800 17,800 1,609 16,191 City Attorney 347,400 347,400 193,360 154,040
Total general government 5,648,100 5,752,378 4,827,190 925,188
Community development:Administration 512,100 530,100 503,636 26,464 Economic development 919,700 958,238 682,387 275,851 Building 1,658,600 1,658,600 1,418,514 240,086 Planning 1,258,300 1,756,455 1,265,513 490,942
Total community development 4,348,700 4,903,393 3,870,050 1,033,343
Public safety:Police patrol 5,700 5,700 4,985 715Police investigation 46,700 46,700 43,818 2,882 Police administration 8,678,700 8,698,621 8,150,895 547,726 Fire 9,062,300 9,011,500 8,890,480 121,020 Communications 638,400 644,900 644,648 252
Total public safety 18,431,800 18,407,421 17,734,826 672,595
See Notes to Financial Statements
!(

CITY OF SAN CARLOS
BUDGETARY COMPARISON STATEMENT BY DEPARTMENTGENERAL FUNDFOR THE YEAR ENDED JUNE 30, 2017
Variance WithBudgeted Amounts Final Budget
PositiveOriginal Final Actual Amounts (Negative)
Public works:Public works 1,139,800 1,139,800 891,323 248,477 Garage 102,000 102,000 45,908 56,092 Street maintenance 174,500 174,500 160,872 13,628 Park maintenance 1,727,500 1,802,500 1,670,734 131,766 Traffic control 309,200 309,200 253,915 55,285 Building maintenance 917,600 968,400 910,332 58,068
Total public works 4,370,600 4,496,400 3,933,084 563,316
Parks and recreation:Administration 519,200 563,276 490,200 73,076 Recreation 2,905,800 2,905,800 2,326,265 579,535
Total parks and recreation 3,425,000 3,469,076 2,816,465 652,611
Total Expenditures 36,224,200 37,028,668 33,181,615 3,847,053
Excess (Deficiency) of RevenuesOver Expenditures 72,500 (307,033) 5,692,772 5,999,805
Other Financing Sources (Uses):Transfers in 573,900 573,900 597,400 23,500 Transfers (out) (3,669,900) (3,769,900) (3,848,709) (78,809)
Total Other Financing Sources (Uses) (3,096,000) (3,196,000) (3,251,309) (55,309)
Net Change in Fund Balance (3,023,500)$ (3,503,033)$ 2,441,463 5,944,496$
Beginning Fund Balance 29,611,217
Ending Fund Balance $32,052,680
See Notes to Financial Statements
!"

This Page Left Intentionally Blank

MAJOR PROPRIETARY FUND
Proprietary funds account for City operations financed and operated in a manner similar to a private business enterprise. The intent of the City is that the cost of providing goods and services be financed primarily through user charges.
The concept of major funds extends to Proprietary Funds.
Budget versus actual comparisons regarding proprietary funds that are major funds are not presented.
SEWER ENTERPRISE FUND – This fund is used to account for sewage treatment, transmission, major replacements and improvements to the City’s sewer system.
!$

CITY OF SAN CARLOS
STATEMENT OF NET POSITIONPROPRIETARY FUNDSJUNE 30, 2017
Business-TypeActivities – GovernmentalEnterprise Activities –
Fund InternalSewer Service Funds
Assets:Current Assets:
Cash and investments 12,298,405$ 1,489,353$ Receivables:
Accounts receivable 543,676 37,612Net OPEB Asset - Healthcare 3,219 -
Total Current Assets 12,845,300 1,526,965
Noncurrent: Investment in SVCW 6,680,080 -Capital assets, net:
Land 153,734 -Construction in process 37,431Depreciable capital assets, net 27,549,138 -
Total Noncurrent Assets 34,420,383 -
Total Assets 47,265,683 1,526,965
Deferred Outflows of Resources:Deferred pension related items 1,064,462 -
Total Deferred Outflows of Resources 1,064,462 -
Liabilities:Current:
Accounts payable 1,223,338 9,627Compensated absences 37,287 -Claims payable - 347,170
Total Current Liabilities 1,260,625 356,797
Noncurrent:Compensated absences 24,858 -Claims payable - 250,000 Net Pension Liability 4,810,091 -
Total Noncurrent Liabilities 4,834,949 250,000
Total Liabilities 6,095,574 606,797
Deferred Inflows of Resources:Deferred pension related items 134,144 -
Total Deferred Inflows of Resources 134,144 -
Net Position:Net investment in capital assets 27,740,303 -Unrestricted 14,360,124 920,168
Total Net Position 42,100,427$ 920,168$
See Notes to Financial Statements
!%

CITY OF SAN CARLOS
STATEMENT OF REVENUES, EXPENSESAND CHANGES IN FUND NET POSITIONPROPRIETARY FUNDSFOR THE YEAR ENDED JUNE 30, 2017
Business-TypeActivities – GovernmentalEnterprise Activities –
Fund InternalSewer Service Funds
Operating Revenues:Charges for services 16,793,613$ 870,178$ Cost reimbursements - 955,000
Total Operating Revenues 16,793,613 1,825,178
Operating Expenses:Salaries and benefits 1,556,584 -Sewer operations 6,728,543 -Insurance premiums - 432,703 Claims expense - 1,194,382 Depreciation expense 694,679 -Miscellaneous 2,376,200 29,486
Total Operating Expenses 11,356,006 1,656,571
Operating Income (Loss) 5,437,607 168,607
Nonoperating Revenues (Expenses):Investment income 91,733 12,201 Grants - 43,885 Increase in Investment in Sewer Authority 1,692,797 -
Total Nonoperating Revenues (Expenses) 1,784,530 56,086
Income (Loss) Before Transfers 7,222,137 224,693
Transfers (out) (573,900) -
Change in net position 6,648,237 224,693
Net position, beginning of the year 35,452,190 695,475
Net position, end of the year 42,100,427$ 920,168$
See Notes to Financial Statements
!&

CITY OF SAN CARLOS
STATEMENT OF CASH FLOWSPROPRIETARY FUNDSFOR THE YEAR ENDED JUNE 30, 2017
Business-TypeActivities – GovernmentalEnterprise Activities –
Fund InternalSewer Service Funds
Cash Flows From Operating Activities:Cash received from customers and users 16,334,574$ -$Cash received/(paid to) interfund service provided - 1,820,328 Cash paid to suppliers for goods and services (11,085,745) (488,156)Cash paid to employees for services (1,626,816) -Claims paid - (1,171,108)
Net Cash Provided (Used) by Operating Activities 3,622,013 161,064 Cash Flows From Non-Capital
Financing Activities:Transfers (out) (573,900) -From other agencies - 43,885
Net Cash Provided (Used) by Non-Capital Financing Activities (573,900) 43,885
Cash Flows from Capital and Related Financing Activities:
Acquisition of capital assets (6,596,631) -
Net Cash Provided (Used) by Capital and Related Financing Activities (6,596,631) -
Cash Flows from Investing Activities:Interest received 91,733 12,201
Net Cash Provided (Used) by Investing Activities 91,733 12,201 Net Increase (Decrease) in Cash
and Cash Equivalents (3,456,785) 217,150 Cash and Cash Equivalents at Beginning of Year 15,755,190 1,272,203
Cash and Cash Equivalents at End of Year $ 12,298,405 1,489,353$
Reconciliation of Operating Income to Net CashProvided (Used) by Operating Activities:
Operating income (loss) 5,437,607$ 168,607$ Adjustments to reconcile operating income (loss) to
net cash provided (used) by operating activities:Depreciation 694,679 -
Change in assets and liabilities:Receivables, net (459,039) (4,850)Net OPEB asset (1,462) -Accounts payable (1,981,002) (25,967)Claims payable - 23,274 Compensated absences (13,095) -Net pension liability and deferred
outflows/inflows of resources (55,675) -Net Cash Provided (Used) by Operating Activities 3,622,013$ 161,064$
Non-Cash Investing, Capital and Financing Activities:Investment in joint venture 1,692,797$
See Notes to Financial Statements
('
FIDUCIARY FUNDS
Fiduciary Funds are presented separately from the Government-wide and Fund Financial Statements.
Agency funds account for assets held by the City as an agent for individuals, government entities and non-public organizations. These include the following:
AGENCY FUNDS – Agency funds are used to account for assets held by the City as an agent for individuals, private organizations and other governments. The financial activities of these funds are excluded from the Entity-wide financial statements, but are presented in separate Fiduciary Fund financial statements.
SUCCESSOR AGENCY OF THE FORMER RDA PRIVATE PURPOSE TRUST FUND – This fund is used to account for the activities related to the dissolution of the former San Carlos Redevelopment Agency.
(�

CITY OF SAN CARLOS
STATEMENT OF FIDUCIARY NET POSITIONFIDUCIARY FUNDSJUNE 30, 2017
Private–Purpose Trust
FundSuccessor
Agency Agency of the Funds Former RDA
Assets:Cash and investments 36,849,600$ 1,137,553$ Cash and investments with fiscal agent 6,364,259 2,524,647 Receivables:
Accounts receivable 8,523,189 -Interest receivable 36,178 -
Prepaid items 720 -Capital assets:
Capital assets, not being depreciated - 281,676
Total Assets 51,773,946$ 3,943,876
Liabilities:Accounts payable and accrued liabilities 7,618,247$ 209,041 Due to members 41,990,765 -Deposits payable 1,233,640 -Interest payable 919,504 -Due to assessment district bondholders 11,790 -Long-term liabilities
Due in one year - 575,659 Due in more than one year - 14,959,247
Total Liabilities 51,773,946$ 15,743,947
Net Position:Held in trust for other purposes (11,800,071)
Total Net Position (11,800,071)$
See Notes to Financial Statements
(

CITY OF SAN CARLOS
STATEMENT OF CHANGES IN FIDUCIARY NET POSITIONFIDUCIARY FUNDSFOR THE YEAR ENDED JUNE 30, 2017
Private–Purpose Trust
FundSuccessor
Agency of the Former RDA
Additions:Taxes 1,608,179$ Use of money and property 10,190Other revenue 12,358
Total Additions 1,630,727
Deductions:Administrative expenses 217,130 Loss on sale of property 2,637,240 *Interest expense 894,074 Depreciation expense 11,559
Total Deductions 3,760,003
Change in Net Position (2,129,276)
Net Position - Beginning of the Year (9,670,795)
Net Position - End of the Year (11,800,071)$
* See Note 5(a) for more information
See Notes to Financial Statements
(!

This Page Left Intentionally Blank
CITY OF SAN CARLOS NOTES TO BASIC FINANCIAL STATEMENTS
June 30, 2017
NOTE 1 – SUMMARY OF SIGNIFICANT ACCOUNTING POLICIES
a. Reporting Entity
The City of San Carlos (“City”) is a general-law city that operates under the Council-Managerform of government, with five elected Council members served by a full time City Manager andstaff. The City provides many services, including public safety, streets and roads, parks andrecreation and planning and community development. The accounting policies of the Cityconform to generally accepted accounting principles as applicable to governments. Thefinancial statements include the City and its component units, entities for which the City isfinancially accountable. Blended component units, although legally separate entities, are insubstance part of the City's operations and data from these units are combined with data ofthe City. Their financial activities have been aggregated and merged (termed "blending") withthose of the City in the accompanying financial statements.
The San Carlos Housing Authority (“Housing Authority”) is a separate government entitywhose purpose is to provide housing to low and moderate income families within certain areasof the city. The Housing Authority is controlled by the City and has the same governing boardas the City, which also performs all accounting and administrative functions for the HousingAuthority. The Housing Authority is financially dependent on the City. The financial activities ofthe Housing Authority have been included in these financial statements.
Separate statements for the Housing Authority are not prepared.
b. Basis of Presentation
The City's Basic Financial Statements are prepared in conformity with accounting principlesgenerally accepted in the United States of America. The Government Accounting StandardsBoard is the acknowledged standard setting body for establishing accounting and financialreporting standards followed by governmental entities in the United States of America. TheseStatements require that the financial statements described below be presented.
Government-wide Statements: The Statement of Net Position and the Statement ofActivities display information about the primary government (“City”) and its component units.These statements include the financial activities of the overall City government, except forfiduciary activities. All fiduciary activities are reported only in the fund financial statements.Eliminations have been made to minimize the double counting of internal activities; however,inter-fund services provided and used are not eliminated in the process of consolidation.These statements distinguish between the governmental and business-type activities of theCity. Governmental activities generally are financed through taxes, intergovernmentalrevenues, and other non-exchange transactions. Business-type activities are financed inwhole or in part by fees charged to external parties.
("
CITY OF SAN CARLOS NOTES TO BASIC FINANCIAL STATEMENTS
June 30, 2017
NOTE 1 – SUMMARY OF SIGNIFICANT ACCOUNTING POLICIES (Continued)
The Statement of Activities presents a comparison between direct expenses and program revenues for each segment of the business-type activities of the City and for each function of the City's governmental activities. Direct expenses are those that are specifically associated with a program or function and, therefore, are clearly identifiable to a particular function. Program revenues include, (a) charges paid by the recipients of goods or services offered by the programs, (b) grants and contributions that are restricted to meeting the operational needs of a particular program and (c) fees, grants and contributions that are restricted to financing the acquisition or construction of capital assets. Revenues that are not classified as program revenues, including all taxes, are presented as general revenues.
Fund Financial Statements: The fund financial statements provide information about the City's funds, including fiduciary funds and blended component units. Separate statements for each fund category - governmental, proprietary and fiduciary are presented. The emphasis of fund financial statements is on major individual governmental and enterprise funds, each of which is displayed in a separate column. All remaining governmental and enterprise funds are aggregated and reported as nonmajor funds.
Proprietary fund operating revenues and expenses, such as charges for services and salaries and benefits, result from exchange transactions associated with the principal activity of the fund. Exchange transactions are those in which each party receives and gives up essentially equal values. Nonoperating revenues and expenses, such as investment earnings and interest expense, result from non-exchange transactions or ancillary activities.
c. Major Funds
The City's major governmental and business-type funds are identified and presentedseparately in the fund financial statements. All other funds, called nonmajor funds, arecombined and reported in a single column.
Major funds are defined as funds that have either assets, deferred outflows of resources,liabilities, deferred inflows of resources, revenues or expenditures/expenses equal to tenpercent of their fund-type total and five percent of the grand total. The General Fund is alwaysa major fund. The City may also select other funds it believes should be presented as majorfunds.
The City reported the following major governmental funds in the accompanying financialstatements:
General Fund – is the primary fund of the City that is used to account for all revenues andexpenditures of the City not legally restricted as to use. A broad range of municipal activitiesare provided through this fund including City Council, City Manager, City Attorney,Administrative Services, City Clerk, Community Development, Public Safety, Public Works,and Parks and Recreation.
Capital Improvement Capital Projects Fund – is used to account for major capital projectsnot provided for in one of the other capital projects funds.
(#
CITY OF SAN CARLOS NOTES TO BASIC FINANCIAL STATEMENTS
June 30, 2017
NOTE 1 – SUMMARY OF SIGNIFICANT ACCOUNTING POLICIES (Continued)
Housing Capital Projects Fund – is used to account for development fees that must be used to finance affordable housing for City residents and the housing activities assumed by the City when the former Redevelopment Agency was dissolved.
The City reports the following major enterprise funds in the accompanying financial statements:
Sewer Enterprise Fund – is used to account for sewage treatment, transmission, major replacements and improvements to the City's sewer system.
The City also reports the following fund types:
Internal Service Fund – The funds account for worker's compensation, general liability and other post-employment benefits; all of which are provided to other departments on a cost-reimbursement basis.
Fiduciary Funds – agency funds are used to account for assets held by the City as an agent for 1988 Special Tax Bonds Assessment Districts, City/County Association of Governments of San Mateo County (C/CAG) and South Bayside Waste Management Authority (SBWMA). Private-purpose trust funds are used to account for the assets and liabilities of the former Redevelopment Agency and the allocated revenue to pay estimated installment payments of enforceable obligations until the obligations of the former Redevelopment Agency are paid in full and assets have been liquidated. All fiduciary funds, including agency funds, use the accrual, rather than the modified accrual, basis of accounting.
The financial activities of these funds are excluded from the Government-wide financial statement, but are presented in separate Fiduciary Fund financial statements.
d. Basis of Accounting
The Government-wide, proprietary fund and fiduciary fund financial statements are reportedusing the economic resources measurement focus and the full accrual basis of accounting.Revenues are recorded when earned and expenses are recorded at the time liabilities areincurred, regardless of when the related cash flows take place.
Governmental funds are reported using the current financial resources measurement focusand the modified accrual basis of accounting. Under this method, revenues are recognizedwhen measurable and available. The City considers all revenues reported in the governmentalfunds to be available if the revenues are collected within 60 days after year-end. Expendituresare recorded when the related fund liability is incurred, except for principal and interest ongeneral long-term debt, claims and judgments, and compensated absences, which arerecognized as expenditures to the extent they have matured. Governmental capital assetacquisitions are reported as expenditures in governmental funds. Proceeds of governmentallong-term debt and acquisitions under capital leases are reported as other financing sources.
($

CITY OF SAN CARLOS NOTES TO BASIC FINANCIAL STATEMENTS
June 30, 2017 �
NOTE 1 – SUMMARY OF SIGNIFICANT ACCOUNTING POLICIES (Continued) Those revenues susceptible to accrual are property, sales and use, transient occupancy, franchise and gas taxes, intergovernmental revenues, grants and interest revenue. Fines, licenses and permits, and charges for services are not susceptible to accrual because they are not measurable until collected. Non-exchange transactions are those in which the City gives or receives value without directly receiving or giving equal value in exchange and includes taxes, grants, entitlements and donations. On the accrual basis, revenue from taxes is recognized in the fiscal year for which the taxes are levied or assessed. Revenue from grants, entitlements and donations is recognized in the fiscal year in which all eligibility requirements have been satisfied. The City may fund programs with a combination of cost-reimbursement grants, categorical block grants, and general revenues. Thus, both restricted and unrestricted net position may be available to finance program expenditures. The City's policy is to first apply restricted grant resources to such programs, followed by general revenues if necessary. Certain indirect costs are included in program expenses reported for individual functions and activities.
e. Property Taxes and Sewer Charges Revenue is recognized in the period for which the tax and assessment is levied. The County of San Mateo levies, bills and collects property taxes and sewer charges for the City; the County remits the entire amount levied and handles all delinquencies, retaining interest and penalties. Secured and unsecured property taxes are levied on January 1. Secured property tax is due in two installments, on November 1 and February 1, and becomes a lien on those dates. It becomes delinquent on December 10 and April 10, respectively. Unsecured property tax is due on July 1 and becomes delinquent on August 31. The term "unsecured" refers to taxes on personal property other than real estate, land and buildings. These taxes are secured by liens on the property being taxed. Property tax revenues are recognized by the City in the fiscal year they are assessed provided they become available as defined above, generally within 60 days.
f. Assets, Deferred Inflows/Outflows, Liabilities and Fund Balance Net Position Investments For financial reporting purposes, investments are adjusted to their fair value. Changes in fair value that occur during a fiscal year are recognized as investment income reported for that fiscal year. Investment income includes interest earnings, changes in fair value, and any gains or losses realized upon the liquidation or sale of investments. Some investments are valued on an unamortized cost basis. For these investments, there is no material difference from fair value.
� �
(%
CITY OF SAN CARLOS NOTES TO BASIC FINANCIAL STATEMENTS
June 30, 2017
NOTE 1 – SUMMARY OF SIGNIFICANT ACCOUNTING POLICIES (Continued)
The City pools cash and investments of all funds, except for assets held by fiscal agents. Each fund’s share in this pool is displayed in the accompanying financial statements as cash and investments. Investment income earned by the pooled investments is allocated to the various funds based on each fund’s average cash and investment balance.
Cash and Cash Equivalents
For purposes of the statement of cash flows, cash equivalents are defined as short-term, highly liquid investments that are both readily convertible to known amounts of cash or so near their maturity that they present insignificant risk of change in value because of changes in interest rates. Cash equivalents also represent the proprietary fund’s share in the cash and investment pool of the City. Cash equivalents have an original maturity date of three months or less from the date of purchase. For purposes of the statement of cash flows, the entire balance of cash and investments on the combined balance sheet for the proprietary funds is considered cash and cash equivalents.
Prepaid Items
Certain payments to vendors reflect costs applicable to future accounting periods and are recorded as prepaid items in both Government-wide and fund financial statements. The cost of prepaid items is recorded as expenditures/expenses when consumed rather than when purchased.
Capital Assets
All capital assets are valued at historical cost or estimated historical cost if actual historical cost is not available. Contributed capital assets are valued at their estimated fair market value on the date contributed. The City's policy is to capitalize all assets with costs exceeding the $5,000 threshold and a useful life of more than one year. Donated capital assets, donated works of art and similar items, and capital assets received in a service concession arrangement are reported at acquisition value rather than fair value.
All capital assets with limited useful lives are depreciated over their estimated useful lives. The purpose of depreciation is to spread the cost of capital assets equitably among all users over the life of these assets. The amount charged to depreciation expense each year represents that year's pro rata share of the cost of capital assets.
Depreciation is provided using the straight-line method, which means the cost of the asset is divided by its expected useful life in years and the result is charged to expense each year until the asset is fully depreciated. The City has assigned the useful lives listed below to capital assets:
Building and Improvements 10 - 50 yearsEquipment 5 - 10 yearsInfrastructure and Sewer System Network 75 - 100 years
(&
CITY OF SAN CARLOS NOTES TO BASIC FINANCIAL STATEMENTS
June 30, 2017 �
NOTE 1 – SUMMARY OF SIGNIFICANT ACCOUNTING POLICIES (Continued)
Major outlays for capital assets and improvements are capitalized as projects are constructed. Interest incurred during the construction phase of capital assets of the business-type activities is reflected in the capitalized value of the asset constructed, net of interest earned on the invested proceeds over the same period. Deferred Outflows/Inflows of Resources In addition to assets, the statements’ of net position and the governmental fund balance sheet report a separate section for deferred outflows of resources. This separate financial statement element, deferred outflows of resources, represents a consumption of net position that applies to a future period(s) and so will not be recognized as an outflow of resources (expense/expenditure) until then. The City only has one item that qualifies for reporting in this category, which is deferred outflows relating to the net pension obligation reported in the statements’ of net position. These outflows are the result of contributions made after the measurement period, which are expensed in the following year, and of adjustments due to the difference in proportions and the difference between actual contributions made and the proportionate share of the risk pool’s total contributions. In addition to liabilities, the statements’ of net position and the governmental balance sheet report a separate section for deferred inflows of resources. This separate financial statement element, deferred inflows of resources, represents an acquisition of net position that applies to a future period(s) and so will not be recognized as an inflow of resources (revenue) until that time. The City has two items that qualify for reporting in this category. 1) Deferred inflows relating to the net pension obligation reported in the Government-wide statement of net position. These inflows are the result of the net difference between projected and actual earnings on pension plan investments and differences in proportions. This amount is deferred and amortized straight-line over a five-year period. 2) Governmental funds report unavailable revenues from the following sources: cost reimbursements; charge for services; and revenues from housing loans. These amounts are deferred and recognized as an inflow of resources in the period that the amounts become available. Compensated Absences Compensated absences comprise unpaid vacation that is accrued as earned. All employees who hold full-time regular positions are entitled to 12 working days of vacation pay upon successful completion of their first year of continuous service. The accrual rate increases as length of service exceeds four years. Maximum accumulation of vacation is two years of vacation accrual. Upon termination or retirement, full-time employees are entitled to receive compensation at their current base salary for all unused vacation leave. The City's liability for compensated absences is recorded in the statements’ of net position. The compensated absences are reported in governmental funds only if they are matured. The liability for compensated absences is determined annually. For governmental funds, the portion expected to be permanently liquidated is recorded as fund liabilities. Compensated absences are liquidated by the fund that has recorded the liability, primarily the General Fund.
"'

CITY OF SAN CARLOS NOTES TO BASIC FINANCIAL STATEMENTS
June 30, 2017
NOTE 1 – SUMMARY OF SIGNIFICANT ACCOUNTING POLICIES (Continued)
Pensions
In Government-wide financial statements, retirement plans (pensions) are required to be recognized and disclosed using the accrual basis of accounting (see Note 10) and the required supplementary information (RSI) section immediately following the Notes to Financial Statements, regardless of the amount recognized as pension expenditures on the governmental fund statements, which use the modified accrual basis of accounting.
In general, the City recognizes a net pension liability, which represents the City’s proportionate share of the excess of the total pension liability over the fiduciary net position of the pension reflected in the actuarial report provided by the California Public Employees’ Retirement System (CalPERS). The net pension liability is measured as of the City’s prior fiscal year-end. Changes in the net pension liability are recorded, in the period incurred, as pension expense or as deferred inflows of resources or deferred outflows of resources depending on the nature of the change. The changes in net pension liability that are recorded as deferred inflows of resources or deferred outflows of resources (that arise from changes in actuarial assumptions or other inputs and differences between expected or actual experience) are amortized over the weighted average remaining service life of all participants in the respective pension plan and are recorded as a component of pension expense beginning with the period in which they are incurred.
For purposes of measuring the net pension liability and deferred outflows/inflows or resources relating to pensions and pension expense, information about the fiduciary net position of the City’s pension plan with CalPERS and additions to/deductions from the plan’s fiduciary net position have been determined on the same basis as they are reported by CalPERS. For this purpose, benefit payments (including refunds of employee contributions) are recognized when due and payable in accordance with the benefits terms. Investments are reported at fair value.
Projected earnings on pension investments are recognized as a component of pension expense. Differences between projected and actual investment earnings are reported as deferred inflows of resources or deferred outflows of resources and amortized as a component of pension expense on a closed basis over a five-year period beginning with the period in which the difference occurred. Each subsequent year will incorporate an additional closed basis five-year period of recognition.
"�
CITY OF SAN CARLOS NOTES TO BASIC FINANCIAL STATEMENTS
June 30, 2017
NOTE 1 – SUMMARY OF SIGNIFICANT ACCOUNTING POLICIES (Continued)
Fund Balance
In the fund financial statements, governmental funds report the following fund balance classifications:
Nonspendable includes amounts that cannot be spent because they are either (a) not in spendable form or (b) legally or contractually required to be maintained intact.
Restricted includes amounts that are constrained on the use of resources by either (a) external creditors, grantors, contributors, or laws or regulations of other governments or (b) by law through constitutional provisions or enabling legislation.
Committed includes amounts that can only be used for specific purposes pursuant to constraints imposed by formal action of the government’s highest authority; City Council. The formal action that is required to be taken to establish, modify, or rescind a fund balance commitment is a Council resolution.
Assigned includes amounts that are constrained by the government’s intent to be used for specific purposes, but are neither restricted nor committed. The City Manager is authorized to assign amounts to a specific purpose, which was established by City Council resolution.
Unassigned includes the residual amounts that have not been restricted, committed, or assigned to specific purposes.
The City Council adopts and amends committed fund balance amounts through resolution. The City Council authorizes assigned amounts for specific purposes pursuant to the policy-making powers granted through resolution.
Fund Balance Flow Assumption
Sometimes the City will fund outlays for a particular purpose from both restricted and unrestricted resources (the total of committed, assigned and unassigned fund balance. To calculate the amounts to report as restricted, committed, assigned and unassigned fund balance in the governmental fund financial statements, a flow assumption must be made about the order in which the resources are considered to be applied. It is the City’s policy to consider restricted fund balance to have been depleted before using any of the components of unrestricted fund balance. Further, when the components of unrestricted fund balance can be used for the same purpose, committed fund balance is depleted first, followed by assigned fund balance. Unassigned fund balance is applied last.
Net Position
Net position is the excess of all the City's assets and deferred outflows over all its liabilities and deferred inflows, regardless of fund. Net position is divided into three captions. These captions apply only to net position, which is determined only at the Government-wide level, and are described below:
"

CITY OF SAN CARLOS NOTES TO BASIC FINANCIAL STATEMENTS
June 30, 2017
NOTE 1 – SUMMARY OF SIGNIFICANT ACCOUNTING POLICIES (Continued)
Net investment in capital assets describes the portion of net position that is represented by the current net book value of the City's capital assets, less the outstanding balance of any debt issued to finance these assets.
Restricted describes the portion of net position that is restricted as to use by the terms and conditions of agreements with outside parties, governmental regulations, laws, or other restrictions that the City cannot unilaterally alter. These principally include developer fees received for use on capital projects, debt service requirements and funds restricted to low and moderate income purposes.
Unrestricted describes the portion of net position that is not restricted to use.
Net Position Flow Assumption
Sometimes the City will fund outlays for a particular purpose from both restricted (e.g., restricted bond or grant proceeds) and unrestricted resources. To calculate the amounts to report as restricted net position and unrestricted net position in the Government-wide and proprietary fund financial statements, a flow assumption must be made about the order in which the resources are considered to be applied. It is the City’s policy to consider restricted net position to have been depleted before unrestricted net position is applied.
g. Budgets and Budgetary Accounting Policies
The City adopts a biennial operating budget on or before June 30 for the ensuing fiscal yearfor the General Fund, all Special Revenue Funds and all Debt Service Funds. Expendituresfor the Capital Projects Funds are budgeted and managed on a project length basis andbudget to actual comparisons for these expenditures have been excluded from theaccompanying financial statements. The City follows a budgeting process in which the City’splans and objectives are outlined and budgeted. This work program is reviewed with the CityCouncil to determine the priority and timing of plans and objectives. Revisions are made tothe work program, which in its final form, is adopted by the City Council as an operatingbudget, effective July 1 for the ensuing fiscal year. From the effective date of the budget, theamounts stated therein as proposed expenditures become appropriations to the variousfunds.
City Council may amend the budget by resolution during the fiscal year. The City Managermay transfer appropriations from one program, activity, or object to another within the samedepartment or between departments. However, transfers of appropriations that change totalfund appropriations must be approved by the City Council. Expenditures that exceedappropriations at the fund level must be approved by the City Council. Budgets are adoptedon a basis consistent with generally accepted accounting principles.
"!

CITY OF SAN CARLOS NOTES TO BASIC FINANCIAL STATEMENTS
June 30, 2017
NOTE 1 – SUMMARY OF SIGNIFICANT ACCOUNTING POLICIES (Continued)
h. Fair Value Measurements
Fair value is defined as the price that would be received to sell an asset or paid to transfer aliability in an orderly transaction between market participants at the measurement date. TheCity categorizes its fair value measurements within the fair value hierarchy established bygenerally accepted accounting principles. The fair value hierarchy categorizes the inputs tovaluation techniques used to measure fair value into three levels based on the extent towhich inputs used in measuring fair value are observable in the market.
Level 1 inputs are quoted prices (unadjusted) in active markets for identical assets or liabilities.
Level 2 inputs are inputs, other than quoted prices included within level 1, that are observable for an asset or liability, either directly or indirectly.
Level 3 inputs are unobservable inputs for an asset or liability.
If the fair value of an asset or liability is measured using inputs from more than one level of the fair value hierarchy, the measurement is considered to be based on the lowest priority level input that is significant to the entire measurement.
i. Estimates and Assumptions
The preparation of financial statements in conformity with generally accepted accountingprinciples (GAAP) requires management to make estimates and assumptions that affect thereported amount of assets and liabilities and disclosure of contingent assets and liabilities atthe date of the financial statements and the reported revenues and expenses during thereporting period. Actual results could differ from those estimates.
NOTE 2 – CASH AND INVESTMENTS
The City pools cash from all sources and all funds except cash and investments held by trustees so that it can be invested at the maximum yield consistent with safety and liquidity, while individual funds can make expenditures at any time.
a. Policies
California Law requires banks and savings and loan institutions to pledge governmentsecurities with a market value of 110% of the City's cash on deposit, or first trust deedmortgage notes with a market value of 150% of the deposit, as collateral for these deposits.Under California Law this collateral is held in a separate investment pool by anotherinstitution in the City's name and places the City ahead of general creditors of the institution.
The City invests in individual investments and in investment pools. Individual investmentsare evidenced by specific identifiable securities instruments, or by an electronic entryregistering the owner in the records of the institution issuing the security, called the bookentry system. To increase security, the City employs the trust department of a bank as thecustodian of certain City managed investments, regardless of their form.
"(

CITY OF SAN CARLOS NOTES TO BASIC FINANCIAL STATEMENTS
June 30, 2017
NOTE 2 – CASH AND INVESTMENTS (Continued)
The City's investments are carried at fair value, as required by generally accepted accounting principles. The City adjusts the carrying value of its investments to reflect their fair value at each fiscal year end, and it includes the effects of these adjustments in income for that fiscal year.
b. Classification
Cash and investments as of June 30, 2017 are classified in the following financialstatements as follows:
Statement of Net Position:Cash and investments 85,183,178$
Subtotal 85,183,178
Fiduciary Funds:Cash and investments 37,987,153 Cash and investments with fiscal agent 8,888,906
Subtotal 46,876,059
Total cash and investments 132,059,237$
Cash and investments as of June 30, 2017 consist of the following:
Cash on hand 9,150$Deposits with financial institutions 5,461,585 Investments 126,588,502
Total cash and Investments 132,059,237$
c. Investments Authorized by the California Government Code and the City's InvestmentPolicy
The following table identifies the investment types that are authorized for the City by theCalifornia Government Code (or the City’s Investment Policy, where more restrictive). Thetable also identifies certain provisions of the California Government Code (or the City’sInvestment Policy, where more restrictive) that address interest rate risk, credit risk andconcentration of credit risk. This table does not address investments of debt proceeds heldby bond trustees that are governed by the provisions of bond indentures of the City, ratherthan the general provisions of the California Government Code or the City’s InvestmentPolicy.
""

CITY OF SAN CARLOS NOTES TO BASIC FINANCIAL STATEMENTS
June 30, 2017
NOTE 2 – CASH AND INVESTMENTS (Continued)
MaximumMinimum Investment
Maximum Credit Maximum In OneAuthorized Investment Type Maturity Quality in Portfolio IssuerState of California Local Agency Upon Demand
Investment FundSan Mateo County Investment Pool Upon Demand N/A As permitted by N/A
County Treasurer, currently no limit
U.S. Treasury Bonds, Notes and Bills 5 Years N/A 100% N/AU.S. Government Agency and Federal
Agency SecuritiesBankers Acceptances 180 Days N/A 40% (A), (B)Commercial Paper 270 Days A 25% (A), (B)Negotiable Certificates of Deposit 5 Years N/A 30% (A), (B)Time Certificates of Deposit - Banks
or Savings and LoansMedium Term Corporate Notes 5 Years A 30% (A), (B)
(A) 5% of outstanding paper of issuing corporation(B) 5% of the portfolio in one corporation
N/A
N/A
N/A 30% (A), (B)
$65 million per account
N/A
5 Years
5 Years
N/A 100%
d. Investments Authorized by Debt Agreements
The City must maintain required amounts of cash and investments with trustees or fiscalagents under the terms of certain debt issues. These funds are unexpended bond proceeds orare pledged reserves to be used if the City fails to meet its obligations under these debtissues. The California Government Code requires these funds to be invested in accordancewith City resolutions, bond indentures or State statutes. The table below identifies theinvestment types that are authorized for investments held by fiscal agents. The table alsoidentifies certain provisions of these debt agreements:
MinimumCredit
Authorized Investment Type QualitySecurities of the U.S. government or its agencies NoneTime certificates of deposit NoneBankers acceptances NoneCommercial paper A1California Local Agency Investment Fund NoneRepurchase agreements NoneSmall Business Administration loans NoneMoney market funds AA-m (1), AAA-m (2)Negotiable certificates of deposit NoneInvestment agreement NoneTax-exempt obligations AAAMedium-term notes AAA (1)
(1) SBWMA Series 2009A Bond(2) San Carlos RDA 2007 TAB Series A & B
"#

CITY OF SAN CARLOS NOTES TO BASIC FINANCIAL STATEMENTS
June 30, 2017
NOTE 2 – CASH AND INVESTMENTS (Continued)
e. Interest Rate Risk
Interest rate risk is the risk that changes in market interest rates will adversely affect the fairvalue of an investment. Normally, the longer the maturity of an investment, the greater thesensitivity of its fair value to changes in market interest rates. The City’s investment policy isto hold investments to maturity to mitigate the interest rate risk. Information about thesensitivity of the fair values of the City's investments (including investments held by bondtrustees) to market interest rate fluctuations is provided by the following table that shows thedistribution of the City's investments by maturity or earliest call date:
12 Monthsor less Total
San Mateo County Investment Pool 66,560,193$ 66,560,193$ California Local Agency Investment Fund 51,140,250 51,140,250 California Asset Management Program 1,077,789 1,077,789 Money market mutual funds 7,810,270 7,810,270
Total Investments 126,588,502$ 126,588,502
Cash in bank and cash on hand 5,470,735
Total Cash and Investments 132,059,237$
Investment Type
f. Credit Risk
Credit risk is the risk that an issuer of an investment will not fulfill its obligation to the holderof the investment. This is measured by the assignment of a rating by a nationally recognizedstatistical rating organization. Presented below is the minimum rating required by (whereapplicable) the California Government Code, the City’s investment policy, or debtagreements, and the actual rating, by Standard and Poor’s, as of June 30, 2017 for eachinvestment type:
Investment Type AAAm Total
Money market mutual funds 7,810,270$ 7,810,270$
Totals 7,810,270$ 7,810,270
Not rated:California Local Agency Investment Fund 51,140,250 San Mateo County Investment Pool 66,560,193 California Asset Management Program 1,077,789
Total Investments 126,588,502
Cash in bank and cash on hand 5,470,735 Total Cash and Investments 132,059,237$
"$

CITY OF SAN CARLOS NOTES TO BASIC FINANCIAL STATEMENTS
June 30, 2017
NOTE 2 – CASH AND INVESTMENTS (Continued)
g. Fair Value Hierarchy
The City categorizes its fair value measurements within the fair value hierarchy establishedby generally accepted accounting principles. The hierarchy is based on the valuation inputsused to measure fair value of the assets. Level 1 inputs are quoted prices in an activemarket for identical assets; Level 2 inputs are significant other observable inputs; and Level3 inputs are significant unobservable inputs.
The following is a summary of the fair value hierarchy of the fair value of investments of theCity as of June 30, 2017:
Exempt TotalInvestments by Fair Value:
California Local Agency Investment Pool 51,140,250$ 51,140,250$ San Mateo County Investment Pool 66,560,193 66,560,193
Total Investments at Fair Value 117,700,443$ 117,700,443 Investments Measured at Net Asset Value:
California Asset Management Program 1,077,789 Investments Measured at Amortized Cost:
Money market mutual funds 7,810,270
Total Investments 126,588,502 Cash in banks 5,470,735
Total Cash and Investments 132,059,237$
Investment Type
Both the California Local Agency Investment Fund and the San Mateo County Investment Pool are external investment pools measured at fair value, and exempt in the fair value hierarchy under GASB 72.
h. Local Agency Investment Fund
The City is a participant in the Local Agency Investment Fund (LAIF) that is regulated byCalifornia Government Code Section 16429 under the oversight of the Treasurer of theState of California. The City reports its investment in LAIF at the fair value amount providedby LAIF, which is the same as the value of the pool share. The balance available forwithdrawal is based on the accounting records maintained by LAIF, which are recorded onan amortized cost basis. Included in LAIF's investment portfolio are collateralized mortgageobligations, mortgage-backed securities, other asset-backed securities, loans to certainState funds, and floating rate securities issued by federal agencies, government-sponsoredenterprises, United States Treasury Notes and Bills and corporations. At June 30, 2017,these investments have an average maturity of 194 days.
"%

CITY OF SAN CARLOS NOTES TO BASIC FINANCIAL STATEMENTS
June 30, 2017
NOTE 2 – CASH AND INVESTMENTS (Continued)
i. San Mateo County Investment Fund
The City is a voluntary participant in the San Mateo County Investment Fund (SMCIF) that isregulated by California Government Code Section 53600 under the oversight of theTreasurer of the County of San Mateo. The City reports its investment in SMCIF at the fairvalue amount provided by SMCIF. The balance available for withdrawal is based on theaccounting records maintained by SMCIF, which are recorded on an amortized cost basis.Included in SMCIF's investment portfolio are U.S. Treasury Notes, obligations issued byagencies of the U.S. Government, LAIF, corporate notes, commercial paper, collateralizedmortgage obligations, mortgage-backed securities, other asset-backed securities andfloating rate securities issued by federal agencies, government-sponsored enterprises andcorporations. The City reports its investments in SMCIF at the fair value amounts providedby SMCIF, which is the same as the value of the pool share.
j. California Asset Management Program
The City is a voluntary participant in the California Asset Management Program (CAMP).CAMP is an investment pool offered by the California Asset Management Trust (the Trust).The Trust is a joint powers authority and public agency created by a Declaration of Trustand established under the provisions of the California Joint Exercise of Powers Act(California Government Code Sections 6500 et seq., or the "Act") for the purpose ofexercising the common power of its participants to invest certain proceeds of debt issuesand surplus funds. The Pool's investments are limited to investments permitted bysubdivisions (a) to (n), inclusive, of Section 53601 of the California Government Code.
The City reports its investments in CAMP at the fair value amounts provided by CAMP,which is the same as the value of the pool share. At June 30, 2017, the fair valueapproximated was the City's cost.
NOTE 3 – DOWN PAYMENT ASSISTANCE LOAN (DAL) PROGRAM RECEIVABLE
The City’s Redevelopment Agency previously offered first time home buyers, who qualified as having low and moderate income, loans for use as a down payment on the purchase of a home. The loans bore an interest rate of 3% and were secured by second deeds of trust on the underlying property. No payments are due until five years after the date of purchase, at which time the buyer has the option of converting the loan into shared equity in the property or extending the loan for an additional 10-years with monthly payments and a balloon payment for the unpaid balance at the end of the 10-year term. On February 1, 2012, this receivable was transferred to the City when it took over the housing function of the Redevelopment Agency upon dissolution. At June 30, 2017, the City has recorded a receivable totaling $301,355 for loans given out to six buyers, consisting of $248,795 in principal and $52,560 in accrued interest.
"&

CITY OF SAN CARLOS NOTES TO BASIC FINANCIAL STATEMENTS
June 30, 2017
NOTE 3 – DOWN PAYMENT ASSISTANCE LOAN (DAL) PROGRAM RECEIVABLE (Continued)
On April 27, 2009, the City Council approved revisions to the terms of DAL for the first time home buyer program. Payments are deferred for the term of the loan. Homeowners of units other than a Below Market Rate unit and/or any unit subject to a resale restriction agreement will be required to pay shared appreciation in addition to the repayment of principal and accrued interest at the time the DAL Program loan repayment is due. Interest rate and loan term remain unchanged. At June 30, 2017, the City has recorded a receivable totaling $427,935 for loans given out to seven buyers, consisting of $350,300 in principal and $77,635 in accrued interest.
NOTE 4 – INTERFUND TRANSACTIONS
a. Transfers Between Funds
The purpose of the majority of transfers is to move resources from one fund to another. Lessoften, a transfer may be made to open or close a fund.
Transfers between funds during the fiscal year ended June 30, 2017 were as follows:
Fund Receiving Transfer Fund Making TransferAmount
Transferred
General Fund Sewer Enterprise Fund 573,900$ (A)General Fund Capital Improvement Fund 23,500 (B)Capital Improvement Fund General Fund 3,136,709 (B)Capital Improvement Fund Non-Major Governmental Fund 350,000 (B)Non-Major Governmental Fund General Fund 712,000 (B)Non-Major Governmental Fund Capital Improvement Fund 450,000 (B)Non-Major Governmental Fund Non-Major Governmental Fund 600,000 (B)
Total Interfund Transfers 5,846,109$
(A) Sewer right of way(B) Capital projects
#'

CITY OF SAN CARLOS NOTES TO BASIC FINANCIAL STATEMENTS
June 30, 2017
NOTE 5 – CAPITAL ASSETS
Capital assets of Governmental Activities as of June 30, 2017 consisted of the following:
Balance at Balance atJune 30, 2016 Additions Retirements Transfers June 30, 2017
Governmental Activities:Capital assets not being depreciated:
Land 62,857,214$ -$ (513,055)$ -$ 62,344,159$ Rights of way 2,413,714 - - - 2,413,714 Construction in progress 6,126,382 2,765,580 - (2,647,041) 6,244,921
Total non-depreciable assets 71,397,310 2,765,580 (513,055) (2,647,041) 71,002,794
Capital assets being depreciated:Buildings and improvements 36,565,548 587,394 (3,140,217) (A) 4,816,964 38,829,689 Equipment 5,800,215 335,467 (33,938) 6,489 6,108,233 Infrastructure 69,024,320 652,378 - (2,176,412) 67,500,286
Total capital assets being depreciated 111,390,083 1,575,239 (3,174,155) 2,647,041 112,438,208
Less accumulated depreciation for:Buildings (14,822,848) (1,065,822) 458,433 - (15,430,237) Equipment (4,226,675) (281,118) 29,404 - (4,478,389) Infrastructure (18,809,402) (888,391) - - (19,697,793)
Total accumulated depreciation (37,858,925) (2,235,331) 487,837 - (39,606,419)
Net capital assets being depreciated 73,531,158 (660,092) (2,686,318) 2,647,041 72,831,789
Capital assets, net 144,928,468$ 2,105,488$ (3,199,373)$ -$ 143,834,583$
a. Loss on Sale of Capital Assets
Pursuant to Health and Safety Code (HSC) section 34181 (f), the City of San Carlos Successor Agency Oversight Board approved the sale of property to the Developer of the Wheeler Plaza Project for $1.
The City of San Carlos entered into Disposition and Development Agreement with Silverstone Development – Northern California, LLC (Developer) for the development of Wheeler Plaza Project. Pursuant to the Agreement, the Developer acquired the property from the City and the Successor Agency to construct the multi-story mixed-use building. The Agreement provides for the conveyance back to the City of a separate condominium space following completion of construction of the Parking Garage. The Project will be of substantial benefit to the City, the regional community and all of the affected taxing entities.
As a result, loss on sale of capital assets in the amount of $2,686,318 and $2,637,240 are recognized in the Governmental Statement of Activities and Fiduciary Statement of Changes in Net Position, respectively.
#�

CITY OF SAN CARLOS NOTES TO BASIC FINANCIAL STATEMENTS
June 30, 2017
NOTE 5 – CAPITAL ASSETS (Continued)
b. Depreciation
Depreciation expense was charged to governmental functions based on the use of the related assets. The amounts allocated to each function or program as follows:
Governmental Activities:
General Government 292,425$ Public Safety 47,792 Public Works 1,079,856 Community Development 99,378 Parks and Recreation 715,880
Total Governmental Activities 2,235,331$
c. Business Activities
Balance at Balance atJune 30, 2016 Additions June 30, 2017
Business-type Activities:Capital assets not being depreciated:
Land 153,734$ -$ 153,734$ Construction in progress - 37,431 37,431
Total non-depreciable assets 153,734 37,431 191,165 Capital assets being depreciated:
Equipment 1,499,318 - 1,499,318 Sewer network system 26,896,725 6,559,200 33,455,925
Total capital assets being depreciated 28,396,043 6,559,200 34,955,243
Less accumulated depreciation for:Equipment (855,677) (169,281) (1,024,958) Sewer network system (5,855,749) (525,398) (6,381,147)
Total accumulated depreciation (6,711,426) (694,679) (7,406,105)
Net capital assets being depreciated 21,684,617 5,864,521 27,549,138
Capital assets, net 21,838,351$ 5,901,952$ 27,740,303$
Depreciation expense of $694,679 was charged to the Sewer Enterprise Fund as of June 30, 2017.
#

CITY OF SAN CARLOS NOTES TO BASIC FINANCIAL STATEMENTS
June 30, 2017
NOTE 6 – PROPERTY HELD FOR RESALE
Property held for resale is stated at the lower of historical cost or net realizable value (equal to agreed-upon sales price if a disposition and development agreement has been reached with a developer).
In October 2009, the Redevelopment Agency purchased a low income housing unit property. On February 1, 2012, this property was transferred to the City when it took over the housing function of the Redevelopment Agency upon dissolution. The unit is being held for future resale to an individual who is eligible for the low income housing program.
In December 2016, the City Council authorized the City to purchase a below market rate (BMR) unit with available funds from the Low and Moderate Income Housing Fund. The unit is being held for future resale or for rental to a qualified income restricted household.
The City has two properties held for resale. The properties are reported in governmental activities in the Statement of Net Position as Property Held for Resale. The carrying value at June 30, 2017 was:
Property Name Property Address AmountHousing Unit 633 Elm St #305, San Carlos 354,999$ Housing Unit 633 Elm St #405, San Carlos 377,987
Total Value 732,986$
NOTE 7 – LONG-TERM DEBT
The City's debt issues and transactions are summarized below and discussed in detail thereafter.
Balance Balance Due WithinJune 30, 2016 Additions Retirements June 30, 2017 One Year
Governmental ActivitiesCompensated absences 556,847$ 427,970$ (328,262)$ 656,555$ 393,933$ Claims liability 573,896 385,196 (361,922) 597,170 347,170
4,190,000 - (250,000) 3,940,000 265,000 Bond Premiums 159,750 - (14,523) 145,227 -
Total Governmental Activities 5,480,493$ 813,166$ (954,707)$ 5,338,952$ 1,006,103$
2015 Refunding General Obligation Bonds
#!

CITY OF SAN CARLOS NOTES TO BASIC FINANCIAL STATEMENTS
June 30, 2017 �
NOTE 7 – LONG-TERM DEBT (Continued)
a. 2015 Refunding General Obligation Bonds
The 2015 Refunding Bonds were issued under a resolution adopted by the City Council on February 9, 2015 to refinance the City’s outstanding City of San Carlos 2005 General Obligation Refunding Bonds, which were issued on December 20, 2005 in the aggregate principal amount of $8,115,000. The 2005 General Obligation Bonds were refunded with the issuance of the 2015 General Obligation Bonds. The 2015 Refunding Bonds are general obligations of the City payable solely from ad valorem property taxes levied by the City and collected by the County. The total principal and interest remaining to be paid on the bonds is $3,940,000 and $483,500, respectively. Principal and interest paid for the current fiscal year and total ad valorem property tax revenues were $348,850 and $422,382, respectively. The total cash flow savings including the application of the excess tax revenues of $1,483,637 were $2,498,038 and the net present value of the savings resulted in an economic gain of $777,443. The refunding resulted in a $19 savings for the average residential homeowner, which reduces the GO Bond tax from $47 to $28. Estimated savings will change over time with the growth in the City’s assessed value but is estimated to average $17 for the 11 years that a 2015 GO Bond tax rate is required. Total estimated savings to the average residential homeowner is $182. Interest on Refunding Bonds accrues from the date of delivery and is payable semi-annually on February 1 and August 1, commencing August 1, 2015, and ranging from 3% to 2%. Principal payments are due annually on August 1. Annual debt service requirements for the 2015 Refunding General Obligation Bonds are shown below:
For theYear Ending
June 30 Principal Interest Total
2018 265,000$ 91,125$ 356,125$ 2019 290,000 82,800 372,800 2020 320,000 73,650 393,650 2021 365,000 63,375 428,375 2022 390,000 52,050 442,050
2023 - 2027 2,310,000 120,500 2,430,500
Total 3,940,000$ 483,500$ 4,423,500$ �
#(
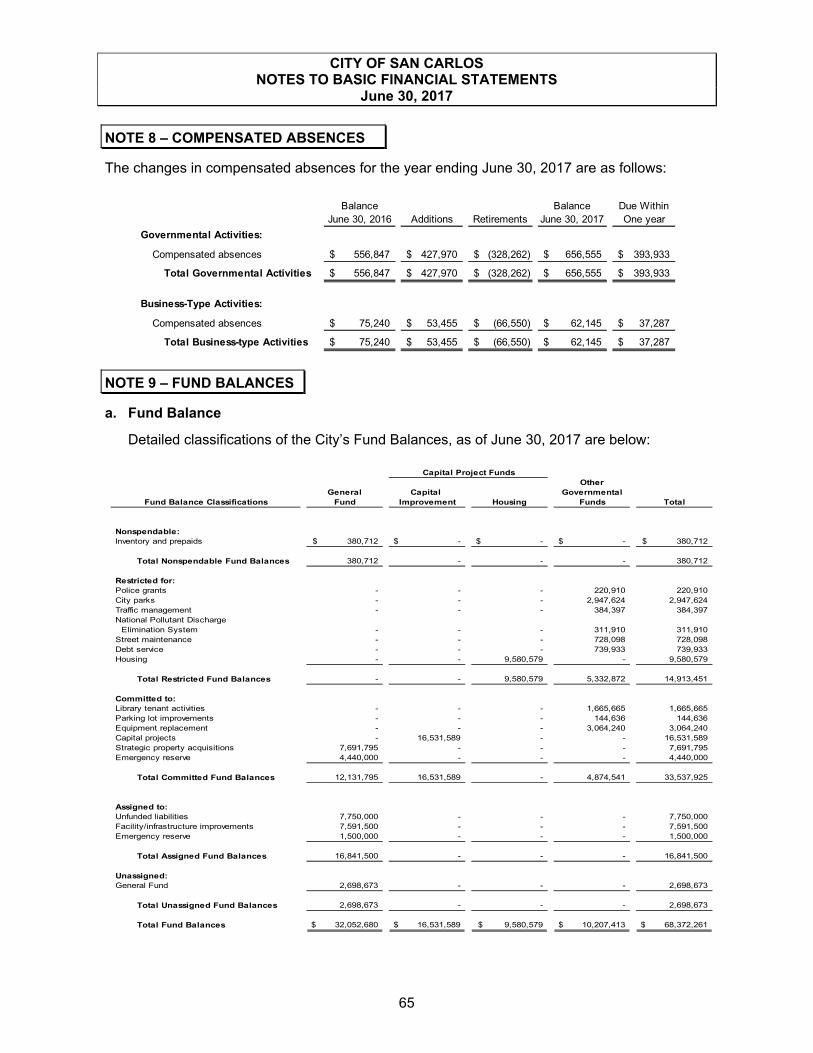
CITY OF SAN CARLOS NOTES TO BASIC FINANCIAL STATEMENTS
June 30, 2017
NOTE 8 – COMPENSATED ABSENCES
The changes in compensated absences for the year ending June 30, 2017 are as follows:
Balance June 30, 2016 Additions Retirements
Balance June 30, 2017
Due Within One year
Governmental Activities:
Compensated absences 556,847$ 427,970$ (328,262)$ 656,555$ 393,933$
Total Governmental Activities 556,847$ 427,970$ (328,262)$ 656,555$ 393,933$
Business-Type Activities:
Compensated absences 75,240$ 53,455$ (66,550)$ 62,145$ 37,287$
Total Business-type Activities 75,240$ 53,455$ (66,550)$ 62,145$ 37,287$
NOTE 9 – FUND BALANCES
a. Fund Balance
Detailed classifications of the City’s Fund Balances, as of June 30, 2017 are below:
OtherGeneral Capital Governmental
Fund Balance Classifications Fund Improvement Housing Funds Total
Nonspendable:Inventory and prepaids 380,712$ -$ -$ -$ 380,712$
Total Nonspendable Fund Balances 380,712 - - - 380,712
Restricted for:Police grants - - - 220,910 220,910 City parks - - - 2,947,624 2,947,624 Traffic management - - - 384,397 384,397 National Pollutant Discharge
Elimination System - - - 311,910 311,910 Street maintenance - - - 728,098 728,098 Debt service - - - 739,933 739,933 Housing - - 9,580,579 - 9,580,579
Total Restricted Fund Balances - - 9,580,579 5,332,872 14,913,451
Committed to:Library tenant activities - - - 1,665,665 1,665,665 Parking lot improvements - - - 144,636 144,636 Equipment replacement - - - 3,064,240 3,064,240 Capital projects - 16,531,589 - - 16,531,589 Strategic property acquisitions 7,691,795 - - - 7,691,795 Emergency reserve 4,440,000 - - - 4,440,000
Total Committed Fund Balances 12,131,795 16,531,589 - 4,874,541 33,537,925
Assigned to:Unfunded liabilities 7,750,000 - - - 7,750,000 Facility/infrastructure improvements 7,591,500 - - - 7,591,500 Emergency reserve 1,500,000 - - - 1,500,000
Total Assigned Fund Balances 16,841,500 - - - 16,841,500
Unassigned:General Fund 2,698,673 - - - 2,698,673
Total Unassigned Fund Balances 2,698,673 - - - 2,698,673
Total Fund Balances 32,052,680$ 16,531,589$ 9,580,579$ 10,207,413$ 68,372,261$
Capital Project Funds
#"

CITY OF SAN CARLOS NOTES TO BASIC FINANCIAL STATEMENTS
June 30, 2017 �
NOTE 9 – FUND BALANCES (Continued) b. Fund Balance Commitments
The City has the following committed fund balances shown on the governmental balance sheet: Economic Uncertainties – General Fund committed fund balance for Economic Uncertainties equal to a minimum of 12.5% of the General Fund expenditures with a target of increasing to 20% of General Fund expenditures. Once established, appropriations from the Economic Uncertainties fund balance commitment can only be made by formal action of the City Council. Generally, appropriations and access to these funds will be reserved for emergency situations. Examples of such emergencies include, but are not limited to: catastrophic disaster (declared by Governor); budgeted revenue taken by another government entity; or a more than 5% drop in projected revenue to the General Fund. The balance as of June 30, 2017 was $4,440,000. In an effort to raise the percentage towards 20% of General Fund expenditures, the City Manager has also assigned $1.5 million towards the Economic Uncertainty Reserve. Strategic Property Acquisitions – General Fund committed fund balance for Strategic Property Acquisitions accumulates funds from the proceeds of future sales of City properties, as directed by the City Manager or City Council. Once established, appropriations from the Strategic Property Acquisitions fund balance commitment can only be made by formal action of the City Council. Generally, appropriations and access to these funds will be reserved for funding strategic property acquisitions by the City. The balance as of June 30, 2017 was $7,691,795. Equipment and Vehicle Replacement Reserves – A Replacement Fund will be maintained as a separate fund for budgetary purposes to fund the replacement costs of existing non-sewer-related vehicles, major equipment and information technology items when they reach the end of their useful lives. Sewer-related items will be maintained in the Wastewater Fund. The Replacement Fund will be analyzed by staff at least annually as part of the budget update process for changes in assets, useful lives, estimated replacement costs and appropriate funding levels. This fund is to be maintained at a level sufficient to fund 100% of the assets, based on estimated replacement costs and useful lives. The balance as of June 30, 2017 was $3,064,240. The City also has commitments for community development projects, general government and capital projects totaling $18,341,890.
##
CITY OF SAN CARLOS NOTES TO BASIC FINANCIAL STATEMENTS
June 30, 2017
NOTE 10 – NET PENSION LIABILITY
a. California Public Employees’ Retirement System (CalPERS) Plan
Description of Plan
The City of San Carlos Miscellaneous Plans Tier 1, Tier 2, Tier 3 and Public Employees’Pension Reform Act of 2013 (PEPRA), and all Safety Plans (Safety Police and Safety Fire)are all cost-sharing multiple-employer defined benefit pension plans (the Cost-SharingPlans) administered by the California Public Employees’ Retirement System (CalPERS). Allqualified permanent and probationary employees are eligible to participate in the City’sCost-Sharing Plans. Benefit provisions under the Cost-Sharing Plans are established byState statue and City resolution. CalPERS issues publicly available reports that include fulldescriptions of each of the Cost-Sharing Plans regarding benefit provisions, assumptionsand membership information. These reports can be found on the CalPERS website:www.calpers.ca.gov.
Benefits Provided
CalPERS provides service retirement and disability benefits, annual cost of livingadjustments and death benefits to plan members, who must be public employees andbeneficiaries. Benefits are based on years of credited service, equal to one year of full-timeemployment. Members with five years of total service are eligible to retire at an age as earlyas 50 in the Cost-Sharing Plans with statutorily reduced benefits. All members are eligiblefor non-duty disability benefits after 10 years of service. The death benefit is one of thefollowing: the Basic Death Benefit; the 1957 Survivor Benefit; or the Optional Settlement 2WDeath Benefit. The cost of living adjustments for each plan are applied as specified by thePublic Employees’ Retirement Law.
The (PEPRA) requires new benefits and member contributions for new members as definedby PEPRA that are hired after January 1, 2013. These PEPRA members in pooled plans arereflected in the new Miscellaneous and Safety risk pools created by the CalPERS Board inresponse to the passage of PEPRA, beginning with the June 30, 2013 risk-pool valuations.Therefore, pursuant to PEPRA, the Miscellaneous “Classic” plan is closed to new entrantsas of January 1, 2013.
#$

CITY OF SAN CARLOS NOTES TO BASIC FINANCIAL STATEMENTS
June 30, 2017 �
NOTE 10 – NET PENSION LIABILITY (Continued) The provisions and benefits of each plan in effect at June 30, 2017 are summarized as follows:
City Miscellaneous PlanTier 1 Tier 2 Tier 3 PEPRA
Hire datePrior to
March 16, 2009Prior to
April 23, 2012On or after
April 23, 2012On or after
January 1, 2013Benefit formula 2.7%@55 2.5%@55 2.0%@55 2.0%@62Benefit vesting scheduleBenefit paymentsRetirement age 52 and upMonthly benefits, as a % of
eligible compensation 2.0% to 2.7% 2.0% to 2.5% 1.426% to 2.418% 1.0% to 2.5%Required employee contribution rates 8% 8% 7% 6.500%Required employer contribution rates 11.973% 10.408% 8.721% 6.647%
City Safety PlanSafety Fire Tier 1 Safety Police
Hire dateOn or after
October 23, 2011On or after
October 30, 2010Benefit formula 2% @ 50 3% @ 55Benefit vesting schedule 5 years of credited serviceBenefit payments monthly for lifeRetirement age 50 and upMonthly benefits, as a % of
eligible compensation 2.0% to 2.7% 2.4% to 3.0%Required employee contribution rates 9% 0.0% *Required employer contribution rates 14.785% 0.00% *
*There are no active employees in this plan during the measurement period.
5 years of credited service monthly for life
50 and up
� Contributions Section 20814(c) of the California Public Employees’ Retirement Law (PERL) requires that the employer contribution rates for all public employers be determined on an annual basis by the actuary and shall be effective on the July 1 following notice of a change in the rate. Funding contributions for all Miscellaneous Plans and Safety Plans are determined annually on an actuarial basis as of June 30 by CalPERS. The actuarially determined rate is the estimated amount necessary to finance the cost of benefits earned by employees during the year, with an additional amount to finance any unfunded accrued liability. The City is required to contribute the difference between the actuarially determined rate and the contribution rate of employees. For the year ended June 30, 2017 the contributions recognized as part of pension expense for each plan were as follows:
Safety Miscellaneous
Contributions - employer 1,112,696$ 670,838$ �
�� �
#%

CITY OF SAN CARLOS NOTES TO BASIC FINANCIAL STATEMENTS
June 30, 2017 �
NOTE 10 – NET PENSION LIABILITY (Continued)
Pension Liabilities, Pension Expenses and Deferred Outflows/Inflows of Resources Related to Pensions
As of June 30, 2016, measurement date, the City reported net pension liabilities for its proportionate share of the net pension liability of each Miscellaneous and Safety Plan as follows:
�Proportionate Share
of Net Pension LiabilitySafety 17,790,912$ Miscellaneous 20,234,806
Total Net Pension Liability 38,025,718$ �
The City’s net pension liability for each Plan is measured as the proportionate share of the net pension liability. The net pension liability of each of the Plans are measured as of June 30, 2016, and the total pension liability for each Plan used to calculate the net pension liability was determined by an actuarial valuation as of June 30, 2015 rolled forward to June 30, 2016 using standard update procedures. The City’s proportion of the net pension liability was based on a projection of the City’s long-term share of contributions to the pension plans relative to the projected contributions of all participating employers, actuarially determined. The City’s proportionate share of the net pension liability for each Plan as of June 30, 2015 and 2016 was as follows:
Proportion - June 30, 2016 0.44%Proportion - June 30, 2015 0.47%
Change Increase/(Decrease) -0.03%
For the year ended June 30, 2017, the City recognized a pension expense of $1,962,459 for the CalPERS Plan. At June 30, 2017, the City reported deferred outflows of resources and deferred inflows of resources related to pensions from the following sources:
Deferred Outflows Deferred Inflows Deferred Outflows Deferred Inflows Deferred Outflows Deferred Inflowsof Resources of Resources of Resources of Resources of Resources of Resources
Contributions subsequent to measurement date 1,112,696$ -$ 670,838$ -$ 1,783,534$ -$
Differences between actual and expected experience - (78,431) 57,740 (13,230) 57,740 (91,661) Changes in assumptions - (341,964) - (546,277) - (888,241) Net differences between projected and actual earnings on plan investments 1,680,052 - 2,843,188 - 4,523,240 - Difference in actual contributions and proportion contributions - (242,979) - (185,736) - (428,715) Change in proportion and differences between actual contributions and proportionate share of contributions 174,295 (474,673) 1,514,171 - 1,688,466 (474,673)
Total 2,967,043$ (1,138,047)$ 5,085,937$ (745,243)$ 8,052,980$ (1,883,290)$
Safety Miscellaneous Total
#&

CITY OF SAN CARLOS NOTES TO BASIC FINANCIAL STATEMENTS
June 30, 2017 �
NOTE 10 – NET PENSION LIABILITY (Continued)
In the table above, the $1,783,534 reported as deferred outflows of resources related to contributions subsequent to the measurement date will be recognized as a reduction of the net pension liability in the year ended June 30, 2017. Other amounts reported as deferred outflows of resources and deferred inflows of resources related to pensions will be recognized as pension expense as follows:
Safety MiscellaneousYear Ended Annual Annual
June 30 Amortization Amortization Total2018 (298,132)$ 846,644$ 548,512$ 2019 (195,024) 750,262 555,2382020 772,089 1,336,531 2,108,6202021 437,367 736,419 1,173,786
Actuarial Assumptions
The total pension liabilities in the actuarial valuations were determined using the following actuarial assumptions:
Valuation Date June 30, 2015Measurement Date June 30, 2016Actuarial Cost Method Entry-Age Normal Cost MethodActuarial Assumptions:
Discount Rate 7.65%Inflation 2.75%Payroll Growth 3.0%Projected Salary Increase Varies by Entry Age and ServiceInvestment Rate of Return 7.5% (1)Mortality Derived using CalPers Membership Data for all Funds (2)
(1) Net of pension plan investment expenses, including inflation(2) The mortality table used was developed based on CalPERS’ specific data. The table includes 20 years of mortality improvements using Society of Actuaries Scale BB. For more details on this table, please refer to the CalPERS 2014 experience study report available on the CalPERS website: www.calpers.ca.gov
Discount Rate
The discount rate used to measure the total pension liability was 7.65% for each of the Plans. To determine whether the municipal bond rate should be used in the calculation of a discount rate for each plan, CalPERS stress tested plans that would most likely result in a discount rate that would be different from the actuarially assumed discount rate. Based on the testing, none of the tested plans ran out of assets. Therefore, the assumed 7.65% discount rate is adequate and the use of the municipal bond rate is not necessary. The long term expected discount rate of 7.65% will be applied to all plans in the Public Employees Retirement Fund (PERF). The stress test results are presented in a detailed report called “GASB Crossover Testing Report” that can be obtained from the CalPERS website under the GASB 68 section.
$'

CITY OF SAN CARLOS NOTES TO BASIC FINANCIAL STATEMENTS
June 30, 2017
NOTE 10 – NET PENSION LIABILITY (Continued)
The long-term expected rate of return on pension plan investments was determined using a building-block method in which best-estimate ranges of expected future real rates of return (expected returns, net of pension plan investment expense and inflation) are developed for each major asset class.
In determining the long-term expected rate of return, staff took into account both short-term and long-term market return expectations and the expected pension fund cash flows. Such cash flows were developed assuming that both members and employers will make their required contributions on time and as scheduled in all future years. Using historical returns of all the funds’ asset classes, expected compound (geometric) returns were calculated over the short-term (first 10 years) and the long-term (11-60 years) using a building-block approach. Using the expected nominal returns for both short-term and long-term, the present value of benefits was calculated for each fund. The expected rate of return was set by calculating the single equivalent expected return that arrived at the same present value of benefits for cash flows as the one calculated using both short-term and long-term returns. The expected rate of return was then set equivalent to the single equivalent rate calculated above and rounded down to the nearest one quarter of one percent.
The table below reflects long-term expected real rate of return by asset class. The rate of return was calculated using the capital market assumptions applied to determine the discount rate and asset allocation. These geometric rates of return are net of administrative expenses.
Asset Class
New Strategic Allocation
Real Return Years 1 -
10(a)1Real Return Years 11+2
Global Equity 51% 5.25% 5.71%Global Fixed Income 20% 0.99% 2.43%Inflation Sensitive 6% 0.45% 3.36%Private Equity 10% 6.83% 6.95%Real Estate 10% 4.50% 5.13%Infrastructure and Forestland 2% 4.50% 5.09%Liquidity 1% -0.55% -1.05%
Total 100%
1 An expected inflation of 2.5% used for this period2 An expected inflation of 3.0% used for this period
$�

CITY OF SAN CARLOS NOTES TO BASIC FINANCIAL STATEMENTS
June 30, 2017
NOTE 10 – NET PENSION LIABILITY (Continued)
Sensitivity of the Proportionate Share of the Net Pension Liability to Changes in the Discount Rate
The following presents the City’s proportionate share of the net pension liability for each Plan, calculated using the discount rate for each Plan, as well as what the City’s proportionate share of the net pension liability would be if it were calculated using a discount rate that is 1-percentage point lower or 1-percentage point higher than the current rate:
Discount Rate1% Decrease Current 1% Increase
6.65% 7.65% 8.65%
Safety 24,920,024$ 17,790,912$ 11,938,642$ Miscellaneous 28,958,077 20,234,806 13,025,456
Pension Plan Fiduciary Net Position
Detailed information about each pension plans’ fiduciary net position is available in the separately issued CalPERS financial reports.
b. Public Agency Retirement Services (PARS) Longevity Recognition Plan
Plan Description and Benefits
The City sponsors a Longevity Recognition Plan for its retirees. All full-time employeeshired before January 1, 2009 are eligible for a longevity recognition benefit if they retire fromthe City with a CalPERS pension and with at least 10 years of City service. All AFSCME(formerly known as Clerical and Mid-Management) and Teamsters employees hired on orafter January 1, 2009 and before the following exclusion dates depending on bargaininggroup are eligible for a longevity recognition benefit if they retire from the City with aCalPERS pension and with at least 15 years of City service.
Bargaining Group Exclusion Date AFSCME (formerly known as Mid-Management) December 13, 2010 AFSCME (formerly known as Clerical) February 28, 2011 Teamsters March 28, 2011
Employees hired by the City before January 1, 2009 receive a monthly payment equal to the Internal Revenue Code (IRC) Section 125 Plan benefit for active Miscellaneous employees with single coverage, $809.46 per month for 2017, subject to future annual increases. The cap for Police retirees has been $718.11 since 2011 and is not expected to be increased.
Eligible employees hired by the City after January 1, 2009 and before the exclusion date for their respective bargaining groups will receive a monthly payment of $350 per month with no future increases upon retirement.
The longevity recognition benefit is payable for the retiree’s lifetime. No continuation of longevity benefits are payable to surviving spouses or dependents. No employees hired after the above exclusion dates are eligible for longevity benefits.
$

CITY OF SAN CARLOS NOTES TO BASIC FINANCIAL STATEMENTS
June 30, 2017 �
NOTE 10 – NET PENSION LIABILITY (Continued) Participants Covered As of the measurement date, June 30, 2016, the number of participants is as follows: 42 active and 33 retirees. Contributions During the year ended June 30, 2017, the contributions totaled $452,000. Net Pension Liability The net pension liability for the plan is measured as the total pension liability, less the Plan’s fiduciary net position. A summary of the actuarial assumptions and methods used to determine the net pension liability is shown below. Actuarial Assumptions and Discount Rate
PARS Longevity Recognition PlanValuation Date June 30, 2015
Measurement Date June 30, 2016Actuarial Cost Method Individual Entry Age, Level Percent of Pay, Normal Cost Method
23-year amortization of unfunded liability (closed period) as a level percentage of projected payroll.
Discount Rate 4.44%Inflation 2.50%Annual Salary Increases CalPERS salary scale for Miscellaneous employees hired at age
30.
Municipal Bond Rate 2.85%. As of June 30, 2016, the 20-year AA bond yield (based on the Bond Buyer Index).
Investment Rate of Return 6.0% net of investment expenses, including 2.5% inflation.
Mortality Rates based on statistics taken from the California PERS Experience Study Report adopted in 2014 and include a margin for mortality improvement based on Scale BB projected to 2028.
Assets are invested in PAR’s Highmark Moderate Index PLUS Diversified Portfolio.
Asset ClassAsset
Allocation
Expected Arithmetic
Nominal Return (50 yrs)
U.S. Equity 50.0% 7.84%U.S. Fixed Income 45.0% 4.88%Cash 5.0% 3.19%
Expected Geometric Return (50 yrs) 5.94% � �
$!

CITY OF SAN CARLOS NOTES TO BASIC FINANCIAL STATEMENTS
June 30, 2017 �
NOTE 10 – NET PENSION LIABILITY (Continued)
Changes in the Net Pension Liability The changes in the June 30, 2016, Measurement Date follows:
Increase (Decrease)
Total Pension Liability
Plan FiduciaryNet Position
Net Pension Liability/(Asset)
Balance at June 30, 2015 9,513,814$ 1,663,142$ 7,850,672$ Changes in the year:
Service cost 225,433 225,433Interest on the total pension liability 470,045 470,045Contribution - employer 350,000 (350,000)Contribution - employeeNet investment income 15,848 (15,848)Administrative expenses (394) 394Change of assumptions 802,583 802,583Benefit payments (299,652) (299,652)
Net changes 1,198,409 65,802 1,132,607
Balance at June 30, 2016 10,712,223$ 1,728,944$ 8,983,279$ �
Sensitivity of the Net Pension Liability to changes in the Discount Rate The following presents the City’s proportionate share of the net pension liability for each Plan, calculated using the discount rate for each Plan, as well as what the City’s proportionate share of the net pension liability would be if it were calculated using a discount rate that is 1-percentage point lower or 1-percentage point higher than the current rate:
Discount Rate1% Decrease Current 1% Increase
3.44% 4.44% 5.44%
Net Pension Liability 10,651,711$ 8,983,279$ 7,625,860$
Pension Plan Fiduciary Net Position
Detailed information about each pension plans’ fiduciary net position is available in the separately issued PARS financial reports.
� �
$(
CITY OF SAN CARLOS NOTES TO BASIC FINANCIAL STATEMENTS
June 30, 2017 �
NOTE 10 – NET PENSION LIABILITY (Continued)
Pension Expenses and Deferred Outflows/Inflows of Resources Related to Pension For the year ended June 30, 2017, the City recognized pension expense of $841,972 for the PARS Longevity Recognition Plan. At June 30, 2017, the City reported the following related to this plan:
Deferred Outflows Deferred Inflowsof Resources of Resources
Contributions subsequent to measurement date 452,000$ -$ Differences between actual and expected experience - - Changes in assumptions 585,669 - Net differences between projected and actual earnings on plan investments 108,436 -
Total 1,146,105$ -$
The $452,000 reported as deferred outflows of resources related to contributions subsequent to the measurement date will be recognized as a reduction of the net pension liability in the year ended June 30, 2018. Other amounts reported as deferred outflows of resources and deferred inflows of resources related to pensions will be recognized as pension expense as follows:
Year Ended AnnualJune 30 Amortization
2018 247,365$ 2019 247,3652020 182,2902021 17,085
NOTE 11 – OTHER POST-EMPLOYMENT BENEFITS a. Provisions and Benefits
OPEB Healthcare – During fiscal year 2008-2009, the City joined the California Employers' Retiree Benefit Trust (CERBT), an agent multiple-employer plan administered by CalPERS, consisting of an aggregation of single-employer plans. City Council authorized a deposit of $1,575,000 with CERBT on October 10, 2008 to begin funding its OPEB liability.
By Council resolution and through agreements with its labor units, the City provides certain health care benefits for retired employees (spouse and dependents are not included) under Public Employees’ Medical Healthcare Act (PEMHCA). A summary of eligibility and retiree contribution requirements are described below:
� �
$"
CITY OF SAN CARLOS NOTES TO BASIC FINANCIAL STATEMENTS
June 30, 2017
NOTE 11 – OTHER POST-EMPLOYMENT BENEFITS (Continued)
Employees are eligible for retiree health benefits if they retire from the City with a CalPERS pension.
For retirees who retired on or before December 31, 2008, the City will reimburse the retiree only premium, up to the active employee single cap. The cap amount for miscellaneous is $809.46 per month for 2017. The cap amount for safety (Police) retirees is $718.11 and is not expected to be increased.
The City will continue to pay the CalPERS minimum contribution for surviving spouses of retirees as long as they remain enrolled in a health plan sponsored by CalPERS (PEMHCA).
For employees retiring on or after January 1, 2009 from the City of San Carlos who choose to enroll in a CalPERS retiree health plan, the City contributes the minimum monthly premium amount specified by CalPERS towards the cost of CalPERS (PEMHCA) medical premiums. The minimum is $128 per month for 2017.
As of June 30, 2017, 73 retired employees participated in the retiree healthcare benefits. Additionally, 101 current employees have met the criteria for the retiree healthcare benefits and are eligible to participate in the program if they retire from the City of San Carlos in future years.
b. Funding Policy and Actuarial Assumptions
OPEB Healthcare – The annual required contribution (ARC) was determined as part of aJune 30, 2015, actuarial valuation using the projected unit credit actuarial cost method.Under this method, the actuarial present value of projected benefits is the value of benefitsexpected to be paid for current actives and retirees and is calculated based on theassumptions and census data from the actuarial report. The actuarial assumptions included(a) 7% discount rate and (b) range of 4.25% to 6.25% health inflation increases. Actuariallydetermined amounts are subject to revision at least biannually as results are compared topast expectations and new estimates are made about the future. The City’s unfundedactuarial accrued liability is amortized as a level dollars amount on a closed basis using a30-year amortization period from June 30, 2009. The remaining amortization period as ofJune 30, 2017 is 22 years.
In accordance with the City's budget, the ARC is to be funded throughout the year as apercentage of payroll. During the fiscal year 2008-2009, the City Council passed a resolutionto participate in the California Employers Retirees Benefit Trust (CERBT), an irrevocabletrust established to fund OPEB. CERBT is administrated by CalPERS, and is managed byan appointed board not under the control of the City Council. This Trust is not considered acomponent unit of the City and has been excluded from these financial statements.Separately issued financial statements for CERBT may be obtained from CALPERS at P.O.Box 942709, Sacramento, CA 94229-2709.
$#

CITY OF SAN CARLOS NOTES TO BASIC FINANCIAL STATEMENTS
June 30, 2017
NOTE 11 – OTHER POST-EMPLOYMENT BENEFITS (Continued)
c. Funding Progress and Funded Status
Generally accepted accounting principles permit contributions to be treated as OPEB assetsand deducted from the Actuarial Accrued Liability (AAL) when such contributions are placedin an irrevocable trust or equivalent arrangement. In fiscal year 2017, the City madecontributions and amortized its net OPEB asset and obligation as presented below:
Annual required contribution (ARC) 383,000$ Interest on net OPEB obligation (1,000)Adjustment to annual required contribution 1,000
Annual OPEB cost (expense) 383,000 Contributions made 398,000
Increase/(decrease) in Net OPEB obligation (15,000)
Net OPEB Asset - beginning of year (9,759)
Net OPEB Asset - end of year (24,759)$
The City's annual required contributions and actual contributions for the year ended June 30, 2017 are set forth below:
Fiscal YearAnnual OPEB
CostActual
Contributions
Percentage of Annual OPEB
Cost
Net OPEB Obligation
(Asset)
6/30/2017 383,000$ 398,000$ 104% (24,759)$
The Schedule of Funding Progress below and in the required supplementary information immediately following the notes to the financial statements presents trend information about whether the actuarial value of plan assets is increasing or decreasing over time relative to the actuarial accrued liability for benefits. Trend data as of the June 30, 2015 actuarial study is presented below:
OverfundedActuarial (Unfunded)
Actuarial Accrued Overfunded AAL asActuarial Value of Liability (Unfunded) Funded Covered Percentage ofValuation Assets (AAL) AAL Ratio Payroll Covered Payroll
Date (A) (B) (A – B) (A/B) (C) [(A – B)/C]
6/30/2015 1,255$ 4,926$ (3,671)$ 25.48% 5,805$ -63.24%
$$

CITY OF SAN CARLOS NOTES TO BASIC FINANCIAL STATEMENTS
June 30, 2017 �
NOTE 12 – RISK MANAGEMENT a. Liability Coverage
The City participates in the Association of Bay Area Governments (ABAG), a non-profit public benefit corporation established to provide liability insurance coverage, claims and risk management, and legal defense to its participating members. The ABAG Plan provides $5,000,000 of general and automobile liability coverage per occurrence and $25,000,000 excess liability coverage per occurrence and is responsible for paying claims in excess of the City's $100,000 deductible. For the year ended June 30, 2017, the City paid the ABAG Plan $360,459 in premiums.
Financial statements may be obtained from ABAG Services, P.O. Box 2050, Oakland, CA 94604-2050.
b. Workers' Compensation Coverage
The City participates in the Cities Group, created by a joint powers agreement to provide workers’ compensation coverage of up to $10,000,000 per occurrence in excess of $1,500,000 for safety officers and $1,000,000 for miscellaneous employees. The Group acts as administrator, claim adjuster and provides other risk management services as required by State law. Each member of the Group pays a premium commensurate with the level of coverage requested and shares surpluses and deficits proportionately to its participation in the Group. During the year ended June 30, 2017, the City paid the Group $64,559 in premiums. At June 30, 2017, the Group reported that the City's equity for the workers' compensation program amounted to $156,193. Financial statements may be obtained from the Cities Group, P.O. Box 111, Burlingame, CA 94011-0111.
c. Liability for Uninsured Claims
The City's liability for uninsured claims at June 30, 2017 was estimated by management based on the ABAG Plan's claims experience and recorded in the Liability Insurance Internal Service Fund. For the years ended June 30, 2017 and 2016, the amount of settlements did not exceed insurance coverage.
$%

CITY OF SAN CARLOS NOTES TO BASIC FINANCIAL STATEMENTS
June 30, 2017 �
NOTE 12 – RISK MANAGEMENT (Continued)
The City's liability for uninsured claims is limited to workers' compensation and general liability claims, as discussed above, and was estimated by management based on prior years’ claims experience as follows for the year’s ended:
2017 2016
Beginning balance 573,896$ 523,895$ Net change in liability for claims and claims paid but not reported 385,196 528,405
Claims paid (361,922) (478,404)
Balance at June 30 597,170 573,896
Current Portion 347,170 200,736
Long-term Portion 250,000$ 373,160$
June 30,
NOTE 13 – JOINT VENTURES The City participates in joint ventures through formally organized and separate entities established under the Joint Exercise of Powers Act (JPA) of the State of California. As separate legal entities, these entities exercise full powers and authorities within the scope of the related Joint Powers Agreements, including the preparation of annual budgets, accountability for all funds, the power to make and execute contracts and the right to sue and be sued. Each joint venture is governed by a board consisting of representatives from member municipalities. Each board controls the operations of the respective joint venture, including selection of management and approval of operating budgets, independent of any influence by member municipalities beyond their representation on that board. Obligations and liabilities of these joint ventures are not the City's responsibility and the City does not have an equity interest in the assets of each joint venture except upon dissolution of the joint venture. a. Belmont-San Carlos Fire Department
The South County Fire Authority was formed in 1979 between the Cities of San Carlos and Belmont on an equal basis to provide more efficient fire protection services for the two cities. Any assets used by the Fire Authority but owned by the member agencies prior to the creation of the Fire Authority remain the property of the members. Each member contributes its pro rata share of operating costs to the Fire Authority. On April 12, 2010, the City Council adopted a resolution authorizing the City Manager to send notice to Belmont Fire Protection District of the City's intent to dissolve the joint powers authority establishing Belmont-San Carlos Fire Department. The service termination of the Belmont-San Carlos Fire Department took effect on October 1, 2011.
� �
$&
CITY OF SAN CARLOS NOTES TO BASIC FINANCIAL STATEMENTS
June 30, 2017 �
NOTE 13 – JOINT VENTURES (Continued) As a result of the termination of service with the Belmont-San Carlos Fire Department, the City is required to make the annual contribution paying for: other post-employment benefits for retirees who have earned lifetime medical coverage; unfunded liabilities of the safety and miscellaneous retirement plans with CalPERS; outstanding workers’ compensation claims from past employees; and liability claims or other obligations of the former Fire Department. The City’s contribution during the year ended June 30, 2017 was $1,814,363.
b. Fire and Emergency Services Agreement with the City of Redwood City
In July 2011, the City of San Carlos and the City of Redwood City entered into an agreement for fire and emergency services. This original agreement allowed the City of San Carlos to maintain a fire department, including personnel and infrastructure, at its sole cost sufficient to provide certain emergency and non-emergency services. The City of Redwood City provided certain fire and emergency services, including fire administration and support; fire prevention; investigation; and training. The City of San Carlos pays the City of Redwood City a fee for the services provided that will be reviewed in January of each year and amended to reflect actual increases or decreases in cost. On June 24, 2013, the City Council adopted a resolution for the execution of the amended and restated agreement between the Cities of Redwood City and San Carlos for a full service model for fire and emergency services. The restated agreement also included the transfer of fire services personnel from the City of San Carlos to the City of Redwood City on July 1, 2013. The term of the agreement is five years, commencing on July 1, 2013 and expiring on June 30, 2018. Costs of services will be reviewed annually and brought forward for Council approval each year.
c. Law Enforcement Services Agreement with the County of San Mateo
In September 2010, the City Council approved a five-year Police Services Agreement contract with the County of San Mateo Sheriff’s Office to provide law enforcement to the City. The contract with the Sheriff includes police management, patrol, investigation, traffic enforcement, community and school services, as well as support service components. The contract maintains minimum staffing levels for patrol, provides for the same quick response times and restores many of the key community programs that the San Carlos Police Department had provided during better economic times. The consolidation of police services with the Sheriff’s Office results in estimated annual savings of approximately $2 million. Annual cost increases are limited to those increases required under California Government Code: Section 51350. On May 11, 2015, the Agreement with the Sheriff’s Office was renewed for another five-year term expiring June 30, 2020. In the seventh year of the Agreement, the total charges for Fiscal Year 2016-17 were $7,872,997.
%'

CITY OF SAN CARLOS NOTES TO BASIC FINANCIAL STATEMENTS
June 30, 2017
NOTE 13 – JOINT VENTURES (Continued)
d. Silicon Valley Clean Water (SVCW)
Silicon Valley Clean Water (formerly the South Bayside System Authority) was formed in1975 between the cities of San Carlos, Belmont, Redwood City and the West Bay SanitationDistrict to operate a wastewater treatment facility. The cost of operating and maintaining thefacility is divided in proportion to the volume of sewage entering from each member entity.During the year ended June 30, 2017, the City contributed $3,791,196 toward the cost ofoperating and maintaining the facility and paid debt principal and interest of $1,983,153 thatincluded the State revolving fund loan and the financing agreements to finance theconstruction and rehabilitation of the SVCW’s wastewater system. For the fiscal year 2017 –2018, the City is obligated to pay debt principal and interest payments totaling $1,985,219.
The condensed financial information of the JPA as of June 30, 2017 is as follows:
Total Assets 302,112,248$ Total Deferred Outflows 6,969,339 Total Liability (223,112,712) Total Deferred Inflows (5,832,072) Total Net Position 80,136,803$
Total Operating Revenues 38,604,428$ Total Operating Expenses (32,149,766) Total Operating Income (Loss) 6,454,662 Other Income (Loss) (5,481,752) Net Income 972,910$
Cumulative Agency Balances:Belmont 20,755,009$ San Carlos 6,680,080 Redwood City 39,111,940 West Bay Sanitation District 13,589,774
Total Net Position 80,136,803$
Of the $223,112,712 liability, $130,390,000 is related to the 2009, 2014 and 2015 revenue bonds. Of that amount, the City’s direct obligation is $22,463,030.
%�
CITY OF SAN CARLOS NOTES TO BASIC FINANCIAL STATEMENTS
June 30, 2017
NOTE 13 – JOINT VENTURES (Continued)
The City entered into financing agreements with SVCW for repayment of the City’s allocated share of the 2009, 2014 and 2015 bonds in the amount of $30,947,027. The financing agreements are secured by a pledge of the City’s Sewer Enterprises Fund Net Revenue as defined under the financing agreements. For the fiscal year 2016 – 2017, gross Sewer Fund revenues, including operating revenues and non-operating interest earnings, amounted to $17,072,848. The operating and maintenance costs, including operating expenses, transfers out for overhead and administrative cost but excluding interest, and depreciation or amortization amounted to $9,563,723. Net revenues available for debt services amounted to $7,509,125, which represented coverage of 4.04 times over the total of debt services of $1,859,007.
In October 2015, SVCW issued the 2015 wastewater revenue bonds in the amount of $70.2 million. Pursuant to the financing agreement, the City’s allocable share of the 2015 bonds is approximately 15.14%.
Of the total bond proceeds, $8.5 million will be used to refund, on an advance basis, certain maturities of the 2008 Bonds and approximately $49.8 million will be used to refund, on an advance crossover basis, certain maturities of the 2009 Bonds.
Proceeds associated with the Refunded 2008 Bonds has been deposited into the “2008 Escrow Fund” for principal and interest payments through August 1, 2017, when the remaining proceeds will be applied to pay the redemption price of the outstanding Refunded 2008 Bonds in full. As a result of the deposit and the application of funds under the escrow agreement relating to the Refunded 2008 Bonds, the Refunded 2008 Bonds are considered fully defeased upon the issuance of the 2015 bonds and are no longer secured by revenues that were originally pledged for the payment of the 2008 Bonds.
Proceeds associated with the Refunded 2009 Bonds has been deposited into the “2009 Escrow Fund” until the Crossover date of August 1, 2019, when all of the outstanding Refunded 2009 Bonds will be redeemed, without premium. Prior to the Crossover date, the Refunded 2009 Bonds will continue to be secured by and payable from the revenues that were originally pledged for the payment of the 2009 Bonds.
The City’s investment in SVCW was adjusted to reflect a net increase in the investment of $1.7 million. Every year the City adjusts the investment based on the City’s proportion of financial activity at SVCW.
Financial statements may be obtained by mailing a request to Silicon Valley Clean Water, 1400 Radio Road, Redwood City, CA 94065.
e. City/County Association of Governments of San Mateo County (C/CAG)
City/County Association of Governments of San Mateo County was formed in 1990 betweenthe various cities in San Mateo County to prepare, adopt, monitor and enforce Statemandated plans for the management of traffic congestion, integrated solid waste, airportland use and hazardous waste. The City's contribution to C/CAG was $101,752 for the yearended June 30, 2017. Financial statements may be obtained by mailing a request to the Cityof San Carlos, 600 Elm Street, San Carlos, CA 94070.
%

CITY OF SAN CARLOS NOTES TO BASIC FINANCIAL STATEMENTS
June 30, 2017 �
NOTE 13 – JOINT VENTURES (Continued)
f. South Bayside Waste Management Authority (SBWMA) The South Bayside Waste Management Authority (the Authority) was formed by a joint powers agreement on October 13, 1999. Members of the Authority currently include the cities of Atherton, Belmont, Burlingame, East Palo Alto, Foster City, Hillsborough, Menlo Park, Redwood City, San Carlos, San Mateo, as well as the West Bay Sanitary District and the County of San Mateo. The Members are required by AB939 to reduce, recycle and reuse solid waste generated within their respective jurisdictions and to provide source reduction, recycling and composting activities. The Authority's purpose is to assist its members in meeting these requirements. Financial statements may be obtained by mailing a request to the City of San Carlos, 600 Elm Street, San Carlos, CA 94070.
NOTE 14 – COMMITMENTS AND CONTINGENT LIABILITIES The City is subject to litigation arising during the normal course of business. In the opinion of the City Attorney, there is no pending litigation that is likely to have a material adverse effect on the financial position of the City. The City participates in federal, State and local grant programs. These programs have been audited by the City's independent accountants in accordance with the provisions of the Federal Single Audit Act of 1984, as amended, and applicable State requirements. No cost disallowances were proposed as a result of these audits; however, these programs are still subject to further examination by the grantors and the amount, if any, of expenditures that may be disallowed by the granting agencies cannot be determined at this time. The City expects such amounts, if any, to be immaterial. a. Palo Alto Medical Foundation Development Agreement
On October 8, 2007, after an extensive 3 1/2-year process, the City Council approved a proposal by the Palo Alto Medical Foundation (PAMF) to develop a regional Medical Clinic, Medical Office Building and Hospital on an 18-acre site at 301 Industrial Road in San Carlos that formerly housed the Varian – CPI Eimac plant. In 2011, Sutter Health, PAMF’s parent organization, approved funding for the first phase construction of its medical facility in San Carlos. This included construction of the Medical Office Building and Clinic, the parking garage to serve full facility build-out, and site improvements, including utilities, loop access road and landscaping. In May 2012, PAMF received construction permits from the City and began work. The Medical Office Building and Clinic opened to patients in November 2014. A second phase of the project, to construct the Hospital on this site, remains unfunded. The purchase and transfer of the 18-acre site at 301 Industrial Road took a major parcel in San Carlos off of the property tax rolls of the City. This occurred when the title to the site passed from 301 Industrial LLC (the entity performing the site clearance and remediation activities) to PAMF, which is a tax-exempt entity. In addition, the PAMF San Carlos Center generates very little in sales tax revenue for the City. To offset this fiscal impact, a Development Agreement with PAMF was entered into to ensure that the City would be in substantially the same position financially as the City would likely have been with use of the Project Site instead for another, economically productive use.
%!

CITY OF SAN CARLOS NOTES TO BASIC FINANCIAL STATEMENTS
June 30, 2017 �
NOTE 14 – COMMITMENTS AND CONTINGENT LIABILITIES (Continued) The key components of the Development Agreement are described in the table below. The Development Agreement guarantees the City nearly $91,000,000 in revenue over a 50-year period. When factoring in costs for City services, the Development Agreement would net the City $43,939,000 over 50 years, resulting in a positive net present value of $11,642,000. The net amount does not include one-time payments of $1 million to the City for athletic fields and $1.5 million to the San Carlos Education Foundation for educational purposes. This amount also does not include the City's share of any excess returns of the $9 million principal amount to be funded by PAMF under the agreement, which could be substantial depending on the investment returns received on the fund.
The financial impacts of these developments are beneficial to the City. The Guaranteed Minimum Payments (item “C” in the table below) began in 2010-11 with a payment of $630,000 in April 2011 after receipt of $250,000 per year payments in the two years prior as described in the Development Agreement. Guaranteed Minimum Payments continued the following year with a payment of $730,607 in April 2017. The next guaranteed payment will be $748,872 in April 2018. In addition to receiving the Year 3 Guaranteed Minimum Payments of $630,000 in April 2011 as specified in the Development Agreement, the start of construction triggered two more events. First, the City received the "construction period revenue" for Phase 1 of the PAMF development (see item "D" in the table below). Since the second phase of the project is unfunded, the City and PAMF agreed to allocate $252,700 of the total construction period revenue to Phase 1, which the City has received. Second, the start of construction triggered payment to the City of the "guaranteed minimum annual operational use tax revenue" one year after construction is completed (see item "E" in the table below).
%(

CITY OF SAN CARLOS NOTES TO BASIC FINANCIAL STATEMENTS
June 30, 2017
NOTE 14 – COMMITMENTS AND CONTINGENT LIABILITIES (Continued)
The revenue sources contained in the Development Agreement are summarized in the following table:
Funding Source Summary Description Current StatusA $9 million endowment
fund (called the Designated Fund)
At the end of 50 years, the Designated Fund becomes the City's to administer
No change.
B 50% of excess returns on the Designated Fund at the end of the payment term
In addition to receiving the $9 million Designated Fund at the end of the term of the agreement, the City will then receive 50% of the amount of the Designated Fund that exceeds $9 million
No change.
C Guaranteed minimum payments from the revenue on the Designated Fund
$250,000 in each of Years 1 and 2$630,000 in Year 3$630,000 inflated by 2.5% per year for the next 49 years
The City has received a total of $5,254,881 from years 1 through 9. City will receive the year 10 payment of $748,872 in April 2018 as scheduled.
D Guaranteed minimum construction-related use tax revenue
$722,000 for the principal construction period
With the start of construction in May 2012, construction period revenue (use tax assigned to the project by the contractors) began to flow to the City's sales tax account. At completion of Phase I construction, the City had received a total of $252,700 in construction user taxes.
E Guaranteed minimumannual operational use tax revenue
$152,000/year inflated by 3%per year for 50 years
Deferred — $152,000 per yearis guaranteed for 50 years starting 1 year after construction of both theMedical Clinic and Hospital facilities are completed.
F $1.5 million One-time payment to the San Carlos Education Foundation for health-related school programs
Received by San Carlos Education Foundation on Feb. 5, 2008.
G $1 million One-time payment to the City to improve athletic facilities and fields
Received — by City of San Carlos on Feb. 5, 2008 and the funds were used to install a synthetic turf field at Lower Highlands Park.
Total: $90,804,000 (minimum) over 50 years
%"

CITY OF SAN CARLOS NOTES TO BASIC FINANCIAL STATEMENTS
June 30, 2017 �
NOTE 14 – COMMITMENTS AND CONTINGENT LIABILITIES (Continued) b. San Francisco Baykeeper Commitment
On February 16, 2010, the City entered into a consent decree with San Francisco Baykeeper to reduce the number of sanitary sewer overflows (SSOs) from the wastewater collection system. The agreement sets forth a timeline for reducing SSOs from the 2010 level of 64 per 100 miles of sewer line per year to a level of 4 per 100 miles of sewer line per year in 2017. The agreement required payments of $200,000 for an environmental mitigation project, $95,000 for litigation fees and costs, and $55,000 for compliance monitoring. These obligations have been met. The agreement also commits the City to certain actions including: SSO investigation, response and reporting; sewer condition assessment rehabilitation replacement; implementation of a fats, oil and grease program; sewer cleaning, hot spots, and lateral programs; regulation of private laterals; and a chemical root control program. An annual report is required commencing on March 1, 2011 and each year thereafter. The agreement sets forth stipulated payments for failure to file required reports. The City was notified by San Francisco Baykeeper (Baykeeper) that the Consent Decree which was signed and issued in 2010 would be allowed to automatically terminate after seven years. Baykeeper was pleased with the City’s progress reducing SSOs. To achieve these reductions, the City made a significant commitment to investing in its sewer system infrastructure, in terms of both financial and staff resources. The improvements to the City’s system have resulted in the prevention of hundreds of thousands of gallons of untreated sewage reaching San Francisco Bay. The consent decree has terminated.
c. Construction Commitments
Construction commitments as of June 30, 2017 consisted of the following projects:
ExpendituresContract to date as of Remaining
Project Name Amount June 30, 2017 Commitments
Holly Street/US 101 Interchange Modification 4,149,292$ 4,132,297$ 16,995$ Capacity Assurance Improvement 4,454,000 4,169,871 284,129 Sewer Lateral Replacement Project 1,111,630 1,040,920 70,710 Capacity Assurance Improvement Phase 4 1,642,050 1,180,233 461,817 Sanitary Sewer Rehabilitation Project 2,179,546 1,880,404 299,142 City Hall and Corporation Yard Generator 685,376 660,651 24,725 Highland Park Renovation 1,178,478 273,428 905,050
%#

CITY OF SAN CARLOS NOTES TO BASIC FINANCIAL STATEMENTS
June 30, 2017
NOTE 14 – COMMITMENTS AND CONTINGENT LIABILITIES (Continued)
d. PG&E Gas Transmission Line 147
The City is an interested party in matter 015-11-015, under which Pacific Gas and Electric isbeing investigated for serious rules violations for improper ex parte communications with theCalifornia Public Utilities Commission (CPUC). A tentative Settlement has been reachedthat is subject to CPUC approval. If approved, the City’s General Fund will receive$6,000,000. Additional ex parte communications have been disclosed, that could affect theSettlement and receipt of the funds.
NOTE 15 – SUCCESSOR AGENCY TRUST FOR ASSETS OF THE FORMER REDEVELOPMENT AGENCY
On December 29, 2011, the California Supreme Court upheld Assembly Bill 1X 26 (“the Bill”) that provided for the dissolution of all Redevelopment Agencies in the State of California. This action impacted the reporting entity of the City of San Carlos that previously had reported a Redevelopment Agency within the reporting entity of the City as a blended component unit.
The Bill provided that upon dissolution of a Redevelopment Agency, either the City or another unit of local government will agree to serve as the “successor agency” to hold the assets until they are distributed to other units of State and local government. On January 9, 2012, the City Council elected to become the Successor Agency for the former Redevelopment Agency in accordance with the Bill.
After enactment of the law, which occurred on June 28, 2011, Redevelopment Agencies in California cannot enter into new projects, obligations or commitments. Subject to the control of a newly established oversight board, remaining assets can only be used to pay enforceable obligations in existence at the date of dissolution (including the completion of any unfinished projects that were subject to legally enforceable contractual commitments).
In future fiscal years, Successor Agencies will only be allocated revenue in the amount that is necessary to pay the estimated annual installment payments on enforceable obligations of the former Redevelopment Agency until all enforceable obligations of the prior Redevelopment Agency have been paid in full and all assets have been liquidated.
%$

CITY OF SAN CARLOS NOTES TO BASIC FINANCIAL STATEMENTS
June 30, 2017 �
NOTE 15 – SUCCESSOR AGENCY TRUST FOR ASSETS OF THE FORMER REDEVELOPMENT AGENCY (Continued)
Additional Information for the Successor Agency of the Former RDA a. Cash and Investments
Cash and investments reported in the Successor Agency in the accompanying financial statements consisted of the following:
Cash and investments 1,137,553$ Cash and investments with fiscal agent 2,524,647
Total Cash and Investments 3,662,200$
b. Capital Assets
Capital assets of the Successor Agency as of June 30, 2017 consisted of the following:
Balance at Balance atJune 30, 2016 Additions Retirements June 30, 2017
Capital assets not being depreciated:Land 588,000$ -$ (588,000)$ -$ Construction in progress 281,676 - - 281,676
Total non-depreciable assets 869,676 - (588,000) 281,676 Capital assets being depreciated:
Buildings and improvements 2,311,798 - (2,311,798) -
Total capital assets being depreciated 2,311,798 - (2,311,798) -
Less accumulated depreciation for:Buildings (250,999) (11,559) 262,558 -
Total accumulated depreciation (250,999) (11,559) 262,558 -
Net capital assets being depreciated 2,060,799 (11,559) (2,049,240) -
Capital assets, net 2,930,475$ (11,559)$ (2,637,240)$ 281,676$
c. Long-term Debt
The Successor Agency long-term debt issues and transactions are summarized below and discussed in detail thereafter.
Balance Balance Due WithinJune 30, 2016 Retirements June 30, 2017 One Year
Notes Payable:Installment Purchase Agreement 2,635,859$ (50,626)$ 2,585,233$ 55,790$ Richard A. Berghella Trust Agreement, 582,748 (18,075) 564,673 19,869 2007 Non-Taxable Revenue Bonds, Series A 11,820,000 (145,000) 11,675,000 155,000 2007 Taxable Revenue Bonds, Series B 1,040,000 (330,000) 710,000 345,000
Total 16,078,607$ (543,701)$ 15,534,906$ 575,659$
� �
%%

CITY OF SAN CARLOS NOTES TO BASIC FINANCIAL STATEMENTS
June 30, 2017
NOTE 15 – SUCCESSOR AGENCY TRUST FOR ASSETS OF THE FORMER REDEVELOPMENT AGENCY (Continued)
Installment Purchase Agreement
On October 1, 1994, the Redevelopment Agency (Agency) purchased real property and provided the bulk of the financing required to construct and equip an 85-unit residential care facility for elderly low income persons. As part of the transaction, the San Carlos Development Corporation (SCDC) agreed to purchase and operate the facility. The Agency signed an Installment Purchase Agreement in the amount of $2,800,000 to finance its purchase of the land. Payments are made out of receipts from SCDC. Interest payments on the Installment Agreement are due monthly and principal payments began on May 1, 2012 and will continue through June 1, 2035, bearing interest of 10.9%. As of June 30, 2017, the total principal and interest remaining on the debt is $5,487,934.
Richard A. Berghella Trust Agreement
In October 2001, the Agency entered into a purchase agreement for $720,156 to purchase a parcel of land to be used for the construction of a residential facility for low and moderate income residents of the city. The agreement calls for monthly principal and interest payments of $6,055 due on the 15th day of each month through August 15, 2032, bearing interest at 9.50% per annum. As of June 30, 2017, the total principal and interest remaining on the debt is $1,029,299.
Tax Allocation Bonds
In December 2007, the Agency issued $12,875,000 of 2007 Series A Revenue Bonds, and $3,135,000 of 2007 Series B Taxable Revenue Bonds, to refinance the 1995 and 1997 Tax Allocation Bonds and to finance various redevelopment activities within or of benefit to the Project Area. The refunding resulted in an overall debt service increase of $75,767. The net present value of the savings resulted in an economic gain of $416,051. The 1995 and 1997 Tax Allocation Revenue Bonds were subsequently retired in December 2007.
The 2007 Series A and Series B Bonds are special obligations of the Agency payable solely from and secured by a pledge of tax revenues, including ad valorem taxes and incremental taxes that are required to be deposited into the housing fund, generated within the Project Area. Principal payments are payable annually on September 1 and the last principal payment is scheduled to occur in 2033. Interest payments are due semi-annually on September 1 and March 1 and bear interest between 3.25% and 5.5%. The pledge of future tax revenue ends upon repayment of the total 2007 Series A and Series B bonds in the amount of $27 million.
On February 1, 2012, this debt was transferred to the Successor Agency, which took over responsibility of winding down the operations of the former Agency upon dissolution.
%&

CITY OF SAN CARLOS NOTES TO BASIC FINANCIAL STATEMENTS
June 30, 2017
NOTE 15 – SUCCESSOR AGENCY TRUST FOR ASSETS OF THE FORMER REDEVELOPMENT AGENCY (Continued)
The Agency pledged, as security for bonds issued, either directly or through the Financing Authority, a portion of tax increment revenue that it receives. The bonds were issued to provide financing for various capital projects. Assembly Bill 1X 26 provided that upon dissolution of the Agency, property taxes allocated to redevelopment agencies no longer are deemed tax increment but rather property tax revenues and will be allocated first to successor agencies to make payments on the indebtedness incurred by the dissolved redevelopment agency. Total principal and interest remaining on the debt is $18,043,345 with annual debt service requirements as included below. For the current year, the total property tax revenue recognized by the Successor Agency for the payment of indebtedness incurred by the dissolved Redevelopment Agency was $1,608,179 and the debt service obligation on the bonds was $1,067,450.
Debt Service Requirements
The following schedule illustrates the debt service requirements to maturity for the debt outstanding as of June 30, 2017:
For the Year Ending Bonds AgreementsJune 30 Principal Interest Total Principal Interest Total
2018 500,000$ 568,444$ 1,068,444$ 75,659$ 302,401$ 378,060$ 2019 520,000 542,913 1,062,913 83,317 294,743 378,060 2020 550,000 518,431 1,068,431 91,755 286,305 378,060 2021 570,000 494,975 1,064,975 101,046 277,014 378,060 2022 595,000 470,219 1,065,219 111,278 266,782 378,060
2023-2027 3,400,000 1,918,875 5,318,875 750,050 1,140,276 1,890,326 2028-2032 4,245,000 1,043,113 5,288,113 1,152,160 677,564 1,829,724 2033-2035 2,005,000 101,375 2,106,375 784,641 122,242 906,883
Total 12,385,000$ 5,658,345$ 18,043,345$ 3,149,906$ 3,367,327$ 6,517,233$
d. Commitments and Contingent Liabilities
The Successor Agency is subject to litigation arising in the normal course of business. In theopinion of the City Attorney there is no pending litigation that is likely to have a materialadverse effect on the financial position of the Successor Agency.
e. State Controller Office Asset Transfer Review
In October 2014, the State Controller’s office completed the fieldwork for its review of theasset transfers between the City and Redevelopment Agency made from January 1, 2011through January 31, 2012 in accordance with Health and Safety Code section 34167.5.Through the review, the State Controller’s office identified that the repayment of principaland interest on a loan between the City and the former Redevelopment Agency, in theamount of $3,308,092, was deemed unallowable and should be returned. The results of thereview was based on the State Controller’s interpretation and understanding of the Code.The City disagrees with the finding and has communicated such to the State Controller’soffice. As of June 30, 2017, The City is waiting for an appeal process to be made availableso that an appeal can be filed.
&'

REQUIRED SUPPLEMENTARY INFORMATION

This Page Left Intentionally Blank

REQUIRED SUPPLEMENTARY INFORMATION
CALPERS COST SHARING PLAN SCHEDULE OF THE PROPORTIONATE SHARE OF THE NET PENSION LIABILITY AS OF JUNE 30, FOR THE LAST TEN FISCAL YEARS
MiscellaneousMeasurement Dates: 6/30/14 6/30/15 6/30/16
Plan's proportion of the Net Pension Liability (Asset) 0.22% 0.25% 0.23%
Plan's proportion share of the Net Pension Liability (Asset) 13,765,793$ 16,833,679$ 20,234,806$
Plan's Covered Payroll 6,254,350 6,577,443 7,079,214
Plan's Proportionate Share of the Net Pension Liability/(Asset) as a Percentage of its Covered Payroll 220% 256% 286%
Plan's Proportionate Share of the Fiduciary Net Position as a Percentage of the Plan's Total Pension Liability 77.29% 72.85% 68.77%
Measurement Dates: 6/30/14 6/30/15 6/30/16Plan's proportion of the Net Pension Liability (Asset) 0.22% 0.23% 0.21%Plan's proportion share of the Net Pension Liability (Asset) 13,974,817$ 15,579,631$ 17,790,912$ Plan's Covered Payroll 2,225,546 114,534 119,583 Plan's Proportionate Share of the Net Pension Liability/(Asset) as a Percentage of its Covered Payroll 627.93% 13603% 14877%Plan's Proportionate Share of the Fiduciary Net Position as a Percentage of the Plan's Total Pension Liability 73.42% 69.92% 66.12%
Notes to Schedule:
Benefit Changes: There were no changes to benefit terms that applied to all members of the Public Agency Pool. However, individual employers in the Plan may have provided a benefit improvement to their employees by granting Two Years Additional Service Credit to members retiring during a specified time period (a.k.a. Golden Handshakes).
* Fiscal year 2015 was the 1st year of implementation, therefore only three years are shown.
Safety
Changes in assumptions: There were no changes of assumptions
&!

REQUIRED SUPPLEMENTARY INFORMATION
CALPERS COST SHARING PLAN SCHEDULE OF PLAN CONTRIBUTIONS AS OF JUNE 30, FOR THE LAST TEN FISCAL YEARS
MiscellaneousFiscal year ended 2015 2016 2017
Actuarially determined contribution 1,261,404$ 1,102,597$ 670,838$
Contributions in relation to the actuarially determined contributions (1,261,404) (1,102,597) (670,838)
Contribution deficiency (excess) -$ -$ -$
Covered payroll 6,254,350$ 6,577,443$ 7,079,214$
Contributions as a percentage of covered payroll 20.17% 16.76% 9.48%
SafetyFiscal year ended 2015 2016 2017
Actuarially determined contribution 1,034,659$ 1,169,706$ 1,112,696$ Contributions in relation to the actuarially determined contributions (1,034,659) (1,169,706) (1,112,696)Contribution deficiency (excess) -$ -$ -$
Covered payroll 2,225,546$ 114,534$ 119,583$
Contributions as a percentage of covered payroll 46.49% 1021% 930%
* Fiscal year 2015 was the 1st year of implementation, therefore only three years are shown.
&(

REQUIRED SUPPLEMENTARY INFORMATION
PARS LONGEVITY RECOGNITION PLAN SCHEDULE OF CHANGES IN THE NET PENSION LIABILITY AND RELATED RATIOS
AS OF JUNE 30, FOR THE LAST TEN FISCAL YEARS
Measurement Date: 6/30/2014 6/30/2015 6/30/2016Total Pension LiabilityService Cost Not available 239,822$ 225,433$ Interest Not available 455,847 470,045Changes of assumptions Not available 802,583Benefit payments, including refunds of employee contributions Not available (261,805) (299,652) Net change in total pension liability Not available 433,864 1,198,409 Total pension liability - beginning Not available 9,079,950 9,513,814 Total pension liability - ending (a) 9,079,950 9,513,814 10,712,223Plan fiduciary net positionContributions - employer 311,000 328,200 350,000Contributions - employeeNet investment income 141,262 29,190 15,848 Administrative expenses (373) (394) Benefit payments, including refunds of employee contributions (208,839) (261,805) (299,652) Net change in plan fiduciary net position 243,423 95,212 65,802 Plan fiduciary net position - beginning 1,324,507 1,567,930 1,663,142 Plan fiduciary net position - ending (b) 1,567,930 1,663,142 1,728,944
Net pension liability - ending (a)-(b) 7,512,020$ 7,850,672$ 8,983,279$
Plan fiduciary net position as a percentage of the total pension liability 17.27% 17.48% 16.14%Covered payroll 1 4,751,000$ 3,794,000$ 3,848,632$ Net pension liability as percentage of covered payroll 158.11% 206.92% 233.41%
Notes to Schedule:
* Fiscal year 2015 was the 1st year of implementation, therefore only three years are shown.
1 Covered payroll as of June 30, 2015 only reflects 36 of 43 active employees.
�� �
&"

REQUIRED SUPPLEMENTARY INFORMATION
PARS LONGEVITY RECOGNITION PLAN SCHEDULE OF PLAN CONTRIBUTIONS
AS OF JUNE 30, FOR THE LAST TEN FISCAL YEARS
Fiscal year ended 2015 2016 2017
Actuarially determined contribution Not available 620,227$ $765,384Contributions in relation to the actuarially determined contributions Not available (328,200) (350,000) Contribution deficiency (excess) Not available 292,027$ 415,384$
Covered payroll 1 Not available 3,794,000$ 3,848,632$
Contributions as a percentage of covered payroll Not available 8.65% 9.09%
Notes to ScheduleValuation date: 6/30/2015
Actuarial cost method Entry-Age Normal Cost MethodAmortization method Level percentage of payroll, closedRemaining amortization period
Discount Rate 4.44%Inflation 2.50%Annual Salary Increases
Investment Rate of Return 6.0% net of investment expenses, including 2.5% inflation.Mortality Derived using CalPERS Membership Data for all Funds
1 Covered payroll as of June 30, 2015 only reflects 36 of 43 actives employees.* Fiscal year 2015 was the 1st year of implementation, therefore only three years are shown.
CalPERS salary scale for Miscellaneous employees hired at age 30.
23 year amortization of unfunded liability (closed period) as a level percentage of projected payroll
&#

REQUIRED SUPPLEMENTARY INFORMATION
OTHER POST-EMPLOYMENT BENEFITS SCHEDULE OF PLAN CONTRIBUTIONS
AS OF JUNE 30, FOR THE LAST THREE FISCAL YEARS
Fiscal YearAnnual OPEB
CostActual
Contributions
Percentage of Annual OPEB
Cost
Net OPEB Obligation
(Asset)
6/30/2015 287,127$ 287,000$ 100% (106,879)$ 6/30/2016 381,320 284,200 75% (9,759)6/30/2017 383,000 398,000 104% (24,759)
OTHER POST-EMPLOYMENT BENEFITS SCHEDULE OF FUNDING PROGRESS (in thousands)
AS OF JUNE 30, FOR THE LAST THREE FISCAL YEARS
OverfundedActuarial (Unfunded)
Actuarial Accrued Overfunded AAL asActuarial Value of Liability (Unfunded) Funded Covered Percentage ofValuation Assets (AAL) AAL Ratio Payroll Covered Payroll
Date (A) (B) (A – B) (A/B) (C) [(A – B)/C]
6/30/2011 1,140$ 5,197$ (4,057)$ 21.94% 5,863$ -69.20%6/30/2013 1,073 3,895 (2,822) 27.55% 4,751 -59.40%6/30/2015 1,255 4,926 (3,671) 25.48% 5,805 -63.24% �
&$

This Page Left Intentionally Blank

SUPPLEMENTAL INFORMATION

This Page Left Intentionally Blank

CITY OF SAN CARLOS
BUDGETARY COMPARISON SCHEDULECAPITAL IMPROVEMENTFOR THE YEAR ENDED JUNE 30, 2017
Variance WithFinal Budget
PositiveOriginal Final Actual (Negative)
Revenues:Property taxes 700,000$ 700,000$ 1,265,089$ 565,089$ Franchise taxes 1,386,600 1,386,600 1,853,604 467,004 Licenses and permits - - 548,935 548,935 From other agencies 400,000 191,896 1,257,306 1,065,410 Use of money and property - - 16,024 16,024 Other revenue 208,100 1,572,151 320,562 (1,251,589)
Total Revenues 2,694,700 3,850,647 5,261,520 1,410,873
Expenditures:Capital outlay 6,255,600 12,663,524 3,928,979 8,734,545
Total Expenditures 6,255,600 12,663,524 3,928,979 8,734,545
Excess (Deficiency) of RevenuesOver Expenditures (3,560,900) (8,812,877) 1,332,541 10,145,418
Other Financing Sources (Uses):Transfers in 3,307,900 3,307,900 3,361,518 53,618 Transfers (out) - (450,000) (473,500) (23,500)
Total Other Financing Sources (Uses) 3,307,900 2,857,900 2,888,018 30,118
Net Change in Fund Balance (253,000)$ (5,954,977)$ 4,220,559 10,175,536$
Beginning Fund Balance 12,311,030
Ending Fund Balance 16,531,589$
Budget Amounts
�'�
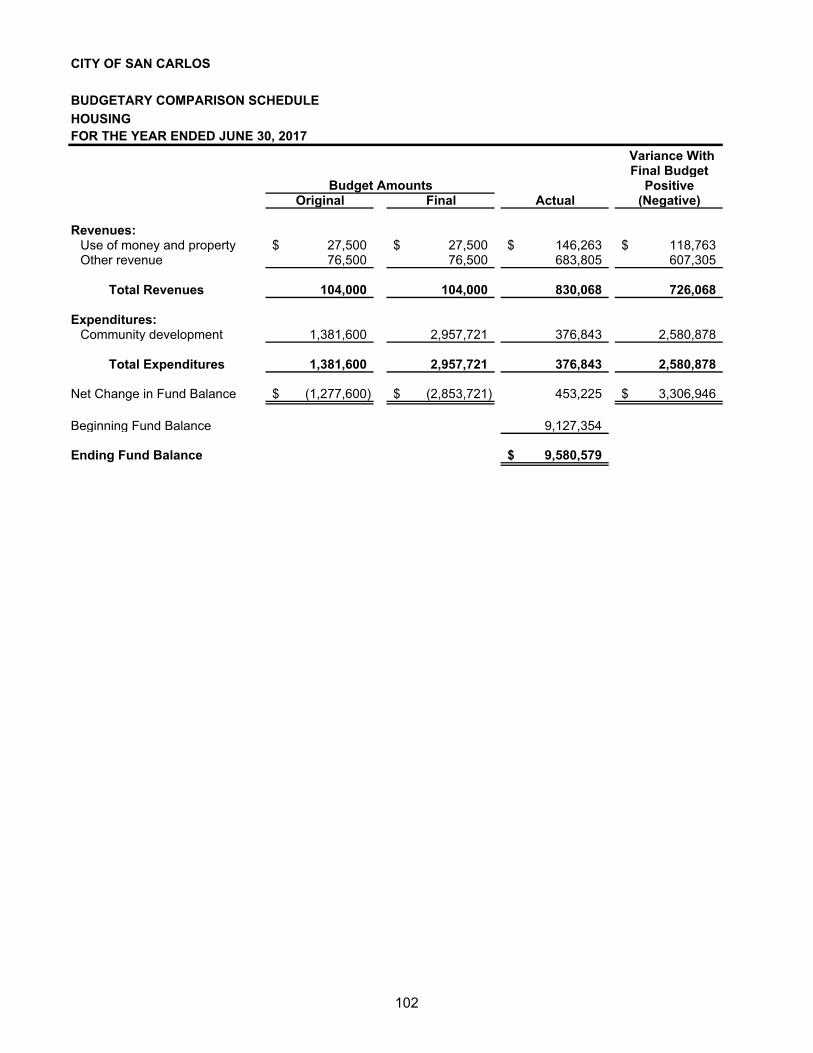
CITY OF SAN CARLOS
BUDGETARY COMPARISON SCHEDULEHOUSINGFOR THE YEAR ENDED JUNE 30, 2017
Variance WithFinal Budget
PositiveOriginal Final Actual (Negative)
Revenues:Use of money and property 27,500$ 27,500$ 146,263$ 118,763$ Other revenue 76,500 76,500 683,805 607,305
Total Revenues 104,000 104,000 830,068 726,068
Expenditures:Community development 1,381,600 2,957,721 376,843 2,580,878
Total Expenditures 1,381,600 2,957,721 376,843 2,580,878
Net Change in Fund Balance (1,277,600)$ (2,853,721)$ 453,225 3,306,946$
Beginning Fund Balance 9,127,354
Ending Fund Balance 9,580,579$
Budget Amounts
�'

NON-MAJOR GOVERNMENTAL FUNDS
SPECIAL REVENUE FUNDS
NPDES FUND – Used to account for revenues received from assessments levied by the County on property and disburses funds in compliance with the provisions of the National Pollutant Discharge Elimination System.
POLICE GRANTS FUND – Used to account for grant activities and services paid for and reimbursed by grant funding. This fund includes grants from the following funding sources:
� Supplemental Law Enforcement Services Funds (SLESF) – Under the SLESFprogram, cities and counties receive State funds to augment public safety expenditures.
� Office of Traffic Safety (OTS) State Funding – The program funds a variety of trafficrelated projects including equipment, personnel and overhead reimbursement.
SAN CARLOS LIBRARY TENANT FUND – Used to account for the San Carlos Library tenants activities.
CAPITAL PROJECTS FUNDS
EQUIPMENT REPLACEMENT FUND – Used to account for the anticipated replacement of general equipment needs.
MEASURE A FUND – Used to account for the City's share of a one-half cent sales tax restricted for transportation purposes.
GAS TAX FUNDS – Used to account for revenue received and expended under the State of California, Streets and Highways Code Sections 2106, 2107, and 2107.5. These revenues must be expended for maintenance or construction of streets.
PARK FEE FUND – Used to account for development fees collected and used to finance the acquisition and construction of City parks.
PARKING IN-LIEU FUND – Used to account for fees charged to business in lieu of required parking. These revenues are used to pay for parking lot improvements and repairs.
DEBT SERVICE FUND
SAN CARLOS LIBRARY BONDS DEBT SERVICE FUND – Used to accumulate the annual tax levies earmarked for payment of principal and interest on the general obligation bonds.
�'!

CITY OF SAN CARLOS
COMBINING BALANCE SHEETNONMAJOR GOVERNMENTAL FUNDSJUNE 30, 2017
CapitalProjects
Special Revenue Funds Fund
San CarlosLibrary Equipment
NPDES Police Grants Tenant Replacement
Assets:Cash and investments 315,564$ 220,910$ 1,665,665$ 3,078,080$ Receivables:
Accounts receivable - - - -
Total Assets 315,564$ 220,910$ 1,665,665$ 3,078,080$
Liabilities:Accounts payable and accrued liabilities 3,654$ -$ -$ 13,840$
Total Liabilities 3,654 - - 13,840
Deferred Inflows of Resources:Unavailable revenue - - - -
Total Deferred Inflows of Resources - - - -
Fund balances:Restricted for:
Public safety - 220,910 - - Parks and recreation - - - - Public works 311,910 - - - Debt service - - - -
Committed to:General government - - 1,665,665 - Community development - - - - Capital projects - - - 3,064,240
Total Fund Balances 311,910 220,910 1,665,665 3,064,240
Total Liabilities, Deferred Inflows ofResources and Fund Balances 315,564$ 220,910$ 1,665,665$ 3,078,080$
�'(
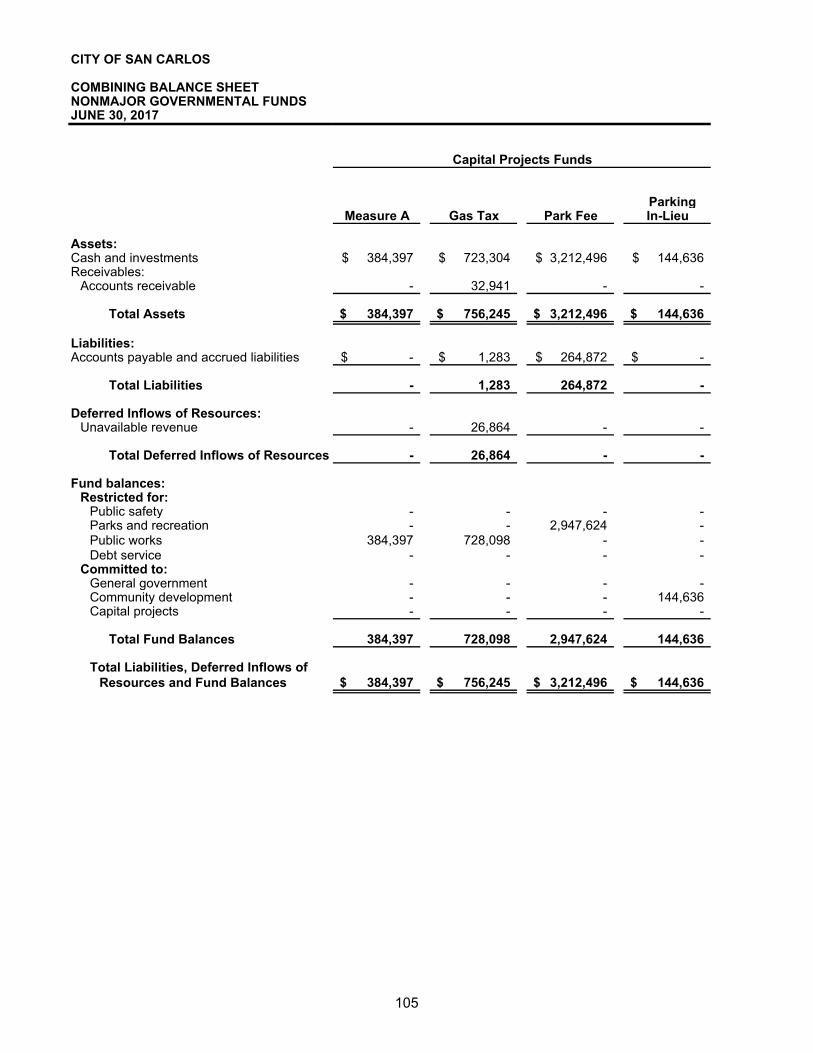
CITY OF SAN CARLOS
COMBINING BALANCE SHEETNONMAJOR GOVERNMENTAL FUNDSJUNE 30, 2017
Assets:Cash and investmentsReceivables:
Accounts receivable
Total Assets
Liabilities:Accounts payable and accrued liabilities
Total Liabilities
Deferred Inflows of Resources:Unavailable revenue
Total Deferred Inflows of Resources
Fund balances:Restricted for:
Public safetyParks and recreationPublic worksDebt service
Committed to:General governmentCommunity developmentCapital projects
Total Fund Balances
Total Liabilities, Deferred Inflows ofResources and Fund Balances
ParkingMeasure A Gas Tax Park Fee In-Lieu
384,397$ 723,304$ 3,212,496$ 144,636$
- 32,941 - -
384,397$ 756,245$ 3,212,496$ 144,636$
-$ 1,283$ 264,872$ -$
- 1,283 264,872 -
- 26,864 - -
- 26,864 - -
- - - -- - 2,947,624 -
384,397 728,098 - -- - - -
- - - -- - - 144,636 - - - -
384,397 728,098 2,947,624 144,636
384,397$ 756,245$ 3,212,496$ 144,636$
Capital Projects Funds
�'"
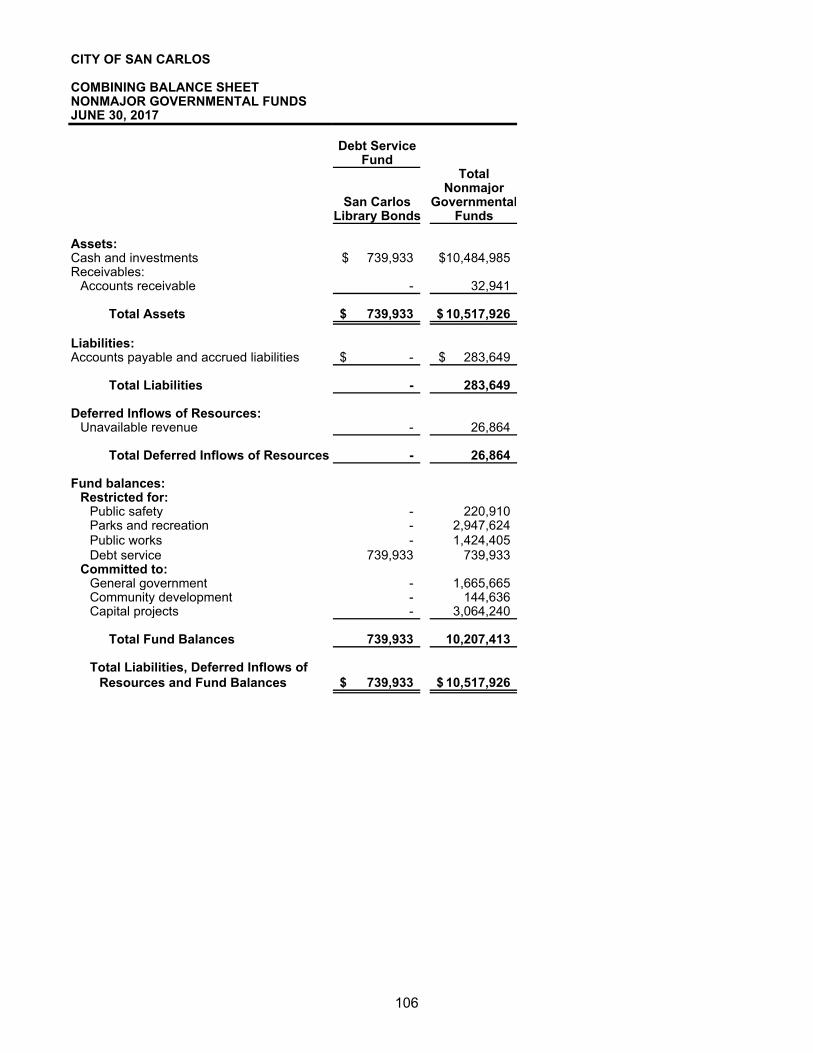
CITY OF SAN CARLOS
COMBINING BALANCE SHEETNONMAJOR GOVERNMENTAL FUNDSJUNE 30, 2017
Assets:Cash and investmentsReceivables:
Accounts receivable
Total Assets
Liabilities:Accounts payable and accrued liabilities
Total Liabilities
Deferred Inflows of Resources:Unavailable revenue
Total Deferred Inflows of Resources
Fund balances:Restricted for:
Public safetyParks and recreationPublic worksDebt service
Committed to:General governmentCommunity developmentCapital projects
Total Fund Balances
Total Liabilities, Deferred Inflows ofResources and Fund Balances
Debt ServiceFund
TotalNonmajor
San Carlos GovernmentalLibrary Bonds Funds
739,933$ 10,484,985$
- 32,941
739,933$ 10,517,926$
-$ 283,649$
- 283,649
- 26,864
- 26,864
- 220,910 - 2,947,624 - 1,424,405
739,933 739,933
- 1,665,665 - 144,636 - 3,064,240
739,933 10,207,413
739,933$ 10,517,926$
�'#

This Page Left Intentionally Blank

CITY OF SAN CARLOS
COMBINING STATEMENT OF REVENUES
NONMAJOR GOVERNMENTAL FUNDSFOR THE YEAR ENDED JUNE 30, 2017
CapitalProjects
Special Revenue Funds Funds
San CarlosLibrary Equipment
NPDES Police Grants Tenant Replacement
Revenues:Sales taxes -$ -$ -$ -$Property taxes - - - -Licenses and permits - - - -From other agencies 524,853 130,086 - -Charges for current services - - - -Use of money and property 2,357 - 242,130 -Other revenue 5,000 - - -
Total Revenues 532,210 130,086 242,130 -
Expenditures:Current:
General government - - 13,025 -Community development - - - -Public safety - 92,839 - -Public works 501,057 - - -
Capital outlay - 57,201 - 294,856 Debt service:
Principal - - - -Interest and fiscal charges - - - -
Total Expenditures 501,057 150,040 13,025 294,856
EXCESS (DEFICIENCY) OF REVENUESOVER EXPENDITURES 31,153 (19,954) 229,105 (294,856)
Other Financing Sources (Uses):Transfers in - - - 712,000 Transfers (out) - - - -
Total Other Financing Sources (Uses) - - - 712,000
Net Change in Fund Balances 31,153 (19,954) 229,105 417,144
Fund Balances, Beginning of Year 280,757 240,864 1,436,560 2,647,096
Fund Balances, End of Year $ 311,910 $ 220,910 $ 1,665,665 $ 3,064,240
EXPENDITURES AND CHANGES IN FUND BALANCES
�'%

CITY OF SAN CARLOS
COMBINING STATEMENT OF REVENUES
NONMAJOR GOVERNMENTAL FUNDSFOR THE YEAR ENDED JUNE 30, 2017
Revenues:Sales taxesProperty taxesLicenses and permitsFrom other agenciesCharges for current servicesUse of money and propertyOther revenue
Total Revenues
Expenditures:Current:
General governmentCommunity developmentPublic safetyPublic works
Capital outlayDebt service:
PrincipalInterest and fiscal charges
Total Expenditures
EXCESS (DEFICIENCY) OF REVENUESOVER EXPENDITURES
Other Financing Sources (Uses):Transfers inTransfers (out)
Total Other Financing Sources (Uses)
Net Change in Fund Balances
Fund Balances, Beginning of Year
Fund Balances, End of Year
EXPENDITURES AND CHANGES IN FUND BALANCES
Capital Projects Funds
ParkingMeasure A Gas Tax Park Fee In-Lieu
804,007$ -$ -$ -$- - - -- 16,831 - 248 - 819,674 - -- 9,600 - -
2,874 5,462 24,092 1,440 - - 932,032 107,616
806,881 851,567 956,124 109,304
- - - -- - - 3,769 - - - -
90,973 476,750 - -- 1,232,190 303,428 -
- - - -- - - -
90,973 1,708,940 303,428 3,769
715,908 (857,373) 652,696 105,535
- 625,191 550,000 -(950,000) - - -
(950,000) 625,191 550,000 -
(234,092) (232,182) 1,202,696 105,535
618,489 960,280 1,744,928 39,101
$ 384,397 $ 728,098 $ 2,947,624 $ 144,636
�'&
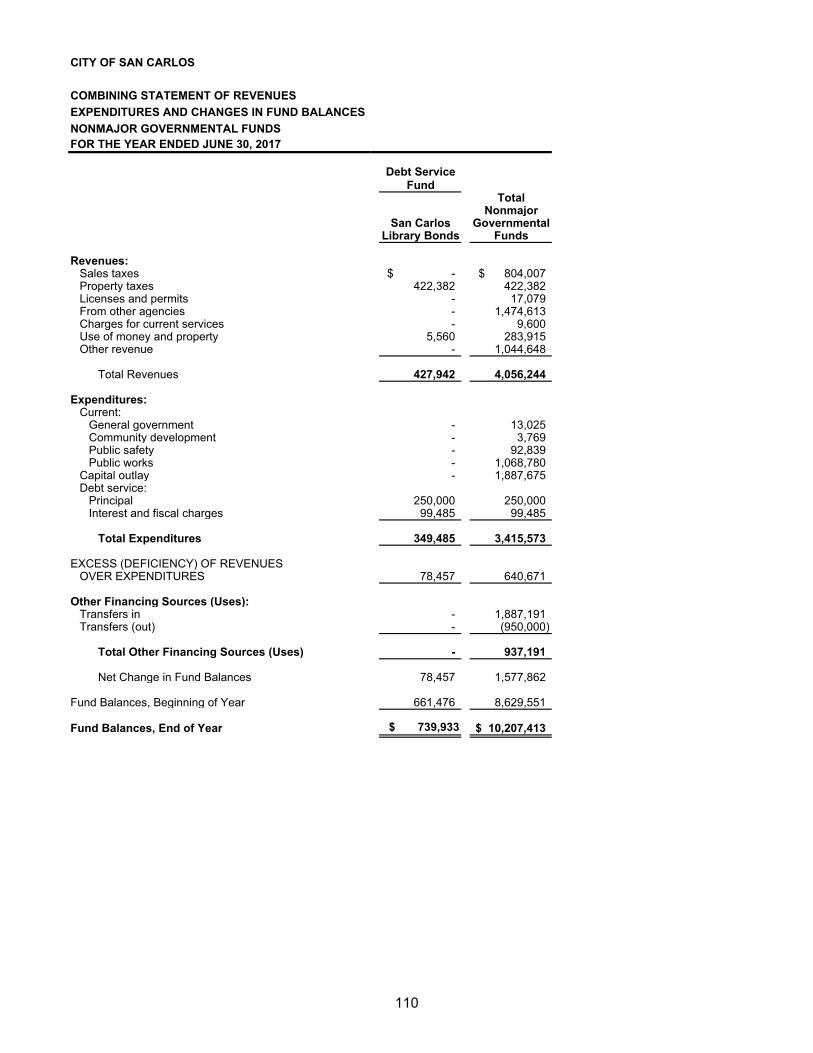
CITY OF SAN CARLOS
COMBINING STATEMENT OF REVENUES
NONMAJOR GOVERNMENTAL FUNDSFOR THE YEAR ENDED JUNE 30, 2017
Revenues:Sales taxesProperty taxesLicenses and permitsFrom other agenciesCharges for current servicesUse of money and propertyOther revenue
Total Revenues
Expenditures:Current:
General governmentCommunity developmentPublic safetyPublic works
Capital outlayDebt service:
PrincipalInterest and fiscal charges
Total Expenditures
EXCESS (DEFICIENCY) OF REVENUESOVER EXPENDITURES
Other Financing Sources (Uses):Transfers inTransfers (out)
Total Other Financing Sources (Uses)
Net Change in Fund Balances
Fund Balances, Beginning of Year
Fund Balances, End of Year
EXPENDITURES AND CHANGES IN FUND BALANCES
Debt ServiceFund
TotalNonmajor
San Carlos GovernmentalLibrary Bonds Funds
-$ 804,007$ 422,382 422,382
- 17,079 - 1,474,613 - 9,600
5,560 283,915 - 1,044,648
427,942 4,056,244
- 13,025 - 3,769 - 92,839 - 1,068,780 - 1,887,675
250,000 250,000 99,485 99,485
349,485 3,415,573
78,457 640,671
- 1,887,191 - (950,000)
- 937,191
78,457 1,577,862
661,476 8,629,551
$ 739,933 10,207,413$
��'

CITY OF SAN CARLOS
BUDGETARY COMPARISON SCHEDULENPDESFOR THE YEAR ENDED JUNE 30, 2017
Variance WithFinal Budget
PositiveOriginal Final Actual (Negative)
Revenues:From other agencies 537,600$ 537,600$ 524,853$ (12,747)$ Use of money and property - - 2,357 2,357 Other revenue 5,100 5,100 5,000 (100)
Total Revenues 542,700 542,700 532,210 (10,490)
Expenditures:Public works 535,800 535,800 501,057 34,743
Total Expenditures 535,800 535,800 501,057 34,743
Net Change in Fund Balance 6,900$ 6,900$ 31,153 24,253$
Beginning Fund Balance 280,757
Ending Fund Balance 311,910$
���

CITY OF SAN CARLOS
BUDGETARY COMPARISON SCHEDULEPOLICE GRANTSFOR THE YEAR ENDED JUNE 30, 2017
Variance WithFinal Budget
PositiveOriginal Final Actual (Negative)
Revenues:From other agencies 102,000$ 102,000$ 130,086$ 28,086$
Total Revenues 102,000 102,000 130,086 28,086
Expenditures:Public safety 90,000 90,000 92,839 (2,839) Capital outlay 60,000 60,000 57,201 2,799
Total Expenditures 150,000 150,000 150,040 (40)
Net Change in Fund Balance (48,000)$ (48,000)$ (19,954) 28,046$
Beginning Fund Balance 240,864
Ending Fund Balance 220,910$
Budget Amounts
��
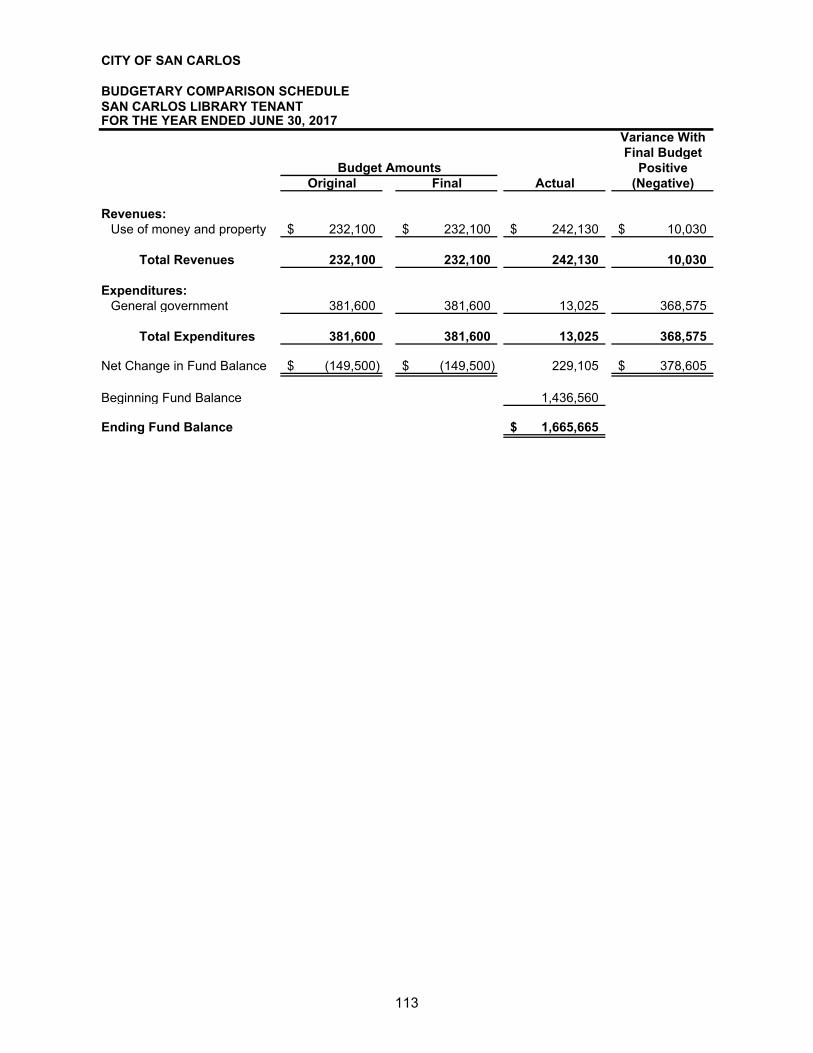
CITY OF SAN CARLOS
BUDGETARY COMPARISON SCHEDULESAN CARLOS LIBRARY TENANTFOR THE YEAR ENDED JUNE 30, 2017
Variance WithFinal Budget
PositiveOriginal Final Actual (Negative)
Revenues:Use of money and property 232,100$ 232,100$ 242,130$ 10,030$
Total Revenues 232,100 232,100 242,130 10,030
Expenditures:General government 381,600 381,600 13,025 368,575
Total Expenditures 381,600 381,600 13,025 368,575
Net Change in Fund Balance (149,500)$ (149,500)$ 229,105 378,605$
Beginning Fund Balance 1,436,560
Ending Fund Balance 1,665,665$
Budget Amounts
��!

CITY OF SAN CARLOS
BUDGETARY COMPARISON SCHEDULEEQUIPMENT REPLACEMENTFOR THE YEAR ENDED JUNE 30, 2017
Variance WithFinal Budget
PositiveOriginal Final Actual (Negative)
Expenditures:Capital outlay 965,600$ 1,450,600$ 294,856$ 1,155,744$
Total Expenditures 965,600 1,450,600 294,856 1,155,744
Excess (Deficiency) of RevenuesOver Expenditures (965,600) (1,450,600) (294,856) 1,155,744
Other Financing Sources (Uses):Transfers in 712,000 712,000 712,000 -
Net Change in Fund Balance (253,600)$ (738,600)$ 417,144 1,155,744$
Beginning Fund Balance 2,647,096
Ending Fund Balance 3,064,240$
Budget Amounts
��(

CITY OF SAN CARLOS
BUDGETARY COMPARISON SCHEDULEMEASURE AFOR THE YEAR ENDED JUNE 30, 2017
Variance WithFinal Budget
PositiveOriginal Final Actual (Negative)
Revenues:Sales taxes 728,300$ 728,300$ 804,007$ 75,707$ Use of money and property - - 2,874 2,874
Total Revenues 728,300 728,300 806,881 78,581
Expenditures:Public works 116,000 116,000 90,973 25,027
Total Expenditures 116,000 116,000 90,973 25,027
Excess (Deficiency) of RevenuesOver Expenditures 612,300 612,300 715,908 103,608
Other Financing Sources (Uses):Transfers (out) (950,000) (950,000) (950,000) -
Net Change in Fund Balance (337,700)$ (337,700)$ (234,092) 103,608$
Beginning Fund Balance 618,489
Ending Fund Balance 384,397$
Budget Amounts
��"

CITY OF SAN CARLOS
BUDGETARY COMPARISON SCHEDULEGAS TAXFOR THE YEAR ENDED JUNE 30, 2017
Variance WithFinal Budget
PositiveOriginal Final Actual (Negative)
Revenues:Licenses and permits 45,900$ 45,900$ 16,831$ (29,069)$ Charges for current servcies - - 9,600 9,600 From other agencies 987,100 987,100 819,674 (167,426) Use of money and property - - 5,462 5,462
Total Revenues 1,033,000 1,033,000 851,567 (181,433)
Expenditures:Public works 477,200 477,200 476,750 450Capital outlay 1,775,000 1,910,574 1,232,190 678,384
Total Expenditures 2,252,200 2,387,774 1,708,940 678,834
Excess (Deficiency) of RevenuesOver Expenditures (1,219,200) (1,354,774) (857,373) 497,401
Other Financing Sources (Uses):Transfers in 600,000 600,000 625,191 25,191
Net Change in Fund Balance (619,200)$ (754,774)$ (232,182) 522,592$
Beginning Fund Balance 960,280
Ending Fund Balance 728,098$
Budget Amounts
��#

CITY OF SAN CARLOS
BUDGETARY COMPARISON SCHEDULEPARK FEEFOR THE YEAR ENDED JUNE 30, 2017
Variance WithFinal Budget
PositiveOriginal Final Actual (Negative)
Revenues:Use of money and property 2,100$ 2,100$ 24,092$ 21,992$ Other revenue 869,300 269,300 932,032 662,732
Total Revenues 871,400 271,400 956,124 684,724
Expenditures:Capital outlay 1,455,000 2,005,000 303,428 1,701,572
Total Expenditures 1,455,000 2,005,000 303,428 1,701,572
Excess (Deficiency) of RevenuesOver Expenditures (583,600) (1,733,600) 652,696 2,386,296
Other Financing Sources (Uses):Transfers in - 550,000 550,000 -
Net Change in Fund Balance (583,600)$ (1,183,600)$ 1,202,696 2,386,296$
Beginning Fund Balance 1,744,928
Ending Fund Balance 2,947,624$
Budget Amounts
��$

CITY OF SAN CARLOS
BUDGETARY COMPARISON SCHEDULEPARKING IN-LIEUFOR THE YEAR ENDED JUNE 30, 2017
Variance WithFinal Budget
PositiveOriginal Final Actual (Negative)
Revenues:Licenses and permits 8,500$ 8,500$ 248$ (8,252)$ Use of money and property 400 400 1,440 1,040 Other revenue - - 107,616 107,616
Total Revenues 8,900 8,900 109,304 100,404
Expenditures:Community development 4,500 4,500 3,769 731Capital outlay 3,000 3,000 - 3,000
Total Expenditures 7,500 7,500 3,769 3,731
Net Change in Fund Balance 1,400$ 1,400$ 105,535 104,135$
Beginning Fund Balance 39,101
Ending Fund Balance 144,636$
Budget Amounts
��%

CITY OF SAN CARLOS
BUDGETARY COMPARISON SCHEDULESAN CARLOS LIBRARY BONDSFOR THE YEAR ENDED JUNE 30, 2017
Variance WithFinal Budget
PositiveOriginal Final Actual (Negative)
Revenues:Property taxes 350,400$ 350,400$ 422,382$ 71,982$ Use of money and property - - 5,560 5,560
Total Revenues 350,400 350,400 427,942 77,542
Expenditures:Principal 250,000 250,000 250,000 - Interest and fiscal charges 99,600 99,600 99,485 115
Total Expenditures 349,600 349,600 349,485 115
Net Change in Fund Balance 800$ 800$ 78,457 77,657$
Beginning Fund Balance 661,476
Ending Fund Balance 739,933$
Budget Amounts
��&

This Page Left Intentionally Blank

INTERNAL SERVICE FUNDS Internal Service Funds are used to finance and account for special activities and services performed by a designated department for other departments in the City on a cost reimbursement basis. The concept of major funds does not extend to internal service funds because they do not do business with outside parties. The Statement of Activities, the net revenues or expenses of each internal service fund, is eliminated by netting them against the operations of the other City departments, which generated them. The remaining balance sheet items are consolidated with these same funds in the Statement of Net Position. However, internal service funds are still presented separately in the Fund Financial Statements, including the funds below: WORKERS’ COMPENSATION FUND – Used to account for activities relating to Workers’ Compensation claims and the premiums for coverage. LIABILITY INSURANCE FUND – Used to account for activities relating to general liability claims against the City and premiums for coverage above the City’s risk retention level. LONGEVITY BENEFITS FUND – Used to account for activities relating to health care benefits for retired employees.
� �

CITY OF SAN CARLOS
COMBINING STATEMENTS OF NET POSITIONINTERNAL SERVICE FUNDSJUNE 30, 2017
Governmental Activities - Internal Service FundsWorkers' Liability Longevity
Compensation Insurance Benefits Total
Assets:Current:
Cash and investments 277,449$ 939,666$ 272,238$ 1,489,353$ Accounts receivable 37,612 37,612
Total Assets 277,449$ 977,278$ 272,238$ 1,526,965$
Liabilities:Accounts payable -$ 9,627$ -$ 9,627$ Claims payable:
Due within one year 97,170 250,000 - 347,170 Due in more than one year - 250,000 - 250,000
Total Liabilities 97,170 509,627 - 606,797
Net Position:Unrestricted 180,279 467,651 272,238 920,168
Total Net Position 180,279$ 467,651$ 272,238$ 920,168$
�

CITY OF SAN CARLOS
COMBINING STATEMENTS OF REVENUES, EXPENSESAND CHANGES IN NET POSITIONINTERNAL SERVICE FUNDSFOR THE YEAR ENDED JUNE 30, 2017
Governmental Activities - Internal Service FundsWorkers' Liability Longevity
Compensation Insurance Benefits Total
Operating Revenues:Charges for services 778$ -$ 869,400$ 870,178$ Cost reimbursements 53,100 901,900 - 955,000
Total Operating Revenues 53,878 901,900 869,400 1,825,178
Operating Expenses:Insurance premiums 64,559 368,144 - 432,703 Claims expense (13,316) 357,698 850,000 1,194,382 Miscellaneous 6,662 22,824 - 29,486
Total Operating Expenses 57,905 748,666 850,000 1,656,571
Operating Income (4,027) 153,234 19,400 168,607
Nonoperating Revenues:Investment income 3,110 7,029 2,062 12,201 From other agencies - 43,885 - 43,885
Total Nonoperating Revenues 3,110 50,914 2,062 56,086
Changes in Net Position (917) 204,148 21,462 224,693
Net Position:
Beginning of Year 181,196 263,503 250,776 695,475
End of Fiscal Year 180,279$ 467,651$ 272,238$ 920,168$
� !

CITY OF SAN CARLOS
INTERNAL SERVICE FUNDSCOMBINING STATEMENTS OF CASH FLOWSFOR THE YEAR ENDED JUNE 30, 2017
Governmental Activities - Internal Service FundsWorkers' Liability Longevity
Compensation Insurance Benefits Total
Cash Flows from Operating Activities:Receipts from other funds 53,878$ 897,050$ 869,400$ #########Payments to suppliers (71,671) (416,485) - (488,156) Claims paid - (321,108) (850,000) (1,171,108)
Net Cash Provided (Used) by Operating Activities (17,793) 159,457 19,400 161,064
Cash Flows from Non-CapitalFinancing Activities:From other agencies - 43,885 - 43,885
Net Cash Provided by Non-Capital Financing Activities - 43,885 - 43,885
Cash Flows from Investing Activities:Interest 3,110 7,029 2,062 12,201
Net Cash Provided (Used) by Investing Activities 3,110 7,029 2,062 12,201
Net Increase (Decrease) in Cash and Cash Equivalents (14,683) 210,371 21,462 217,150
Cash and Cash Equivalents at Beginning of Year 292,132 729,295 250,776 1,272,203
Cash and Cash Equivalents at End of Year 277,449$ 939,666$ 272,238$ #########
Reconciliation of Operating Income toNet Cash Provided (Used) by Operating Activities:Operating income (loss) (4,027)$ 153,234$ 19,400$ 168,607$
Adjustments to reconcile operating income tonet cash provided (used) by operating activities:Change in assets and liabilities:
Accounts receivable - (4,850) - (4,850) Accounts payable (450) (25,517) - (25,967) Claims payable (13,316) 36,590 - 23,274
Net Cash Provided (Used) by Operating Activities (17,793)$ 159,457$ 19,400$ 161,064$
� (

AGENCY FUNDS
Agency Funds are presented separately from the Government-wide and Fund financial statements.
Agency Funds account for assets held by the City as agent for individuals, governmental entities, and non-public organizations. These funds include the following:
ASSESSMENT DISTRICTS FUND – Used to account for the collection and payment to holders of the 1988 Special Tax Bonds.
CITY/COUNTY ASSOCIATION OF GOVERNMENTS OF SAN MATEO COUNTY (C/CAG) – Used to account for City/County Association of Governments of San Mateo County’s activities. The City acts as fiscal agent for this entity.
SOUTH BAYSIDE WASTE MANAGEMENT AUTHORITY (SBWMA) – Used to account for the South Bayside Waste Management Authority’s activities. The City acts as fiscal agent for this entity.
� "

CITY OF SAN CARLOS
COMBINING STATEMENT OF CHANGES IN ASSETS AND LIABILITIESAGENCY FUNDSFOR THE YEAR ENDED JUNE 30, 2017
Balance BalanceJune 30, 2016 Additions Deductions June 30, 2017
Assessment Districts Fund
Assets:Cash and investments 11,790$ -$ -$ $11,790
Total Assets 11,790$ -$ -$ 11,790$
Liabilities:Due to assessment district bondholders 11,790$ -$ -$ 11,790$
Total Liabilities 11,790$ -$ -$ 11,790$
City/County Association ofGovernment of San Mateo County
Assets:Cash and investments 21,546,519$ 60,524,942$ 60,094,814$ 21,976,647$ Receivables:
Accounts receivable 3,184,912 7,205,878 6,482,935 3,907,855
Total Assets 24,731,431$ 67,730,820$ 66,577,749$ 25,884,502$
Liabilities:Accounts payable 3,621,416$ 16,457,387$ 16,342,643$ 3,736,160$ Due to members 21,110,015 20,527,528 19,489,201 22,148,342
Total Liabilities 24,731,431$ 36,984,915$ 35,831,844$ $25,884,502
South Bayside Waste Management Authority
Assets:Cash and investments 16,136,138$ 249,541,083$ 250,816,058$ 14,861,163$ Cash with fiscal agent 6,320,832 4,146,228 4,102,801 6,364,259Prepaid items - 4,639 3,919 720Receivables:
Accounts receivable 4,133,293 41,424,713 40,942,672 4,615,340Interest receivable 23,018 36,178 23,018 36,178
Total Assets 26,613,281$ 295,152,841$ 295,888,468$ 25,877,660$
Liabilities:Accounts payable and accrued liabilities 6,490,459$ 53,122,707$ 55,731,079$ 3,882,096$ Interest payable 936,971 1,839,008 1,856,475 919,504Deposits payable 1,233,640 - - 1,233,640Due to members 17,952,211 83,478,800 81,588,588 19,842,420
Total Liabilities 26,613,281$ 138,440,515$ 139,176,142$ 25,877,660$
� #
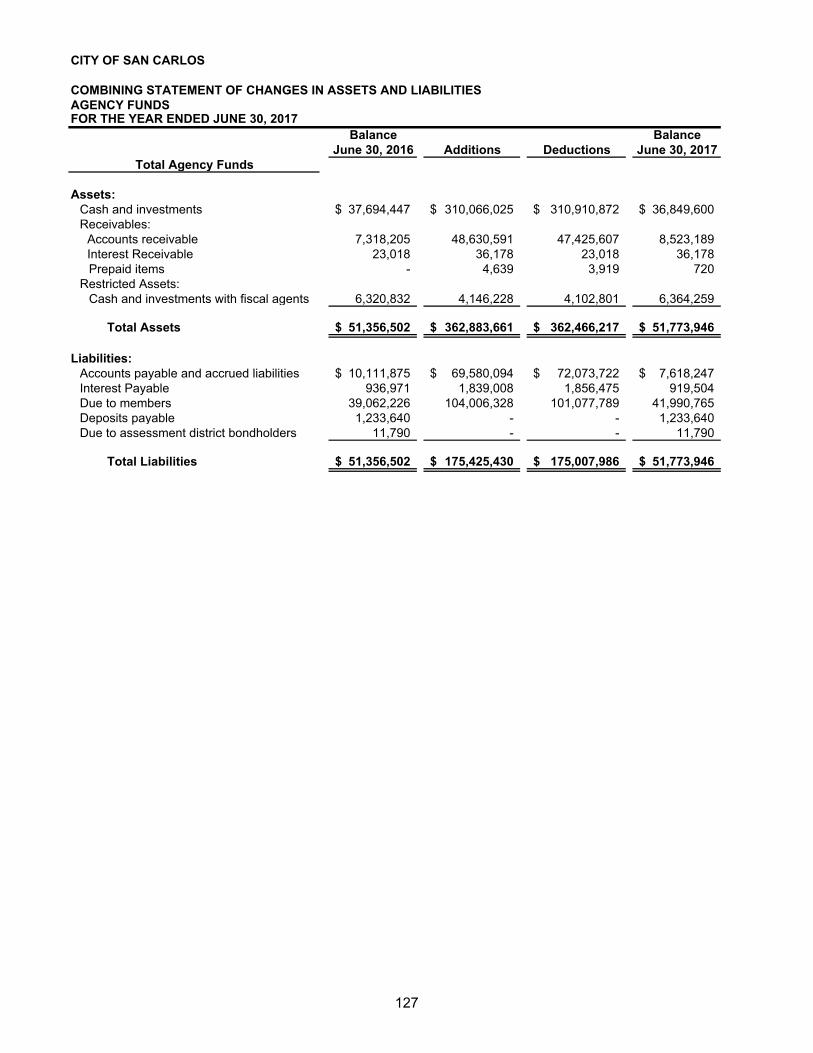
CITY OF SAN CARLOS
COMBINING STATEMENT OF CHANGES IN ASSETS AND LIABILITIESAGENCY FUNDSFOR THE YEAR ENDED JUNE 30, 2017
Balance BalanceJune 30, 2016 Additions Deductions June 30, 2017
Total Agency Funds
Assets:Cash and investments 37,694,447$ 310,066,025$ 310,910,872$ 36,849,600$ Receivables:
Accounts receivable 7,318,205 48,630,591 47,425,607 8,523,189 Interest Receivable 23,018 36,178 23,018 36,178 Prepaid items - 4,639 3,919 720
Restricted Assets:Cash and investments with fiscal agents 6,320,832 4,146,228 4,102,801 6,364,259
Total Assets 51,356,502$ 362,883,661$ 362,466,217$ 51,773,946$
Liabilities:Accounts payable and accrued liabilities 10,111,875$ 69,580,094$ 72,073,722$ 7,618,247$ Interest Payable 936,971 1,839,008 1,856,475 919,504 Due to members 39,062,226 104,006,328 101,077,789 41,990,765 Deposits payable 1,233,640 - - 1,233,640 Due to assessment district bondholders 11,790 - - 11,790
Total Liabilities 51,356,502$ 175,425,430$ 175,007,986$ 51,773,946$
� $

This Page Left Intentionally Blank

STATISTICAL SECTION
This part of the City’s Comprehensive Annual Financial Report presents detailed information as a context for understanding what the information in the financial statements, note disclosures, and required supplementary information says about the City’s overall financial health. In contrast to the financial section, the statistical section information is not subject to independent audit.
Financial Trends These schedules contain trend information to help the reader understand how the City’s financial performance and well-being have changed over time:
1. Net Position by Component2. Changes in Net Position3. Fund Balances of Governmental Funds4. Changes in Fund Balance of Governmental Funds
Revenue Capacity These schedules contain information to help the reader assess the City’s most significant local revenue source, the property tax:
1. Assessed and Estimated Actual Value of Taxable Property2. Direct and Overlapping Property Tax Rates3. Top Ten Property Tax Payers4. Property Tax Levies and Collections
Debt Capacity These schedules present information to help the reader assess the affordability of the City’s current levels of outstanding debt and the City’s ability to issue additional debt in the future:
1. Ratio of Outstanding Debt by Type2. Ratio of General Bonded Debt Outstanding3. Pledged-Revenue Coverage4. Computation of Direct and Overlapping Debt5. Computation of Legal Bonded Debt Margin
Demographic and Economic Information These schedules offer demographic and economic indicators to help the reader understand the environment within which the City’s financial activities take place:
1. Demographic and Economic Statistics2. Principal Employers3. Full Time Equivalent City Employees by Function
Operating Information These schedules contain service and infrastructure data to help the reader understand how the information in the City’s financial report relates to the services the City provides and the activities it performs:
1. Operating Indicators by Function/Program2. Capital Asset Statistics by Function/Program
Sources Unless otherwise noted, the information in these schedules is derived from the Comprehensive Annual Financial Reports for the relevant year.
� &

CITY OF SAN CARLOSNet Position by ComponentLast Ten Fiscal Years(accrual basis of accounting)
2008 2009 2010 2011Governmental activities
Net investment in capital assets 98,247,695$ 107,041,257$ 101,975,928$ 113,903,786$ Restricted 22,849,602 23,426,300 23,500,466 12,143,894 Unrestricted 18,741,036 12,724,651 19,737,818 26,256,514
Total governmental activities net position 139,838,333$ 143,192,208$ 145,214,212$ 152,304,194$
Business-type activitiesNet investment in capital assets 10,667,232$ 11,097,233$ 11,528,037$ 12,133,706$ Unrestricted 3,064,709 3,985,755 4,591,798 5,117,936
Total business-type activities net position 13,731,941$ 15,082,988$ 16,119,835$ 17,251,642$
Primary governmentNet investment in capital assets 108,914,927$ 118,138,490$ 113,503,965$ 126,037,492$ Restricted 22,849,602 23,426,300 23,500,466 12,143,894 Unrestricted 21,805,745 16,710,406 24,329,616 31,374,450
Total primary government net position 153,570,274$ 158,275,196$ 161,334,047$ 169,555,836$
�$�
�$50,000
�$100,000
�$150,000
�$200,000
�$250,000
2008200920102011201220132014201520162017
Thou
sand
s
Unrestricted Restricted Net�Investment�in�Capital�Assets
�!'

2012 2013 2014 2015 2016 2017
119,426,713$ 119,171,599$ 124,467,083$ 132,736,463$ 140,578,718$ 139,749,356$ 7,322,914 8,871,235 9,859,896 12,904,615 13,634,148 14,913,451
34,473,081 39,942,056 42,689,655 14,374,721 14,261,604 19,429,741 161,222,708$ 167,984,890$ 177,016,634$ 160,015,799$ 168,474,470$ 174,092,548$
12,798,962$ 13,337,359$ 14,840,080$ 14,855,225$ 21,838,351$ 27,740,303$ 6,210,876 7,556,596 19,028,996 19,212,357 13,613,839 14,360,124
19,009,838$ 20,893,955$ 33,869,076$ 34,067,582$ 35,452,190$ 42,100,427$
132,225,675$ 132,508,958$ 139,307,163$ 147,591,688$ 162,417,069$ 167,489,659$ 7,322,914 8,871,235 9,859,896 12,904,615 13,634,148 14,913,451
40,683,957 47,498,652 61,718,651 33,587,078 27,875,443 33,789,865 180,232,546$ 188,878,845$ 210,885,710$ 194,083,381$ 203,926,660$ 216,192,975$
�!�
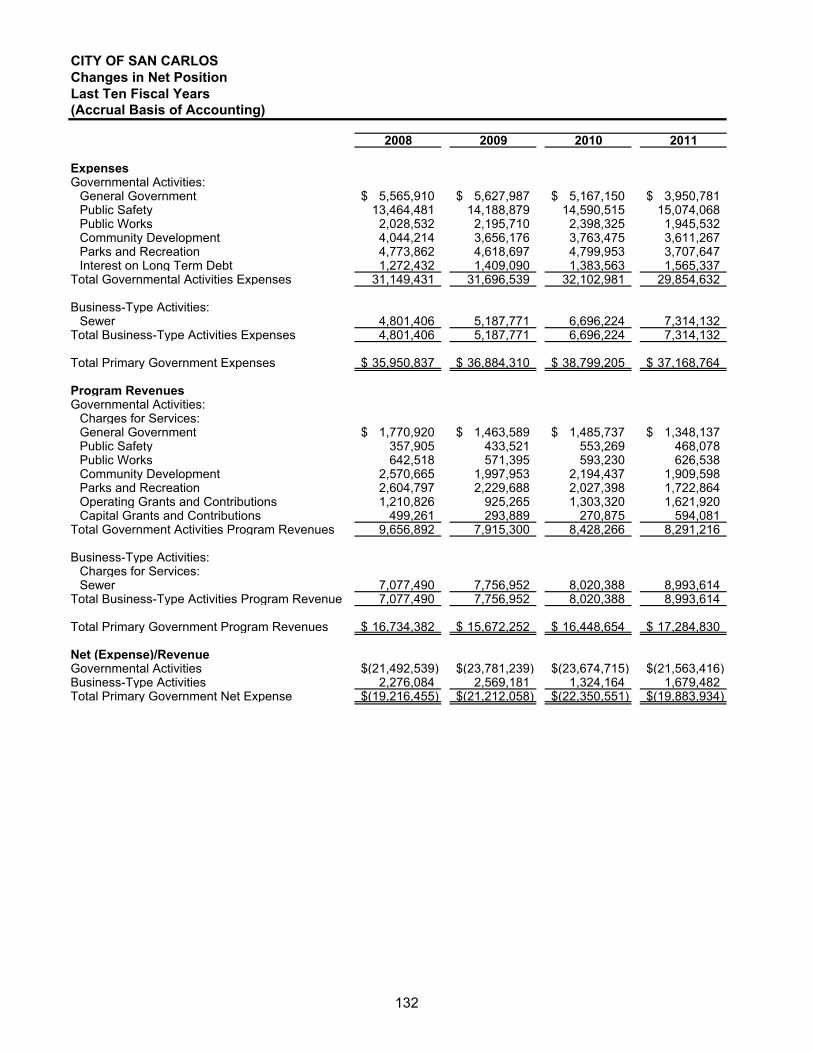
CITY OF SAN CARLOSChanges in Net PositionLast Ten Fiscal Years(Accrual Basis of Accounting)
2008 2009 2010 2011
ExpensesGovernmental Activities:
General Government 5,565,910$ 5,627,987$ 5,167,150$ 3,950,781$ Public Safety 13,464,481 14,188,879 14,590,515 15,074,068 Public Works 2,028,532 2,195,710 2,398,325 1,945,532 Community Development 4,044,214 3,656,176 3,763,475 3,611,267 Parks and Recreation 4,773,862 4,618,697 4,799,953 3,707,647 Interest on Long Term Debt 1,272,432 1,409,090 1,383,563 1,565,337
Total Governmental Activities Expenses 31,149,431 31,696,539 32,102,981 29,854,632
Business-Type Activities:Sewer 4,801,406 5,187,771 6,696,224 7,314,132
Total Business-Type Activities Expenses 4,801,406 5,187,771 6,696,224 7,314,132
Total Primary Government Expenses 35,950,837$ 36,884,310$ 38,799,205$ 37,168,764$
Program RevenuesGovernmental Activities:
Charges for Services:General Government 1,770,920$ 1,463,589$ 1,485,737$ 1,348,137$ Public Safety 357,905 433,521 553,269 468,078 Public Works 642,518 571,395 593,230 626,538 Community Development 2,570,665 1,997,953 2,194,437 1,909,598 Parks and Recreation 2,604,797 2,229,688 2,027,398 1,722,864 Operating Grants and Contributions 1,210,826 925,265 1,303,320 1,621,920 Capital Grants and Contributions 499,261 293,889 270,875 594,081
Total Government Activities Program Revenues 9,656,892 7,915,300 8,428,266 8,291,216
Business-Type Activities:Charges for Services:Sewer 7,077,490 7,756,952 8,020,388 8,993,614
Total Business-Type Activities Program Revenue 7,077,490 7,756,952 8,020,388 8,993,614
Total Primary Government Program Revenues 16,734,382$ 15,672,252$ 16,448,654$ 17,284,830$
Net (Expense)/RevenueGovernmental Activities (21,492,539)$ (23,781,239)$ (23,674,715)$ (21,563,416)$Business-Type Activities 2,276,084 2,569,181 1,324,164 1,679,482 Total Primary Government Net Expense (19,216,455)$ (21,212,058)$ (22,350,551)$ (19,883,934)$
�!

2012 2013 2014 2015 2016 2017
5,663,863$ 6,475,824$ 5,321,121$ 5,189,609$ 6,017,538$ 6,329,346$ 13,449,771 14,574,275 15,592,529 16,069,651 17,430,558 18,375,585
2,493,488 2,687,707 8,255,888 9,167,760 8,266,278 7,978,435 4,081,250 2,766,720 2,991,374 3,272,803 4,096,699 4,700,675 4,018,025 4,117,692 3,043,648 3,203,949 2,367,444 3,858,835
608,784 264,260 276,859 334,808 268,810 81,837 30,315,181 30,886,478 35,481,419 37,238,580 38,447,327 41,324,713
7,887,064 7,874,008 8,320,370 11,882,000 14,067,910 9,663,209 7,887,064 7,874,008 8,320,370 11,882,000 14,067,910 9,663,209
38,202,245$ 38,760,486$ 43,801,789$ 49,120,580$ 52,515,237$ 50,987,922$
1,027,189$ 1,074,928$ 1,071,289$ 1,749,186$ 1,258,805$ 1,297,282$ 515,745 505,948 527,366 560,303 518,876 618,102
2,230,306 597,220 1,201,650 769,083 2,222,932 1,502,215 2,125,361 2,017,110 2,625,860 3,227,818 4,359,416 3,618,051 1,951,859 2,122,207 2,206,374 1,710,865 1,499,342 1,630,102 1,257,912 1,591,002 1,942,020 1,718,123 1,717,004 2,093,580 1,054,103 1,070,551 4,907,492 4,882,958 4,295,854 2,416,816
10,162,475 8,978,966 14,482,051 14,618,336 15,872,229 13,176,148
10,195,074 10,222,616 12,685,252 15,335,342 16,798,299 16,793,613 10,195,074 10,222,616 12,685,252 15,335,342 16,798,299 16,793,613
20,357,549$ 19,201,582$ 27,167,303$ 29,953,678$ 32,670,528$ 29,969,761$
(20,152,706)$ (21,907,512)$ (20,999,368)$ (22,620,244)$ (22,575,098)$ (28,148,565)$ 2,308,010 2,348,608 4,364,882 3,453,342 2,730,389 7,130,404
(17,844,696)$ (19,558,904)$ (16,634,486)$ (19,166,902)$ (19,844,709)$ (21,018,161)$
�!!

CITY OF SAN CARLOSChanges in Net Position(continued)Last Ten Fiscal Years(Accrual Basis of Accounting)
2008 2009 2010 2011
General Revenues and Other Changes in Net Position
Governmental Activities:Taxes:Property Taxes 13,878,227$ 14,247,207$ 12,785,913$ 14,414,923$ Sales Taxes 5,503,729 5,669,333 5,697,574 5,752,468 Motor Vehicle In-Lieu 2,105,682 2,176,235 2,230,997 2,315,671 Transient Occupancy Tax 825,070 750,175 682,750 815,197 Nonregulatory Franchise and Business 2,357,789 2,520,723 2,663,713 2,916,896 Use of money and property 1,624,497 300,513 782,328 1,190,048 Loss on sale of capital assets - - - -Other 1,337,838 287,928 313,444 853,307 Transfers 1,139,799 1,183,000 540,000 584,600 Extraordinary gain/(loss) on dissolution of RDA - - - -
Total Government Activities 28,772,631 27,135,114 25,696,719 28,843,110
Business-Type Activities:Use of money and property 89,239 (35,134) 38,243 36,925 Miscellaneous Revenues - - 214,440 -Transfers (1,139,799) (1,183,000) (540,000) (584,600)
Total Business-Type Activities (1,050,560) (1,218,134) (287,317) (547,675)
Total Primary Government 27,722,071$ 25,916,980$ 25,409,402$ 28,295,435$
Change in Net PositionGovernmental Activities 7,280,092$ 3,353,875$ 2,022,004$ 7,279,694$ Business-Type Activities 1,225,524 1,351,047 1,036,847 1,131,807 Total Primary Government 8,505,616$ 4,704,922$ 3,058,851$ 8,411,501$
�!(

2012 2013 2014 2015 2016 2017
12,615,467$ 11,231,717$ 12,907,307$ 11,295,391$ 12,117,407$ 12,867,544$ 5,870,214 6,427,400 7,287,136 9,882,460 10,708,021 11,574,662 2,205,159 2,155,983 2,438,078 2,515,600 2,744,676 2,933,877
943,513 1,120,864 1,270,072 1,396,732 1,578,740 1,570,815 3,000,857 3,240,864 3,351,838 3,437,742 3,552,639 3,792,976 1,443,720 1,552,992 1,918,054 2,330,545 3,147,860 2,271,719
- - - - - (2,686,318) 818,682 2,429,847 686,427 708,552 1,284,689 867,468 595,000 510,000 172,200 591,000 562,600 573,900
2,184,427 - - 2,172,017 - - 29,677,039 28,669,667 30,031,112 34,330,039 35,696,632 33,766,643
45,186 45,509 91,110 77,276 109,244 91,733 - - 32,358 26,973 - -
(595,000) (510,000) (172,200) (591,000) (562,600) (573,900) (549,814) (464,491) (48,732) (486,751) (453,356) (482,167)
29,127,225$ 28,205,176$ 29,982,380$ 33,843,288$ 35,243,276$ 33,284,476$
9,524,333$ 6,762,155$ 9,031,744$ 11,709,795$ 13,121,534$ 5,618,078$ 1,758,196 1,884,117 4,316,150 2,966,591 2,277,033 6,648,237
11,282,529$ 8,646,272$ 13,347,894$ 14,676,386$ 15,398,567$ 12,266,315$
�!"

CITY OF SAN CARLOSFund Balances of Governmental FundsLast Ten Fiscal Years(Modified Accrual Basis of Accounting)
2008 2009 2010 2011 2012 2013 2014
General FundReserved 1,607,405$ 1,433,666$ 2,556,020$ -$ -$ -$ -$Unreserved 7,339,240 8,455,536 9,207,477 - - - -Nonspendable - - - 712,160 713,300 1,062,700 15,130,823 Restricted - - - - - 42,000 -Committed - - - 2,706,600 6,853,165 7,151,565 3,200,000 Assigned - - - 2,728,704 9,175,000 9,700,000 12,901,565 Unassigned - - - 10,694,918 3,002,379 3,052,124 3,040,483
Total General Fund 8,946,645$ 9,889,202$ 11,763,497$ 16,842,382$ 19,743,844$ 21,008,389$ 34,272,871$
All Other Governmental FundsReserved 7,950,925$ 4,725,179$ 4,093,846$ -$ -$ -$ -$Unreserved, reported in: Special revenue funds 986,318 1,038,590 1,228,197 - - - - Capital project funds 19,391,338 22,213,798 23,313,352 - - - -Nonspendable - - - 1,587,305 1,585,662 2,538,601 -Restricted - - - 10,556,589 5,737,252 6,290,634 9,859,896 Committed - - - 5,760,066 9,652,778 14,369,247 12,377,737 Assigned - - - 5,578,686 - - -Unassigned - - - (22,835) (22,610) - -
Total all other governmental funds 28,328,581$ 27,977,567$ 28,635,395$ 23,459,811$ 16,953,082$ 23,198,482$ 22,237,633$
(a) The City implemented Governmental Accounting Standards Board Statement Number 54 in fiscal year 2011.
$0
$10,000
$20,000
$30,000
$40,000
$50,000
$60,000
$70,000
2008 2009 2010 2011 2012 2013 2014 2015 2016 2017
Thousands
Reserved Unreserved Nonspendable Restricted Committed Assigned Unassigned
�!#

2015 2016 2017
-$ -$ -$ - - -
14,422,062 348,263 380,712 - - -
3,300,000 11,291,795 12,131,795 13,683,365 14,000,000 16,841,500 3,386,603 3,971,159 2,698,673
34,792,030$ 29,611,217$ 32,052,680$ (a)
-$ -$ -$
- - - - - - - - -
12,904,615 13,634,148 14,913,451 15,968,926 16,433,787 21,406,130
- - - - - -
28,873,541$ 30,067,935$ 36,319,581$
�!$
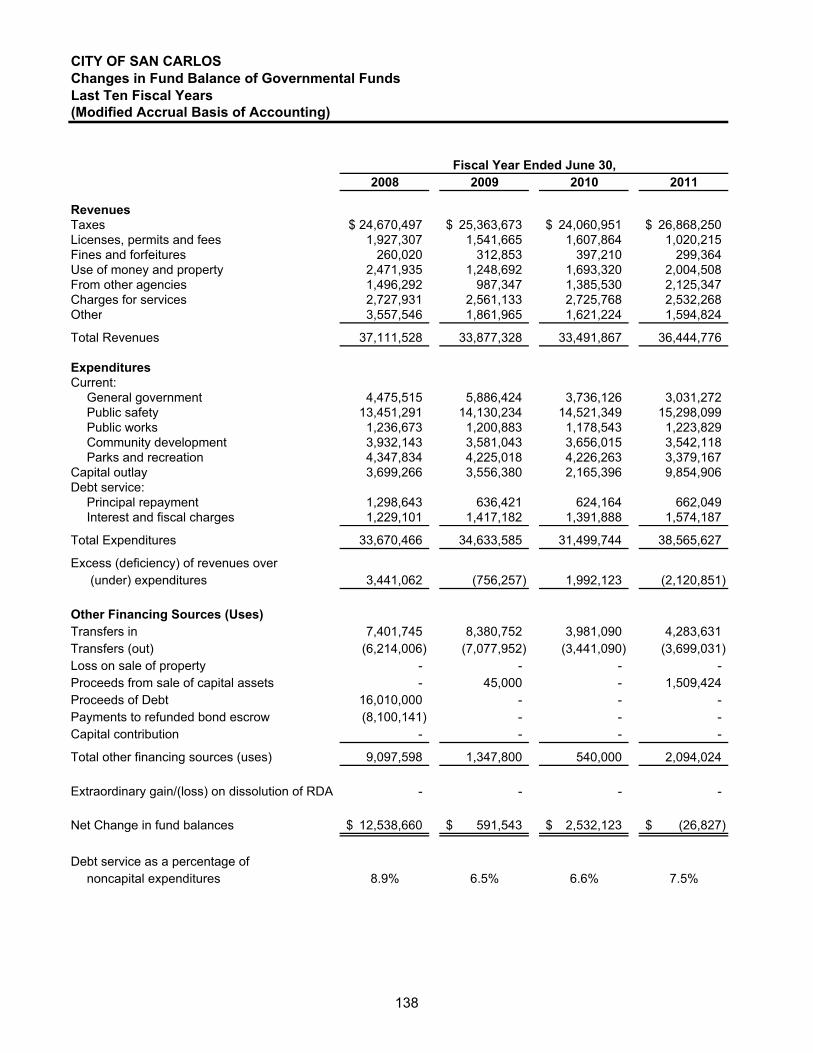
Fiscal Year Ended June 30,2008 2009 2010 2011
RevenuesTaxes 24,670,497$ 25,363,673$ 24,060,951$ 26,868,250$ Licenses, permits and fees 1,927,307 1,541,665 1,607,864 1,020,215 Fines and forfeitures 260,020 312,853 397,210 299,364 Use of money and property 2,471,935 1,248,692 1,693,320 2,004,508 From other agencies 1,496,292 987,347 1,385,530 2,125,347 Charges for services 2,727,931 2,561,133 2,725,768 2,532,268 Other 3,557,546 1,861,965 1,621,224 1,594,824
Total Revenues 37,111,528 33,877,328 33,491,867 36,444,776
ExpendituresCurrent:
General government 4,475,515 5,886,424 3,736,126 3,031,272 Public safety 13,451,291 14,130,234 14,521,349 15,298,099 Public works 1,236,673 1,200,883 1,178,543 1,223,829 Community development 3,932,143 3,581,043 3,656,015 3,542,118 Parks and recreation 4,347,834 4,225,018 4,226,263 3,379,167
Capital outlay 3,699,266 3,556,380 2,165,396 9,854,906 Debt service:
Principal repayment 1,298,643 636,421 624,164 662,049 Interest and fiscal charges 1,229,101 1,417,182 1,391,888 1,574,187
Total Expenditures 33,670,466 34,633,585 31,499,744 38,565,627
Excess (deficiency) of revenues over (under) expenditures 3,441,062 (756,257) 1,992,123 (2,120,851)
Other Financing Sources (Uses)Transfers in 7,401,745 8,380,752 3,981,090 4,283,631 Transfers (out) (6,214,006) (7,077,952) (3,441,090) (3,699,031) Loss on sale of property - - - - Proceeds from sale of capital assets - 45,000 - 1,509,424 Proceeds of Debt 16,010,000 - - - Payments to refunded bond escrow (8,100,141) - - - Capital contribution - - - -
Total other financing sources (uses) 9,097,598 1,347,800 540,000 2,094,024
Extraordinary gain/(loss) on dissolution of RDA - - - -
Net Change in fund balances 12,538,660$ 591,543$ 2,532,123$ (26,827)$
Debt service as a percentage ofnoncapital expenditures 8.9% 6.5% 6.6% 7.5%
CITY OF SAN CARLOSChanges in Fund Balance of Governmental FundsLast Ten Fiscal Years(Modified Accrual Basis of Accounting)
�!%

2012 2013 2014 2015 2016 2017
25,282,782$ 24,176,828$ 27,254,431$ 28,527,925$ 30,701,483$ 32,739,874$ 3,198,769 2,024,279 2,271,457 2,465,157 4,534,737 3,511,276
265,091 234,218 219,944 265,288 234,697 255,632 1,864,401 1,805,466 2,176,508 6,124,308 3,143,760 2,195,096 2,048,990 1,824,567 4,119,086 4,218,621 4,360,957 2,753,794 2,557,464 2,912,353 3,389,107 3,785,239 4,253,198 3,952,620 1,674,507 3,878,322 2,886,134 4,439,450 4,236,064 3,613,927
36,892,004 36,856,033 42,316,667 49,825,988 51,464,896 49,022,219
4,555,802 4,165,249 4,715,318 4,824,314 4,988,340 4,840,215 13,119,914 14,410,769 15,360,993 15,993,240 17,340,123 17,827,665
1,673,870 1,641,955 6,779,012 4,121,793 4,612,132 8,930,843 3,932,661 2,666,132 2,870,822 3,104,920 4,134,764 4,250,662 3,438,598 3,597,600 2,574,917 2,590,068 2,775,229 2,816,465 2,465,296 2,841,083 7,691,263 10,596,619 12,271,896 1,887,675
700,264 265,000 285,000 6,405,000 9,210,000 250,000 843,435 268,300 258,604 400,240 300,908 99,485
30,729,840 29,856,088 40,535,929 48,036,194 55,633,392 40,903,010
6,162,164 6,999,945 1,780,738 1,789,794 (4,168,496) 8,119,209
2,938,040 4,303,415 1,645,165 6,441,141 4,815,399 5,846,109 (2,293,040) (3,793,415) (1,472,965) (5,850,141) (4,252,799) (5,272,209)
- - - - (380,523) - - - - - - - - - 8,800,000 4,774,273 - - - - - - - - - - 1,550,695 - - -
645,000 510,000 10,522,895 5,365,273 182,077 573,900
(10,412,431) - - - - -
(3,605,267)$ 7,509,945$ 12,303,633$ 7,155,067$ (3,986,419)$ 8,693,109$
5.3% 1.9% 1.7% 16.3% 20.7% 1.0%
Fiscal Year Ended June 30,
�!&

CITY OF SAN CARLOSASSESSED AND ESTIMATED ACTUAL VALUE OF TAXABLE PROPERTYLAST TEN FISCAL YEARS
Real Property Total Real TotalFiscal Residential Commercial Industrial Secured Unsecured Total Estimated DirectYear Property Property Property Other Property Property Assessed (a) Full Market (a) Tax Rate (b)
2008 4,907,682,878$ 480,488,543$ 480,178,708$ 56,711,565$ 5,925,061,694$ 337,894,181$ 6,262,955,875$ 6,262,955,875$ 0.19223%2009 5,237,194,752 530,328,970 493,030,102 58,254,703 6,318,808,527 329,100,047 6,647,908,574 6,647,908,574 0.19262%2010 5,385,051,647 537,954,158 510,871,559 49,573,684 6,483,451,048 299,137,744 6,782,588,792 6,782,588,792 0.19582%2011 5,438,326,043 532,479,578 524,446,802 50,382,008 6,545,634,431 289,541,082 6,835,175,513 6,835,175,513 0.19600%2012 5,532,457,020 530,784,713 530,206,176 57,106,808 6,650,554,717 280,928,376 6,931,483,093 6,931,483,093 0.19481%2013 5,717,858,710 516,269,311 559,907,761 69,214,632 6,863,250,414 269,345,842 7,132,596,256 7,132,596,256 0.19504%2014 6,120,011,894 541,914,403 556,804,162 59,050,682 7,277,781,141 401,155,969 7,678,937,110 7,678,937,110 0.11685%2015 6,489,784,870 561,595,333 563,659,154 50,870,561 7,665,909,918 299,060,205 7,964,970,123 7,964,970,123 0.11840%2016 6,979,211,977 665,733,132 598,644,941 63,226,293 8,306,816,343 370,528,439 8,677,344,782 8,677,344,782 0.11424%2017 7,420,946,280 770,190,805 636,526,534 67,885,633 8,895,549,252 381,768,262 9,277,317,514 9,277,317,514 0.11379%
Source: San Mateo County Assessor 2007/08 - 2016/17 Combined Tax Rolls
(a) The State Constitution requires property to be assessed at one hundred percent of the mostrecent purchase price, plus an increment of no more than two percent annually, plus anylocal over-rides. These values are considered to be full market values.
(b) California cities do not set their own direct tax rate. The state constitution establishes the rate at 1% and allocates a portion of that amount, by an annual calculation, to all the taxing entities within a tax rate area.
0
1000
2000
3000
4000
5000
6000
7000
8000
9000
10000
2008 2009 2010 2011 2012 2013 2014 2015 2016 2017
Mill
ions
Unsecured Secured
�('

CITY OF SAN CARLOSDIRECT AND OVERLAPPING PROPERTY TAX RATES(RATE PER $100 OF TAXABLE VALUE)LAST TEN FISCAL YEARS
Basic City's share . Belmont Mid Total DirectCounty of 1% Levy San Mateo San Carlos Sequoia Redwood City Penninsula Overlapping Total*
Fiscal Wide Per Public Junior College Elementary High School Redwood Shore Open Tax DirectYear Levy Prop 13 Library District Bonds Bond Elementary Space Rate Rate
2008 1.0000 0.13273 0.0092 0.0171 0.0520 0.0205 0.0612 - 1.1600 0.192232009 1.0000 0.13273 0.0089 0.0165 0.0517 0.0282 0.0601 - 1.1654 0.192622010 1.0000 0.13273 0.0088 0.0182 0.0531 0.0277 0.0568 - 1.1646 0.195822011 1.0000 0.13273 0.0089 0.0193 0.0528 0.0311 0.0598 - 1.1719 0.196002012 1.0000 0.13273 0.0089 0.0199 0.0535 0.0358 0.0971 - 1.2152 0.194812013 1.0000 0.13273 0.0088 0.0194 0.0528 0.0356 0.0981 - 1.2147 0.195042014 1.0000 0.13273 0.0084 0.0194 0.0775 0.0313 0.0945 - 1.2311 0.116852015 1.0000 0.13273 0.0082 0.0190 0.0768 0.0433 0.0923 - 1.2396 0.118402016 1.0000 0.13273 0.0042 0.0250 0.0725 0.0434 0.1005 0.0008 1.2464 0.114242017 1.0000 0.13273 0.0040 0.0247 0.0646 0.0391 0.1198 0.0006 1.2528 0.11379
.City's share of 1% Levy is based on the City's share of the general fund tax rate area with the largest net taxable value within the city.*Total Direct Rate is the weighted average of all individual direct rates applied by the government preparing the statistical section information
Data Source: San Mateo County Assessor 2007/08 - 2016/17 Tax Rate Table
City Direct Rates Overlapping Rates
0.00
0.20
0.40
0.60
0.80
1.00
1.20
1.40
2008 2009 2010 2011 2012 2013 2014 2015 2016 2017
Basic County Wide Levy Public Library
San Mateo Junior College District San Carlos Elementary Bonds
Sequoia High School Bond Belmont Redwood City Redwood Shore Elementary
Mid Penninsula Open Space
�(�

CITY OF SAN CARLOSTOP TEN PROPERTY TAX PAYERSCURRENT YEAR AND TEN YEARS AGO
2007-2008Percentage Percentageof Total City of Total City
Assessed Assessed Assessed AssessedTaxpayer Value Rank Value Value Rank Value
Hudson Skyway Landing LLC 106,017,480$ 1 1.14%GC Net Lease San Carlos Investors LLC 84,736,766 2 0.91%Novartis Pharmaceuticals 77,886,931 3 0.84%BMR-201 Industrial RD LLC 39,771,625 4 0.43% 39,138,190$ 4 0.62%Black Mountain Holdings LLC 39,570,571 5 0.43%Premia Shoreway Owner LLC 38,500,000 6 0.41%L-3 Communications Corp 35,554,413 7 0.38% 33,867,560 5 0.54%SB US LLC 27,617,325 8 0.30%Kelly Moore Paint Company Inc 26,787,238 9 0.29% 26,690,599 6 0.43%Are-San Francisco No. 63 LLC 25,707,113 10 0.28%Nektar Therapeutics 87,960,265 1 1.40%SPK-Skyway Landing LLC 68,602,401 2 1.10%Circle Star Center Associates LP 53,300,000 3 0.85%301 Industrial LLC 23,750,500 7 0.38%Brittan Corners Shopping Center LLC 22,278,379 8 0.36%ECI San Carlos LLC 17,850,000 9 0.29%S. Stephen Makashima Trust 16,634,219 10 0.27% Subtotal $502,149,462 5.41% $390,072,113 6.23%
Total Net Assessed Valuation:Fiscal Year 2016-2017 $9,277,317,514Fiscal Year 2007-2008 $6,262,955,875
Source: San Mateo County Assessor 2016/17 Combined Tax Rolls.Top Property Tax Payers Based on Net Values
2016-2017
�(

CITY OF SAN CARLOSPROPERTY TAX LEVIES AND COLLECTIONSLAST TEN FISCAL YEARS
Percentof Total
Current Percent Delinquent Total TaxFiscal Total Tax of Levy Tax Tax CollectionsYear Tax Levy (a) Collections( b) Collected Collections (c) Collections to Tax Levy
2008 11,389,746$ 11,234,055$ 98.63% N/A 11,234,055$ 98.63%2009 12,171,289 11,641,072 95.64% N/A 11,641,072 95.64%2010 12,695,894 12,124,097 95.50% N/A 12,124,097 95.50%2011 12,829,443 12,155,993 94.75% N/A 12,155,993 94.75%2012 12,955,911 11,398,356 87.98% N/A 11,398,356 87.98%2013 8,138,448 8,027,011 98.63% N/A 8,027,011 98.63%2014 8,879,658 8,757,878 98.63% N/A 8,757,878 98.63%2015 9,229,066 9,208,905 99.78% N/A 9,208,905 99.78%2016 9,744,532 9,693,047 99.47% N/A 9,693,047 99.47%2017 10,273,217 10,231,703 99.60% N/A 10,231,703 99.60%
Source: San Mateo County Assessor 2007/08 - 2016/17 Combined Tax Rolls 2015/16 County of San Mateo Estimated property tax revenue
Note: Current tax collections beginning in 1993 have been reduced by a mandatory tax reallocation imposed by the State of California
a) Prior to the dissolution of the Redevelopment Agency in FY 2012; the data in this table included the general fundproperty taxes, debt service tax, and the Redevelopment Agency tax increments. Beginning FY 2013, the amountspresented are the securedand unsecured estimated property tax revenue provided by the County at the beginningof the fiscal year. The tax levyis subject to adjustment for all increases, decreases and refunds processedthroughout the fiscal year.
b) Prior to the dissolution of the Redevelopment Agency in FY 2012; the data in this table included the basic andsupplemental property taxes, debt service tax and the Redevelopment Agency tax increments. Beginning FY 2013,the amounts presented include only the City's general secured and unsecured property taxes collections. The taxcollection is subject to adjustmentfor all increases, decreases and refunds processed throughout the fiscal year.
c) Beginning fiscal year 1995, the County entered a "Teeter Plan" agreement with the City which allows the City tokeep 100% of the secured taxes, and the County to keep all interest and delinquency charges collected.Delinquent tax collection data is not available.
�$�
�$2
�$4
�$6
�$8
�$10
�$12
�$14
2008 2009 2010 2011 2012 2013 2014 2015 2016 2017
Mill
ions
Total�Tax�Levy�(a) Total�Tax�Collections
�(!

CITY OF SAN CARLOSRATIO OF OUTSTANDING DEBT BY TYPELAST TEN FISCAL YEARS
2015General Installment * California R. Berghella * RDA* ABAG Refunding 2008 ** 2009** Total Percentage
Fiscal Obligation Bonds Purchase Energy Trust Revenue Lease General Financing Financing Primary of Personal PerYear Public Library Agreement Commission Agreement Bonds Agreement Obligation Bonds Agreement Agreement Government Income (a) Capita
2008 7,820,000$ 2,800,000$ 263,415$ 679,432$ 16,010,000$ -$ -$ -$ -$ 27,572,847$ 1.46% 966.04$ 2009 7,630,000 2,800,000 200,475 671,009 15,635,000 - - 1,510,000 - 28,446,484 1.55% 986.732010 7,425,000 2,800,000 135,627 661,683 15,290,000 - - 1,510,000 8,450,000 36,272,310 2.38% 1,276.922011 7,200,000 2,800,000 68,822 651,439 14,930,000 - - 1,460,000 8,330,000 35,440,261 2.19% 1,243.782012 6,955,000 - - - - - - 1,410,000 8,175,000 16,540,000 0.97% 577.232013 6,690,000 - - - - - - 1,355,000 8,015,000 16,060,000 0.91% 555.112014 6,405,000 - - - - 8,800,000 - - - 15,205,000 0.89% 520.382015 - - - - - 8,800,000 4,600,000 - - 13,400,000 0.73% 455.022016 - - - - - - 4,190,000 - - 4,190,000 0.21% 144.442017 - - - - - - 4,085,227 - - 4,085,227 (a) 139.38
Note: Debt amounts exclude any premiums, discounts, or other amortization amounts.
Sources: City of San Carlos Debt ScheduleState of California, Department of Finance (population)U.S. Department of Commerce, Bureau of the Census (income)
(a) See Schedule (Demographic Statistics) for personal income and population data. Data for 2017 is not available
** Adjustments made in FY2013 relating to the City's investment in the Silicon Valley Water Joint Venture. when it took over the responsibility of winding down the operations of the former Agency.
Governmental Activities Business Type Activities
* As a result of the dissolution of the Redevelopment Agency on February 1, 2012, the long-term debt of the former Redevelopment Agency was transferred to the Successor Agency
$-
$10
$20
$30
$40
2008 2009 2010 2011 2012 2013 2014 2015 2016 2017
Mill
ions
Total Outstanding Debt
General Obligation Bonds Public Library Installment * Purchase Agreement California Energy Commission
R. Berghella * Trust Agreement RDA* Revenue Bonds 2008 ** Financing Agreement
2009** Financing Agreement ABAG Lease Agreement 2015 Refunding General Obligation Bonds
�((

CITY OF SAN CARLOSRATIO OF GENERAL BONDED DEBT OUTSTANDINGLAST TEN FISCAL YEARS
2015 Refunding Less: Amounts Percentage ofFiscal 2005 General General Obligation Available in Debt Assessed PerYear Obligation Debt (1) Bonds Service Fund (2) Total Value (3) Capita (4)
2008 7,820,000$ -$ 324,388$ 7,495,612$ 0.12% 262.62$
2009 7,630,000 - 327,112 7,302,888 0.11% 253.32
2010 7,425,000 - 331,025 7,093,975 0.10% 249.74
2011 7,200,000 - 350,365 6,849,635 0.10% 240.39
2012 6,955,000 - 364,775 6,590,225 0.10% 229.99
2013 6,690,000 - 401,700 6,288,300 0.09% 217.36
2014 6,405,000 - 436,396 5,968,604 0.08% 204.27
2015 - 4,600,000 460,660 4,139,340 0.05% 140.56
2016 - 4,190,000 343,987 3,846,013 0.04% 132.58
2017 - 4,085,227 323,532 3,761,695 0.04% 128.34
1. This is the general bonded debt of governmental activities, net of original issuance discounts and premiums2. This is the amount restricted for debt service principal payments3. Assessed value has been used because the actual value of taxable property is not readily available in the State
of California4. Population data can be found in the Schedule of Demographic and Economic Statistics
General Bonded Debt Outstanding
0
50
100
150
200
250
300
2008 2009 2010 2011 2012 2013 2014 2015 2016 2017
GO Bond Outstanding Debt Per Capita
�("
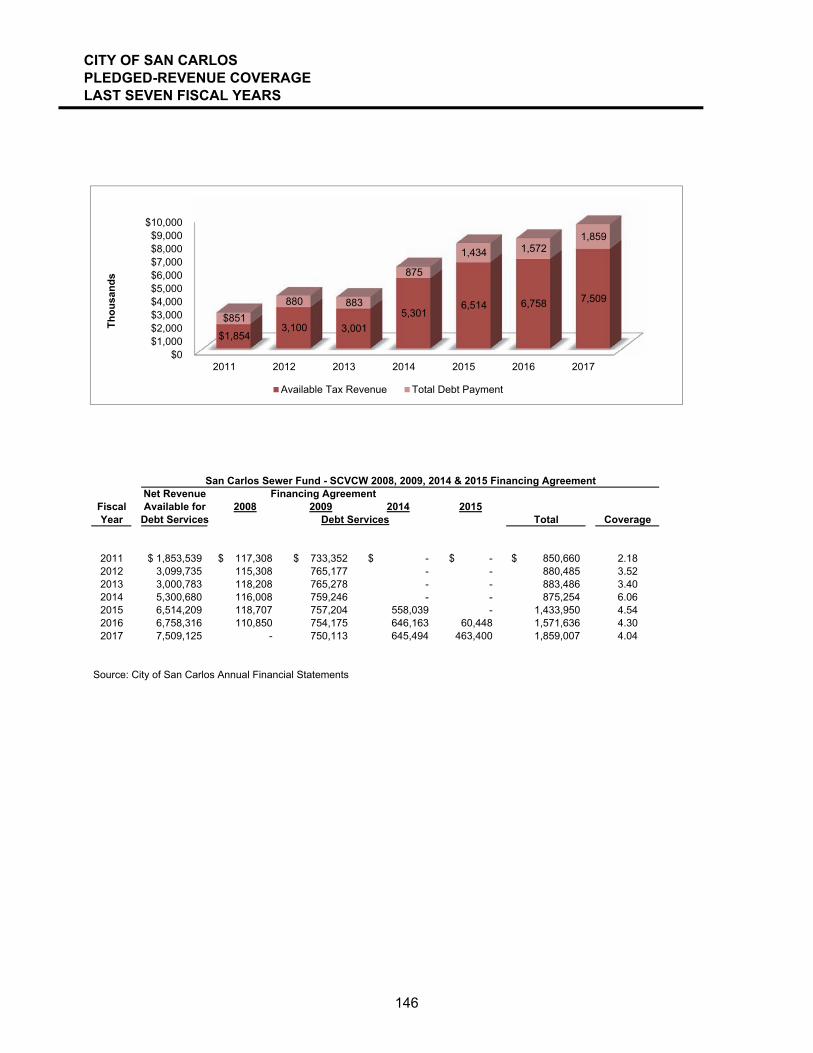
CITY OF SAN CARLOSPLEDGED-REVENUE COVERAGELAST SEVEN FISCAL YEARS
Net RevenueFiscal Available for 2008 2009 2014 2015Year Debt Services Total Coverage
2011 1,853,539$ 117,308$ 733,352$ -$ -$ 850,660$ 2.182012 3,099,735 115,308 765,177 - - 880,485 3.522013 3,000,783 118,208 765,278 - - 883,486 3.402014 5,300,680 116,008 759,246 - - 875,254 6.062015 6,514,209 118,707 757,204 558,039 - 1,433,950 4.542016 6,758,316 110,850 754,175 646,163 60,448 1,571,636 4.302017 7,509,125 - 750,113 645,494 463,400 1,859,007 4.04
Source: City of San Carlos Annual Financial Statements
San Carlos Sewer Fund - SCVCW 2008, 2009, 2014 & 2015 Financing AgreementFinancing Agreement
Debt Services
$0$1,000$2,000$3,000$4,000$5,000$6,000$7,000$8,000$9,000
$10,000
2011 2012 2013 2014 2015 2016 2017
$1,854 3,100 3,001
5,301 6,514 6,758 7,509
$851 880 883
875
1,434 1,572 1,859
Thou
sand
s
Available Tax Revenue Total Debt Payment
�(#

CITY OF SAN CARLOS COMPUTATION OF DIRECT AND OVERLAPPING DEBT JUNE 30, 2017
2016-17 Assessed Valuation $9,277,329,499Redevelopment Successor Agency Incremental Valuation $942,245,617
(1) City's Share ofTotal Debt Percentage Debt
DIRECT AND OVERLAPPING TAX AND ASSESSMENT DEBT 6/30/2017 Applicable 6/30/2017San Mateo Community College District 611,812,998$ 4.835% 29,581,158$ Sequoia Union High School District 523,920,000 11.396% 59,705,923Belmont-Redwood Shores School District 66,921,311 3.873% 2,591,862Belmond-Redwood Shores School Facilities Improvement District 38,078,950 6.302% 2,399,735Belmont-Redwood Shores School Facilities Improvement District 21,715,000 0.672% 145,925Redwood City School District 85,711,277 3.045% 2,609,908San Carlos School District 120,526,118 95.897% 115,580,931City of San Carlos 4,085,227 100% 4,085,227Midpeninsula Regional Park District 44,225,000 3.752% 1,659,322 TOTAL DIRECT AND OVERLAPPING TAX AND ASSESSMENT DEBT 1,516,995,881$ 218,359,993$
OVERLAPPING GENERAL FUND OBLIGATION DEBT:San Mateo County General Fund Obligations 399,389,816$ 4.835% 19,310,498$ San Mateo County Board of Education Certificates of Participation 9,330,000 4.835% 451,106Midpeninsula Regional Park District General Fund Obligations 112,143,611 3.752% 4,207,628 TOTAL OVERLAPPING GENERAL FUND DEBT 520,863,427$ 23,969,231$
OVERLAPPING TAX INCREMENT DEBT (SUCCESSOR AGENCY) 12,385,000$ 100% 12,385,000$
TOTAL DIRECT DEBT 4,085,227 TOTAL OVERLAPPING DEBT 250,628,997
COMBINED TOTAL DEBT 254,714,224$
(1) The percentage of overlapping debt applicable to the city is estimated using taxable assessed property value. Applicable percentages were estimated b determining the portion of the overlapping district's assessed value that is within the boundaries of the city divided by the district's total taxable assesse value.(2) Excludes tax and revenue anticipation notes, enterprise revenue, mortgage revenue and tax allocation bonds, and non-bonded capital lease obligations
RATIOS TO 2016-2017 ASSESSED VALUATION:Direct Debt ($3,940,000) 0.04%Total Direct and Overlapping Tax and Assessment Debt 2.35%Combined Total Debts 2.75%
RATIOS TO REDEVELOPMENT INCREMENTAL VALUATION ($942,245,617):Total Overlapping Tax Increment Debt 1.31%
Source: California Municipal Statistics, Inc.
�($
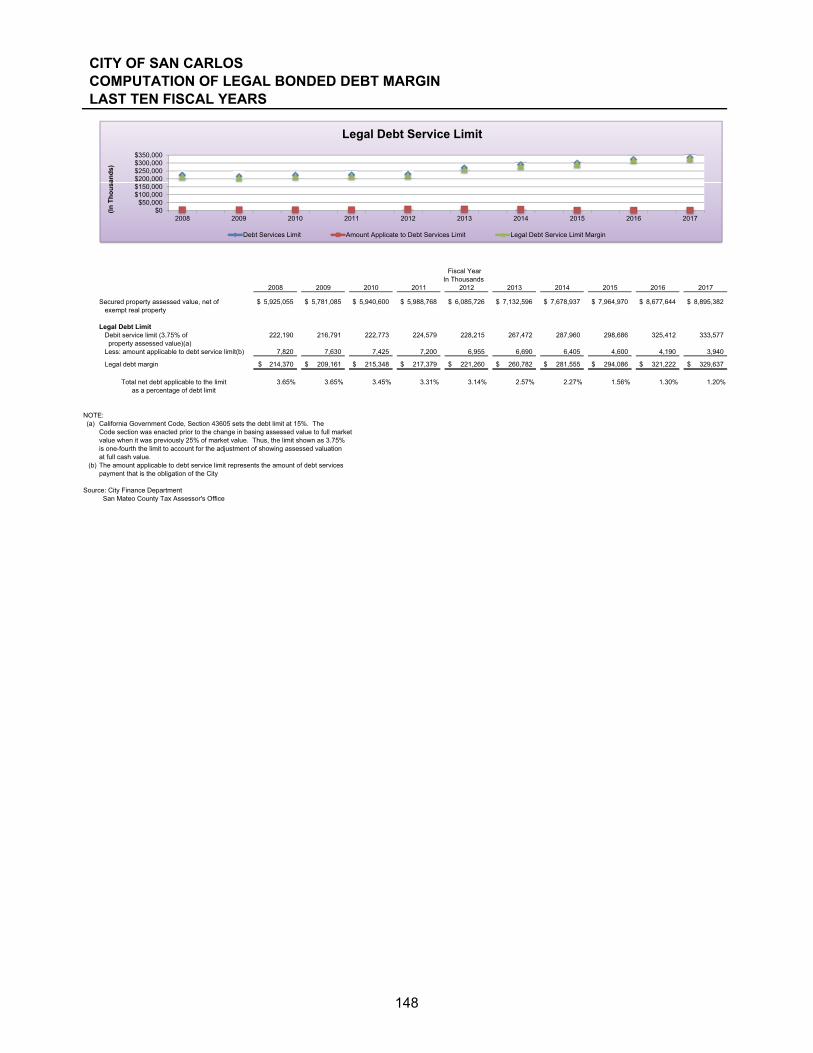
CITY OF SAN CARLOSCOMPUTATION OF LEGAL BONDED DEBT MARGINLAST TEN FISCAL YEARS
2008 2009 2010 2011 2012 2013 2014 2015 2016 2017
Secured property assessed value, net of 5,925,055$ 5,781,085$ 5,940,600$ 5,988,768$ 6,085,726$ 7,132,596$ 7,678,937$ 7,964,970$ 8,677,644$ 8,895,382$ exempt real property
Legal Debt Limit Debit service limit (3.75% of 222,190 216,791 222,773 224,579 228,215 267,472 287,960 298,686 325,412 333,577 property assessed value)(a) Less: amount applicable to debt service limit(b) 7,820 7,630 7,425 7,200 6,955 6,690 6,405 4,600 4,190 3,940
Legal debt margin 214,370$ 209,161$ 215,348$ 217,379$ 221,260$ 260,782$ 281,555$ 294,086$ 321,222$ 329,637$
Total net debt applicable to the limit 3.65% 3.65% 3.45% 3.31% 3.14% 2.57% 2.27% 1.56% 1.30% 1.20%as a percentage of debt limit
NOTE:(a) California Government Code, Section 43605 sets the debt limit at 15%. The
Code section was enacted prior to the change in basing assessed value to full market value when it was previously 25% of market value. Thus, the limit shown as 3.75% is one-fourth the limit to account for the adjustment of showing assessed valuationat full cash value.
(b) The amount applicable to debt service limit represents the amount of debt services payment that is the obligation of the City
Source: City Finance Department San Mateo County Tax Assessor's Office
Fiscal YearIn Thousands
$0$50,000
$100,000$150,000$200,000$250,000$300,000$350,000
2008 2009 2010 2011 2012 2013 2014 2015 2016 2017
(In T
hous
ands
)
Legal Debt Service Limit
Debt Services Limit Amount Applicate to Debt Services Limit Legal Debt Service Limit Margin
�(%

CITY OF SAN CARLOSDEMOGRAPHIC AND ECONOMIC STATISTICSLAST TEN FISCAL YEARS
Total PersonalIncome (amount Per Capita San Mateo City
Fiscal City express in Personal Unemployment County PopulationYear Population thousands) Income Rate Population % of County
2008 28,542 1,888,601$ 66,169$ 3.2% 739,469 3.90%2009 28,829 1,830,173 63,484 5.8% 745,858 3.87%2010 28,406 1,524,777 52,299 6.3% 754,285 3.77%2011 28,494 1,614,668 56,223 5.4% 724,702 3.93%2012 28,654 1,696,601 58,643 4.8% 729,443 3.93%2013 28,931 1,769,882 60,573 3.6% 735,678 3.93%2014 29,219 1,717,440 58,740 2.8% 745,193 3.92%2015 29,449 1,824,271 62,888 3.3% 753,123 3.91%2016 29,008 1,963,141 66,976 3.3% 766,041 3.79%2017 29,311 (a) (b) 2.9% 770,763 3.80%
Data Source:Population: California State Department of FinanceUnemployment Data: California Employment Development DepartmentIncome Data : ESRI - Demographic estimates are based on the last available census.Demographic data is totaled from census Block Groups that overlap the City's boundaries
Note: (a) & (b) Information is not available
3.2%
5.8%6.3%
5.4%
4.8%
3.6%
2.8%3.3% 3.3%
2.9%
0.0%
1.0%
2.0%
3.0%
4.0%
5.0%
6.0%
7.0%
$0
$10,000
$20,000
$30,000
$40,000
$50,000
$60,000
$70,000
$80,000
2008 2009 2010 2011 2012 2013 2014 2015 2016 2017
Personal Income and Unemployment
Per Capita Personal Income Unemployment Rate
�(&

CITY OF SAN CARLOSPRINCIPAL EMPLOYERSCURRENT YEAR AND TEN YEARS AGO
EmployerNumber ofEmployees Rank
Percent of Total City
EmploymentNumber ofEmployees Rank
Percent of Total City
Employment
PALO ALTO MEDICAL FOUNDATION 500 1 2.94%NATERA INC 405 2 2.38%L-3 COMMUNICATIONS CORP 389 3 2.29% 389 2 2.51%PACIFIC GAS & ELECTRIC CO 331 4 1.95% 350 3 2.26%RECOLOGY SAN MATEO COUNTY 240 5 1.41%NOVARTIS PHARMACEUTICALS 230 6 1.35%THE HOME DEPOT #0628 221 7 1.30% 165 7 1.06%CHECK POINT SOFTWARE TECH INC 208 8 1.22%KELLY-MOORE PAINT CO INC 193 9 1.14% 267 4 1.72%DELTA STAR INC 188 10 1.11% 188 6 1.21%NEKTAR THERAPEUTICS 550 1 4.71%TESLA MOTORS 213 5 1.37%GEORGE P JOHNSON COMPANY 150 8 0.97%BEST BUY STORES LP 110 9 0.71%ACTERON CORP 100 10 0.65%
"Total Employment " as used above represents the total employment of all employers locatedwithin City limits.
Source: *data from City of San Carlos business license database
2017 * 2008*
�"'
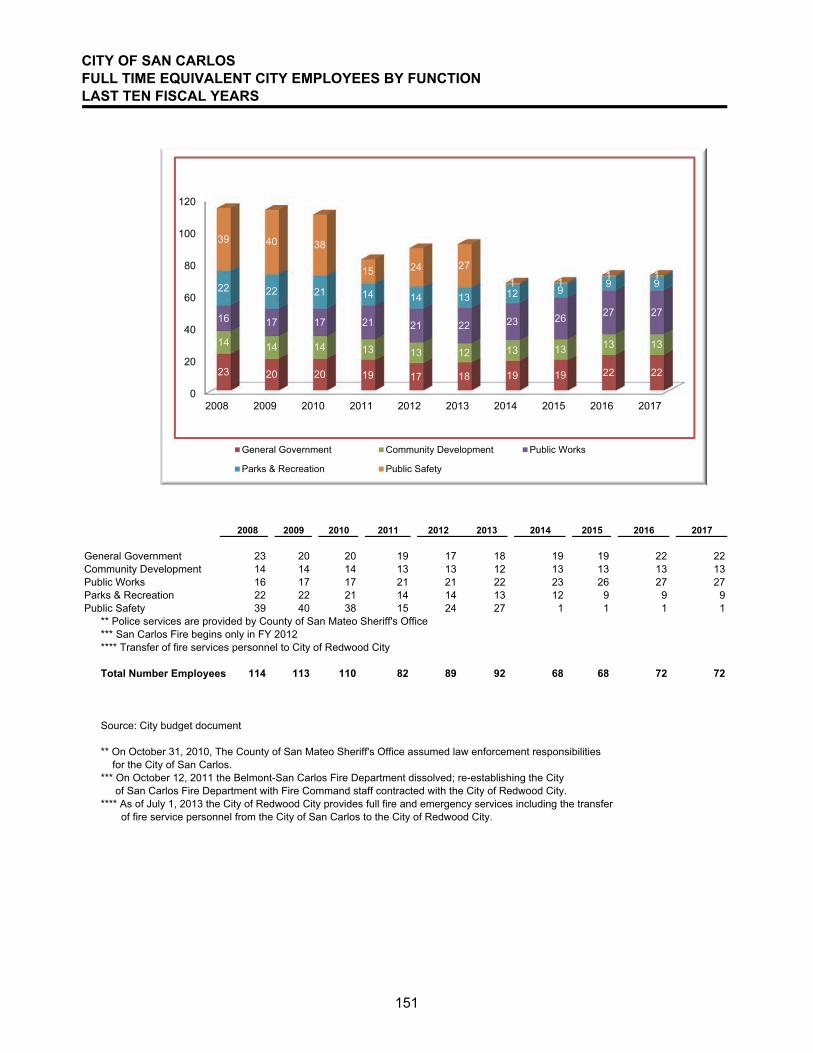
CITY OF SAN CARLOSFULL TIME EQUIVALENT CITY EMPLOYEES BY FUNCTIONLAST TEN FISCAL YEARS
2008 2009 2010 2011 2012 2013 2014 2015 2016 2017
General Government 23 20 20 19 17 18 19 19 22 22Community Development 14 14 14 13 13 12 13 13 13 13Public Works 16 17 17 21 21 22 23 26 27 27Parks & Recreation 22 22 21 14 14 13 12 9 9 9Public Safety 39 40 38 15 24 27 1 1 1 1
** Police services are provided by County of San Mateo Sheriff's Office*** San Carlos Fire begins only in FY 2012**** Transfer of fire services personnel to City of Redwood City
Total Number Employees 114 113 110 82 89 92 68 68 72 72
Source: City budget document
** On October 31, 2010, The County of San Mateo Sheriff's Office assumed law enforcement responsibilities for the City of San Carlos.*** On October 12, 2011 the Belmont-San Carlos Fire Department dissolved; re-establishing the City of San Carlos Fire Department with Fire Command staff contracted with the City of Redwood City.**** As of July 1, 2013 the City of Redwood City provides full fire and emergency services including the transfer of fire service personnel from the City of San Carlos to the City of Redwood City.
0
20
40
60
80
100
120
2008 2009 2010 2011 2012 2013 2014 2015 2016 2017
23 20 20 19 17 18 19 19 22 22
14 14 14 13 13 12 13 13 13 13
16 17 17 21 21 22 23 26 27 27
22 22 21 14 14 13 12 9 9 9
39 40 38
15 24 27
1 1 1 1
General Government Community Development Public Works
Parks & Recreation Public Safety
�"�

CITY OF SAN CARLOSOPERATING INDICATORS BY FUNCTION/PROGRAM�LAST TEN FISCAL YEARS
2008 2009 2010 2011 2012 2013 2014 2015 2016 2017
Function/ProgramPublic safety:
* Fire Fire calls for service 992 1,896 1,961 2,209 2,365 2,232 Primary fire inspections conducted 240 465 356 638 700 450Police: Communication Center calls answered Police calls for Service 14,769 14,434 13,638 12,236 11,058 13,490 12,831 13,446 17,985 12,474 Law violations: Part I and Part II crimes 2,126 2,638 2,843 2,446 2,132 1,780 1,988 1,868 1,544 1,387 Physical arrests (adult and juvenile) 864 1,005 1,060 912 704 657 683 732 713 803 Traffic violations 1,783 2,916 4,660 3,701 2,932 3,666 3,224 3,260 2,599 1,843 Parking violations 4,698 4,357 5,103 4,573 4,533 4,558 3,609 6,613 4,794 8,014
Street64 64 64 67 64 64 60 60 60 63
SewerSewer service connections 11,061 11,192 11,309 11,309 11,335 11,355 11,107 11,000 11,017 11,017Average daily flow (millions of gallons) 2.76 2.45 N/A 2.60 1.75 1.66 1.66 1.81 1.80 3Maximum Allocated Treatment Capacity, Average Dry Weather Flow (Millions of Gallons) 4.47 4.47 4.47 4.47 4.47 4.47 4.47 4.39 5.18 5Maximum Allocated Treatment Capacity, Peak Wet Weather Flow (Millions of Gallons) 14.30 14.30 14.30 14.30 14.30 14.30 14.30 15.96 25.0 14
Culture and recreation:Community Services: Adult Registrations 4,373 3,304 3,086 2,312 2,585 2,481 2,750 2,825 2,949 4,120 Tot/Youth Registrations 9,267 7,577 6,262 6,189 7,117 7,646 7,042 7,524 6,433 5,595 Facility Rentals 62 94 158 185 178 189 133 114 79 129 Picnic Rentals 150 184 146 N/A * 144 166 173 196 235 2,536 Organized Play Participants 8,724 6,742 6,620 5,454 8,005 7,184 6,761 7,222 7,900 7,985 Organized Play Hours Permitted 18,326 19,329 17,228 17,368 18,611 17,212 17,046 17,856 18,440 18,560
Note: N/A denotes information not available. The Wastewater Treatment Plant had problems with its flow meters in 2010, the data for average daily flow is not available. N/A* Due to budget cuts, the picnic rental program was halted in FY 2011. It was reinstated in FY 2012.* The Belmont-San Carlos Fire Department was dissolved on October 12, 2011. City reestablished the Fire Department in October 2011.
Information prior to the FY 2011 is not available.Source: Various city department records
Pavement Condition Index
�"

CITY OF SAN CARLOSCAPITAL ASSET STATISTICS BY FUNCTION/PROGRAMLAST TEN FISCAL YEARS
2008 2009 2010 2011 2012 2013 2014 2015 2016 2017
Function/ProgramPublic safety:
Fire stations 2 2 2 2 2 2 2 2 2 2Police stations 1 1 1 1 1 1 1 1 1 1
StreetsTotal Length (Miles) 87 87 87 87 87 87 87 87 87 87Street lights 1,740 1,740 1,888 1,888 1,888 1,888 1,888 1,916 1,942 1,942
19 20 20 20 20 20 21 21 21 21
Parking Lots4 4 4 4 4 4 4 4 4 4
356 356 356 356 356 356 356 356 356 35694 94 94 94 91 91 91 91 91 91
Wastewater106 106 106 106 104 104 104 105 105 105
6 6 6 6 6 6 6 6 6 6
Storm water1,324 1,324 1,324 1,324 1,324 1,324 1,324 1,324 1,326 1,326
3 3 3 3 3 3 3 3 3 33,205 3,205 3,205 3,205 3,205 3,205 3,205 3,205 3,205 3,205
General government:City Hall 1 1 1 1 1 1 1 1 1 1City Museum 1 1 1 1 1 1 1 1 1 1
Parks and recreation:Parks (and associated buildings) 13 13 13 13 13 13 13 13 13 13Community centers 2 2 2 2 2 2 2 2 2 2
Source: Various city department records
Manholes
Number of Public Parking SpacesNumber of Employee Permit
Catch basins/inletsStormwater Pump Stations
Total Sewer Main Length (Miles)Sewer Pump Stations
Number of City Parking Lots
Traffic Signals
�"!
This Page Left Intentionally Blank
APPENDIX L
Financial Statements and Independent Auditor’s Report for West Bay Sanitary District –
Fiscal Year Ended June 30, 2017

[THIS PAGE INTENTIONALLY LEFT BLANK]
SERVING AREAS IN MENLO PARK, ATHERTON, PORTOLA VALLEY, EAST PALO ALTO, REDWOOD CITY, WOODSIDE AND
UNINCORPORATED SAN MATEO AND SANTA CLARA COUNTIES
Serving Our Community Since 1902
500 Laurel Street, Menlo Park, California 94025-3486 (650) 321-0384 (650)321-4265 FAX PHIL SCOTT
District Manager
December 14, 2017 MEMORANDUM TO: West Bay Sanitary District’s Customers & Owners FROM: West Bay Sanitary District Board of Directors RE: Financial Audit – Fiscal Year 2016-17 Each year, an audit of the financial records of West Bay Sanitary District (WBSD) is completed to assure the management and Board of Directors is exercising its fiduciary responsibilities in maintaining your wastewater system and services. Attached is the audit report for the fiscal year between July 1, 2016 and June 30, 2017. We are pleased that the auditors found:
1. WBSD is in sound financial condition; 2. The accounting reports fairly reflect the financial condition of WBSD, and 3. The WBSD staff follows sound financial processes and procedures.
We welcome your comments or questions. WBSD Board of Directors: Ned Moritz President Roy Thiele-Sardina Treasurer Fran Dehn Secretary George Otte Director David Walker Director

CHAVAN & ASSOCIATES LLP CERTIFIED PUBLIC ACCOUNTANTS 1475 SARATOGA AVE, SUITE 180
SAN JOSE, CA 95129
WEST BAY SANITARY DISTRICT
FINANCIAL STATEMENTS AND INDEPENDENT AUDITOR’S REPORT
JUNE 30, 2017
* * *

West Bay Sanitary District
Table of Contents June 30, 2017
Independent Auditor’s Report................................................................................. 1 - 2 Management’s Discussion and Analysis ................................................................. 4 - 8 Basic Financial Statements: Statement of Net Position ........................................................................................ 10 Statement of Revenues, Expenses and Changes in Net Position ............................. 11 Statement of Cash Flows ......................................................................................... 12 Notes to Financial Statements .................................................................................. 13 - 34 Required Supplementary Information: Schedule of Pension Contributions - CalPERS ....................................................... 36 Schedule of Proportionate Share of Net Pension Liability ...................................... 37 Supplementary Information: Budgetary Comparison Schedule ............................................................................. 39 Independent Auditor’s Report on Internal Control over Financial Reporting and on Compliance and Other Matters Based on an Audit of Financial Statements Performed in Accordance with Government Auditing Standards ............................................................................ 41 - 42
1475 Saratoga Ave, Suite 180, San Jose, CA 95129 Tel: 408-217-8749 • E-Fax: 408-872-4159
[email protected] • www.cnallp.com
INDEPENDENT AUDITOR’S REPORT To the Board of Directors West Bay Sanitary District Menlo Park, California Report on the Financial Statements We have audited the accompanying financial statements of the West Bay Sanitary District (the “District"), as of and for the year ended June 30, 2017, and the related notes to the financial statements, which collectively comprise District’s basic financial statements as listed in the table of contents. Management’s Responsibility for the Financial Statements The District’s management is responsible for the preparation and fair presentation of these financial statements in accordance with accounting principles generally accepted in the United States of America; this includes the design, implementation, and maintenance of internal control relevant to the preparation and fair presentation of financial statements that are free from material misstatement, whether due to fraud or error. Auditor’s Responsibility Our responsibility is to express opinions on these financial statements based on our audit. We conducted our audit in accordance with auditing standards generally accepted in the United States of America, the standards applicable to financial audits contained in Government Auditing Standards, issued by the Comptroller General of the United States, and the State Controller's Minimum Audit Requirements for California Special Districts. Those standards require that we plan and perform the audit to obtain reasonable assurance about whether the financial statements are free from material misstatement. An audit involves performing procedures to obtain audit evidence about the amounts and disclosures in the financial statements. The procedures selected depend on the auditor’s judgment, including the assessment of the risks of material misstatement of the financial statements, whether due to fraud or error. In making those risk assessments, the auditor considers internal control relevant to the District’s preparation and fair presentation of the financial statements in order to design audit procedures that are appropriate in the circumstances, but not for the purpose of expressing an opinion on the effectiveness of the District’s internal control. Accordingly, we express no such opinion. An audit also includes evaluating the appropriateness of accounting policies used and the reasonableness of significant accounting estimates made by management, as well as evaluating the overall presentation of the financial statements. We believe that the audit evidence we have obtained is sufficient and appropriate to provide a basis for our audit opinions. Opinions In our opinion, the financial statements referred to above present fairly, in all material respects, the respective financial position of the West Bay Sanitary District, as of June 30, 2017, and the respective changes in financial position and, where applicable, cash flows thereof for the year then ended in accordance with accounting principles generally accepted in the United States of America.
Page 1 of 42

1475 Saratoga Ave, Suite 180, San Jose, CA 95129 Tel: 408-217-8749 • E-Fax: 408-872-4159
[email protected] • www.cnallp.com
Other Matters Required Supplementary Information Accounting principles generally accepted in the United States of America require that the management’s discussion and analysis, schedule of pension contributions - CalPERS, schedule of proportionate share of net pension liability, and schedule of funding progress for the retiree health benefit plan, as listed in the table of contents, be presented to supplement the basic financial statements. Such information, although not a part of the basic financial statements, is required by the Governmental Accounting Standards Board who considers it to be an essential part of financial reporting for placing the basic financial statements in an appropriate operational, economic, or historical context. We have applied certain limited procedures to the required supplementary information in accordance with auditing standards generally accepted in the United States of America, which consisted of inquiries of management about the methods of preparing the information and comparing the information for consistency with management’s responses to our inquiries, the basic financial statements, and other knowledge we obtained during our audit of the basic financial statements. We do not express an opinion or provide any assurance on the information because the limited procedures do not provide us with sufficient evidence to express an opinion or provide any assurance. Supplementary Information Our audit was conducted for the purpose of forming opinions on the financial statements that collectively comprise the District’s financial statements as a whole. The supplementary information listed in the table of contents is presented for purposes of additional analysis and is not a required part of the financial statements. These schedules are the responsibility of management and were derived from and relate directly to the underlying accounting and other records used to prepare the financial statements. The information has been subjected to the auditing procedures applied in the audit of the financial statements and certain additional procedures, including comparing and reconciling such information directly to the underlying accounting and other records used to prepare the financial statements or to the financial statements themselves, and other additional procedures in accordance with auditing standards generally accepted in the United States of America. In our opinion, the information is fairly stated in all material respects in relation to the financial statements as a whole. Other Reporting Required by Government Auditing Standards In accordance with Government Auditing Standards, we have also issued our report dated November 7, 2017 on our consideration of the District’s internal control over financial reporting and on our tests of its compliance with certain provisions of laws, regulations, contracts, and grant agreements and other matters. The purpose of that report is to describe the scope of our testing of internal control over financial reporting and compliance and the results of that testing, and not to provide an opinion on internal control over financial reporting or on compliance. That report is an integral part of an audit performed in accordance with Government Auditing Standards in considering the District’s internal control over financial reporting and compliance.
November 7, 2017 San Jose, California
Page 2 of 42

MANAGEMENT'S DISCUSSION AND ANLAYSIS
Page 3 of 42

West Bay Sanitary District Management’s Discussion and Analysis
June 30, 2017
The West Bay Sanitary District (the District) has issued its financial statements for the fiscal year ended June 30, 2017, in conformity with the format prescribed by the provisions of Governmental Accounting Standards. The Management’s Discussion and Analysis is an overview of the District’s financial activities for the fiscal year and is an integral part of the accompanying Basic Financial Statements. Readers are encouraged to consider the information presented herein with those statements. FINANCIAL HIGHLIGHTS
The District’s net position increased by $9,607,563 or 10.5%. The District’s operating revenue increased by $1,203,468 or 4.9%. The District’s operating expenses increased by $439,086 or 2.4%.
OVERVIEW OF THE FINANCIAL STATEMENTS This annual report includes the Management's discussion and analysis report, the independent auditor’s report and the basic financial statements of the District. The financial statements also include notes that explain the information in the financial statements in more detail. BASIC FINANCIAL STATEMENTS The Financial Statements of the District report information about the District’s accounting methods similar to those used by private sector companies. These statements offer short-term and long-term financial information about its activities. The Statement of Net Position includes all of the District’s assets, deferred inflows, deferred outflows, and liabilities and provides information about the nature and amounts of investments in resources (assets) and obligations to creditors (liabilities). It also provides the basis for evaluating the capital structure of the District. All of the current year’s revenues and expenses are accounted for in the Statement of Activities and Changes in Net Position. These statements reflect the result of the District’s operations over the past year. The final required Financial Statement is the Statement of Cash Flows. The primary purpose of this statement is to provide information about the District’s cash receipts and cash payments during the reporting period. The statement reports cash receipts, cash payments, and net changes in cash resulting from operations and investments. It also provides answers to questions such as where did cash come from, what was cash used for, and what was the change in cash balance during the reporting period. FINANCIAL ANALYSIS OF THE DISTRICT One of the most important questions asked about the District’s finances is “Is the District better off or worse off as a result of the year’s activities?” The Statement of Net Position and the Statement of Activities and Changes in Net Position report information about the District’s activities in a way that will help answer this question. These two statements report the net position of the District and changes in them. You can think of the District’s net position – the difference between assets and liabilities – as one way to measure the financial health or financial position. Over time, increases or decreases in the District’s net position are one indicator of whether its financial health is improving or deteriorating. However, you will need to consider other non-financial factors such as changes in economic conditions, population growth, and new or changed government legislation.
Page 4 of 42

West Bay Sanitary District Management’s Discussion and Analysis
June 30, 2017
NET POSITION To begin our analysis, a summary of the District’s Statement of Net Position is presented in Table 1.
Dollar Percent 2017 2016 Change ChangeAssetsCurrent & Other Assets 60,289,418$ 53,652,452$ 6,636,966$ 12.4%Capital Assets 48,382,995 43,914,905 4,468,090 10.2%Total Assets 108,672,413$ 97,567,357$ 11,105,056$ 11.4%
Deferred Outflows of Resources 1,083,877$ 773,589$ 310,288$ 40.1%
Liabilities Current Liabilities 3,624,254$ 2,631,509$ 992,745$ 37.7%Noncurrent Liabilities 4,507,639 3,764,819 742,820 19.7%Total Liabilities 8,131,893$ 6,396,328$ 1,735,565$ 27.1%
Deferred Inflows of Resources 408,664$ 336,448$ 72,216$ 21.5%
Net Position Net Investment in Capital Assets 48,382,995$ 43,914,905$ 4,468,090$ 10.2%Unrestricted:
Capital fund budget 14,531,267 19,923,329 (5,392,062) -27.1%Invested in SVCW 13,589,774 13,261,248 328,526 2.5%Operations reserve 7,923,244 7,441,158 482,086 6.5%Unreserved 16,788,453 7,067,530 9,720,923 137.5%
Total Net Position 101,215,733$ 91,608,170$ 9,607,563$ 10.5%
Table 1 - Summary of Net Position
As seen above, the District’s total net position increased by $9,607,563, or 10.5%, from fiscal year 2015- 16 to 2016-17. The District’s current and other assets increased by $6,636,966. Capital assets, net of depreciation, increased by $4,468,090 from capital spending totaling $6,120,727. This includes Capital expenditures of $4,952,150 for capital equipment purchases and replacement of sewer infrastructure, expenditures of $1,154,381 for the SHGCC Recycled Water Facility including a prior year reclass from O&M expense, and $14,196 for the Bay Front Resource Recovery project. Total liabilities increased by $1,735,565 primarily due to increases to the District’s net pension liability of $904,101 and accounts payable of $988,504.
Page 5 of 42
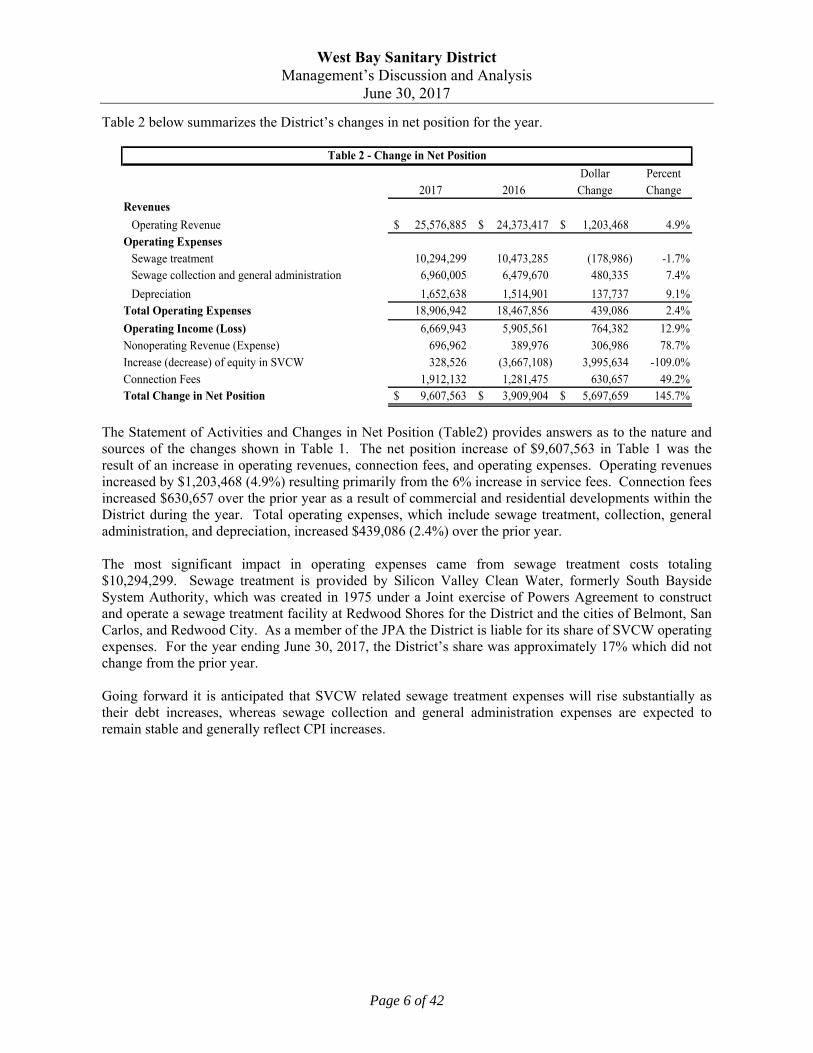
West Bay Sanitary District Management’s Discussion and Analysis
June 30, 2017
Table 2 below summarizes the District’s changes in net position for the year.
Dollar Percent2017 2016 Change Change
Revenues
Operating Revenue 25,576,885$ 24,373,417$ 1,203,468$ 4.9%Operating Expenses
Sewage treatment 10,294,299 10,473,285 (178,986) -1.7%Sewage collection and general administration 6,960,005 6,479,670 480,335 7.4%
Depreciation 1,652,638 1,514,901 137,737 9.1%Total Operating Expenses 18,906,942 18,467,856 439,086 2.4%
Operating Income (Loss) 6,669,943 5,905,561 764,382 12.9%Nonoperating Revenue (Expense) 696,962 389,976 306,986 78.7%Increase (decrease) of equity in SVCW 328,526 (3,667,108) 3,995,634 -109.0%Connection Fees 1,912,132 1,281,475 630,657 49.2%Total Change in Net Position 9,607,563$ 3,909,904$ 5,697,659$ 145.7%
Table 2 - Change in Net Position
The Statement of Activities and Changes in Net Position (Table2) provides answers as to the nature and sources of the changes shown in Table 1. The net position increase of $9,607,563 in Table 1 was the result of an increase in operating revenues, connection fees, and operating expenses. Operating revenues increased by $1,203,468 (4.9%) resulting primarily from the 6% increase in service fees. Connection fees increased $630,657 over the prior year as a result of commercial and residential developments within the District during the year. Total operating expenses, which include sewage treatment, collection, general administration, and depreciation, increased $439,086 (2.4%) over the prior year. The most significant impact in operating expenses came from sewage treatment costs totaling $10,294,299. Sewage treatment is provided by Silicon Valley Clean Water, formerly South Bayside System Authority, which was created in 1975 under a Joint exercise of Powers Agreement to construct and operate a sewage treatment facility at Redwood Shores for the District and the cities of Belmont, San Carlos, and Redwood City. As a member of the JPA the District is liable for its share of SVCW operating expenses. For the year ending June 30, 2017, the District’s share was approximately 17% which did not change from the prior year. Going forward it is anticipated that SVCW related sewage treatment expenses will rise substantially as their debt increases, whereas sewage collection and general administration expenses are expected to remain stable and generally reflect CPI increases.
Page 6 of 42

West Bay Sanitary District Management’s Discussion and Analysis
June 30, 2017
BUDGETARY HIGHLIGHTS The District adopts an annual budget which provides for the general operations. Budgets are prepared on the accrual basis of accounting. Project-length financial plans are adopted for capital projects. The Capital Improvement Program provides an annual forecast of capital requirements. Table 3 shows a comparison of actual to budget for general operations for the year ended June 30, 2017.
PercentBudget Actual Variance Variance
RevenuesOperating Revenue 25,012,206$ 25,576,885$ 564,679$ 2.3%
Operating ExpensesSewage treatment 11,905,000 10,294,299 1,610,701 15.6%Sewage collection and general administration 7,024,786 6,960,005 64,781 0.9%Depreciation 1,600,000 1,652,638 (52,638) -3.2%
Total Operating Expenses 20,529,786 18,906,942 1,622,844 8.6%Operating Income (Loss) 4,482,420 6,669,943 2,187,523 48.8%Nonoperating Revenue (Expense) 105,000 696,962 591,962 84.9%Increase (Decrease) of Equity in SVCW - 328,526 328,526 100.0%Connection Fees 50,000 1,912,132 1,862,132 3724.3%Change in Net Position 4,637,420$ 9,607,563$ 4,970,143$ 107.2%
Table 3 - Budget Summary
The District reported $564,679 more in operating revenue than budgeted primarily resulting from higher sewer service fees collected. Total operating expenses were $1,622,844 less than budgeted primarily due to budgeted payments for SVCW bond and loan debt that did not materialize.. Table 4 summarizes the capital budget for the fiscal year ended June 30, 2017:
Budget Actual VariancePercent
Variance
Transfer from Operations 6,112,420$ 6,941,472$ 829,052$ 14%Capital Expenditures (9,414,500) (4,952,150) 4,462,350 -90%Recycled Water Facility SHGCC - (1,154,381) (1,154,381) 100%Bay Front Resource Recovery - (14,196) (14,196) 100%Connection Charges 50,000 1,912,132 1,862,132 3724%Interest Income 75,000 96,511 21,511 29%Recycled Water Facility Cash Flow Reserve - (8,000,000) (8,000,000) 100%Equipment Replacement Reserve (221,450) (221,450) - 0%Change in capital Asset Fund (3,398,530) (5,392,062) (1,993,532) 37%Beginning Fund Balance 19,946,317 19,923,329 (22,988) 0%Ending Fund Balance 16,547,787$ 14,531,267$ (2,016,520)$ -12%
Table 4 - Capital Fund Budget Summary
Capital Expenditures of $4,952,150 to acquire capital equipment and replace or rehabilitate sewer infrastructure were $4,462,350 less than budget. Expenditures to date for the District recycled water facility projects are $1,154,381 for the SHGCC Recycled Water Facility and $14,196 for the Bay Front Resource Recovery. To fund the cash flow for these projects the District set aside $8,000,000 in a Recycled Water Facility Cash Flow Reserve. The District also set-aside $221,450 for equipment
Page 7 of 42
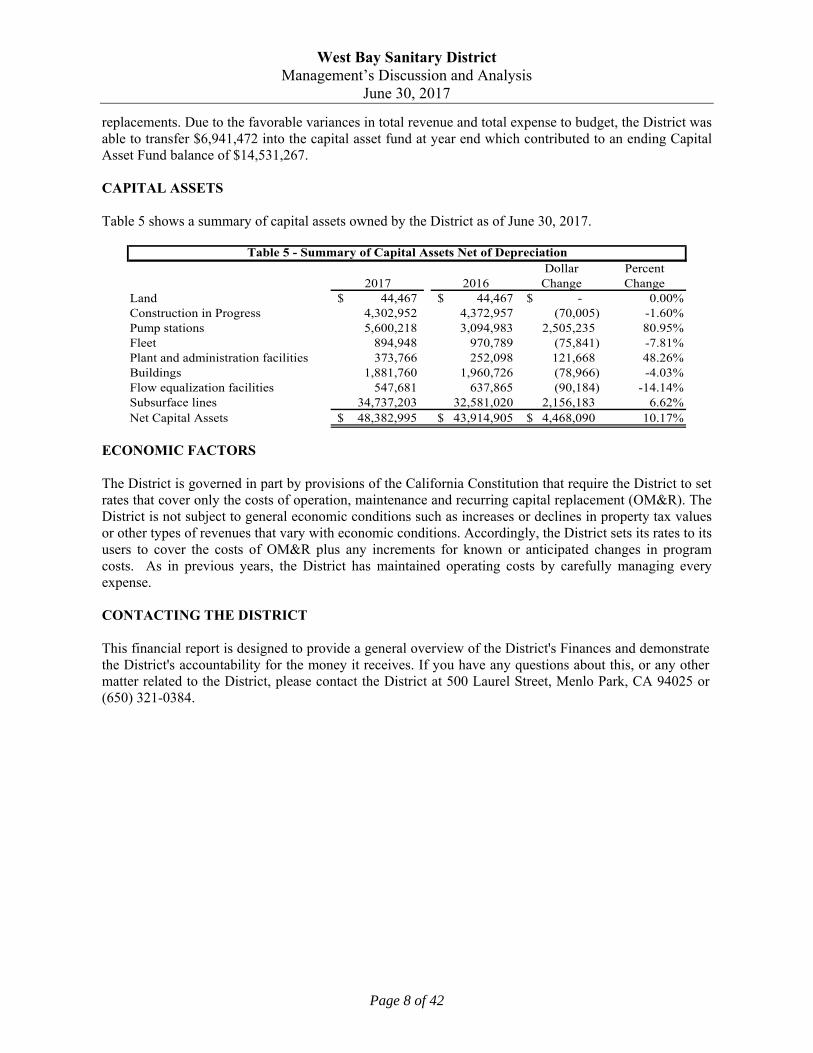
West Bay Sanitary District Management’s Discussion and Analysis
June 30, 2017
replacements. Due to the favorable variances in total revenue and total expense to budget, the District was able to transfer $6,941,472 into the capital asset fund at year end which contributed to an ending Capital Asset Fund balance of $14,531,267. CAPITAL ASSETS Table 5 shows a summary of capital assets owned by the District as of June 30, 2017.
Dollar Percent 2017 2016 Change ChangeLand 44,467$ 44,467$ -$ 0.00%Construction in Progress 4,302,952 4,372,957 (70,005) -1.60%Pump stations 5,600,218 3,094,983 2,505,235 80.95%Fleet 894,948 970,789 (75,841) -7.81%Plant and administration facilities 373,766 252,098 121,668 48.26%Buildings 1,881,760 1,960,726 (78,966) -4.03%Flow equalization facilities 547,681 637,865 (90,184) -14.14%Subsurface lines 34,737,203 32,581,020 2,156,183 6.62%Net Capital Assets 48,382,995$ 43,914,905$ 4,468,090$ 10.17%
Table 5 - Summary of Capital Assets Net of Depreciation
ECONOMIC FACTORS The District is governed in part by provisions of the California Constitution that require the District to set rates that cover only the costs of operation, maintenance and recurring capital replacement (OM&R). The District is not subject to general economic conditions such as increases or declines in property tax values or other types of revenues that vary with economic conditions. Accordingly, the District sets its rates to its users to cover the costs of OM&R plus any increments for known or anticipated changes in program costs. As in previous years, the District has maintained operating costs by carefully managing every expense. CONTACTING THE DISTRICT This financial report is designed to provide a general overview of the District's Finances and demonstrate the District's accountability for the money it receives. If you have any questions about this, or any other matter related to the District, please contact the District at 500 Laurel Street, Menlo Park, CA 94025 or (650) 321-0384.
Page 8 of 42

BASIC FINANCIAL STATEMENTS
Page 9 of 42

Assets 2017 2016
Current Assets:
Cash and cash equivalents 20,181,203$ 20,442,968$
Accounts receivable 184,381 1,561,725
Interest receivable 182,784 120,550
Prepaid expenses and other current assets 35,995 32,180
Total Current Assets 20,584,363 22,157,423
Noncurrent Assets:
Investments 26,031,081 18,233,781
Net OPEB asset 84,200 -
Investment in Silicon Valley Clean Water 13,589,774 13,261,248
Capital assets:
Non-depreciable 4,347,419 4,417,424
Depreciable net of accumulated depreciation 44,035,576 39,497,481
Total Capital Assets - Net 48,382,995 43,914,905
Total Noncurrent Assets - Net 88,088,050 75,409,934
Total Assets 108,672,413$ 97,567,357$
Deferred Outflows of Resources
Pension contributions 1,083,877$ 773,589$
Liabilities
Current Liabilities:
Accounts payable 3,439,238$ 2,450,734$
Payroll and related liabilities 4,035 9,262
Construction deposits 9,381 9,381
Compensated absences payable - current 171,600 162,132
Total Current Liabilities 3,624,254 2,631,509
Noncurrent Liabilities:
Net OPEB obligation - 119,049
Net pension obligation 4,429,092 3,524,991
Compensated absences payable - noncurrent 78,547 120,779
Total Noncurrent Liabilities 4,507,639 3,764,819
Total Liabilities 8,131,893$ 6,396,328$
Deferred Inflows of Resources
Pension adjustments from projected and actual earnings 408,664$ 336,448$
Net Position
Net Investment in Capital Assets 48,382,995$ 43,914,905$
Unrestricted:
Capital fund budget 14,531,267 19,923,329
Invested in Silicon Valley Clean Water 13,589,774 13,261,248
Operations reserve 7,923,244 7,441,158
Unreserved 16,788,453 7,067,530
Total Net Position 101,215,733$ 91,608,170$
West Bay Sanitary District
Statement of Net Position
(With Comparative Totals as of June 30, 2016)
June 30, 2017
The notes to the financial statements are an integral part of this statement.
Page 10 of 42

2017 2016
Operating Revenues:
Service charges 24,483,213$ 23,208,142$
Flow equalization uses 315,186 306,900
Permit and inspection fees and other services 210,870 242,077
Other operating revenues 567,616 616,298
Total operating revenues 25,576,885 24,373,417
Operating Expenses:
Sewage treatment 10,294,299 10,473,285
Sewage collection and general administration:
Salaries and benefits 5,231,091 4,538,250
Materials and supplies 335,092 346,827
Insurance 84,360 78,753
Contract services 283,662 442,135
Professional services 383,741 563,261
Repairs and maintenance 255,891 171,892
Utilities 129,147 116,154
Other operating expenses 257,021 222,398
Total sewage collection and general administration 6,960,005 6,479,670
Depreciation 1,652,638 1,514,901
Total operating expenses 18,906,942 18,467,856
Operating Income (Loss) 6,669,943 5,905,561
Nonoperating Revenues (Expenses):
Investment income 168,839 385,725
Increase (decrease) of equity in Silicon Valley Clean Water 328,526 (3,667,108)
Other nonoperating revenues 528,123 4,251
Total nonoperating revenues (expenses) 1,025,488 (3,277,132)
Income before contributions 7,695,431 2,628,429
Capital contributions - connection fees 1,912,132 1,281,475
Change in Net Position 9,607,563 3,909,904
Beginning Net Position 91,608,170 87,698,266
Ending Net Position 101,215,733$ 91,608,170$
West Bay Sanitary District
Statement of Revenues, Expenses and Changes in Net Position
(With Comparative Totals for the Fiscal Year Ended June 30, 2016)
For the Fiscal Year Ended June 30, 2017
The notes to the financial statements are an integral part of this statement.
Page 11 of 42
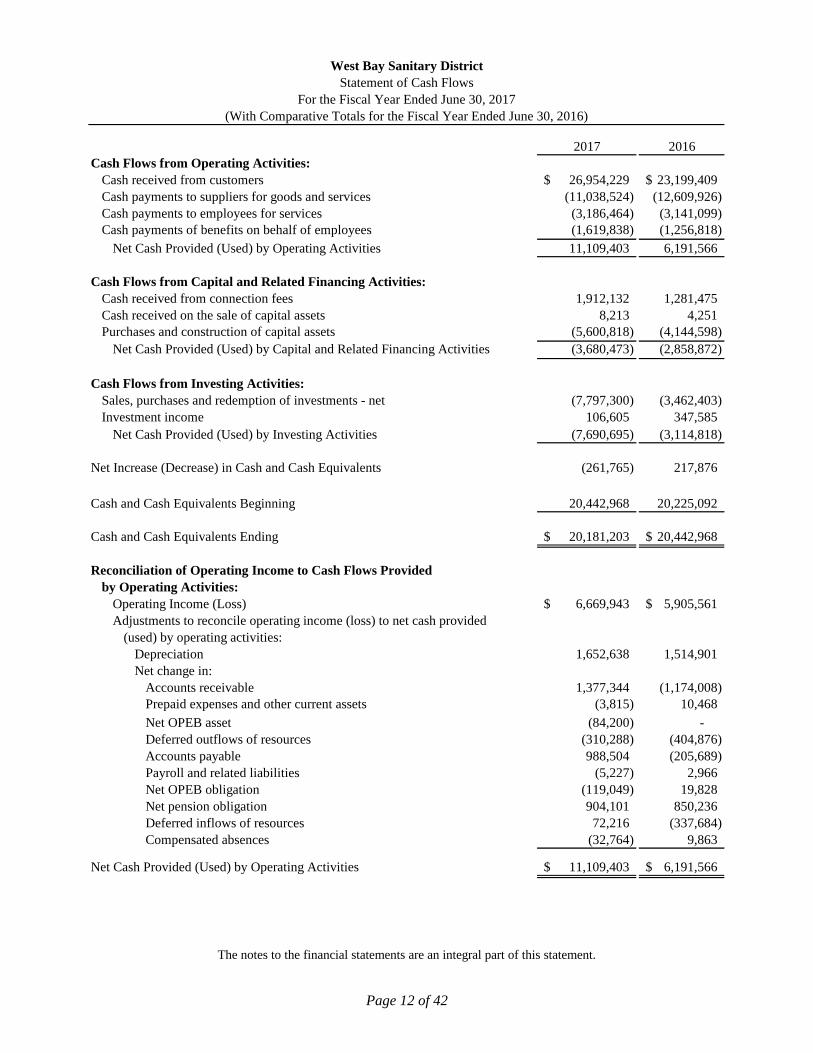
2017 2016
Cash Flows from Operating Activities:
Cash received from customers 26,954,229$ 23,199,409$
Cash payments to suppliers for goods and services (11,038,524) (12,609,926)
Cash payments to employees for services (3,186,464) (3,141,099)
Cash payments of benefits on behalf of employees (1,619,838) (1,256,818)
Net Cash Provided (Used) by Operating Activities 11,109,403 6,191,566
Cash Flows from Capital and Related Financing Activities:
Cash received from connection fees 1,912,132 1,281,475
Cash received on the sale of capital assets 8,213 4,251
Purchases and construction of capital assets (5,600,818) (4,144,598)
Net Cash Provided (Used) by Capital and Related Financing Activities (3,680,473) (2,858,872)
Cash Flows from Investing Activities:
Sales, purchases and redemption of investments - net (7,797,300) (3,462,403)
Investment income 106,605 347,585
Net Cash Provided (Used) by Investing Activities (7,690,695) (3,114,818)
Net Increase (Decrease) in Cash and Cash Equivalents (261,765) 217,876
Cash and Cash Equivalents Beginning 20,442,968 20,225,092
Cash and Cash Equivalents Ending 20,181,203$ 20,442,968$
Reconciliation of Operating Income to Cash Flows Provided
by Operating Activities:
Operating Income (Loss) 6,669,943$ 5,905,561$
Adjustments to reconcile operating income (loss) to net cash provided
(used) by operating activities:
Depreciation 1,652,638 1,514,901
Net change in:
Accounts receivable 1,377,344 (1,174,008)
Prepaid expenses and other current assets (3,815) 10,468
Net OPEB asset (84,200) -
Deferred outflows of resources (310,288) (404,876)
Accounts payable 988,504 (205,689)
Payroll and related liabilities (5,227) 2,966
Net OPEB obligation (119,049) 19,828
Net pension obligation 904,101 850,236
Deferred inflows of resources 72,216 (337,684)
Compensated absences (32,764) 9,863
Net Cash Provided (Used) by Operating Activities 11,109,403$ 6,191,566$
West Bay Sanitary District
Statement of Cash Flows
(With Comparative Totals for the Fiscal Year Ended June 30, 2016)
For the Fiscal Year Ended June 30, 2017
The notes to the financial statements are an integral part of this statement.
Page 12 of 42

West Bay Sanitary District Notes to Financial Statements
June 30, 2017
NOTE 1 - NATURE OF ORGANIZATION West Bay Sanitary District (District) is a political subdivision of the State of California, and was formed for the purpose of protecting water quality and the associated public health. The District is responsible for wastewater collections, treatment, reclamation and disposal. The District performs the services of wastewater collection, and together with three other public entities is part of a Joint Powers District for the treatment, disposal and reclamation of wastewater. The District is also responsible for refuse (solid waste) collection, treatment, disposal and reclamation. It franchises with other organizations to perform these refuse services.
NOTE 2 - SUMMARY OF SIGNIFICANT ACCOUNTING POLICIES
Basis of Presentation and Accounting
The District's Basic Financial Statements are prepared in accordance with the policies and procedures for California special districts. The accounting policies of the District conform to accounting principles generally accepted in the United States of America, and as prescribed by the Governmental Accounting Standards Board and Audits of State and Local Governmental Units, issued by the American Institute of Certified Public Accountants. The District is accounted for as an enterprise fund because the intent of the governing body is that the cost (including depreciation) of providing goods or services to the general public on a continuing basis be financed or recovered primarily through user charges. An enterprise fund is used to account for activities similar to those in the private sector, where the proper matching of revenues and costs is important and the full accrual basis of accounting is required. With this measurement focus, all assets, deferred outflows of resources, liabilities, and deferred inflows of resources of the enterprise are recorded on its statement of net position, and under the full accrual basis of accounting, all revenues are recognized when earned and all expenses, including depreciation, are recognized when incurred. Enterprise funds are accounted for on a cost of services or economic resources measurement focus, which means that all assets, deferred outflows of resources, liabilities, and deferred inflows of resources associated with their activity are included on their balance sheets. Enterprise fund type operating statements present increases (revenues) and decreases (expenses) in total net position. Deferred outflows of resources is a consumption of net assets by the District that is applicable to a future reporting period. For example, prepaid items and deferred charges. Deferred inflows of resources is an acquisition of net assets by the District that is applicable to a future reporting period. For example, unearned revenue and advance collections. Unearned revenue arises when assets are received before revenue recognition criteria have been satisfied. Grants and entitlements received before eligibility requirements are met are recorded as deferred inflows from unearned revenue. The District applies all applicable GASB pronouncements for certain accounting and financial reporting guidance. In December of 2010, GASB issued Statement No. 62, Codification of
Page 13 of 42
West Bay Sanitary District Notes to Financial Statements
June 30, 2017
Accounting and Financial Reporting Guidance Contained in Pre-November 30, 1989 FASB and AICPA Pronouncements. GASB 62 incorporates pronouncements issued on or before November 30, 1989 into GASB authoritative literature. In June of 2015, GASB issued Statement No. 76, The Hierarchy of Generally Accepted Accounting Principles for State and Local Governments. GASB 76 supersedes Statement No. 55, The Hierarchy of Generally Accepted Accounting Principles for State and Local Governments. GASB 76 also amends GASB 62 and AICPA Pronouncements paragraphs 64, 74, and 82. The GAAP hierarchy sets forth what constitutes GAAP for all state and local governmental entities. It establishes the order of priority of pronouncements and other sources of accounting and financial reporting guidance that a governmental entity should apply. The sources of authoritative GAAP are categorized in descending order of authority as follows:
a. Officially established accounting principles—Governmental Accounting Standards Board (GASB) Statements (Category A)
b. GASB Technical Bulletins; GASB Implementation Guides; and literature of the AICPA cleared by the GASB (Category B).
If the accounting treatment for a transaction or other event is not specified by a pronouncement in Category A, a governmental entity should consider whether the accounting treatment is specified by a source in Category B. Statement of Net Position
The statement of net position is designed to display the financial position of the District. The District’s net position are classified into three categories as follows:
Net Investment in Capital Assets - This component of net position consists of capital assets,
including restricted capital assets, net of accumulated depreciation and reduced by the outstanding balances of any bonds, notes, or other borrowings that are attributable to the acquisition, construction, or improvement of those assets. Deferred outflows of resources and deferred inflows of resources that are attributable to the acquisition, construction, or improvement of those assets or related debt are also included in this component of net position, as applicable.
Restricted - This component of net position consists of constraints placed on an assets use through external constraints imposed by creditors (such as through debt covenants), grantors, contributors, or law and regulations of other governments, and reduced by liabilities and deferred inflows of resources related to those assets. It also pertains to constraints imposed by law or constitutional provisions or enabling legislation
Unrestricted - This component of net position consists of the net amount of the assets, deferred
outflows of resources, liabilities, and deferred inflows of resources that are not included in the determination of net investment in capital assets or the restricted component of net position. The District first applies restricted resources when an expense is incurred for purposes for which both restricted and unrestricted net position are available.
Page 14 of 42

West Bay Sanitary District Notes to Financial Statements
June 30, 2017
Statement of Revenues, Expenses, and Changes in Net Position The statement of revenues, expenses, and changes in net position is the operating statement for proprietary funds. This statement distinguishes between operating and non-operating revenues and expenses and presents a separate subtotal for operating revenues, operating expenses, and operating income. Operating revenues and expenses generally result from providing services in connection with the District's principal ongoing operations. The principal operating revenues of the District are charges to customers for services. Operating expenses for the District include the cost of services, administrative expenses, and depreciation on capital assets. All revenues and expenses not meeting this definition are reported as non-operating revenues and expenses. Service Charges Service charges are billed and collected on the District's behalf by the County of San Mateo in conjunction with the County's annual property tax billings. The majority of revenues are collected through the County system with only small amounts billed directly by the District. Connection Fees Connection fees are reported as revenue only to the extent the amount equals the costs of the physical connection to the system. Budgets and Budgetary Accounting Budgets are prepared on a basis consistent with generally accepted accounting principles. Annual appropriated budgets are adopted by the Board of Directors. Project-length financial plans are adopted for all capital projects funds. Cash and Cash Equivalents For the purposes of the statement of cash flows, cash represents balances that can be readily withdrawn without substantial notice or penalty. Cash equivalents are defined as short-term, highly liquid investments that are both readily convertible to known amounts of cash or so near their maturity that they present insignificant risk of changes in value because of changes in interest rates, and have an original maturity date of three months or less. Investments In accordance with GASB Statement No. 40, Deposit and Investment Disclosures (Amendment of GASB No.3), certain disclosure requirements for Deposits and Investment Risks were made in the areas of interest rate risk and credit risk. The credit risk disclosures include the following components; overall credit risk, custodial credit risk and concentrations of credit risk. In addition, other disclosures are specified including use of certain methods to present deposits and investments, highly sensitive investments, credit quality at year-end and other disclosures. The District participates in an investment pool managed by the State of California known as the Local Agency Investment Fund (LAIF), which has invested a portion of the pooled funds in
Page 15 of 42

West Bay Sanitary District Notes to Financial Statements
June 30, 2017
structured notes and asset-backed securities. LAIF’s investments are subject to credit risk with the full faith and credit of the State of California collateralizing these investments. In addition, the structured notes and asset-backed securities are subject to market risk as to change in interest rates. Investments are recorded at fair value in accordance with GASB Statement No. 72, Fair Value Measurement and Application. Accordingly, the change in fair value of investments is recognized as an increase or decrease to investment assets and investment income. This statement changed the definition of fair value and is effective for periods beginning after June 15, 2015. The following is a summary of the definition of fair value: Fair value is defined as the price that would be received to sell an asset or paid to transfer a liability in an orderly transaction. In determining this amount, three valuation techniques are available:
Market approach - This approach uses prices generated for identical or similar assets or liabilities. The most common example is an investment in a public security traded in an active exchange such as the NYSE.
Cost approach - This technique determines the amount required to replace the current asset.
This approach may be ideal for valuing donations of capital assets or historical treasures.
Income approach - This approach converts future amounts (such as cash flows) into a current discounted amount.
Each of these valuation techniques requires inputs to calculate a fair value. Observable inputs have been maximized in fair value measures, and unobservable inputs have been minimized. Receivables Receivables include amounts due from collection services and other assessments or resources. All receivables are current and reported net of an allowance for uncollectible accounts as applicable. The allowance for uncollectible accounts was zero as of June 30, 2017. Capital Assets Property, plant and equipment contributed to the District are stated at estimated fair value at the time of contribution. District policy has set the capitalization threshold for reporting capital assets at $5,000 if an asset has an estimated useful life in excess of one year. Depreciation is computed using the straight-line method over the estimated useful lives of the assets. The purpose of depreciation is to spread the cost of plant and equipment equitably among all customers over the life of these assets, so that each customer's bill includes a pro rata share of the cost of these assets. The amount charged to depreciation expense each year represents that year's pro rata share of plant and equipment cost. Depreciation of all plant and equipment in service is charged as an expense against operations each year and the total amount of depreciation taken over the years, called accumulated depreciation, is reported on the statement of net position as a reduction in the book value of the capital assets.
Page 16 of 42

West Bay Sanitary District Notes to Financial Statements
June 30, 2017
The District has assigned the useful lives listed below to plant and equipment:
Pump Stations 5-30 years Fleet 5-10 years Plant and administration facilities 3-10 years Buildings 10-30 years Flow equalization facilities 10-30 years Subsurface lines 10-50 years
Compensated Absences Compensated absences include vacation leave. Vested or accumulated vacation leave is recorded as an expense and liability as the benefits accrue to the employees. Pensions For purposes of measuring the net pension liability and deferred outflows/inflows of resources related to pensions, and pension expense, information about the fiduciary net position of the District’s California Public Employees’ Retirement System (CalPERS) plan (the Plan) and additions to/deductions from the Plan’s fiduciary net position have been determined on the same basis as they are reported by CalPERS. Accounting Estimates The preparation of the financial statements in conformity with accounting principles generally accepted in the United States of America requires management to make estimates and assumptions that affect the amounts reported in the financial statements and accompanying notes. Subsequent Events Management has reviewed subsequent events and transactions that occurred after the date of the financial statements through the date the financial statements were issued. The financial statements include all events or transactions, including estimates, required to be recognized in accordance with generally accepted accounting principles. Management has determined that there are no non-recognized subsequent events that require additional disclosure. Implemented New Accounting Pronouncements GASB Statement No. 77, Tax Abatement Disclosures - Effective date: the requirements of this Statement are effective for reporting periods beginning after December 15, 2015 (earlier application was encouraged and was applied at the District).
Page 17 of 42

West Bay Sanitary District Notes to Financial Statements
June 30, 2017
This Statement requires governments that enter into tax abatement agreements to disclose the following information about the agreements:
Brief descriptive information, such as the tax being abated, the District under which tax abatements are provided, eligibility criteria, the mechanism by which taxes are abated, provisions for recapturing abated taxes, and the types of commitments made by tax abatement recipients
The gross dollar amount of taxes abated during the period Commitments made by a government, other than to abate taxes, as part of a tax abatement
agreement. The implementation of this statement did not have a significant impact on the District’s financial statements and did not result in any prior period restatements or adjustments. GASB Statement No. 78, Pensions Provided through Certain Multiple-Employer Defined Benefit Pension Plans - The objective of this Statement is to address a practice issue regarding the scope and applicability of GASB Statement No. 68, Accounting and Financial Reporting for Pensions. This issue is associated with pensions provided through certain multiple-employer defined benefit pension plans and to state or local governmental employers whose employees are provided with such pensions. Prior to the issuance of this GASB 78, the requirements of GASB 68 applied to the financial statements of all state and local governmental employers whose employees are provided with pensions through pension plans that are administered through trusts that meet the criteria in paragraph 4 of that statement. GASB 78 amends the scope and applicability of GASB 68 to exclude pensions provided to employees of state or local governmental employers through a cost-sharing multiple-employer defined benefit pension plan that (1) is not a state or local governmental pension plan, (2) is used to provide defined benefit pensions both to employees of state or local governmental employers and to employees of employers that are not state or local governmental employers, and (3) has no predominant state or local governmental employer (either individually or collectively with other state or local governmental employers that provide pensions through the pension plan). This Statement establishes requirements for recognition and measurement of pension expense, expenditures, and liabilities; note disclosures; and required supplementary information for pensions that have the characteristics described above. The implementation of this statement did not have a significant impact on the District’s financial statements and did not result in any prior period restatements or adjustments. Upcoming New Accounting Pronouncements GASB Statement No. 75, Accounting and Financial Reporting for Postemployment Benefits Other Than Pensions - The provisions in Statement 75 are effective for fiscal years beginning after June 15, 2017. The primary objective of this Statement is to improve accounting and financial reporting by state and local governments for postemployment benefits other than pensions (other postemployment benefits or OPEB). It also improves information provided by state and local
Page 18 of 42
West Bay Sanitary District Notes to Financial Statements
June 30, 2017
governmental employers about financial support for OPEB that is provided by other entities. This Statement replaces the requirements of Statements No. 45, Accounting and Financial Reporting by Employers for Postemployment Benefits Other Than Pensions, as amended, and No. 57, OPEB Measurements by Agent Employers and Agent Multiple-Employer Plans, for OPEB. Statement No. 74, Financial Reporting for Postemployment Benefit Plans Other Than Pension Plans, establishes new accounting and financial reporting requirements for OPEB plans. The scope of this Statement addresses accounting and financial reporting for OPEB that is provided to the employees of state and local governmental employers. This Statement establishes standards for recognizing and measuring liabilities, deferred outflows of resources, deferred inflows of resources, and expense/expenditures. For defined benefit OPEB, this Statement identifies the methods and assumptions that are required to be used to project benefit payments, discount projected benefit payments to their actuarial present value, and attribute that present value to periods of employee service. Note disclosure and required supplementary information requirements about defined benefit OPEB also are addressed. In addition, this Statement details the recognition and disclosure requirements for employers with payables to defined benefit OPEB plans that are administered through trusts that meet the specified criteria and for employers whose employees are provided with defined contribution OPEB. This Statement also addresses certain circumstances in which a nonemployer entity provides financial support for OPEB of employees of another entity. In this Statement, distinctions are made regarding the particular requirements depending upon whether the OPEB plans through which the benefits are provided are administered through trusts that meet the following criteria:
Contributions from employers and nonemployer contributing entities to the OPEB plan and earnings on those contributions are irrevocable.
OPEB plan assets are dedicated to providing OPEB to plan members in accordance with the benefit terms.
OPEB plan assets are legally protected from the creditors of employers, nonemployer contributing entities, the OPEB plan administrator, and the plan members.
The District is in the process of determining the impact this statement will have on the financial statements. GASB Statement No. 81, Irrevocable Split-Interest Agreements - The objective of this Statement is to improve accounting and financial reporting for irrevocable split-interest agreements by providing recognition and measurement guidance for situations in which a government is a beneficiary of the agreement. Split-interest agreements are a type of giving agreement used by donors to provide resources to two or more beneficiaries, including governments. Split-interest agreements can be created through trusts—or other legally enforceable agreements with characteristics that are equivalent to split-interest agreements—in which a donor transfers resources to an intermediary to hold and administer for the benefit of a government and at least one other beneficiary. Examples of these types of agreements include charitable lead trusts, charitable remainder trusts, and life-interests in real estate.
Page 19 of 42

West Bay Sanitary District Notes to Financial Statements
June 30, 2017
This Statement requires that a government that receives resources pursuant to an irrevocable split-interest agreement recognize assets, liabilities, and deferred inflows of resources at the inception of the agreement. Furthermore, this Statement requires that a government recognize assets representing its beneficial interests in irrevocable split-interest agreements that are administered by a third party, if the government controls the present service capacity of the beneficial interests. This Statement requires that a government recognize revenue when the resources become applicable to the reporting period. The requirements of this Statement are effective for financial statements for periods beginning after December 15, 2016, and should be applied retroactively. Earlier application is encouraged. The District doesn’t believe this statement will have a significant impact on the District’s financial statements. GASB Statement No. 82, Pension Issues - an amendment of GASB Statements No. 67, No. 68, and No. 73 - The objective of this Statement is to address certain issues that have been raised with respect to Statements No. 67, Financial Reporting for Pension Plans, No. 68, Accounting and Financial Reporting for Pensions, and No. 73, Accounting and Financial Reporting for Pensions and Related Assets That Are Not within the Scope of GASB Statement 68, and Amendments to Certain Provisions of GASB Statements 67 and 68. Specifically, this Statement addresses issues regarding (1) the presentation of payroll-related measures in required supplementary information, (2) the selection of assumptions and the treatment of deviations from the guidance in an Actuarial Standard of Practice for financial reporting purposes, and (3) the classification of payments made by employers to satisfy employee (plan member) contribution requirements. The requirements of this Statement are effective for reporting periods beginning after June 15, 2016, except for the requirements of GASB 82 for selection of assumptions in a circumstance in which an employer’s pension liability is measured as of a date other than the employer’s most recent fiscal year-end. In that circumstance, the requirements for the selection of assumptions are effective for that employer in the first reporting period in which the measurement date of the pension liability is on or after June 15, 2017. Earlier application is encouraged. The District doesn’t believe this statement will have a significant impact on the District’s financial statements. GASB Statement No. 83, Certain Asset Retirement Obligations - This Statement addresses accounting and financial reporting for certain asset retirement obligations (AROs). An ARO is a legally enforceable liability associated with the retirement of a tangible capital asset. A government that has legal obligations to perform future asset retirement activities related to its tangible capital assets should recognize a liability based on the guidance in this Statement. The requirements of this Statement are effective for financial statements for periods beginning after June 15, 2018. Earlier application is encouraged. The District doesn’t believe this statement will have a significant impact on the District’s financial statements. GASB Statement No. 84, Fiduciary Activities - The objective of this Statement is to improve guidance regarding the identification of fiduciary activities for accounting and financial reporting purposes and how those activities should be reported. This Statement establishes criteria for identifying fiduciary activities of all state and local governments. The focus of the criteria generally is on (1) whether a government is controlling the assets of the fiduciary activity and (2) the beneficiaries with whom a fiduciary relationship exists.
Page 20 of 42

West Bay Sanitary District Notes to Financial Statements
June 30, 2017
Separate criteria are included to identify fiduciary component units and postemployment benefit arrangements that are fiduciary activities. The requirements of this Statement are effective for financial statements for periods beginning after December 15, 2018. Earlier application is encouraged. The District doesn’t believe this statement will have a significant impact on the District’s financial statements. GASB Statement No. 86, Certain Debt Extinguishment Issues - The primary objective of this Statement is to improve consistency in accounting and financial reporting for in-substance defeasance of debt by providing guidance for transactions in which cash and other monetary assets acquired with only existing resources—resources other than the proceeds of refunding debt—are placed in an irrevocable trust for the sole purpose of extinguishing debt. This Statement also improves accounting and financial reporting for prepaid insurance on debt that is extinguished and notes to financial statements for debt that is defeased in substance. The requirements of this Statement are effective for financial statements for periods beginning after June 15, 2017. Earlier application is encouraged. The District doesn’t believe this statement will have a significant impact on the District’s financial statements. NOTE 3 - CASH AND INVESTMENTS The District’s cash and investments consisted of the following as of June 30, 2017 and 2016:
Cash Deposits As of June 30, 2017, the District’s cash deposits exceeded the Federal Deposit Insurance Corporation ("FDIC") insured limits by $1,865,413, but had little exposure since they were collateralized as noted in the Collateral and Categorization Requirements disclosure below. Bank balances are insured up to $250,000 per bank by FDIC. Collateral and Categorization Requirements The California Government Code requires California banks and savings and loan associations to secure an agency’s deposits by pledging government securities as collateral. The market value of pledged securities must equal at least 110% of an agency’s deposits. California law also allows financial institutions to secure an agency’s deposits by pledging first trust deed mortgage notes having a value of at least 150% of an agency’s total deposits.
Fair Value 12 Months 13 - 24 25 - 60 More Than Fair ValueRating June 30, 2017 or Less Months Months 60 Months June 30, 2016
Bank of the West Investments:Municipal Bonds AA+/AA3 2,443,216$ 1,042,561$ 705,019$ 645,765$ 49,871$ 5.29% 2,028,778$ Corporate Bonds BBB/A+ 7,684,388 3,385,624 1,462,165 2,836,599 - 16.63% 5,400,745 US Agency Obligations Govt 15,903,477 5,061,707 3,353,912 7,455,155 32,703 34.41% 10,804,260
Total Bank of West Investments AAA 26,031,081 9,489,892 5,521,096 10,937,519 82,574 56.33% 18,233,783 Cash and Cash Equivalents:Cash on hand and in banks N/A 2,084,503 2,084,503 - - - 4.51% 1,484,587 Money Market N/A 13,704,414 13,704,414 - - - 29.66% 17,696,834 Bank of the West Cash Equivalents N/A 1,361,849 1,361,849 - - - 2.95% 240,002 LAIF N/A 3,029,837 3,029,837 - - - 6.56% 1,020,943 Petty Cash N/A 600 600 - - - 0.00% 600
Total Cash and Cash Equivalents 20,181,203 20,181,203 - - - 43.67% 20,442,966
Total Cash and Investments 46,212,284$ 29,671,095$ 5,521,096$ 10,937,519$ 82,574$ 100.00% 38,676,749$
DescriptionConcen-trations
Maturities
Page 21 of 42

West Bay Sanitary District Notes to Financial Statements
June 30, 2017
Investment Policy The District's investment guidelines as defined by its written investment policy were approved by the Board of Directors. Implementation and direction is established by an internal finance committee. Monthly, the Board ratifies the investments that have been made. The District’s investment policy follows the California Government Code which authorizes the District to invest in the following:
Fair Value Measurements GASB 72 established a hierarchy of inputs to the valuation techniques above. This hierarchy has three levels:
Level 1 inputs are quoted prices in active markets for identical assets or liabilities. Level 2 inputs are quoted market prices for similar assets or liabilities, quoted prices for
identical or similar assets or liabilities in markets that are not active, or other than quoted prices that are not observable
Level 3 inputs are unobservable inputs, such as a property valuation or an appraisal. All of the Districts investments were valued using Level 1/2 inputs as noted above. Local Agency Investment Fund LAIF allows local agencies such as the District to participate in a Pooled Money Investment Account managed by the State Treasurer Office and overseen by the Pooled Money Investment Board and State Treasurer investment committee. A Local District Investment Advisory Board oversees LAIF. The investments with LAIF are not classified for credit risk due to their diverse nature and are stated at cost, which approximates fair value. The total amount invested by all public agencies in LAIF, as of June
Maximum Maximum Maximum Total of Investment in
Authorized Investment Type Maturity (1) Portfolio Anyone IssuerLocal Agency Bonds 5 years None NoneU.S. Treasury Obligations 5 years None NoneU.S. Agency Securities 5 years None NoneBanker's Acceptances 180 days 40% 30%Commercial Paper 270 days 25% 10%Negotiable Certificates of Deposit 5 years 30% NoneRepurchase Agreements 1 year 20% NoneReverse Repurchase Agreements 92 days 20% NoneMedium-Term Notes 5 years 30% NoneMutual Funds N/A 20% 10%Money Market Mutual Funds N/A 20% 10%Mortgage Pass-Through Securities 2 years 20% NoneCounty Pooled Investment Funds 1 year 20% NoneLocal Agency Investment Fund (LAIF) N/A None NoneJPA Pools (other investment pools) N/A None None
Page 22 of 42

West Bay Sanitary District Notes to Financial Statements
June 30, 2017
30, 2017, was approximately $77.6 billion of that amount, 99.12% was invested in non-derivative financial products and .88% was invested in structured notes and asset-backed securities. The average maturity for the investment in LAIF was 194 days. Risk Disclosures Limitations as they relate to interest rate risk, credit risk, and concentration of credit risk are described below: Interest Rate Risk - Interest rate risk is the risk that changes in market interest rates will adversely
affect the fair value of an investment. Generally, the longer the maturity of an investment, the greater the sensitivity of its fair value to the changes in market interest rates. In order to limit loss exposure due to Interest Rate Risk, the investment policy limits the length of maturity of investments
Credit Risk - Credit risk is the risk of loss due to the failure of the security issuer. This is
measured by the assignment of a rating by a nationally recognized statistical rating organization. In order to limit loss exposure due to Credit Risk, the investment policy limits purchases of investments to those rated A-1 by Standard & Poor's or P-1 by Moody's Investors Service.
Custodial Credit Risk - Custodial credit risk is the risk that in the event of a bank failure, the
District’s deposits may not be returned to it. Or, in the case of investments, the risk of loss of the investment due failure, impairment or malfeasance of the third party whose name in which the investment is held and who has physical possession of the instrument. In order to limit loss exposure due to Custodial Credit Risk, the investment policy requires all securities be received and delivered using the standard delivery versus payment (DVP) procedure, and all securities be held by a third party bank or trust department under the terms of a custody or trustee agreement. None of the District's investments were subject to custodial credit risk.
Concentration of Credit Risk - See the chart above for the District’s limitations on the amount
that can be invested in any one issuer. NOTE 4 - INVESTMENT IN SILICON VALLEY CLEAN WATER Silicon Valley Clean Water (SVCW), formerly the South Bayside System Authority, was created in 1975, under a Joint Exercise of Powers Agreement, to construct and operate a sewage treatment facility at Redwood Shores for the District and the cities of Belmont, San Carlos, and Redwood City. At June 30, 2017 and 2016, the District had approximately 17% equity interest in SVCW, which is reported using the equity method of accounting. The Districts investment in SVCW at June 30, 2017 and 2016 was $13,589,774 and $13,261,248, respectively, as reflected on the statement of net position. The change in the investment for the years ended June 30, 2017 and 2016 was an increase of $328,526 and a decrease of $3,667,108, respectively, as reflected in the statement of revenues, expenses and changes in net position. The 2017 decrease in the District’s equity share was attributed to the fact that not all members share in the long-term debt, only the net position, or equity, of the participating members decreases upon the issuance of new debt, while the “non-debt” member’s net position increases. In addition, the non-debt members contribute more cash into the JPA than other members to cover their share of capital improvements, which increases the equity share of non-debt
Page 23 of 42

West Bay Sanitary District Notes to Financial Statements
June 30, 2017
members and decreases the share of other participating agencies. SVCW's governing commission consists of four members, one appointed from each of the four participating agencies. SVCW’s condensed audited financial information is presented below for the year ended June 30, 2017, (most recent information available):
NOTE 5 - CAPITAL ASSETS (PROPERTY, PLANT AND EQUIPMENT) The District’s capital assets consisted of the following as of June 30, 2017:
Balance BalanceDescription June 30, 2016 Additions Deletions Transfers June 30, 2017Non-depreciable Capital Assets:Land 44,467$ -$ -$ -$ 44,467$ Construction in progress 4,372,957 5,626,783 - (5,696,788) 4,302,952
Total non-depreciable capital assets 4,417,424 5,626,783 - (5,696,788) 4,347,419 Depreciable Capital Assets:Pump stations 5,317,773 56,591 (377,308) 2,569,983 7,567,039 Fleet 2,368,042 100,498 (39,745) - 2,428,795 Plant and administration facilities 1,442,234 183,716 (25,008) - 1,600,942 Buildings 2,969,680 12,213 - - 2,981,893 Flow equalization facilities 2,901,072 - - - 2,901,072 Subsurface lines 49,428,086 140,927 - 3,126,805 52,695,818 Total depreciable capital assets 64,426,887 493,945 (442,061) 5,696,788 70,175,559 Less accumulated depreciation for:
Pump stations (2,222,790) (121,339) 377,308 - (1,966,821) Fleet (1,397,253) (176,339) 39,745 - (1,533,847) Plant and administration facilities (1,190,136) (62,048) 25,008 - (1,227,176) Buildings (1,008,954) (91,179) - - (1,100,133) Flow equalization facilities (2,263,207) (90,184) - - (2,353,391) Subsurface lines (16,847,066) (1,111,549) - - (17,958,615)
Total accumulated depreciation (24,929,406) (1,652,638) 442,061 - (26,139,983) Total depreciable capital assets - net 39,497,481 (1,158,693) - 5,696,788 44,035,576
Total capital assets - net 43,914,905$ 4,468,090$ -$ -$ 48,382,995$
June 30, 2017Total Assets 304,774,429$ Deferred Outflows of Resources 6,969,339 Total Liabilities 225,872,024 Deferred Inflows of Resources 5,832,072 Total Equity 80,039,672 Total Revenues 41,887,031 Total Expenditures 41,011,248
Page 24 of 42
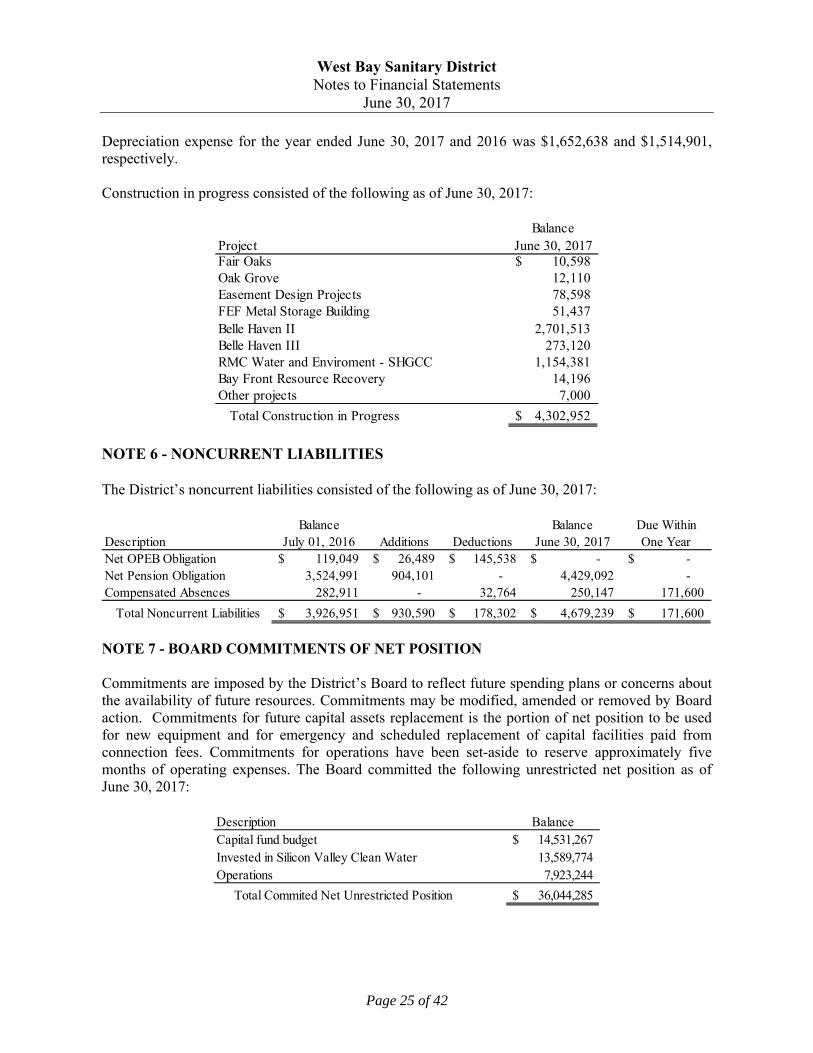
West Bay Sanitary District Notes to Financial Statements
June 30, 2017
Depreciation expense for the year ended June 30, 2017 and 2016 was $1,652,638 and $1,514,901, respectively. Construction in progress consisted of the following as of June 30, 2017:
BalanceProject June 30, 2017Fair Oaks 10,598$ Oak Grove 12,110 Easement Design Projects 78,598 FEF Metal Storage Building 51,437 Belle Haven II 2,701,513 Belle Haven III 273,120 RMC Water and Enviroment - SHGCC 1,154,381 Bay Front Resource Recovery 14,196 Other projects 7,000
Total Construction in Progress 4,302,952$
NOTE 6 - NONCURRENT LIABILITIES The District’s noncurrent liabilities consisted of the following as of June 30, 2017:
NOTE 7 - BOARD COMMITMENTS OF NET POSITION Commitments are imposed by the District’s Board to reflect future spending plans or concerns about the availability of future resources. Commitments may be modified, amended or removed by Board action. Commitments for future capital assets replacement is the portion of net position to be used for new equipment and for emergency and scheduled replacement of capital facilities paid from connection fees. Commitments for operations have been set-aside to reserve approximately five months of operating expenses. The Board committed the following unrestricted net position as of June 30, 2017:
Description BalanceCapital fund budget 14,531,267$ Invested in Silicon Valley Clean Water 13,589,774Operations 7,923,244
Total Commited Net Unrestricted Position 36,044,285$
Balance Balance Due WithinDescription July 01, 2016 Additions Deductions June 30, 2017 One YearNet OPEB Obligation 119,049$ 26,489$ 145,538$ -$ -$ Net Pension Obligation 3,524,991 904,101 - 4,429,092 - Compensated Absences 282,911 - 32,764 250,147 171,600
Total Noncurrent Liabilities 3,926,951$ 930,590$ 178,302$ 4,679,239$ 171,600$
Page 25 of 42

West Bay Sanitary District Notes to Financial Statements
June 30, 2017
NOTE 8 - DEFERRED COMPENSATION PLAN District employees may defer a portion of their compensation under a District-sponsored Deferred Compensation Plan created in accordance with Internal Revenue Code Section 457. Under this Plan, participants are not taxed on the deferred portion of their compensation until distributed to them; distributions may be made only at termination, retirement, death or in an emergency defined by the Plan. The laws governing deferred compensation plan assets require plan assets to be held by a Trust for the exclusive benefits of plan participants and their beneficiaries. Since the assets held under these plans are not the District's property and are not subject to District control, they are not included in these financial statements. NOTE 9 - RISK MANAGEMENT The District joined together with other sanitary districts in the State to form California Sanitation Risk Management Authority (CSRMA), a public entity risk pool currently operating as a common risk management and. insurance program. The District is insured for the costs of claims through CSRMA and commercial insurance carriers for the following:
The District has not incurred a claim that has exceeded its insurance coverage limits in any of the last three years. Audited condensed financial information for CSRMA is presented below for the year ended June 30, 2016 (most recent information available):
June 30, 2017Total Assets 28,336,567$
Total Liabilities 16,735,609
Total Equity 11,600,958
Total Revenues 11,843,583
Total Expenditures 10,946,085
Type of Coverage Limits DeductiblesGeneral Liability 15,500,000 25,000 Employment Practices Liability 15,500,000 25,000 Worker's Compensation 750,000 NoneExcess Worker's Compensation Liability Statutory Limits NoneMobile Equipment 767,005 2,000 Special Form Property 1,003,385 5,000 Public Official Bond 100,000 None
Page 26 of 42
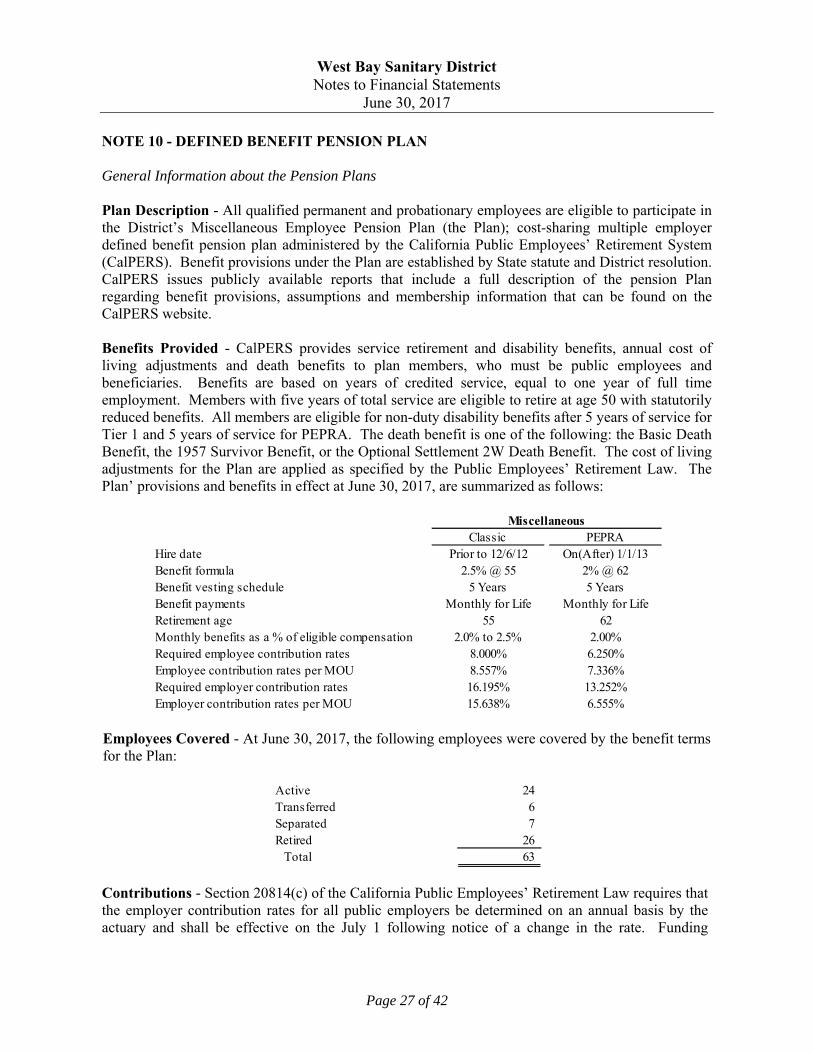
West Bay Sanitary District Notes to Financial Statements
June 30, 2017
NOTE 10 - DEFINED BENEFIT PENSION PLAN
General Information about the Pension Plans Plan Description - All qualified permanent and probationary employees are eligible to participate in the District’s Miscellaneous Employee Pension Plan (the Plan); cost-sharing multiple employer defined benefit pension plan administered by the California Public Employees’ Retirement System (CalPERS). Benefit provisions under the Plan are established by State statute and District resolution. CalPERS issues publicly available reports that include a full description of the pension Plan regarding benefit provisions, assumptions and membership information that can be found on the CalPERS website. Benefits Provided - CalPERS provides service retirement and disability benefits, annual cost of living adjustments and death benefits to plan members, who must be public employees and beneficiaries. Benefits are based on years of credited service, equal to one year of full time employment. Members with five years of total service are eligible to retire at age 50 with statutorily reduced benefits. All members are eligible for non-duty disability benefits after 5 years of service for Tier 1 and 5 years of service for PEPRA. The death benefit is one of the following: the Basic Death Benefit, the 1957 Survivor Benefit, or the Optional Settlement 2W Death Benefit. The cost of living adjustments for the Plan are applied as specified by the Public Employees’ Retirement Law. The Plan’ provisions and benefits in effect at June 30, 2017, are summarized as follows:
Employees Covered - At June 30, 2017, the following employees were covered by the benefit terms for the Plan:
Contributions - Section 20814(c) of the California Public Employees’ Retirement Law requires that the employer contribution rates for all public employers be determined on an annual basis by the actuary and shall be effective on the July 1 following notice of a change in the rate. Funding
Classic PEPRAHire date Prior to 12/6/12 On(After) 1/1/13Benefit formula 2.5% @ 55 2% @ 62Benefit vesting schedule 5 Years 5 YearsBenefit payments Monthly for Life Monthly for LifeRetirement age 55 62Monthly benefits as a % of eligible compensation 2.0% to 2.5% 2.00%Required employee contribution rates 8.000% 6.250%Employee contribution rates per MOU 8.557% 7.336%Required employer contribution rates 16.195% 13.252%Employer contribution rates per MOU 15.638% 6.555%
Miscellaneous
Active 24 Transferred 6 Separated 7 Retired 26
Total 63
Page 27 of 42

West Bay Sanitary District Notes to Financial Statements
June 30, 2017
contributions for the Plan are determined annually on an actuarial basis as of June 30 by CalPERS. The actuarially determined rates are the estimated amount necessary to finance the costs of benefits earned by employees during the year, with an additional amount to finance any unfunded accrued liability. The District is required to contribute the difference between the actuarially determined rate and the contribution rate of employees. For the year ended June 30, 2017, the contributions recognized as part of pension expense for the Plan were as follows:
During the fiscal year, the Classic employees contributed 8.557% and the PEPRA employees contributed 7.336% of their salary toward the combined required contribution of 24.195% for the Classic plan and 13.891% for PEPRA, leaving the District’s total contribution at 15.638% for the Classic plan and 6.555% for PEPRA in 2017. Total contributions made by employees over the last three fiscal years ended June 30, 2017, 2016 and 2015 were $230,583, $184,846 and $142,082, respectively. Pension Liabilities, Pension Expenses and Deferred Outflows/Inflows of Resources Related to Pensions As of June 30, 2017, the District reported net pension liabilities for its proportionate shares of the net pension liability of $4,429,092. The District’s net pension liability for the Plan is measured as the proportionate share of the net pension liability. The net pension liability of the Plan are measured as of June 30, 2016, and the total pension liability for the Plan used to calculate the net pension liability was determined by an actuarial valuation as of June 30, 2015 rolled forward to June 30, 2016 using standard update procedures. The District’s proportion of the net pension liability was based on a projection of the District’s long-term share of contributions to the pension Plan relative to the projected contributions of all participating employers, actuarially determined. The District’s proportionate share of the net pension liability for the Plan as of June 30, 2016 and 2017 was as follows:
For the year ended June 30, 2017, the District recognized pension expense of $1,053,529.
June 30, 2017Contributions - employer $ 399,280 Contributions - employee 184,670
Total $ 583,950
Proportion of Net Pension Liability
June 30, 2016 0.1285%June 30, 2017 0.1275%
Change in Proportions -0.0010%
Page 28 of 42

West Bay Sanitary District Notes to Financial Statements
June 30, 2017
At June 30, 2017, the District reported deferred outflows of resources and deferred inflows of resources related to pensions from the following sources:
The District reported $387,500 as deferred outflows of resources related to contributions subsequent to the measurement date that will be recognized as a reduction of the net pension liability in the year ended June 30, 2018. Other amounts reported as deferred outflows of resources and deferred inflows of resources related to pensions will be recognized as pension expense as follows:
Deferred Outflows of Resources
Deferred Inflows of Resources
387,500$ -$
Changes in assumptions - (131,736) 10,734 -
- (276,928)
685,643 -
1,083,877$ (408,664)$
proportionate share of contributionsNet differences between projected and actual earnings
on plan investments
Total
Pension contributions subsequent to measurement date
Differences between expected and actual experiencesChange in employer's proportion and differences between
the employer’s contributions and the employer’s
Fiscal Year Ending:
Deferred Outflows/(inflows)
of Resources2018 (69,624)$ 2019 (56,534) 2020 236,280 2021 177,591
Total 287,713$
Page 29 of 42

West Bay Sanitary District Notes to Financial Statements
June 30, 2017
Actuarial Assumptions - The total pension liabilities in the June 30, 2015 actuarial valuations were determined using the following actuarial assumptions:
Discount Rate - The discount rate used to measure the total pension liability was 7.65 percent for the Plan. To determine whether the municipal bond rate should be used in the calculation of a discount rate for the Plan, CalPERS stress tested plans that would most likely result in a discount rate that would be different from the actuarially assumed discount rate. Based on the testing, none of the tested plans run out of assets. Therefore, the current 7.65 percent discount rate is adequate and the use of the municipal bond rate calculation is not necessary. The long term expected discount rate of 7.65 percent will be applied to all plans in the Public Employees Retirement Fund (PERF). The stress test results are presented in a detailed report that can be obtained from the CalPERS website. According to Paragraph 30 of Statement 68, the long-term discount rate should be determined without reduction for pension plan administrative expense. The 7.50 percent investment return assumption used in this accounting valuation is net of administrative expenses. Administrative expenses are assumed to be 15 basis points. An investment return excluding administrative expenses would have been 7.65 percent. Using this lower discount rate has resulted in a slightly higher Total Pension Liability and Net Pension Liability. CalPERS checked the materiality threshold for the difference in calculation and did not find it to be a material difference. CalPERS is scheduled to review all actuarial assumptions as part of its regular Asset Liability Management (ALM) review cycle that is scheduled to be completed in February 2018. Any changes to the discount rate will require Board action and proper stakeholder outreach. For these reasons, CalPERS expects to continue using a discount rate net of administrative expenses for GASB 67 and 68 calculations through at least the 2017-18 fiscal year. CalPERS will continue to check the materiality of the difference in calculation until such time as we have changed our methodology. The long-term expected rate of return on pension plan investments was determined using a building-block method in which best-estimate ranges of expected future real rates of return (expected returns, net of pension plan investment expense and inflation) are developed for each major asset class.
Valuation Date June 30, 2015Measurement Date June 30, 2016Actuarial Cost Method Entry-Age Normal
Cost Method
Actuarial Assumptions:Discount Rate 7.65%Inflation 2.75%Payroll Growth 3.00%Projected Salary Increase (1)Investment Rate of Return 7.5% (2)Mortality (3)
(3) Derived using CalPERS' membership data for all funds
(1) Varies by age and service(2) Net of pension plan investment expenses, including inflation
Page 30 of 42

West Bay Sanitary District Notes to Financial Statements
June 30, 2017
In determining the long-term expected rate of return, CalPERS took into account both short-term and long-term market return expectations as well as the expected pension fund cash flows. Using historical returns of all the funds’ asset classes, expected compound returns were calculated over the short-term (first 10 years) and the long-term (11-60 years) using a building-block approach. Using the expected nominal returns for both short-term and long-term, the present value of benefits was calculated for each fund. The expected rate of return was set by calculating the single equivalent expected return that arrived at the same present value of benefits for cash flows as the one calculated using both short-term and long-term returns. The expected rate of return was then set equivalent to the single equivalent rate calculated above and rounded down to the nearest one quarter of one percent. The table below reflects the long-term expected real rate of return by asset class. The rate of return was calculated using the capital market assumptions applied to determine the discount rate and asset allocation. These rates of return are net of administrative expenses.
Sensitivity of the Proportionate Share of the Net Pension Liability to Changes in the Discount Rate - The following presents the District’s proportionate share of the net pension liability for the Plan, calculated using the discount rate for the Plan, as well as what the District’s proportionate share of the net pension liability would be if it were calculated using a discount rate that is 1-percentage point lower or 1-percentage point higher than the current rate:
Pension Plan Fiduciary Net Position - Detailed information about each pension plan’s fiduciary net position is available in the separately issued CalPERS financial reports.
NewStrategic Real Return Real Return
Asset Class Allocation Years 1 - 10 (a) Years 11+ (b)
Global Equity 51.00% 5.25% 5.71%Global Fixed Income 20.00% 0.99% 2.43%Inflation Sensitive 6.00% 0.45% 3.36%Private Equity 10.00% 6.83% 6.95%Real Estate 10.00% 4.50% 5.13%Infrastructure and Forestland 2.00% 4.50% 5.09%Liquidity 1.00% -0.55% -1.05%
Total 100.00%
(b) An expected inflation of 3.0% used for this period.(a) An expected inflation of 2.5% used for this period.
1% Decrease 6.65%Net Pension Liability $ 6,686,473
Current Discount Rate 7.65%Net Pension Liability $ 4,429,092
1% Increase 8.65%Net Pension Liability $ 2,563,477
Page 31 of 42

West Bay Sanitary District Notes to Financial Statements
June 30, 2017
NOTE 11 - OTHER POST EMPLOYMENT BENEFITS Plan Description The District's single employer defined benefit postemployment healthcare plan provides health care benefits to eligible retirees in accordance with a Board resolution. Eligible employees retiring at or after age 50 with a minimum of 5 years of service may opt to continue health care coverage, with a portion of the monthly premium paid for by the District. Coverage discontinues either at the request of the retiree or by defaulting on the employee portion of the premium. The District contracts with CalPERS to administer its retiree health benefit plan. A menu of benefit provisions as well as other requirements is established by State statute within the Public Employees' Retirement Law. The District chooses among the menu of benefit provisions and adopts certain benefit provisions by Board resolution. Funding Policy There is no statutory requirement for the District to prefund its OPEB obligation. The District has currently chosen to pay plan benefits on a pay-as-you-go basis. There are no employee contributions. For fiscal year ending June 30, 2017, the District paid $229,738 for retiree healthcare plan benefits and trust contributions. The Annual Required Contribution (ARC) is an amount actuarially determined in accordance with the parameters of GASB Statement 45. The ARC is equal to the normal cost plus a 30-year amortization of the unfunded actuarial liability. Annual OPEB Cost and Net OPEB Obligation The following table, based on the District’s actuarial valuation dated July 1, 2015, shows the components of the District’s annual OPEB cost for the year, the amount actually contributed to the plan, and changes in the District’s Net OPEB obligation:
Annual required contribution 27,198$ Interest on net OPEB obligation 5,952 Adjustment to annual required contribution (6,661) Annual OPEB cost (expense) 26,489 Contributions made (229,738) Increase in net OPEB obligation (203,249) Net OPEB obligation - beginning of year 119,049 Net OPEB obligation (asset) - end of year (84,200)$
Page 32 of 42

West Bay Sanitary District Notes to Financial Statements
June 30, 2017
The District’s annual OPEB cost, the percentage of annual OPEB cost contributed to the plan, and the net OPEB obligation for fiscal year ending June 30, 2017, are as follows:
Fiscal OPEB
Year Annual OPEB Obligation
Ended OPEB Cost Cost Contributed (Asset)
June 30, 2015 25,900$ 16.75% 99,221$
June 30, 2016 25,313 21.67% 119,049
June 30, 2017 26,489 867.30% (84,200) Actuarial valuations of an ongoing plan involve estimates of the value of expected benefit payments and assumptions about the probability of occurrence of events far into the future. Examples include assumptions about future employment, mortality, and the healthcare cost trend. Amounts determined regarding the funded status of the plan and the annual required contributions of the employer are subject to continual revision as actual results are compared with past expectations and new estimates are made about the future. The schedule of funding progress, presented as required supplementary information, presents multi-year trend information about whether the actuarial value of plan assets is increasing or decreasing over time relative to the actuarial accrued liabilities for benefits. Actuarial Methods and Assumptions Projections of benefits for financial reporting purposes are based on the substantive plan (the plan as understood by the employer and the plan members) and include the types of benefits provided at the time of each valuation and the historical pattern of sharing of benefit costs between the employer and plan members to that point. The actuarial methods and assumptions used are consistent with the long-term perspective of the calculations. In the July 1, 2015 actuarial valuation, the Projected Unit Credit actuarial cost method was used. The actuarial assumptions included a 5% investment rate of return, which is the expected long-term investment return on District investments, a 3% general inflation assumption, and an annual aggregate payroll increase rate of 3%. Required Supplementary Information
ActuarialAccrued UAAL as
Actuarial Liability Unfunded a PercentageActuarial Value of (AAL) AAL Funded Covered of CoveredValuation Assets Entry Age (UAAL) Ratio Payroll Payroll
Date (a) (b) (b-a) (a/b) (c) ((b-a/c))
3/1/2010 -$ 137,900$ 137,900$ 0.00% 1,952,200$ 7.06%
3/1/2013 -$ 186,100$ 186,100$ 0.00% 2,391,800$ 7.78%
7/1/2015 -$ 217,440$ 217,440$ 0.00% 2,846,000$ 7.64%
Schedule of Funding Progress - Postemployement Healthcare Plan
Page 33 of 42

West Bay Sanitary District Notes to Financial Statements
June 30, 2017
NOTE 12 - SHARON HEIGHTS GOLF AND COUNTRY CLUB COST SHARING PLAN The West Bay Sanitary District has an agreement with Sharon Heights Golf and Country Club (Club) to contribute toward the cost of the Facilities plan and the full cost incurred thereafter for the planning, design environmental review, permitting, construction and operation of a recycled water treatment facility on Club property. West Bay will receive a grant easement in perpetuity for the location of the recycled water treatment facility and West Bay will have ownership of the treatment facility and all the recycled water, with the Club’s right to receive recycled water. West Bay has received approval for a California Clean Water State Revolving Fund loan to Design/Build a recycled water treatment facility. The parties have a long-term agreement that establishes the terms and conditions of loan payments, easements, ownership of the facility, design criteria, and terms of operation and maintenance. Through June 30, 2017, total costs for consultants, attorneys, studies, applications and reports have totaled $1,414,145. The cost sharing breakdown for these expenditures is as follows:
West Bay Sanitary District $1,154,381 SHGCC (Club) $185,286 State Revolving Fund $74,477
NOTE 13 - COMMITMENTS AND CONTINGENCIES The District may be at risk to be a defendant in certain lawsuits which arise in the normal course of business. District management is of the opinion that the ultimate outcome of such matters will not have a significant effect on the financial position of the District.
Page 34 of 42

REQUIRED SUPPLEMENTARY INFORMATION
Page 35 of 42

2017 2016 2015
Contractually Required Contributions (Actuarially Determined) 387,500$ 399,280$ 368,713$
Contributions in Relation to Actuarially Determined Contributions 387,500 399,280 368,713
Contribution Deficiency (Excess) - - -
Covered Employee Payroll 2,765,233$ 2,544,628$ 2,411,343$
Contributions as a Percentage of Covered Payroll 14.01% 15.69% 15.29%
Notes to Schedule:
Valuation Date: June 30, 2015
Assumptions Used: Entry Age Method used for Actuarial Cost Method
Level Percentage of Payroll (Closed) Used Amortization Method
3.7 Years Remaining Amortization Period
Inflation Assumed at 2.75%
Investment Rate of Returns set at 7.5%
CalPERS mortality table using 20 years of membership data for all funds
** Fiscal year 2015 was the first year of implementation, therefore only three years are shown.
West Bay Sanitary District
Schedule of Pension Contributions - CalPERS
June 30, 2017
Page 36 of 42

2017 2016 2015
Proportion of Net Pension Liability 0.12750% 0.12849% 0.10822%
Proportionate Share of Net Pension Liability 4,429,092$ 3,524,991$ 2,674,755$
Covered Employee Payroll 2,765,233$ 2,544,628$ 2,411,343$
Proportionate Share of NPL
as a % of Covered Employee Payroll 160.17% 138.53% 110.92%
Plan's Fiduciary Net Position as a % of the TPL 73.58% 78.29% 83.03%
** Fiscal year 2015 was the first year of implementation, therefore only three years are shown.
West Bay Sanitary District
June 30, 2017
Schedule of Proportionate Share of Net Pension Liability
Page 37 of 42
SUPPLEMENTARY INFORMATION
Page 38 of 42

Budget Actual
Amounts (GAAP Basis) Variance
Operating Revenues:
Service charges 24,233,319$ 24,483,213$ 249,894$
Flow equalization uses 313,000 315,186 2,186
Permit and inspection fees and other services 50,000 210,870 160,870
Other operating revenues 415,887 567,616 151,729
Total operating revenues 25,012,206 25,576,885 564,679
Operating Expenses:
Sewage treatment 11,905,000 10,294,299 1,610,701
Sewage collection and general administration:
Salaries and benefits 4,850,661 5,231,091 (380,430)
Materials and supplies 448,195 335,092 113,103
Insurance 95,050 84,360 10,690
Contract services 393,000 283,662 109,338
Professional services 529,350 383,741 145,609
Repairs and maintenance 259,000 255,891 3,109
Utilities 148,000 129,147 18,853
Other operating expenses 301,530 257,021 44,509
Total sewage collection and general administration 7,024,786 6,960,005 64,781
Depreciation 1,600,000 1,652,638 (52,638)
Total operating expenses 20,529,786 18,906,942 1,622,844
Operating Income (Loss) 4,482,420 6,669,943 2,187,523
Nonoperating Revenues (Expenses):
Investment income 125,000 168,839 43,839
Increase (decrease) of equity in Silicon Valley Clean Water - 328,526 328,526
Other nonoperating expenses (21,000) - 21,000
Other nonoperating revenues 1,000 528,123 527,123
Total nonoperating revenues (expenses) 105,000 1,025,488 920,488
Income before contributions 4,587,420 7,695,431 3,108,011
Capital Contributions 50,000 1,912,132 1,862,132
Change in Net Position 4,637,420 9,607,563 4,970,143
Beginning Net Position 91,608,170 91,608,170 -
Ending Net Position 96,245,590$ 101,215,733$ 4,970,143$
West Bay Sanitary District
Budgetary Comparison Schedule
For the Fiscal Year Ended June 30, 2017
Page 39 of 42
INDEPENDENT AUDITOR’S REPORT IN ACCORDANCE WITH GOVERNMENT AUDITING STANDARDS
Page 40 of 42

1475 Saratoga Ave, Suite 180, San Jose, CA 95129 Tel: 408-217-8749 • E-Fax: 408-872-4159
[email protected] • www.cnallp.com
INDEPENDENT AUDITOR’S REPORT ON INTERNAL CONTROL OVER FINANCIAL REPORTING AND ON COMPLIANCE AND OTHER MATTERS BASED ON AN AUDIT
OF FINANCIAL STATEMENTS PERFORMED IN ACCORDANCE WITH GOVERNMENT AUDITING STANDARDS
To the Board of Directors West Bay Sanitary District We have audited, in accordance with auditing standards generally accepted in the United States of America and the standards applicable to financial audits contained in Government Auditing Standards issued by the Comptroller General of the United States, the financial statements of the West Bay Sanitary District (the “District”) as of and for the year ended June 30, 2017, and the related notes to the financial statements, which collectively comprise the District’s basic financial statements, and have issued our report thereon dated November 7, 2017. Internal Control over Financial Reporting Management is responsible for establishing and maintaining effective internal control over financial reporting. In planning and performing our audit of the financial statements, we considered the District’s internal control over financial reporting (internal control) to determine the audit procedures that are appropriate in the circumstances for the purpose of expressing our opinions on the financial statements, but not for the purpose of expressing an opinion on the effectiveness of the District’s internal control. Accordingly, we do not express an opinion on the effectiveness of the District’s internal control. A deficiency in internal control exists when the design or operation of a control does not allow management or employees in the normal course of performing their assigned functions, to prevent, or detect and correct misstatements on a timely basis. A material weakness is a deficiency, or a combination of deficiencies, in internal control, such that there is a reasonable possibility that a material misstatement of the entity’s financial statements will not be prevented, or detected and corrected on a timely basis. A significant deficiency is a deficiency, or a combination of deficiencies, in internal control that is less severe than a material weakness, yet important enough to merit attention by those charged with governance. Our consideration of internal control over financial reporting was for the limited purpose described in the first paragraph of this section and was not designed to identify all deficiencies in internal control over financial reporting that might be material weaknesses or significant deficiencies. Given these limitations, during our audit we did not identify any deficiencies in internal control over financial reporting that we consider to be material weaknesses. However, material weaknesses may exist that have not been identified. Compliance and Other Matters As part of obtaining reasonable assurance about whether the District’s financial statements are free of material misstatement, we performed tests of its compliance with certain provisions of laws, regulations, contracts, and grant agreements, noncompliance with which could have a direct and material effect on the determination of financial statement amounts. However, providing an opinion on compliance with those provisions was not an objective of our audit, and accordingly, we do not
Page 41 of 42

1475 Saratoga Ave, Suite 180, San Jose, CA 95129 Tel: 408-217-8749 • E-Fax: 408-872-4159
[email protected] • www.cnallp.com
express such an opinion. The results of our tests disclosed no instances of noncompliance or other matters that are required to be reported under Government Auditing Standards. Purpose of this Report The purpose of this report is solely to describe the scope of our testing of internal control and compliance and the results of that testing, and not to provide an opinion on the effectiveness of the entity’s internal control or on compliance. This report is an integral part of an audit performed in accordance with Government Auditing Standards in considering the entity’s internal control and compliance. Accordingly, this communication is not suitable for any other purpose.
November 7, 2017 San Jose, California
Page 42 of 42

[THIS PAGE INTENTIONALLY LEFT BLANK]

[THIS PAGE INTENTIONALLY LEFT BLANK]

[THIS PAGE INTENTIONALLY LEFT BLANK]


SIl
IcO
N VA
ll
Ey
cl
EA
N W
At
ER
(Sa
n Ma
te
o Co
un
ty, C
al
ifo
rn
ia) • 2018 Wa
St
eW
at
er r
ev
en
ue B
on
dS