
Sihyuk Choia,b, Timothy C. Davenporta
21
1 Supplementary Information Protonic Ceramic Electrochemical Cells for Hydrogen Production and Electricity Generation: Exceptional Reversibility, Stability, and Demonstrated Faradaic Efficiency Sihyuk Choi a,b , Timothy C. Davenport a , Sossina M. Haile* a a Materials Science and Engineering, Northwestern University, Evanston, IL, USA b Department of Mechanical Engineering, Kumoh National Institute of Technology, Gyeongbuk 39177, Republic of Korea correspondence to: [email protected] (S.M.H) This PDF file includes: Experimental Procedure Figures S1 to S12 Table S1 to S3 References 1-3 Electronic Supplementary Material (ESI) for Energy & Environmental Science. This journal is © The Royal Society of Chemistry 2018
Transcript of Sihyuk Choia,b, Timothy C. Davenporta

1
Supplementary Information
Protonic Ceramic Electrochemical Cells for Hydrogen Production
and Electricity Generation: Exceptional Reversibility, Stability,
and Demonstrated Faradaic Efficiency
Sihyuk Choia,b, Timothy C. Davenporta, Sossina M. Haile*a
a Materials Science and Engineering, Northwestern University, Evanston, IL, USAb Department of Mechanical Engineering, Kumoh National Institute of Technology,
Gyeongbuk 39177, Republic of Korea
correspondence to: [email protected] (S.M.H)
This PDF file includes:
Experimental Procedure
Figures S1 to S12
Table S1 to S3
References 1-3
Electronic Supplementary Material (ESI) for Energy & Environmental Science.This journal is © The Royal Society of Chemistry 2018

2
Experimental procedure
Air electrode preparation
Powders of PrBa0.5Sr0.5Co1.5Fe0.5O5+ (PBSCF), Sm0.5Sr0.5CoO3- (SSC), La0.6Sr0.4Co0.2Fe0.8O3-
(LSCF), and La0.8Sr0.2MnO3 (LSM) were synthesized via a variant of the Pechini process in
which nitrate precursors are dissolved in aqueous solution using citric acid and ethylene glycol
as complexing agents.1 The black char resulting from the gelation and drying steps was calcined
at 600 oC for 4 h to eliminate organic residue. The calcined powders were ball milled, then
sintered at 1150 oC for 12 h (PBSCF), 1200 oC for 12 h (SSC), 1200 oC for 12 h (LSCF), and
1450 oC for 5 h (LSM), to achieve single phase products as confirmed by X-ray diffraction
(XRD) (Scintag XDS2000, Cu Kα radiation, 40 kV, 20 mA).
Conventional cell preparation
The fuel electrode-supported cells with the configuration of NiO-
BZCYYb4411/BZCYYb4411/air electrode configuration were fabricated using a drop-coating
method. The composite fuel electrode was formed from in-house synthesized NiO and
BZCYYb4411 electrolyte powders, the former by the glycine nitrate process, and the latter by
typical solid state reaction method. For NiO synthesis, nickel nitrate (Sigma Aldrich) was
dissolved in distilled water and glycine (98.5%, Sigma Aldrich) was added in the solution in a
1:1 molar ratio. The solution was heated on a hot plate set at 350 oC to evaporate water, yielding
a viscous liquid. Fine NiO powders were obtained via a subsequent combustion reaction. The
resulting NiO powder was calcined at 800 oC for 4h in air. The BaZr0.4Ce0.4Y0.1Yb0.1O3
(BZCYYb4411) electrolyte powder was prepared with stoichiometric quantities of barium
carbonate (>99%, Sigma Aldrich), zirconium oxide (99.5%, Alfa Aesar), cerium oxide (99.9%,
Alfa Aesar) and the oxides of the dopants, yttrium oxide (99.9%, Alfa Aesar), and ytterbium
oxide (99.9%, Alfa Aesar). The mixture was first ball-milled for 24 h with yttria-stabilized
zirconia balls (Inframat Advanced Materials, spherical 3.0 mm) using ethanol as the milling
medium. After removing the ethanol via a drying step at 100 oC, the powder was lightly ground
then calcined at 1100 oC for 10 h. The milling and calcination steps were repeated a second
time to ensure phase formation. The NiO-BZCYYb4411 composite fuel electrode was prepared
by ball milling NiO powder, BZCYYb4411 powders, and starch in a weight ratio of 65:35:0.5

3
in ethanol for 24 h. After a drying step, the composite powders were mechanically pressed into
a disc and lightly sintered at 800 oC for 4 h.
A thin electrolyte layer was applied atop the porous anode by a drop coating technique.
Specifically, the electrolyte powder was suspended in a multi-component organic fluid in a
1:10 solid-to-fluid weight ratio, where the fluid was comprised of a mixture of 2-butanol binder
(Alfa Aesar), polyvinyl butyral (Tape Casting Warehouse, TCW), butyl benzyl phthalate
(TCW), polyalkylene glycol (TCW), and triethanolamine (Alfa Aesar). After drop-coating onto
the lightly fired support, the resulting fuel electrode/electrolyte bi-layer was heat-treated at 400 oC for 1 h to remove organics. Sintering was carried out immediately thereafter in a two-step
protocol in which the sample was first exposed to 1550 oC for 5 min and then 1500 oC for 4 h
to maximize grain growth while minimizing barium volatilization. The resulting electrolyte
thickness was ~15 m. The air electrode layer was applied in the form of a slurry, comprised
of a mixture of air electrode powder and the organic binder, V-006 (Heraeus) in a 1:1.2 ratio.
After slurry deposition onto the electrolyte layer, the complete cell was sintered at 950 oC for
4 h in air (PBSCF) and 1100 oC for 4 h (Both LSCF and LSM), resulting in ~20 m thick with
an effective area of 0.28 cm2. The microstructures and morphologies were observed using a
field emission scanning electron microscope (SEM) (Hitachi SU8030).
Cell preparation with pulsed laser deposition (PLD) layer
To facilitate PLD of PBSCF, large targets of the material were fabricated. Pre-calcined PBSCF
powders were mechanically compacted into discs using a uniaxial press (20 MPa for 1 min),
followed by high pressure in an isostatic press (~250 MPa for 20 min). Green bodies were
sintered at 1150 oC for 12 h to yield compacts ~ 24 mm in diameter and 4-5 mm in thickness.
Typical densities were ~95 % of theoretical, as determined by the Archimedes method. PBSCF
films were grown on the electrolyte side of NiO+BZCYYb4411/BZCYYb4411 bi-layer cells
using a PVD PLD/MBE 2300 in the Northwestern University PLD core facility. The substrate
was heated at a rate of 30 °C/min and then held at 650 °C for growth. The oxygen pressure in
the chamber was set at 30 mTorr. The growth rate was found to be 20.8 nm min-1 for the
conditions employed (248 nm KrF laser, 270 mJ/pulse, 5 Hz repetition rate). Upon completion
of the deposition, the chamber was vented to 300 Torr oxygen pressure (to facilitate oxidation)
and cooled at a rate of 10 °C/min. As with the conventional cells, a slurry of PBSCF was then

4
brush-painted (now onto the PBSCF thin film rather than the electrolyte) and the complete cell
was sintered at 950 oC for 4 hours in air.
Electrolysis and fuel cell measurement
Ag wires (GoodFellow) were attached at both electrodes of single cell using an Ag paste (SPI
supplies) as a current collector. An alumina tube and a ceramic adhesive (Ceramabond 552,
Aremco) were employed to fix and seal the single cell. For a typical experiment, humidified
hydrogen (3 % H2O) and humidified air (3 % H2O) were supplied with a flow rate of 50 sccm
of hydrogen and 200 sccm of air, using a water bubbler for humidification. Impedance spectra
were recorded under open circuit voltage (OCV) in a frequency range of 100 kHz to 0.1 Hz
with AC perturbation of 20 mV. I-V curves were collected using a BioLogic SP-300
Potentiostat at operating temperature from 500 to 650 oC in intervals of 50 oC. The current
stability was measured under a fixed voltage of 1.3 V at 550 oC. For experiments varying the
H2O concentration in air, humidified air was supplied with concentrations of 3, 5, 7, and 10 %
H2O, achieved by varying the temperature of the water bubbler. For Faradaic efficiency tests,
humidified hydrogen was replaced with 5 % H2/Ar, and the flow rate fixed at 150 ml min-1 unless
otherwise specified. The hydrogen concentration of the fuel electrode effluent was measured
by an inline mass spectrometer (Pfeiffer Thermostar GSD301T2). The mass spectrometer was
calibrated using a six-point calibration using known mixtures of hydrogen in Ar between 5 %
H2 and 15 % H2 immediately before the experiment.
Electrochemical Characteristics of Mixed Conductors
Two mistakes are commonly encountered in the interpretation of the behavior of
electrochemical cells based on mixed ion (proton) and electron conductors used in electrolysis.
The first is in the interpretation of the impedance data. Most authors recognize that the high
frequency ohmic resistance is , as given in Eq. (11) of the main e Hohmic
H e
limR R
Z RR R
text. That is, Rohmic does not directly give the value of the ionic (protonic) resistance. In contrast,
many misinterpret the meaning of the resistance in the D.C. limit and incorrectly take Rp to be
(RDC – Rohmic). The true relationship of the resistance in the DC limit to the material properties
5
is, however, , as given in Eq. (12) of the main text. Thus, the Pe HDC0 Pe H
limR R R
Z RR R R
incorrect interpretation of RDC underestimates RP, just as an incorrect assumption that Rohmic
corresponds to the ionic resistance would underestimate . In both cases, electronic leakage HR
increases the measured conductance and such leakage must be accounted for in order to extract
the true material properties.
The second common mistake is in the measurement of hydrogen production. Review of the
literature reveals that many authors report hydrogen production from protonic ceramic cells to
be zero under open circuit conditions. However, it is generally not possible to actually measure
the hydrogen production as being zero. In the protonic ceramic system, hydrogen from
electrolysis is generated at the fuel electrode, and thus the hydrogen content in the exhaust from
this electrode must be measured. Typically, some amount of hydrogen (3 to 5%) is supplied to
the fuel electrode, and thus even under open circuit conditions, hydrogen is detected in the
exhaust stream. For a cell with no electronic leakage, it is appropriate to calibrate the system
such that the detected hydrogen signal corresponds to the inlet hydrogen, meaning that the
hydrogen production is zero. However, when the open circuit voltage is lower than the Nernst
value due to electronic conductivity, there is, as discussed in the main text, a net loss of
hydrogen at open circuit. Explicitly, combining Eqs. (8) and (13) text yields
+OC OC OCH
DC1
N
V VIR V
Thus, taking the hydrogen signal to correspond to zero production at open circuit from an
electronically leaky cell is simply incorrect. Doing so overestimates the hydrogen production
at all conditions – at open circuit and, due to the incorrect calibration, also under bias. One
cannot simultaneously attribute VOC < VN to electronic leakage and take the hydrogen
production at open circuit to be zero. These two conditions are contradictory. Yet, many authors
report both to be true. Because there are fewer challenges to measuring voltage than hydrogen
signal above an unquantified background, it is likely that the VOC measurements are correct,
whereas the hydrogen production values reported in these studies are overestimated.
Consequently, Faradaic efficiencies are unlikely to be as high as many authors have suggested.

6
Figure S1. Steam tolerance of BZCYYb4411 electrolyte and PBSCF air electrode. X-ray diffraction
patterns of (a) BZCYYb4411 electrolyte and (b) PBSCF air electrode (powder form) after treatment in
20 % H2O-80 % air at 500 oC for 24 h.

7
Figure S2. Electrochemical charateristics of various H2O concentration. IV curves of the effect on
various H2O concentration for air electrode at (a) 600 oC and (b) 500 oC. (c) Nyquist impedance plots
and the corresponding fit curves as function of H2O concentration at 500 oC and 1.3 V.
8
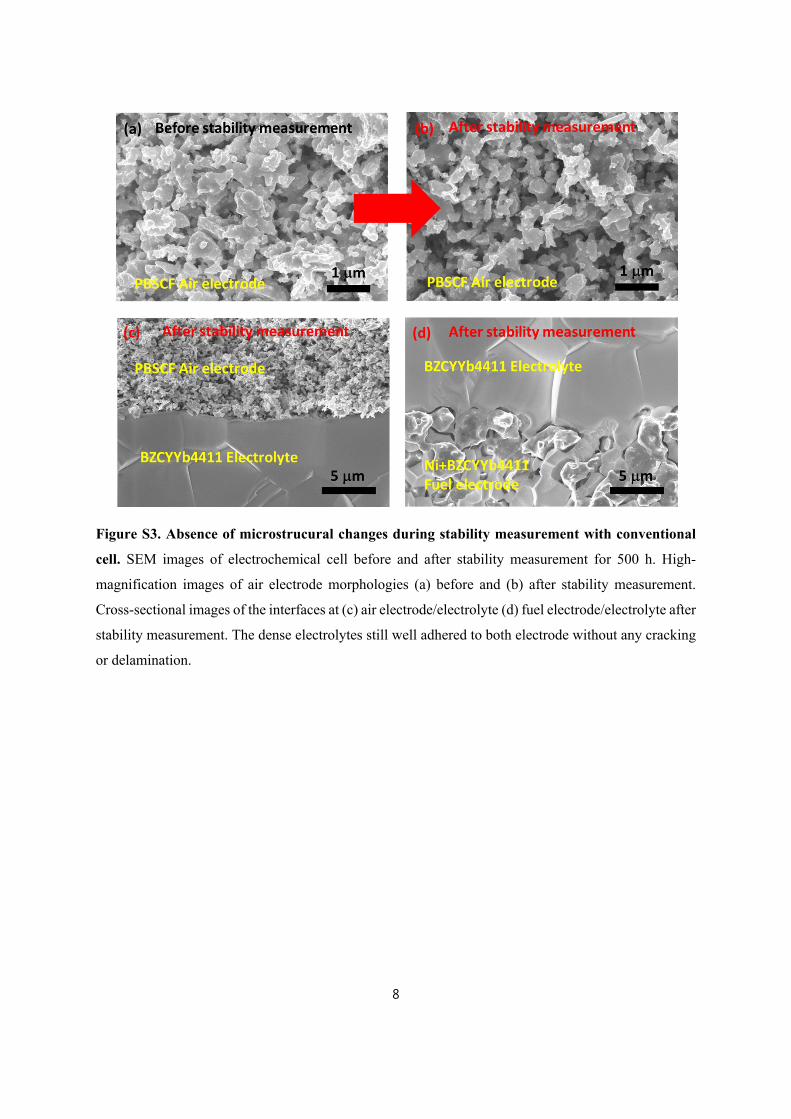
Figure S3. Absence of microstrucural changes during stability measurement with conventional
cell. SEM images of electrochemical cell before and after stability measurement for 500 h. High-
magnification images of air electrode morphologies (a) before and (b) after stability measurement.
Cross-sectional images of the interfaces at (c) air electrode/electrolyte (d) fuel electrode/electrolyte after
stability measurement. The dense electrolytes still well adhered to both electrode without any cracking
or delamination.

9
Figure S4. Impedance spectra of conventional cell under OCV condition at 600 oC. Dry 5 % H2
(balanced in Ar) is supplied to the fuel electrode and humidified (3 % H2O) air is fed to air electrode.

10
Figure S5. Simplified equivalent circuit representation of an electrochemical cell with a mixed ion
and electron conducting electrolyte. Top: the circuit at frequencies below the bulk characteristic
frequency, at which the dielectric capacitance of the electrolyte is effectively open and can be ignored.
Ions and electrons move along parallel paths, and under the assumption of local electroneutrality,
differential ionic and electronic resistances are linked by the differential chemical capacitance which
ensures that changes in concentration of two types of species are balanced. RC and RA are, respectively,
the cathode and anode electrochemical reaction resistances, which are accompanied by capacitance
terms, CC and CA. In principle, non-conventional circuit elements are required to completely describe
the impedance response, but such elements are omitted here for simplicity.2,3 Middle: at high frequency,
capacitors are shorted. Bottom: at low frequency, capacitors are open. in the middle and bottom ionR
circuits includes both the bulk ionic resistance and the ionic contact resistance of the top circuit.
Similarly, includes both the bulk electronic resistance and the electronic contact resistance.eonR

11
Figure S6. A trace of hydrogen detected under different voltage conditions. Hydrogen production
rate by converting from the current density (line) and directly measuring from the MS (dot) at (a) 600,
(b) 550, and (c) 500 oC. (d) Reduced flow rate (100 ml min-1) is used at fuel electrode side at 500 oC to
check the possible mechanical leaks across the cell or through the apparatus.
12
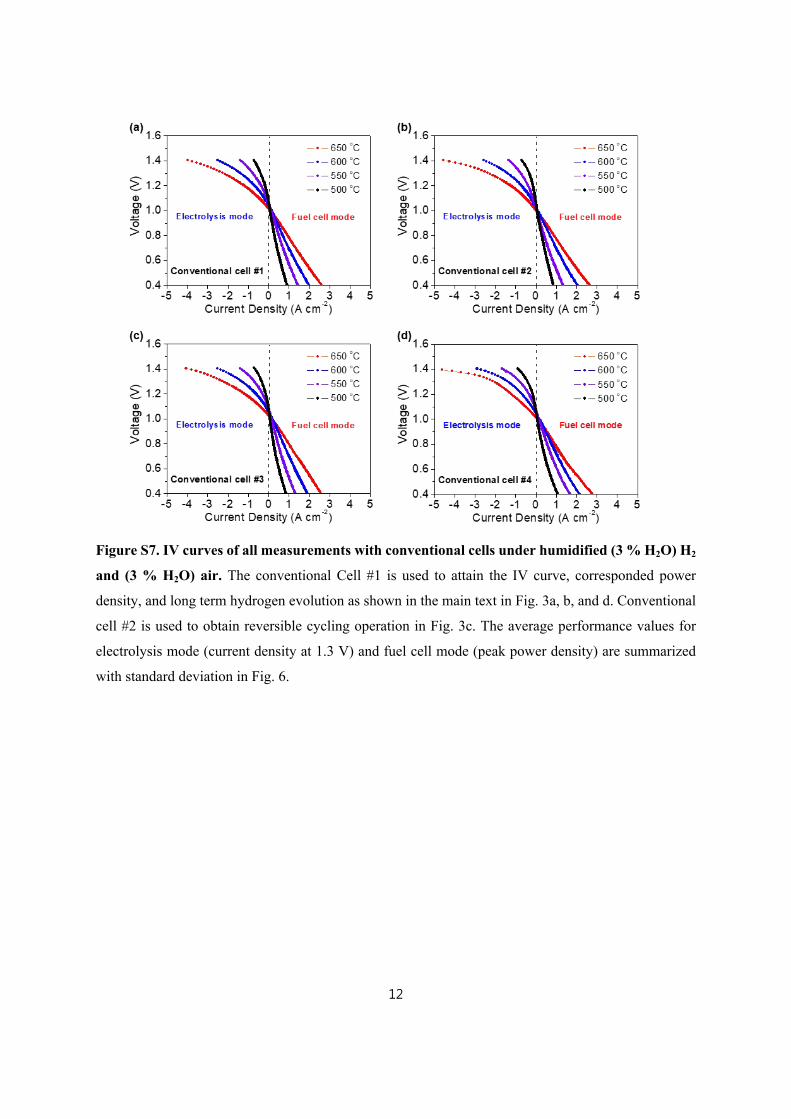
Figure S7. IV curves of all measurements with conventional cells under humidified (3 % H2O) H2
and (3 % H2O) air. The conventional Cell #1 is used to attain the IV curve, corresponded power
density, and long term hydrogen evolution as shown in the main text in Fig. 3a, b, and d. Conventional
cell #2 is used to obtain reversible cycling operation in Fig. 3c. The average performance values for
electrolysis mode (current density at 1.3 V) and fuel cell mode (peak power density) are summarized
with standard deviation in Fig. 6.

13
Figure S8. IV curves of all measurements with PLD modified cells under humidified (3 % H2O)
H2 and (3 % H2O) air. The PLD-modified cell #1 is used to perform the electrochemical
characterization with long-term stability measurement in Fig. 5. The average performance values for
electrolysis mode (current density at 1.3 V) and fuel cell mode (peak power density) are summarized
with standard deviation in Fig. 6.
14
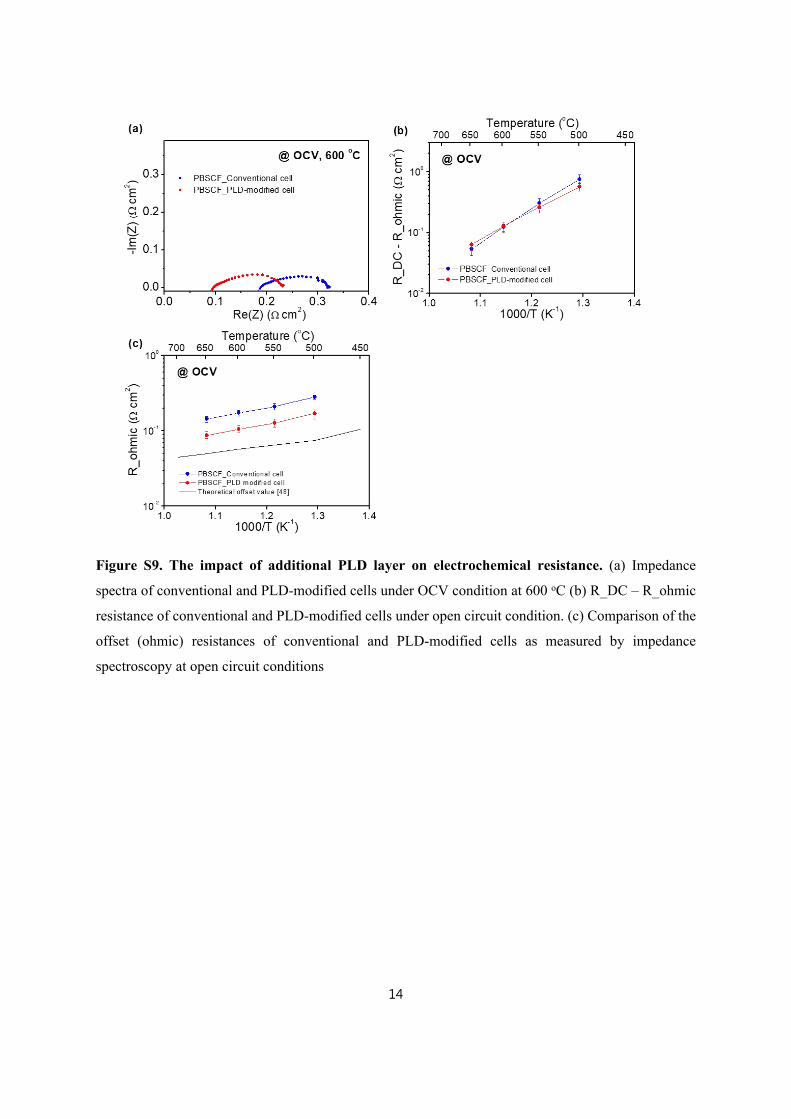
Figure S9. The impact of additional PLD layer on electrochemical resistance. (a) Impedance
spectra of conventional and PLD-modified cells under OCV condition at 600 oC (b) R_DC – R_ohmic
resistance of conventional and PLD-modified cells under open circuit condition. (c) Comparison of the
offset (ohmic) resistances of conventional and PLD-modified cells as measured by impedance
spectroscopy at open circuit conditions

15
Figure S10. Absence of microstrucural changes during stability measurement with PLD-modified
cell. Microstructure of interface at PBSCF air electrode and BZCYYb4411 electrolyte with inserted
additional PBSCF PLD layer (a) before and (b) after stability measurement under electrolysis operation
(1.3 V) at 550 oC as shown in Fig. 5b.

16
Figure S11. Chemical compatibility between various air electrodes and BZCYYb4411 electrolyte.
X-ray diffraction (XRD) patterns for sintered BZCYYb4411 and (a and b) SSC, (c and d) LSCF, and
(e and f) LSM air electrodes are shown as references for the diffraction pattern, and a mixture of the
two materials annealed at 900, 1000, and 1100 °C under air. In SSC, XRD patterns indicate that there
occurs impurities after annealing process as shown in b. There is no detectable secondary phases with
LSCF and LSM after heat treatment.

17
Figure S12. Electrochemical performance of alternative air electrodes. (a) IV curves and (b)
polarization and power density curves for fuel cell mode with LSCF air electrode based on
BZCYYb4411 electrolyte using conventional cells in humidified (3 % H2O) H2 and (3 % H2O) air. (c)
IV curves and (d) polarization and power density curves for fuel cell mode with LSM air electrode

18
Table S1. Performance of electrolysis cells based on an oxygen ion (O2-) conducting electrolyte
Inlet Gas composition
Ref.Cell configuration
(Air electrode/Electrolyte (Thickness)/ Fuel electrode)
ForAir electrode
Forfuel electrode
Temp
(oC)
OCV
(V)
Current density@ 1.3V(A cm-2)
(20) PBSCF-GDC/LSGM (250 m)/LDC/PBM(Co-Fe)
AirH2
(10 % H2O)800700
1.001.05
-1.31-0.52
(21) LSCF-GDC/GDC/YSZ (7 m)/Ni-YSZ
AirH2
(50 % H2O)750 0.94 -2.10
(22) BLC/LSGM (300 m)/CMF
Air1 % H2 +79 % Ar
(20 % H2O)800700
0.780.85
-0.37-0.10
(23) LSM-YSZ/LNWO (360 m)/Ni-YSZ
20 % O2 + 80 % N2
H2
(50 % H2O)950850
0.910.96
-0.26-0.04
(27) PNO/PNO-CGO/YSZ (20 m)/Ni-YSZ
Ambient airH2
(50 % H2O)800 0.94 -0.78
(28) NNO-SSZ/SSZ (12 m)/Ni-SSZ
AirH2
(50 % H2O)800700
0.940.99
-1.08-0.44
(29) LSCF/LSCF-GDC/GDC/YSZ (20 m)//Ni-YSZ
AirH2
(50 % H2O)800 1.10 -0.85
(30) LSM-YSZ/YSZ (13 m)/Ni-YSZ
Ambient airH2
(50 % H2O)750 1.00 -1.42
(31)LSCF-SDC/LSGM (n/a)/
LCO/SFMNi-SDCAmbient air
H2
(42 % H2O)800700
0.920.93
-0.84-0.27
(32) LSM-YSZ/YSZ (10 m)/Ni-YSZ
Ambient airH2
(33 % H2O)800 0.87 -1.35
(33) LSM-YSB/YSZ (10 m)/Ni-YSZ
100 % O2H2
(45 % H2O)800 0.98 -1.52
(34)LSCF/LSGM (n/a)/
Ni-LSGM/SLTAir
H2
(50 % H2O)600 1.00 -0.92
For air electrode
PBSCF = PrBa0.5Sr0.5Co1.5Fe0.5O5+; LSCF = La0.6Sr0.4Co0.2Fe0.8O3-; BLC = Ba0.6La0.4CoO3-; LSM = (La0.8Sr0.2)0.98MnO3-;
PNO=Pr2NiO4+; NNO = Nd2NiO4+;
For electrolyte
GDC or CGO = gadolinium doped ceria, Ce0.9Gd0.1O2-; LSGM= La0.9Sr0.1Ga0.8Mg0.2O3-; LDC= La0.4Ce0.6O2-; YSZ=
yttria-stabilized zirconia; LNWO = LaNb0.84W0.16O4.08; SSZ = Scandia stabilized zirconia; SDC = Sm0.2Ce0.8O1.9; LCO =
La0.5Ce0.5O1.5; YSB=Bi0.42Y0.58O1.5;
For fuel electrode
PBM= PrBaMn2O5+; CMF= Ce0.6Mn0.3Fe0.1O2-; SFMNi = Sr2Fe1.3Ni0.2Mo0.5O6; SLT = Sr0.8La0.2TiO3-
n/a = not available

19
Table S2. High-temperature performance of electrolysis cells based on a proton conducting (H+) electrolyte
Inlet Gas composition
Ref.Cell configuration
(Air electrode/Electrolyte (Thickness)/ Fuel electrode)
For air electrode
For fuel electrode
OCV/EN
(V)
Current density@ 1.3V(A cm-2)
FaradayEfficiency
@ 1.3V (%)
700C
(35) SSC/BZCY44(1500 m)/Pt
Air(20 % H2O)
5 % H2/Ar(3 % H2O)
0.95/0.96 -0.035 > 80
(42)NBSCF-
BZCYYb1711/BZCYYb1711 (20 m)/ Ni-BZCYYb1711
Air(10 % H2O)
H2 (10 % H2O)
1.00/1.00 -2.41 n/a
(43) LSCM-BZCYZ/BCZYZ (75 m)/ Ni-BCZYZ
N2
(3 % H2O)5 % H2 +95 % Ar
0.13 -0.9622
@ 2.0V
(45) LSMS0.05/BCZYZ (2000 m)/LSMS0.05
Air(5 % H2O)
5 % H2 +95 % Ar
0.60/1.05 -0.02280
@ 2.0V
800C
(44) LSCF-BZCYZ/BCZYZ (2000 m)/ Ni-BCZYZ
Air(3 % H2O)
5 % H2 +95 % Ar
0.75/0.97-0.03
@ 1.4V37.5
@ 1.4V
(44) BSCF-BZCYZ/ BCZYZ (2000 m)/ Ni-BCZYZ
Air(3 % H2O)
5 % H2 +95 % Ar
0.73/0.97-0.03
@ 1.4V43.8
@ 1.4V
(46)6 wt% Co3O4-LSM-BCZYZ/
BCZYZ(2000 m)/Ni-BCZYZ
Air(10 % H2O)
5 % H2 +95 % Ar
0.92/0.94-0.07
@ 1.4V43.3
@ 1.4V
For air electrode
LSCM = La0.75Sr0.25Cr0.5Mn0.5O3-d; NBSCF = NdBa0.5Sr0.5Co1.5Fe0.5O5+d; SSC = Sm0.5Sr0.5CoO3-d; LSMS0.05 =
La0.8Sr0.2Mn0.95Sc0.05O3-d; LSCF = La0.6Sr0.4Co0.2Fe0.8O3-d; BSCF = Ba0.5Sr0.5Co0.8Fe0.2O3-d; LSM = La0.8Sr0.2MnO3-d
For electrolyte
BCZYZ = BaCe0.5Zr0.3Y0.16Zn0.04O3; BZCYYb1711 = BaZr0.1Ce0.7Y0.1Yb0.1O3; BZCY44 = BaCe0.4Zr0.4Y0.2O3;
BZY20 = BaZr0.8Y0.2O3; BCZD = BaCe0.5Zr0.3Dy0.2O3; BCZY = BaCe0.5Zr0.3Y0.2O3; BZY10 = BaZr0.9Y0.1O3; BZCYYb1711
= BaZr0.1Ce0.7Y0.1Yb0.1O3; BZCYYb4411 = BaZr0.4Ce0.4Y0.1Yb0.1O3
n/a = not available

20
Table S3. Electrochemical characteristics of representative protonic ceramic electrochemical cells under open circuit conditions: VN is the computed Nernst voltage; VOC, Rohmic, and RDC are measured values of, respectively, the open circuit voltage, the high frequency resistance, and the resistance in the low frequency limit; , , , and are, respectively, the computed electronic resistance, eR HR PR OC
HI
protonic resistance, polarization resistance, and ionic leakage current. Cells are measured with 97 % hydrogen, balance steam, supplied to the fuel electrode and 3 % H2O humidified synthetic air supplied to the air electrode.
T, C
VN, V
VOC, V
Rohmic, cm2
RDC, cm2
, eR
cm2
, HR
cm2Ht , PR
cm2
, OCHI
Acm-2
1.3VF
(%), 1.3V
HI
Acm-2
Conventional cell #1
650 1.07 1.02 0.15 0.20 4.05 0.16 0.96 0.05 0.25 77 -1.74600 1.08 1.05 0.18 0.32 10.2 0.19 0.98 0.14 0.10 84 -1.18550 1.10 1.07 0.22 0.47 19.6 0.22 0.99 0.25 0.06 86 -0.67500 1.11 1.08 0.30 0.94 38.7 0.30 0.99 0.66 0.03 87 -0.33
PLD-modified cell #1
650 1.07 1.01 0.08 0.15 2.55 0.08 0.97 0.08 0.40 74 -2.15600 1.08 1.03 0.10 0.23 4.62 0.10 0.98 0.15 0.22 76 -1.37550 1.10 1.06 0.11 0.40 12.1 0.13 0.99 0.28 0.09 81 -0.83500 1.11 1.07 0.14 0.80 23.8 0.15 0.99 0.68 0.05 82 -0.42
Application of a PLD layer largely improves the electronic contact between air electrode and the electrolyte, as reflected in the decrease of , although a slightly improvement in the protonic contact eR
is also observed. As a consequence, both the electronic and ionic currents increase. The transference number is unchanged, as would be expected, as is the electrochemical reaction resistance, implying that the PLD layer does not impact the redox reaction, as also expected. Despite a slight penalty in Faradaic efficiency upon PLD-modification, because of the overall decrease in cell resistance terms, the hydrogen production rate increases at any given voltage. This behavior is exemplified by the tabulated data for an operating voltage 1.3 V.

21
References
1. M. P. Pechini US Patent 1967, 3, 330, 697.
2. W. Lai, S. M. Haile, Phys. Chem. Chem. Phys., 2008, 10, 865-883.
3. M. Liu and H. Hu, J. Electrochem. Soc. 1996, 143(6), L109-L112.