Signs of Chemical Reactions · 2017-06-13 · 1. What does a catalytic converter do? Converts...
132
Signs of Chemical Reactions
Transcript of Signs of Chemical Reactions · 2017-06-13 · 1. What does a catalytic converter do? Converts...
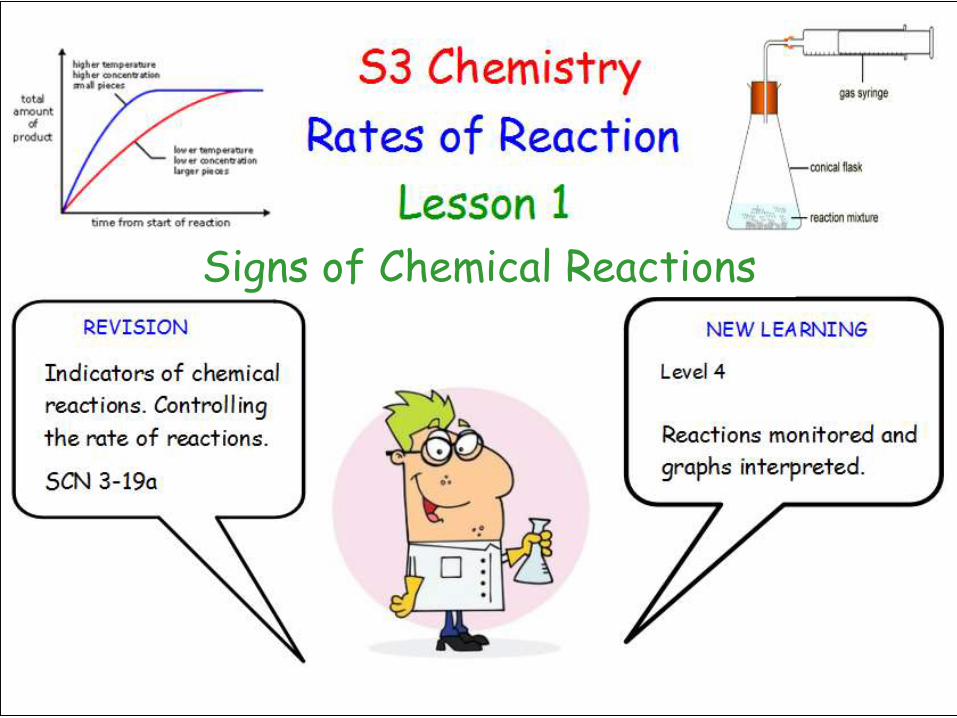
Signs of Chemical Reactions


Tell the difference between changes which are PHYSICALand those which involve a CHEMICAL reaction
Doing six different experiments and observing the changes which occur when substances react.
We can tell whether something is a chemical reaction or physical change and can state some common signs of chemical reactions.


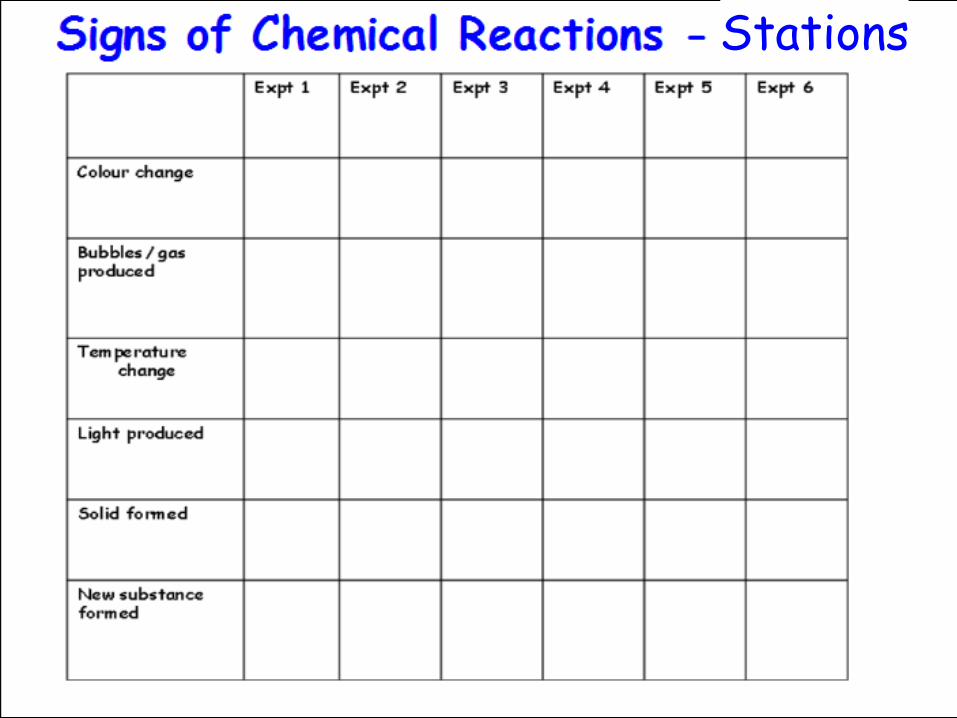
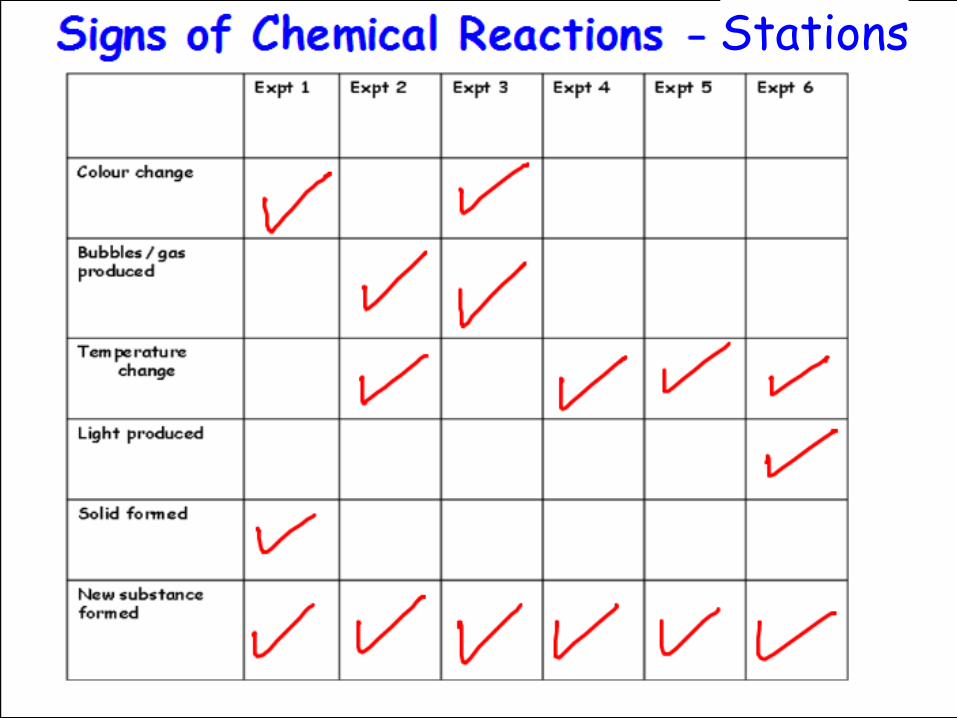
Stations
Stations
Stations

Tell the difference between changes which are PHYSICALand those which involve a CHEMICAL reaction
Doing six different experiments and observing the changes which occur when substances react.
We can tell whether something is a chemical reaction or physical change and can state some common signs of chemical reactions.

Exit Task – Match Up
Match the word to the definition.
A chemical reaction in which heat is
taken in. Precipitate
Exothermic
Endothermic A solid created in a solution during a chemical reaction.
A chemical reaction in which heat is
released.Effervescence
Bubbling and fizzing as a gas
escapes from an aqueous solution

Lesson 2Energy Changes
NEW LEARNING
I can collect and analyse experimental data on chemical reactions that result in an obvious change in energy. I can apply my findings to explain the significance of the energy changes associated with chemical reactions.
SCN 4-19a

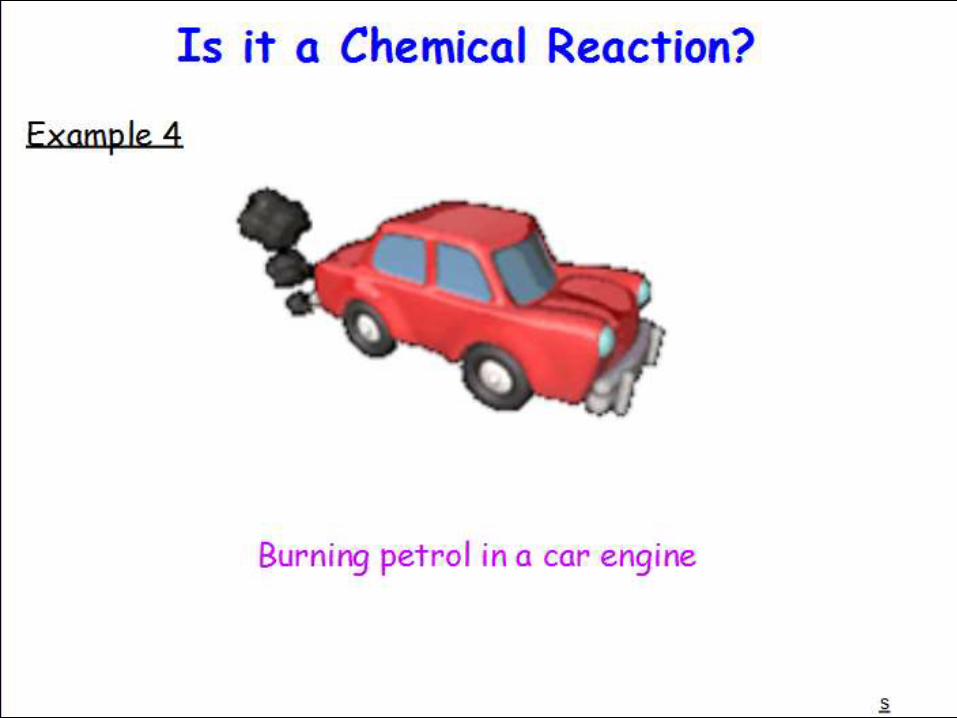
1 Name any one sign of a chemical reaction.
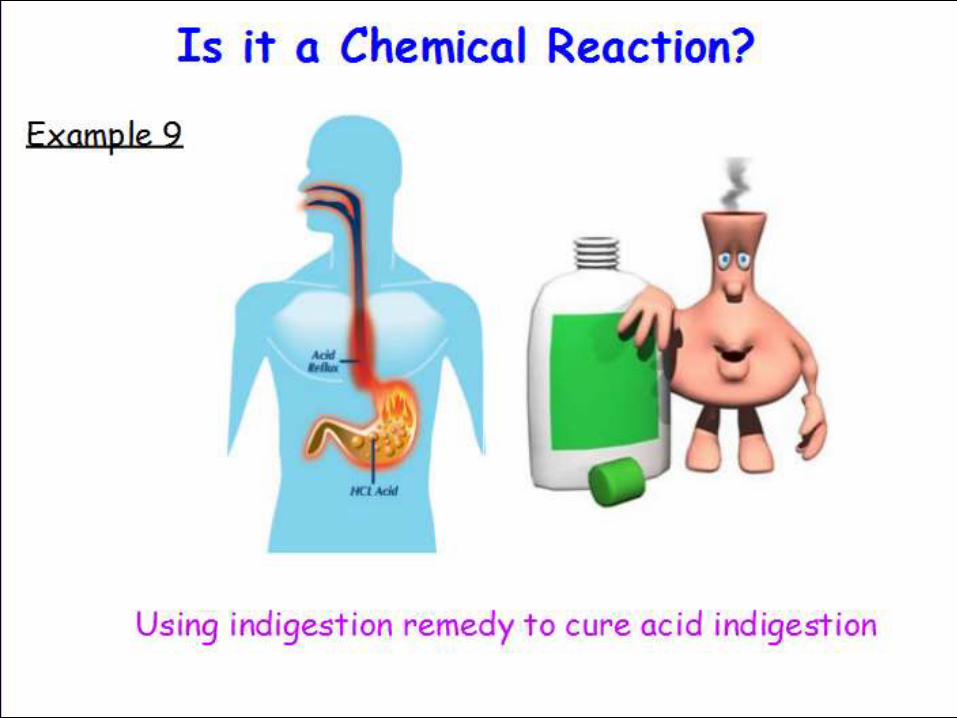
2 Name one sign of a chemical reaction which can be seen in the diagram below
Appearance change, temperature change, new substance formed, effervescence, precipitation.
• Colour change, • New substances formed
(copper oxide and carbon dioxide),
• Gas given off
Starter Questions

Starter Questions
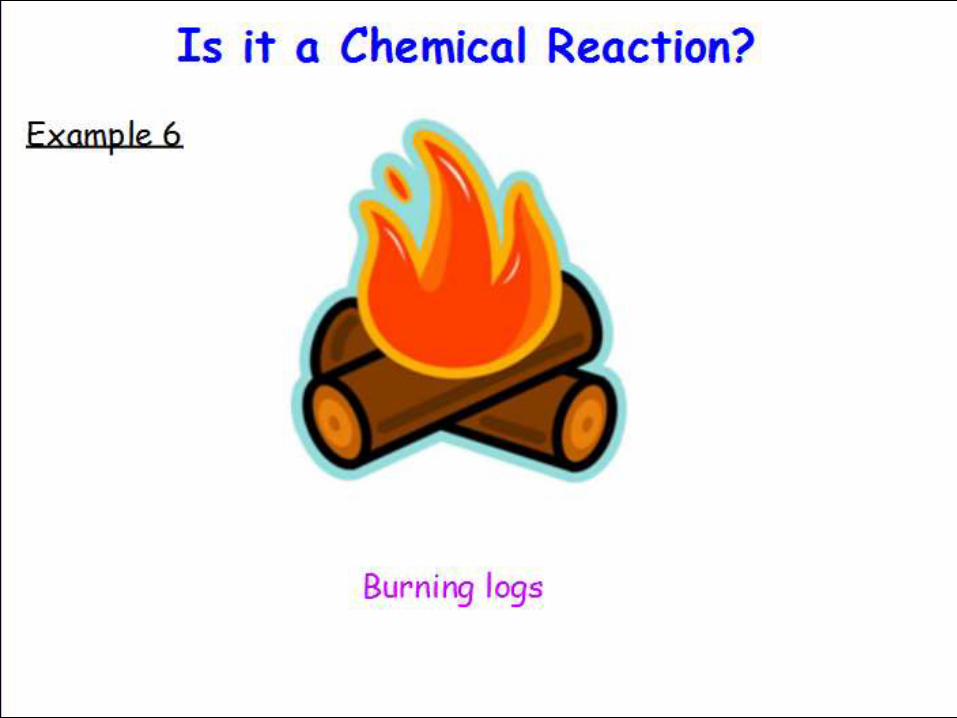
3. When a fire is burning, is energy taken in or given out?
4. How do you know?
Given out
You can feel the heat from the fire reaching you and heating you up.

Energy ChangesToday we will learn toState that chemical reactions have changes in
energy.
We will do this byTrying experiments to observe different types
of energy changes. Learning about what the
different types of energy changes are called.
We will have succeeded ifWe can use the results of experiments to
state whether a chemical reactions is exothermic or endothermic.
Energy changes
When chemical reactions occur there is a
change in energy
When energy is given out, it is called an
exothermic reaction
When energy is taken in, it is called an
endothermic reaction

Exothermic Reactions
1. Place the thermometer in the beaker and record the temperature.
2. Soak a piece of steel wool in vinegar for 1 minute.
3. Squeeze the excess vinegar out of the steel wool.
4. Wrap the wool around the thermometer and place the wool/thermometer in the beaker, sealing the lid.
5. Allow 5 minutes, then read the temperature and compare it with the first reading.
Endothermic Reaction
1. Pour the citric acid solution (20cm3) into a styrofoam coffee cup. Use a thermometer or other temperature probe to record the initial temperature.
2.Stir in the baking soda (2 spatulas sodium bicarbonate). Track the change in temperature every 30 seconds
• What happens?

Elephant’s toothpaste
1. Pour ~50 mL of 30% hydrogen peroxide solution into the graduated cylinder.
2. Squirt in a little dishwashing detergent and swirl it around.
3. You can place 5-10 drops of food coloring along the wall of the cylinder to make the foam resemble striped toothpaste.
4. Add ~10 mL of potassium iodide solution. You may touch a glowing splint to the foam to relight it, indicating the presence of oxygen.
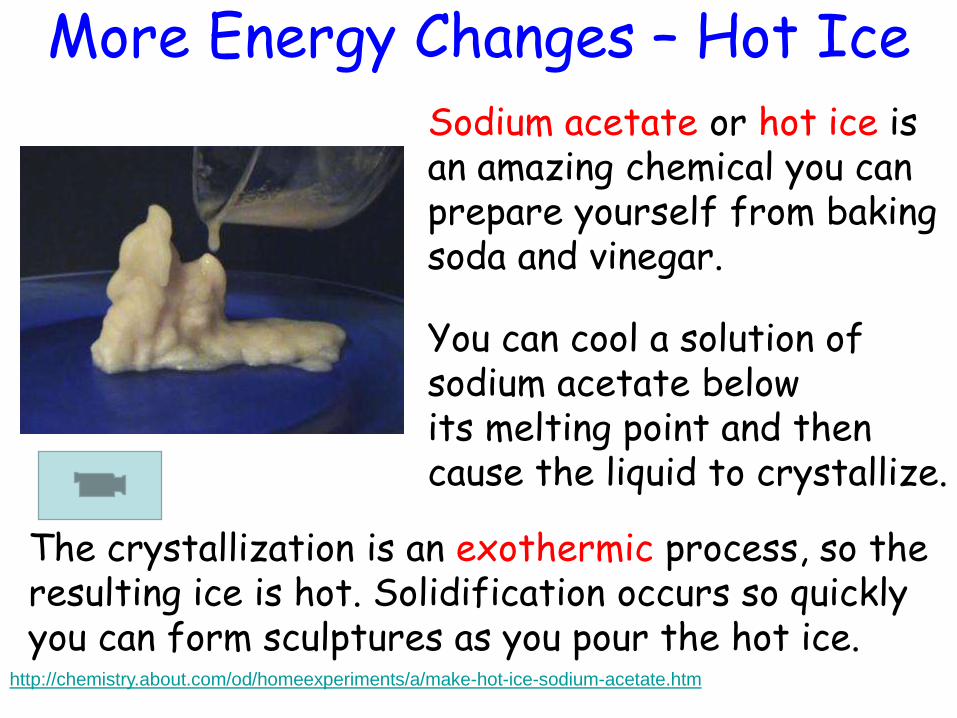
More Energy Changes – Hot Ice
http://chemistry.about.com/od/homeexperiments/a/make-hot-ice-sodium-acetate.htm
Sodium acetate or hot ice is an amazing chemical you can prepare yourself from baking soda and vinegar.
You can cool a solution of sodium acetate below its melting point and then cause the liquid to crystallize.
The crystallization is an exothermic process, so the resulting ice is hot. Solidification occurs so quickly you can form sculptures as you pour the hot ice.

Energy ChangesToday we will learn toState that chemical reactions have changes in
energy.
We will do this byTrying experiments to observe different types
of energy changes. Learning about what the
different types of energy changes are called.
We will have succeeded ifWe can use the results of experiments to
state whether a chemical reaction is
exothermic or endothermic.

1 In an exothermic reaction:
A The temperature goes upB The temperature goes downC The temperature stays the same
2 Endothermic reactions:
A Release energy to the surroundingsB Absorb energy from the surroundingsC Do not transfer energy to or from the surroundings
Energy Changes – Exit Task

Lessons 3 & 4Factors Affecting Reaction Rate


Change the speed of a chemical reaction using 3 different methods. We will also remind ourselves about Catalysts.
Doing experiments in groups and changing the temperature,concentration or particle size of the chemicals we are using.Discussing catalysts and their uses.
We can prove by experiment the effect of changing the temperature, concentration or particle size on the rate of reaction . We can state the definition of a catalyst and give some examples.


Particle Size Time taken for bubbling to stop
(seconds)
As particle size increases the rate of reaction decreases.


As temperature increases the rate of reaction increases.
RESULTS – Draw a table containing your results here.
CONCLUSION – Write how temperature affected reaction rate here.
Temperature of acid (OC)
Time taken for magnesium to fully react (seconds)


Investigating Concentration
AIM – To investigate the effect of concentration on reaction rate.
HYPOTHESIS (what I think will happen) – Write your idea here
METHOD -

Investigating Concentration
RESULTS – Draw a table containing your results here.
CONCLUSION – Write how concentration affected reaction rate here.
Concentration (mol l-1)
Time taken for cross to disappear (seconds)
As concentration increases the rate of reaction increases.

Change the speed of a chemical reaction using 3 different methods. We will also remind ourselves about Catalysts.
We can prove by experiment the effect of changing the temperature, concentration or particle size on the rate of reaction . We can state the definition of a catalyst and give some examples.
ISSUE RATES HOMEWORK 1
Doing experiments in groups and changing the temperature,concentration or particle size of the chemicals we are using.Discussing catalysts and their uses.
Tell me three things...
One you have done well
One you would like to find out more about
One you know now that you didn’t know 50 minutes
ago

Lessons 3 & 4Factors Affecting Reaction Rate

Change the speed of a chemical reaction using 3 different methods. We will also remind ourselves about Catalysts.
We can prove by experiment the effect of changing the temperature, concentration or particle size on the rate of reaction . We can state the definition of a catalyst and give some examples.
ISSUE RATES HOMEWORK 1
Doing experiments in groups and changing the temperature,concentration or particle size of the chemicals we are using.Discussing catalysts and their uses.

Starter Questions
1. What does a catalytic converter do?Converts harmful exhaust gases into
less harmful gases.2. Which metal is a catalytic converter
made of?Platinum (or rhodium or palladium)3. What types of pollutants come out
of car exhausts without a catalytic converter?
Carbon monoxide, oxides of nitrogen, unburned hydrocarbons.

Lessons 5Catalysts & Enzymes

Describe catalysts and enzymes and how they work.
We can state the definition for a catalyst and for an enzyme. Name an example of each and the reaction they catalyse.
Discussing different catalysts and enzymes and their uses.Watching a video clip about catalytic converters in cars.Carrying out an experiment using a catalyst and an enzyme.

A catalyst is a substance which speeds up a chemical reaction and can be recovered unchanged at the end of the reaction (it is not used up in the reaction).
Catalysts & Enzymes
An enzyme is a biological catalyst. It speeds up chemical reactions in living things and can be recovered unchanged at the end of the reaction (it is not used up in the reaction).

Some common catalysts and the reactions they catalyse are:
Common Catalysts
Catalyst Reaction catalysed Iron Making ammonia from nitrogen and hydrogen
Platinum Car exhaust (oxides of nitrogen and carbonmonoxide into nitrogen and carbon dioxide)
Manganese dioxide Decomposition (breakdown) of hydrogenperoxide into oxygen and water

Common Enzymes
Enzyme Reaction catalysed Amylase Breakdown of starch into sugars e.g. glucoseZymase Brewing (fermentation) of sugar e.g. glucose
into alcohol (ethanol)Catalase Decomposition (breakdown) of hydrogen
peroxide into oxygen and water
Some common enzymes and the reactions they catalyse are:

Describe catalysts and enzymes and how they work.
We can state the definition for a catalyst and for an enzyme. Name an example of each and the reaction they catalyse.
Discussing different catalysts and enzymes and their uses.Watching a video clip about catalytic converters in cars.Carrying out an experiment using a catalyst and an enzyme.

Matthew added 0.1g manganese dioxide to hydrogen peroxide solution and oxygen was produced. Manganese dioxide is a catalyst.
1. What is a catalyst?
2. What will be the mass of the manganese dioxide at the end of the reaction?
3. What would happen to the rate at which oxygen gas is given off if the temperature was raised to 35oC?
0.1 g (A catalyst is not used up in a reaction).
The rate of oxygen gas production will increase.
Exit Task
A catalyst is a substance which speeds up a chemical reaction and can be recovered unchanged at the end of the reaction (it is not used up itself).

Describe catalysts and enzymes and how they work.
We can state the definition for a catalyst and for an enzyme. Name an example of each and the reaction they catalyse.
Discussing different catalysts and enzymes and their uses.Watching a video clip about catalytic converters in cars.Carrying out an experiment using a catalyst and an enzyme.

Lesson Starter
Question 1
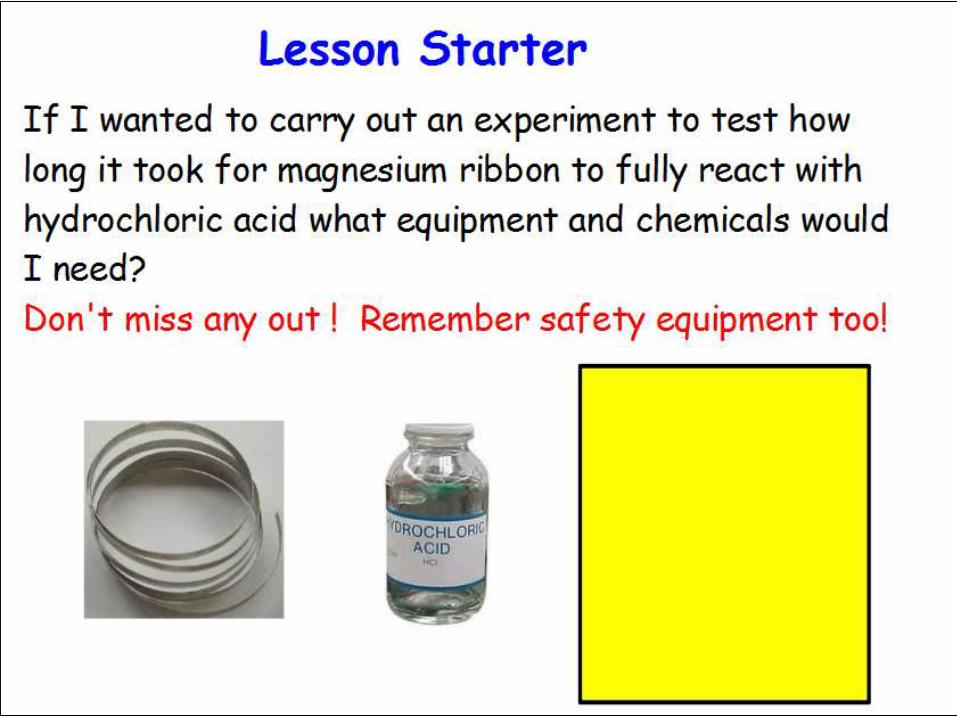
Which reaction will be faster: 1g marble lumps with acid or 1g marble powder with acid ?
1g marble powder with acid
Lesson Starter
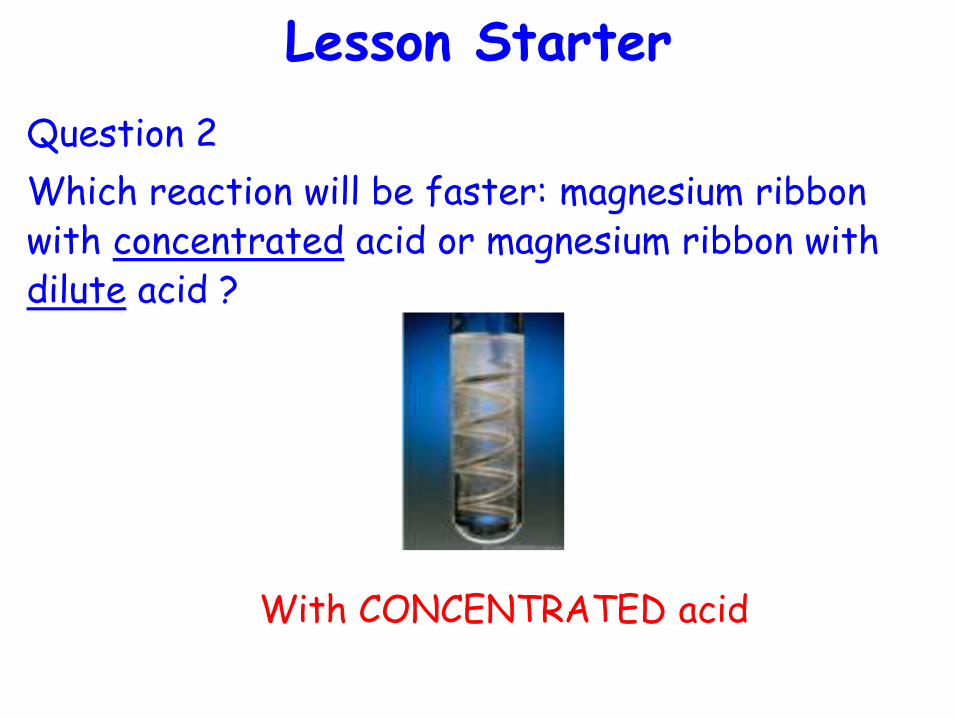
Question 2
Which reaction will be faster: magnesium ribbon with concentrated acid or magnesium ribbon with dilute acid ?
With CONCENTRATED acid

Lesson Starter
Question 3
At which temperature will the reaction between marble powder and acid be faster?
40oC

Lesson 6What Is Reaction Rate?
We can describe at least one experimental method of measuring the rate of reaction and can explain why this method is better than just timing how long it takes for a reaction to finish.
Carrying out a simple experiment to see how the speed/rate of a reaction varies with time. Watching the GLOW video to see how we can measure the RATE not just the relative SPEED of a chemical reaction.

Observing Changes in Reaction Rate
Set up the simple experiment shown below and make observations about how fast the reaction rate is at the start and as the reaction proceeds.
Were the bubbles of gas produced just as quickly throughout the whole experiment? (If not describe how the rate of bubbling changed as the reaction proceeded).
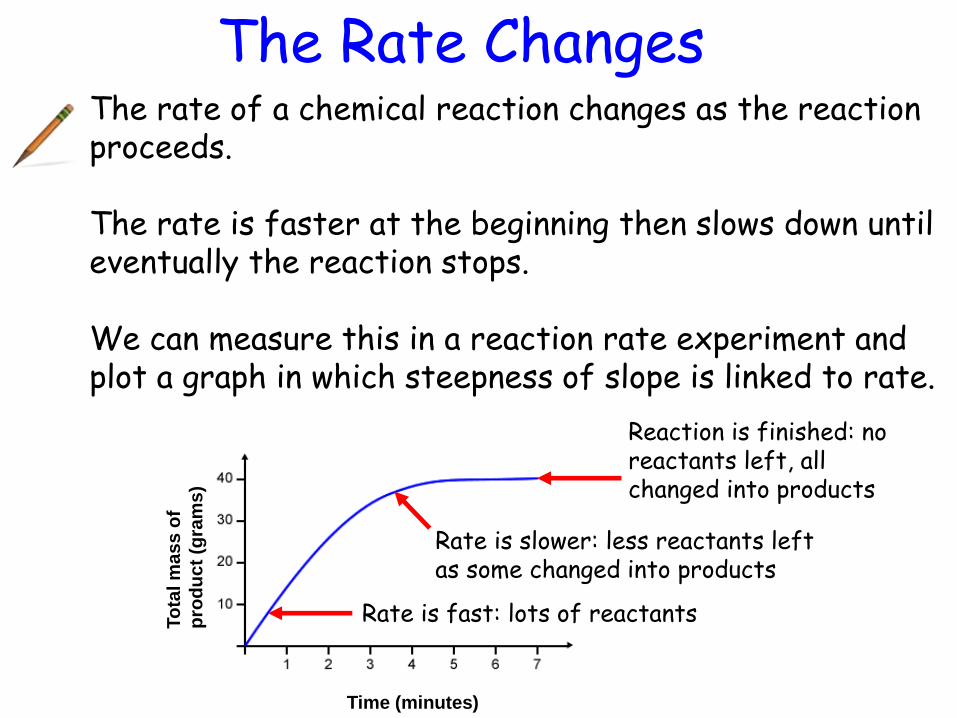
The Rate ChangesThe rate of a chemical reaction changes as the reaction proceeds.
The rate is faster at the beginning then slows down until eventually the reaction stops.
We can measure this in a reaction rate experiment and plot a graph in which steepness of slope is linked to rate.
To
tal m
as
s o
f
pro
du
ct
(gra
ms
)
Time (minutes)
Rate is fast: lots of reactants
Rate is slower: less reactants left as some changed into products
Reaction is finished: no reactants left, all changed into products


We can describe at least one experimental method of measuring the rate of reaction and can explain why this method is better than just timing how long it takes for a reaction to finish.
Carrying out a simple experiment to see how the speed/rate of a reaction varies with time. Watching the GLOW video to see how we can measure the RATE not just the relative SPEED of a chemical reaction.

Exit TaskConsider a reaction between marble chips and acid what do you think the main difference between measuring overall speed of reaction and measuring rate might be? Why might it be more useful/better to measure the rate of reaction?
HINT – consider how many measurements you take for each?
One measurement: Time taken to stop bubbling
Several measurements: Mass of gas lost OR Volume of gas collected over time (e.g. every minute) until bubbling stops.
MEASURING OVERALL SPEED OF REACTION
MEASURING RATE OF REACTION


Lessons 7 & 8

Planning an investigation, noting down the method and the measurements/results we need to take and then completing an investigation report and graph of our results.
Our plan allows us to carry out the investigation in a safe and organised way. The results collected allow us to make a valid conclusion on how varying the concentration of hydrochloric acid affects its rate of reaction with magnesium ribbon.

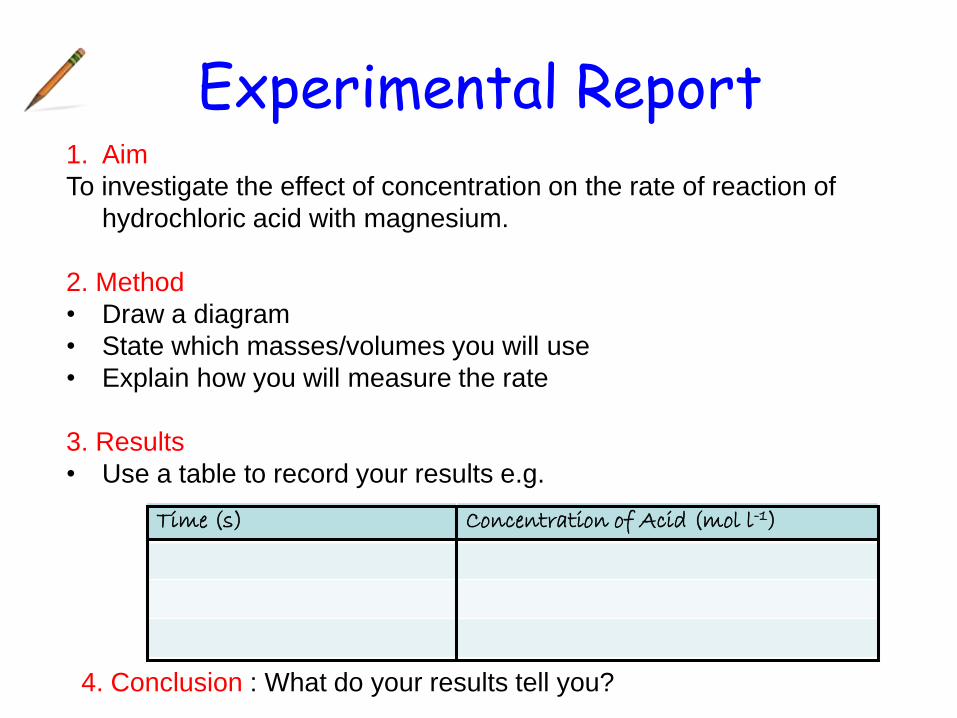
Experimental Report1. Aim
To investigate the effect of concentration on the rate of reaction of
hydrochloric acid with magnesium.
2. Method
• Draw a diagram
• State which masses/volumes you will use
• Explain how you will measure the rate
3. Results
• Use a table to record your results e.g.
Time (s) Concentration of Acid (mol l-1)
4. Conclusion : What do your results tell you?


LESSON STARTER TASK

Lessons 7 & 8

Planning an investigation, noting down the method and the measurements/results we need to take and then completing an investigation report and graph of our results.
Our plan allows us to carry out the investigation in a safe and organised way. The results collected allow us to make a valid conclusion on how varying the concentration of hydrochloric acid affects its rate of reaction with magnesium ribbon.

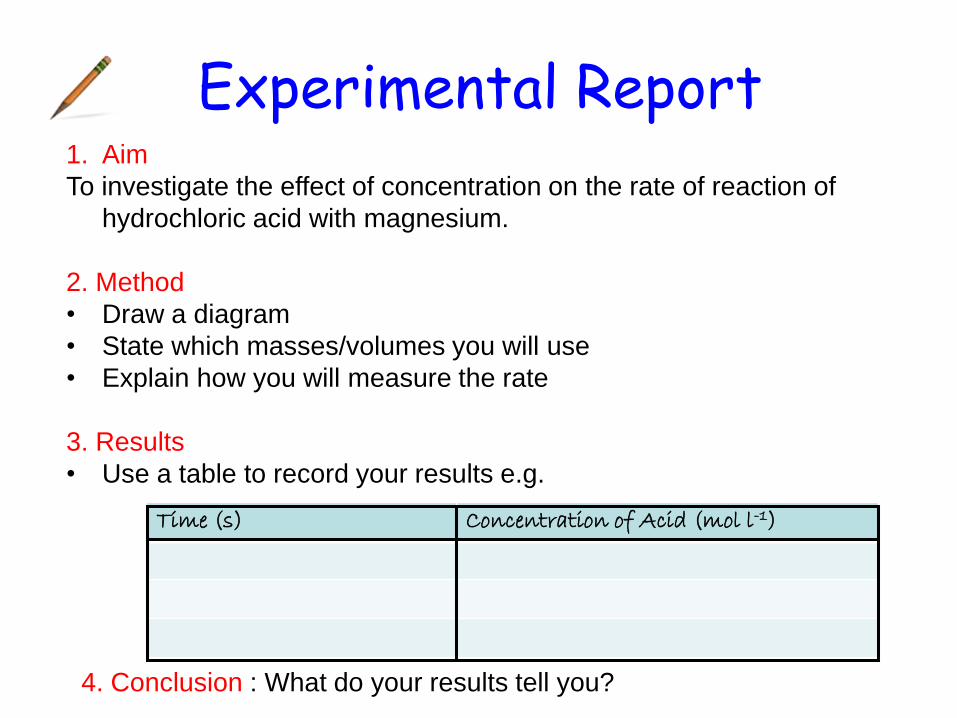
Experimental Report1. Aim
To investigate the effect of concentration on the rate of reaction of
hydrochloric acid with magnesium.
2. Method
• Draw a diagram
• State which masses/volumes you will use
• Explain how you will measure the rate
3. Results
• Use a table to record your results e.g.
Time (s) Concentration of Acid (mol l-1)
4. Conclusion : What do your results tell you?

What? How?
Explain what you have learnt today and how you have learnt it
?

Planning an investigation, noting down the method and the measurements/results we need to take and then completing an investigation report
Our plan allows us to carry out the investigation in a safe and organised way. The results collected allow us to make a valid conclusion on how varying the concentration of hydrochloric acid affects its rate of reaction with magnesium ribbon.

Lesson 9

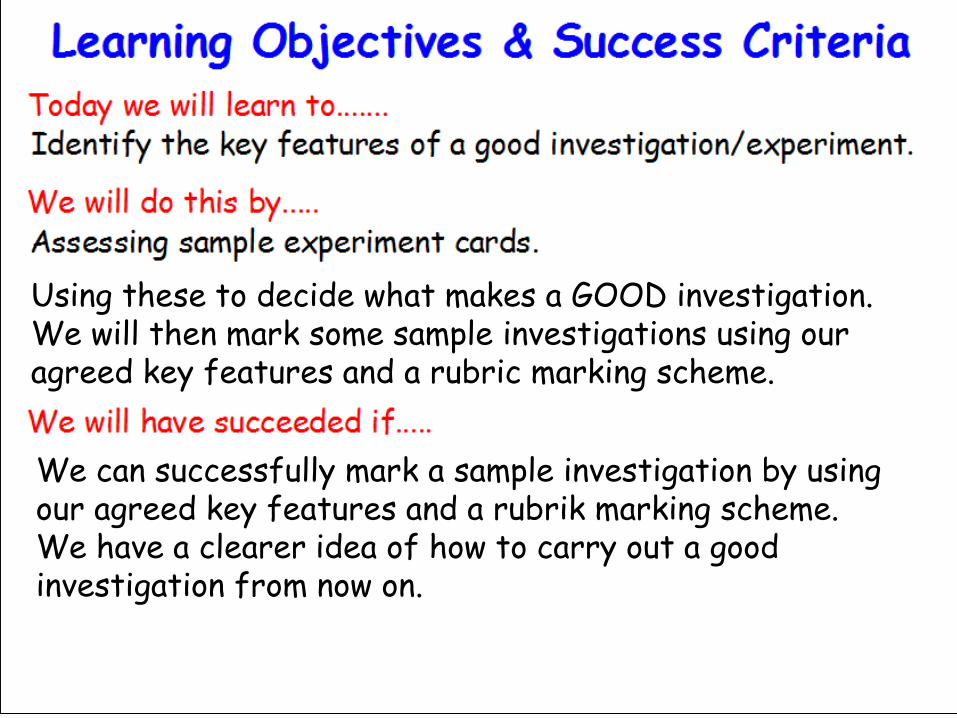
Using these to decide what makes a GOOD investigation. We will then mark some sample investigations using our agreed key features and a rubric marking scheme.
We can successfully mark a sample investigation by using our agreed key features and a rubrik marking scheme.We have a clearer idea of how to carry out a good investigation from now on.


Correct type of graph must have been drawn
line for number vs number data PLUSS
checklist used (Points, Labels, Units, Size & Scale)
It contains an aim, hypothesis, method, results and conclusion. Also desirable is an evaluation.
bar for word vs number data
The investigation should have been considered & planned out (with a data table and the variables to be changed and controlled noted down before experimental work starts).
Experiment should be carried out in an organised, accurate and safe way then cleared up safely.
All results & observations recorded.
The report should be neat, organised and clear, containing all the key information.

Working In Pairs
Use the Rubrik and your new knowledge of what makes a good
investigation to mark the sample investigations completed by other S3
pupils. Complete two stars and a wish for each investigation marked.
THEN
As A Class
We will compare the marks awarded to each investigation. This will
allow us to assess our understanding of what makes a good
investigation.
Investigation Marking

Using these to decide what makes a GOOD investigation. We will then mark some sample investigations using our agreed key features and a rubric marking scheme.
We can successfully mark a sample investigation by using our agreed key features and a rubrik marking scheme.We have a clearer idea of how to carry out a good investigation from now on.
ISSUE RATES HOMEWORK 2

Fist to Five
Rate your understanding of today’s lesson using your fingers.

Lesson 10

Lesson starterTime
(minutes)
Mass lost
(grams)
0.0 0.00
0.5 0.36
1.0 0.52
2.0 0.70
3.0 0.80
4.0 0.86
5.0 0.86
A B C
D E
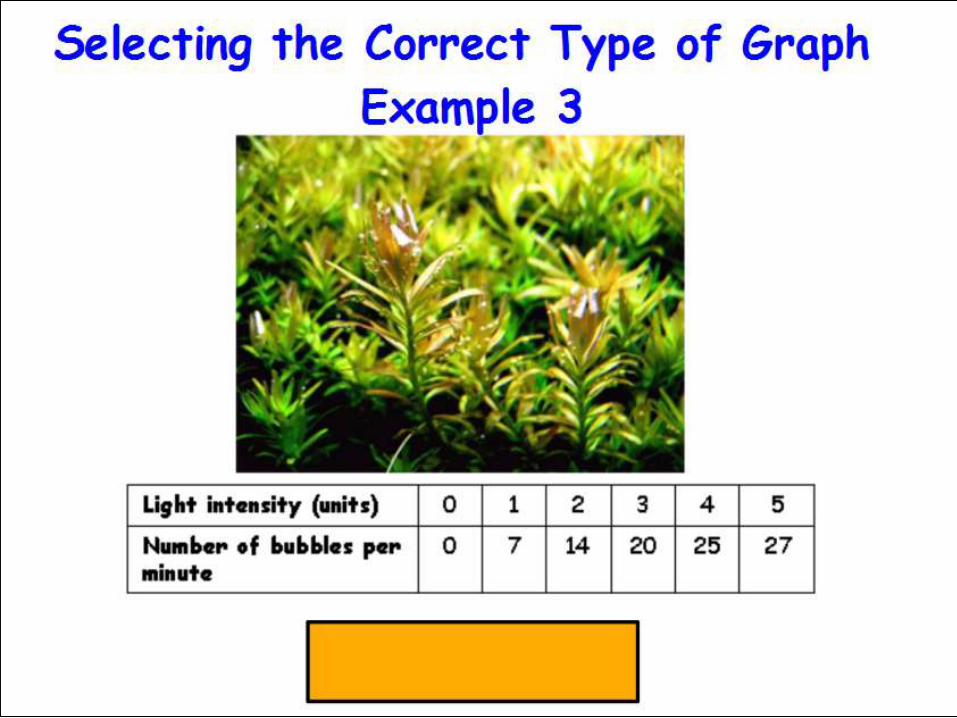
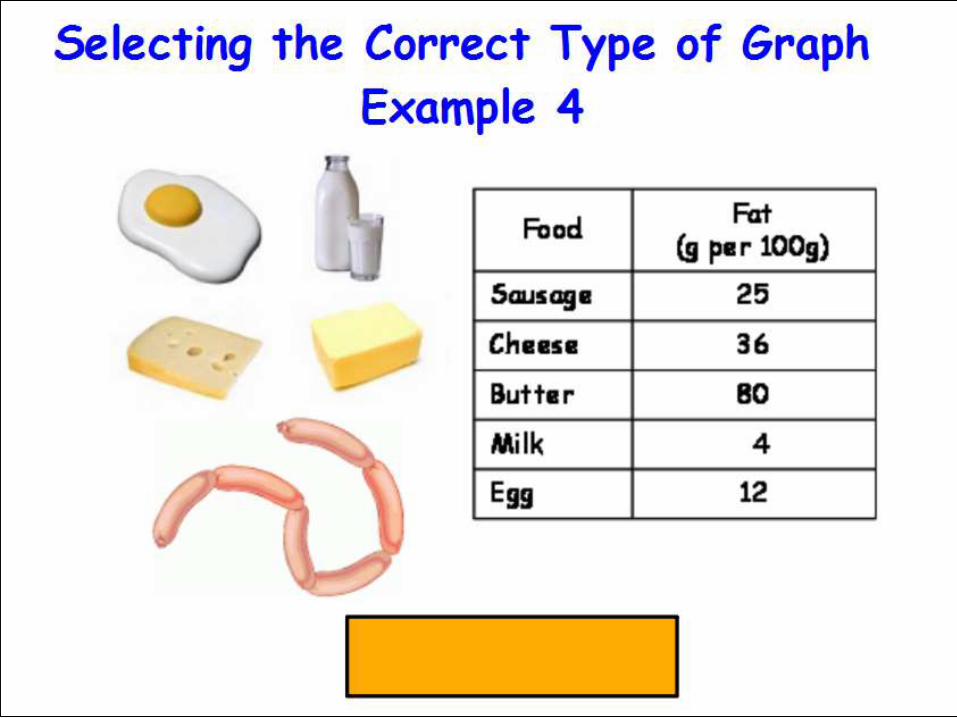
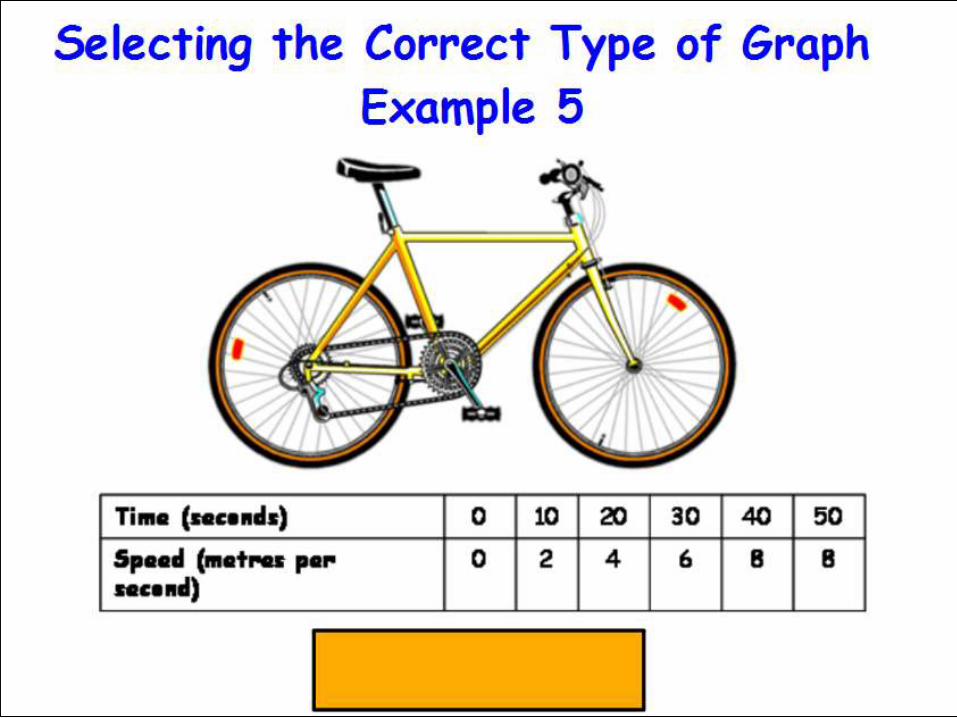
Match the correct name to each graphic type shown above:
Bar graphTable Flowchart Line graph Pie chart
A BC D E

We can select the most appropriate type of graph to draw for our data and describe the features of a good graph.


Correct type of graph must have been drawn
line for number vs number data
Points plotted correctly (1/2 box tolerance allowed)
Labelsincluded on both axes
Units included if available.
Size is appropriate to allow the data to be read
Scale is appropriate and increases in a regular pattern.
bar for word vs number data

We can select the most appropriate type of graph to draw for our data and describe the features of a good graph.


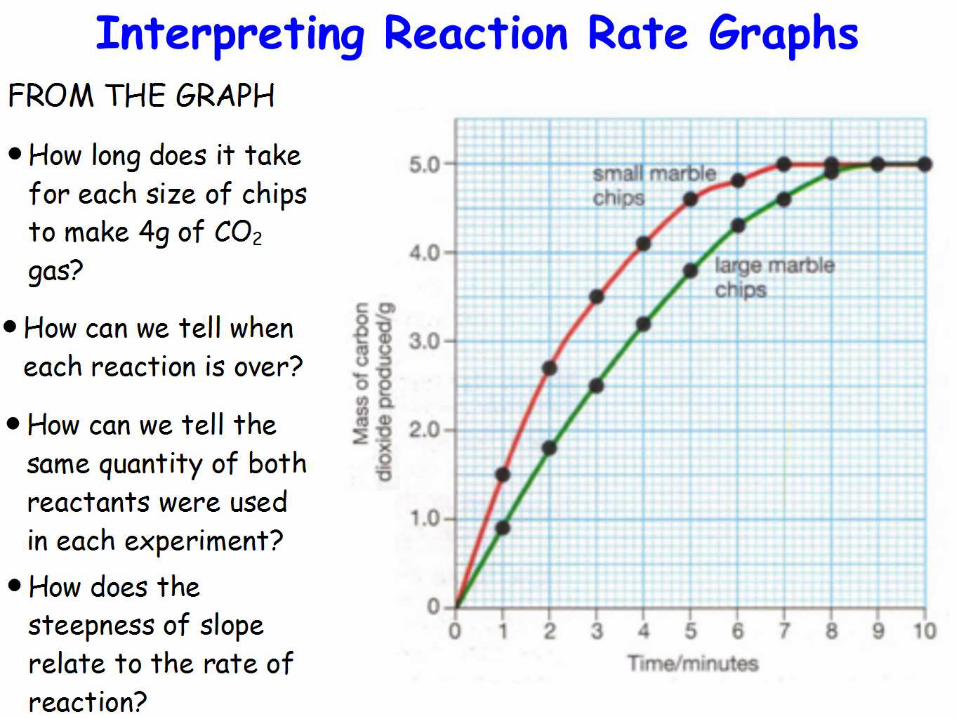
Lessons 11 & 12Interpreting Graphs


Learning Objectives & Success Criteria
Today we will learn to
Interpret graphs used to measure the rate of reaction and
understand the changes to these graphs which can result
from changing certain experimental factors.
We will have succeeded if
We can interpret information about a reaction from a
reaction rate graph. We can predict the effect of altering an
experimental variable on the shape of a reaction rate graph.
We will do this by
Plotting graphs of experimental data in which certain
variables have been altered. Studying our graphs and learning
what the features tell us about the reaction rate.


The Rate Changes
To
tal m
ass o
f
pro
du
ct
(gra
ms
)
Time
(minutes)
Rate is fast: lots of reactants
Rate is slower: less reactants left as some changed into products
Reaction is finished: no reactants left, all changed into products
As the reaction proceeds the concentration of reactants decreases. This means less collisions of the reactants (i.e. less reactions). The reaction therefore slows down and the graph levels off.
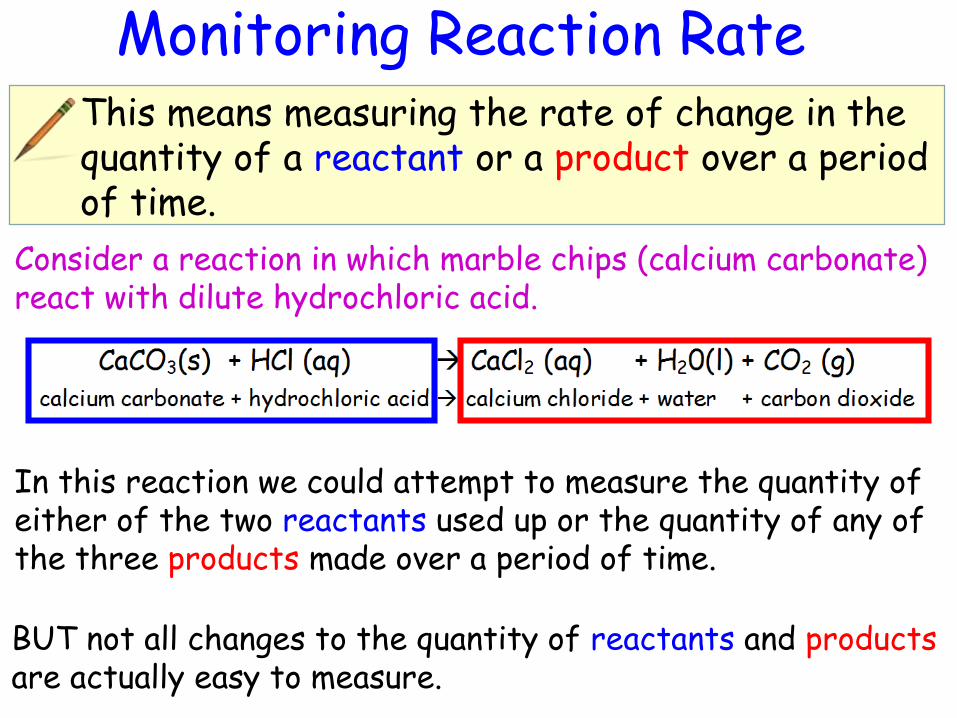
Monitoring Reaction RateThis means measuring the rate of change in the quantity of a reactant or a product over a period of time.
Consider a reaction in which marble chips (calcium carbonate) react with dilute hydrochloric acid.
In this reaction we could attempt to measure the quantity of either of the two reactants used up or the quantity of any of the three products made over a period of time.
BUT not all changes to the quantity of reactants and productsare actually easy to measure.

Methods of Monitoring Reaction Rate1
2 3 4
5
Measure the mass of gas product lost
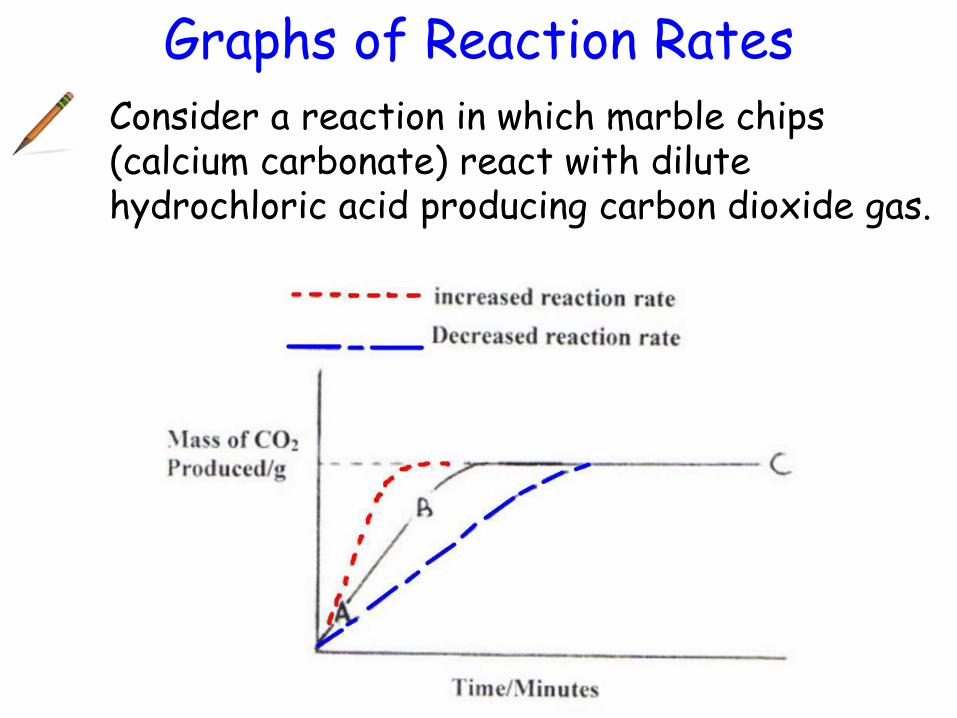
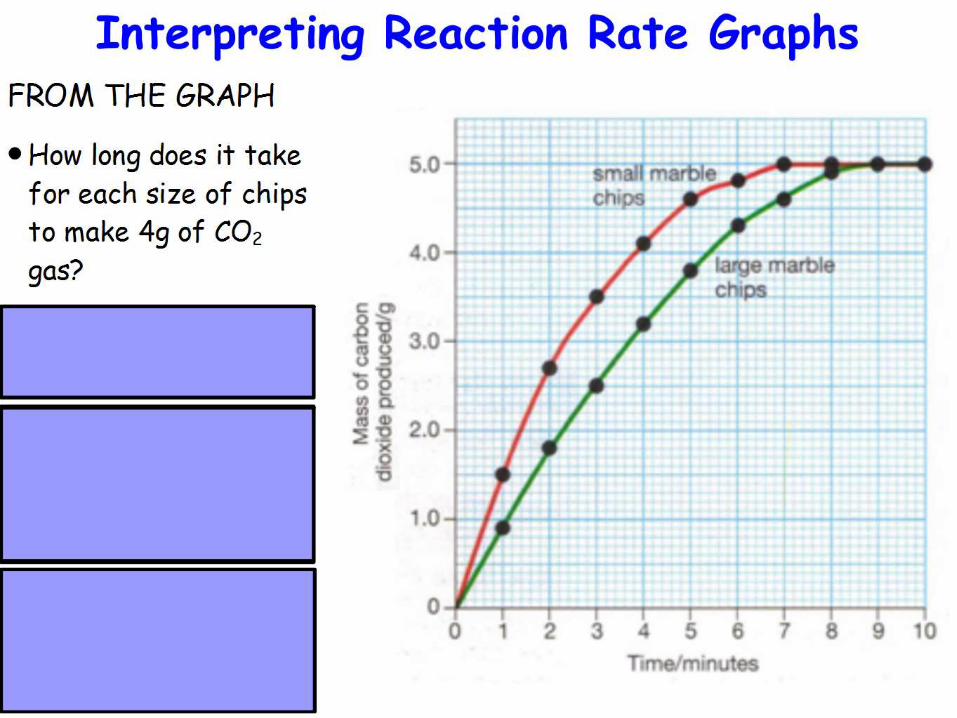
Graphs of Reaction RatesConsider a reaction in which marble chips (calcium carbonate) react with dilute hydrochloric acid producing carbon dioxide gas.

• Slope A – B indicates the reaction rate. When the graph levels off at height C the reaction is complete
• The steeper the slope the faster the reaction.
• The quantity of product(s) formed is limited by the quantity of reactants (so if two curves level off at the same place that means the same quantity of reactants were used in both experiments).

Altered Variable Reaction Rate Graphs
What can we do to each of our three experimental variables to get the decreased reaction rate as shown in the graph? • Increase particle size
• Decrease concentration• Decrease temperature
What can we do to each of our three experimental variables to get the increasedreaction rate as shown in the graph?
• Decrease particle size• Increase concentration• Increase temperature

Learning Objectives & Success Criteria
Today we will learn to
Interpret graphs used to measure the rate of reaction and
understand the changes to these graphs which can result
from changing certain experimental factors.
We will have succeeded if
We can interpret information about a reaction from a
reaction rate graph. We can predict the effect of altering an
experimental variable on the shape of a reaction rate graph.
We will do this by
Plotting graphs of experimental data in which certain
variables have been altered. Studying our graphs and learning
what the features tell us about the reaction rate.


Reaction Rate Extras• There are two “Interpreting Reaction Rate - Graph
Exercises” available (with an extra help sheet for exercise 1 if required).
• There is an animated reaction rate graph PPT.
• In the slides which follow this one there is also a rate graph quiz.

Graph B
Reaction Rate Graph Quiz
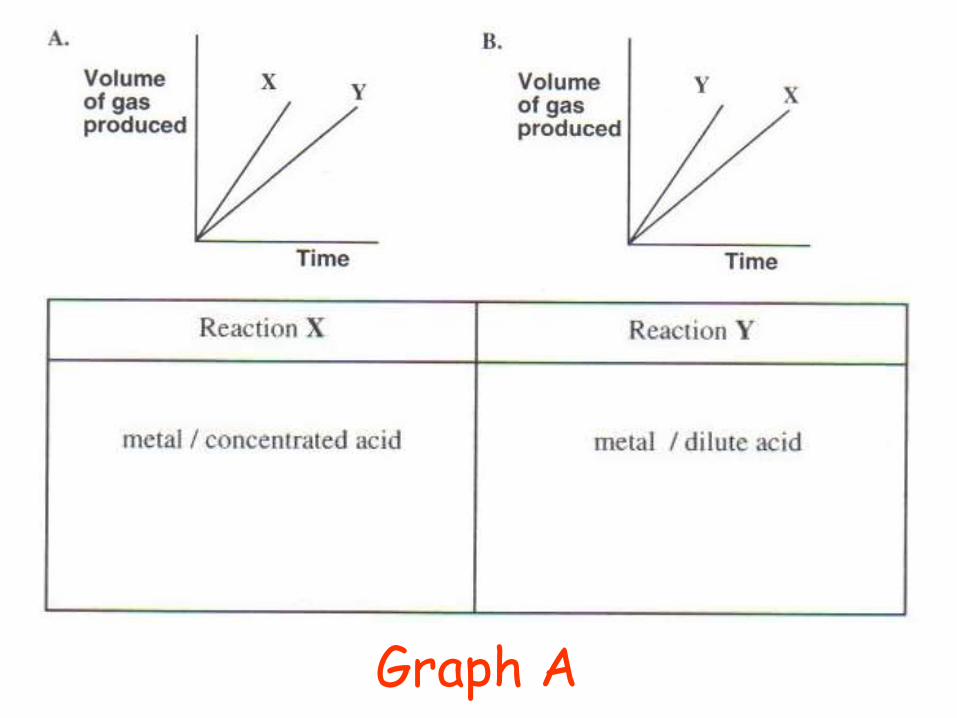
Graph A
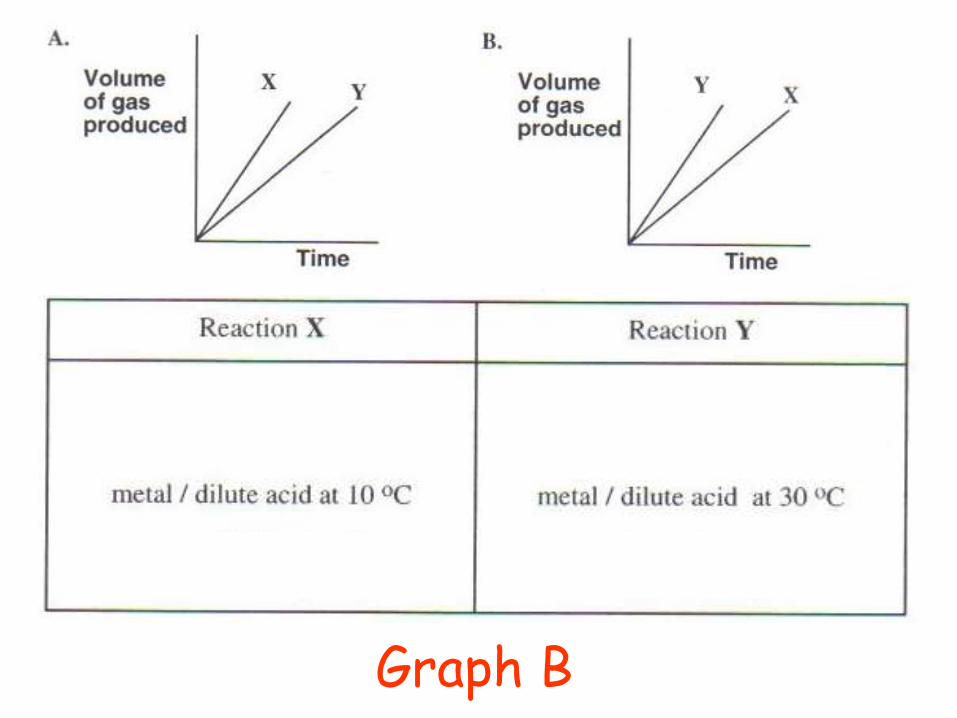
Graph B

Graph A

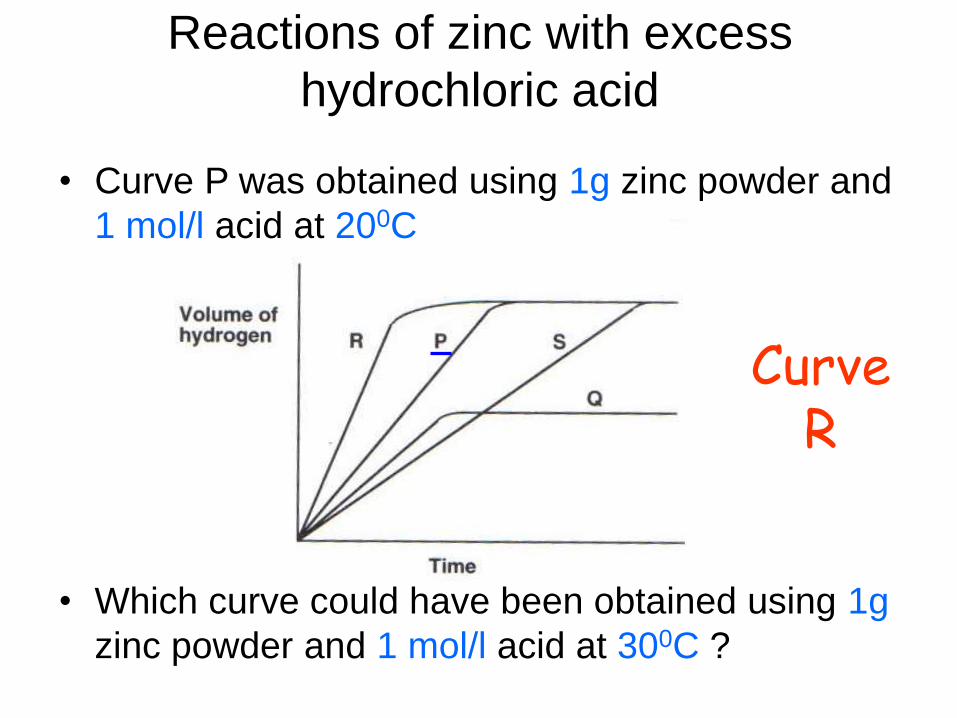
Reactions of zinc with excess
hydrochloric acid
• Curve P was obtained using 1g zinc powder and
1 mol/l acid at 200C
• Which curve could have been obtained using 1g
zinc powder and 1 mol/l acid at 100C ?
Curve S

Reactions of zinc with excess
hydrochloric acid
• Curve P was obtained using 1g zinc powder and
1 mol/l acid at 200C
• Which curve could have been obtained using
0.5g zinc powder and 1 mol/l acid at 200C ?
Curve Q
Reactions of zinc with excess
hydrochloric acid
• Curve P was obtained using 1g zinc powder and
1 mol/l acid at 200C
• Which curve could have been obtained using 1g
zinc powder and 1 mol/l acid at 300C ?
Curve R
Reactions of zinc with excess
hydrochloric acid
• Curve P was obtained using 1g zinc powder and
1 mol/l acid at 200C
• Which curve could have been obtained using 1g
zinc lumps and 1 mol/l acid at 200C ?
Curve S


![PlasmaModule 10 [42,0410,1283] - Fronius Hitsauskoneet I ... · ud_fr_st_sv_00467 012010 IV The fumes given off during welding contain gases and vapors that are harmful to health.](https://static.fdocuments.in/doc/165x107/5c856fb509d3f2f2298c9693/plasmamodule-10-4204101283-fronius-hitsauskoneet-i-udfrstsv00467.jpg)