
Sign Language Program Structure and Content in Institutions of Higher Education in the United States...
133
Sign Language Program Structure and Content in Institutions of Higher Education in the United States 1994 - 2004 Research and Presentation by: • Sheryl B. Cooper, Ph.D. Funding received from: • University of Arkansas RT-31 Statistical assistance from: • Joel Reisman
-
Upload
gordon-park -
Category
Documents
-
view
213 -
download
0
Transcript of Sign Language Program Structure and Content in Institutions of Higher Education in the United States...
Sign Language ProgramStructure and Content
in Institutions of Higher Education in the United States
1994 - 2004
Research and Presentation by:
• Sheryl B. Cooper, Ph.D.
Funding received from:
• University of Arkansas RT-31
Statistical assistance from:
• Joel Reisman

Purpose of the Original Study
To identify these characteristics
of U.S. post-secondary sign language programs:
Structure,
Organization,
Staffing,
Administration of such programs,
and gather Recommendations from current administrators for how such programs should be
structured and administered.

Definition of Sign Language for these Studies
Includes any form
of signed languageASL
Contact Signing
Signed English

Historical Perspective
Research in the 1980’s provided: Basic demographic information re:
the extent of sign language in US (Battison & Carter, 1982)
Explanations re: increasing popularity (Shroyer & Holmes, 1980)
List of IHEs thought to offer sign language (Reflector, 1982, 1983, 1984, Cokely,
1986)

Historical Perspective continued . . .
Research in the 1980’s provided:
Limited statistics on numbers of students enrolled (Shroyer & Holmes, 1980; Cogen & Mosely, 1984)
Types of course offerings, degrees, certificates (Cogen & Mosely, 1984)

Historical Perspective continued . . .
No research 1986-1994 to enable administrators to: make comparative decisions about program
content or location (which department?) improve the quality of sign language
instruction through standardization of faculty qualifications sign language curriculum program structure

Original Institutions Sampled
ASHA Directory 1994 (n=137)April 1994 American Annals of the Deaf
Deaf Education Programs (n=60) Programs for Training Professionals (Deaf) Programs for Training Professionals (Deaf-blind) Interpreter Training Programs (n=63) Post-secondary Special Support Programs for
Deaf Students (n=9)continued . . .

Institutions Sampled continued . . .
• CIT Directory 1995 (n=96)• Less Commonly Taught Languages List
(U. of Minn) (n=45)• E-mail requests: SLLING, DEAF-L (n=48)• List of colleges “known” to teach sign
language (Reflector, 1984) (n=772)

Total Questionnaires Sent
1994• 1230 questionnaires mailed out• Approximately 991 institutions represented
2004• 983 questionnaires mailed out• Duplicates, etc. deleted

Changes for 2004 Survey
• Multiple questionnaires not sent to same institutions
• Questionnaires not sent to closed institutions
• Wording changed to encourage responses from institutions with sign language classes (even if no program existed)
• Some items modified to elicit better responses.

Responses Received
1994:• 371 responses total• 362 different institutions• 301 taught sign language
2004:• 242 responses total• 180 taught sign language

Research Areas
1. Characteristics of Institutions and Academic Status of Sign Language
2. Characteristics of Administrators
3. Characteristics of Sign Language InstructorsData available in American Annals of the Deaf, April 2008 issue
4. Program Structure*
5. Content, Curriculum and Resources*
6. Recommendations of Current Administrators*
* 2004 results and comparisons included today

Research Areas
Results:
GREEN indicates statistically significant changes between studies.For this set of studies,
significance was set at p < .05.
RED indicates interesting information or
statistical significance of p = .05 - .99.

Research Question #1
What are the characteristics of the institutions of higher education offering sign language classes, and what is the academic status of sign language at these institutions?

Characteristics of Responding Institutions
Research Question #1/Results
Total Student Enrollment 1994 2004
<5K 28% 38%
5-15K 43% 30%
15-30K 21% 23%
<30K 8% 9%
Fewer medium-sized schools and more large schools responded to the second survey.
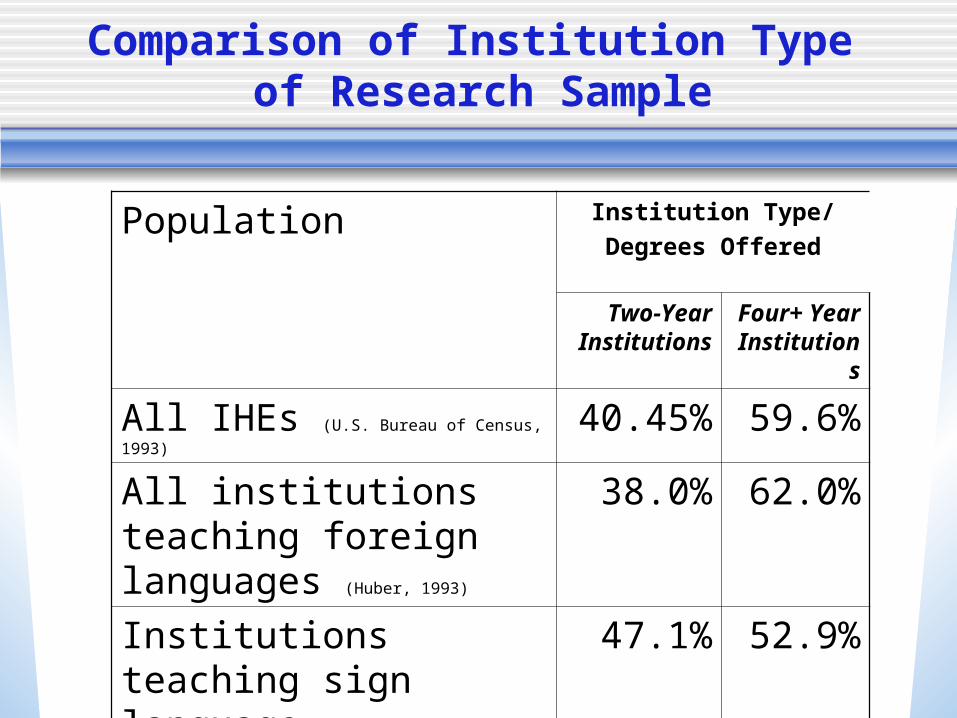
Comparison of Institution Type of Research Sample
Population Institution Type/
Degrees Offered
Two-Year Institutions
Four+ Year Institutions
All IHEs (U.S. Bureau of Census, 1993) 40.45% 59.6%
All institutions teaching foreign languages (Huber, 1993)
38.0% 62.0%
Institutions teaching sign language (Cooper, 1994)
47.1% 52.9%
Institutions teaching sign language (Cooper, 2004)
45.0% 55.0%

Comparison of Institution Type of Research Sample
Highest Degree offered
1994 2004
Associate’s 46.8% 45.0%
Bachelor’s 8.5% 13.3%
Master’s 20.0% 16.7%
Doctorate 24.8% 25.0%

Research Question #1/Results Academic Status of
Sign Language
The results showed that
the status of sign language
has improved significantly
in the past 20 years!
How do we see this?

Research Question #1/Results Academic Status of
Sign Language
1. Increasing numbers of programs in schools
2. Increased enrollment in classes
3. Increased percentage of credit-bearing classes
4. Increase in acceptance as General Education requirement
5. Increase in acceptance as a foreign language requirement

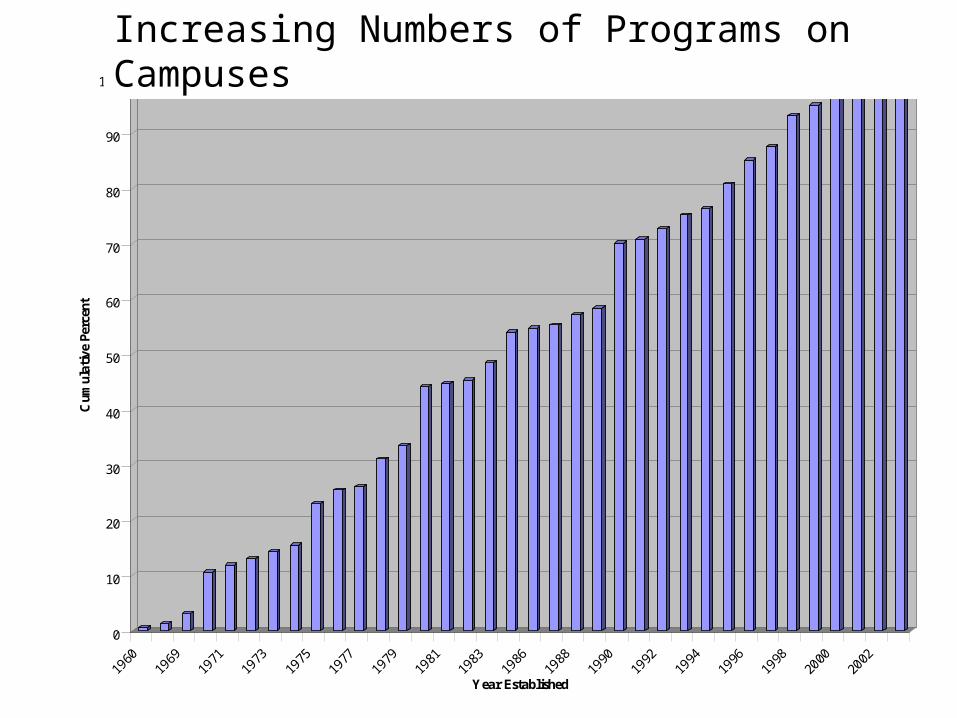
Question 1: Supporting Data
1. Increasing number of programs
0
10
20
30
40
50
60
70
80
90
100
Cum
ula
tive P
erc
ent
Year Established
Increasing Number of Programs on Campuses
Notice how many programs showed up after DPN and ADA!
0
10
20
30
40
50
60
70
80
90
100C
umul
ativ
e Pe
rcen
t
1960
1969
1971
1973
1975
1977
1979
1981
1983
1986
1988
1990
1992
1994
1996
1998
2000
2002
Year Established
Increasing Number of Programs on CampusesIncreasing Numbers of Programs on Campuses

Question 1: Supporting Data
Self-report of enrollment during past 3 years 1994
2004• Increased: 64.8% 52.2%• Remained stable: 29.9% 38.5%• Decreased: 5.3% 9.3%
2. Increasing enrollment in classes

Question 1: Supporting Data
ADFL Study, (Huber, 1995)ASL ranked #13 in student enrollment across all IHEs
The Top Twelve Languages taught in colleges:1. Arabic2. Chinese3. French4. German5. Ancient Greek6. Hebrew….
2. Increasing enrollment in classes

Question 1: Supporting Data
7. Italian8. Japanese9. Latin10. Portuguese11. Russian12. Spanish
“More than 60,000 students were enrolled in ASL courses, and ASL has become the fastest-growing language in terms of student interest.”
2. Increasing enrollment in classes

Question 1: Supporting Data

Question 1: Supporting Data
• 1980: 13% of sign language classes credit-bearing (Shroyer & Holmes)
• 1994: 84% credit-bearing (Cooper)
• 2004: 86.1% credit-bearing, undergrad 8.9% credit-bearing, graduate (Cooper)
More four year institutions offer credit-bearing classes (89.7%) than two year institutions (79.1%).
3. Increased percentage of credit-bearing classes

Question 1: Supporting Data
• Does the institution accept sign language in fulfillment of any requirement (FL, GenEd, etc)?
1994: 62% 2004: 67%
• Are changes being considered in this area?1994: 28% 2004: 28%
• 85.2% accept as requirement when non-credit classes excluded (1994).
4. increase in acceptance as graduation requirement

Question 1: Supporting Data
Does your institution have a foreign language requirement?
1994 2004
Yes, for all majors
18.43% 25.56%
Yes, for some majors
40.27% 48.33%
No 41.30% 26.11%
5. increase in acceptance for foreign language requirement
Question 1: Supporting Data
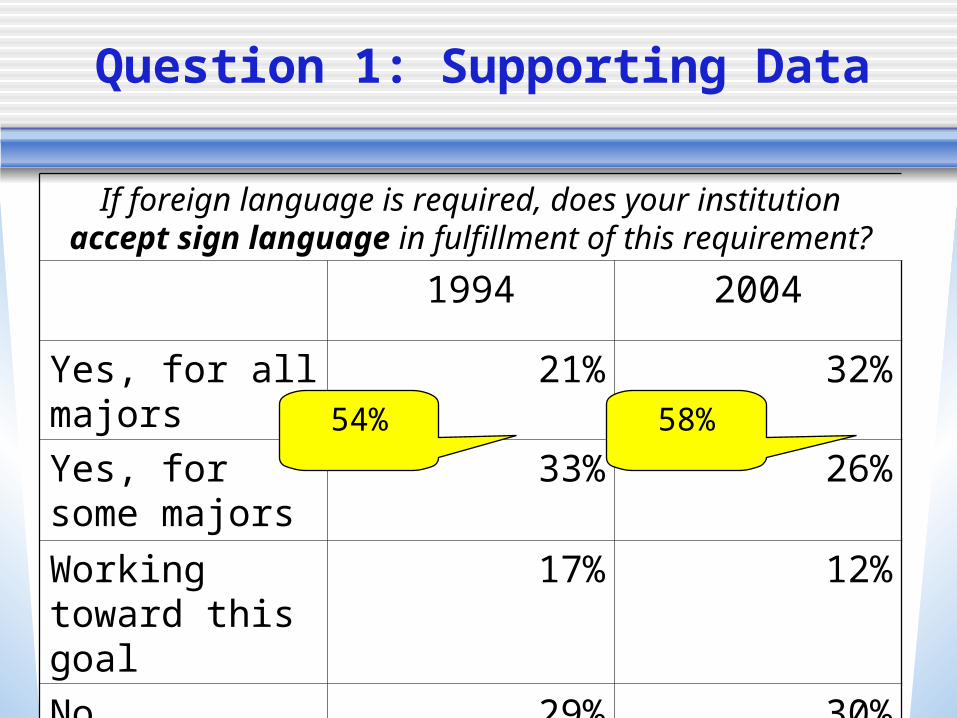
If foreign language is required, does your institution accept sign language in fulfillment of this requirement?
1994 2004
Yes, for all majors
21% 32%
Yes, for some majors
33% 26%
Working toward this goal
17% 12%
No 29% 30%
54% 58%
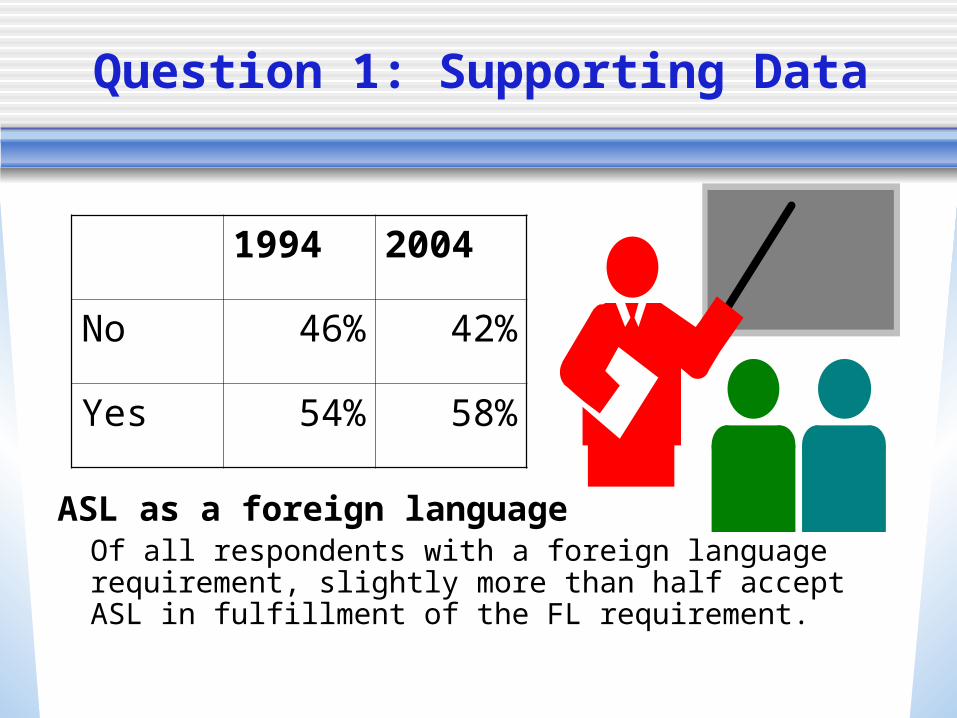
Question 1: Supporting Data
ASL as a foreign language Of all respondents with a foreign language requirement, slightly more than half accept ASL in fulfillment of the FL requirement.
1994 2004
No 46% 42%
Yes 54% 58%

Planned Changes?
Are any changes planned or being considered for accepting sign language as a foreign language?
1994: 16% 2004: 22%
(Types of changes: see next screen)

Planned Changes
What type of changes are being considered regarding ASL and foreign languages?
1. Accepting as transfer between 2-4 year schools
2. Moving SL into FL department
3. Acceptance of ASL as FL
4. Correcting terminology (foreign language, modern language, indigenous language)
5. Accept SL as GenEd

Planned Changes?
Are any changes planned or being considered for accepting sign language as a general education or non-major requirement for graduation?
1994: 18% 2004: 18%
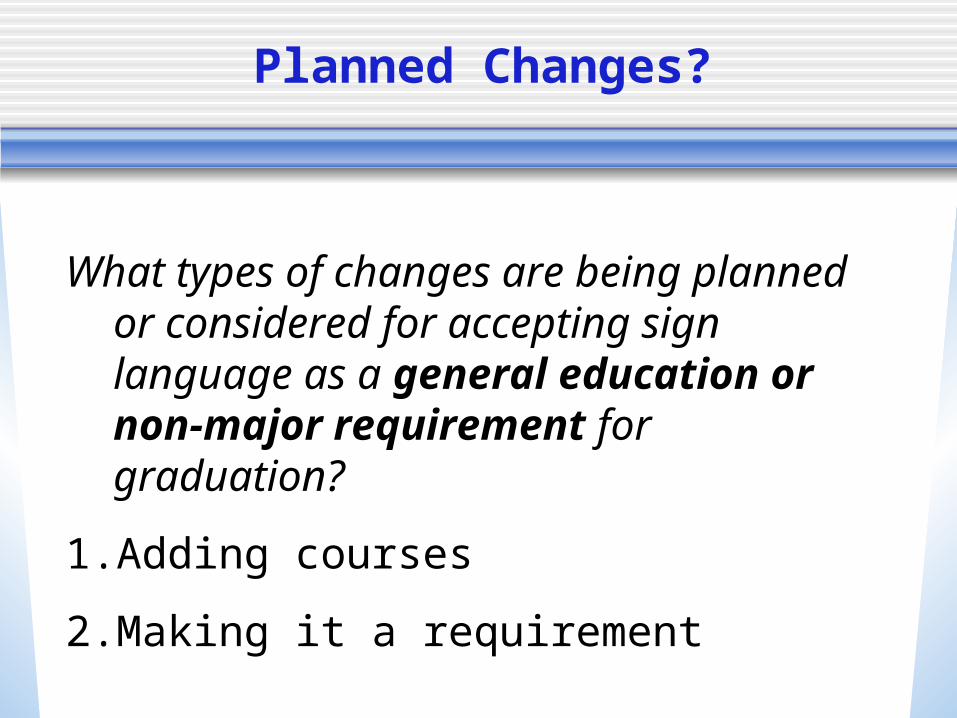
Planned Changes?
What types of changes are being planned or considered for accepting sign language as a general education or non-major requirement for graduation?
1. Adding courses
2. Making it a requirement

Transfer Credit
If your institution has a foreign language requirement, do you accept sign language transfer credits to fulfill this requirement?
1994 2004
Yes 68% 65%

Staffing
Does your institution have a sign language staff size greater than one full-time equivalent (FTE)?
1994 2004
Yes 51% 63%

Research Question #2
What are the characteristics, qualifications, duties, priorities, and concerns of administrative personnel in sign language programs in institutions of higher education?

Research Question #2/Results
“The perspective depends
on the administrator’s background.”
What are the characteristics, qualifications, duties, priorities, and concerns of administrative personnel in sign language programs in institutions of higher education?

Job Classifications of Program Administrators 1994
1994:Administration 19.4%
Dean, provost, etc. 6.7% Dept/division chair 12.7%
Teaching 60.6% Academic Prgrm Coord 26.0% Faculty 20.3% Sign Language Instr. 14.3%
Staff 20.0% Professional Staff 13.7% Paraprofesional Staff 4.3% Other 2.0%

Job Classifications of Program Administrators 2004
2004Primary Role of Sign Language Program
Administrator
22% Administrator overseeing several programs11.5% Administrator overseeing only SL and deaf-
related programs43.5% Full-time teaching faculty overseeing SL
classes12% Part-time teaching faculty overseeing SL
classes11% Other

Job Classifications of Program Administrators 2004
Level of SL Program Administrator 2004Faculty:
Instructor: 32.0%Asst Prof: 16.0%Assoc. Prof. 16.0%Full Prof: 19.5%
Staff /Adm: 16.5%
(Administrators: director of community education, department chair, dean, clinic director, etc.)

Employment Status of Program Administrators
• Full-time or
Part-time?
1994 2004
Full-time
83% (duties not limited to
SL)
85% (duties not limited to
SL
Part-time
17% 15%

Employment Status of Program Administrators
• Are the sign language program administrators temporary or permanent?
1994 2004
Temp. 14.5% 9%
Perm. 85.5% 91%

Employment Status of Program Administrators
• Are the sign language program administrators tenured or
non-tenured?
1994 2004
Tenured 43% 39%
Tenure Track
9% 17%
Non-Tenure Track
48% 44%
52% 56%
Significant change!

Qualifications of Administrators
Are sign language program administrators personally involved in the Deaf
Community?
1994 2004
“yes” 63% 70%
average # of years
14.28 17.40

Qualifications of Administrators
1994 2004
Average # of years
17.18 20.58
Are sign language program administrators professionally involved in the Deaf
Community?

Qualifications of Administrators
Self-Reported Signing Skills of Administrators
1994 2004
Non-signer 22% 16.5%
Beginner 2.5% 6%
Advanced Beg 4% 1%
Intermediate 10.5% 10%
Advanced 18% 13.5%
Fluent 43% 53%

Qualifications of Administrators
Extent Sign Language is Used at Work
1994 2004
Primary 17% 17%Daily, in class only
3% 7%
Daily, all 39% 37%
Several x/wk 9% 12%
<3x/week 7% 5.5%Rarely/
Never25% 21.5%

Qualifications
• Academic Majors of Program Coordinators
Varied, more deaf-specific at Master’s level

Qualifications of SL Administrators
• Administrator involvement with Deaf People
1994: 33% of respondents indicated NO INVOLVEMENT with Deaf people.
2004: 30.2% of respondents indicated NO INVOLVEMENT with Deaf people.

Signing Skills of Administrators
Non-signers 1994: 22%Non-signers 2004: 16%
FT administrators were less likely to be skilled signers. Part-time administrators were more likely to be skilled signers.

Job Duties of Administrators
1994 2004Teaching 53% 66.5%
Research 3% 8%
Service 4.5% 6%
Administration 34.5% 25%
Advising 5.5% 4%
How do you spend most of your time?
Numbers do not total 100% due to “tied priorities” among respondents.

Job Duties of Program Coordinator
Does the program coordinator have a reduced teaching load?
1994 2004
No 84% 70%
Yes 16% 30%

Job Duties of Program Administrator
Does the sign language program coordinator get extra months on a contract?
1994 2004
No 92% 94.5%
Yes 8% 5.5%

Job Duties of Program Administrator
Does the sign language program coordinator get a salary stipend?
1994 2004
No 86% 86%
Yes 14% 14%

Job Duties of Program Administrator
Does the sign language program coordinator get staff support or student assistance?
1994 2004
No 76% 80%
Yes 24% 20%
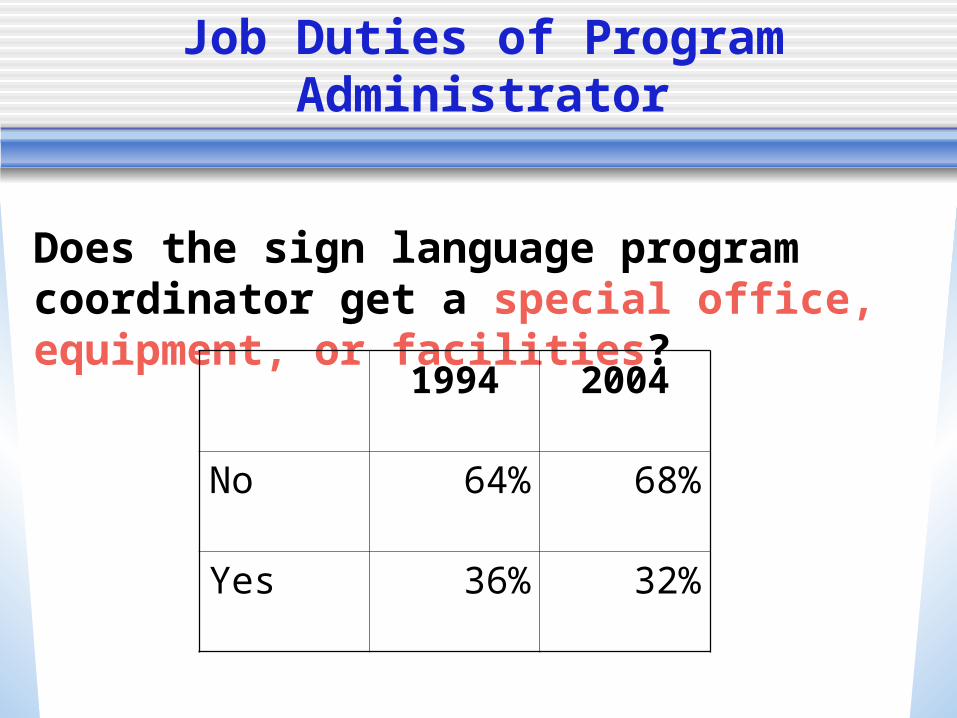
Job Duties of Program Administrator
Does the sign language program coordinator get a special office, equipment, or facilities?
1994 2004
No 64% 68%
Yes 36% 32%

Administrative Concerns
Management Problems 1994 1. Obtaining and hiring staff 2. Managing budget 3. Lack of opportunity to do research
Biggest Changes:1994 2004
Evaluating teachers 57% 44%Dealing w/complaints 46% 32%Resolving student concerns 60% 45%

Financial Needs and Desires of Sign Language Program Coordinators
Budget
Area of
Greatest
Need
1994 2004
More sections of existing courses
15% 19%
New courses 19% 17%
Technology 16% 17%
Books, videos, etc 16% 16%
Hire/increase student workers 2% 2%
Pay guest speakers 3% 6%
In-service training for faculty 15% 15%
Other 14% 8%

Dichotomies among Program Administrators
• Signers/Non-signers
• Teachers/Administrators

Research Question #3
What are the characteristics and expectations of teaching staff in post-secondary sign language classes?

Teaching Staff Characteristics
1994 52% of responding institutions had no FT sign language staff.
Half of the remaining 48% had only 1 FT person.
97% had 4 or fewer FT positions.

Teaching Staff Characteristics
1994 2004
.89 1.16
Average # of FT SL Instructors per institution
Significant at .0466 per Wilcoxon
Average # of PT SL Instructors per institution
1994 2004
2.95 3.29Significant at .0299 per Wilcoxon

Teaching Staff Characteristics
All Respondents:
(Only from “yes”)
How many?
Top + bottom = 100%
Do you have any of these? Yes?
1994 2004 1994 2004
Full-time 23.1% 26.1% 48.1% 56.7%
Part-time 76.9% 73.9% 87.1% 91.5%
Full-time vs. Part-time Status
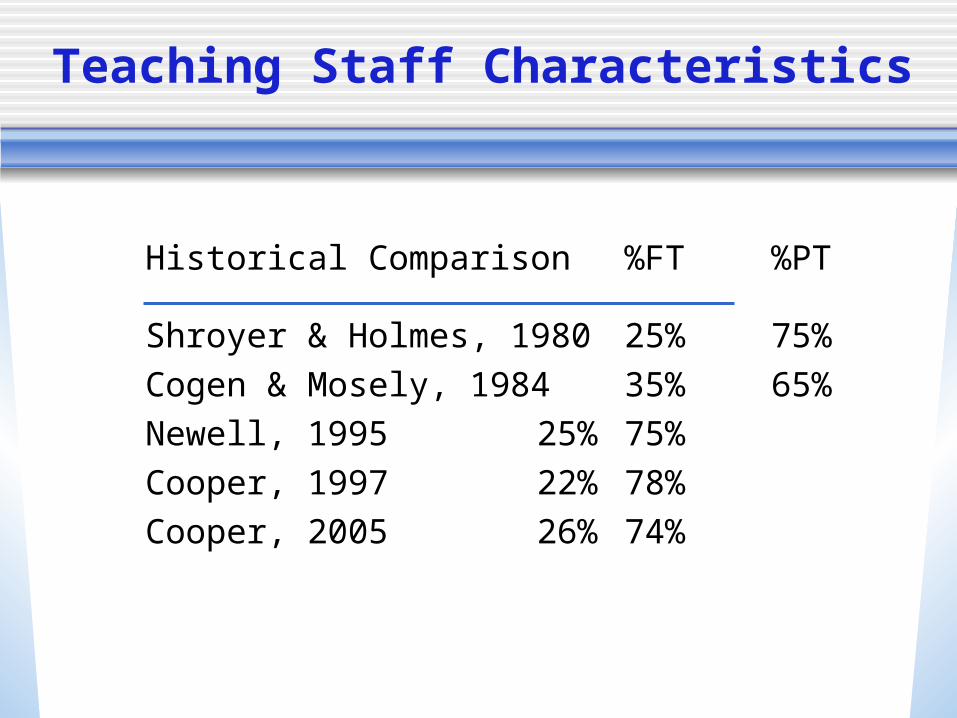
Teaching Staff Characteristics
Historical Comparison %FT %PT
Shroyer & Holmes, 1980 25% 75%
Cogen & Mosely, 1984 35% 65%
Newell, 1995 25% 75%
Cooper, 1997 22% 78%
Cooper, 2005 26% 74%

Teaching Staff Characteristics
All Respondents:
(Only from “yes”)
How many?
Top + bottom = 100%
Do you have any of these? Yes?
1994 2004 1994 2004
Male 29.6% 31.4% 57.0% 66.5%
Female 70.4% 68.6% 91.5% 91.5%
Gender

Teaching Staff Characteristics
All Respondents:
(Only from “yes”)
How many?
Top + bottom = 100%
Do you have any of these? Yes?
1994 2004 1994 2004
Male 36.0% 34.0% 23.6% 27.4%
Female 64.0% 66.0% 37.6% 42.1%
Gender: Full-time only
Teaching Staff Characteristics
All Respondents:
(Only from “yes”)
How many?
Top + bottom = 100%
Do you have any of these? Yes?
1994 2004 1994 2004
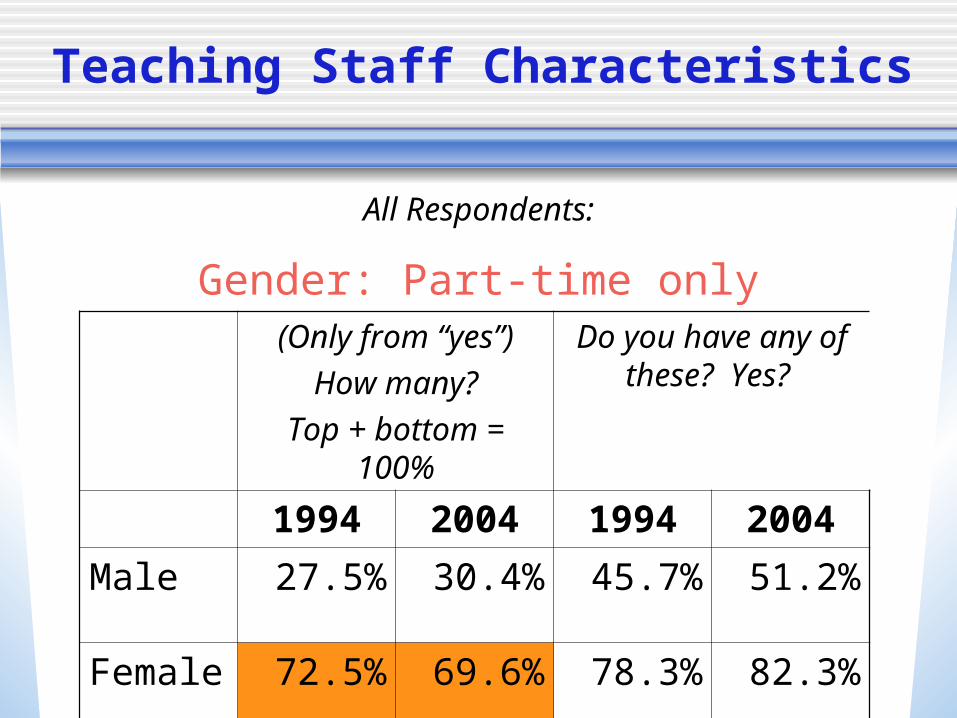
Male 27.5% 30.4% 45.7% 51.2%
Female 72.5% 69.6% 78.3% 82.3%
Gender: Part-time only

Teaching Staff Characteristics
Researchers/Yr %Male %Female
Battison/Carter, 198229% 71%
Newell, 1995 26% 74%
Cooper, 1997 (pub) 36% 64%
Cooper, 2004 31.5% 68.5%
(PT and FT combined)
Historical Comparison
Gender of Sign Language Instructors

Teaching Staff Characteristics
All Respondents:
(Only from “yes”)
How many?
Top + bottom = 100%
Do you have any of these? Yes?
1994 2004 1994 2004
Deaf 44.6% 46.2% 59.4% 69.2%
Hearing 52.2% 50.9% 80.5% 85.5%
Hard of Hearing
3.2% 2.9% 9.4% 10.7%
Hearing Status

Teaching Staff Characteristics
All Respondents:
(Only from “yes”)
How many?
Top + bottom = 100%
Do you have any of these? Yes?
1994 2004 1994 2004
Deaf 36.2% 47.3% 23.1% 32.1%
Hearing 63.0% 51.1% 37.1% 39.0%
Hard of Hearing
0.8% 1.6% 0.8% 1.9%
Hearing Status: Full-time only

Teaching Staff Characteristics
All Respondents:
(Only from “yes”)
How many?
Top + bottom = 100%
Do you have any of these? Yes?
1994 2004 1994 2004
Deaf 47.4% 45.8% 53.1% 58.5%
Hearing 48.6% 50.8% 64.5% 70.4%
Hard of Hearing
4.0% 3.3% 9.0% 8.8%
Hearing Status: Part-time only

Teaching Staff Characteristics
Institutions responding to both 1994 and 2004 surveys; n=68Not all institutions responded to all items
(Only from “yes”)
How many?
Do you have any of these? Yes?
1994 2004 1994 2004
Deaf 40.9% 49.6% 31.9% 44.8%Hearing 58.1% 48.7% 48.5% 50.8%
Hard of Hearing
1.1% 1.7% 1.5% 3.0%
Hearing Status: Full-time

Teaching Staff Characteristics
Researchers/Yr %Deaf/HOH %HrgBattison/Carter, 1982 24% 76%Delgado, 1984 22% 78%Cogen/Mosely, 1984 30% 70%Newell, 1995 55% 45%Cooper, 1997 (pub) 47% 53%Cooper, 2004 49% 51%
(PT and FT combined)
Historical ComparisonHearing Status of SL Instructors

Teaching Staff Characteristics
All respondents:
(Only from “yes”)
How many?
Top + bottom = 100%
Do you have any of these? Yes?
1994 2004 1994 2004
Tenured 39.0% 29.0% 21.4% 21.9%
Tenure Track
24.9% 27.6% 14.9% 22.6%
NonTenure Track
36.2% 42.5% 17.6% 27.1%
Tenure Status: Full-time

Teaching Staff Characteristics
All Respondents:
(Only from “yes”)
How many?
Top + bottom = 100%
Do you have any of these? Yes?
1994 2004 1994 2004< Bachelor’s 20.7% 11.6% 33.2% 26.1%Bachelor’s 33.3% 34.2% 48.4% 60.3%Master’s 40.1% 46.1% 69.5% 76.4%Doctorate 5.9% 8.1% 18.8% 23.6%
Highest Degree
Historical Comparison
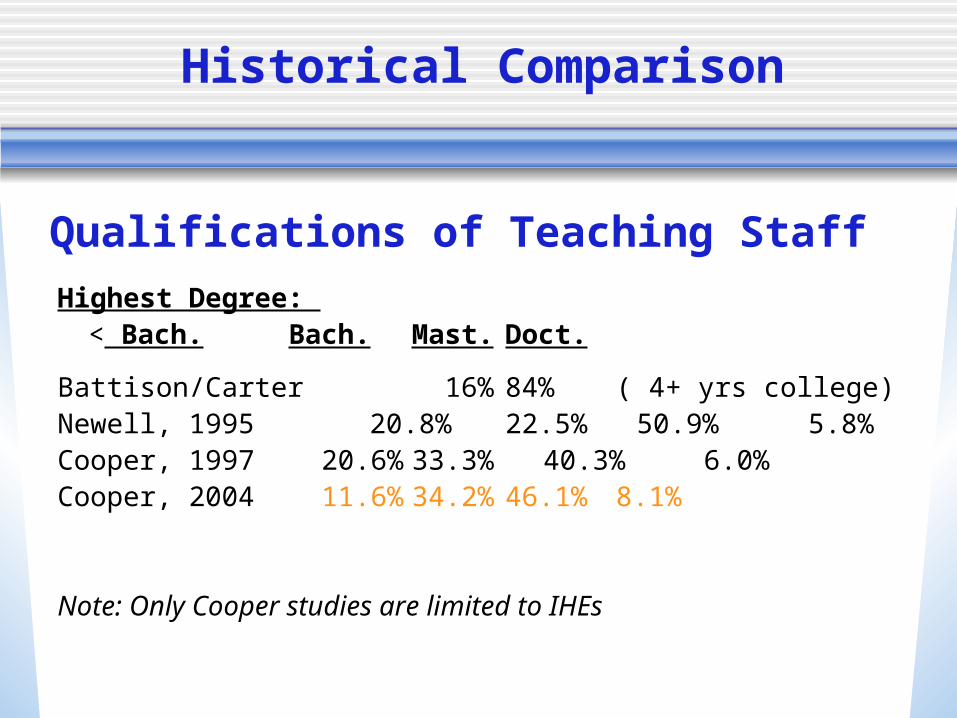
Highest Degree: < Bach. Bach. Mast. Doct.
Battison/Carter 16% 84% ( 4+ yrs college)Newell, 1995 20.8% 22.5% 50.9% 5.8%Cooper, 1997 20.6% 33.3% 40.3% 6.0%Cooper, 2004 11.6% 34.2% 46.1% 8.1%
Note: Only Cooper studies are limited to IHEs
Qualifications of Teaching Staff

Teaching Staff Characteristics
All respondents:
(Only from “yes”)
How many?
Do you have any of these? Yes?
1994 2004 1994 2004< 3 years 17.8% 13.8% 35.2% 33.3%3-6 years 23.6% 21.1% 41.0% 42.0%> 6 years 58.6% 65.1% 80.1% 83.3%
Teaching Experience

Historical Comparison
Researchers/Yr % of instr. w/> 3 yrs exp.
Battison/Carter, 1982 40.0%Newell, 1995 82.8%Cooper, 1997 (pub) 82.4%Cooper, 2004 86.2%
(PT and FT combined)
Years of Experience of Sign Language Instructors

Teaching Staff Characteristics
All Respondents(n=161)
(Only from “yes”)
How many?
Do you have any of these? Yes?
1994 2004 1994 2004White n/a 92.6% n/a 99.4%Non-white n/a 7.4% n/a 23.6%
Race/Ethnicity: FT + PT
Teaching Staff Duties
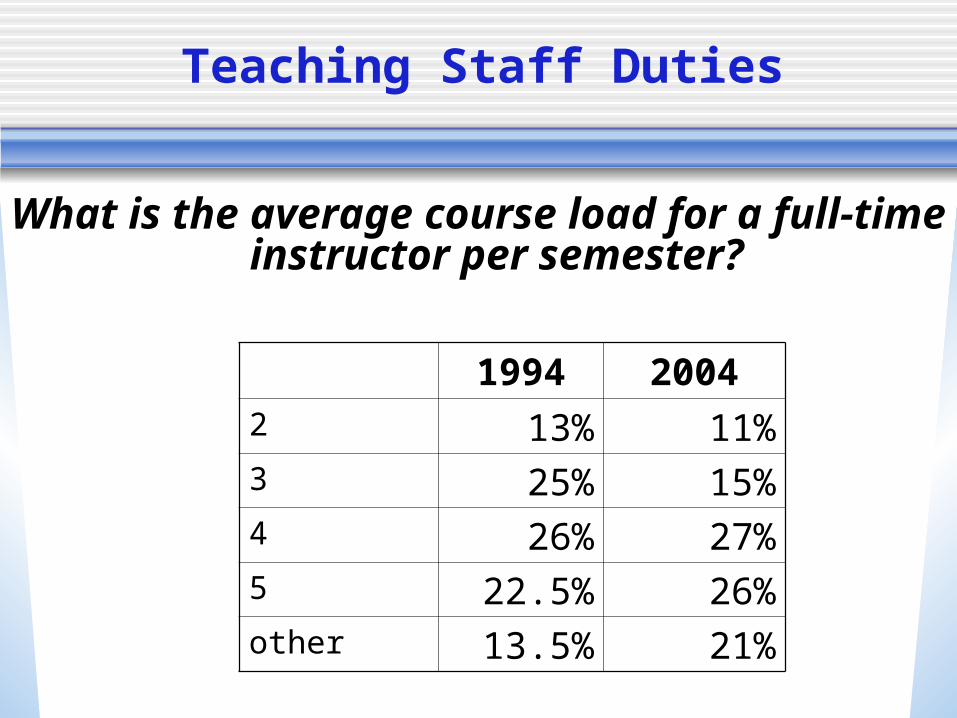
What is the average course load for a full-time instructor per semester?
1994 20042 13% 11%3 25% 15%4 26% 27%5 22.5% 26%other 13.5% 21%

Expectations of Instructors: Attendance at Faculty Meetings
Lowest level expected to attend meetings
Tenured faculty only 8.1%Tenure track faculty 23.3%Non-TT faculty 35.8%Part-time/Adjunct 32.8%
• Reflects limited participation in institutional governance.
• Differences from 1994 to 2004 insignificant.

Expectations of Instructors: Professional Development
Continuing education required? 1994: 14.3%2004: 25.3% (only 25%?)
In-service training offered?1994: 22%2004: 26%
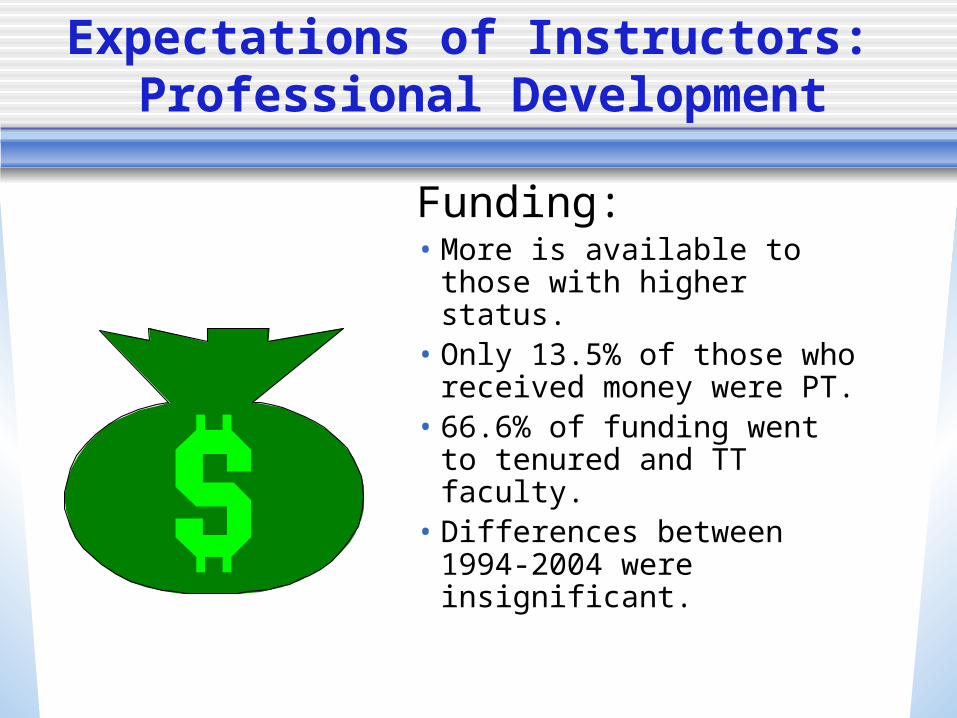
Funding:• More is available to those
with higher status.• Only 13.5% of those who
received money were PT.• 66.6% of funding went to
tenured and TT faculty.• Differences between 1994-
2004 were insignificant.
Expectations of Instructors: Professional Development
What is the administrative structure of sign language programs in
institutions of higher education in the U.S.?
Research Question #4

Structure of Sign Language Programs
• Topics investigated: Age of programs* Changes in Enrollment* Planned changes in program structure* Position within institution:
Person to whom SL program administrator reports “Program” in which SL program resides “Department” in which SL program resides “School” in which SL program resides
…continued…. (* previously discussed)

Structure of Sign Language Programs
• Topics investigated, continued: SL as a requirement for degree programs Advisory Board
Existence Composition
Hiring Decisions Curricular Decisions

Institutional Characteristics
1994 2004
Age of Sign Language Program
N 231 161mean years 14.2 19.4
median year started 1980 1985
Programs are on average 5 years older, more established, more entrenched.
14.2 19.4

Institutional Characteristics
1994 2004Change in Sign Language Enrollment
over Last 3 Years
N 264 161Enrollment increased 64.8% 52.2%Remained stable 29.9% 38.5%Declined 5.3% 9.3%
Indicates stabilization of programs

Institutional Characteristics
1994 2004Any Changes Planned in Structure of Program?
N 248 160
% Yes 37.9% 21.9%
(see screens in Question #1 for specific types of changes)

To Whom does SL Coordinator Report?
1994 2004
Title of Person to Whom Sign Language Administrator ReportsN 262 160Department chair 42.7% 50.0%Division chair 10.7% 11.9%Dean 21.8% 22.5%Director 8.8% 9.4%Provost 1.1% 1.2%
Other 14.9% 5.0%
50.0%

Program Where SL Resides
1994 2004Program in Which Sign Language Resides
N 301 33Deaf Ed. & Special Ed. 9.3% 24.2%ASL & Deaf Studies 13.0% 18.2%Interpreter Preparation 13.3% 27.3%Speech Pathology & Audiology
8.0% 12.1%Language & Linguistics 1.7% 6.1%Other 54.8% 12.1%
Many responses may be left blank because they do not have a program.

Department Where SL Resides
1994 2004Department in Which Sign Language Resides
N 267 84Foreign/Modern Lang, Ling 15.0% 14.3%Speech, Sp Path/Aud, Comm 25.5% 31.0%Education & Special Ed. 12.4% 15.5%Liberal Arts & Humanities 10.5% 11.9%Continuing Education 13.1% 4.8%Df Ed, Df Stud, Interp Prep, ASL
3.7% 9.5%Health, Human Services, Social Sciences
8.6% 11.9% Other 11.2% 1.2%
14.3%31.0%15.5%11.9% 4.8%
9.5%
11.9% 1.2%

School/College Where SL Resides
1994 2004School/College in Which Sign Language Resides
N 140 38Arts & Humanities 50.0% 39.5%Education 21.4% 34.2%Continuing Ed. 12.1% 0.0%Health & Human Services 7.9% 18.4%Other 8.6% 7.9%
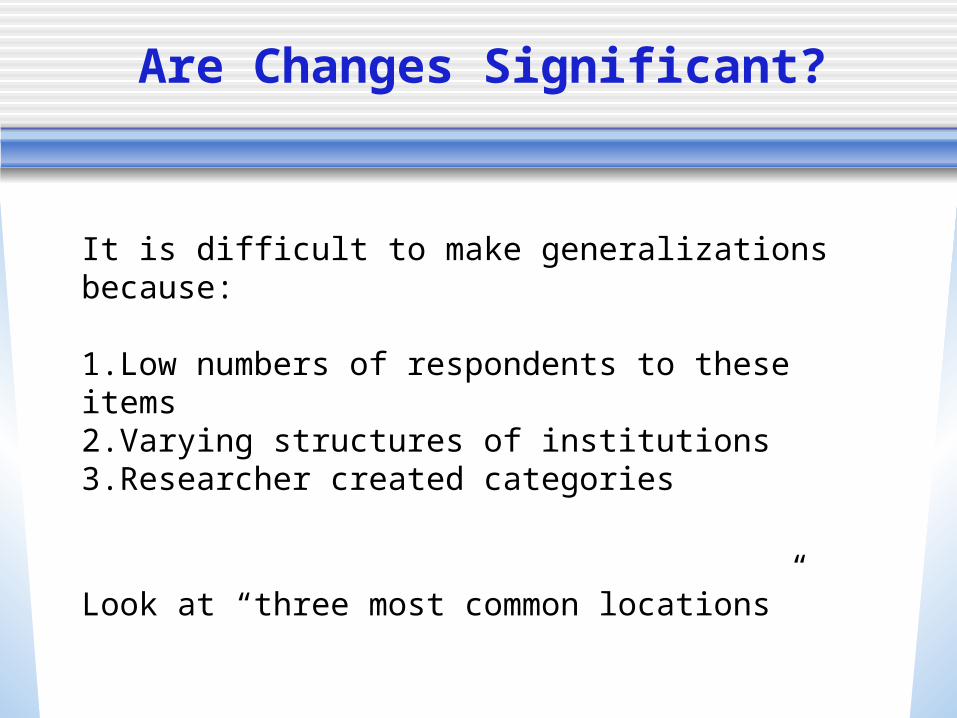
Are Changes Significant?
It is difficult to make generalizations because:
1.Low numbers of respondents to these items2.Varying structures of institutions3.Researcher created categories
Look at “three most common locations”

Sign Language as Degree Requirement
1994 2004N 256 152
Sign Language is Requirement for Some Degree Program*% Yes 43.0% 48.0%
Sign Language is a Full Degree Program% Yes 3.9% 5.9%
* Includes Deaf Studies, Education of Deaf Students, Speech Pathology, Interpreter Preparation, Audiology, other programs, and SL as full degree program.

Advisory Board
1994 2004
Does Program have an Advisory Board?N 263 154
% Yes 23.6% 26.6%(n=62) (n=41)

Composition of Advisory Board
Composition of Advisory Board
19942004
N 3838
Total Members 13.18 9.26Hearing Sign Language Instructors 1.34 1.53Hearing Professionals from Community 4.26 2.53Deaf Professionals from Community 3.00 1.87Deaf Sign Language Instructors 1.08 1.13Representatives from Campus Not from Sign Language Program
1.61 1.11
Deaf Consumers 1.89 1.11

Responsibility for Making Decisions
1994 2004Who Makes Hiring Recommendations?
N 245 160% Sign Language Facultya 79.2% 70.6%
Who Gives Hiring Approval?N 236 160
% Sign Language Facultyb 33.5% 31.2%
a Includes positions of Head Instructor, Coordinator, Instructor and Faculty Committee. The complementary positions include Department Chair and Advisory Board.b Includes positions of Head Instructor, Coordinator, Instructor and Faculty Committee. The complementary positions include Department Chair, Advisory Board, Personnel/HR Staff and Provost or University Administrator.

Responsibility for Making Decisions
1994 2004Who Makes Curriculum Recommendations?
N 250 157% Sign Language Facultya 91.2% 91.7%
Who Gives Curriculum Approval?N 245 147
% Sign Language Facultyb 69.8% 72.8%
a Includes positions of Head Instructor, Coordinator, Instructor and Faculty Committee. The complementary positions include Department Chair and Advisory Board.b Includes positions of Head Instructor, Coordinator, Instructor and Faculty Committee. The complementary positions include Department Chair, Advisory Board, Personnel/HR Staff and Provost or University Administrator.

What is the scope of the sign language program in terms of standardization, assessment of student
progress, and resources?
Research Question #5

Standardization of SL Programs
1. Methods used to measure student progress2. Assessing experienced signers for placement into SL
classes3. Sources of standardized assessment4. Resources for students5. Special Programs for motivated students6. Policies regarding use of voice in class7. Uniformly administered features of SL classes8. Topics covered in SL classes9. Decisions regarding format and content of classes

Assessing Student SL Skills
Measuring Student Progress: % used by all respondents
1994 2004N 129 156
Written exams (translating teacher sign) 75.8% 74.5%Written exams (fixed choice) 52.3% 65.8%Live expressive presentation 77.7% 83.6%Videotaped expressive presentation 56.8% 67.1%Out-of-class assignments or papers 64.4% 81.0%In-class assignments or activities 79.7% 82.9%

Assessing Student SL Skills
Assessing Experienced Signers for Placement into SL classes1994 2004
N 301 180Standardized test 2.3% 8.3%Credits from high school or transfer 6.3% 15.0%Instructor decision 58.8% 52.2%Program coord/ depart chair decision 9.0% 27.2%School-made test 11.0% 15.0%Student’s choice 18.3% 10.6%Other 7.3% 8.3%

Assessing Student SL Skills
Source of Standardized Assessment: % mentioned1994 2004
N 103 72
Department 77.7% 66.7%Locally-developed 11.7% 23.6%Nationally-developed 7.8% 18.1%
Assessing Student SL Skills
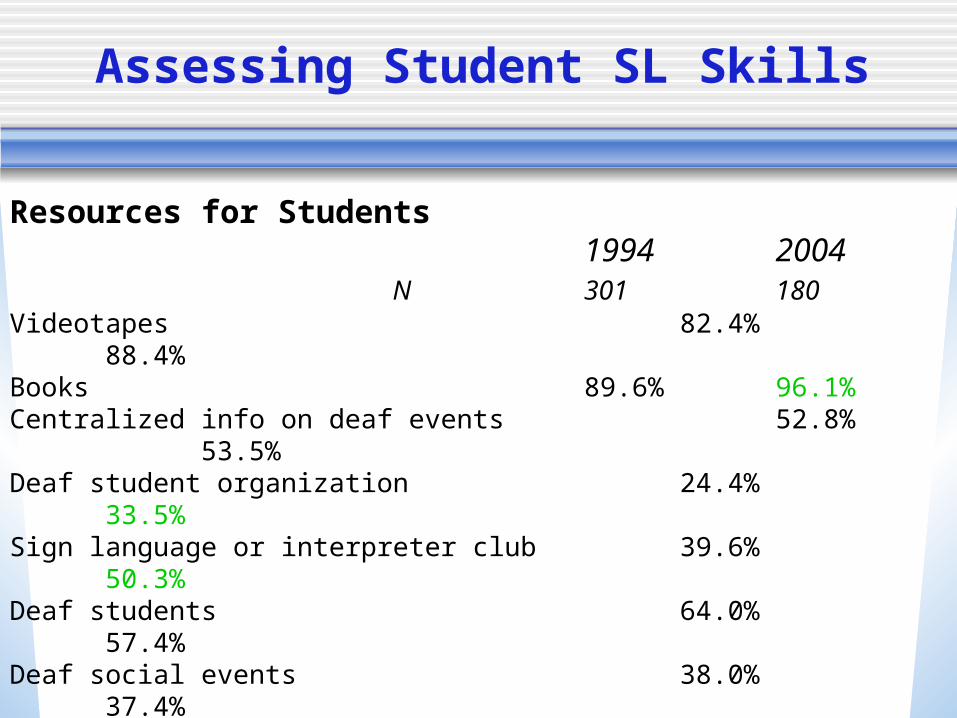
Resources for Students1994 2004
N 301 180Videotapes 82.4% 88.4%Books 89.6% 96.1%Centralized info on deaf events 52.8% 53.5%Deaf student organization 24.4% 33.5%Sign language or interpreter club 39.6% 50.3%Deaf students 64.0% 57.4%Deaf social events 38.0% 37.4%Video lab 50.4% 45.2%Journals 68.8% 65.2%Other 13.2% 20.0%

Assessing Student SL Skills
Special Programs for Highly Motivated Students1994 2004
N 301 180Intensive courses 7.0% 15.6%Immersion experience off-campus 21.6% 28.9%Study abroad or off-campus 1.7% 7.8%“Signing Only” areas on campus 8.6% 20.6%Other 20.3% 17.8%

Assessing Student SL Skills
Special Programs for Highly Motivated Students:Number of Programs offered:
1994 2004N 301 180
% with 1 or more programs 42.9% 43.9%

Voice or No Voice Policy
1994 2004N 301 180
Stated Voice / No Voice PolicyYes 37.8% 52.6%No, but voice discouraged 34.0% 27.6%No 28.2% 19.9%
Teachers Use Voice in ClassYes 17.9% 16.5%Yes, but limited 26.3% 32.3%Yes, but very limited 31.3% 27.8%No 24.4% 23.4%
Students Use Voice in ClassYes 18.9% 17.2%Yes, but limited 26.3% 27.4%Yes, but very limited 32.4% 24.8%No 22.4% 30.6%

Uniformly Administered Features
1994 2004N 137 87
% of all institutions 45.5% 48.3%Features that are Uniformly Administered, % mentioned:Learning objectives 78.1% 89.7%Required course assignments 59.9% 66.7%Sign language vocabulary and grammar 75.2% 77.0%Information about deafness 59.9% 73.6%Course syllabus 67.2% 70.1%Examinations 36.5% 47.1%Achievement expectation levels 59.9% 58.6%Voice/no voice policies 56.9% 64.4%

Uniformly Administered Features
1994 2004N 137 87
% of all institutions responding 45.5% 48.3%
Topics covered in introductory sign language classes:Laws affecting deaf people 21.8% 29.5%Sign language continuum 63.3% 64.6%History of sign language 60.5% 63.8%Education of deaf students 38.9% 55.7%Deaf community and Deaf culture 78.4% 82.9%Audiological information 17.8% 20.8%Careers using sign language 27.7% 41.0%
Uniformly Administered Features
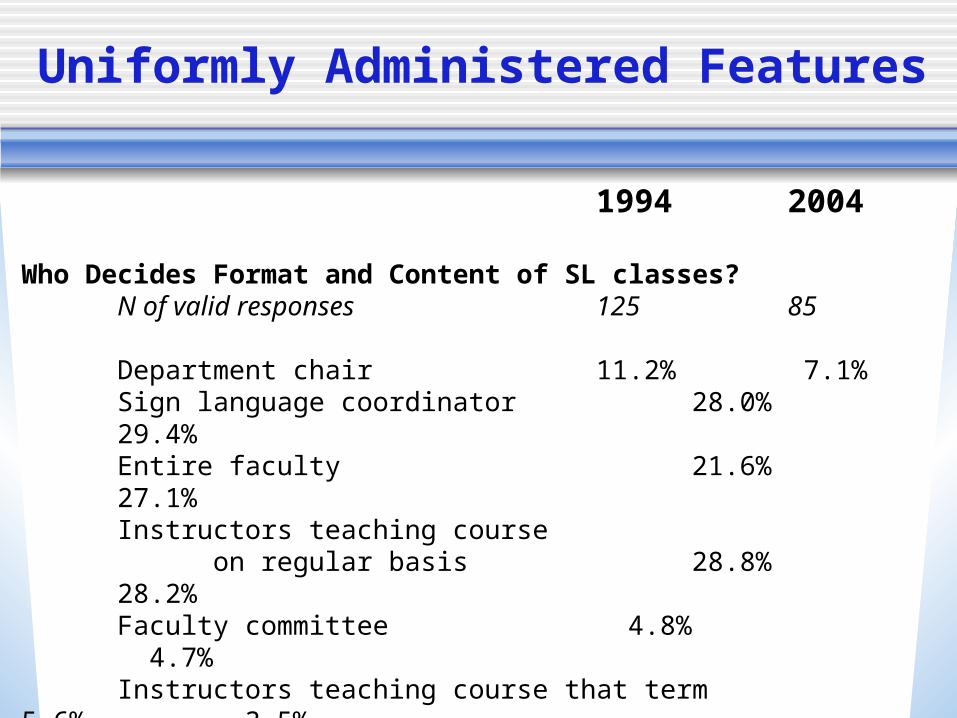
1994 2004
Who Decides Format and Content of SL classes?N of valid responses 125 85
Department chair 11.2% 7.1%Sign language coordinator 28.0% 29.4%Entire faculty 21.6% 27.1%Instructors teaching course on regular basis 28.8% 28.2%Faculty committee 4.8% 4.7%Instructors teaching course that term 5.6% 3.5%

What are the recommendations of current sign language program administrators regarding the location, status, size, staffing, and administrative needs of sign language classes in institutions of
higher education?
Research Question #6

Recommendations of SL Administrators
1. Location for SL classes
2. Should SL satisfy foreign language requirement?
3. Optimal size of SL classes
4. Importance of methods of evaluating student progress
5. Transfer credit for SL classes
6. Importance of qualifications of SL instructors
7. Importance of skills of SL instructors
8. Desired qualifications for SL program administrators
9. Desired degrees for SL program administrators
10. Suggested level of sign skills for SL program administrators
11. Suggested allocation of time for SL program administratrors

Recommendations of SL Administrators
1994 2004Suggested Location for Sign Language Program
N 247 149Modern or foreign languages 36.8% 38.9%Sign language, sign communication 12.6% 16.1%Speech pathology, audiology, etc. 10.5% 9.4%Education of Deaf 8.1% 5.4%Deaf Studies 7.7% 6.7%Interpreter preparation 5.7% 12.8%Linguistics 5.7% 4.7%Special Ed 5.3% 0.7%Anthropology or Sociology 0.0% 0.7%Other 7.7% 4.7%

Recommendations of SL Administrators
1994 2004
Should Sign Language Satisfy Foreign Language Requirement?
N 258 157% Yes 95.0% 96.2%

Recommendations of SL Administrators
1994 2004
Suggested Optimal Size for Beginning Sign Language Class
N 261 159mean # students 17.2
18.1

Recommendations of SL Administrators
1994 2004
Importance of Methods for Evaluating Student Progress (low score indicates greater importance)
N 234 155mean meanranking rating
Live Signing 1.21 1.07Videotaped Signing 2.14 1.65Written Examinations 2.97 1.94Written Papers 3.69 2.32

Recommendations of SL Administrators
1994 2004How Should Sign Language Transfer Credit Be GivenWhen Receiving Institution Doesn’t Have Equivalent Course
N 240 151Modern or foreign language elective 54.2% 59.6%Special Education elective 4.6% 4.0%Comm Sciences & Disorders, Speech Pathology, etc. elective
6.7% 4.0%General elective 19.2% 17.9%“It depends” 10.4% 10.6%Should not be accepted 5.0% 4.0%

Recommendations of SL Administrators
1994 2004Importance of Qualifications of Instructors, mean rating:(low score indicates greater importance)
N 259 157Earned Degree 1.52 1.43Earned Degree in Related Major 1.63 1.71Prior Teaching Experience 1.27 1.29Known to Deaf Community 1.56 1.57RID Certification 2.70 2.39ASLTA Certification 2.26 1.91Prior Work in Sign Language 1.08 1.38Knowing Second Lang Learning Theory 2.05 1.68Native Use of Sign Communication 1.39 1.72

Recommendations of SL Administrators
1994 2004Importance of Skills of Instructors:(low score indicates greater importance) (not tested)
N 239 157mean meanranking rating
Knowledge of Linguistics 2.19 1.16Knowledge of Deaf Culture 2.49 1.08Knowledge of Teaching Strategies 2.18 1.15Knowledge of Professional Issues 3.86 1.41Proficiency in Sign Language 1.43 1.10Creativity in Lesson Planning 3.18 1.31

Recommendations of SL Administrators
1994 2004
Desired Qualifications for Sign Language Administrators
Minimum Degree N 243 157Associate’s 1.6% 1.3%Bachelor’s 14.4% 18.5%Master’s 75.3% 72.0%Doctorate 8.6% 8.3%

Recommendations of SL Administrators
1994 2004
Desired Degree, Specialization or Major, % mentioned:N 180 108
ASL, Languages, Sign Language Studies 52.8% 50.0%
Education, Rehabilitation, Human Services 25.6% 13.0%
Speech Pathology, Health Science 6.7% 2.8%
General Deafness and Related Fields 36.1% 47.2%
Other, specified 32.8% 2.8%
.

Recommendations of SL Administrators
1994 2004
Suggested Level of Signing Skill N 246 158
Signing Not Necessary 11.0% 11.4%Beginning to Intermediate 8.9% 8.2%Advanced 34.1% 25.3%Fluent 45.9% 55.1%
.

Recommendations of SL Administrators
1994 2004
Suggested Allocation of Sign Language Administrator’s Time(low score indicates greater importance)
N 222 152mean meanranking rating
Teaching 2.03 1.50Administration 2.40 1.72Research/Scholarship 4.05 2.23Service 3.40 1.92Advising Students 2.94 1.75
.

Limitations of the Study
1. Sample Only those contacted participated Only those who filled out the long questionnaire Includes some “non-credit only” and “single class
only” excludes many “single class only” IHEs (1994
only)
Limitations of the Study
2. Timing (1994 only) End of the academic year Overlapping academic years Planned changes took place during data
collection

Limitations of the Study
3. Wording of the questionnaire failure of respondents to rank
and prioritize lack of questions about “other duties”

Limitations of the Study
4. Self-reporting of results
signing skill level what is ASL?
Summary
GOOD NEWS!• More programs• More students enrolled• Entrenchment of sign language offerings-credit-bearing- fulfills requirements- required by other programs- more changes coming!

Summary
Needs for improvement and growth:• Higher qualifications for instructors• Graduate training opportunities for instructors• More full-time instructors• More Deaf instructors• More standardization within and across
institutions

Summary
Overall, the results indicate:Sign language is an emerging academic discipline:- a credit-bearing course- a requirement for an increasing number of
academic programs, - a viable way to fulfill institutional requirements.
Sign language as a service course is entrenched at many institutions.

This data is available
on Sheryl Cooper’s web site:
http://pages.towson.edu/scooper


