SIGMOD'061 Run-Time Operator State Spilling for Memory Intensive Long-Running Queries Bin Liu, Yali...
30
SIGMOD'06 1 Run-Time Operator State Spilling for Memory Intensive Long-Running Queries Bin Liu, Yali Zhu and Elke A. Rundensteiner Database Systems Research Laboratory Worcester Polytechnic Institute
-
date post
20-Dec-2015 -
Category
Documents
-
view
221 -
download
2
Transcript of SIGMOD'061 Run-Time Operator State Spilling for Memory Intensive Long-Running Queries Bin Liu, Yali...
SIGMOD'06 1
Run-Time Operator State Spilling for Memory Intensive Long-Running QueriesBin Liu, Yali Zhu and Elke A.
RundensteinerDatabase Systems Research Laboratory
Worcester Polytechnic Institute
SIGMOD'06 2
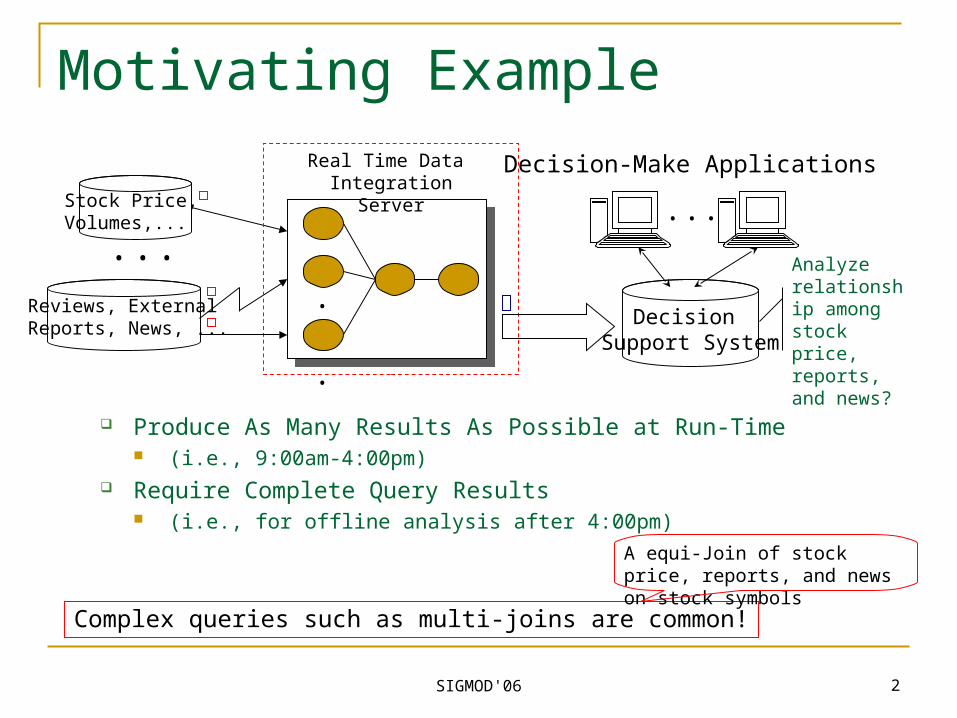
Motivating ExampleReal Time Data
Integration Server
......
Stock Price, Volumes,...
Reviews, External Reports, News, ...
Produce As Many Results As Possible at Run-Time (i.e., 9:00am-4:00pm)
Require Complete Query Results (i.e., for offline analysis after 4:00pm)
Decision Support System
...
Decision-Make Applications
Analyze relationship among stock price, reports, and news?
Complex queries such as multi-joins are common!
A equi-Join of stock price, reports, and news on stock symbols

SIGMOD'06 3
Challenges
As Many Run-Time Results As Possible Demand main memory based query processing
a4
a4
a2 b3
b3
b3
a4 b2a4 b1
a1a2a3
State Ab1b2
State B
A B
A B
Push-Based Processing with Complex Queries Demand main memory space to store operator states Operator states may monotonically increase over time
Run-Time Main Memory Overflow?

SIGMOD'06 4
Problem : Memory Overflow High Demand on Main Memory :
High input rates and large windows result in huge states Bursty streams cause temporary accumulation of tuples Long-running queries exhibit monotonic state increases
Potential Solutions : Query Optimization Distributed Processing Load Shedding Memory Management

SIGMOD'06 5
State Spill Push Operator States Temporarily into Disks
Operator states spilled are temporarily inactive
A B C
A B C
A B C
Secondary Storage
New incoming tuples processed only against partial states

SIGMOD'06 6
Three-staged Processing : Hash Xjoin [UF00]
Two Algorithms : Hash + Merge Hash-Merge Join [MLA04]
Single-input, Distributed Environment Flux [SHCF03]
Observation: Single Operator Focus !!!
State of Art : State Flushing

SIGMOD'06 7
Observation: Interdependency among Pipelined Operators
Spilling of bottom operators affects its downstream operators !
Problem : What about Multi-Operator Plans ?
A B C
D
Join2
Join1
Maximize Run-time Throughput of Join1 !!
Increase memory consumption of Join2: May quickly fill main memory May require state spill again Causes more work downstream
But states in Join2 may not contribute to final output : Low selectivity
?

SIGMOD'06 8
Outline
Basics on State Spill
Plan-level Spill Strategies
Experimental Evaluation

SIGMOD'06 9
Granularity : State Partitioning Divide Input Streams into Large Number of Partitions
At run-time, only need to choose partitions to spill [DNS92,SH03] Avoid expensive run-time repartitioning Does not affect partitions that are not spilled
Join Joinm1 m2
Split Split
A B C
1
3
2
Split
1 2
4
2
34
Example : 300 partitions M1 has odd IDs M2 has even IDs

SIGMOD'06 10
Partition Granularity : Choose State? Multiple States Exist from Different Inputs
To disk
To disk
...
...
Select States from One Input Only
Select States with Same ID
Partition Group Granularity! Avoid across-machine processing Simplify spill management Streamline cleanup process

SIGMOD'06 11
Clean Up Stage Partition Groups Could be Pushed Multiple Times
V0 = PA10 PB1
0
PC10
V1 = PA11 PB1
1
PC11
...Vk = PA1
k PB1k
PC1k
The Results Have Been Generated
Incremental View Maintenance Algorithm [ZMH+95]
Treat Multiple Join as Materialized View Partition Groups as Source Updates
(PA1 , PB1 , PC1 ) 0 0 0
, (PA11, PB1
1, PC11), (PA1
2, PB12, PC1
2)
,..., (PA1k, PB1
k, PC1k)

SIGMOD'06 12
Merge Disk Resident States
To Merge Two Partition Groups with Same ID i.e., (PA1
0, PB10, PC1
0) and (PA11, PB1
1, PC11)
V0 = PA10 PB1
0 PC10, V1 = PA1
1 PB11 PC1
1
After Merge Combined States: PA1
0 PA11, PB1
0 PB11, PC1
0 PC11
Final Result: V = (PA10 PA1
1) (PB10 PB1
1) (PC10 PC1
1)
Missing Results: = V - V0 - V1
V-V0 = PA11 PB1
0 PC10
(PA10 PA1
1) PB11 PC1
0
(PA10 PA1
1) (PB10 PB1
1) PC11

SIGMOD'06 13
State Spill Strategies

SIGMOD'06 14
Which Partitions to Push?
Throughput-Oriented State Spill
Productivity of a partition group :
Poutput: Number of output tuples generated from partition group
Psize: Size of partition group in terms of number of tuples
Productivity: Poutput/Psize

SIGMOD'06 15
Globally Choose Partition Groups
Rank Partitions Based on Productivity: Poutput/Psize
Choose globally least productive partitions to spill
A B C
D
EJoin2
Join1
Join3
…
Disk
State SpillDirect Extension :Local Output Method

SIGMOD'06 17
Bottom Up Pushing Strategy Spill States from Bottom Operators First
Choose partitions from Join1 until it reaches threshold k%
If not done, choose partitions from Join2, and so on
A B C
D
EJoin2
Join1
Join3
Minimize intermediate results in upstream operators (memory)
Minimize number of state spill processes
Partition Selection:Randomly or using local productivity
Less spill process Higher overall query throughput ?

SIGMOD'06 18
Partition Interdependency Smaller Number of Spill Processes High Throughput !!
Partition pushed in bottom operator may be parent for productive partitions in its downstream operators
2
10
OP1 OP2
...p1
1
p12 ...
p21
p22
21
1
It may worthwhile to push P21 instead of P1
1!
Global Strategy : Account for Dependency Relationships !

SIGMOD'06 19
“True” Global Output Strategy Poutput: Contribution to Final Query Output
A B C
D
EJoin2
Join1
Join3
SplitE
SplitA SplitB SplitC
Split2
SplitDSplit1
k Update Poutput values of
partitions in Join3
Apply Split2 to each tuple and find corresponding partitions from Join2, and update its Poutput value
And so on …
Employ lineage tracing algorithm to update Poutput statistics
SIGMOD'06 20
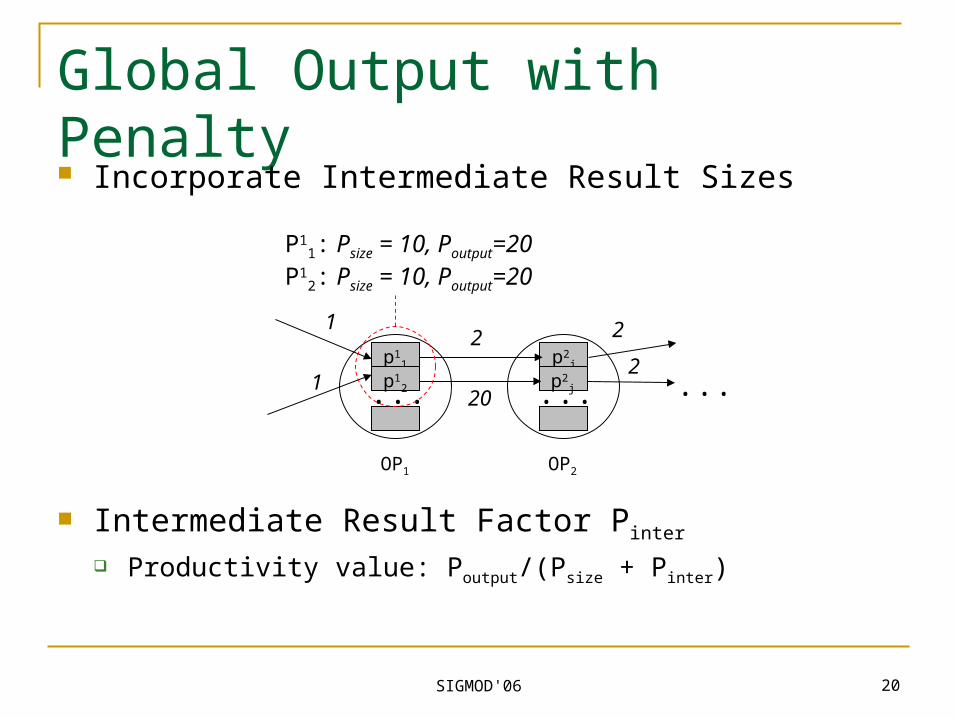
Global Output with Penalty
Incorporate Intermediate Result Sizes
...
2
2
P11: Psize = 10, Poutput=20
P12: Psize = 10, Poutput=20
OP1
...p1
1
1
p12
OP2
...p2
i
p2j1
2
20
Intermediate Result Factor Pinter
Productivity value: Poutput/(Psize + Pinter)

SIGMOD'06 21
Global Penalty : Tracing Pinter
Penalty Pinter : Contribution to Intermediate Result Sizes
Apply Similar Lineage Tracing Algorithm for Pinter
......
OP1
...p1
1
1
p12
OP2
p21
p2j
OP3
p31
p3j
2
OP4
...p4
1
p4j
2
23
3
34
4
4
2+3+4 3+4 4

SIGMOD'06 22
CAPE System Overview [LZ+05, TLJ+05]
Local Statistics Gatherer
DataDistributor
CAPE-Continuous Query Processing Engine
DataReceiver
Query Processor
Local Adaptation Controller
Distribution Manager
StreamingDataNetwor
k
Network
End User
Global AdaptationController
RuntimeMonitor
Query PlanManager
Repository
ConnectionManager
Repository
Application Server Stream Generator

SIGMOD'06 23
Experimental Setup : Queries and Data Inputs: A, B, C, D, and E data streams Query : Join1:A1=B1=C1, Join2:C2=D1, Join3:D2=E1
Query Operators : Use symmetric hash join
Each input stream is partitioned into 300 partitions Query is partitioned and run in two machines Memory threshold for spill : 60MB Push 30% of states in each state spill Average tuple inter-arrival time 50ms from each input

SIGMOD'06 24
Experimental Setup High Performance PC cluster
Dual 2.4GHz CPUs, 2G Memory, Gigabit Network 3 Machines for Stream Generator, Application Server, and
Distribution Manager. Each Query Processor on Separate Machine
Generated Data Streams with Integer Join Column Values Data value V appears R times for every K input tuples
Tuple Range : K Range Join Ratio : R
Average Join Rate : Average number of tuples with same join value per input

SIGMOD'06 25
Percentage Spilled per Adaptation
0
50
100
150
200
250
300
350
1 4 7 10 13 16 19 22 25 28 31 34 37 40 43 46 49
Every 60 Seconds
Me
mo
ry U
sa
ge
(M
B)
All-Mem
10%-Push
30%-Push
50%-Push
100%-Push
0
200000
400000
600000
800000
1000000
1200000
1 4 7 10 13 16 19 22 25 28 31 34 37 40 43 46 49
Minutes
Th
rou
gh
pu
t
All-Mem
10%-Push
30%-Push
50%-Push
100%-Push
Amount of State Pushed Each Adaptation Percentage: # of Tuples Pushed / Total # of Tuples
(Input Rate: 30ms/Input, Tuple Range:30K, Join Ratio:3, Adaptation threshold: 200MB)
Run-Time Query Throughput Run-Time Main Memory Usage

SIGMOD'06 26
Experiment : Throughput & Memory
0
5000
10000
15000
20000
25000
30000
1 3 5 7 9 11 13 15 17 19 21 23 25 27 29 31 33 35 37 39 41 43 45 47 49
Minutes
Th
rou
gh
pu
t
Global Output with Penalty
Global OutputLocal Output
Bottom-Up
0.0
10.0
20.0
30.0
40.0
50.0
60.0
70.0
1 7 13 19 25 31 37 43 49 55 61 67 73 79 85 91 97
Every 30 Seconds
Mem
ory
Usa
ge
(MB
)
Global Output with PenaltyGlobal Output
0.0
10.0
20.0
30.0
40.0
50.0
60.0
70.0
1 7 13 19 25 31 37 43 49 55 61 67 73 79 85 91 97
Every 30 Seconds
Mem
ory
Usa
ge
(MB
)Global Output with Penalty
Bottom-Up
Query with Average Join Rate:Join1: 3, Join2: 1, Join3: 1

SIGMOD'06 27
Experiment : Throughput Comparison
0
5000
10000
15000
20000
25000
30000
1 3 5 7 9 11 13 15 17 19 21 23 25 27 29 31 33 35 37 39 41 43 45 47 49
Minutes
Thro
ughp
ut
Global Output with Penalty
Global OutputLocal Output
Bottom-Up
0
10000
20000
30000
40000
50000
60000
70000
80000
90000
100000
1 3 5 7 9 11 13 15 17 19 21 23 25 27 29 31 33 35 37 39 41 43 45 47 49
Minutes
Thro
ughp
ut
Global Output with PenaltyGlobal OutputLocal OutputBottom-Up
Query with Average Join Rate:Join1: 1, Join2: 3, Join3: 3
Query with Average Join Rate:Join1: 3, Join2: 2, Join3: 3

SIGMOD'06 28
Experimental Summary
Productivity metric improves run-time throughput Global-output-with-penality is overall winner Global output (with and without penality)
outperform alternates in runtime throughput Global output (with and without penality) have
similar (good) cleanup costs Bottom-up strategy has lowest # of adaptations,
yet poor performer and high cleanup costs

SIGMOD'06 30
Conclusions
Identified Problem of Plan-Spill State spill using “productivity” viable
Proposed Plan-Level Spill Policies Dependencies considered for multi-operator plans
Evaluated Spill Policies Global spill solutions improve throughput

SIGMOD'06 31
Questions ?
Thank You !
SIGMOD'06 32
Acknowledgments
DSRG students contributed to CAPE code base, including Luping Ding, Bin Liu, Tim Sutherland, Brad Pielech, Rimma Nehme, Mariana Jbantova, Brad Momberger, Song Wang, Natasha Bogdanova
Thanks to National Science Foundation for partial support via IDM and equipment grants, to WPI for RDC grant, and to NEC for student support