SiaA: A Heme Protein - Open Access Institutional Repository of
47
Georgia State University ScholarWorks @ Georgia State University Chemistry Honors eses Department of Chemistry 2-19-2007 SiaA: A Heme Protein Marianna Libkind Follow this and additional works at: hps://scholarworks.gsu.edu/chemistry_hontheses is esis is brought to you for free and open access by the Department of Chemistry at ScholarWorks @ Georgia State University. It has been accepted for inclusion in Chemistry Honors eses by an authorized administrator of ScholarWorks @ Georgia State University. For more information, please contact [email protected]. Recommended Citation Libkind, Marianna, "SiaA: A Heme Protein." esis, Georgia State University, 2007. hps://scholarworks.gsu.edu/chemistry_hontheses/2
Transcript of SiaA: A Heme Protein - Open Access Institutional Repository of

Georgia State UniversityScholarWorks @ Georgia State University
Chemistry Honors Theses Department of Chemistry
2-19-2007
SiaA: A Heme ProteinMarianna Libkind
Follow this and additional works at: https://scholarworks.gsu.edu/chemistry_hontheses
This Thesis is brought to you for free and open access by the Department of Chemistry at ScholarWorks @ Georgia State University. It has beenaccepted for inclusion in Chemistry Honors Theses by an authorized administrator of ScholarWorks @ Georgia State University. For more information,please contact [email protected].
Recommended CitationLibkind, Marianna, "SiaA: A Heme Protein." Thesis, Georgia State University, 2007.https://scholarworks.gsu.edu/chemistry_hontheses/2

SiaA: A HEME PROTEIN
by
MARIANNA LIBKIND
Under the Direction of Dabney White Dixon
ABSTRACT
The protein SiaA (Streptococcal iron acquisition) is involved in heme uptake in the
bacterium Streptococcus pyogenes. It is difficult to obtain this protein in its fully holo form
(completely loaded with heme). To increase the concentration of heme in the growing cell, we
added δ-aminolevulinic acid (ALA) and ferrous sulfate (FeSO4), precursors of heme, to the
growth media. Neither increasing the concentration of heme in vivo, nor growth at lower
temperature for longer times, increased the production of holoprotein. The classical method of
measuring the concentration of heme in a newly discovered heme protein is cumbersome. We
have developed an improved method, which gives a solution that is more stable and has a cleaner
spectrum. With further development, this new technique may replace the classical assay.
Background information on S. pyogenes, SiaA, ABC transporters, heme biosynthesis, and the
pyridine hemochrome assay are described.
INDEX WORDS: SiaA, Heme, S. pyogenes, ABC Transporters, δ-aminolevulinic acid, ALA, Pyridine Hemochrome, Butylamine, E. coli

SiaA: A HEME PROTEIN
By
MARIANNA LIBKIND
An Honors Thesis Submitted in Partial Fulfillment of the Requirements for Graduation with Undergraduate Research Honors in the College of Arts and Sciences Georgia State University 2006

SiaA: A HEME PROTEIN
by
MARIANNA LIBKIND
Honors Thesis Director: Dabney White Dixon Honors Program Director: Robert Sattelmeyer Electronic Version Approved: Honors Program College of Arts and Sciences Georgia State University December, 2006

Copyright by
Marianna Libkind 2006

iv
Acknowledgements I would like to thank Dr. Dabney White Dixon for the opportunity to work under her
supervision. Thank you for making me a strong writer, an independent thinker in science and
providing me with confidence in my experimental ideas as well as guidance.
I would like to thank Brian Sook for providing me with guidance and mentoring me
within the laboratory. Thank you also for providing me with unpublished data.
I would like to thank Brian Basden and Thanh Quach for introducing me to new
techniques pertaining to our research and for being great peer mentors.
I would like to thank my parents, Faina and Anatoly Libkind who have supported me
morally, emotionally and financially throughout college. Thank you for always being interested
in my research although neither of you have a chemistry background, and always encouraging
me to do my best. You immigrated to this country to give me the freedom to peruse anything I
wanted to do academically, and I am always grateful to you for that.
I would also like to thank Samuel Kovitch, Irina and Vadim Golod, Yana Kutikov, Alina
Birger and Michael Libkind for always believing in my research ideas although you never
understood any of the concepts. Thank you for always providing me with moral support.

v
Table of Contents:
Streptococcus pyogenes .............................................................................................................. 1 SiaA............................................................................................................................................. 1 ABC transporters ........................................................................................................................ 2 Heme biosynthesis ...................................................................................................................... 3 Enhancing heme production with ALA and Fe(II)SO4............................................................... 4 The pyridine hemochrome assay ................................................................................................ 5
Materials and Methods................................................................................................................. 5 Results ............................................................................................................................................ 7
Addition of ALA to the growth medium .................................................................................... 7 The oxidation state of the heme in SiaA..................................................................................... 8 Growth at low temperature ......................................................................................................... 9 Modification of the pyridine-hemochrome assay ....................................................................... 9
Discussion....................................................................................................................................... 9 Addition of ALA to the growth medium .................................................................................... 9 The oxidation state of the heme in SiaA................................................................................... 10 Growth at low temperature ....................................................................................................... 10 Modifications of the pyridine-hemochrome assay.................................................................... 11

1
Introduction Some bacteria need heme for survival (Figure 1) (Perkins-Balding et al., 2004). Heme may serve as the major sole source of iron, which is key for a variety of cellular processes. Some bacteria take up iron using an ATP-binding cassette (ABC) transporter system, in which a protein on the exterior of the cell picks up heme, and transfers it to a membrane protein, which transports it into the cell. In the bacterium Streptococcus pyogenes, the protein SiaA (Streptococcal iron acquisition) is involved in heme uptake. Work in other laboratories, as well as in our own, has shown that it is difficult to obtain this protein in its fully holo form (completely loaded with heme). One strategy to increase the amount of heme in solution is to add heme precursors to the growth media. A second technique is to grow the protein at a lower temperature, for longer duration, with shaking at a lower speed. Herein, we report attempts to increase the amount of holoprotein using both of these techniques. It is difficult to measure the concentration of heme in a novel heme protein. We report the development of an improved method, which is both easier to implement and gives a more stable solution. Streptococcus pyogenes S. pyogenes is a Gram-positive bacterium and is nonmotile (Bates et al., 2003). The metabolism of S. pyogenes is fermentative; therefore, it does not require oxygen to survive. S. pyogenes is also a common human pathogen. S. pyogenes can produce infections such as scarlet fever, pharyngitis (strep throat), impetigo (infections of the superficial layers of the skin), and cellulitis (infection of the deep layers of the skin). It can also produce streptococcal toxic shock syndrome (Bates et al., 2003; Lei et al., 2003). S. pyogenes uses iron for growth, and heme compounds are necessary sources of iron for infection. Bates et al. have shown that whole blood can support S. pyogenes growth in iron-depleted medium (Bates et al., 2003). Hemolysis is used by this pathogen to obtain iron and this idea is consistent with the hemolytic nature of S. pyogenes. Hemolytic S. pyogenes can use heme from various sources and can make use of hemoglobin, myoglobin, heme-albumin, and the hemoglobin-haptoglobin complex. S. pyogenes is not able to use ferric carriers in the serum and secretions such as transferrin and lactoferrin. Surface proteins help streptococcal binding of hemoproteins, which is most likely seen as the first step in the process of bacteria capturing iron. Hyalauronic acid is capable of assisting S. pyogenes’ surface to bind free heme because of the interactions between polysaccharides and heme. Bates et al. have shown that in S. pyogenes cells grown at 40 °C, gene expression was affected by the restriction of iron in ways including the induction of genes encoding a putative iron transporter, hemolysins, and iron-dependent repressors (Bates et al., 2003). SiaA A highly preserved, iron-regulated, ten gene operon is expressed by S. pyogenes to bring in iron ions into the cytoplasm (Figure 2). This has been termed the Sia (Streptococcal Iron Acquisition) transporter by Eichenbaum and co-workers (Bates et al., 2003), and HtsA by Lui, Lei and co-workers (Lei et al., 2002; Lei et al., 2003; Liu & Lei, 2005a; Liu & Lei, 2005b; Nygaard et al., 2006). SiaA is of the ABC (ATP-Binding Cassette) transporter family. ABC transporters assist the translocation of substrates, in one direction, across membranes with the

2
use of ATP (Locher, 2004). The Sia transporter consists of a lipoprotein, SiaA, membrane permease, SiaB, and ATPase, SiaC (Figure 3). The production of SiaA is induced by iron restriction (Bates et al., 2003). SiaA is located in a ten gene operon that is iron regulated (Bates et al., 2003). Sequence analysis shows that siaABC appear as genes three through five in the operon (Bates et al., 2003). The genes encoded by the Sia operon are transcriptionally linked. Under the conditions of metal cations (e.g. Ca2+, Zn2+, Mn2+, and Mg2+) depletion, the transcription of SiaA is up-regulated (Lei et al., 2003). The operon is also able to code for Shr, which is a protein that is associated with the surface and binds in vitro to various heme compounds. It is also the closest up stream gene cluster within the operon. Heme in the host proteins can be extracted by Shp and Shr and then passed on to SiaA. Wild type SiaA has a mass of 33 kDa and a pI of 5.8. It is anchored by a membrane-bound tail (Lei et al., 2003; Bates et al., 2003). SiaA is a cell surface exposed protein; the exposure is necessary to obtain heme from the host or from hemoproteins (Lei et al., 2003). SiaA binds heme during the transfer from a heme protein or from a solution. Once it binds, SiaA transfers the heme to permease SiaB. SiaA is mostly α-helical as shown by circular dichroism (B. Sook, unpublished). It is homologous to BtuF, which is a cobalamin-binding protein (Karpowich et al., 2003). The homology program 3D Jigsaw has been used to identify possible axial ligands of SiaA, which include Tyr179, Met66, and His216. All of these are located next to the probable binding pocket (B. Sook, unpublished). WT SiaA is capable of binding various heme proteins as well as heme itself. SiaA can form a stable compound with hemoglobin, but is not able to bind myoglobin or the hemoglobin-haptoglobin complex (Bates et al., 2003). Bates et al. found that recombinant SiaA binds hemoglobin specifically via Western blot and SDS-PAGE analysis (Bates et al., 2003). Via enterokinase digest and hemoglobin-binding assays, Bates et al. showed that both rSiaA with a His-Xpress epitope and rSiaA without an epitope were able to bind hemoglobin. Eichenbaum and co-workers cloned recombinant SiaA (rSiaA) without a lipoprotein tail; a His tag and express epitope were added at the N-terminal end of the construct (Bates et al., 2003). Liu and Lei showed that when SiaA is expressed and purified in Escherichia coli, it has an intense red color, which signifies the presence of heme (Lei et al., 2003). A typical UV-visible absorption spectrum displayed heme peaks at approximately wavelengths 275, 370, 417, 530, and 560 nm (Lei et al., 2003). Via ICP-MS, Lui and Lei showed that SiaA as isolated contained about 0.25 bound heme molecules, whereas reconstituted SiaA contained about 1.0 bound heme molecules (Lei et al., 2003).
ABC transporters ATP-binding cassette (ABC) transporters are integral membrane proteins that consist of a solute-binding lipoprotein, one or two membrane spanning permeases, and an ATPase. The proteins are usually organized into an operon (Locher, 2004; Jones & George, 2004)}. ABC transporters promote the movement of substrates across membranes in a single direction with the use of ATP (Locher, 2004). ABC transporters are engaged in cellular processes such as nutrient uptake, bacterial immunity, and cell division, through the transport of ions, amino acids, and lipids(Jones & George, 2004). In order to establish homeostasis, ABC
3
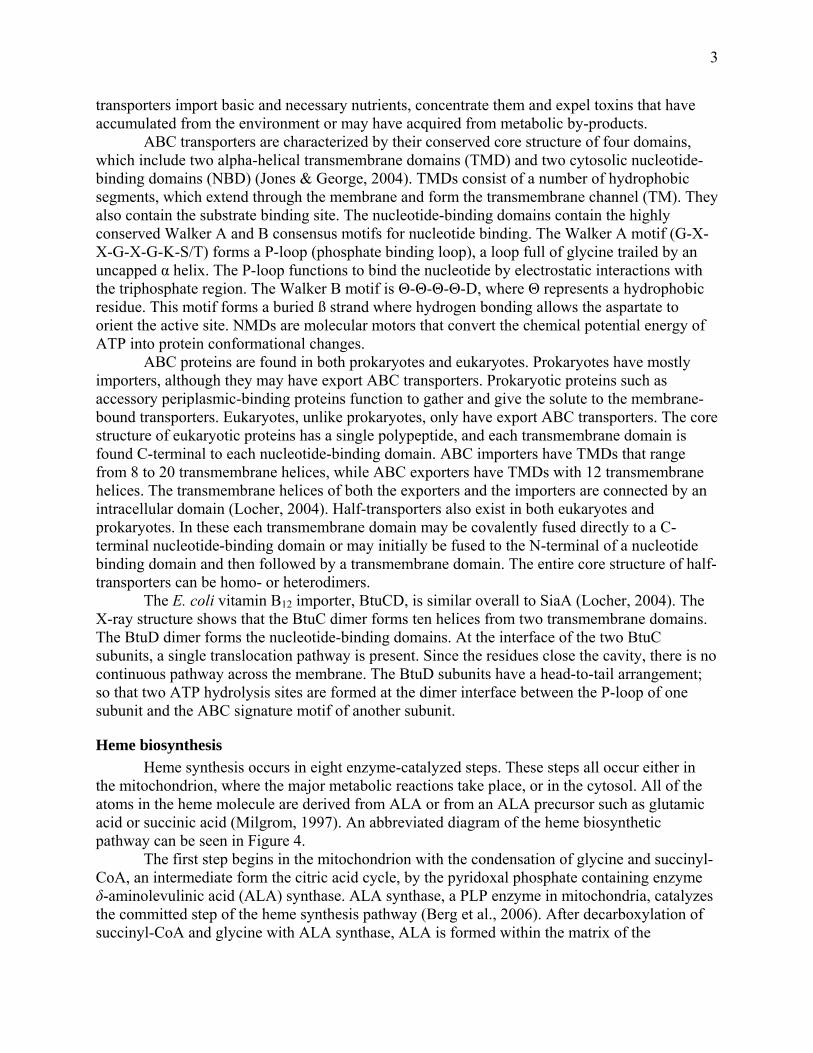
transporters import basic and necessary nutrients, concentrate them and expel toxins that have accumulated from the environment or may have acquired from metabolic by-products. ABC transporters are characterized by their conserved core structure of four domains, which include two alpha-helical transmembrane domains (TMD) and two cytosolic nucleotide-binding domains (NBD) (Jones & George, 2004). TMDs consist of a number of hydrophobic segments, which extend through the membrane and form the transmembrane channel (TM). They also contain the substrate binding site. The nucleotide-binding domains contain the highly conserved Walker A and B consensus motifs for nucleotide binding. The Walker A motif (G-X-X-G-X-G-K-S/T) forms a P-loop (phosphate binding loop), a loop full of glycine trailed by an uncapped α helix. The P-loop functions to bind the nucleotide by electrostatic interactions with the triphosphate region. The Walker B motif is Θ-Θ-Θ-Θ-D, where Θ represents a hydrophobic residue. This motif forms a buried ß strand where hydrogen bonding allows the aspartate to orient the active site. NMDs are molecular motors that convert the chemical potential energy of ATP into protein conformational changes. ABC proteins are found in both prokaryotes and eukaryotes. Prokaryotes have mostly importers, although they may have export ABC transporters. Prokaryotic proteins such as accessory periplasmic-binding proteins function to gather and give the solute to the membrane-bound transporters. Eukaryotes, unlike prokaryotes, only have export ABC transporters. The core structure of eukaryotic proteins has a single polypeptide, and each transmembrane domain is found C-terminal to each nucleotide-binding domain. ABC importers have TMDs that range from 8 to 20 transmembrane helices, while ABC exporters have TMDs with 12 transmembrane helices. The transmembrane helices of both the exporters and the importers are connected by an intracellular domain (Locher, 2004). Half-transporters also exist in both eukaryotes and prokaryotes. In these each transmembrane domain may be covalently fused directly to a C-terminal nucleotide-binding domain or may initially be fused to the N-terminal of a nucleotide binding domain and then followed by a transmembrane domain. The entire core structure of half-transporters can be homo- or heterodimers. The E. coli vitamin B12 importer, BtuCD, is similar overall to SiaA (Locher, 2004). The X-ray structure shows that the BtuC dimer forms ten helices from two transmembrane domains. The BtuD dimer forms the nucleotide-binding domains. At the interface of the two BtuC subunits, a single translocation pathway is present. Since the residues close the cavity, there is no continuous pathway across the membrane. The BtuD subunits have a head-to-tail arrangement; so that two ATP hydrolysis sites are formed at the dimer interface between the P-loop of one subunit and the ABC signature motif of another subunit.
Heme biosynthesis Heme synthesis occurs in eight enzyme-catalyzed steps. These steps all occur either in the mitochondrion, where the major metabolic reactions take place, or in the cytosol. All of the atoms in the heme molecule are derived from ALA or from an ALA precursor such as glutamic acid or succinic acid (Milgrom, 1997). An abbreviated diagram of the heme biosynthetic pathway can be seen in Figure 4. The first step begins in the mitochondrion with the condensation of glycine and succinyl-CoA, an intermediate form the citric acid cycle, by the pyridoxal phosphate containing enzyme δ-aminolevulinic acid (ALA) synthase. ALA synthase, a PLP enzyme in mitochondria, catalyzes the committed step of the heme synthesis pathway (Berg et al., 2006). After decarboxylation of succinyl-CoA and glycine with ALA synthase, ALA is formed within the matrix of the

4
mitochondrion and transported to the cytosol. This route to the formation of ALA is known as the Shemin pathway (Milgrom, 1997). ALA is a precursor to heme; if ALA is abundant it may increase heme production which in turn may lead to higher concentration of heme in vivo (Rivera & Walker, 1995). Heme acts as a feedback inhibitor, repressing transcription of the gene for ΑLA synthase in most cells (Berg et al., 2006). In the cytosol, ALA dehydratase condenses two molecules of ALA to produce the pyrrole ring compound porphobilinogen (PBG) (Berg et al., 2006). Labeled PBG has been inserted into heme by the use of chicken blood as the biosynthetic system (Milgrom, 1997). This biosynthetic system is also very similar to Knorr pyrrole synthesis, a common method of making pyrroles in a laboratory. The third step includes the head-to-tail condensation of four molecules of PBG to produce a linear tetrapyrrole intermediate, hydroxymethylbilane, a reaction catalyzed by PBG deaminase (Rivera & Walker, 1995). An ammonium ion is released from each methylene bridge and the linear tetrapyrrole cyclizes to form uroporphyrinogen III, which has an asymmetric arrangement of side chains (Berg et al., 2006). This reaction is catalyzed by uroporphyrinogen III cosynthase. In the linear tetrapyrrole formed by the four PBG molecules, one of the PBG units is reversed giving the type III isomer. This reaction requires both of the enzymes; if uroporphyrinogen III cosynthase is not present then only uroporphyrinogen I is produced (Milgrom, 1997). The acetate substituents of uroporphyrinogen III are decarboxylated by the enzyme uroporphyrinogen decarboxylase to methyl groups forming coproporphyrinogen III(Rivera & Walker, 1995). Coproporphyrinogen III is then transported to the interior of the mitochondrion, where desaturation of the porphyrin ring and the conversion of two of the propionate side chains into vinyl groups leads to protoporphyrinogen IX, catalyzed by the enzyme coproporphyrinogen III oxidase (Milgrom). In the mitochondrion, protoporphyrinogen IX is converted to protoporphyrin IX by protoporphyrinogen IX oxidase (Berg et al., 2006), found in the inner mitochondrial membrane (Milgrom, 1997). This oxidase reaction requires molecular oxygen (Milgrom, 1997). The loss of six electrons and six protons yields a completely conjugated ring system (Rivera & Walker, 1995). This conjugated ring system is responsible for the characteristic red color of heme (Berg et al., 2006). The final reaction in heme synthesis, which also takes place in the mitochondrion, involves the insertion of the ferrous form of iron into the ring system (Rivera & Walker, 1995). Iron is transported in the plasma by transferrin, a protein that binds ferric ions. The enzyme catalyzing this reaction is known as ferrochelatase and is bound to the inner mitochondrial membrane (Berg et al., 2006). In proteins with a non-covalently bound heme such as hemoglobin, myoglobin, catalase, peroxidases and cytochrome b, the reaction between heme and the apoprotein occurs spontaneously; therefore, it does not require a catalyst. For a protein with a covalently bound heme such as cytochrome c, the reaction does not occur spontaneously; therefore, it requires a catalyst (Milgrom, 1997).
Enhancing heme production with ALA and Fe(II)SO4 All of the atoms in the heme molecule are derived from ALA or from an ALA precursor such as glutamic acid or succinic acid (Rivera & Walker, 1995). The first committed precursor in the biosynthetic pathway of heme is δ-aminolevulinic acid (ALA) (Figure 4). When iron(II) is present in conjunction with ALA in a culture medium, the biosynthesis of heme proceeds to a greater extent than without ALA, resulting in a higher concentration of free heme. For example, Rivera has shown that the addition of ALA in combination with iron(II)
5
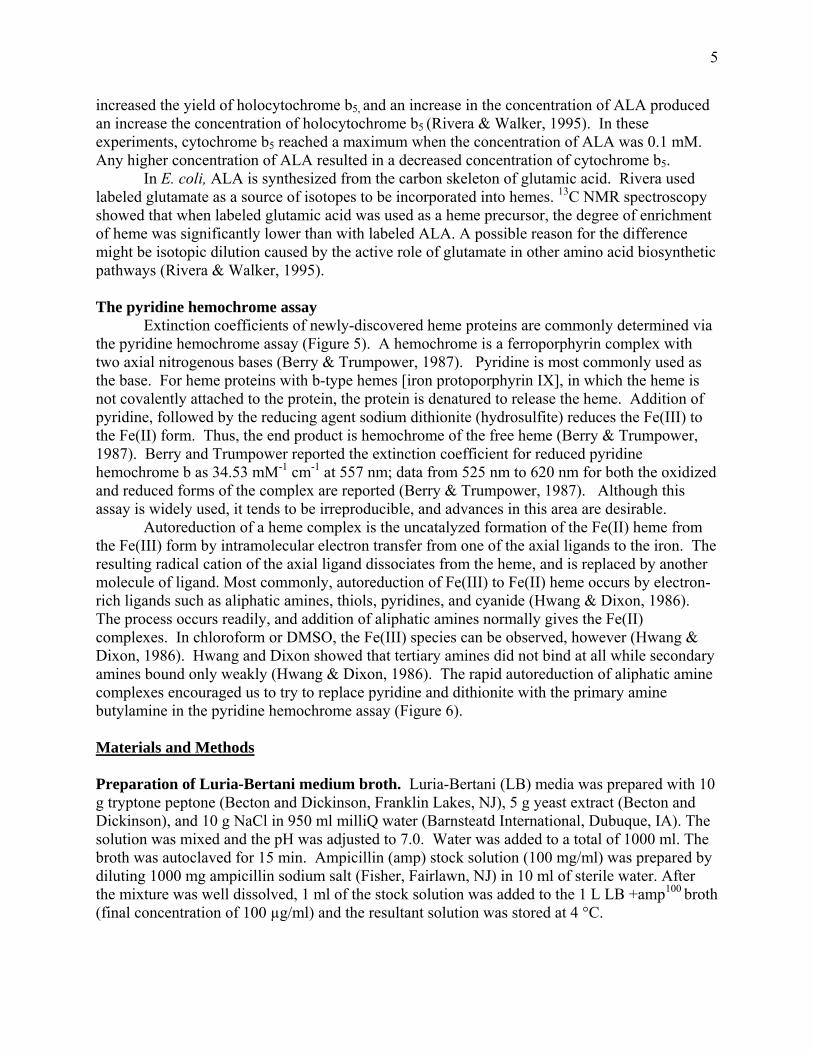
increased the yield of holocytochrome b5, and an increase in the concentration of ALA produced an increase the concentration of holocytochrome b5 (Rivera & Walker, 1995). In these experiments, cytochrome b5 reached a maximum when the concentration of ALA was 0.1 mM. Any higher concentration of ALA resulted in a decreased concentration of cytochrome b5. In E. coli, ALA is synthesized from the carbon skeleton of glutamic acid. Rivera used labeled glutamate as a source of isotopes to be incorporated into hemes. 13C NMR spectroscopy showed that when labeled glutamic acid was used as a heme precursor, the degree of enrichment of heme was significantly lower than with labeled ALA. A possible reason for the difference might be isotopic dilution caused by the active role of glutamate in other amino acid biosynthetic pathways (Rivera & Walker, 1995). The pyridine hemochrome assay Extinction coefficients of newly-discovered heme proteins are commonly determined via the pyridine hemochrome assay (Figure 5). A hemochrome is a ferroporphyrin complex with two axial nitrogenous bases (Berry & Trumpower, 1987). Pyridine is most commonly used as the base. For heme proteins with b-type hemes [iron protoporphyrin IX], in which the heme is not covalently attached to the protein, the protein is denatured to release the heme. Addition of pyridine, followed by the reducing agent sodium dithionite (hydrosulfite) reduces the Fe(III) to the Fe(II) form. Thus, the end product is hemochrome of the free heme (Berry & Trumpower, 1987). Berry and Trumpower reported the extinction coefficient for reduced pyridine hemochrome b as 34.53 mM-1 cm-1 at 557 nm; data from 525 nm to 620 nm for both the oxidized and reduced forms of the complex are reported (Berry & Trumpower, 1987). Although this assay is widely used, it tends to be irreproducible, and advances in this area are desirable. Autoreduction of a heme complex is the uncatalyzed formation of the Fe(II) heme from the Fe(III) form by intramolecular electron transfer from one of the axial ligands to the iron. The resulting radical cation of the axial ligand dissociates from the heme, and is replaced by another molecule of ligand. Most commonly, autoreduction of Fe(III) to Fe(II) heme occurs by electron-rich ligands such as aliphatic amines, thiols, pyridines, and cyanide (Hwang & Dixon, 1986). The process occurs readily, and addition of aliphatic amines normally gives the Fe(II) complexes. In chloroform or DMSO, the Fe(III) species can be observed, however (Hwang & Dixon, 1986). Hwang and Dixon showed that tertiary amines did not bind at all while secondary amines bound only weakly (Hwang & Dixon, 1986). The rapid autoreduction of aliphatic amine complexes encouraged us to try to replace pyridine and dithionite with the primary amine butylamine in the pyridine hemochrome assay (Figure 6). Materials and Methods Preparation of Luria-Bertani medium broth. Luria-Bertani (LB) media was prepared with 10 g tryptone peptone (Becton and Dickinson, Franklin Lakes, NJ), 5 g yeast extract (Becton and Dickinson), and 10 g NaCl in 950 ml milliQ water (Barnsteatd International, Dubuque, IA). The solution was mixed and the pH was adjusted to 7.0. Water was added to a total of 1000 ml. The broth was autoclaved for 15 min. Ampicillin (amp) stock solution (100 mg/ml) was prepared by diluting 1000 mg ampicillin sodium salt (Fisher, Fairlawn, NJ) in 10 ml of sterile water. After the mixture was well dissolved, 1 ml of the stock solution was added to the 1 L LB +amp100 broth (final concentration of 100 µg/ml) and the resultant solution was stored at 4 °C.

6
Inoculation and addition of reagents. From the 1 L of LB + amp100 broth, 5 ml were transferred to two 15 ml centrifuge tubes with 5 ml of broth in each. Both tubes were inoculated by scraping/stabbing a barely visible amount of Top 10 ShuA-His (gift from Dr. Griselle Montañez, Georgia State University) out of the cyrovial with the blunt end of an inoculating loop. The broth was stirred with the same inoculating loop. The cryovial containing Top 10 ShuA-His was placed back into the freezer at -80 °C immediately. The centrifuge tube caps were slightly loosened and a strip of loose tape was placed over the top so that the caps would not fall off during shaking in the incubator. Care was taken not to put the tape around the circumference of the lid, as this prevents aeration. Both tubes were grown overnight at 37 °C with shaking at 200 rpm. E. coli growth. The OD was checked after 16 h with a Shimadzu 1601 UV/vis spectrophotometer. Each tube was inverted several times immediately before taking an aliquot for the measurement, and the minimum amount possible of the solution was drawn out (~0.5 ml, or about to the middle of the cuvette). The OD660 was 1-2. The aliquot was discarded after testing. The media (50 ml) was measured into two identical flasks, one being the control and the other the experimental. The centrifuge tubes containing the overnight culture were inverted several times to re-suspend the cell material. Each 50 ml flask of LB was inoculated with 0.7 ml. Both flasks were again grown at 37 °C with shaking at 200 rpm for 3 h. Arabinose stock solution (0.02%) was prepared by diluting 4 g of L-arabinose (Sigma Aldrich, St. Louis, MO) in 200 ml of sterile water. The solution was dissolved and filtered through a 0.20 µm Nalgene filter unit (MF75 Nalgene Labware, Rochester, NY). Iron sulfate stock solution (0.1 mM) was prepared by dissolving 0.1395 g of iron (II) sulfate heptahydrate (MP Biomedicals,) in 5.0 ml of sterile water. d-aminolevulinic acid (ALA) stock solution (0.1 mM) was prepared by dissolving 0.0872 g of ALA (MP Biomedicals, Irvine, CA) in 5.0 ml of sterile water. After 3 h of shaking arabinose stock solution (0.05 ml), iron sulfate stock solution (0.05 ml), and ALA stock solution (0.05 ml) were added to the experimental flask, and only 0.05 ml of arabinose was added to the control flask. The flasks continued growing at 37 °C with shaking at 200 rpm for 4 h. Sonication procedure. The 50 ml fractions were centrifuged at 8000 x g for 10 min at 4 °C and the supernatant was discarded. The pellet from each centrifuge tube was transferred to a 1.7 ml centrifuge tube. Lysis buffer (50 mM Tris, pH 8.0 at 4 °C) was prepared by dissolving 2.42 g of 20 mM Tris base (MP Biomedicals), 5.84 g of 100 mM NaCl (MP Biomedicals), and 1 ml of neat 0.1% Triton (MP Biomedicals) in 1 L of sterile water. Lysis buffer (0.7 ml) was added to each tube. The fractions were sonicated (without ice) using a Branson Sonifier 450. The duty cycle was set to 85%. The output level started at 2 for a one min sonication (without ice). The fraction was allowed to stand for two min at room temperature. Subsequent sonications were performed at output levels of 3 and 4, again without ice, and again with a two minute interval at room temperature between sonications. The tubes were centrifuged and spectra were taken. Nickel affinity fast protein liquid chromatography (FPLC). A new nickel column (HiTrap chelating 5 ml, Amersham Biosciences, Piscataway, NJ) was washed with 20 column volumes (CV) of water prior to charging to remove any contaminants present. The column was stripped with 5 CV nickel chelating column buffer (binding buffer) (Figure 7). Binding buffer was prepared as follows. A 500 ml solution of 1.00 M K2HPO4 (Fisher Scientific, Fair Lawn, NJ) was prepared by the addition of K2HPO4 (87.09 g) to a 500 ml volumetric flask and dilution to the mark. A 500 ml solution of 1.00 M KH2PO4 (Fisher) was prepared by addition of KH2PO4 (68.05 g) to a 500 ml volumetric flask and dilution to the mark. Portions of the K2HPO4 solution (80.2 ml), KH2PO4 (19.8 ml), and solid NaCl (29.22 g) were added to a 2 L Pyrex bottle and

7
were diluted to the mark. The pH was adjusted to 7.4. The final solution was 50 mM in with potassium phosphate (50 mM) and 250 mM in NaCl. The solution was filtered using a MF75 Nalgene vacuum filter unit. The column was charged with a 0.1 M nickel chloride solution, which was prepared by the addition of nickel chloride (4.4 g) (Mallinckrodt Chemical Works, St. Louis, MO) to a 100 ml volumetric flask and dilution with milliQ water to 100 ml. The solution was vacuum filtered before use. The pump and column were washed with ten CV of water to remove any ethanol preservative or stripping buffer remaining in the FPLC from previous runs. The column was equilibrated with five CV of binding buffer and a flow rate of 1.0 for 30 min. The super loop (50 ml) was washed with milliQ water. The concentrated SiaA sample was then injected into the superloop. One line was placed into the binding buffer, and another line was placed into the elution buffer (lysis buffer). After SiaA was purified and collected, the pumps were washed again with water and 20% ethanol. Growth at low temperature. To see if a lower incubation temperature and a slower shaking speed would increase the yield of protein, the procedure above was followed, but the shaking speed, temperature and duration were changed. After the inoculation was completed, the beakers containing the 50 ml samples were grown at 24 °C with shaking at 100 rpm for 3 h. After addition of the stock solution, arabinose, ALA and iron sulfate the beakers were incubated at 24 °C with shaking at 100 rpm. The OD of the solution was taken after 1, 2 and 4 days. The protein was isolated on day 5. Autoreduction of myoglobin by butylamine. A solution of NaOH (1.0 ml of 1.0 M, Fisher Scientific, Fair Lawn, NJ) was added to a 15 ml centrifuge tube. A small amount of myoglobin (equine skeletal muscle, Sigma-Aldrich, St. Louis, MO) was added to give a Soret band between 0.2 and 2.0. Butylamine (4 ml, Aldrich, Milwaukee, WI) was added and the tube was filled to the 10 ml mark with milliQ water (5 ml) to give a solution of 40% final concentration of butylamine. The solution was vortexed and an immediate spectrum was taken; the solution was not fully reduced. An 80% butylamine solution was then prepared by the addition of NaOH (1.0 ml of 1.0 M) to a 15 ml centrifuge tube. A small amount of myoglobin was added to give a Soret band between 0.2 and 2.0. Butylamine (8 ml), was added and the tube was filled to the 10 ml mark with milliQ water (1 ml). The solution was vortexed and an immediate spectrum was obtained. A solution of sodium dithionite in water was prepared. MilliQ water (3 ml) was degassed with nitrogen (pre-purified, Airgas) for approximately 10 min. Sodium dithionite (0.0564 g, Fisher Scientific, Fair Lawn, NJ) was added to the water. The myoglobin solution in aqueous butylamine solution was degassed for approximately 10 min as well. An aliquot of saturated sodium dithionite solution (1.6 µL) was added to the myoglobin solution and the spectrum was recorded. A second aliquot of 22.0 µL of the dithionite solution was added to the same myoglobin solution and the spectrum retaken. Results Addition of ALA to the growth medium Because ALA is expensive, our first goal was to determine the minimum volume of growth solution that would give reproducible results. Starting with 500 ml samples and working

8
with increasingly smaller volumes, a 50 ml sample was found to be the smallest volume that could be used to provide reproducible results. Our second goal was to establish whether the addition of ALA enhanced the production of the holoprotein. A preliminary experiment involved a direct comparison of the bacteria grown with and without ALA on the 50 ml scale. ALA and FeSO4 stock solutions (0.1 M each) were added to only one beaker to give solutions that were 0.1 mM in both reagents. The reactions were taken through the sonication and centrifugation steps. The supernatant of each sample was analyzed via UV/vis (Figures 8 and 9). The amount of heme protein was evaluated using an extinction coefficient 1.03 x 10⁵ M-1 cm-1 at 424 nm (B. Sook, unpublished). The total amount of holoprotein found in the control was approximately 0.46 mg in 50 ml, which extrapolates to a total of 9.13 mg/L. When the bacteria was grown with ALA and FeSO4, a very broad Soret was observed (Figure 9), consistent with both holoprotein and free heme in solution. Assuming that the absorbance at 424 represents only the holoprotein, this experiment indicates that 0.49 mg of holoprotein was formed in 50 ml, extrapolating to a total of about 9.71 mg/L of culture. To the extent that the absorbance at 424 nm is a shoulder of free heme, the final concentration of SiaA will be lower than that calculated. Thus, it appears that ALA substantially increases the amount of heme available in the cell, but does not significantly increase the amount of holoprotein. These same two reactions were each concentrated and run through nickel affinity FPLC, using imidazole to elute the His-tagged protein from the column (Figure 10). SiaA produced without ALA and FeSO4 eluted at 59.2 min (Figure 11). Spectra of fractions 14-19 (2 ml each) are shown in Figure 12. The positions of the Soret and α,β bands indicate that the protein is in the ferric form, as expected. Using an extinction coefficient of 9.6 x 10⁴ M-1 cm-1 at 415 nm (S. Sumithran, unpublished), the total protein concentration in tubes 14 to 19 was determined to be approximately 5.0 mg. Thus, about 50% of the protein was isolated after the nickel affinity column step.
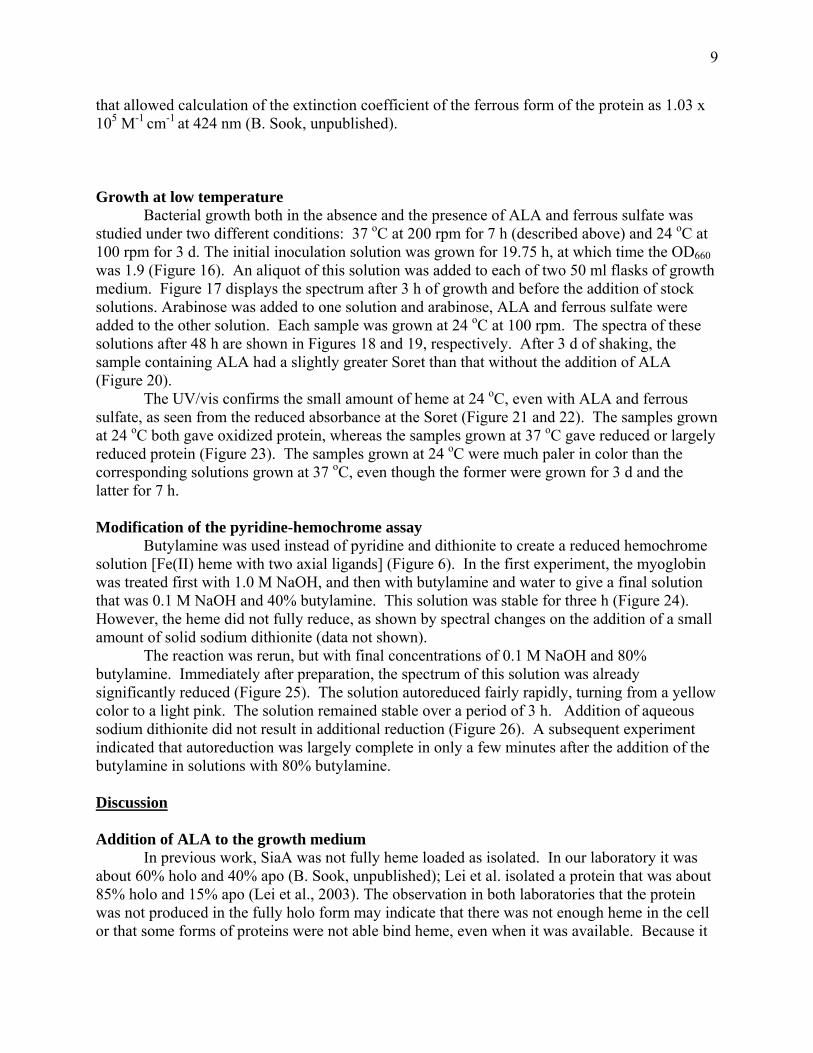
SiaA produced with ALA and FeSO4 eluted at 84.5 min (later than in the previous run because the imidazole gradient was started much later) (Figure 13). Spectra of fractions 24-30 (0.5 ml each) are shown in Figure 14. The total protein concentration in tubes 24 to 30 was determined to be approximately 0.2 mg. Thus, it appears that much less of the protein was recovered in the ALA and FeSO4 run. However, if the free heme had contributed significantly to the apparent Soret of the protein sample before FPLC, the amount of holoprotein before the FPLC step could have been overestimated, as described above. The oxidation state of the heme in SiaA In this work, SiaA was isolated as reduced [i.e., in the Fe(II) state] for the first time (Figure 1). Previous work in the laboratory had always led to the ferric [Fe(III)] protein. Figure 15 shows SiaA to be reduced because the positions of the Soret at 421 nm, the α peak at 558 nm and the ß peak at 541 nm match those previously recorded for the reduced form of pure protein (B. Sook, unpublished). The ratio of the α to ß was 1.39, which is also the same as that for previously recorded data (1.40) (B. Sook, unpublished). Therefore, the protein was reduced as isolated. Figure 15 also demonstrates that SiaA becomes oxidized in 48 h under regular conditions. The observation of reduced protein in these preparations may be due to rapid workup of the cells. The extinction coefficient of the protein has been measured using the pyridine hemochrome technique as 9.6 x 10⁴ M-1 cm-1 at 415 nm. Reduction of a solution gave a spectrum
9
that allowed calculation of the extinction coefficient of the ferrous form of the protein as 1.03 x 10⁵ M-1 cm-1 at 424 nm (B. Sook, unpublished). Growth at low temperature Bacterial growth both in the absence and the presence of ALA and ferrous sulfate was studied under two different conditions: 37 oC at 200 rpm for 7 h (described above) and 24 oC at 100 rpm for 3 d. The initial inoculation solution was grown for 19.75 h, at which time the OD660 was 1.9 (Figure 16). An aliquot of this solution was added to each of two 50 ml flasks of growth medium. Figure 17 displays the spectrum after 3 h of growth and before the addition of stock solutions. Arabinose was added to one solution and arabinose, ALA and ferrous sulfate were added to the other solution. Each sample was grown at 24 oC at 100 rpm. The spectra of these solutions after 48 h are shown in Figures 18 and 19, respectively. After 3 d of shaking, the sample containing ALA had a slightly greater Soret than that without the addition of ALA (Figure 20). The UV/vis confirms the small amount of heme at 24 oC, even with ALA and ferrous sulfate, as seen from the reduced absorbance at the Soret (Figure 21 and 22). The samples grown at 24 oC both gave oxidized protein, whereas the samples grown at 37 oC gave reduced or largely reduced protein (Figure 23). The samples grown at 24 oC were much paler in color than the corresponding solutions grown at 37 oC, even though the former were grown for 3 d and the latter for 7 h. Modification of the pyridine-hemochrome assay
Butylamine was used instead of pyridine and dithionite to create a reduced hemochrome solution [Fe(II) heme with two axial ligands] (Figure 6). In the first experiment, the myoglobin was treated first with 1.0 M NaOH, and then with butylamine and water to give a final solution that was 0.1 M NaOH and 40% butylamine. This solution was stable for three h (Figure 24). However, the heme did not fully reduce, as shown by spectral changes on the addition of a small amount of solid sodium dithionite (data not shown). The reaction was rerun, but with final concentrations of 0.1 M NaOH and 80% butylamine. Immediately after preparation, the spectrum of this solution was already significantly reduced (Figure 25). The solution autoreduced fairly rapidly, turning from a yellow color to a light pink. The solution remained stable over a period of 3 h. Addition of aqueous sodium dithionite did not result in additional reduction (Figure 26). A subsequent experiment indicated that autoreduction was largely complete in only a few minutes after the addition of the butylamine in solutions with 80% butylamine. Discussion Addition of ALA to the growth medium
In previous work, SiaA was not fully heme loaded as isolated. In our laboratory it was about 60% holo and 40% apo (B. Sook, unpublished); Lei et al. isolated a protein that was about 85% holo and 15% apo (Lei et al., 2003). The observation in both laboratories that the protein was not produced in the fully holo form may indicate that there was not enough heme in the cell or that some forms of proteins were not able bind heme, even when it was available. Because it

10
has been difficult to reconstitute the protein in our laboratory, we desired to change the growth medium to produce more heme in the cell, on the hypothesis that perhaps the protein was not fully heme loaded because there was not enough heme in the cell. To increase the amount of heme in the cell, we followed the work of Rivera and Walker by adding ALA to the growth medium to enhance heme biosynthesis (Rivera & Walker, 1995). Our work showed that experiments could be run reliably on the 50 ml scale. In this work, we observed that growth with 0.1 M ALA produced free heme, (i.e., not bound in the protein). The increased amount of free heme due to growth with ALA is consistent with previous work by Rivera and Walker (Rivera & Walker, 1995). The Soret of the holoprotein was very similar intensity with and without ALA and ferrous sulfate. Thus, it appears that addition of ALA and ferrous sulfate does not increase the amount of holoprotein. A more detailed assessment of the effect ALA and ferrous sulfate was made by doing the first chromatography step involved in isolating pure protein (Figure 27). Fractions from a nickel affinity column were collected, and the absorbance of each measured at the Soret. Summation of all of the holoprotein derived from a 50 mL growth showed that 5.03 mg of holoprotein were obtained without the addition of ALA and 0.19 mg of holoprotein were obtained with the addition of ALA. As for the spectral measurements before the nickel affinity column, this analysis shows that the addition of ALA and ferrous sulfate do not increase the amount of holoprotein. With this analysis, however, it appears that ALA and ferrous sulfate actually decrease the amount of holoprotein. The discrepancy is not yet resolved. Further work might involve growing the bacteria with lower concentrations of ALA and ferrous sulfate. Hemin is known to dimerize, and it might be that a lower concentration of hemin in solution would provide more monomer for uptake by the apoprotein. The oxidation state of the heme in SiaA
The UV/vis spectra of SiaA show that it is isolated as the reduced protein. The isolation of the reduced protein, even after a workup taking many hours, indicates that SiaA is very stable in its reduced form. Rodgers and Evans have found that SiaA has a redox potential of about 75 mV (though the process is not fully reversible) (K. Rodgers and D. Evans, personal communication). Isolation of a mixture of the oxidized and reduced form of the heme has also been reported for IsdE, a SiaA homolog from Staphylococcus aureus (Mack et al., 2004). Reduction potentials are known for two other b-type hemes with Met and His axial ligands. Cellobiose dehydrogenase has reported redox potentials of 164 mV and 130 mV (Igarashi et al., 1999). Cytochrome b562 also has Met and His axial ligands and a reported reduction potential of 160 mV (Barker et al., 1996). The protein itself is very important in controlling the redox potential. For example, c-type hemes with Met and His axial ligands have reported reduction potentials ranging from 450 to -60 mV (Gibney Database, http://heme.chem.columbia.edu/hemedetail.php). The internal redox set point of E. coli is estimated to be approximately -0.3 V (de Graef et al., 1999). Thus, it is expected that SiaA, with a reduction potential of 75 mV, will be found largely in the oxidized state in the cell. The observation that it is isolated in the reduced form presumably indicates that some protein(s) in E. coli reduces SiaA during cell growth. Growth at low temperature
When growing recombinant heme proteins in E. coli, it is not uncommon to find that the recombinant protein is not fully in the holoprotein form. As pointed out above, we usually

11
isolate SiaA with only about 60% heme loading. The heme uptake protein ShuT is isolated with only about 10-20% heme loading (Eakanunkul et al., 2005). One possibility for low heme loading is that heme biosynthesis in E. coli cannot make enough heme to fully load the recombinant apoprotein. One solution is to grow the bacteria at lower temperatures. While lower temperatures are expected to slow both the growth of the mutant protein and the production of heme, it has been found empirically that growing the bacteria at lower temperatures gives higher fractions of holoprotein in some instances (A. Thompson and T. Holman, personal communication). For SiaA, growing the bacteria at 24 oC for 3 d gave a much lower final concentration of heme than growing at 37 oC for 7 h. Thus, this technique of growing at lower temperatures does not seem to increase the holoprotein for SiaA. Growing at the lower temperature gave oxidized protein, whereas growing at the higher temperature usually gives partially or fully reduced protein. This is presumably because the bacteria grown at 24 oC were shaken in an oxygen atmosphere for approximately nine times longer than those grown at 37 °C, resulting in oxidation of the SiaA. Modifications of the pyridine-hemochrome assay A variety of amines are known to autoreduce hemes (Hwang & Dixon, 1986). Autoreduction is thought to be a light-induced process, but in many cases room light is enough to effect full reduction (D. Dixon, personal communication). Autoreduction is thought to occur by initial transfer of an electron from the amine to the Fe(III) center, followed by dissociation of the amine cation, and binding of another amine to the Fe(II) center. Butylamine autoreduces hemin quickly under some circumstances (Hwang & Dixon, 1986). In the current series of experiments, we observed facile reduction of the hemin from myoglobin with 80% butylamine, but not with 40% butylamine (Figure 24 and 25). The reduced hemochrome in the 80% butylamine solution was also stable for at least 3 h. An advantage to using butylamine instead of pyridine and sodium dithionite is that the tailing due to sodium dithionite is eliminated. In the pyridine hemochrome assay, a small amount of sodium dithionite did not fully reduce the myoglobin (1.6 µL of saturated aqueous solution). A larger amount (23.6 µL total of saturated aqueous solution) gave dithionite absorbance under the heme peak, which reduced the accuracy of measuring the absorbance ratios in order to determine the extinction coefficient. Since the 80% butylamine solution gave complete autoreduction without the need for sodium dithionite, bubbling with gas was not necessary. Thus, the butylamine solution protocol was less labor intensive. The new technique was also more reproducible and more accurate than the pyridine hemochrome assay. With further experimentation we hope to replace the pyridine hemochrome assay, which is generally viewed as difficult and prone to error.

12
Protoporphyrin IX Heme (Reduced) Hemin (Oxidized) Figure 1: The structures of protoporphyrin and heme (reduced) and hemin (oxidized).
shr shp siaA siaB siaC siaD siaF siaG siaHsiaE
Ten Gene Operon
Figure 2. Structure of the ten gene operon expressed by S. pyogenes.
N
NN
N
COO--OOC
Fe3+N
HNN
NH
COO--OOC
N
NN
N
COO--OOC
Fe2+

13
Gram Positive Heme ATP Binding Cassette Transport System (ABC)
N
NN
N
COO--OOC
Fe2+
• The heme (red) is bound to the protein SiaA (bright blue)
• The lipoprotein tail anchors the protein to the membrane.
• The heme goes through the membrane permease, which is composed of SiaB and SiaC. It then enters the cytoplasm.
Figure 3. Heme binding protein, SiaA and its ABC transporter.

14
Heme Biosynthesis
Mitochondrion Cytoplasm
Succinyl CoA + Glycine
δ – Aminolevulinate
Porphobilinogen
Uroporphyrinogen III
Coproporphyrinogen III
Protoporphyrin IX
Heme
Linear tetrapyrrole
Figure 4. The structure of δ-aminolevulinic acid (ALA), the first committed precursor in the biosynthetic pathway of heme (Top). A schematic of the heme biosynthetic pathway (Bottom).
HO NH2
O
O

15
Pyridine Hemochrome
• Extinction coefficients of newly-discovered heme proteins are commonly determined via the pyridine hemochrome assay.
• Pyridine is most commonly used as the base. For heme proteins with b-type hemes [iron protoporphyrin IX], in which the heme is not covalently attached to the protein, the protein is denatured to release the heme. Addition of pyridine, followed by the reducing agent sodium dithionite (hydrosulfite) reduces the Fe(III) to the Fe(II) form.
• Although this assay is widely used, it tends to be irreproducible, and advances in this area are desirable.
Prot
ein
Fe NaOH Fe PyridineFe III
Pyridine
Pyridine
Na DTFe II
Pyridine
Pyridine
Figure 5. Graphical description of the pyridine hemochrome assay.
Butylamine as an Autoreducer
Prot
ein
Fe NaOH Fe PyridineFe III
Pyridine
Pyridine
Na DTFe II
Pyridine
Pyridine
• Autoreduction of Fe(III) to Fe(II) heme occurs by electron-rich ligands such as aliphatic amines.
• Butylamine solution (40%) was found to partially autoreduce hemin.
• Butylamine solution (80%) was found to fully autoreduce hemin.
• Both solutions of butylamine remain stable over 3 hours.
• Autoreduction does not require sodium dithionite, and is less labor intensive than the pyridine hemochrome assay.
Butylaminehv
Fe II
Butylamine
Butylamine

16
Figure 6. Graphical description of the butylamine hemochrome assay.
Protocol step Comments Numerical setting
Notes
Flow rate 0.2 ml/min Start pump wash Wash inlet A On Wash inlet B On Start conc B % B 0 Column equilibrate Equilibrate w/ 0 CV Normally 5-10 CV.
Equilibrate the column with buffer A. Flowthrough fractionation 8 ml Can be adjusted Sample injection Empty loop w/ X ml Wash out unbound sample Wash column w/ 10 CV 5-10 CV Volume fractionation Start fraction at % B 0 % Start elution End fraction (% B) 100 % Volume fractionation Eluate fraction size 2 ml Can be adjusted Linear gradient Target conc B (% B) 100 % Length of gradient 10 CV Gradient delay Gradient delay 5 ml Clean after elution Clean w/ CV 5 CV Figure 7. FPLC settings for purification of the SiaA protein.

17
Figure 8. Control (50 ml) grown at 37° C and 200 rpm for 7 h followed by centrifugation, sonication and centrifugation again. The absorbance is approximately 1.5 at the Soret. Figure 9. Addition of ALA and ferrous sulfate (50 ml) and grown at 37° C and 200 rpm for 7 h followed by centrifugation, sonication and centrifugation again. The absorbance is approximately 2.3 at the Soret.
50 ml control 4-11-06
0
0.5
1
1.5
2
2.5
3
3.5
4
4.5
250 300 350 400 450 500 550 600 650 700
Wavelength (nm)
Abs
orba
nce
50 ml sample with 0.1 mM ALA 4-11-06
0
0.5
1
1.5
2
2.5
3
3.5
4
4.5
250 300 350 400 450 500 550 600 650 700
Wavelength (nm)
Abs
orba
nce

18
Expression and Purification at 37 °C
E. coli was grown with plasmid of SiaA overnight
E. coli was added to LB broth; 37 °C with shaking at 200 rpm
Arabinose was added to control. ALA and FeSo4was added to the experimental.
Centrifuged and supernatent was discarded.
Solution was centrifuged again on smaller scale.
Cells lysed in extraction buffer with sonication
Ni Affinity FPLC
4 hours
3 hours
UV/vis was used to calculate amount of holoprotein in SiaA.
Figure 10. Expression, growth and purification protocol of SiaA with and without ALA at 37 oC with shaking at 200 rpm for 7 h.

19
Figure 11. Nickel affinity FPLC chromatogram performed on Figure 8, sonicated, centrifuged, and filtered supernatant (no addition of ALA and FeSO4 to the growth medium). Dotted line starting at fraction 6 indicates a linearly increasing concentration of elution buffer (binding buffer with 0.5 M imidazole). SiaA eluted at 59.2 min.

20
FPLC Control Fraction 14
0
0.5
1
1.5
2
2.5
3
3.5
4
250 300 350 400 450 500 550 600 650 700
Wavelength (nm)
Aab
sorb
ance
FPLC Control Fraction 15
0
0.5
1
1.5
2
2.5
3
3.5
4
250 300 350 400 450 500 550 600 650 700
Wavelength (nm)
Abso
rban
ce
Figure 12. Spectra of individual FPLC fractions for the Ni affinity purification of the protein from cells grown without the addition of ALA and ferrous sulfate. The Figure continues on the next 2 pages.

21
FPLC Control Fraction 16
0
0.5
1
1.5
2
2.5
3
250 300 350 400 450 500 550 600 650 700
Wavelength (nm)
Abso
rban
ce
FPLC Control Fraction 17
0
0.5
1
1.5
2
2.5
3
250 300 350 400 450 500 550 600 650 700
Wavelength (nm)
Abso
rban
ce

22
FPLC Control Fraction18
0
0.1
0.2
0.3
0.4
0.5
0.6
0.7
250 300 350 400 450 500 550 600 650 700
Wavelength (nm)
Abso
rban
ce
FPLC Control Fraction 19
0
0.05
0.1
0.15
0.2
0.25
0.3
0.35
0.4
0.45
250 300 350 400 450 500 550 600 650 700
Wavelength (nm)
Abso
rban
ce

23
Figure 13. Nickel affinity FPLC chromatogram performed on Figure 9, sonicated, centrifuged, and filtered supernatant (with addition of ALA and FeSO4 to the growth medium). Dotted line starting at fraction 16 indicates a linearly increasing concentration of elution buffer (binding buffer with 0.5 M imidazole). SiaA eluted at 84.45 min.
24
FPLC ALA Fraction 24
0
0.2
0.4
0.6
0.8
1
1.2
1.4
1.6
250 300 350 400 450 500 550 600 650 700
Wavelength (nm)
Abso
rban
ce
Figure 14. Spectra of individual FPLC fractions for the Ni affinity purification of the protein from cells grown with the addition of ALA and ferrous sulfate. The Figure continues on the next 3 pages.

25
FPLC ALA Fraction 25
0
0.1
0.2
0.3
0.4
0.5
0.6
0.7
0.8
250 300 350 400 450 500 550 600 650 700
Wavelength (nm)
Abso
rban
ce
FPLC ALA Fraction 26
0
0.05
0.1
0.15
0.2
0.25
0.3
0.35
250 300 350 400 450 500 550 600 650 700
Wavelength (nm)
Abso
rban
ce

26
FPLC ALA Fraction 27
0
0.1
0.2
0.3
0.4
0.5
0.6
250 300 350 400 450 500 550 600 650 700
Wavelength (nm)
Abso
rban
ce
FPLC ALA Fraction 28
0
0.1
0.2
0.3
0.4
0.5
0.6
250 300 350 400 450 500 550 600 650 700
Wavelength (nm)
Abso
rban
ce

27
FPLC ALA Fraction 29
0
0.05
0.1
0.15
0.2
0.25
0.3
0.35
250 300 350 400 450 500 550 600 650 700
Wavelength (nm)
Abso
rban
ce
FPLC ALA Fraction 30
0
0.05
0.1
0.15
0.2
0.25
0.3
0.35
0.4
250 300 350 400 450 500 550 600 650 700
Wavelength (nm)
Abso
rban
ce

28
Figure 15. Control (50 ml) grown at 37 °C and 200 rpm for 7 h followed by centrifugation, sonication and centrifugation again. The protein was initially isolated as reduced after the second centrifugation. After 48 h of being exposed to oxygen, the protein becomes oxidized.
SiaA is in Reduced Form Directly after
Cell Lysis
0.0
0.51.0
1.5
2.0
2.53.0
3.54.0
4.5
250 300 350 400 450 500 550 600 650 700
nm
abs
Cells were lysed in 20 mM Tris-HCl, pH 8.0, 100 mM NaCl, and 0.1% Triton X-100.
0.00.51.01.52.02.53.03.54.04.5
250 300 350 400 450 500 550 600 650 700nm
abs
SiaA in Lysate is Oxidized After
48 h
Prominent α peak indicates the Fe(II) form

29
e. coli gowth after 19 h 45 min 10-10-06
0
0.5
1
1.5
2
2.5
3
3.5
4
4.5
200 300 400 500 600 700
Wavelength (nm)
Abs
orba
nce
Figure 16. E. coli were grown at 37 °C with shaking at 200 rpm for 19.75 h. This spectra was obtained before the addition of arabinose, ALA or Fe(II)SO4. The OD660 is approximately 1.9.
Control Low Temperature before addition of stock solutions 10-10-06
0
0.5
1
1.5
2
2.5
3
3.5
4
4.5
250 300 350 400 450 500 550 600 650 700
Wavelength
Abs
orba
nce
Figure 17. E. coli were grown at 24 °C with shaking at 100 rpm for 3 h. This spectra was obtained before the addition of arabinose, ALA or Fe(II)SO4. The OD660 is less than 0.1.

30
Control LT after 48 h of shaking 10-12-06
0
0.2
0.4
0.6
0.8
1
1.2
1.4
1.6
250 350 450 550 650
Wavelength (nm)
Abso
rban
ce
Figure 18. Arabinose was added to the sample in Figure 17 which was then grown at 24 °C with shaking at 100 rpm for 48 h.
ALA low temperature after 48 h of shaking 10-12-06
0
0.5
1
1.5
2
2.5
250 300 350 400 450 500 550 600 650 700
Wavelength (nm)
Abso
rban
ce
Figure 19. Arabinose, ALA or Fe(II)SO4 were added to the sample identical to that in Figure 17. The sample was then grown at 24 °C with shaking at 100 rpm for 48 h.

31
Control LT OD before centrifuge 10-13-06
0
0.2
0.4
0.6
0.8
1
1.2
1.4
1.6
1.8
250 300 350 400 450 500 550 600 650 700
Wavelength (nm)
Abs
orba
nce
ALA LT OD before cenrifuge 10-13-06 Libkind 54
0
0.5
1
1.5
2
2.5
3
250 300 350 400 450 500 550 600 650 700
Wavelength
Abs
orba
nce
Figure 20. The samples from Figure 18 (top) and 19 (bottom) after 3 d of growth (just before centrifugation).

32
50 ml sample control at low temperature 10-13-06
0
0.5
1
1.5
2
2.5
250 350 450 550 650
Wavelength (nm)
Abso
rban
ce
Figure 21. E. coli grown without ALA and ferrous sulfate at 24 °C with shaking at 100 rpm for 3 days.

33
50 ml ALA sample at low temperature 10-13-06
0
0.5
1
1.5
2
2.5
3
3.5
4
250 300 350 400 450 500 550 600 650 700
Wavelength (nm)
Abso
rban
ce
Figure 22. E. coli grown in the presence of ALA and FeSO4 24 °C with shaking at 100 rpm for 3 days.

34
Production of Heme at Different Temperatures
50 ml ALA sample at low temperature 10-13-06
0
0.5
1
1.5
2
2.5
3
3.5
4
250 300 350 400 450 500 550 600 650 700
Wavelength (nm)
Abs
orba
nce
50 ml sample with 0.1 mM ALA 4-11-06
0
0.5
1
1.5
2
2.5
3
3.5
4
4.5
250 300 350 400 450 500 550 600 650 700
Wavelength (nm)
Abso
rban
ce
• SiaA grown at 37 °C (top spectrum) displays a larger Soret in comparison to SiaA grown at 24 °C (bottom spectrum).
• The larger Soret represents more free heme when grown at 37 °C, but not more holoprotein.
• Growth at 24 °C produces approximately four times less free heme than at 37 °C.
37 °C
24 °C
Figure 23. Comparison of growth of E. coli with SiaA at 37 oC and 24 oC.

35
Butylamine (40%) with hemin from Mb 10-30-06
0
0.5
1
1.5
2
250 300 350 400 450 500 550 600 650 700
Wavelength
Abso
rban
ce
Butylamine Solution (40%) after 3 h 10-30-06
0
0.5
1
1.5
2
250 300 350 400 450 500 550 600 650 700
Wavelength
Abs
orba
nce
Figure 24. Myoglobin treated first with 0.1 M NaOH with subsequent addition of 40% butylamine solution (top). The heme is not fully reduced. After 3 h, the heme is still not fully reduced (bottom). All solutions were in air.

36
Butylamine (80%) immediate spectrum11-6-06
0
0.2
0.4
0.6
0.8
1
250 300 350 400 450 500 550 600 650 700
Wavelength
Abs
orba
nce
Butylamine Solution (80%) after 2 h 11-6-06
0
0.2
0.4
0.6
0.8
1
250 300 350 400 450 500 550 600 650 700
Wavelength
Abso
rban
ce
Figure 25. Myoglobin treated first with 0.1 M NaOH and then with butylamine to give a final solution of 80% butylamine (all solutions in air). Top: Spectra take directly after the addition of butylamine. Bottom: Spectrum taken after 2 h in room light. The sample appears completely reduced after mixing, and does not change over 3 h.

37
1.6 uL of Na DT added to butylamine (80%) 11-6-06
0
0.2
0.4
0.6
0.8
1
250 300 350 400 450 500 550 600 650 700
Wavelength
Abs
orba
nce
23.6 uL of Na DT added to butylamine (80%) 11-6-06
0
0.2
0.4
0.6
0.8
1
250 300 350 400 450 500 550 600 650 700
Wavelength
Abs
orba
nce
Figure 26. The solution in Figure 25 (bottom) (3 mL) was bubbled with nitrogen for 10 min. Top: To this sample was added 1.6 µL of saturated aqueous solution of sodium dithionite. No addition reduction is seen. Bottom: Another 22 µL of saturated aqueous sodium dithionite solution were added. Significant absorption under the Soret due to the dithionite is observed.

38
Figure 27. General protocol for expression and purification of SiaA.
Expression and Purification
Grow E. coli with plasmid of SiaA
SDS-PAGE to confirm overexpression
Lyse cells in extraction buffer with French press; centrifuge; Ni affinity FPLC
Combine predominant SiaA fractions; remove imidazole elutent by exchanging buffer to Tris-HCl
Combine SiaA fractions; suspend in Tris-HCl to remove NaCl eluent; concentrate
SDS-PAGE
Weak anion exchange FPLC
Purified SiaA ready for biophysical testing
SDS-PAGE

39
Reference List
Barker, P. D., Butler, J. L., deOliveira, P., Hill, H. A. O., and Hunt, N. I. (1996). Direct electrochemical studies of cytochromes b(562). Inorg. Chim. Acta 252, 71-77.
Bates, C. S., Montanez, G. E., Woods, C. R., Vincent, R. M., and Eichenbaum, Z. (2003). Identification and characterization of a Streptococcus pyogenes operon involved in binding of hemoproteins and acquisition of iron. Infect. Immun. 71, 1042-1055.
Berg, J. M., Tymoczko, J. L., and Stryer, L. (2006). "Biochemistry." W. H. Freeman.
Berry, E. A. and Trumpower, B. L. (1987). Simultaneous determination of hemes a, b, and c from pyridine hemochrome spectra. Anal. Biochem. 161, 1-15.
de Graef, M. R., Alexeeva, S., Snoep, J. L., and de Mattos, M. J. T. (1999). The steady-state internal redox state (NADH/NAD) reflects the external redox state and is correlated with catabolic adaptation in Escherichia coli. J. Bacteriol. 181, 2351-2357.
Eakanunkul, S., Lukat-Rodgers, G. S., Sumithran, S., Ghosh, A., Rodgers, K. R., Dawson, J. H., and Wilks, A. (2005). Characterization of the periplasmic heme-binding protein ShuT from the heme uptake system of Shigella dysenteriae. Biochemistry 44, 13179-13191.
Hwang, Y. C. and Dixon, D. W. (1986). Characterization of Fe(III) porphyrins bearing aliphatic amine ligands. Inorg. Chem. 25, 3716-3718.
Igarashi, K., Verhagen, M. F. J. M., Samejima, M., Schulein, M., Eriksson, K. E. L., and Nishino, T. (1999). Cellobiose dehydrogenase from the fungi Phanerochaete chrysosporium and Humicola insolens - A flavohemoprotein from Humicola insolens contains 6-hydroxy-FAD as the dominant active cofactor. J. Biol. Chem. 274, 3338-3344.
Jones, P. M. and George, A. M. (2004). The ABC transporter structure and mechanism: Perspectives on recent research. Cell Mol. Life Sci. 61, 682-699.
Karpowich, N. K., Huang, H. H., Smith, P. C., and Hunt, J. F. (2003). Crystal structures of the BtuF periplasmic-binding protein for vitamin B12 suggest a functionally important reduction in protein mobility upon ligand binding. J. Biol. Chem. 278, 8429-8434.
Lei, B. F., Liu, M. Y., Prater, C. I., Kala, S. V., Deleo, F. R., and Musser, J. M. (2003). Identification and characterization of HtsA, a second heme-binding protein made by Streptococcus pyogenes. Infect. Immun. 71, 5962-5969.
Lei, B. F., Smoot, L. M., Menning, H. M., Voyich, J. M., Kala, S. V., Deleo, F. R., Reid, S. D., and Musser, J. M. (2002). Identification and characterization of a novel heme-associated cell surface protein made by Streptococcus pyogenes. Infect. Immun. 70, 4494-4500.

40
Liu, M. and Lei, B. F. (2005a). Heme transfer from streptococcal cell surface protein Shp to HtsA of transporter HtsABC. Infect. Immun. 73, 5086-5092.
Liu, M. Y. and Lei, B. F. (2005b). Heme transfer from streptococcal cell surface protein Shp to HtsA of transporter HtsABC. Infect. Immun. 73, 5086-5092.
Locher, K. P. (2004). Structure and mechanism of ABC transporters. Curr. Opin. Struct. Biol. 14, 426-431.
Mack, J., Vermeiren, C., Heinrichs, D. E., and Stillman, M. J. (2004). In vivo heme scavenging by Staphylococcus aureus IsdC and IsdE proteins. Biochem. Biophys. Res. Commun. 320, 781-788.
Milgrom, L. R. (1997). "The Colours of Life: An Introduction to the Chemistry of Porphyrins and Related Compounds." Oxford University Press, Oxford.
Nygaard, T. K., Blouin, G. C., Liu, M. Y., Fukumura, M., Olson, J. S., Fabian, M., Dooley, D. M., and Lei, B. F. (2006). The mechanism of direct heme transfer from the streptococcal cell surface protein shp to HtsA of the HtsABC transporter. J. Biol. Chem. 281, 20761-20771.
Perkins-Balding, D., Rasmussen, A., and Stojiljkovic, I. (2004). Bacterial heme and hemoprotein receptors. In "Iron Transport in Bacteria" (J. H. Crosa, A. R. Mey, and S. M. Payne, Eds.), pp. 66-85. ASM Press, Washington, DC.
Rivera, M. and Walker, F. A. (1995). Biosynthetic preparation of isotopically labeled heme. Anal. Biochem. 230, 295-302.