
Short Wave Infrared (SWIR) Imaging Using Small Unmanned ...
7
Short Wave Infrared (SWIR) Imaging Systems Using Small Unmanned Aerial Systems (sUAS) Brandon Stark 1 , Student Member, IEEE, Matthew McGee 2 , Student Member, IEEE and YangQuan Chen 3 , Senior Member, IEEE Abstract— Unmanned Aerial Systems are currently in use for a wide variety of applications with digital cameras and thermal cameras, but recent advances in Short Wave Infrared (SWIR) imaging systems or imagers have led to their commercial availability. The SWIR spectrum is a reflected light region and similar to near-infrared (NIR) is invisible to human eyes. The unique properties of this spectrum such as penetration of haze and smoke and its high sensitivity to moisture make it a potentially significant addition to small UAS (sUAS) applications. The use of sUASs to provide higher temporal and spatial resolutions has the potential for new applications otherwise impossible. In this paper, a tutorial introduction to the SWIR spectrum and its enabled potential applications for small UASs is presented. Furthermore this paper outlines how sUAS remote sensing applications stand to benefit from the use of SWIR imaging systems, as the effectiveness of SWIR bands in satellite imagery for metrics related to water content have already been demonstrated. Results from real world sUAS flight missions are included. I. I NTRODUCTION Short Wave Infrared (SWIR) imaging systems or imagers are increasingly becoming commercially available, enabling their integration into Unmanned Aerial Systems (UASs). These unique imagers measure light in the SWIR region of the electromagnetic spectrum, typically defined as between 1μm and 3μm, beyond the visible light spectrum (0.4 μm to 0.7 μm) and beyond the near infrared region (0.7 μm to 1 μm). While the near infrared (NIR) spectrum can be measured by CMOS or CCD technology even though it is invisible to the human eye, the SWIR spectrum requires a different detector, such as an Indium Gallium Arsenide (InGaAs) detector. The manufacturing challenges and costs has slowed its adoption in commercial applications. In com- parison to other visible light or thermal infrared imagers, the cost for SWIR systems are typically higher and suffer from significantly reduced resolution and increased weight. How- ever, its unique properties can provide valuable information where visible, NIR or thermal imagery are ineffective. This paper is intended to introduce the SWIR spectrum of light, highlight some of its uses, describe its implementations and challenges including calibration techniques, demonstrate 1 Mechatronics, Embedded Systems and Automation Lab, School of Engineering, University of California, Merced, Merced, CA, USA, [email protected] 2 Mechatronics, Embedded Systems and Automation Lab, School of Engineering, University of California, Merced, Merced, CA, USA, [email protected] 3 Mechatronics, Embedded Systems and Automation Lab, School of Engineering, University of California, Merced, Merced, CA, USA, [email protected] unique qualities and predict its future enabled small UAS applications. In Section II, an introduction to the SWIR spectrum is presented. Current uses of SWIR in military and remote sensing applications are described in Section III. Section IV introduces SWIR imagers and integration into UASs. Two example UAS SWIR applications are described in Section V. Finally, concluding remarks are presented in Section VI. II. SHORT WAVE I NFRARED Visual light comprises of only a small portion of the electromagnetic spectrum. Beyond 0.7 μm (what humans perceive to be the color red), longer wavelengths of light exist but are invisible to the human eye. However, with the use of imaging equipment, it is possible to record these wavelengths. Many UASs are already equipped with cameras that can image in the NIR spectrum which ranges from 0.7 μm to the limit of CMOS or CCD detector sensitivity at 1 μm. Beyond NIR, from 1 μm to roughly 3 μm is referred to as the short wave infrared spectrum (Fig. 1 ). While this spectrum is beyond NIR, it still primarily responds to reflected electromagnetic energy as opposed to emitted energy, and thus is not normally used for thermal measurements [1]. The majority of energy in the SWIR spectrum is either reflected or absorbed by objects, similar to the light properties in the visible and NIR spectrum. Fig. 1: Electromagnetic Light Spectrum. The SWIR spectrum is recognized for its significant ab- sorption by water, and bands of absorption by water vapor and CO 2 . Water vapor has significant impact on the transmis- sion of light in the atmosphere in the SWIR spectrum with bands of absorption around 0.935μm, 1.13 μm, 1.38 μm, 1.88 μm and 2.68 μm [1]. However, the strong absorption by water in the SWIR spectrum results in SWIR imagers exhibiting significant sensitivity to moisture. In Fig. 2, the water in the bottle appears dark rather than transparent. Next to the bottle, the darker spot on the apple is a visible marker of a bruise, which released moisture under the skin of the apple. In the visible spectrum, such bruising would not be visible. Man-made objects, such as clothing also typically 2015 International Conference on Unmanned Aircraft Systems (ICUAS) Denver Marriott Tech Center Denver, Colorado, USA, June 9-12, 2015 978-1-4799-6009-5/15/$31.00 ©2015 European Union 495
Transcript of Short Wave Infrared (SWIR) Imaging Using Small Unmanned ...

Short Wave Infrared (SWIR) Imaging Systems Using Small UnmannedAerial Systems (sUAS)
Brandon Stark1, Student Member, IEEE, Matthew McGee2, Student Member, IEEEand YangQuan Chen3, Senior Member, IEEE
Abstract— Unmanned Aerial Systems are currently in use fora wide variety of applications with digital cameras and thermalcameras, but recent advances in Short Wave Infrared (SWIR)imaging systems or imagers have led to their commercialavailability. The SWIR spectrum is a reflected light regionand similar to near-infrared (NIR) is invisible to human eyes.The unique properties of this spectrum such as penetrationof haze and smoke and its high sensitivity to moisture makeit a potentially significant addition to small UAS (sUAS)applications. The use of sUASs to provide higher temporaland spatial resolutions has the potential for new applicationsotherwise impossible. In this paper, a tutorial introduction tothe SWIR spectrum and its enabled potential applications forsmall UASs is presented. Furthermore this paper outlines howsUAS remote sensing applications stand to benefit from the useof SWIR imaging systems, as the effectiveness of SWIR bandsin satellite imagery for metrics related to water content havealready been demonstrated. Results from real world sUAS flightmissions are included.
I. INTRODUCTION
Short Wave Infrared (SWIR) imaging systems or imagersare increasingly becoming commercially available, enablingtheir integration into Unmanned Aerial Systems (UASs).These unique imagers measure light in the SWIR region ofthe electromagnetic spectrum, typically defined as between1µm and 3µm, beyond the visible light spectrum (0.4 µmto 0.7 µm) and beyond the near infrared region (0.7 µmto 1 µm). While the near infrared (NIR) spectrum can bemeasured by CMOS or CCD technology even though it isinvisible to the human eye, the SWIR spectrum requiresa different detector, such as an Indium Gallium Arsenide(InGaAs) detector. The manufacturing challenges and costshas slowed its adoption in commercial applications. In com-parison to other visible light or thermal infrared imagers, thecost for SWIR systems are typically higher and suffer fromsignificantly reduced resolution and increased weight. How-ever, its unique properties can provide valuable informationwhere visible, NIR or thermal imagery are ineffective.
This paper is intended to introduce the SWIR spectrum oflight, highlight some of its uses, describe its implementationsand challenges including calibration techniques, demonstrate
1Mechatronics, Embedded Systems and Automation Lab, School ofEngineering, University of California, Merced, Merced, CA, USA,[email protected]
2Mechatronics, Embedded Systems and Automation Lab, School ofEngineering, University of California, Merced, Merced, CA, USA,[email protected]
3Mechatronics, Embedded Systems and Automation Lab, School ofEngineering, University of California, Merced, Merced, CA, USA,[email protected]
unique qualities and predict its future enabled small UASapplications. In Section II, an introduction to the SWIRspectrum is presented. Current uses of SWIR in militaryand remote sensing applications are described in Section III.Section IV introduces SWIR imagers and integration intoUASs. Two example UAS SWIR applications are describedin Section V. Finally, concluding remarks are presented inSection VI.
II. SHORT WAVE INFRARED
Visual light comprises of only a small portion of theelectromagnetic spectrum. Beyond 0.7 µm (what humansperceive to be the color red), longer wavelengths of lightexist but are invisible to the human eye. However, with theuse of imaging equipment, it is possible to record thesewavelengths. Many UASs are already equipped with camerasthat can image in the NIR spectrum which ranges from0.7 µm to the limit of CMOS or CCD detector sensitivityat 1 µm. Beyond NIR, from 1 µm to roughly 3 µm isreferred to as the short wave infrared spectrum (Fig. 1). While this spectrum is beyond NIR, it still primarilyresponds to reflected electromagnetic energy as opposed toemitted energy, and thus is not normally used for thermalmeasurements [1]. The majority of energy in the SWIRspectrum is either reflected or absorbed by objects, similarto the light properties in the visible and NIR spectrum.
Fig. 1: Electromagnetic Light Spectrum.
The SWIR spectrum is recognized for its significant ab-sorption by water, and bands of absorption by water vaporand CO2. Water vapor has significant impact on the transmis-sion of light in the atmosphere in the SWIR spectrum withbands of absorption around 0.935µm, 1.13 µm, 1.38 µm,1.88 µm and 2.68 µm [1]. However, the strong absorptionby water in the SWIR spectrum results in SWIR imagersexhibiting significant sensitivity to moisture. In Fig. 2, thewater in the bottle appears dark rather than transparent. Nextto the bottle, the darker spot on the apple is a visible markerof a bruise, which released moisture under the skin of theapple. In the visible spectrum, such bruising would not bevisible. Man-made objects, such as clothing also typically
2015 International Conference on Unmanned Aircraft Systems (ICUAS)Denver Marriott Tech CenterDenver, Colorado, USA, June 9-12, 2015
978-1-4799-6009-5/15/$31.00 ©2015 European Union 495
reflects highly in the SWIR spectrum as can be seen in Fig.3.
Fig. 2: Water and Bruised Apple. The bruise is imperceptiblein visible light, but is visible in the SWIR spectrum.
Fig. 3: Person wearing a black jacket and holding a blackrock. Clothing is often highly reflective in the SWIR spec-trum.
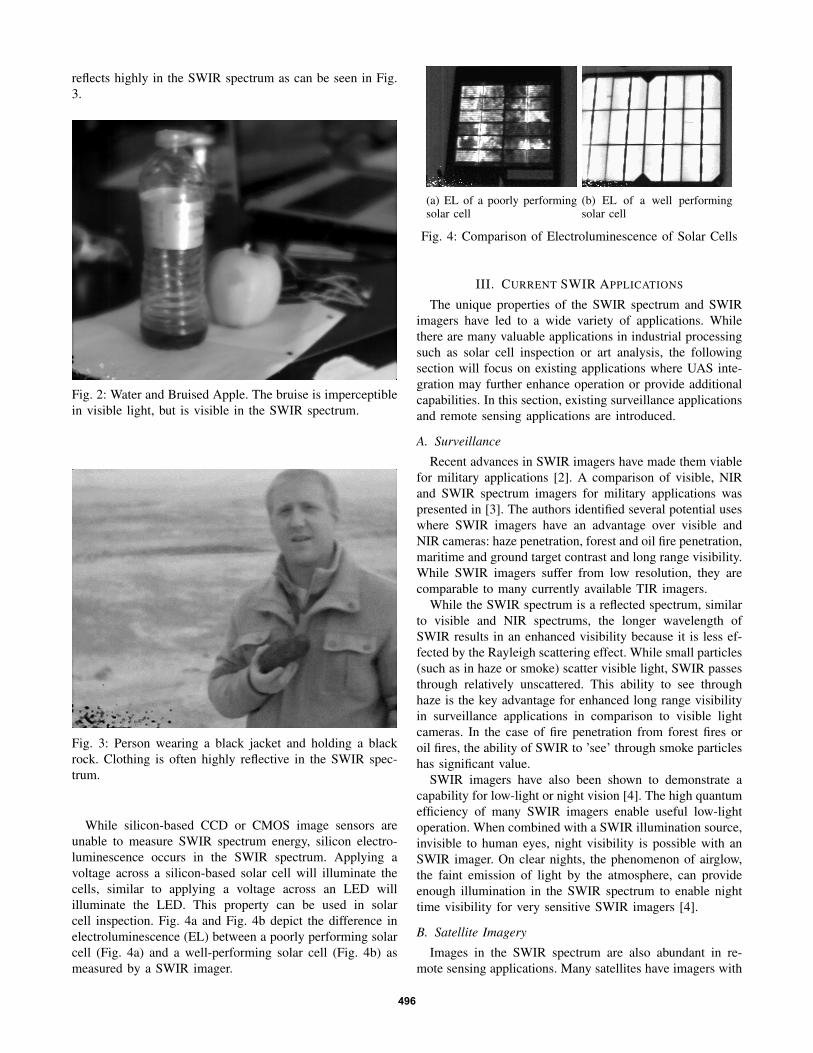
While silicon-based CCD or CMOS image sensors areunable to measure SWIR spectrum energy, silicon electro-luminescence occurs in the SWIR spectrum. Applying avoltage across a silicon-based solar cell will illuminate thecells, similar to applying a voltage across an LED willilluminate the LED. This property can be used in solarcell inspection. Fig. 4a and Fig. 4b depict the difference inelectroluminescence (EL) between a poorly performing solarcell (Fig. 4a) and a well-performing solar cell (Fig. 4b) asmeasured by a SWIR imager.
(a) EL of a poorly performingsolar cell
(b) EL of a well performingsolar cell
Fig. 4: Comparison of Electroluminescence of Solar Cells
III. CURRENT SWIR APPLICATIONS
The unique properties of the SWIR spectrum and SWIRimagers have led to a wide variety of applications. Whilethere are many valuable applications in industrial processingsuch as solar cell inspection or art analysis, the followingsection will focus on existing applications where UAS inte-gration may further enhance operation or provide additionalcapabilities. In this section, existing surveillance applicationsand remote sensing applications are introduced.
A. Surveillance
Recent advances in SWIR imagers have made them viablefor military applications [2]. A comparison of visible, NIRand SWIR spectrum imagers for military applications waspresented in [3]. The authors identified several potential useswhere SWIR imagers have an advantage over visible andNIR cameras: haze penetration, forest and oil fire penetration,maritime and ground target contrast and long range visibility.While SWIR imagers suffer from low resolution, they arecomparable to many currently available TIR imagers.
While the SWIR spectrum is a reflected spectrum, similarto visible and NIR spectrums, the longer wavelength ofSWIR results in an enhanced visibility because it is less ef-fected by the Rayleigh scattering effect. While small particles(such as in haze or smoke) scatter visible light, SWIR passesthrough relatively unscattered. This ability to see throughhaze is the key advantage for enhanced long range visibilityin surveillance applications in comparison to visible lightcameras. In the case of fire penetration from forest fires oroil fires, the ability of SWIR to ’see’ through smoke particleshas significant value.
SWIR imagers have also been shown to demonstrate acapability for low-light or night vision [4]. The high quantumefficiency of many SWIR imagers enable useful low-lightoperation. When combined with a SWIR illumination source,invisible to human eyes, night visibility is possible with anSWIR imager. On clear nights, the phenomenon of airglow,the faint emission of light by the atmosphere, can provideenough illumination in the SWIR spectrum to enable nighttime visibility for very sensitive SWIR imagers [4].
B. Satellite Imagery
Images in the SWIR spectrum are also abundant in re-mote sensing applications. Many satellites have imagers with
496

specific regions of spectral sensitivity, referred to as bands,within the SWIR region. For remote sensing applications, theSWIR spectrum is recognized for its sensitivity to moisture,which can be correlated to important metrics such as leafwater content and other crop canopy physiological statuses[5]. Over the past decades, researchers have used SWIRbands to indicate leaf and canopy moisture [6], plant waterstress [7], the remote sensing of vegetation liquid water [8]and forest fire burn severity [9].
A list of common satellites and their SWIR bands canbe found in Tab. I. While the majority of SWIR bands arein the region between 1.55µm and 1.75µm, some satelliteshave bands in the atmospheric window between 2.1µm and2.4 µm and around 1.25µm. Landsat 8 OLI introduces a newSWIR band between 1.36-1.38µm, notable because it existsat a region where water vapor is not transparent. The result isthat high altitude clouds reflect highly compared to the darkbackground of water vapor in the earth atmosphere, whichthen can be used to correct other satellite imagery distortedfrom these high altitude clouds.
Many of the applications utilize a common spectral vege-tation difference index in the form of
Index =ρNIR − ρSWIR
ρNIR + ρSWIR(1)
where ρNIR is the reflectance in the NIR spectrum band,ρSWIR is the reflectance in the measured SWIR spectrum.There are several indexes identified, each with differentapplications utilizing difference SWIR bands provided bydifferent satellite systems. The availability of SWIR wave-lengths for sUASs enable these indices to be calculatedat a higher spatial resolution than previously available byutilizing optical bandpass filters. Literature describes threemajor spectral indices that have been identified. The Nor-malized Difference Water Index (NDWI) utilizes the shorterwavelengths within the SWIR spectrum (1.2 µm - 1.3 µm)and was recognized as a way to measure vegetation liquidwhile being less sensitive to atmospheric effects than NDVI[8]. The Normalized Difference Infrared Index (NDII) usesthe SWIR spectrum between 1.55 µm - 1.75 µm and hasbeen used to identify historic (up to 10 years) fire scardamage [10] as well as an indicator of canopy water stress[6]. The Normalized Burn Ratio (NBR) utilizes the longerSWIR spectrum between 2.05 µm - 2.45 µm to map forestburns and mapping burn severity [9].
IV. SWIR IMAGING EQUIPMENT
Although not as common as digital cameras or thermal im-agers, SWIR imagers have become available commercially.Currently, most SWIR imaging sensors are made with In-dium Gallium Arsenide (InGaAs) detector arrays. Althoughother detectors such as Germanium (Ge), Indium Antimonide(InSb), and Mercury Cadmium Telluride (HgCdTe) detectors,InGeAs arrays have been more practical due to their higherquantum efficiency and low dark current at room temper-ature, although these sensors are typically only effectivebetween the 0.9 µm to 1.7 µm wavelengths [4]. A plot
of the quantum efficiency of an InGeAs detector can befound in Fig 5, courtesy of Infrared Cameras Inc (ICI). Aswith most electronics, the drive for miniaturization has ledto the availability of small and light-weight systems, manysuitable for integration into UASs. The rest of this sectionwill introduce issues related to the calibration of SWIRimagers and the use of bandpass filters for SWIR spectrumseparation.
Fig. 5: SWIR Quantum Efficiency, courtesy of ICI http://www.infraredcamerasinc.com
A. SWIR Calibration Techniques
As with all optical imaging equipment, calibration isnecessary for reliable and accurate measurements. Whilethe SWIR spectrum is invisible to the human eye, many ofthe techniques of calibration for multi-spectral cameras aresuitable for SWIR imagers. An in-depth discussion of manycalibration techniques can be found in [11]. However, unlikevisible spectrum imagers, SWIR imagers typically have amuch lower resolution and pixel count which introduces ad-ditional challenges. Commercially available SWIR imagershave resolutions of 320 x 240 or 640 x 480, comparable tomany commercially available TIR imagers. Special care mustbe taken in noise reduction techniques to prevent the ob-scuring of details which may result in artifacts or inaccuratedata. Common issues found in SWIR imagers include pixelnonuniformities and line noise. Nonuniformity corrections(NUCs) techniques are suitable for SWIR imagers, similarto their application in thermal imagers.
In cases where reflected radiation measurements are re-quired, radiometric calibration can be applied. Since SWIRspectrum has similar characteristics as visible and nearinfrared spectrums, similar radiometric calibration can beapplied, however special care must be taken in target se-lection. Certain ink and prints may be discernible in thevisible spectrum (Fig. 6a), but not in the SWIR spectrum (Fig6b). Additionally, while SWIR is predominately a reflectedenergy region, objects that are extremely hot (above 300degrees C) may emit radiation in the SWIR region and
497

TABLE I: Satellite SWIR Bands
Satellite Resolution Band Regions (µm)ASTER 30 m 1.6-1.7, 2.145-2.185, 2.185-2.225, 2.235-2.285, 2.295-2.365, 2.360-2.430
AVHRR/3 1.09 km 1.58-1.64EO-1 ALI 30 m 1.2-1.3, 1.55-1.75, 2.08-2.35
Landsat 7 ETM+ 30 m 1.55-1.77, 2.09-2.35Landsat 8 OLI 30 m 1.57-1.65, 2.11-2.29, 1.36-1.38
MODIS 500 m 1.23-1.25, 1.628-1.652, 2.105-2.155, 1.36-1.39
(a) Visible Spectrum (b) SWIR Spectrum
Fig. 6: Comparison of Visible and SWIR Images of markerink. SWIR contrast artificially stretched for comparison
should be avoided for reflected energy calibration. However,once the SWIR imager is calibrated to provide accurate andrepeatable data, it is suitable for surveillance applications.
B. Bandpass Lens Selection
As previously described, one application of SWIR imagersis in the field of remote sensing. It is possible to utilizebandpass optical filters to restrict wavelength sensitivity toprovide similar bands as found in satellite imagery. Thehigh quantum efficiency of InGaAs detectors enable a SWIRimager to work well in low-light situations, such as when abandpass filter is used. This ability introduces a wide range ofapplications that utilize specific SWIR bands for calculationas with the previously described spectral indices that useSWIR bands. For example, a bandpass filter with a centerwavelength at 1.6 µm with a bandwidth of 50 nm wouldresult in a similar spectral sensitivity as Landsat 8 - Band 6(1.575 µm - 1.625 µm compared to 1.570 µm to 1.650 µm).
However, there are challenges to the implementation ofbandpass filters in the SWIR spectrum as there are in thevisible and NIR spectrum. Many commercially availablebandpass filters, including those used by many multi-spectralcameras, are subject to wavelength shifting as a function ofangle of incidence. The center wavelength of a bandpass filterwill shift towards towards shorter (blue) wavelengths as theviewing angle widens. This relationship can be calculated as
λr = λ0
(1− sin2 θ
n2
) 12
(2)
where λr is the resulting wavelength, λ0 is the centerwavelength, n is the effective index of refraction of the filterand θ is the angle of incidence. For example, a bandpassfilter centered around 1.600 µm with an index of refraction
of 2.1, will have shifted to 1.580 µm when viewed at anangle of 20◦ (equivalent to a field of view of 40◦). Thismay introduce significant errors for narrow bandpass filterson imagers with a wide field of view (FOV). This affect canbe mitigated through the use of additional lens to collimatethe light before focusing.
Bandpass filter selection should consider both the spectralreflectance of the object and the spectrum of light that passesthrough the atmosphere. Unlike the visible spectrum, not allsunlight passes through the atmosphere due to the bands ofabsorption, especially water vapor around 0.938 µm, 1.13µm, 1.38 µm, 1.88 µm and 2.68 µm. At all of these bands,there is a limited amount of reflected energy for a SWIR tomeasure. This can be visualized in Fig. 7 (data reproducedfrom the USGS Spectral Library [12]).
Fig. 7: Spectral Band specifications from Landsat 8, Sunlighttransmission through atmosphere and spectral reflectancesof green grass, dry grass, melting snow and wetland area.Spectral band specification from Landsat 8 OLI reproducedfrom data by [13]. Sunlight transmission data reproducedfrom the SMARTS model of atmospheric transfer of sunshine[14]. Spectral reflectance data reproduced from the USGSSpectral Library [12]
.
While some satellite imagery is limited by atmospherictransmission windows, a UAS with a SWIR imager withappropriate bandpass filters would be able to collect a widerrange of spectral measurements. This has been shown tobe valuable for improved spectral indices for water stress
498

detection or soil moisture measurements [15].
V. SWIR UAS APPLICATIONS
The use of SWIR imagers for UAS applications is rel-atively unexplored and few applications have been docu-mented. However, as SWIR imagers become more available,there will be opportunities to explore. In the followingsection, two specific potential applications will be discussedthat highlight the unique capabilities of SWIR: soil moisturemeasurements and shallow vernal pool identification andanalysis.
A. Soil Moisture Measurements
Recently, as much as forty-six percent of California hasbeen classified as in stage 4 exceptional drought. As waterconservation becomes ever more important in the state,agricultural regions will need to be as efficient as possiblewith resource allocation. To improve water conservationefforts, wide-scale water usage monitoring is necessary withsufficient spatial resolution. The use of a sUAS with a SWIRimaging system is one of the many methods proposed toprovide the necessary monitoring.
Moisture effects on soil reflectance in the SWIR spectrumhas been well documented with spectrometers in laboratorysettings. Within the visual spectrum, wet soil reflects signifi-cantly less light than dry soil, a process that is both familiarand well studied. However, measurements of soil moistureis difficult in this range as the amount of light reflected doesnot vary after some level of moisture, usually within 1-2 ofvolumetric water content. The reflectance response to varyinglevels of soil moisture begins to exhibit larger separation inthe NIR and SWIR range. Previous studies have identifiedan exponential model relating soil moisture and reflectance[16],
R = Rsat + (Rdry −Rsat)× exp(−c× wc) (3)
where Rsat is the reflectance of saturated soil, Rdry is thereflectance of dry soil, c describes the rate of change becauseof soil moisture, wc is the water content (expressed asvolumetric content) and all values are wavelength dependent.
This model has been validated with SWIR images aswell. To validate the model, a controlled experiment wasconducted. As seen in Fig. 8, 10 cups were filled with sandand mixed with distilled water. Water content was measuredby volume at 2%, 5%, 8%, 11% and 15%. The set ofsoil samples were imaged with a SWIR imager with a fullspectrum lens referred to as broadband (sensitivity between900nm to 1700nm), a 1100nm lens with a bandwidth of12 nm and a 1600nm lens with bandwidth of 50nm. Soilsamples were intentionally not smoothed to simulate real-world conditions. Radiometric calibration was accomplishedwith a NIST calibrated white panel from LabSphere [17] anddistilled water as the black body. Using the full spectrum ofa SWIR imager (broadband) resulted in the highest nonlin-earity, whereas the use of the 1600nm centered bandpass lensresulted in the most linear regression (Fig. 9). All three lensresulted in a R2 fit to the described model above 0.9. The
Fig. 8: Image of soil moisture data collection.
result of this experiment validated the use of the previouslydescribed model and validated the use of 1600 nm centeredbandpass filter as the filter that would provide the most linearresponse to soil moisture as a function of volumetric content.
Fig. 9: Reflectance of soil as a function of water volume com-paring three lens configurations. Reflectance measurementsdepict a more linear relationship when using a bandpass filterlens with a center wavelength at 1600nm.
Future UAS missions will combine ground truth measure-ments of top soil moisture with SWIR aerial imagery tovalidate the use of the described model for soil moistureestimation. While this application would only be effectivewhen the soil is bare and when looking at the top layer ofsoil, the information would be valuable for understandingthe hydrological connectivity in semi-arid environments,where many rare and endangered species of flora and faunacongregate.
499

Fig. 10: Orthomap in Color
Fig. 11: Orthomap in NIR
B. Vernal Pool Identification and Analysis
In Central California, brief seasonal rain occasionallyconcentrates forming what is known as vernal pools. Thesevernal pools are critical complexes teaming with uniqueendemic flora and fauna. Some of these pools may onlybe several centimeters deep and exist for a brief week, butare a valuable ecological resource. Within Central California,the majority of the original vernal pool habitats have beendestroyed through farming and urban development. Ecolog-ical monitoring and conservation of these vernal pools arecritical for maintaining this part of the California ecosystem.Principally, the monitoring of ecosystem properties in theseephemeral habitats requires high frequency sensing. Tradi-tional approaches to remote sensing, which entail fixed orbitsatellites or single flight photography, fail in these systemsbecause the identifying features are too small or too rapidlychanging. The use of UASs have the potential to both providethe high spatial resolution and the high temporal resolution
Fig. 12: Orthomap in SWIR
to both identify and quantify these vernal pools.While NIR imagery can be used for mapping water
features, energy in the NIR spectrum is not fully absorbed inwater less than 1 m. An subset of sUAS imagery collectedin Color, NIR, and SWIR is seen in Figures 10, 11 and 12.The shallow pool outside the levy is indistiguishable in colorimagery and is faint in NIR. However, the full outline ofthe water level is clearly depicted in SWIR. In contrast, thedeeper water pool within the levy is more apparent in NIR,however, the even more shallow ponds are indistinguishablefrom soil and bareground. The increased sensitivity of SWIRto water enables accurate water feature measurements whichis a critical need for conservation efforts.
Future UAS missions will utilize SWIR imagery to iden-tify and analyze the size and distribution of these temporaryvernal pools to aid in the understanding and conservation ofthese rare and threatened ecosystems.
VI. CONCLUSION
SWIR imagers are starting to be become more availablecommercially and they hold significant potential value inproviding information that would be difficult to perceivein visible, NIR or thermal imagery. When combined withthe capabilities of sUASs, the possibilities are endless. Theunique properties of the SWIR spectrum such as the abilityto penetrate haze and smoke are extrodinarly valuable for awide variety of surveillance, reconnaissance, or intelligencegathering for law enforcement, military or fire fightingapplications. In remote sensing operations, such as agricul-tural or environmental applications where data analysis andprocessing are complex and multi-variate, SWIR reflectancemeasurements may prove to be key for water detection andquantification. The SWIR spectrum is already in use forthese applications from satellite imagery, so the transitionto sUASs is well known. The potential applications enabledthrough a higher spatial and temporal resolution of SWIRinformation are only just being realized. The validation ofsoil surface moisture measurements and the use of SWIR
500
for shallow water detection are only the beginning for SWIRapplications for sUASs.
ACKNOWLEDGMENT
The authors would like to thank Gary Strahan, AbhishekMadaan and Gary Forister for their support.
REFERENCES
[1] H. G. Jones and R. A. Vaughan, Remote Sensing of Vegetation. OxfordUniversity Press, New York, USA, 2010.
[2] J. Green and T. Robinson, “Test Equipment and Methods to Char-acterize Fully Assembled SWIR Digital Imaging Systems,” in SPIEDefense+ Security, pp. 90710U–90710U, International Society forOptics and Photonics, 2014.
[3] R. G. Driggers, V. Hodgkin, and R. Vollmerhausen, “What good isSWIR? Passive day comparison of VIS, NIR, and SWIR,” in SPIEDefense, Security, and Sensing, pp. 87060L–87060L, InternationalSociety for Optics and Photonics, 2013.
[4] M. P. Hansen and D. S. Malchow, “Overview of SWIR detectors,cameras, and applications,” in SPIE Defense and Security Symposium,pp. 69390I–69390I, International Society for Optics and Photonics,2008.
[5] D. Kimes, B. Markham, C. Tucker, and J. McMurtrey III, “Temporalrelationships between spectral response and agronomic variables of acorn canopy,” Remote Sensing of Environment, vol. 11, pp. 401–411,1981.
[6] M. Hardisky, V. Klemas, and M. Smart, “The influence of soilsalinity, growth form, and leaf moisture on the spectral radiance ofSpartina alterniflora canopies,” Photogrammetric Engineering andRemote Sensing, pp. 77–83, 1983.
[7] E. R. Hunt Jr and B. N. Rock, “Detection of changes in leaf watercontent using near-and middle-infrared reflectances,” Remote sensingof environment, vol. 30, no. 1, pp. 43–54, 1989.
[8] B.-C. Gao, “NDWI - a normalized difference water index for remotesensing of vegetation liquid water from space,” Remote sensing ofenvironment, vol. 58, no. 3, pp. 257–266, 1996.
[9] C. Key and N. Benson, “Measuring and remote sensing of burnseverity,” in US Geological Survey wildland fire workshop, vol. 31,pp. 02–11, US Geological Survey Washington, DC, USA, 2002.
[10] F. Gerard, S. Plummer, R. Wadsworth, A. Ferreruela Sanfeliu, L. Iliffe,H. Balzter, and B. Wyatt, “Forest fire scar detection in the borealforest with multitemporal SPOT-VEGETATION data,” Geoscience andRemote Sensing, IEEE Transactions on, vol. 41, no. 11, pp. 2575–2585, 2003.
[11] J. Kelcey and A. Lucieer, “Sensor correction of a 6-band multispectralimaging sensor for UAV remote sensing,” Remote Sens, vol. 4, no. 5,pp. 1462–1493, 2012.
[12] R. N. Clark, G. A. Swayze, R. Wise, K. E. Livo, T. M. Hoefen, R. F.Kokaly, and S. J. Sutley, USGS digital spectral library splib06a. USGeological Survey Reston, VA, 2007.
[13] USGS, “Landsat 8.” [ONLINE] http://landsat.usgs.gov/landsat8.php, 2015.
[14] C. A. Gueymard, “Parameterized transmittance model for direct beamand circumsolar spectral irradiance,” Solar Energy, vol. 71, no. 5,pp. 325–346, 2001.
[15] L. Ji, L. Zhang, B. K. Wylie, and J. Rover, “On the Terminology of theSpectral Vegetation Index (NIR- SWIR)/(NIR+ SWIR),” InternationalJournal of Remote Sensing, vol. 32, no. 21, pp. 6901–6909, 2011.
[16] D. B. Lobell and G. P. Asner, “Moisture Effects on Soil Reflectance,”Soil Science Society of America Journal, vol. 66, no. 3, pp. 722–727,2002.
[17] Labsphere, INC, “Permaflect Reflectance Coatings.” [ONLINE]http://www.labsphere.com/products/reflectance-materials-and-coatings/white-coatings/permaflect.aspx, 2015.
501