Shipping 1Q13 Previews -...
114
Sector Report 15-Apr-13 RS PLATOU MARKETS AS Haakon VII’s gate 10 P.O. BOX 1474 Vika N-0116 Oslo, Norway Telephone +47 22 01 63 00 Telefax +47 22 01 63 10 [email protected] www.platoumarkets.com NO 942 274 238 MVA Shipping 1Q13 Previews Analyst: Frode Mørkedal Tel: +47 22 01 63 27 E-mail: [email protected] Analyst: Herman Hildan Tel: +47 22 01 63 53 E-mail: [email protected] Shipping 1Q13 Previews Investing in shipping stocks today is a bet on a cyclical recovery of freight rates over the next two years. Given the sharply lower fleet growth in most segments during the forecast period, we believe such a bet is attractive. The stocks that have done well the last months have been able to tie a story around acquisition of ships at historically low asset values, and we expect the winners this year will remain growth-oriented companies. We continue to favour product tankers and dry bulk shipping where demand growth is high and therefore should be able to absorb the overcapacity of ships faster than in other segment. Closures of refinery capacity in mature markets means trading distances for product tankers will increase, while China will be increasingly reliant on dry bulk imports because of constrained local production of iron ore and coal with new low-cost supply from Australia and Brazil opening up arbitrage opportunities. • 1Q13 market review:Product tankers enjoyed much better rates in 1Q, particularly for MRs that averaged $18,000 per day. We believe this reflects that US product exports are driving up trading distances, although seasonal refinery turnarounds helped as well. Dry bulk earnings remained at operating cost levels, although we have seen improved freight rates for the smaller Handysize, Supramax and Panamax vessels during March on the back of a strong South American grain season and rising port congestion. In the crude tanker sector, rates have struggled due to reduced OPEC production and declining crude imports to both USA and China. However, we expect the end of a heavy refinery maintenance period to lift Saudi crude exports in coming months, provided oil prices do not drop much further. The container shipping market saw flat box rates q/q but 16% higher y-y, which should help the container operators to avoid the dramatic losses seen during 1Q12. However, box rates have underperformed last year’s level during April. In our view this is due to too high fleet growth and still struggling volumes and demand from Europe. LPG and LNG carriers saw rates slip in the first quarter due to lower export volumes whereas chemical tanker earnings were up 4% y-y. • Recommendation changes:We have lifted our rating for Nordic American Tankers from Sell to Neutral following the recent equity raise, the alignment of management’s incentives with other shareholders, and growth clearly on the agenda with recent investments. We have also lifted Diana Containerships from Sell to Neutral after the recent stock price decline. We have changed StealthGas from Buy to Neutral following the strong share price performance. • Valuation: Tanker stocks (both crude and clean) today trade 1.4x NAV (simple peer group average) which we find implies around 16% higher asset values compared with broker quotes. Dry bulk stocks on the other hand trade on average 1.03x NAV. Since we are at the trough of the shipping cycle (with ship values historically low when inflation adjusted), we find that today’s NAV is not very meaningful to base an investment on since it is fair to price in a recovery of asset values. Based on EV/EBITDA, the tanker peer group trades at 7x ‘15e while dry bulk on average trades at 3.5x ‘15e (both sectors based on mid-cycle rates of $30,000/day for Capesize and $43,000/day for VLCC). We reiterate our view from our Shipping Quarterly February 2013 that we believe both dry bulk and tankers will bottom out in 2013 and see a gradual recovery towards mid-cycle rates in 2015. Our top picks include d’Amico Shipping, Frontline 2012, Golden Ocean, Navios Acquisition, Scorpio Tankers and Ship Finance. 80 85 90 95 100 105 110 115 120 apr. 12 jun. 12 aug. 12 okt. 12 des. 12 feb. 13 apr. 13 Platou Shipping index relative to key indices, rebased Platou Shipping (Rebased) OSEBX index (Rebased) Company Share Share price perf. Target price* 3m 6m 12m price Rec. AP Moller-Maersk 41760 - 14 % 0 % -8 % 50 000 NEUTRAL Awilco LNG 14.50 -20 % -29 % -53 % 4.0 BUY Baltic Trading 3.66 4 % 7 % - 19 % 6.0 BUY Capital Product Partners 8.55 7 % 0 % -1% 10.0 BUY Cost amare 15.80 3 % -2 % 7 % 16.0 NEUTRAL d'Amico International Shipping 0.44 3 % 36 % - 12 % 0.70 BUY D/S Norden 182.60 5 % 14 % 11% 39.0 BUY Danaos 3.84 7 % 24 % -5 % 3.5 NEUTRAL DHT Holdings 4.75 1% -25 % 431% 7.0 BUY Diana Cont ainerships 5.29 -24 % - 12 % - 19 % 6.0 NEUTRAL Diana Shipping 9.79 11% 39 % 17 % 15.0 BUY Dryships 1.88 - 15 % -22 % -48 % 3.5 BUY Euronav 3.24 -38 % -38 % -54 % 3.0 SELL Frontline 11.95 -43 % -46 % -71% 2.5 NEUTRAL Front line 2012 45.75 31% 69 % 85 % 10.0 BUY GasLog 12.69 1% -1% 6 % 14.0 NEUTRAL Genco Shipping 2.29 -43 % -41% -61% 1.0 SELL Golar LNG 35.61 - 10 % - 11% - 10 % 46.0 BUY Golden Ocean 5.86 9 % 29 % 9 % 1.5 BUY Hoegh LNG 49.00 -9 % 11% -7 % 12.0 NEUTRAL Navios Maritime Acquisition 3.38 27 % 22 % -4 % 5.0 BUY Nept une Orient Lines 1.16 - 16 % -1% - 19 % 1.2 NEUTRAL Nordic American Tankers 9.73 2 % -1% -37 % 10.0 NEUTRAL Norwegian Car Carriers 1.60 -24 % -25 % - 18 % 2.5 BUY Odfjell 27.80 -8 % 30 % -26 % 6.0 BUY Orient Overseas 48.55 - 16 % 2 % -21% 54.0 NEUTRAL Pacific Basin 4.62 -6 % 12 % 4 % 5.0 NEUTRAL Scorpio Tankers 8.49 10 % 39 % 15 % 13.0 BUY Ship Finance 17.44 -3 % 10 % 19 % 22.0 BUY StealthGas 11.69 24 % 63 % 89 % 12.0 NEUTRAL Stolt-Nielsen 116.50 -9 % 5 % 6 % 24.0 NEUTRAL Teekay Tankers 2.60 -26 % -31% -57 % 4.0 BUY Thoresen Thai Agencies 18.20 0 % 0 % 0 % 18.0 NEUTRAL Wilh. Wilhelmsen ASA 49.50 - 13 % 21% 25 % 10.0 NEUTRAL Wilh. Wilhelmsen Holding 165.00 - 12 % 20 % 6 % 37.0 BUY 12 % 12 % * The share price is in local currency, Target price is in USD except for d'Amico, Euronav, Maersk, Nept une Orient Lines, Norwegian Car Carriers, Orient Overseas, Pacif ic Basin and Thoresen Thai.
Transcript of Shipping 1Q13 Previews -...

Sector Report 15-Apr-13
RS PLATOU MARKETS AS Haakon VII’s gate 10 P.O. BOX 1474 Vika N-0116 Oslo, Norway
Telephone +47 22 01 63 00 Telefax +47 22 01 63 10
[email protected] www.platoumarkets.com
NO 942 274 238 MVA
Shipping 1Q13 Previews
Analyst: Frode Mørkedal Tel: +47 22 01 63 27 E-mail: [email protected] Analyst: Herman Hildan Tel: +47 22 01 63 53 E-mail: [email protected]
Shipping 1Q13 Previews Investing in shipping stocks today is a bet on a cyclical recovery offreight rates over the next two years. Given the sharply lower fleetgrowth in most segments during the forecast period, we believesuch a bet is attractive. The stocks that have done well the last months have been able to tie a story around acquisition of ships athistorically low asset values, and we expect the winners this yearwill remain growth-oriented companies. We continue to favour product tankers and dry bulk shipping where demand growth is high and therefore should be able to absorb the overcapacity of shipsfaster than in other segment. Closures of refinery capacity inmature markets means trading distances for product tankers willincrease, while China will be increasingly reliant on dry bulk imports because of constrained local production of iron ore and coal withnew low-cost supply from Australia and Brazil opening up arbitrageopportunities.
• 1Q13 market review:Product tankers enjoyed much better rates in 1Q, particularly for MRs that averaged $18,000 per day. We believethis reflects that US product exports are driving up trading distances,although seasonal refinery turnarounds helped as well. Dry bulkearnings remained at operating cost levels, although we have seen improved freight rates for the smaller Handysize, Supramax andPanamax vessels during March on the back of a strong South Americangrain season and rising port congestion. In the crude tanker sector,rates have struggled due to reduced OPEC production and declining crude imports to both USA and China. However, we expect the end of aheavy refinery maintenance period to lift Saudi crude exports incoming months, provided oil prices do not drop much further. Thecontainer shipping market saw flat box rates q/q but 16% higher y-y, which should help the container operators to avoid the dramatic lossesseen during 1Q12. However, box rates have underperformed lastyear’s level during April. In our view this is due to too high fleet growthand still struggling volumes and demand from Europe. LPG and LNGcarriers saw rates slip in the first quarter due to lower export volumeswhereas chemical tanker earnings were up 4% y-y.
• Recommendation changes:We have lifted our rating for Nordic American Tankers from Sell to Neutral following the recent equity raise, the alignment of management’s incentives with other shareholders,and growth clearly on the agenda with recent investments. We havealso lifted Diana Containerships from Sell to Neutral after the recent stock price decline. We have changed StealthGas from Buy to Neutralfollowing the strong share price performance.
• Valuation: Tanker stocks (both crude and clean) today trade 1.4x NAV (simple peer group average) which we find implies around 16% higher asset values compared with broker quotes. Dry bulk stocks on theother hand trade on average 1.03x NAV. Since we are at the trough ofthe shipping cycle (with ship values historically low when inflationadjusted), we find that today’s NAV is not very meaningful to base an investment on since it is fair to price in a recovery of asset values.Based on EV/EBITDA, the tanker peer group trades at 7x ‘15e while drybulk on average trades at 3.5x ‘15e (both sectors based on mid-cycle rates of $30,000/day for Capesize and $43,000/day for VLCC).
We reiterate our view from our Shipping Quarterly February 2013 that we believe both dry bulk and tankers will bottom out in 2013 and see a gradual recovery towards mid-cycle rates in 2015. Our top picks include d’Amico Shipping, Frontline 2012, Golden Ocean, Navios Acquisition, Scorpio Tankers and Ship Finance.
80
85
90
95
100
105
110
115
120
apr. 12 jun. 12 aug.12
okt. 12 des. 12 feb. 13 apr. 13
Platou Shipping index relative to key indices, rebased
Platou Shipping (Rebased) OSEBX index (Rebased)
Compa ny S ha r e S ha r e pr i c e pe r f . Ta r ge t
pr i c e * 3 m 6 m 12 m pr i c e R e c .
AP Moller-Maersk 41 760 -14 % 0 % -8 % 50 000 NEUTRAL
Awilco LNG 14.50 -20 % -29 % -53 % 4.0 BUY
Balt ic Trading 3.66 4 % 7 % -19 % 6.0 BUY
Capit al Product Part ners 8.55 7 % 0 % -1 % 10.0 BUY
Cost amare 15.80 3 % -2 % 7 % 16.0 NEUTRAL
d'Amico Int ernat ional Shipping 0.44 3 % 36 % -12 % 0.70 BUY
D/ S Norden 182.60 5 % 14 % 11 % 39.0 BUY
Danaos 3.84 7 % 24 % -5 % 3.5 NEUTRAL
DHT Holdings 4.75 1 % -25 % 431 % 7.0 BUY
Diana Cont ainerships 5.29 -24 % -12 % -19 % 6.0 NEUTRAL
Diana Shipping 9.79 11 % 39 % 17 % 15.0 BUY
Dryships 1.88 -15 % -22 % -48 % 3.5 BUY
Euronav 3.24 -38 % -38 % -54 % 3.0 SELL
Front line 11.95 -43 % -46 % -71 % 2.5 NEUTRAL
Front line 2012 45.75 31 % 69 % 85 % 10.0 BUY
GasLog 12.69 1 % -1 % 6 % 14.0 NEUTRAL
Genco Shipping 2.29 -43 % -41 % -61 % 1.0 SELL
Golar LNG 35.61 -10 % -11 % -10 % 46.0 BUY
Golden Ocean 5.86 9 % 29 % 9 % 1.5 BUY
Hoegh LNG 49.00 -9 % 11 % -7 % 12.0 NEUTRAL
Navios Marit ime Acquisit ion 3.38 27 % 22 % -4 % 5.0 BUY
Nept une Orient Lines 1.16 -16 % -1 % -19 % 1.2 NEUTRAL
Nordic American Tankers 9.73 2 % -1 % -37 % 10.0 NEUTRAL
Norwegian Car Carr iers 1.60 -24 % -25 % -18 % 2.5 BUY
Odf jell 27.80 -8 % 30 % -26 % 6.0 BUY
Orient Overseas 48.55 -16 % 2 % -21 % 54.0 NEUTRAL
Pacif ic Basin 4.62 -6 % 12 % 4 % 5.0 NEUTRAL
Scorpio Tankers 8.49 10 % 39 % 15 % 13.0 BUY
Ship Finance 17.44 -3 % 10 % 19 % 22.0 BUY
St ealt hGas 11.69 24 % 63 % 89 % 12.0 NEUTRAL
St olt -Nielsen 116.50 -9 % 5 % 6 % 24.0 NEUTRAL
Teekay Tankers 2.60 -26 % -31 % -57 % 4.0 BUY
Thoresen Thai Agencies 18.20 0 % 0 % 0 % 18.0 NEUTRAL
Wilh. Wilhelmsen ASA 49.50 -13 % 21 % 25 % 10.0 NEUTRAL
Wilh. Wilhelmsen Holding 165.00 -12 % 20 % 6 % 37.0 BUY12 % 12 %
* The share pr ice is in local currency, Target pr ice is in USD except f or d'Amico,
Euronav, Maersk, Nept une Orient Lines, Norwegian Car Carr iers,
Orient Overseas, Pacif ic Basin and Thoresen Thai.
2
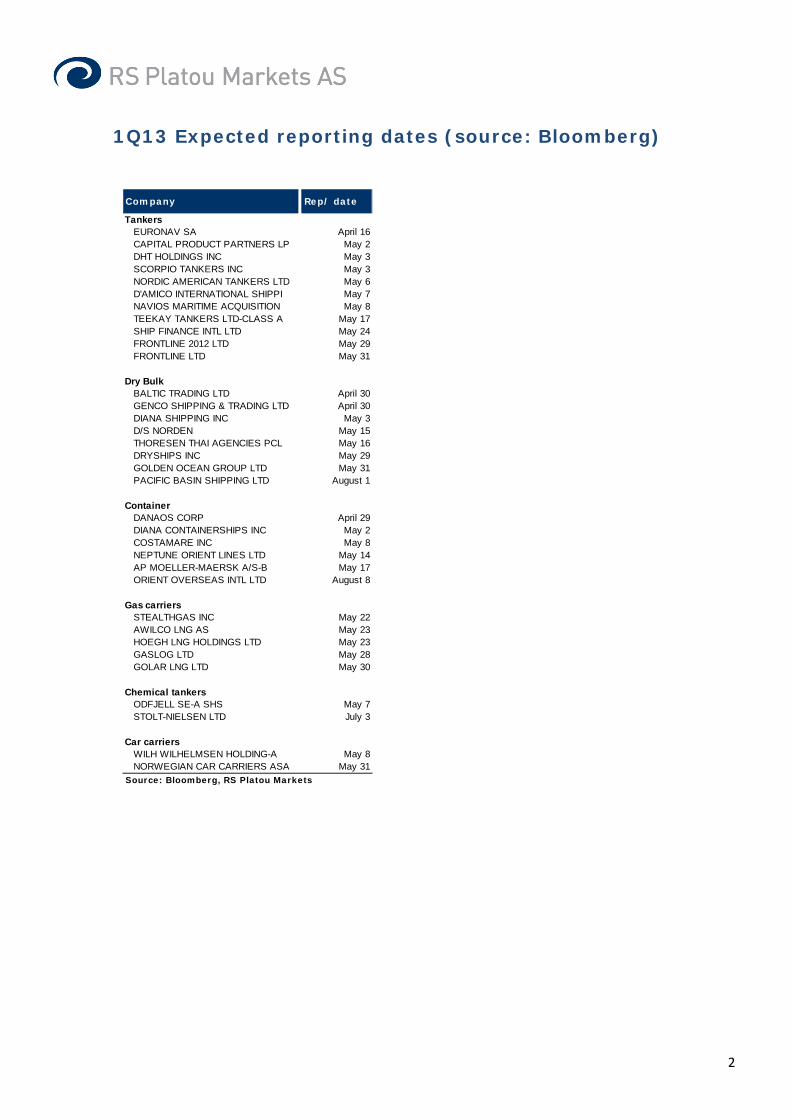
1Q13 Expected reporting dates (source: Bloomberg)
TankersEURONAV SA April 16CAPITAL PRODUCT PARTNERS LP May 2DHT HOLDINGS INC May 3SCORPIO TANKERS INC May 3NORDIC AMERICAN TANKERS LTD May 6D'AMICO INTERNATIONAL SHIPPI May 7NAVIOS MARITIME ACQUISITION May 8TEEKAY TANKERS LTD-CLASS A May 17SHIP FINANCE INTL LTD May 24FRONTLINE 2012 LTD May 29FRONTLINE LTD May 31
Dry BulkBALTIC TRADING LTD April 30GENCO SHIPPING & TRADING LTD April 30DIANA SHIPPING INC May 3D/S NORDEN May 15THORESEN THAI AGENCIES PCL May 16DRYSHIPS INC May 29GOLDEN OCEAN GROUP LTD May 31PACIFIC BASIN SHIPPING LTD August 1
ContainerDANAOS CORP April 29DIANA CONTAINERSHIPS INC May 2COSTAMARE INC May 8NEPTUNE ORIENT LINES LTD May 14AP MOELLER-MAERSK A/S-B May 17ORIENT OVERSEAS INTL LTD August 8
Gas carriersSTEALTHGAS INC May 22AWILCO LNG AS May 23HOEGH LNG HOLDINGS LTD May 23GASLOG LTD May 28GOLAR LNG LTD May 30
Chemical tankersODFJELL SE-A SHS May 7STOLT-NIELSEN LTD July 3
Car carriersWILH WILHELMSEN HOLDING-A May 8NORWEGIAN CAR CARRIERS ASA May 31
Source: Bloomberg, RS Platou Markets
Company Rep/ date

3
Crude tanker market graphs
Source: LoneStar, Baltic Exchange, RS Platou Markets
0
10 000
20 000
30 000
40 000
50 000
60 000
70 000
Jan Feb Mar Apr May Jun Jul Aug Sep Oct Nov Dec
USD
/day
VLCC spot earnings (USD/day)
Avg. 2008-2012 2012 2013
0
10 000
20 000
30 000
40 000
50 000
60 000
Jan Feb Mar Apr May Jun Jul Aug Sep Oct Nov DecU
SD/d
ay
Suezmax spot earnings (USD/day)
Avg. 2008-2012 2012 2013
0
5 000
10 000
15 000
20 000
25 000
30 000
35 000
Jan Feb Mar Apr May Jun Jul Aug Sep Oct Nov Dec
USD
/day
Aframax spot earnings (USD/day)
Avg. 2008-2012 2012 2013
25
29
13
1617
22
19
1211
131311
1213
11
0
5
10
15
20
25
30
35
Q1'12 Q2'12 Q3'12 Q4'12 Q1'13
'000
USD
/day
Crude tanker earnings, quarterly
VLCC Suezmax Aframax

4
Product tanker market graphs
Source: Baltic Exchange, RS Platou Markets
0
5 000
10 000
15 000
20 000
25 000
30 000
35 000
Jan Feb Mar Apr May Jun Jul Aug Sep Oct Nov Dec
USD
/day
LR2 spot earnings (USD/day)
Avg. 2008-2012 2012 2013
0
5 000
10 000
15 000
20 000
25 000
30 000
Jan Feb Mar Apr May Jun Jul Aug Sep Oct Nov DecU
SD/d
ay
LR1 spot earnings (USD/day)
Avg. 2008-2012 2012 2013
5 000
7 000
9 000
11 000
13 000
15 000
17 000
19 000
21 000
23 000
25 000
Jan Feb Mar Apr May Jun Jul Aug Sep Oct Nov Dec
USD
/day
MR spot earnings (USD/day)
2011 2012 2013e
1211
14
12
14
13
14
12
1415
14
12 11
14
18
0
2
4
6
8
10
12
14
16
18
20
Q1'12 Q2'12 Q3'12 Q4'12 Q1'13
'000
USD
/day
Product tanker earnings, quarterly
LR2 LR1 MR
5
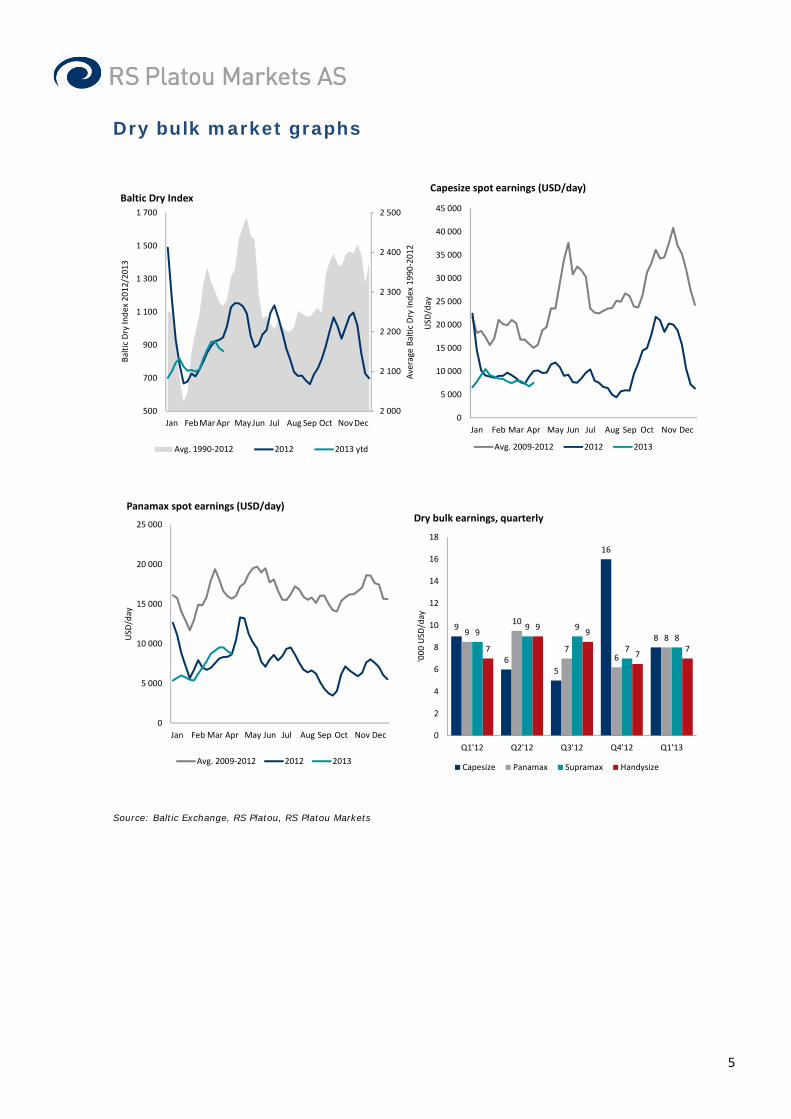
Dry bulk market graphs
Source: Baltic Exchange, RS Platou, RS Platou Markets
2 000
2 100
2 200
2 300
2 400
2 500
500
700
900
1 100
1 300
1 500
1 700
Jan FebMar Apr May Jun Jul Aug Sep Oct Nov Dec
Ave
rage
Bal
tic D
ry In
dex
1990
-201
2
Balti
c D
ry In
dex
2012
/201
3
Baltic Dry Index
Avg. 1990-2012 2012 2013 ytd
0
5 000
10 000
15 000
20 000
25 000
30 000
35 000
40 000
45 000
Jan Feb Mar Apr May Jun Jul Aug Sep Oct Nov DecU
SD/d
ay
Capesize spot earnings (USD/day)
Avg. 2009-2012 2012 2013
0
5 000
10 000
15 000
20 000
25 000
Jan Feb Mar Apr May Jun Jul Aug Sep Oct Nov Dec
USD
/day
Panamax spot earnings (USD/day)
Avg. 2009-2012 2012 2013
9
65
16
89
10
76
89
9 9
78
7
99
77
0
2
4
6
8
10
12
14
16
18
Q1'12 Q2'12 Q3'12 Q4'12 Q1'13
'000
USD
/day
Dry bulk earnings, quarterly
Capesize Panamax Supramax Handysize

6
Container market graphs
Source: Shanghai Shipping Exchange, RS Platou Markets
500
700
900
1 100
1 300
1 500
1 700
1 900
2 100
Sep07
Feb08
Jul08
Dec08
May09
Oct09
Mar10
Aug10
Jan11
Jun11
Nov11
Apr12
Sep12
Feb13
USD
/TEU
Box rates per major trade lanes
Intra-Asia CCFI Asia-Europe CCFI Transpacific CCFI
900
950
1 000
1 050
1 100
1 150
700
800
900
1 000
1 100
1 200
1 300
1 400
Jan Feb Mar Apr May Jun Jul Aug Sep Oct Nov Dec
Ave
rage
200
8-20
12 ($
/TEU
)
2012
/201
3 ($
/TEU
)
China Containerized Freight Index ($/TEU)
Avg. 2008-2012 2012 2013
400
600
800
1 000
1 200
1 400
1 600
1 800
2 000
Jan Feb Mar Apr May Jun Jul Aug Sep Oct Nov Dec
USD
/TEU
Asia-Europe rates (spot)
2011 2012 2013
1 000
1 200
1 400
1 600
1 800
2 000
2 200
2 400
2 600
2 800
3 000
Jan Feb Mar Apr May Jun Jul Aug Sep Oct Nov Dec
USD
/FEU
Asia-USWC rates (spot)
Avg. 2010-2012 2012 2013
7
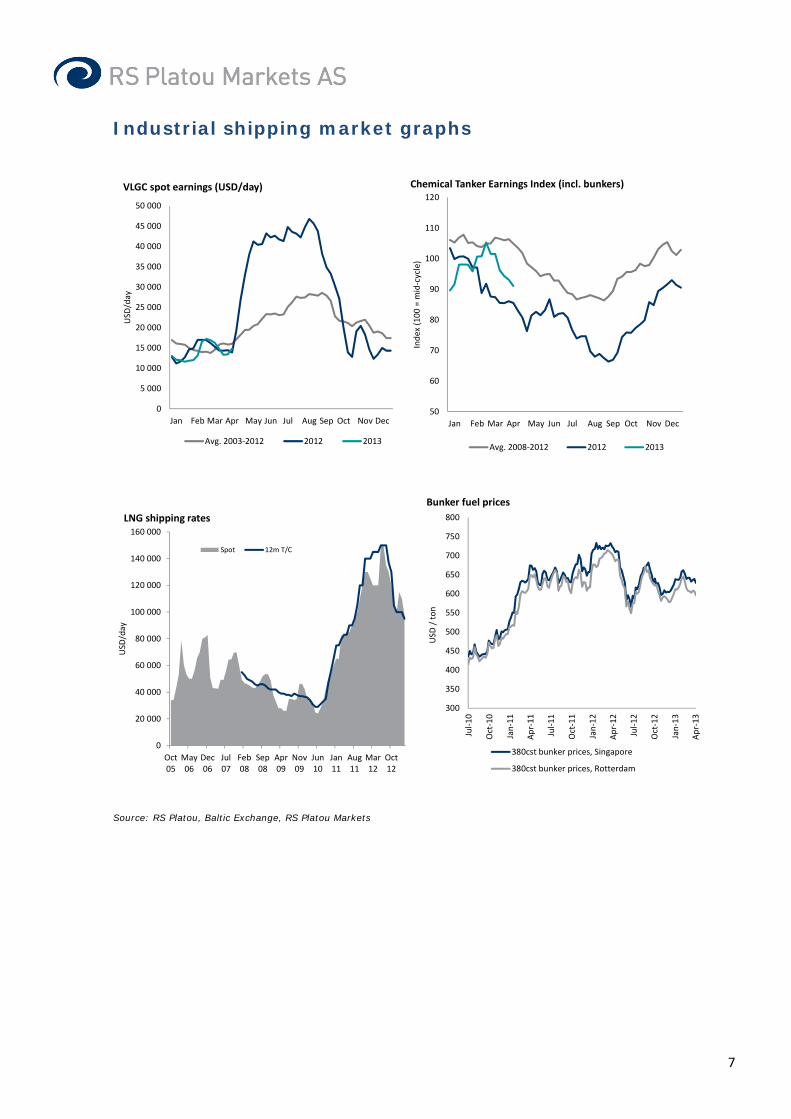
Industrial shipping market graphs
Source: RS Platou, Baltic Exchange, RS Platou Markets
0
5 000
10 000
15 000
20 000
25 000
30 000
35 000
40 000
45 000
50 000
Jan Feb Mar Apr May Jun Jul Aug Sep Oct Nov Dec
USD
/day
VLGC spot earnings (USD/day)
Avg. 2003-2012 2012 2013
50
60
70
80
90
100
110
120
Jan Feb Mar Apr May Jun Jul Aug Sep Oct Nov DecIn
dex
(100
= m
id-c
ycle
)
Chemical Tanker Earnings Index (incl. bunkers)
Avg. 2008-2012 2012 2013
0
20 000
40 000
60 000
80 000
100 000
120 000
140 000
160 000
Oct05
May06
Dec06
Jul07
Feb08
Sep08
Apr09
Nov09
Jun10
Jan11
Aug11
Mar12
Oct12
USD
/day
LNG shipping rates
Spot 12m T/C
300
350
400
450
500
550
600
650
700
750
800
Jul-1
0
Oct
-10
Jan-
11
Apr
-11
Jul-1
1
Oct
-11
Jan-
12
Apr
-12
Jul-1
2
Oct
-12
Jan-
13
Apr
-13
USD
/ to
n
Bunker fuel prices
380cst bunker prices, Singapore
380cst bunker prices, Rotterdam

8
RS Platou Markets peer group
TP Last M.Cap EV NAV P/ EV/ Yield %Rating USD* local USDm USDm USD* NAV ASSETS 2013 2014 2015 2013
TankersCapital Product Partners Buy 10.0 8.6 794 1 195 4.1 2.10 1.53 10.8 10.3 7.9 10.9d'Amico International Shipping Buy 0.7 0.4 158 353 0.5 0.80 0.90 11.3 9.0 3.7 0.0DHT Holdings Buy 7.0 4.8 73 214 7.7 0.62 0.83 12.2 6.7 2.1 1.7Euronav Sell 3.0 3.2 212 1 401 1.8 2.39 1.10 9.3 7.3 3.0 0.0Frontline Neutral 2.5 12.0 162 1 372 -3.1 nmf 1.17 29.0 21.3 5.7 0.0Frontline 2012 Buy 10.0 45.8 1 714 2 157 4.1 1.93 1.62 nmf 24.0 9.4 0.0Navios Maritime Acquisition Buy 5.0 3.4 265 1 195 2.4 1.42 1.07 10.0 8.1 5.3 5.9Nordic American Tankers Neutral 10.0 9.7 628 823 7.5 1.30 1.22 24.7 10.1 4.1 6.6Scorpio Tankers Buy 13.0 8.5 1 049 1 104 7.0 1.21 1.19 38.9 19.9 6.1 0.0Ship Finance Buy 22.0 17.4 1 486 4 476 14.9 1.17 1.05 8.5 7.6 8.0 7.0Teekay Tankers Buy 4.0 2.6 217 927 1.8 1.47 1.08 10.7 8.8 4.2 4.6Weighted average 1.51 1.29 13.6 14.6 7.1 3.8
Dry bulkBaltic Trading Buy 6.0 3.7 82 180 4.9 0.75 0.87 nmf 10.2 5.0 0.0Diana Shipping Buy 15.0 9.8 792 806 8.0 1.22 1.21 16.2 11.8 4.6 0.0Dryships Buy 3.5 1.9 799 4 465 2.8 0.67 0.92 10.2 4.7 3.4 0.0D/S Norden Buy 39.0 182.6 1 319 951 39.1 0.82 0.77 16.2 7.9 3.2 2.3Genco Shipping Sell 1.0 2.3 101 1 556 -8.2 nmf 1.43 nmf 11.4 5.8 0.0Golden Ocean Buy 1.5 5.9 457 862 1.0 1.05 1.03 7.0 5.3 2.7 0.0Pacific Basin Neutral 5.0 4.4 1 104 1 286 3.8 1.18 1.15 15.0 8.9 4.3 0.0Thoresen Thai Neutral 18.0 18.2 621 952 12.7 1.44 1.25 7.7 3.0 1.4 0.0Weighted average 1.01 1.03 12.7 7.5 3.5 0.6
ContainerAP Moller-Maersk Neutral 50 000 41 760 31 949 48 756 70 300 0.59 0.69 3.9 3.5 3.0 3.1Costamare Neutral 16.0 15.8 1 182 2 429 10.9 1.45 1.18 10.4 8.1 7.5 7.0Danaos Neutral 3.5 3.8 421 3 764 2.3 1.67 1.05 8.4 7.8 6.7 0.0Diana Containerships Neutral 6.0 5.3 170 230 5.7 0.92 0.94 17.9 20.2 11.7 11.3Neptune Orient Lines Neutral 1.2 1.1 2 392 5 471 1.1 1.08 1.03 18.5 7.2 6.0 0.0Orient Overseas Neutral 54.0 48.5 3 906 5 078 69.8 0.69 0.75 8.9 4.7 3.5 1.9Weighted average (excl. Maersk) 0.98 0.91 12.1 6.4 5.2 2.2
Gas carriersAwilco LNG Buy 4.0 14.5 171 169 4.1 0.62 0.62 12.0 5.9 5.9 0.0Hoegh LNG Neutral 12.0 49.0 597 1 102 11.0 0.78 0.87 25.5 16.7 7.5 0.0GasLog Neutral 14.0 12.7 797 820 11.2 1.14 1.13 17.0 11.9 9.5 4.1Golar LNG Buy 46.0 35.6 2 860 3 959 48.3 0.74 0.79 12.2 10.1 7.8 4.0StealthGas Neutral 12.0 11.7 240 535 8.5 1.37 1.14 7.0 5.8 4.3 0.0Weighted average 0.84 0.87 14.5 10.9 7.8 3.2
Chemical tankersOdfjell Buy 6.0 27.8 416 1 593 7.0 0.69 0.90 10.5 7.3 6.3 0.0Stolt-Nielsen Neutral 24.0 116.5 1 178 2 769 22.8 0.89 0.95 8.7 7.0 6.4 4.9Weighted average 0.84 0.94 9.2 7.1 6.4 3.6
Car carriersNorwegian Car Carriers Buy 2.5 1.6 68 283 1.9 0.84 0.96 7.1 6.6 5.6 0.0Wilh. Wilhelmsen ASA Neutral 10.0 49.5 1 897 3 397 10.3 0.84 0.90 7.1 5.6 5.0 4.2W.Wilhelmsen Holding Buy 37.0 165.0 1 337 2 994 42.9 0.67 0.82 4.9 3.8 3.2 3.5Weighted average 0.77 0.87 6.2 4.9 4.3 3.8
* NAV and TP in local currencies for Maersk, d'Amico, Euronav, Neptune Orient Lines, Norwegian Car Carriers, Orient Overseas, Pacific Basin and Thoresen Thai.
Source: RS Platou Markets estimates
EV/EBITDA

9
Analyst: Frode Mørkedal Tel: +47 22 01 63 27 E-mail: [email protected] Next report date: 17.05.2013 Disclosure:
Analyst: Herman Hildan Tel: +47 22 01 63 53 E-mail: [email protected] Analyst: Alex Gheorghe Tel: +47 22 01 63 47 E-mail: [email protected]
Weak container results – focus on Oil reserves update AP Moller-Maersk will report 1Q13 results on May 17.We expect focus to be on updated resource estimatesfor Maersk Oil and as always, the near term outlook forthe struggling container market. We remain NEUTRAL.
• 1Q13 expectations: We look for EBITDA of DKK 16bndown from DKK 18bn in 4Q12 due to lower results fromMaersk Line. Compared to preliminary Bloombergconsensus we are DKK 2bn lower on EBITDA level.
• Maersk Line: The container market in 1Q13 was muchbetter than 1Q12 when Maersk Line posted a negative DKK3.4bn net loss. Still, we look for a slightly negative resultof DKK -0.13bn. We factor in 6% lower volumes y-y but6% higher rates y-y (but flat rates vs. 4Q12). Comparedwith 4Q12 the result is negatively impacted by higherbunker costs.
• Maersk Oil: Updated reserves figures along withresources, perhaps with more granularity than previouslydisclosed, will be the focus with 1Q13 results. Whileproduction is expected to be weak at 232 mbbl/d, weforecast a rebound settling by 3Q13. More importantly, wewill be watching for changes in pace and costs indevelopments going forward.
Our 2013e EPS is maintained at DKK 4,380 for now. However, given the weaker than expected container market we see downside risk on our estimates should the May 1 container surcharges not be successful. We therefore maintain our Neutral recommendation.
AP Moller-MaerskSector: Marine
Recommendation: NEUTRAL (unchanged)
Target price (DKK): 50000 (unchanged)
Company descriptionDanish conglomerate with diversification across a broad range of businesses including world-leading positions in container shipping, tankers, terminals, tugs and niche offshore supply services. Comprehensive oil & gas activities. Listed at OMX Copenhagen.
35 000
40 000
45 000
50 000
55 000
60 000
apr. 12 jun. 12 aug. 12 okt. 12 des. 12 feb. 13
Share price (DKK) in AP Moller-Maersk relative to key indices
AP Moller-Maersk
OMX Copenhagen 20 (Rebased)
OSE Transportation (Rebased)
Shareholders Shares VotesA.P. Møller and Hustru 51.1 % 64.1 %Franklin Resources INC 4.2 % 6.5 %MC-Kinney Moeller Maersk 3.7 % 5.9 %
Free Float 41.0 % 41.0 %
Changes in estimates (DKKm)2013E 2014E
New Old Chg. New Old Chg.Oper. revenue 325 738 325 738 0% 335 302 335 302 0%EBITDA, adj. 70 821 70 821 0% 76 581 76 581 0%EBIT, adj. 42 853 42 853 0% 46 228 46 228 0%Net income, adj. 19 132 19 132 0% 25 181 25 181 0%EPS, adj. (DKK) 4 383.1 4 383.1 0% 5 768.8 5 768.8 0%
Company data (2013E)Share price (DKK) 41 760.00No. of shares (m) 4.4Market cap. (DKKm) 182 282Net debt YE (DKKm) 95 266Enterprise value (DKKm) 277 548
Description of adjustments: Sale of assets, agio/disagio and gain/losses on financial instruments.
Key figures 2009 2010 2011 2012 2013E 2014E 2015ERevenue (DKKm) 261 532 315 831 324 172 344 782 325 738 335 302 348 076EBITDA (DKKm) 50 124 93 010 83 254 76 593 70 821 76 581 81 780EBITDA, adj. (DKKm) 49 262 89 218 78 506 72 910 70 821 76 581 81 780EBIT, adj. (DKKm) 21 854 59 474 51 251 41 937 42 853 46 228 48 234Pre-tax profit, adj. (DKKm) 17 543 58 705 53 174 43 264 41 365 45 540 48 546Net income, adj. (DKKm) -9 034 22 901 13 085 13 625 19 132 25 181 29 129EPS, adj. (DKK) -2 152.65 5 246.53 2 997.63 3 121.54 4 383.06 5 768.84 6 673.37OCFPS (DKK) 5 980.4 13 052.1 8 908.6 10 126.5 10 771.9 12 444.9 14 001.2FCFPS (DKK) -3 391.7 7 077.7 -3 063.7 1 737.2 1 343.6 2 831.3 8 085.8BVPS (DKK) 37 855.5 44 206.8 47 637.1 50 984.0 54 566.6 59 434.9 65 107.9Net asset value (NAV) (DKK) 0.0 0.0 70 100.0 70 100.0 0.0 0.0 0.0Dividend (DKK) 325.00 1 000.00 1 000.00 1 200.00 1 300.00 1 400.00 1 400.00EV/EBITDA, adj. (x) 5.2 3.3 3.3 3.9 3.9 3.5 3.0EV/EBIT, adj. (x) 11.6 5.0 5.1 6.7 6.5 5.9 5.0P/E, adj. (x) n.m. 9.6 12.6 13.6 9.5 7.2 6.3P/OCF (x) 6.1 3.9 4.3 4.2 3.9 3.4 3.0EV/FCF (x) n.m. 9.6 n.m. 37.2 47.3 21.9 6.8P/Book (x) 1.0 1.1 0.8 0.8 0.8 0.7 0.6P/NAV (x) n.m. n.m. 0.5 0.6 n.m. n.m. n.m.Dividend yield (%) 0.9 2.0 2.6 2.8 3.1 3.4 3.4
Key Assumptions 2009 2010 2011 2012 2013E 2014E 2015EOil price (Brent USD/bbl) 62 80 111 113 107 100 100Asia-Europe spot rates $/TEU 1 720 883 1 362 1 300 1 365 1 365Maersk Line achieved box rates $/FEU 2 370 3 062 2 833 2 881 2 842 2 871 2 871
Result Preview 15-Apr-13

10
1Q13 Result preview
AP Moller-Maersk(DKK bn) 1Q12 2Q12 3Q12 4Q12 1Q13E
Consensus avg.
Platou vs. Cons.
TCE Income 81 89 87 85 80 82 (2)Operating expenses (67) (68) (67) (67) (64)EBITDA excl. one-offs 14 21 20 18 16 18 (2)Gain/loss sale of assets 2 0 1 0 -Depreciation & amortization (7) (7) (9) (8) (7)EBIT 9 14 12 11 9 11 (2)Associated companies 0 0 0 0 0Net interest (1) (1) (1) (1) (1)Other financial income - - - - -Pretax profit 8 13 12 10 9 10 (2)Taxes (2) (7) (6) (4) (5)Minorities (1) (0) (0) (0) (0)Net profit 6 5 5 5 3 4 (1)Net profit, adjusted (1) 5 5 6 3 4
EPS 1 399 1 197 1 172 1 158 718 849EPS, adjusted (171) 1 124 1 242 1 271 718 849 (131)
CurrencyUSD/DKK 5.67 5.79 5.95 5.75 5.65
Net profit per segmentMaersk Line (3.4) 1.3 2.9 1.9 (0.1)Maersk Oil 7.3 2.8 1.5 2.5 1.9APM Terminals 1.3 0.9 1.0 1.0 0.8Maersk Drilling 0.7 0.6 0.5 0.3 0.7Maersk Supply Service 0.2 0.2 0.3 0.1 0.3Maersk Tankers (0.2) (0.0) (1.6) 0.0 (0.0)Damco 0.0 0.2 0.1 0.0 0.1SVITZER 0.2 0.2 0.2 (0.5) 0.1Maersk FPSOs and Maersk LNG 0.6 0.2 0.9 0.2 0.0Dansk Supermarked 0.3 0.3 0.2 0.5 0.4Other industrial 0.5 0.5 0.2 0.3 0.2Other/consolidation eliminations (1.0) (1.4) (0.6) (0.8) (0.8)Total net profit (before minority) 6.7 5.6 5.6 5.5 3.6
Key value drivers Transported volumes (mill FEU) 2.2 2.1 2.0 2.1 Average container freight rate (USD per FEU) 3 152 3 022 2 842 2 816 Entitlement oil production (bpd ´000) 288 240 242 232 Oil price (USD/bbl) 104 108 113 104 APM Terminals equity throughput (mill TEU) 9.1 9.0 8.8 9.1
Source: Company, Bloomberg, RS Platou Markets

11
Profit and loss (DKKm) 2009 2010 2011 2012 2013E 2014E 2015ETotal revenue 261 532 315 831 324 172 344 782 325 738 335 302 348 076Voyage expenses & commissions 0 0 0 0 0 0 0Time-charter equivalent 261 532 315 831 324 172 344 782 325 738 335 302 348 076
Operating expenses -212 270 -226 613 -245 666 -271 872 -254 917 -258 721 -266 296
EBITDA, adj. 49 262 89 218 78 506 72 910 70 821 76 581 81 780Gain/loss sale of assets 862 3 792 4 748 3 683 0 0 0EBITDA 50 124 93 010 83 254 76 593 70 821 76 581 81 780Depreciation -27 408 -29 744 -27 255 -30 973 -27 968 -30 353 -33 546Amortization/Write down -3 784 -4 078 -1 634 -2 369 0 0 0EBIT 18 932 59 188 54 365 43 251 42 853 46 228 48 234EBIT, adj. 21 854 59 474 51 251 41 937 42 853 46 228 48 234
Associated companies 360 461 651 1 286 2 112 2 812 3 112Net interest -5 533 -5 022 -3 476 -3 642 -3 600 -3 500 -2 800Gains/losses on securities or financial instruments 270 -241 -1 088 -734 0 0 0Other financial ItemsPre-tax profit 14 029 54 386 50 452 40 161 41 365 45 540 48 546Tax -20 393 -26 174 -32 447 -19 138 -20 489 -18 615 -17 673Minorities -1 538 -1 760 -2 894 -1 722 -1 744 -1 744 -1 744Result from discontinued operations/ Other 0 3 78 16 0 0 0Net income -7 902 26 455 15 189 19 317 19 132 25 181 29 129
Adjustments after tax -1 132 -3 554 -2 104 -596 0 0 0Adjusted net income -9 034 22 901 13 085 13 625 19 132 25 181 29 129
EPS (DKK) -1 882.91 6 060.74 3 479.74 4 425.45 4 383.06 5 768.84 6 673.37EPS, adj. (DKK) -2 152.65 5 246.53 2 997.63 3 121.54 4 383.06 5 768.84 6 673.37
Balance sheet (DKKm) 2009 2010 2011 2012 2013E 2014E 2015ELong-term interest bearing assets 2 966 711 87 0 0 0 0Fixed assets 244 995 249 007 265 180 264 425 277 611 289 222 281 496Other long-term assets 46 292 50 347 71 390 80 386 82 498 85 310 88 422Long-term assets 294 253 300 065 336 657 344 811 360 109 374 531 369 918
Other current assets 40 233 48 776 52 839 60 709 57 356 59 040 61 289Cash and liquid assets 10 713 25 882 15 247 15 171 26 631 23 119 9 324Current assets 50 946 74 658 68 086 75 880 83 987 82 158 70 613
Total assets 345 199 374 723 404 743 420 691 444 096 456 690 440 531
Equity 148 779 181 556 194 157 208 800 222 694 242 200 265 219
Minorities 10 089 11 406 13 778 13 744 15 488 17 232 18 976
Long term interest bearing debt 98 158 88 421 96 884 98 112 108 945 98 749 55 771Other long-term liabilities 25 557 24 591 29 888 31 568 31 568 31 568 31 568Long term liabilities 123 715 113 012 126 772 129 680 140 513 130 317 87 339
Short term interest bearing debt 16 300 14 610 14 571 12 952 12 952 12 952 12 952Other short term liabilities 46 316 54 139 55 465 55 515 52 449 53 989 56 045Current liabilities 62 616 68 749 70 036 68 467 65 401 66 941 68 997
Total liabilities and equity 345 199 374 723 404 743 420 691 444 096 456 690 440 531
Working capital -6 083 -5 363 -2 626 5 194 4 907 5 051 5 244Net debt 100 779 76 438 96 121 95 893 95 266 88 582 59 399
Cash flow (DKKm) 2009 2010 2011 2012 2013E 2014E 2015EPre-tax profit 14 029 54 386 50 452 40 161 41 365 45 540 48 546- Associated companies -360 -461 -651 -1 286 -2 112 -2 812 -3 112+ Depreciation and amortization 31 192 33 822 28 889 33 342 27 968 30 353 33 546- Payable tax -20 393 -26 174 -32 447 -19 138 -20 489 -18 615 -17 673+/- Other operating items 1 815 -3 881 -4 620 -1 057 0 0 0Cash flow from operations 26 283 57 692 41 623 52 022 46 732 54 466 61 307
Change in working capital -1 185 -720 -2 737 -7 820 287 -144 -192Operating cash flow 25 098 56 972 38 886 44 202 47 019 54 322 61 115
Maintenance capex 0 0 0 0 0 0 0Growth capex -43 822 -30 958 -42 058 -47 108 -43 810 -41 963 -25 821Acquisition capex 2 267 1 533 -12 456 368 0 0 0Sale of assets 2 223 3 347 2 255 10 121 2 656 0 0Cash flow from investments -39 332 -26 078 -52 259 -36 619 -41 154 -41 963 -25 821
Free cash flow -14 234 30 894 -13 373 7 583 5 865 12 358 35 294
Dividend paid -3 082 -2 104 -4 947 -5 475 -5 238 -5 674 -6 111Share buy back 0 0 61 -1 514 0 0 0Equity increase 8 177 153 0 0 0 0 0Cash flow from financing 5 095 -1 951 -4 886 -6 989 -5 238 -5 674 -6 111
Other items -8 883 -4 602 -1 424 -366 0 0 0
Change in net debt 18 022 -24 341 19 683 -228 -627 -6 684 -29 183

12
Analyst: Frode Mørkedal Tel: +47 22 01 63 27 E-mail: [email protected] Next report date: 30.05.2013 Disclosure:
Analyst: Herman Hildan Tel: +47 22 01 63 53 E-mail: [email protected]
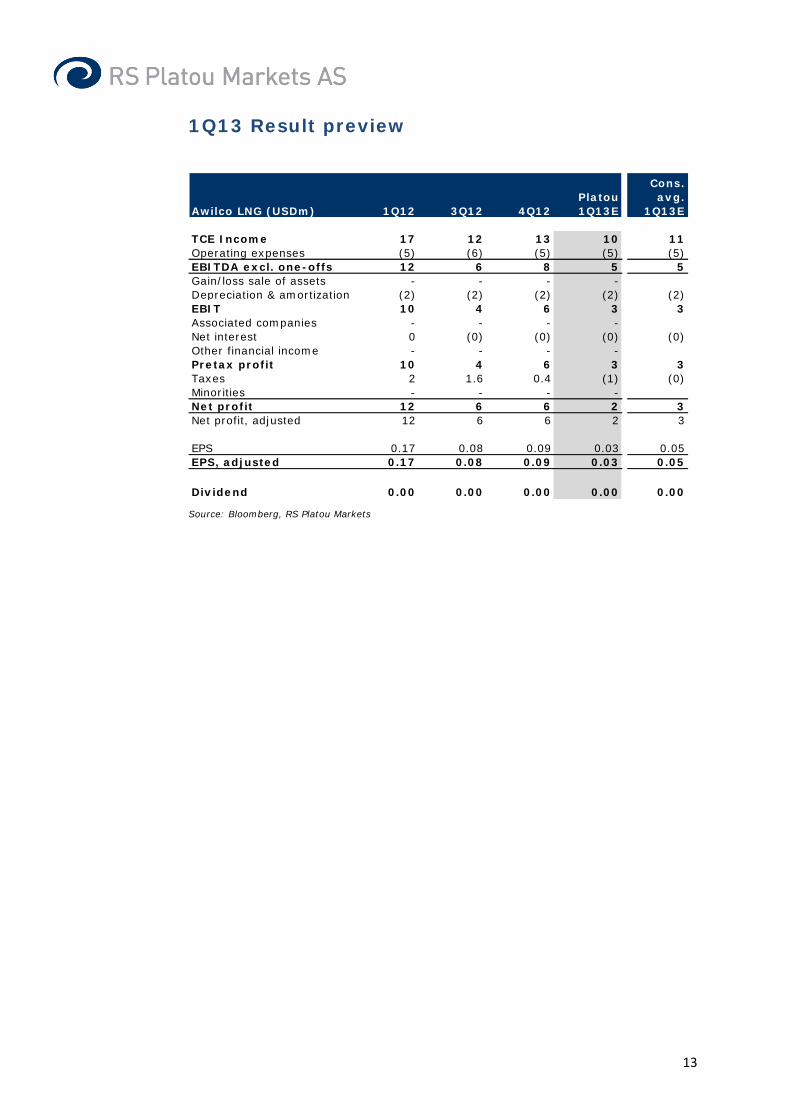
Waiting for contracts and financing Awilco LNG will report their 1Q13 figures on May 5th. Weare in line with consensus on estimates and expect mainfocus to be the newbuilds with 2H13 delivery.
• 1Q13 figures: We expect revenue of USD 10m andEBITDA of USD 5m, in line with consensus at USD 11mand USD 5m respectively. Only WillGas is on long termcontract while WilEnergy is reported by brokers to havefixed two spot voyages, to Brunei and West Australia. Weexpect $40,000/day, hence, lower earnings for theCompany q/q. WilPower is idle and will likely remain idle aswe enter into the seasonally slow period over the summer.Consequently 2013 estimates are lowered as we model inWilPower being idle going forward.
• Newbuildings and financing: Management has guidednewbuild contracts 3-6 months prior to vessel delivery,consequently we expect the first contract prior to summer.Duration and rate level will determine financing, but 70%debt financing should be achievable either fully throughbank debt or in combination with bonds.
• Valuation: With at least $80,000/day on the newbuildsone could argue for USD 225m value of the newbuilds.With scrap value of USD 20m on the remaining 3 vesselsand USD 36m contract value for WilGas we arrive at USD4/share after USD 280m of capex. Furthermore, the 2xnewbuilds alone should be able to provide USD 15m ofdividend capacity, assuming 15 year debt profile.
We lower target to USD 4/sh, but reiterate BUY.
Awilco LNGSector: Marine
Recommendation: BUY (unchanged)
Target price (USD): 4.0 (5.0)
Company descriptionOwns 3 LNG carriers built in 1983-84 and two newbuilds for 2013 delivery marketed for spot and term chartering in the LNG shipping market.
10
15
20
25
30
35
40
45
apr. 12 jun. 12 aug.12
okt. 12 des. 12 feb. 13 apr. 13
Share price (NOK) in Awilco LNG relative to key indices
Awilco LNG
OSEBX index (Rebased)
OSE Transportation (Rebased)
Shareholders Shares VotesAwilco AS 33.7 % 33.7 %Home Capital AS 7.9 % 7.9 %Astrup Fearnley AS 7.6 % 7.6 %Uthalden A/S 7.6 % 7.6 %Free Float 66.3 % 66.3 %
Changes in estimates (USDm)2013E 2014E
New Old Chg. New Old Chg.Oper. revenue 57 76 -25% 94 117 -20%EBITDA, adj. 35 51 -30% 64 82 -23%EBIT, adj. 26 41 -37% 47 65 -29%Net income, adj. 19 34 -45% 36 54 -34%EPS, adj. (USD) 0.3 0.5 -45% 0.5 0.8 -34%
Company data (2013E)Share price (NOK) 15.00No. of shares (m) 67.8Market cap. (USDm) 178Net debt YE (USDm) 254Enterprise value (USDm) 431
Description of adjustments: Sale of assets, agio/disagio and gain/losses on financial instruments
Key figures 2011 2012 2013E 2014E 2015ERevenue (USDm) 31 57 57 94 88EBITDA (USDm) 5 29 35 64 57EBITDA, adj. (USDm) 5 29 35 64 57EBIT, adj. (USDm) 1 22 26 47 38Pre-tax profit, adj. (USDm) 2 21 23 40 32Net income, adj. (USDm) -1 22 19 36 28EPS, adj. (USD) -0.02 0.32 0.28 0.53 0.41OCFPS (USD) 0.1 0.4 0.4 0.8 0.7FCFPS (USD) -2.5 -0.4 -3.8 0.7 0.6BVPS (USD) 2.5 2.9 3.1 3.6 4.1Net asset value (NAV) (USD) 4.1 4.1 0.0 0.0 0.0Dividend (USD) 0.00 0.00 0.00 0.00 0.00EV/EBITDA, adj. (x) 56.2 8.1 12.2 6.0 6.0EV/EBIT, adj. (x) n.m. 10.9 16.8 8.2 9.1P/E, adj. (x) n.m. 10.9 9.5 5.0 6.3P/OCF (x) 48.8 8.4 6.7 3.3 3.8EV/FCF (x) n.m. n.m. n.m. 8.2 8.5P/Book (x) 1.9 1.2 0.8 0.7 0.6P/NAV (x) 1.2 0.9 n.m. n.m. n.m.Dividend yield (%) 0.0 0.0 0.0 0.0 0.0
Key Assumptions 2011 2012 2013E 2014E 2015EShort term T/C, USD/Day 95 500 125 000 82 000 85 000Short term T/C, USD/Day old tonnage 51 000 36 000 40 000 40 000
Result Preview 15-Apr-13
13
1Q13 Result preview
Source: Bloomberg, RS Platou Markets
Awilco LNG (USDm) 1Q12 3Q12 4Q12Platou 1Q13E
Cons. avg.
1Q13E
TCE Income 17 12 13 10 11Operating expenses (5) (6) (5) (5) (5)EBITDA excl. one-offs 12 6 8 5 5Gain/loss sale of assets - - - -Depreciation & amortization (2) (2) (2) (2) (2)EBIT 10 4 6 3 3Associated companies - - - -Net interest 0 (0) (0) (0) (0)Other financial income - - - -Pretax profit 10 4 6 3 3Taxes 2 1.6 0.4 (1) (0)Minorities - - - -Net profit 12 6 6 2 3Net profit, adjusted 12 6 6 2 3
EPS 0.17 0.08 0.09 0.03 0.05EPS, adjusted 0.17 0.08 0.09 0.03 0.05
Dividend 0.00 0.00 0.00 0.00 0.00

14
Profit and loss (USDm) 2011 2012 2013E 2014E 2015ETotal revenue 31 57 57 94 88Voyage expenses & commissions -10 -4 -2 -2 -2Time-charter equivalent 21 52 55 92 86
Operating expenses -15 -23 -20 -28 -28
EBITDA, adj. 5 29 35 64 57Gain/loss sale of assets 0 0 0 0 0EBITDA 5 29 35 64 57Depreciation -4 -8 -10 -17 -19Amortization/Write down 0 -1 0 0 0EBIT 1 20 26 47 38EBIT, adj. 1 22 26 47 38
Associated companies 0 0 0 0 0Net interest 0 0 -3 -7 -6Gains/losses on securities or financial instruments 0 0 0 0 0Other financial Items -1Pre-tax profit 0 20 23 40 32Tax -3 2 -4 -4 -4Minorities 0 0 0 0 0Result from discontinued operations/ Other 0 0 0 0 0Net income -2 22 19 36 28
Adjustments after tax 1 0 0 0 0Adjusted net income -1 22 19 36 28
EPS (USD) -0.04 0.32 0.28 0.53 0.41EPS, adj. (USD) -0.02 0.32 0.28 0.53 0.41
Balance sheet (USDm) 2011 2012 2013E 2014E 2015ELong-term interest bearing assets 0 0 0 0 0Fixed assets 149 196 467 456 444Other long-term assets 0 0 0 0Long-term assets 149 196 467 457 444
Other current assets 5 5 4 7 6Cash and liquid assets 28 3 26 57 81Current assets 33 7 30 64 88
Total assets 182 203 497 521 532
Equity 172 193 212 247 275
Minorities 0 0 0 0 0
Long term interest bearing debt 0 0 280 264 248Finance obligation 0 0 0 0 0Other long-term liabilities 2 0 0 0 0Long term liabilities 2 0 280 264 248
Short term interest bearing debt 0 2 0 0 0Other short term liabilities 9 8 5 9 8Current liabilities 9 9 5 9 8
Total liabilities and equity 182 203 497 521 532
Working capital -4 -3 -1 -2 -2Net debt -28 -1 254 207 167
Cash flow (USDm) 2011 2012 2013E 2014E 2015EPre-tax profit 0 20 23 40 32- Associated companies 0 0 0 0 0+ Depreciation and amortization 4 9 10 17 19- Payable tax -3 2 -4 -4 -4+/- Other operating items 0 -2 0 0 0Cash flow from operations 2 29 28 53 47
Change in working capital 4 -1 -2 1 0Operating cash flow 6 28 26 53 47
Maintenance capex 0 -13 -1 -7 -7Growth capex -151 -43 -280 0 0Acquisition capex 0 0 0 0 0Sale of assets 0 0 0 0 0Cash flow from investments -151 -56 -281 -7 -7
Free cash flow -145 -27 -255 47 40
Dividend paid 0 0 0 0 0Share buy back 0 0 0 0 0Equity increase 132 0 0 0 0Cash flow from financing 132 0 0 0 0
Other items 42 0 0 0 0
Change in net debt -28 28 255 -47 -40

15
Analyst: Frode Mørkedal Tel: +47 22 01 63 27 E-mail: [email protected] Next report date: 30.04.2013 Disclosure:
Analyst: Herman Hildan Tel: +47 22 01 63 53 E-mail: [email protected]
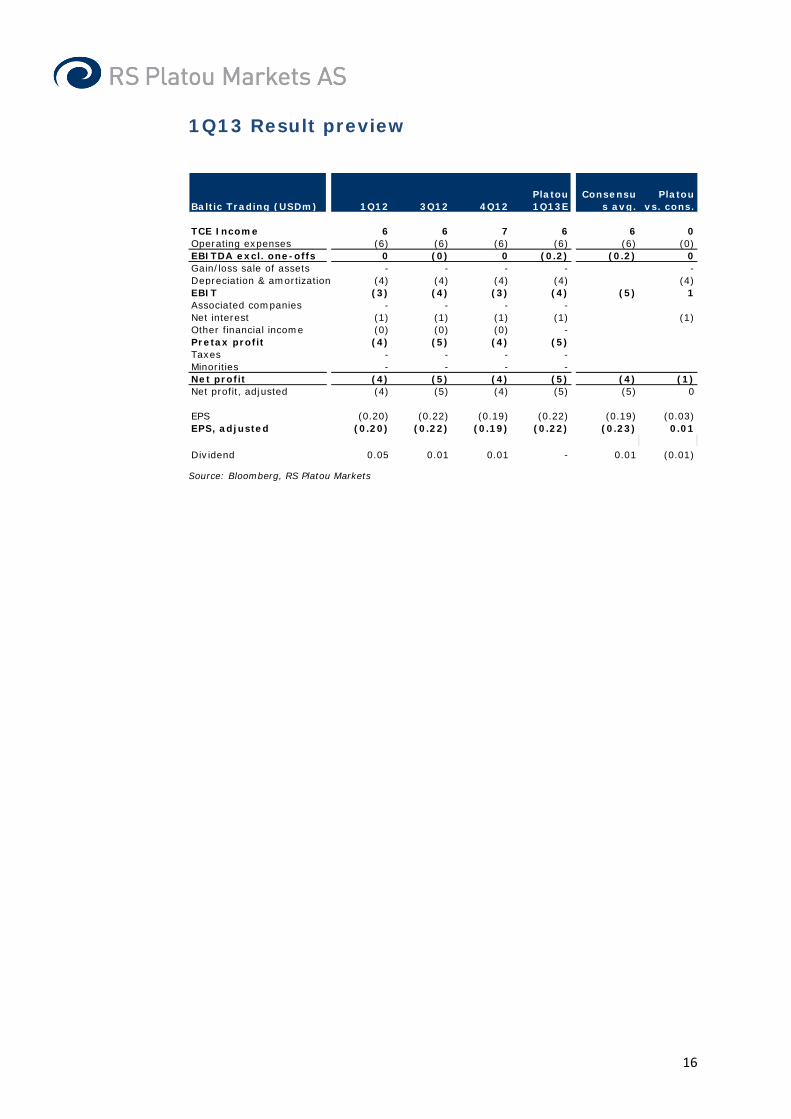
Will dividends be cut or not? We are in line with consensus on earnings expectations,but see potential for dividends to be cut in light of theweak dry bulk market. Nevertheless, with a strongbalance sheet and low cash-breakeven we reiterate BUYand USD 6 target as we believe the dry bulk market willbottom out in 2013. • 1Q13 numbers: We expect revenue of USD 6m and
negative USD 0.2m of EBITDA, same as consensusexpectations. Consensus expects EPS adj. of minus USD0.23/share, in line with our negative USD 0.22/shareestimate.
• Dividend cut? The dividend policy of BALT is net incomeless maintenance capex plus non-cash compensation andsubject to reserves established by the board. Based on thiswe see the risk that dividends should be reduced to zero.However, due to the solid financial position of theCompany and the limited cash drain from dividends it maybe that the Company continues to distribute some cash toshareholders. If dividends are paid for 1Q13 it will be asignal that minimum dividends are USD 0.01/share, in ourview.
• Valuation: We estimate mid-cycle NAV of USD 7.6/shwhile EV/EBITDA target multiple of 7.5x on 20 yearaverage rates gives USD 7/sh target. However, due to themanagement agreement we set our target USD 1 lower toreflect the cost of terminating the agreement.
We reiterate BUY and USD 6/share target price.
Baltic TradingSector: Marine
Recommendation: BUY (unchanged)
Target price (USD): 6.0 (unchanged)
Company descriptionDrybulk shipping company established in 2010 and based in New York. Listed at NYSE under the ticker BALT US.
2.5
3.0
3.5
4.0
4.5
5.0
5.5
6.0
Apr. 12 Jun. 12 Aug. 12 Oct. 12 Dec. 12 Feb. 13
Share price (USD) in Baltic Trading relative to key indices
Baltic Trading
S&P 500 Index (Rebased)
OSE Transportation (Rebased)
Shareholders Shares VotesGenco 26.0 %
Free Float 74.0 % 74.0 %
Changes in estimates (USDm)2012E 2013E
New Old Chg. New Old Chg.Oper. revenue 27 27 1% 29 29 1%EBITDA, adj. 2 2 0% 2 3 -25%EBIT, adj. -13 -13 -1% -12 -11 -8%Net income, adj. -17 -17 0% -17 -16 -5%EPS, adj. (USD) -0.8 -0.8 0% -0.7 -0.7 -5%
Company data (2012E)Share price (USD) 3.66No. of shares (m) 22.3Market cap. (USDm) 82Net debt YE (USDm) 98Enterprise value (USDm) 180
Description of adjustments: Sale of assets, agio/disagio and gain/losses on financial instruments
Key figures 2009 2010 2011 2012E 2013E 2014E 2015ERevenue (USDm) 0 33 43 27 29 44 60EBITDA (USDm) 0 18 17 2 2 16 30EBITDA, adj. (USDm) 0 17 17 2 2 16 30EBIT, adj. (USDm) 0 10 2 -13 -12 1 16Pre-tax profit, adj. (USDm) 0 8 -2 -17 -17 -3 12Net income, adj. (USDm) 0 8 -2 -17 -17 -3 12EPS, adj. (USD) 0.45 -0.10 -0.78 -0.74 -0.12 0.55OCFPS (USD) 1.0 0.8 -0.2 0.1 0.7 1.3FCFPS (USD) -21.1 0.8 -0.2 0.1 0.7 1.3BVPS (USD) 13.1 12.7 11.7 11.0 10.7 10.5Net asset value (NAV) (USD) 0.0 0.0 0.0 4.9 0.0 0.0 0.0Dividend (USD) 0.00 0.49 0.12 0.12 0.00 0.10 0.77EV/EBITDA, adj. (x) 18.1 10.9 97.3 72.8 10.2 5.0EV/EBIT, adj. (x) 31.3 82.4 n.m. n.m. n.m. 9.8P/E, adj. (x) 22.6 n.m. n.m. n.m. n.m. 6.7P/OCF (x) 9.7 6.3 n.m. 58.8 5.5 2.8EV/FCF (x) n.m. 11.1 n.m. n.m. 11.3 5.2P/Book (x) 0.8 0.4 0.3 0.3 0.3 0.3P/NAV (x) n.m. n.m. 0.7 n.m. n.m. n.m.Dividend yield (%) 4.8 2.4 3.3 0.0 2.8 21.0
Key Assumptions 2009 2010 2011 2012E 2013E 2014E 2015ECapesize spot USD/Day 42,000 33,100 16,000 9,500 11,000 19,000 30,000Supramax spot USD/Day 19,000 22,500 14,500 9,500 9,000 13,000 17,000Global drybulk fleet utilization (%) 91 92 88 84 83 87 90
Result Preview 15-Apr-13
16
1Q13 Result preview
Source: Bloomberg, RS Platou Markets
Baltic Trading (USDm) 1Q12 3Q12 4Q12Platou 1Q13E
Consensus avg.
Platou vs. cons.
TCE Income 6 6 7 6 6 0Operating expenses (6) (6) (6) (6) (6) (0)EBITDA excl. one-offs 0 (0) 0 (0.2) (0.2) 0Gain/loss sale of assets - - - - -Depreciation & amortization (4) (4) (4) (4) (4)EBIT (3) (4) (3) (4) (5) 1Associated companies - - - -Net interest (1) (1) (1) (1) (1)Other financial income (0) (0) (0) -Pretax profit (4) (5) (4) (5)Taxes - - - -Minorities - - - -Net profit (4) (5) (4) (5) (4) (1)Net profit, adjusted (4) (5) (4) (5) (5) 0
EPS (0.20) (0.22) (0.19) (0.22) (0.19) (0.03)EPS, adjusted (0.20) (0.22) (0.19) (0.22) (0.23) 0.01
Dividend 0.05 0.01 0.01 - 0.01 (0.01)

17
Profit and loss (USDm) 2009 2010 2011 2012E 2013E 2014E 2015ETotal revenue 0 33 43 27 29 44 60Voyage expenses & commissions 0 -1 -1 -1 -2 -2 -3Time-charter equivalent 0 32 42 26 28 42 57
Operating expenses 0 -14 -25 -24 -25 -26 -26
EBITDA, adj. 0 17 17 2 2 16 30Gain/loss sale of assets 0 0 0 0 0 0 0EBITDA 0 18 17 2 2 16 30Depreciation 0 -7 -15 -15 -15 -15 -15Amortization/Write down 0 0 0 0 0 0 0EBIT 0 10 2 -13 -12 1 16EBIT, adj. 0 10 2 -13 -12 1 16
Associated companies 0 0 0 0 0 0 0Net interest 0 -2 -5 -4 -4 -4 -3Gains/losses on securities or financial instruments 0 0 0 0 0 0 0Other financial Items 0 0Pre-tax profit 0 8 -2 -17 -17 -3 12Tax 0 0 0 0 0 0 0Minorities 0 0 0 0 0 0 0Result from discontinued operations/ Other 0 0 0 0 0 0 0Net income 0 8 -2 -17 -17 -3 12
Adjustments after tax 0 0 0 0 0 0 0Adjusted net income 0 8 -2 -17 -17 -3 12
EPS (USD) 0.46 -0.10 -0.78 -0.74 -0.12 0.55EPS, adj. (USD) 0.45 -0.10 -0.78 -0.74 -0.12 0.55
Balance sheet (USDm) 2009 2010 2011 2012E 2013E 2014E 2015ELong-term interest bearing assets 0 0 0 0 0 0 0Fixed assets 0 382 367 355 340 326 311Other long-term assets 1 1 2 2 2 2Long-term assets 0 383 368 357 342 328 313
Other current assets 4 5 4 4 6 8Cash and liquid assets 0 8 10 3 5 17 28Current assets 0 12 15 7 9 23 37
Total assets 0 395 383 364 351 351 350
Equity 0 289 281 261 244 239 234
Minorities 0 0 0 0 0 0 0
Long term interest bearing debt 0 92 82 101 101 101 100Finance obligation 0 0 0 0 0 0 0Other long-term liabilities 3 3 7 10Long term liabilities 0 92 86 101 105 108 110
Short term interest bearing debt 0 7 7 0 0 0 0Other short term liabilities 0 7 9 2 3 4 5Current liabilities 0 14 17 2 3 4 5
Total liabilities and equity 0 395 383 364 351 351 350
Working capital 0 -3 -4 1 1 2 3Net debt 0 92 80 98 97 84 72
Cash flow (USDm) 2009 2010 2011 2012E 2013E 2014E 2015EPre-tax profit 0 8 -2 -17 -17 -3 12- Associated companies 0 0 0 0 0 0 0+ Depreciation and amortization 0 7 15 15 15 15 15- Payable tax 0 0 0 0 0 0 0+/- Other operating items 0 0 3 3 3 3 3Cash flow from operations 0 16 16 1 1 15 30
Change in working capital 0 3 1 -5 0 -1 -1Operating cash flow 0 19 17 -4 1 15 30
Maintenance capex 0 0 0 0 0 0 0Growth capex 0 -387 0 0 0 0 0Acquisition capex 0 -12 0 0 0 0 0Sale of assets 0 0 0 0 0 0 0Cash flow from investments 0 -399 0 0 0 0 0
Free cash flow 0 -380 17 -4 1 15 30
Dividend paid 0 -7 -5 -5 0 -2 -17Share buy back 0 0 0 0 0 0 0Equity increase 0 285 0 0 0 0 0Cash flow from financing 0 278 -5 -5 0 -2 -17
Other items 0 10 0 -8 0 0 0
Change in net debt 0 92 -12 18 -1 -12 -12
18
Analyst: Frode Mørkedal Tel: +47 22 01 63 27 E-mail: [email protected] Next report date: 02.05.2013 Disclosure:
Analyst: Herman Hildan Tel: +47 22 01 63 53 E-mail: [email protected]
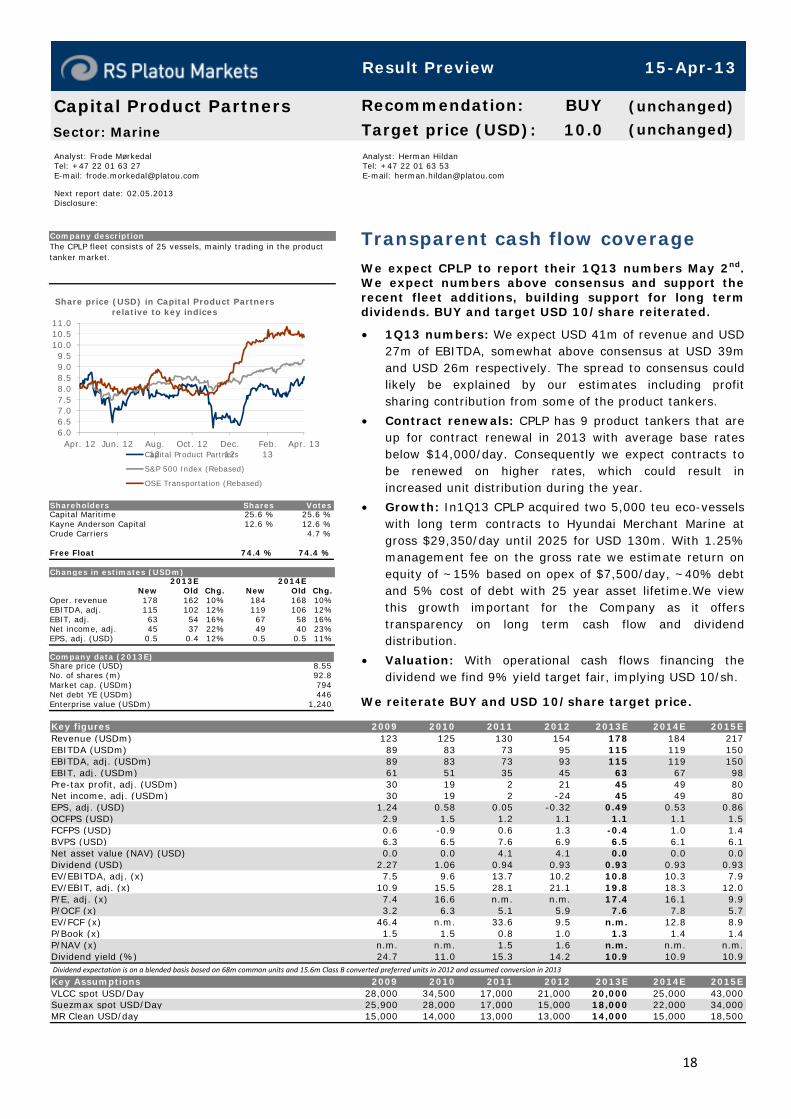
Transparent cash flow coverage We expect CPLP to report their 1Q13 numbers May 2nd.We expect numbers above consensus and support therecent fleet additions, building support for long termdividends. BUY and target USD 10/share reiterated.
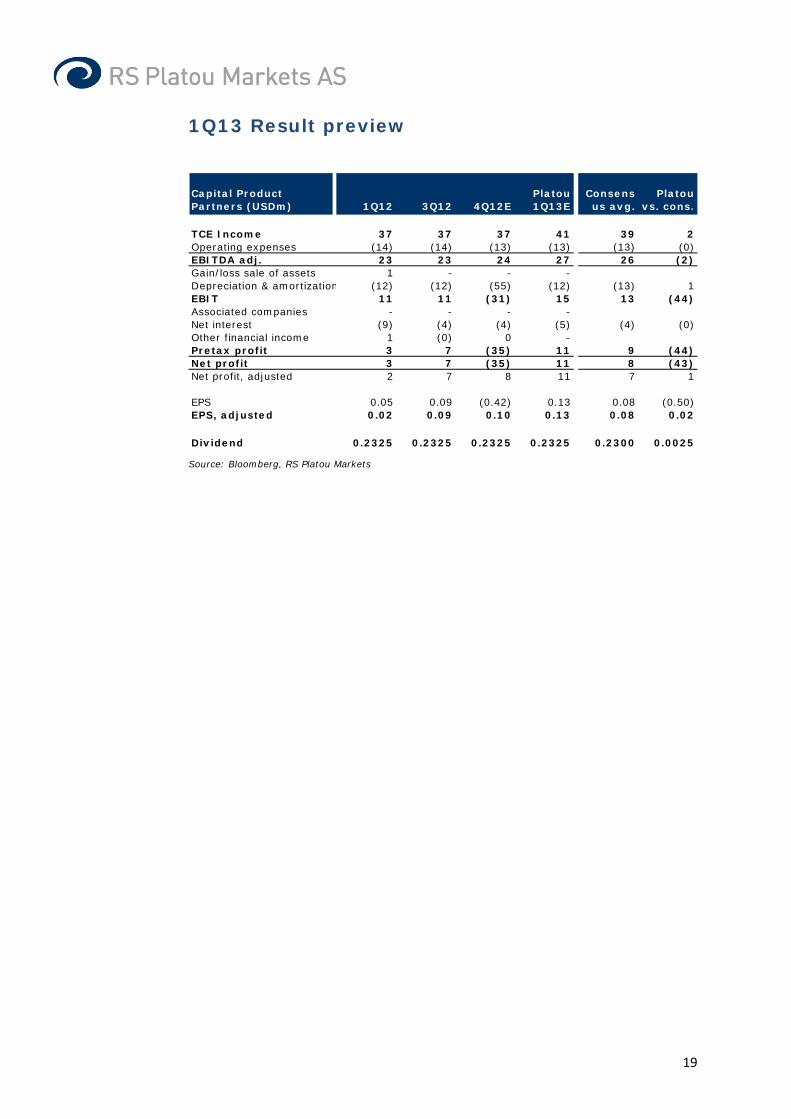
• 1Q13 numbers: We expect USD 41m of revenue and USD27m of EBITDA, somewhat above consensus at USD 39mand USD 26m respectively. The spread to consensus couldlikely be explained by our estimates including profitsharing contribution from some of the product tankers.
• Contract renewals: CPLP has 9 product tankers that areup for contract renewal in 2013 with average base ratesbelow $14,000/day. Consequently we expect contracts tobe renewed on higher rates, which could result inincreased unit distribution during the year.
• Growth: In1Q13 CPLP acquired two 5,000 teu eco-vesselswith long term contracts to Hyundai Merchant Marine atgross $29,350/day until 2025 for USD 130m. With 1.25%management fee on the gross rate we estimate return onequity of ~15% based on opex of $7,500/day, ~40% debtand 5% cost of debt with 25 year asset lifetime.We viewthis growth important for the Company as it offerstransparency on long term cash flow and dividenddistribution.
• Valuation: With operational cash flows financing thedividend we find 9% yield target fair, implying USD 10/sh.
We reiterate BUY and USD 10/share target price.
Capital Product PartnersSector: Marine
Recommendation: BUY (unchanged)
Target price (USD): 10.0 (unchanged)
Company descriptionThe CPLP fleet consists of 25 vessels, mainly trading in the product tanker market.
6.06.57.07.58.08.59.09.5
10.010.511.0
Apr. 12 Jun. 12 Aug.12
Oct. 12 Dec.12
Feb.13
Apr. 13
Share price (USD) in Capital Product Partners relative to key indices
Capital Product Partners
S&P 500 Index (Rebased)
OSE Transportation (Rebased)
Shareholders Shares VotesCapital Maritime 25.6 % 25.6 %Kayne Anderson Capital 12.6 % 12.6 %Crude Carriers 4.7 %
Free Float 74.4 % 74.4 %
Changes in estimates (USDm)2013E 2014E
New Old Chg. New Old Chg.Oper. revenue 178 162 10% 184 168 10%EBITDA, adj. 115 102 12% 119 106 12%EBIT, adj. 63 54 16% 67 58 16%Net income, adj. 45 37 22% 49 40 23%EPS, adj. (USD) 0.5 0.4 12% 0.5 0.5 11%
Company data (2013E)Share price (USD) 8.55No. of shares (m) 92.8Market cap. (USDm) 794Net debt YE (USDm) 446Enterprise value (USDm) 1,240
Dividend expectation is on a blended basis based on 68m common units and 15.6m Class B converted preferred units in 2012 and assumed conversion in 2013
Key figures 2009 2010 2011 2012 2013E 2014E 2015ERevenue (USDm) 123 125 130 154 178 184 217EBITDA (USDm) 89 83 73 95 115 119 150EBITDA, adj. (USDm) 89 83 73 93 115 119 150EBIT, adj. (USDm) 61 51 35 45 63 67 98Pre-tax profit, adj. (USDm) 30 19 2 21 45 49 80Net income, adj. (USDm) 30 19 2 -24 45 49 80EPS, adj. (USD) 1.24 0.58 0.05 -0.32 0.49 0.53 0.86OCFPS (USD) 2.9 1.5 1.2 1.1 1.1 1.1 1.5FCFPS (USD) 0.6 -0.9 0.6 1.3 -0.4 1.0 1.4BVPS (USD) 6.3 6.5 7.6 6.9 6.5 6.1 6.1Net asset value (NAV) (USD) 0.0 0.0 4.1 4.1 0.0 0.0 0.0Dividend (USD) 2.27 1.06 0.94 0.93 0.93 0.93 0.93EV/EBITDA, adj. (x) 7.5 9.6 13.7 10.2 10.8 10.3 7.9EV/EBIT, adj. (x) 10.9 15.5 28.1 21.1 19.8 18.3 12.0P/E, adj. (x) 7.4 16.6 n.m. n.m. 17.4 16.1 9.9P/OCF (x) 3.2 6.3 5.1 5.9 7.6 7.8 5.7EV/FCF (x) 46.4 n.m. 33.6 9.5 n.m. 12.8 8.9P/Book (x) 1.5 1.5 0.8 1.0 1.3 1.4 1.4P/NAV (x) n.m. n.m. 1.5 1.6 n.m. n.m. n.m.Dividend yield (%) 24.7 11.0 15.3 14.2 10.9 10.9 10.9
Key Assumptions 2009 2010 2011 2012 2013E 2014E 2015EVLCC spot USD/Day 28,000 34,500 17,000 21,000 20,000 25,000 43,000Suezmax spot USD/Day 25,900 28,000 17,000 15,000 18,000 22,000 34,000MR Clean USD/day 15,000 14,000 13,000 13,000 14,000 15,000 18,500
Result Preview 15-Apr-13
19
1Q13 Result preview
Source: Bloomberg, RS Platou Markets
Capital Product Partners (USDm) 1Q12 3Q12 4Q12E
Platou 1Q13E
Consensus avg.
Platou vs. cons.
TCE Income 37 37 37 41 39 2Operating expenses (14) (14) (13) (13) (13) (0)EBITDA adj. 23 23 24 27 26 (2)Gain/loss sale of assets 1 - - -Depreciation & amortization (12) (12) (55) (12) (13) 1EBIT 11 11 (31) 15 13 (44)Associated companies - - - -Net interest (9) (4) (4) (5) (4) (0)Other financial income 1 (0) 0 -Pretax profit 3 7 (35) 11 9 (44)Net profit 3 7 (35) 11 8 (43)Net profit, adjusted 2 7 8 11 7 1
EPS 0.05 0.09 (0.42) 0.13 0.08 (0.50)EPS, adjusted 0.02 0.09 0.10 0.13 0.08 0.02
Dividend 0.2325 0.2325 0.2325 0.2325 0.2300 0.0025
20
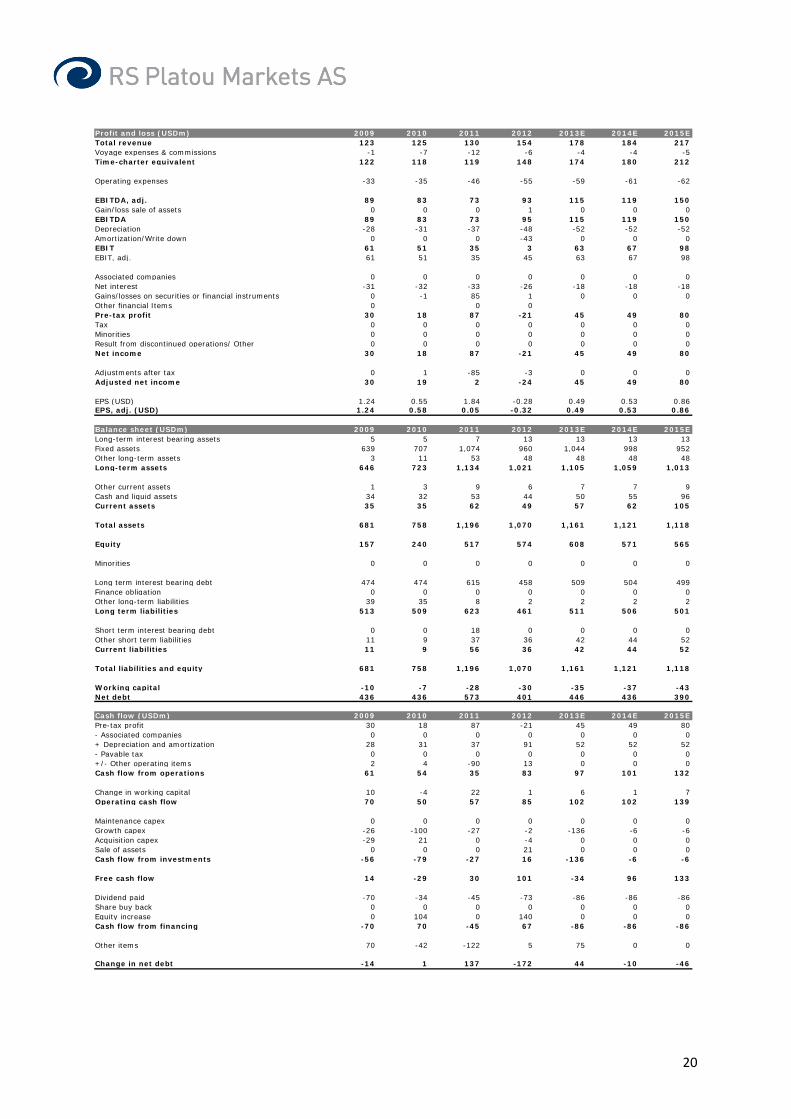
Profit and loss (USDm) 2009 2010 2011 2012 2013E 2014E 2015ETotal revenue 123 125 130 154 178 184 217Voyage expenses & commissions -1 -7 -12 -6 -4 -4 -5Time-charter equivalent 122 118 119 148 174 180 212
Operating expenses -33 -35 -46 -55 -59 -61 -62
EBITDA, adj. 89 83 73 93 115 119 150Gain/loss sale of assets 0 0 0 1 0 0 0EBITDA 89 83 73 95 115 119 150Depreciation -28 -31 -37 -48 -52 -52 -52Amortization/Write down 0 0 0 -43 0 0 0EBIT 61 51 35 3 63 67 98EBIT, adj. 61 51 35 45 63 67 98
Associated companies 0 0 0 0 0 0 0Net interest -31 -32 -33 -26 -18 -18 -18Gains/losses on securities or financial instruments 0 -1 85 1 0 0 0Other financial Items 0 0 0Pre-tax profit 30 18 87 -21 45 49 80Tax 0 0 0 0 0 0 0Minorities 0 0 0 0 0 0 0Result from discontinued operations/ Other 0 0 0 0 0 0 0Net income 30 18 87 -21 45 49 80
Adjustments after tax 0 1 -85 -3 0 0 0Adjusted net income 30 19 2 -24 45 49 80
EPS (USD) 1.24 0.55 1.84 -0.28 0.49 0.53 0.86EPS, adj. (USD) 1.24 0.58 0.05 -0.32 0.49 0.53 0.86
Balance sheet (USDm) 2009 2010 2011 2012 2013E 2014E 2015ELong-term interest bearing assets 5 5 7 13 13 13 13Fixed assets 639 707 1,074 960 1,044 998 952Other long-term assets 3 11 53 48 48 48 48Long-term assets 646 723 1,134 1,021 1,105 1,059 1,013
Other current assets 1 3 9 6 7 7 9Cash and liquid assets 34 32 53 44 50 55 96Current assets 35 35 62 49 57 62 105
Total assets 681 758 1,196 1,070 1,161 1,121 1,118
Equity 157 240 517 574 608 571 565
Minorities 0 0 0 0 0 0 0
Long term interest bearing debt 474 474 615 458 509 504 499Finance obligation 0 0 0 0 0 0 0Other long-term liabilities 39 35 8 2 2 2 2Long term liabilities 513 509 623 461 511 506 501
Short term interest bearing debt 0 0 18 0 0 0 0Other short term liabilities 11 9 37 36 42 44 52Current liabilities 11 9 56 36 42 44 52
Total liabilities and equity 681 758 1,196 1,070 1,161 1,121 1,118
Working capital -10 -7 -28 -30 -35 -37 -43Net debt 436 436 573 401 446 436 390
Cash flow (USDm) 2009 2010 2011 2012 2013E 2014E 2015EPre-tax profit 30 18 87 -21 45 49 80- Associated companies 0 0 0 0 0 0 0+ Depreciation and amortization 28 31 37 91 52 52 52- Payable tax 0 0 0 0 0 0 0+/- Other operating items 2 4 -90 13 0 0 0Cash flow from operations 61 54 35 83 97 101 132
Change in working capital 10 -4 22 1 6 1 7Operating cash flow 70 50 57 85 102 102 139
Maintenance capex 0 0 0 0 0 0 0Growth capex -26 -100 -27 -2 -136 -6 -6Acquisition capex -29 21 0 -4 0 0 0Sale of assets 0 0 0 21 0 0 0Cash flow from investments -56 -79 -27 16 -136 -6 -6
Free cash flow 14 -29 30 101 -34 96 133
Dividend paid -70 -34 -45 -73 -86 -86 -86Share buy back 0 0 0 0 0 0 0Equity increase 0 104 0 140 0 0 0Cash flow from financing -70 70 -45 67 -86 -86 -86
Other items 70 -42 -122 5 75 0 0
Change in net debt -14 1 137 -172 44 -10 -46
21
Analyst: Frode Mørkedal Tel: +47 22 01 63 27 E-mail: [email protected] Next report date: 08.05.2013 Disclosure:
Analyst: Herman Hildan Tel: +47 22 01 63 53 E-mail: [email protected]
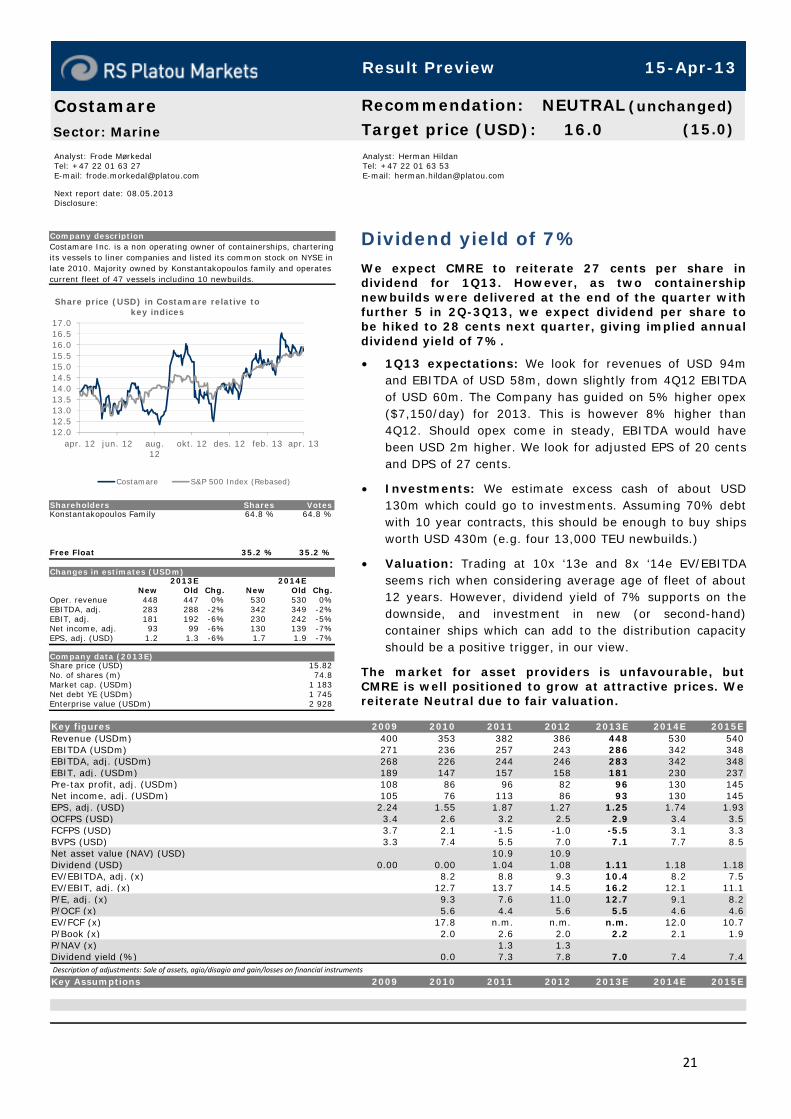
Dividend yield of 7% We expect CMRE to reiterate 27 cents per share individend for 1Q13. However, as two containershipnewbuilds were delivered at the end of the quarter withfurther 5 in 2Q-3Q13, we expect dividend per share to be hiked to 28 cents next quarter, giving implied annual dividend yield of 7%.
• 1Q13 expectations: We look for revenues of USD 94m and EBITDA of USD 58m, down slightly from 4Q12 EBITDAof USD 60m. The Company has guided on 5% higher opex($7,150/day) for 2013. This is however 8% higher than4Q12. Should opex come in steady, EBITDA would have been USD 2m higher. We look for adjusted EPS of 20 centsand DPS of 27 cents.
• Investments: We estimate excess cash of about USD 130m which could go to investments. Assuming 70% debtwith 10 year contracts, this should be enough to buy ships worth USD 430m (e.g. four 13,000 TEU newbuilds.)
• Valuation: Trading at 10x ‘13e and 8x ‘14e EV/EBITDA seems rich when considering average age of fleet of about12 years. However, dividend yield of 7% supports on thedownside, and investment in new (or second-hand) container ships which can add to the distribution capacityshould be a positive trigger, in our view.
The market for asset providers is unfavourable, but CMRE is well positioned to grow at attractive prices. We reiterate Neutral due to fair valuation.
CostamareSector: Marine
Recommendation: NEUTRAL (unchanged)
Target price (USD): 16.0 (15.0)
Company descriptionCostamare Inc. is a non operating owner of containerships, chartering its vessels to liner companies and listed its common stock on NYSE in late 2010. Majority owned by Konstantakopoulos family and operates current fleet of 47 vessels including 10 newbuilds.
12.012.513.013.514.014.515.015.516.016.517.0
apr. 12 jun. 12 aug.12
okt. 12 des. 12 feb. 13 apr. 13
Share price (USD) in Costamare relative to key indices
Costamare S&P 500 Index (Rebased)
Shareholders Shares VotesKonstantakopoulos Family 64.8 % 64.8 %
Free Float 35.2 % 35.2 %
Changes in estimates (USDm)2013E 2014E
New Old Chg. New Old Chg.Oper. revenue 448 447 0% 530 530 0%EBITDA, adj. 283 288 -2% 342 349 -2%EBIT, adj. 181 192 -6% 230 242 -5%Net income, adj. 93 99 -6% 130 139 -7%EPS, adj. (USD) 1.2 1.3 -6% 1.7 1.9 -7%
Company data (2013E)Share price (USD) 15.82No. of shares (m) 74.8Market cap. (USDm) 1 183Net debt YE (USDm) 1 745Enterprise value (USDm) 2 928
Description of adjustments: Sale of assets, agio/disagio and gain/losses on financial instruments
Key figures 2009 2010 2011 2012 2013E 2014E 2015ERevenue (USDm) 400 353 382 386 448 530 540EBITDA (USDm) 271 236 257 243 286 342 348EBITDA, adj. (USDm) 268 226 244 246 283 342 348EBIT, adj. (USDm) 189 147 157 158 181 230 237Pre-tax profit, adj. (USDm) 108 86 96 82 96 130 145Net income, adj. (USDm) 105 76 113 86 93 130 145EPS, adj. (USD) 2.24 1.55 1.87 1.27 1.25 1.74 1.93OCFPS (USD) 3.4 2.6 3.2 2.5 2.9 3.4 3.5FCFPS (USD) 3.7 2.1 -1.5 -1.0 -5.5 3.1 3.3BVPS (USD) 3.3 7.4 5.5 7.0 7.1 7.7 8.5Net asset value (NAV) (USD) 10.9 10.9Dividend (USD) 0.00 0.00 1.04 1.08 1.11 1.18 1.18EV/EBITDA, adj. (x) 8.2 8.8 9.3 10.4 8.2 7.5EV/EBIT, adj. (x) 12.7 13.7 14.5 16.2 12.1 11.1P/E, adj. (x) 9.3 7.6 11.0 12.7 9.1 8.2P/OCF (x) 5.6 4.4 5.6 5.5 4.6 4.6EV/FCF (x) 17.8 n.m. n.m. n.m. 12.0 10.7P/Book (x) 2.0 2.6 2.0 2.2 2.1 1.9P/NAV (x) 1.3 1.3Dividend yield (%) 0.0 7.3 7.8 7.0 7.4 7.4
Key Assumptions 2009 2010 2011 2012 2013E 2014E 2015E
Result Preview 15-Apr-13
22
1Q13 Result preview
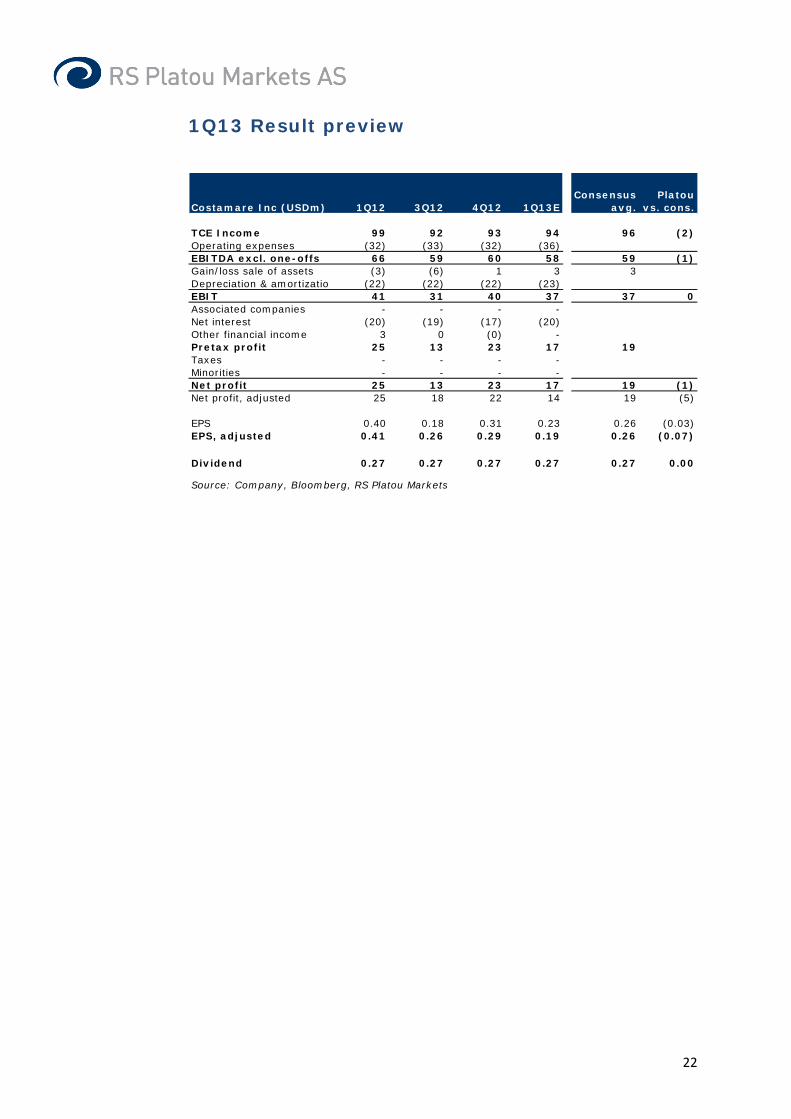
Costamare Inc (USDm) 1Q12 3Q12 4Q12 1Q13EConsensus
avg.Platou
vs. cons.
TCE Income 99 92 93 94 96 (2)Operating expenses (32) (33) (32) (36)EBITDA excl. one-offs 66 59 60 58 59 (1)Gain/loss sale of assets (3) (6) 1 3 3Depreciation & amortizatio (22) (22) (22) (23)EBIT 41 31 40 37 37 0Associated companies - - - -Net interest (20) (19) (17) (20)Other financial income 3 0 (0) -Pretax profit 25 13 23 17 19Taxes - - - -Minorities - - - -Net profit 25 13 23 17 19 (1)Net profit, adjusted 25 18 22 14 19 (5)
EPS 0.40 0.18 0.31 0.23 0.26 (0.03)EPS, adjusted 0.41 0.26 0.29 0.19 0.26 (0.07)
Dividend 0.27 0.27 0.27 0.27 0.27 0.00
Source: Company, Bloomberg, RS Platou Markets

23
Profit and loss (USDm) 2009 2010 2011 2012 2013E 2014E 2015ETotal revenue 400 353 382 386 448 530 540Voyage expenses & commissions -3 -2 -7 -8 -7 -8 -8Time-charter equivalent 397 351 375 378 441 522 532
Operating expenses -128 -125 -131 -132 -158 -180 -183
EBITDA, adj. 268 226 244 246 283 342 348Gain/loss sale of assets 3 10 13 -3 3 0 0EBITDA 271 236 257 243 286 342 348Depreciation -71 -71 -79 -80 -93 -103 -104Amortization/Write down -8 -8 -8 -8 -8 -8 -8EBIT 192 156 171 155 184 230 237EBIT, adj. 189 147 157 158 181 230 237
Associated companies 0 0 0 0 0 0 0Net interest -84 -71 -75 -73 -88 -100 -92Gains/losses on securities or financial instruments 9 -4 -8 -1 0 0 0Other financial ItemsPre-tax profit 117 81 88 81 96 130 145Tax 0 0 0 0 0 0 0Minorities 0 0 0 0 0 0 0Result from discontinued operations/ Other 0 0 0 0 0 0 0Net income 117 81 88 81 96 130 145
Adjustments after tax -12 -5 -5 3 -3 0 0Adjusted net income 105 76 113 86 93 130 145
EPS (USD) 2.49 1.65 1.45 1.20 1.29 1.74 1.93EPS, adj. (USD) 2.24 1.55 1.87 1.27 1.25 1.74 1.93
Balance sheet (USDm) 2009 2010 2011 2012 2013E 2014E 2015ELong-term interest bearing assets 40 37 39 42 42 42 42Fixed assets 1 560 1 535 1 767 1 922 2 453 2 366 2 266Other long-term assets 62 45 38 48 48 48 48Long-term assets 1 662 1 618 1 844 2 011 2 542 2 456 2 356
Other current assets 36 51 41 27 36 43 44Cash and liquid assets 12 160 98 273 241 194 192Current assets 48 211 139 300 277 236 235
Total assets 1 710 1 829 1 983 2 311 2 819 2 692 2 591
Equity 155 362 330 520 535 577 633
Minorities 0 0 0 0 0 0 0
Long term interest bearing debt 1 342 1 227 1 290 1 400 1 865 1 675 1 515Finance obligation 29 54 125 0 0 0 0Other long-term liabilities 1 1 11 142 142 142 142Long term liabilities 1 372 1 282 1 426 1 541 2 007 1 817 1 656
Short term interest bearing debt 94 115 153 162 162 162 162Other short term liabilities 89 70 73 87 116 137 139Current liabilities 183 185 227 249 278 299 302
Total liabilities and equity 1 710 1 829 1 983 2 311 2 819 2 692 2 591
Working capital -53 -19 -33 -60 -79 -94 -96Net debt 1 383 1 145 1 307 1 247 1 745 1 601 1 443
Cash flow (USDm) 2009 2010 2011 2012 2013E 2014E 2015EPre-tax profit 117 81 88 81 96 130 145- Associated companies 0 0 0 0 0 0 0+ Depreciation and amortization 79 79 87 89 101 112 112- Payable tax 0 0 0 0 0 0 0+/- Other operating items -11 -4 17 -29 -3 0 0Cash flow from operations 185 156 192 141 195 242 256
Change in working capital -23 -29 4 27 20 15 2Operating cash flow 162 128 195 168 214 256 258
Maintenance capex 0 0 0 0 -10 -6 -12Growth capex -57 -55 -341 -200 -628 -19 0Acquisition capex 0 0 0 0 0 0 0Sale of assets 70 31 57 -37 8 0 0Cash flow from investments 13 -24 -284 -237 -629 -25 -12
Free cash flow 175 104 -89 -68 -415 231 246
Dividend paid -30 -10 -62 -71 -83 -88 -88Share buy back 0 0 0 0 0 0 0Equity increase 0 148 0 194 0 0 0Cash flow from financing -30 138 -62 123 -83 -88 -88
Other items -1 528 -4 -11 5 1 0 0
Change in net debt 1 383 -238 162 -59 497 -143 -158

24
Analyst: Frode Mørkedal Tel: +47 22 01 63 27 E-mail: [email protected] Next report date: 07.05.2013 Disclosure:
Analyst: Herman Hildan Tel: +47 22 01 63 53 E-mail: [email protected]
Continued fleet expansion d’Amico International Shipping (DIS IM) continued itsfleet expansion during the quarter by adding another 2newbuilds to the orderbook with 2014 delivery at highlyattractive prices.
• 1Q13 numbers: We expect USD 50m of revenue and EBITDA of USD 12m vs. consensus EBITDA expectation ofUSD 9m. Management was bullish on the 4Q12 conferencecall, citing low fleet growth on the back of the changingrefinery landscape, likely to be repeated on the 1Q13 call. However, we expect somewhat lower DIS spot rates as theCompany said on the last conference call that Januaryaverage earnings were $14,000/day. This is below ourestimated average 1Q13 MR earnings of $18,000/day. Weexpect average fleet earnings of $15,100/day for 1Q13.
• Fleet expansion: DIS added another 2 MR newbuilds to their orderbook in March, to be built in Vietnam butdelivered by Hyundai Mipo (Korea). Industry sources saythe technical management of DIS holds unique quality,hence we see limited quality risk for the newbuilds.
• Valuation: We estimate current NAV of EUR 0.55/sh, increasing to EUR 0.7/sh with newbuild parity. At EUR0.7/sh EV/EBITDA is 6x while the theoretically fair targetmultiple indicates EUR 1/sh target in 2015 on 20 yearaverage rate of $18,500/day. However, due to low freefloat and Italy listing a discount seems likely.
We reiterate BUY and EUR 0.7/sh target.
d'Amico International ShippingSector: Marine
Recommendation: BUY (unchanged)
Target price (EUR): 0.70 (unchanged)
Company descriptionItalian pure play product tanker company focused on MRs, current fleet of 25 owned and 6 eco newbuilds. Listed on the Milan Stock Exchange.
0.25
0.30
0.35
0.40
0.45
0.50
0.55
0.60
0.65
Apr. 12 Jun. 12 Aug.12
Oct. 12 Dec.12
Feb.13
Apr. 13
Share price (EUR) in d'Amico International Shipping relative to key indices
d'Amico International Shipping
S&P 500 Index (Rebased)
OSE Transportation (Rebased)
Shareholders Shares VotesD'AMICO Intl SA 74.1 % 74.1 %
Free Float 25.9 % 25.9 %
Changes in estimates (USDm)2013E 2014E
New Old Chg. New Old Chg.Oper. revenue 327 327 0% 349 343 2%EBITDA, adj. 33 33 0% 52 51 3%EBIT, adj. -2 -2 0% 9 9 6%Net income, adj. -12 -12 0% -2 -3 19%EPS, adj. (USD) 0.0 0.0 0% 0.0 0.0 19%
Company data (2013E)Share price (EUR) 0.44No. of shares (m) 429.9Market cap. (USDm) 248Net debt YE (USDm) 215Enterprise value (USDm) 462
d’Amico International Shipping S.A. (DIS) is one of the ten world main owners in its industry segment with a long history of over 60 years, and one of the few pure Product Tankers players
Key figures 2010 2011 2012 2013E 2014E 2015ERevenue (USDm) 311 295 327 327 349 470EBITDA (USDm) 30 31 20 33 52 110EBITDA, adj. (USDm) 30 28 19 33 52 110EBIT, adj. (USDm) -2 -9 -20 -2 9 62Pre-tax profit, adj. (USDm) -12 -17 -29 -11 -1 51Net income, adj. (USDm) -11 -21 -116 -12 -2 50EPS, adj. (USD) -0.08 -0.14 -0.69 -0.03 0.00 0.12OCFPS (USD) 0.0 0.2 0.0 0.1 0.1 0.2FCFPS (USD) -0.3 -0.1 -0.4 0.0 -0.3 0.1BVPS (USD) 2.2 2.1 0.7 0.7 0.7 0.8Net asset value (NAV) (USD) 0.0 0.0 0.7 0.0 0.0 0.0Dividend (USD) 0.00 0.00 0.00 0.00 0.00 0.00EV/EBITDA, adj. (x) 13.8 12.0 20.1 14.0 10.8 4.5EV/EBIT, adj. (x) n.m. n.m. n.m. n.m. 59.2 8.0P/E, adj. (x) n.m. n.m. n.m. n.m. n.m. 4.9P/OCF (x) 79.4 2.9 29.9 10.9 6.1 2.5EV/FCF (x) n.m. n.m. n.m. n.m. n.m. 8.8P/Book (x) 0.6 0.3 0.6 0.9 0.9 0.7P/NAV (x) n.m. n.m. 0.6 n.m. n.m. n.m.Dividend yield (%) 0.0 0.0 0.0 0.0 0.0 0.0
Key Assumptions 2010 2011 2012 2013E 2014E 2015EMR spot rates (USD/day) 14,000 13,000 13,000 14,000 15,000 18,500
Result Preview 15-Apr-13
25
1Q13 Result preview
Source: Bloomberg, RS Platou Markets
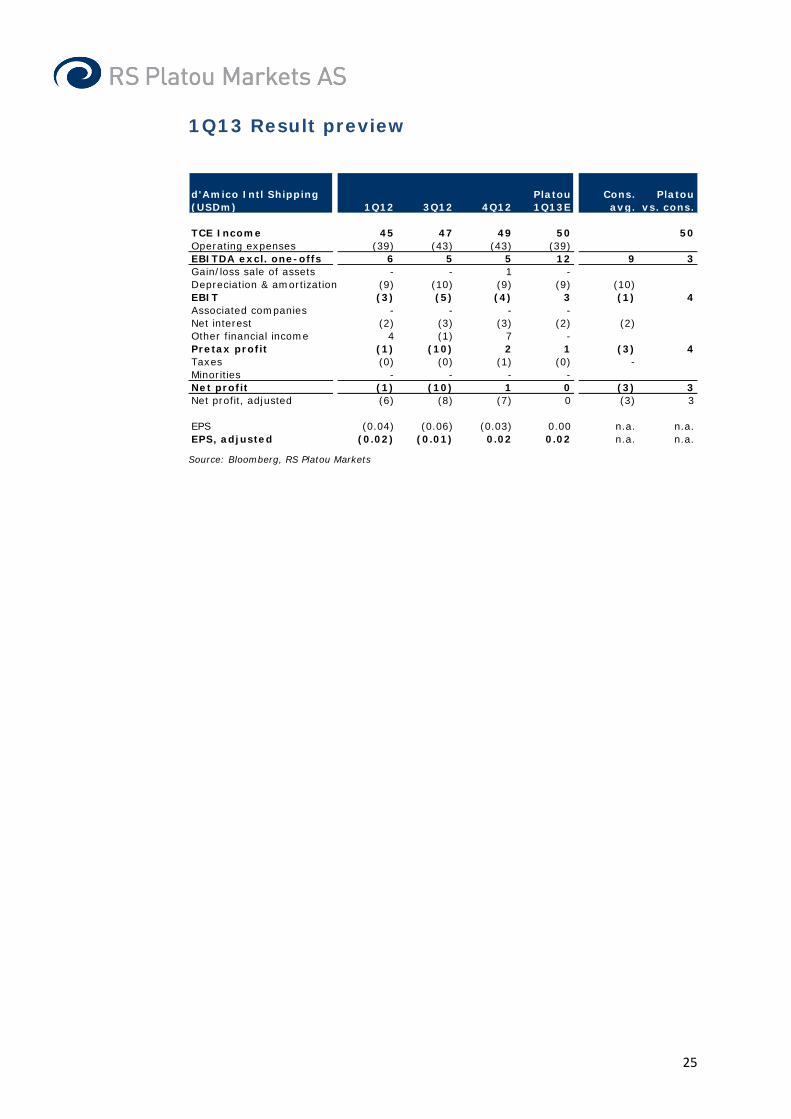
d'Amico Intl Shipping (USDm) 1Q12 3Q12 4Q12
Platou 1Q13E
Cons. avg.
Platou vs. cons.
TCE Income 45 47 49 50 50Operating expenses (39) (43) (43) (39)EBITDA excl. one-offs 6 5 5 12 9 3Gain/loss sale of assets - - 1 -Depreciation & amortization (9) (10) (9) (9) (10)EBIT (3) (5) (4) 3 (1) 4Associated companies - - - -Net interest (2) (3) (3) (2) (2)Other financial income 4 (1) 7 -Pretax profit (1) (10) 2 1 (3) 4Taxes (0) (0) (1) (0) -Minorities - - - -Net profit (1) (10) 1 0 (3) 3Net profit, adjusted (6) (8) (7) 0 (3) 3
EPS (0.04) (0.06) (0.03) 0.00 n.a. n.a.EPS, adjusted (0.02) (0.01) 0.02 0.02 n.a. n.a.

26
Profit and loss (USDm) 2010 2011 2012 2013E 2014E 2015ETotal revenue 311 295 327 327 349 470Voyage expenses & commissions -106 -105 -142 -140 -149 -201Time-charter equivalent 205 190 185 187 200 269
Operating expenses -174 -162 -167 -154 -147 -159
EBITDA, adj. 30 28 19 33 52 110Gain/loss sale of assets 0 3 1 0 0 0EBITDA 30 31 20 33 52 110Depreciation -32 -37 -38 -35 -43 -48Amortization/Write down 0 0 -85 0 0 0EBIT -2 -6 -103 -2 9 62EBIT, adj. -2 -9 -20 -2 9 62
Associated companies 0 0 0 0 0 0Net interest -10 -11 -10 -9 -11 -11Gains/losses on securities or financial instruments -9 -4 9 0 0 0Other financial Items 0Pre-tax profit -21 -20 -105 -11 -1 51Tax 1 -1 -1 -1 -1 -1Minorities 0 0 0 0 0 0Result from discontinued operations/ Other 0 0 0 0 0 0Net income -21 -21 -106 -12 -2 50
Adjustments after tax 9 0 -10 0 0 0Adjusted net income -11 -21 -116 -12 -2 50
EPS (USD) -0.14 -0.14 -0.63 -0.03 0.00 0.12EPS, adj. (USD) -0.08 -0.14 -0.69 -0.03 0.00 0.12
Balance sheet (USDm) 2010 2011 2012 2013E 2014E 2015ELong-term interest bearing assets 0 0 0 0 0 0Fixed assets 544 548 499 507 613 610Other long-term assetsLong-term assets 544 548 499 507 613 610
Other current assets 97 72 60 61 65 88Cash and liquid assets 68 51 118 68 33 85Current assets 165 123 178 129 98 172
Total assets 710 670 677 635 712 782
Equity 333 315 294 282 291 353
Minorities 0 0 0 0 0 0
Long term interest bearing debt 285 282 284 254 317 301Finance obligation 0 0 0 0 0 0Other long-term liabilities 5 5 5 5Long term liabilities 285 282 289 259 322 305
Short term interest bearing debt 11 15 28 28 28 28Other short term liabilities 81 57 66 67 71 96Current liabilities 92 72 94 95 99 124
Total liabilities and equity 710 670 677 635 712 782
Working capital 16 14 -5 -5 -6 -8Net debt 227 246 195 215 312 244
Cash flow (USDm) 2010 2011 2012 2013E 2014E 2015EPre-tax profit -21 -20 -105 -11 -1 51- Associated companies 0 0 0 0 0 0+ Depreciation and amortization 32 37 123 35 43 48- Payable tax 1 -1 -1 -1 -1 -1+/- Other operating items 7 11 -35 0 0 0Cash flow from operations 19 27 -17 23 40 99
Change in working capital -16 2 20 0 0 2Operating cash flow 2 29 2 23 41 101
Maintenance capex 0 0 0 0 0 0Growth capex -57 -65 -85 -43 -149 -45Acquisition capex 0 0 0 0 0 0Sale of assets 3 27 12 0 0 0Cash flow from investments -54 -37 -73 -43 -149 -45
Free cash flow -52 -8 -71 -20 -108 56
Dividend paid 0 0 0 0 0 0Share buy back 0 0 0 0 0 0Equity increase 0 -1 84 0 11 12Cash flow from financing 0 -1 84 0 11 12
Other items -176 -10 39 0 0 0
Change in net debt 227 19 -51 20 97 -68

27
Analyst: Frode Mørkedal Tel: +47 22 01 63 27 E-mail: [email protected] Next report date: 15.05.2013 Disclosure:
Analyst: Herman Hildan Tel: +47 22 01 63 53 E-mail: [email protected]
Expect higher full year guidance DS Norden is expected to report 1Q13 numbers on May15th. We expect the low 2013 guidance from the last report to be upgraded and see high upside potential forDNORD as the market is expected to bottom in 2013. Weexpect management comments to be bullish in terms ofbuilding upside for a recovery, in line with the signals at a lunch presentation in our offices during the quarter.
• 1Q13 numbers: We expect TCE income of USD 218m and EBITDA of USD 16m, in line with consensus expecting USD18m of EBITDA.
• 2013 guidance: Management guided USD 0m EBITDA for Dry Cargo and USD 25-45m for Product tankers and Group EBITDA of USD 15-45m on the 4Q12 presentation. Management told us at a lunch presentation that theguidance was based on a depressed FFA market inFebruary, on the back of a recovery since then we find itlikely that the guiding will be upgraded in 1Q13.
• Valuation: We estimate DNORD NAV at DKK 223/sh, up from DKK 214/sh a month ago due to higher asset values.Management said in the last report that they believed assetvalues have bottomed out and implemented a sharebuyback program of USD 30m as long as the share price is below NAV (DKK 213/sh at 4Q12 report). Regardless, wefind earnings more important and find EV/EBITDA of 3.2x‘15e as attractive in light of the strong balance sheet. OurUSD 39/sh target implies EV/EBTIDA of ~4.5x.
We reiterate BUY and USD 39/sh target.
D/S NordenSector: Marine
Recommendation: BUY (unchanged)
Target price (USD): 39 (unchanged)
Company descriptionDanish dry bulk major founded in 1871 that operates more than 100 bulk vessels including long-term charters. Has a large newbuild orderbook in addition to a product tanker exposure . Listed in Copenhagen under the ticker DNORD.
140
150
160
170
180
190
200
210
220
Apr. 12 Jun. 12 Aug. 12 Oct. 12 Dec. 12 Feb. 13
Share price (DKK) in D/S Norden relative to key indices
D/S Norden
OSEBX index (Rebased)
OSE Transportation (Rebased)
Shareholders Shares VotesA/S Motortramp 26.6 % 26.6 %Kristiansand Tankrederi (Rasmussengrupp 10.9 % 10.9 %D/S Norden (treasury shares) 5.7 % 5.7 %
Free Float 56.8 % 56.8 %
Changes in estimates (USDm)2013E 2014E
New Old Chg. New Old Chg.Oper. revenue 1,622 1,622 0% 1,899 1,899 0%EBITDA, adj. 60 60 0% 119 119 0%EBIT, adj. -22 -22 0% 30 30 0%Net income, adj. -31 -31 0% 21 21 0%EPS, adj. (USD) -0.8 -0.8 0% 0.5 0.5 0%
Company data (2013E)Share price (DKK) 182.60No. of shares (m) 41.2Market cap. (USDm) 1,321Net debt YE (USDm) -343Enterprise value (USDm) 979
Description of adjustments: Sale of assets, agio/disagio and gain/losses on financial instruments
Key figures 2009 2010 2011 2012 2013E 2014E 2015ERevenue (USDm) 1,676 2,190 2,273 2,131 1,622 1,899 2,461EBITDA (USDm) 195 268 186 124 63 119 239EBITDA, adj. (USDm) 126 240 186 148 60 119 239EBIT, adj. (USDm) 90 190 105 59 -22 30 149Pre-tax profit, adj. (USDm) 167 220 108 33 -23 26 145Net income, adj. (USDm) 87 186 103 -249 -31 21 139EPS, adj. (USD) 2.06 4.42 2.49 -6.03 -0.76 0.50 3.38OCFPS (USD) 3.8 7.1 1.5 3.0 1.9 2.3 4.8FCFPS (USD) 1.9 -1.9 -7.5 3.1 0.1 1.7 4.8BVPS (USD) 42.8 47.4 48.4 40.9 39.5 39.3 42.0Net asset value (NAV) (USD) 51.2 39.1 39.1 39.1 0.0 0.0 0.0Dividend (USD) 1.29 1.43 0.73 0.73 0.73 0.73 0.73EV/EBITDA, adj. (x) 8.5 4.0 3.9 5.6 16.2 7.9 3.2EV/EBIT, adj. (x) 11.9 5.1 6.9 13.9 n.m. 31.1 5.2P/E, adj. (x) 19.6 8.1 9.4 n.m. n.m. 64.1 9.5P/OCF (x) 10.6 5.1 15.5 9.8 16.6 14.2 6.7EV/FCF (x) 13.2 n.m. n.m. 6.4 n.m. 13.7 3.9P/Book (x) 0.9 0.8 0.5 0.7 0.8 0.8 0.8P/NAV (x) 0.8 0.9 0.6 0.7 n.m. n.m. n.m.Dividend yield (%) 3.2 4.0 3.1 2.5 2.3 2.3 2.3
Key Assumptions 2009 2010 2011 2012 2013E 2014E 2015EPanamax USD/day 19,000 25,000 14,500 8,500 9,000 13,000 18,000Supramax USD/day 17,100 22,500 14,500 9,500 9,000 13,000 17,000Handysize USD/day 11,200 16,500 10,500 7,500 7,000 10,000 13,000
Result Preview 15-Apr-13
28
1Q13 Result preview
Source: Bloomberg, RS Platou Markets
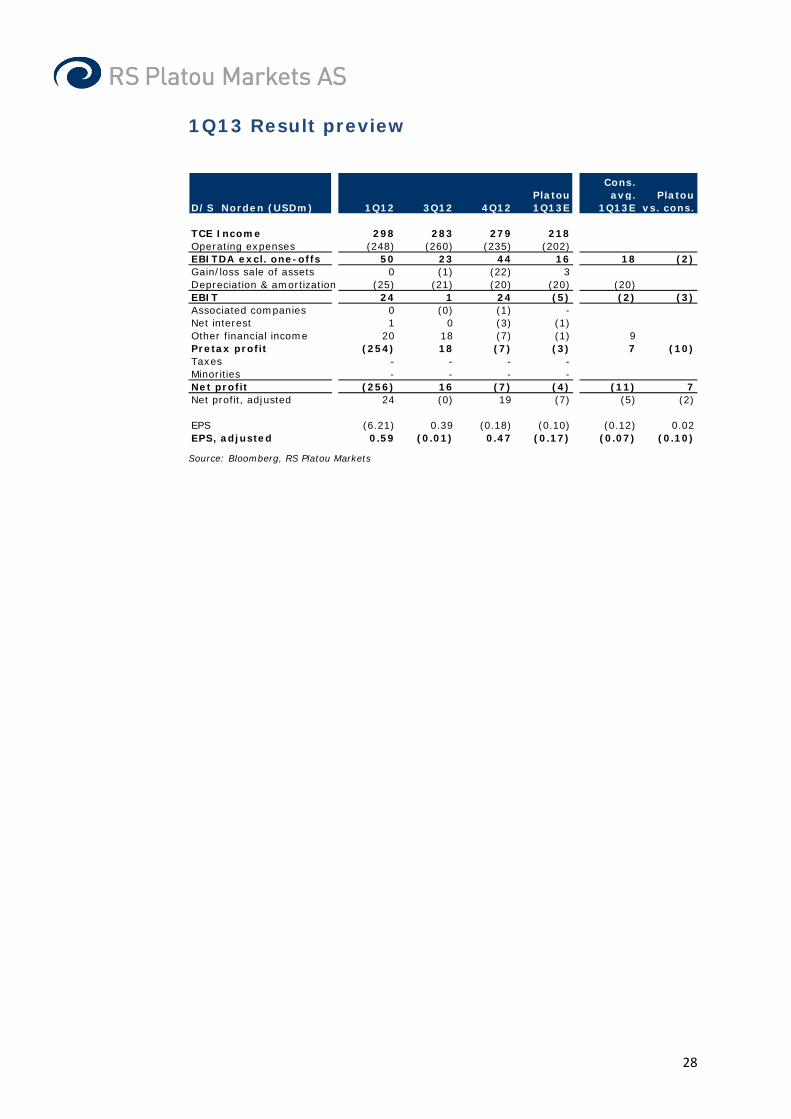
D/S Norden (USDm) 1Q12 3Q12 4Q12Platou 1Q13E
Cons. avg.
1Q13EPlatou
vs. cons.
TCE Income 298 283 279 218Operating expenses (248) (260) (235) (202)EBITDA excl. one-offs 50 23 44 16 18 (2)Gain/loss sale of assets 0 (1) (22) 3Depreciation & amortization (25) (21) (20) (20) (20)EBIT 24 1 24 (5) (2) (3)Associated companies 0 (0) (1) -Net interest 1 0 (3) (1)Other financial income 20 18 (7) (1) 9Pretax profit (254) 18 (7) (3) 7 (10)Taxes - - - -Minorities - - - -Net profit (256) 16 (7) (4) (11) 7Net profit, adjusted 24 (0) 19 (7) (5) (2)
EPS (6.21) 0.39 (0.18) (0.10) (0.12) 0.02EPS, adjusted 0.59 (0.01) 0.47 (0.17) (0.07) (0.10)

29
Profit and loss (USDm) 2009 2010 2011 2012 2013E 2014E 2015ETotal revenue 1,676 2,190 2,273 2,131 1,622 1,899 2,461Voyage expenses & commissions -451 -617 -900 -997 -751 -880 -1,142Time-charter equivalent 1,225 1,572 1,373 1,134 871 1,019 1,319
Operating expenses -1,100 -1,333 -1,187 -986 -810 -900 -1,080
EBITDA, adj. 126 240 186 148 60 119 239Gain/loss sale of assets 70 28 0 -24 3 0 0EBITDA 195 268 186 124 63 119 239Depreciation -36 -50 -81 -89 -82 -88 -91Amortization/Write down -3 0 0 -300 0 0 0EBIT 156 218 105 -265 -19 30 149EBIT, adj. 90 190 105 59 -22 30 149
Associated companies 1 4 -1 -1 0 0 0Net interest 7 -2 4 -2 -4 -4 -4Gains/losses on securities or financial instruments 61 30 -15 -6 0 0 0Other financial Items 0Pre-tax profit 225 251 93 -274 -23 26 145Tax -7 -6 -6 -5 -6 -6 -6Minorities 0 0 0 0 0 0 0Result from discontinued operations/ Other 0 0 0 0 0 0 0Net income 217 245 88 -279 -28 21 139
Adjustments after tax -130 -59 15 30 -3 0 0Adjusted net income 87 186 103 -249 -31 21 139
EPS (USD) 5.16 5.80 2.12 -6.77 -0.69 0.50 3.38EPS, adj. (USD) 2.06 4.42 2.49 -6.03 -0.76 0.50 3.38
Balance sheet (USDm) 2009 2010 2011 2012 2013E 2014E 2015ELong-term interest bearing assets 0 0 0 0 0 0 0Fixed assets 996 1,373 1,613 1,183 1,179 1,114 1,024Other long-term assets 32 35 21 13 13 13 13Long-term assets 1,028 1,408 1,634 1,196 1,192 1,127 1,037
Other current assets 293 229 309 309 237 278 360Cash and liquid assets 711 613 407 529 481 502 651Current assets 1,004 842 716 838 718 779 1,011
Total assets 2,032 2,250 2,350 2,033 1,909 1,907 2,047
Equity 1,805 1,998 1,994 1,687 1,629 1,620 1,729
Minorities 0 0 0 0 0 0 0
Long term interest bearing debt 58 22 135 138 116 98 80Finance obligation 0 0 0 0 0 0 0Other long-term liabilitiesLong term liabilities 58 22 135 138 116 98 80
Short term interest bearing debt 5 44 30 22 22 22 22Other short term liabilities 163 187 191 186 143 167 216Current liabilities 168 230 221 208 165 189 238
Total liabilities and equity 2,032 2,250 2,350 2,033 1,909 1,907 2,047
Working capital 130 43 118 123 95 111 144Net debt -647 -547 -242 -368 -343 -381 -549
Cash flow (USDm) 2009 2010 2011 2012 2013E 2014E 2015EPre-tax profit 225 251 93 -274 -23 26 145- Associated companies -1 -4 1 1 0 0 0+ Depreciation and amortization 39 50 81 389 82 88 91- Payable tax -7 -6 -6 -5 -6 -6 -6+/- Other operating items 13 -79 -32 17 -3 0 0Cash flow from operations 269 211 138 128 51 109 230
Change in working capital -109 87 -75 -6 29 -16 -33Operating cash flow 160 298 62 122 79 93 197
Maintenance capex 0 0 0 0 0 0 0Growth capex -533 -660 -383 -150 -124 -24 0Acquisition capex 2 -39 -25 -12 0 0 0Sale of assets 451 319 35 169 49 0 0Cash flow from investments -80 -380 -373 7 -75 -24 0
Free cash flow 80 -82 -310 129 4 69 197
Dividend paid -98 -53 -60 -29 -30 -30 -30Share buy back -10 -8 -32 0 0 0 0Equity increase 0 0 0 0 0 0 0Cash flow from financing -107 -60 -92 -29 -30 -30 -30
Other items -63 42 97 26 0 0 0
Change in net debt 91 100 305 -126 26 -39 -167

30
Analyst: Frode Mørkedal Tel: +47 22 01 63 27 E-mail: [email protected] Next report date: 29.04.2013 Disclosure:
Analyst: Herman Hildan Tel: +47 22 01 63 53 E-mail: [email protected]
Little happening while deleveragingDanaos is expected to report 1Q13 figures April 29th. We expect somewhat lower results quarter on quarter dueto idle vessels. The problem for the stock is that theCompany is unable to grow unless new equity is raised. Lacking company specific triggers, the share needsmarket momentum to lift the price, which is unlikely tohappen in 2013 given the poor supply-demand balance.
• Earnings: We expect flat time-charter market in 2013 vs. 2012 (about $10,000/day for 4500 TEU vessels). We lookfor EBITDA of USD 107m and net profit of USD 11m in 1Q.
• Valuation: We estimate nominal EBITDA backlog of approx. USD 3.6bn. At the end of the 9 year duration, thefleet would be 18 years of age on average, or approx. USD1.7bn of value. The net present value of this stream plusterminal value at 8% is USD 3.3bn. Compared with current debt level of USD 3.3bn there is little equity value based on the firm backlog and residual value. However, including re-chartering of the approx. 25-30% open days, we find fairDCF value of $2.3 per share. Our price target of $3.5 pershare reflects EV/EBITDA 7.7x ‘14e and 6.6x ‘15e.
Danaos is essentially using 90% of all cash flows to repay debt. The goal is to deleverage from 7.7x net debt/EBITDA in 2012 to below 6x (likely in 2015) before dividends can be reinstated. Unless new equity is raised to acquire new vessels we see few triggers in the near term for the share price, hence we reiterate Neutral.
DanaosSector: Marine
Recommendation: NEUTRAL (unchanged)
Target price (USD): 3.5 (unchanged)
Company descriptionDanaos Corporation is one of the biggest indepenedent owner of containerships. The Non Operating Owner is engaged in chartering out its vessels to operating companies on long term charters and has a current fleet of 62 vessels with further 2 on order.
2.0
2.5
3.0
3.5
4.0
4.5
5.0
apr. 12 jun. 12 aug.12
okt. 12 des. 12 feb. 13 apr. 13
Share price (USD) in Danaos relative to key indices
Danaos S&P 500 Index (Rebased)
Shareholders Shares VotesJohn Coustas 61.9 % 61.9 %George Economou 10.5 % 10.5 %Acclaim Shipping 7.4 % 7.4 %
Free Float 38.1 % 38.1 %
Changes in estimates (USDm)2013E 2014E
New Old Chg. New Old Chg.Oper. revenue 592 592 0% 603 603 0%EBITDA, adj. 428 428 0% 437 437 0%EBIT, adj. 290 290 0% 299 299 0%Net income, adj. 45 45 0% 69 69 0%EPS, adj. (USD) 0.4 0.4 0% 0.6 0.6 0%
Company data (2013E)Share price (USD) 3.84No. of shares (m) 109.0Market cap. (USDm) 418Net debt YE (USDm) 3 167Enterprise value (USDm) 3 586
Description of adjustments: Sale of assets, agio/disagio and gain/losses on financial instruments
Key figures 2009 2010 2011 2012 2013E 2014E 2015ERevenue (USDm) 320 360 468 589 592 603 626EBITDA (USDm) 205 171 317 302 428 437 454EBITDA, adj. (USDm) 205 240 317 432 428 437 454EBIT, adj. (USDm) 144 163 205 282 290 299 316Pre-tax profit, adj. (USDm) 111 53 25 -88 45 69 206Net income, adj. (USDm) 102 116 25 42 45 69 206EPS, adj. (USD) 1.88 1.53 0.23 0.38 0.42 0.63 1.89OCFPS (USD) 1.7 1.0 0.5 1.5 1.7 1.9 3.2FCFPS (USD) -5.1 -6.7 -5.4 -1.9 1.6 1.8 3.1BVPS (USD) 7.4 5.2 4.1 4.0 4.5 5.1 7.0Net asset value (NAV) (USD) 0.0 0.0 0.0 2.3 0.0 0.0 0.0Dividend (USD) 0.00 0.00 0.00 0.00 0.00 0.00 0.00EV/EBITDA, adj. (x) 11.7 10.9 10.5 8.4 8.4 7.8 6.7EV/EBIT, adj. (x) 16.7 16.0 16.2 12.9 12.3 11.4 9.7P/E, adj. (x) 2.4 2.4 14.3 7.2 9.3 6.1 2.0P/OCF (x) 2.6 3.6 6.1 1.8 2.3 2.0 1.2EV/FCF (x) n.m. n.m. n.m. n.m. 20.4 17.4 9.1P/Book (x) 0.6 0.7 0.8 0.7 0.9 0.8 0.6P/NAV (x) n.m. n.m. n.m. 1.2 n.m. n.m. n.m.Dividend yield (%) 0.0 0.0 0.0 0.0 0.0 0.0 0.0
Key Assumptions 2009 2010 2011 2012 2013E 2014E 2015E4800 TEU 15 500 20 100 10 200 10 000 14 000 18 0003500 TEU 11 000 14 000 8 000 8 000 10 000 13 000
Result Preview 15-Apr-13
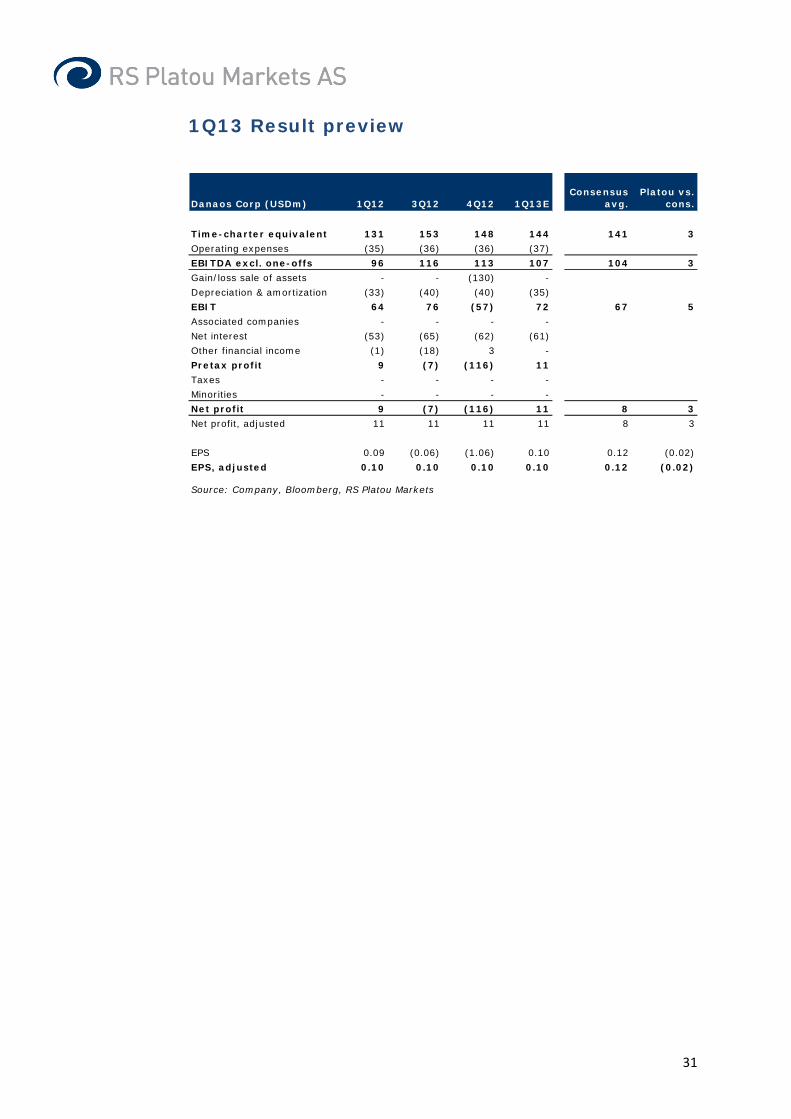
31
1Q13 Result preview
Danaos Corp (USDm) 1Q12 3Q12 4Q12 1Q13EConsensus
avg.Platou vs.
cons.
Time-charter equivalent 131 153 148 144 141 3
Operating expenses (35) (36) (36) (37)
EBITDA excl. one-offs 96 116 113 107 104 3
Gain/loss sale of assets - - (130) -
Depreciation & amortization (33) (40) (40) (35)
EBIT 64 76 (57) 72 67 5
Associated companies - - - -
Net interest (53) (65) (62) (61)
Other financial income (1) (18) 3 -
Pretax profit 9 (7) (116) 11
Taxes - - - -
Minorities - - - -
Net profit 9 (7) (116) 11 8 3
Net profit, adjusted 11 11 11 11 8 3
EPS 0.09 (0.06) (1.06) 0.10 0.12 (0.02)
EPS, adjusted 0.10 0.10 0.10 0.10 0.12 (0.02)
Source: Company, Bloomberg, RS Platou Markets
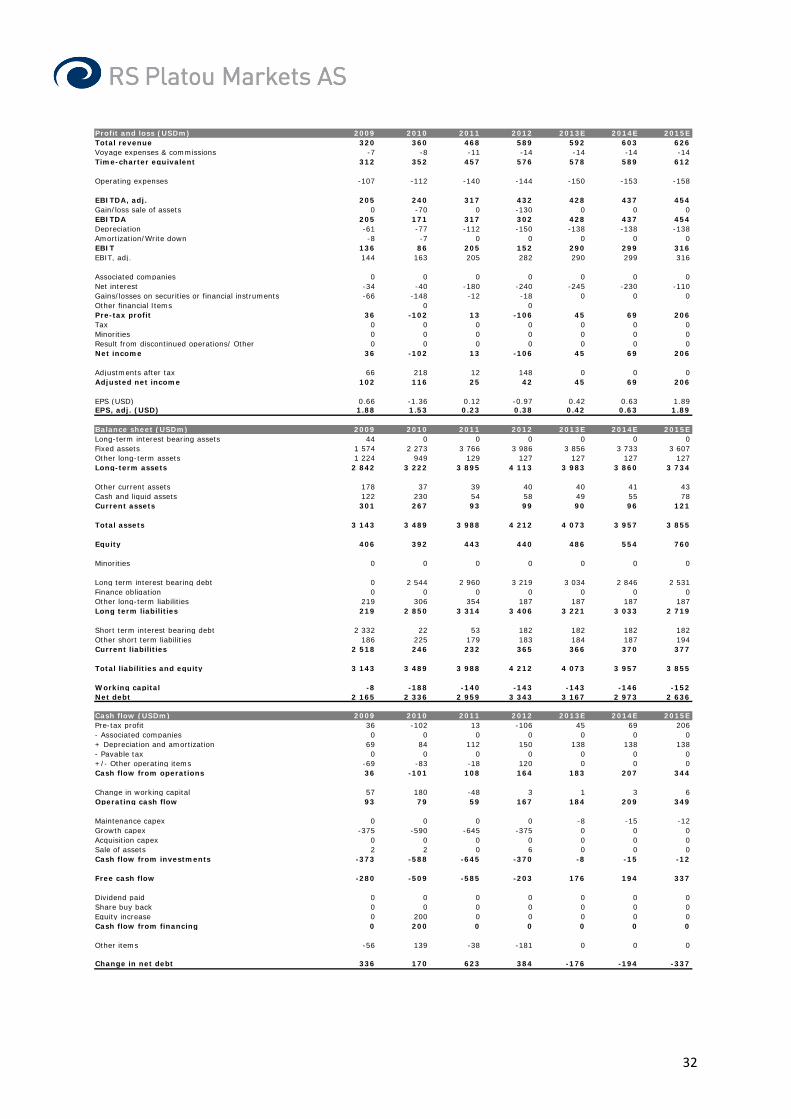
32
Profit and loss (USDm) 2009 2010 2011 2012 2013E 2014E 2015ETotal revenue 320 360 468 589 592 603 626Voyage expenses & commissions -7 -8 -11 -14 -14 -14 -14Time-charter equivalent 312 352 457 576 578 589 612
Operating expenses -107 -112 -140 -144 -150 -153 -158
EBITDA, adj. 205 240 317 432 428 437 454Gain/loss sale of assets 0 -70 0 -130 0 0 0EBITDA 205 171 317 302 428 437 454Depreciation -61 -77 -112 -150 -138 -138 -138Amortization/Write down -8 -7 0 0 0 0 0EBIT 136 86 205 152 290 299 316EBIT, adj. 144 163 205 282 290 299 316
Associated companies 0 0 0 0 0 0 0Net interest -34 -40 -180 -240 -245 -230 -110Gains/losses on securities or financial instruments -66 -148 -12 -18 0 0 0Other financial Items 0 0Pre-tax profit 36 -102 13 -106 45 69 206Tax 0 0 0 0 0 0 0Minorities 0 0 0 0 0 0 0Result from discontinued operations/ Other 0 0 0 0 0 0 0Net income 36 -102 13 -106 45 69 206
Adjustments after tax 66 218 12 148 0 0 0Adjusted net income 102 116 25 42 45 69 206
EPS (USD) 0.66 -1.36 0.12 -0.97 0.42 0.63 1.89EPS, adj. (USD) 1.88 1.53 0.23 0.38 0.42 0.63 1.89
Balance sheet (USDm) 2009 2010 2011 2012 2013E 2014E 2015ELong-term interest bearing assets 44 0 0 0 0 0 0Fixed assets 1 574 2 273 3 766 3 986 3 856 3 733 3 607Other long-term assets 1 224 949 129 127 127 127 127Long-term assets 2 842 3 222 3 895 4 113 3 983 3 860 3 734
Other current assets 178 37 39 40 40 41 43Cash and liquid assets 122 230 54 58 49 55 78Current assets 301 267 93 99 90 96 121
Total assets 3 143 3 489 3 988 4 212 4 073 3 957 3 855
Equity 406 392 443 440 486 554 760
Minorities 0 0 0 0 0 0 0
Long term interest bearing debt 0 2 544 2 960 3 219 3 034 2 846 2 531Finance obligation 0 0 0 0 0 0 0Other long-term liabilities 219 306 354 187 187 187 187Long term liabilities 219 2 850 3 314 3 406 3 221 3 033 2 719
Short term interest bearing debt 2 332 22 53 182 182 182 182Other short term liabilities 186 225 179 183 184 187 194Current liabilities 2 518 246 232 365 366 370 377
Total liabilities and equity 3 143 3 489 3 988 4 212 4 073 3 957 3 855
Working capital -8 -188 -140 -143 -143 -146 -152Net debt 2 165 2 336 2 959 3 343 3 167 2 973 2 636
Cash flow (USDm) 2009 2010 2011 2012 2013E 2014E 2015EPre-tax profit 36 -102 13 -106 45 69 206- Associated companies 0 0 0 0 0 0 0+ Depreciation and amortization 69 84 112 150 138 138 138- Payable tax 0 0 0 0 0 0 0+/- Other operating items -69 -83 -18 120 0 0 0Cash flow from operations 36 -101 108 164 183 207 344
Change in working capital 57 180 -48 3 1 3 6Operating cash flow 93 79 59 167 184 209 349
Maintenance capex 0 0 0 0 -8 -15 -12Growth capex -375 -590 -645 -375 0 0 0Acquisition capex 0 0 0 0 0 0 0Sale of assets 2 2 0 6 0 0 0Cash flow from investments -373 -588 -645 -370 -8 -15 -12
Free cash flow -280 -509 -585 -203 176 194 337
Dividend paid 0 0 0 0 0 0 0Share buy back 0 0 0 0 0 0 0Equity increase 0 200 0 0 0 0 0Cash flow from financing 0 200 0 0 0 0 0
Other items -56 139 -38 -181 0 0 0
Change in net debt 336 170 623 384 -176 -194 -337

33
Analyst: Frode Mørkedal Tel: +47 22 01 63 27 E-mail: [email protected] Next report date: 00.00.0000 Disclosure:
Analyst: Herman Hildan Tel: +47 22 01 63 53 E-mail: [email protected]
OSG legacy settled, growth next? DHT has been through a busy quarter with sale of the OSG claim and 3 more vessels entering the spot market.However, with the OSG settlement concluded the focusmay turn to growth as we believe the crude tankermarket will bottom out in 2013. We reiterate BUY andraise our target price to USD 7/sh, reflecting the impactfrom the OSG settlement.
• 1Q13 numbers: We expect DHT to report revenue of USD 13m and EBITDA of USD 3m, below consensus at USD 14mand USD 5m respectively. Overseas Ann, Newcastle andLondon entered the spot market in 1Q13, consequently we model in USD 14m higher working capital.
• Settlement: DHT entered into an Assignment of Claims related to the claims against OSG, where Citibank acquiredthe USD 52m claim for 33.25%. USD 6.9m will be paidinitially and the remaining once the claim has been allowed by court. This lifts our NAV by USD 1.1/share, hence thehigher target price.
• Balance sheet: DHT has no scheduled debt repayments until 2015, generating an industry low cash-breakeven of $14,000/day. However, the Company has repaid debt to stay in compliance with covenants, which may be amendedas the Company turns focus to growth ahead.
• Valuation: We estimate DHT NAV at USD 7.7/share and 2x EV/EBITDA on 20 year average rates, including a ratediscount on older vessels.
We reiterate BUY and increase TP to USD 7/sh.
DHT HoldingsSector: Marine
Recommendation: BUY (unchanged)
Target price (USD): 7.0 (6.0)
Company descriptionUS Listed tanker company formed in 2005 after spin-off from Overseas Shipholding Group. Owns 5 VLCCs, 2 Suezmax vessels and 2 Aframax vessels with ~11 years average age.
0
2
4
6
8
10
12
Apr12
May12
Jun12
Jul12
Aug12
Sep12
Oct12
Nov12
Dec12
Jan13
Feb13
Mar13
Apr13
Share price in DHT relative to key indices
DHT S&P 500 index (rebased)
Shareholders Shares VotesAnchorage Capital Group 32.0 % 32.0 %
Free Float 68.0 % 68.0 %
Changes in estimates (USDm)2013E 2014E
New Old Chg. New Old Chg.Oper. revenue 66 66 1% 80 80 0%EBITDA, adj. 18 18 2% 30 30 0%EBIT, adj. -12 -12 3% -2 -2 0%Net income, adj. -17 -17 2% -6 -6 0%EPS, adj. (USD) -1.1 -1.1 2% -0.4 -0.4 0%
Company data (2013E)Share price (USD) 4.75No. of shares (m) 15.4Market cap. (USDm) 73Net debt YE (USDm) 149Enterprise value (USDm) 222
Description of adjustments: Sale of assets, agio/disagio and gain/losses on financial instruments
Key figures 2009 2010 2011 2012 2013E 2014E 2015ERevenue (USDm) 103 90 100 97 66 80 132EBITDA (USDm) 68 52 53 43 18 30 77EBITDA, adj. (USDm) 68 52 53 45 18 30 77EBIT, adj. (USDm) 41 23 22 13 -12 -2 44Pre-tax profit, adj. (USDm) 23 10 15 4 -17 -6 41Net income, adj. (USDm) 23 10 -41 6 -17 -6 40EPS, adj. (USD) 0.50 0.20 -0.65 0.51 -1.09 -0.42 2.62OCFPS (USD) 1.2 0.7 0.7 1.9 -0.8 1.1 2.8FCFPS (USD) 1.1 0.6 -1.2 2.7 -0.9 1.6 2.7BVPS (USD) 3.9 4.0 3.2 11.7 10.6 10.1 12.6Net asset value (NAV) (USD) 0.0 7.7 7.7 7.7 0.0 0.0 0.0Dividend (USD) 0.60 0.40 0.26 0.52 0.08 0.08 0.08EV/EBITDA, adj. (x) 5.9 8.4 5.4 4.5 12.2 6.7 2.1EV/EBIT, adj. (x) 9.7 18.7 12.7 15.4 n.m. n.m. 3.6P/E, adj. (x) 7.3 23.1 n.m. 8.0 n.m. n.m. 1.8P/OCF (x) 3.1 6.6 1.1 2.2 n.m. 4.3 1.7EV/FCF (x) 8.0 15.2 n.m. 6.2 n.m. 8.0 3.9P/Book (x) 0.9 1.2 0.2 0.3 0.4 0.5 0.4P/NAV (x) n.m. 0.6 0.1 0.5 n.m. n.m. n.m.Dividend yield (%) 16.3 8.6 35.1 12.7 1.7 1.7 1.7
Key Assumptions 2009 2010 2011 2012 2013E 2014E 2015EVLCC spot USD/Day 28,000 34,500 18,000 21,000 20,000 25,000 43,000Suezmax spot USD/Day 25,900 28,000 15,000 16,000 18,000 22,000 34,000Aframax spot USD/Day 14,900 21,000 11,000 12,000 15,000 18,000 28,000
Result Preview 15-Apr-13

34
1Q13 Result preview
Source: Bloomberg, RS Platou Markets
DHT Holdings (USDm) 1Q12 3Q12 4Q12Platou 1Q13E
Cons. 1Q13E
PLA vs. Cons
TCE Income 28 18 17 13 14 (1)Operating expenses (12) (11) (7) (10) (9) (0)EBITDA excl. one-offs 16 7 10 3 5 (1)Gain/loss sale of assets (1) - - -Depreciation & amortization (7) (11) (8) (8) (7) (0)Amortization - (93) (8) -EBIT adj. 9 (3) 2 (4) (3) (2)Associated companies - - - -Net interest (2) (2) (2) (1) 0 (1)Other financial income 0 1 1 -Pretax profit 6 (97) (6) (5) (2) (3)Taxes - (0) (0) - (1) 1Minorities - - - -Net profit 6 (97) (6) (5) (3) (2)Net profit, adjusted 7 (5) 1 (5) (4) (2)
EPS 0.10 (6.27) (0.41) (0.35) (0.20) (0.15)EPS, adjusted 0.11 (0.32) 0.04 (0.35) (0.23) (0.12)
Dividend 0.02 0.02 0.02 0.02 0.02 0.00
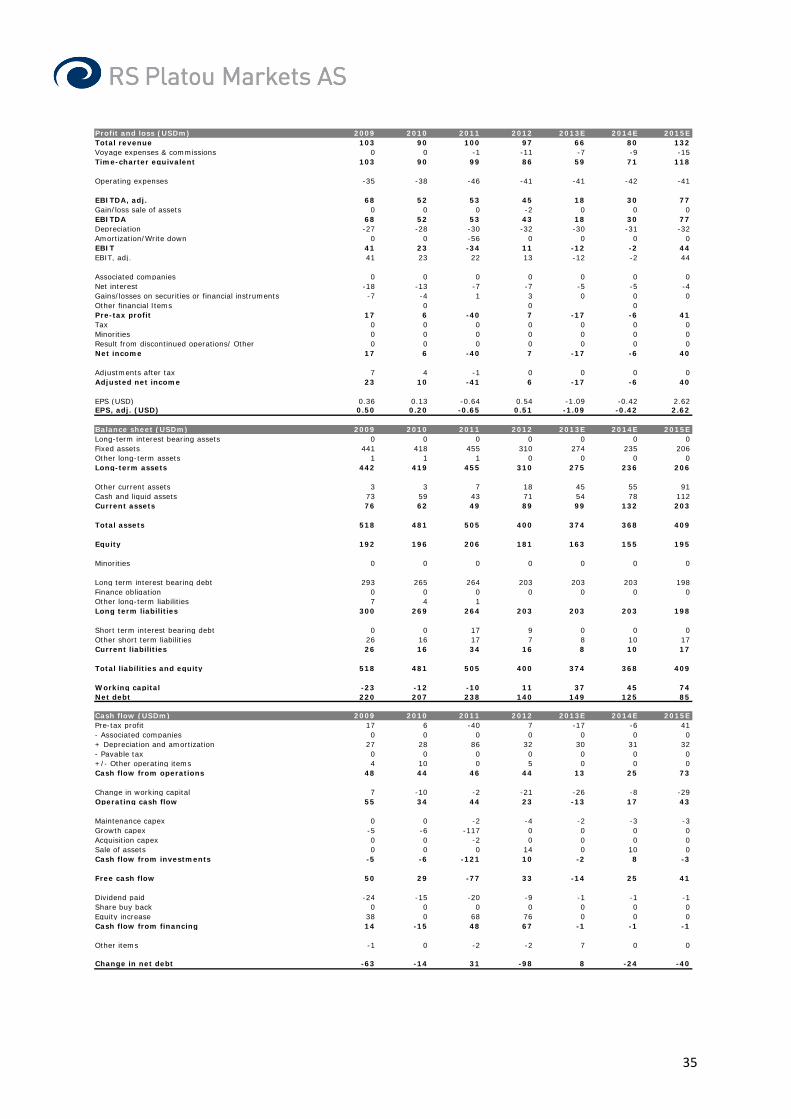
35
Profit and loss (USDm) 2009 2010 2011 2012 2013E 2014E 2015ETotal revenue 103 90 100 97 66 80 132Voyage expenses & commissions 0 0 -1 -11 -7 -9 -15Time-charter equivalent 103 90 99 86 59 71 118
Operating expenses -35 -38 -46 -41 -41 -42 -41
EBITDA, adj. 68 52 53 45 18 30 77Gain/loss sale of assets 0 0 0 -2 0 0 0EBITDA 68 52 53 43 18 30 77Depreciation -27 -28 -30 -32 -30 -31 -32Amortization/Write down 0 0 -56 0 0 0 0EBIT 41 23 -34 11 -12 -2 44EBIT, adj. 41 23 22 13 -12 -2 44
Associated companies 0 0 0 0 0 0 0Net interest -18 -13 -7 -7 -5 -5 -4Gains/losses on securities or financial instruments -7 -4 1 3 0 0 0Other financial Items 0 0 0Pre-tax profit 17 6 -40 7 -17 -6 41Tax 0 0 0 0 0 0 0Minorities 0 0 0 0 0 0 0Result from discontinued operations/ Other 0 0 0 0 0 0 0Net income 17 6 -40 7 -17 -6 40
Adjustments after tax 7 4 -1 0 0 0 0Adjusted net income 23 10 -41 6 -17 -6 40
EPS (USD) 0.36 0.13 -0.64 0.54 -1.09 -0.42 2.62EPS, adj. (USD) 0.50 0.20 -0.65 0.51 -1.09 -0.42 2.62
Balance sheet (USDm) 2009 2010 2011 2012 2013E 2014E 2015ELong-term interest bearing assets 0 0 0 0 0 0 0Fixed assets 441 418 455 310 274 235 206Other long-term assets 1 1 1 0 0 0 0Long-term assets 442 419 455 310 275 236 206
Other current assets 3 3 7 18 45 55 91Cash and liquid assets 73 59 43 71 54 78 112Current assets 76 62 49 89 99 132 203
Total assets 518 481 505 400 374 368 409
Equity 192 196 206 181 163 155 195
Minorities 0 0 0 0 0 0 0
Long term interest bearing debt 293 265 264 203 203 203 198Finance obligation 0 0 0 0 0 0 0Other long-term liabilities 7 4 1Long term liabilities 300 269 264 203 203 203 198
Short term interest bearing debt 0 0 17 9 0 0 0Other short term liabilities 26 16 17 7 8 10 17Current liabilities 26 16 34 16 8 10 17
Total liabilities and equity 518 481 505 400 374 368 409
Working capital -23 -12 -10 11 37 45 74Net debt 220 207 238 140 149 125 85
Cash flow (USDm) 2009 2010 2011 2012 2013E 2014E 2015EPre-tax profit 17 6 -40 7 -17 -6 41- Associated companies 0 0 0 0 0 0 0+ Depreciation and amortization 27 28 86 32 30 31 32- Payable tax 0 0 0 0 0 0 0+/- Other operating items 4 10 0 5 0 0 0Cash flow from operations 48 44 46 44 13 25 73
Change in working capital 7 -10 -2 -21 -26 -8 -29Operating cash flow 55 34 44 23 -13 17 43
Maintenance capex 0 0 -2 -4 -2 -3 -3Growth capex -5 -6 -117 0 0 0 0Acquisition capex 0 0 -2 0 0 0 0Sale of assets 0 0 0 14 0 10 0Cash flow from investments -5 -6 -121 10 -2 8 -3
Free cash flow 50 29 -77 33 -14 25 41
Dividend paid -24 -15 -20 -9 -1 -1 -1Share buy back 0 0 0 0 0 0 0Equity increase 38 0 68 76 0 0 0Cash flow from financing 14 -15 48 67 -1 -1 -1
Other items -1 0 -2 -2 7 0 0
Change in net debt -63 -14 31 -98 8 -24 -40

36
Analyst: Frode Mørkedal Tel: +47 22 01 63 27 E-mail: [email protected] Next report date: 02.05.2013 Disclosure:
Analyst: Herman Hildan Tel: +47 22 01 63 53 E-mail: [email protected]
Upgrade to Neutral Since we downgraded to Sell in February, the stock hasdeclined 25%. Valuation now appears fair but we findconsensus expectations for both earnings and dividendstoo high. Charter renewals will be concluded at much lower levels and the Company is likely to cut thedividend from 30 cents to 15 cents, in our view. Given ayield of 11% even at the halved dividend payment, wechange to Neutral.
• 1Q13 expectations: We expect little change in the quarterly figures, with EBITDA of USD 6m and EPS of 4cents. However, we believe DCIX will cut the dividend to 15cents. Looking at consensus figures, EBITDA for 2013 isUSD 24m which is too high compared with our USD 14m.DCIX has 3x 4,700 TEU vessels that are 22-23 years of age currently on charter to Maersk at $21,450/day that runsout during May 2013. We have assumed these are renewed at a lower rate of $10,000/day.
• Low leverage: DCIX has low leverage at 50% LTV (USD 92m credit facility divided by charter-free value of USD 183m). DCIX’s cash-break even is on average $11,500/day, according to our calculations reflectingessentially opex and interest costs. Further growth requires new equity, in our view.
Weaker earnings and the structural risk for tonnage providers with old assets are factors pulling the stock down. However, after the recent sell off the stock is now in Neutral territory, hence our change of rating.
Diana ContainershipsSector: Marine
Recommendation: NEUTRAL (Sell)
Target price (USD): 6.0 (unchanged)
Company descriptionDiana Containerships (DCIX US) is a US listed non operating owner founded in 2010 to own and operate containerships and pursue containership acquisition opportunities. The company owns 10 vessels.
4.5
5.0
5.5
6.0
6.5
7.0
7.5
8.0
apr. 12 jun. 12 aug.12
okt. 12 des. 12 feb. 13 apr. 13
Share price (USD) in Diana Containerships relative to key indices
Diana Containerships S&P 500 Index (Rebased)
Shareholders Shares VotesDiana Shipping Inc 10.4 % 10.4 %
Free Float 89.6 % 89.6 %
Changes in estimates (USDm)2013E 2014E
New Old Chg. New Old Chg.Oper. revenue 55 50 9% 55 49 12%EBITDA, adj. 14 12 19% 12 10 29%EBIT, adj. -1 -3 56% -3 -5 36%Net income, adj. -4 -6 34% -6 -8 28%EPS, adj. (USD) -0.1 -0.2 34% -0.2 -0.3 27%
Company data (2013E)Share price (USD) 5.29No. of shares (m) 32.1Market cap. (USDm) 170Net debt YE (USDm) 80Enterprise value (USDm) 250
Description of adjustments: Sale of assets, agio/disagio and gain/losses on financial instruments
Key figures 2011 2012 2013E 2014E 2015ERevenue (USDm) 27 57 55 55 65EBITDA (USDm) 11 21 14 12 21EBITDA, adj. (USDm) 11 21 14 12 21EBIT, adj. (USDm) 5 9 -1 -3 6Pre-tax profit, adj. (USDm) 4 6 -4 -6 3Net income, adj. (USDm) 4 6 -4 -6 3EPS, adj. (USD) 0.23 0.21 -0.13 -0.19 0.08OCFPS (USD) 0.8 1.2 0.9 0.7 0.7FCFPS (USD) -4.3 -4.4 0.2 0.6 0.7BVPS (USD) 9.0 7.4 6.5 5.8 5.2Net asset value (NAV) (USD) 5.7 5.7 5.7 5.7 5.7Dividend (USD) 0.33 1.15 0.60 0.60 0.60EV/EBITDA, adj. (x) 7.6 12.0 17.9 20.2 11.7EV/EBIT, adj. (x) 16.5 29.0 n.m. n.m. 43.1P/E, adj. (x) 23.4 28.2 n.m. n.m. 62.4P/OCF (x) 6.9 5.2 5.9 7.7 7.1EV/FCF (x) n.m. n.m. 51.2 12.6 11.4P/Book (x) 0.6 0.8 0.8 0.9 1.0P/NAV (x) 0.9 1.1 0.9 0.9 0.9Dividend yield (%) 6.1 19.0 11.3 11.3 11.3
Key Assumptions 2011 2012 2013E 2014E 2015E3,500 TEU (USD/day) 8 000 8 000 10 000 14 0004,500 TEU (USD/day) 10 000 10 000 14 000 18 000
Result Preview 15-Apr-13
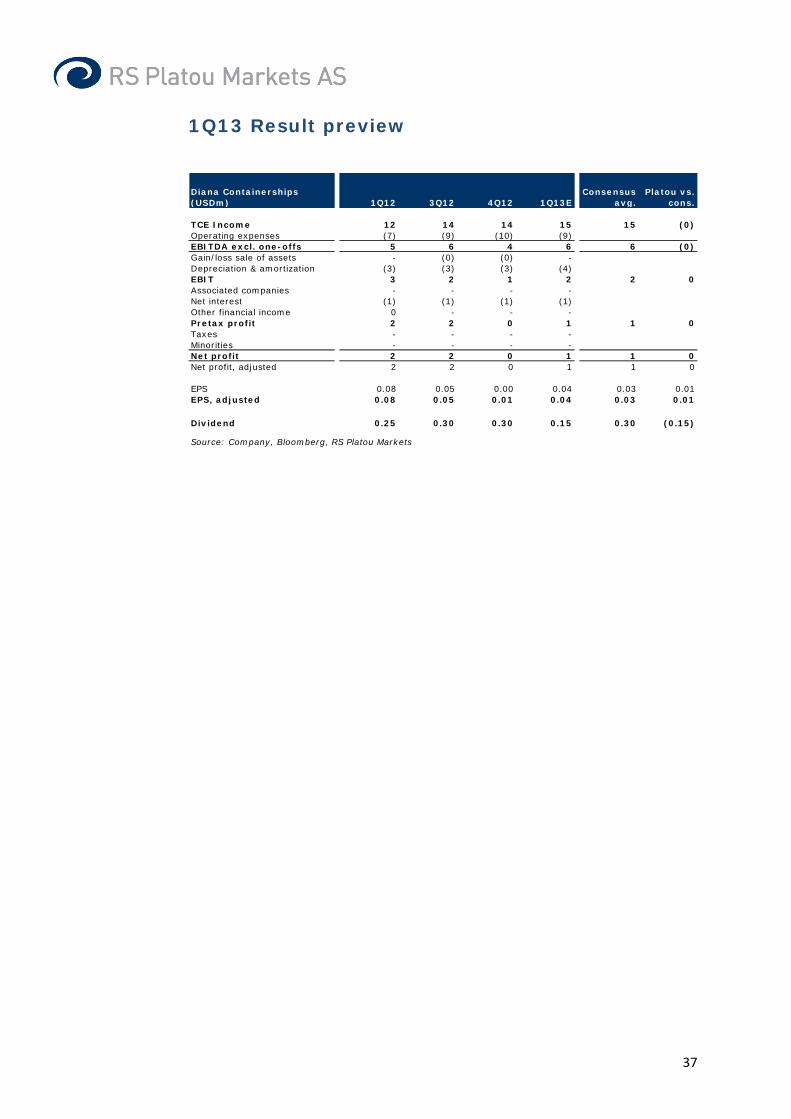
37
1Q13 Result preview
Diana Containerships(USDm) 1Q12 3Q12 4Q12 1Q13E
Consensus avg.
Platou vs. cons.
TCE Income 12 14 14 15 15 (0)Operating expenses (7) (9) (10) (9)EBITDA excl. one-offs 5 6 4 6 6 (0)Gain/loss sale of assets - (0) (0) -Depreciation & amortization (3) (3) (3) (4)EBIT 3 2 1 2 2 0Associated companies - - - -Net interest (1) (1) (1) (1)Other financial income 0 - - -Pretax profit 2 2 0 1 1 0Taxes - - - -Minorities - - - -Net profit 2 2 0 1 1 0Net profit, adjusted 2 2 0 1 1 0
EPS 0.08 0.05 0.00 0.04 0.03 0.01EPS, adjusted 0.08 0.05 0.01 0.04 0.03 0.01
Dividend 0.25 0.30 0.30 0.15 0.30 (0.15)
Source: Company, Bloomberg, RS Platou Markets
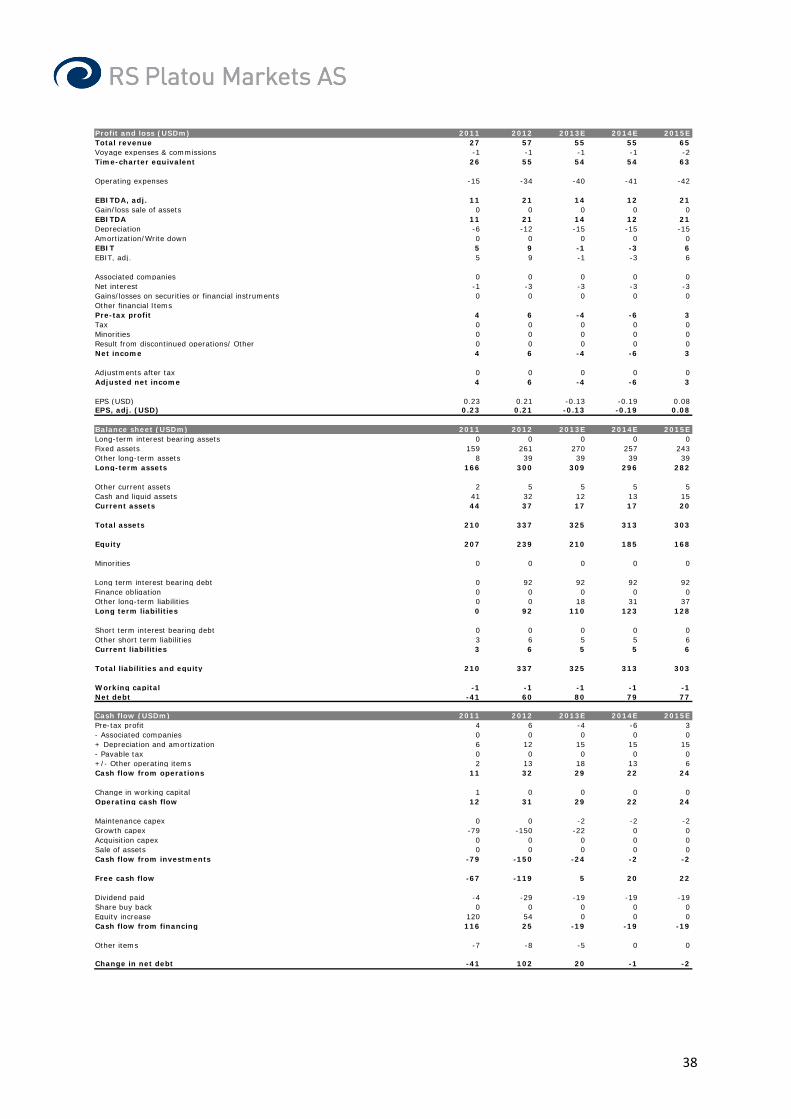
38
Profit and loss (USDm) 2011 2012 2013E 2014E 2015ETotal revenue 27 57 55 55 65Voyage expenses & commissions -1 -1 -1 -1 -2Time-charter equivalent 26 55 54 54 63
Operating expenses -15 -34 -40 -41 -42
EBITDA, adj. 11 21 14 12 21Gain/loss sale of assets 0 0 0 0 0EBITDA 11 21 14 12 21Depreciation -6 -12 -15 -15 -15Amortization/Write down 0 0 0 0 0EBIT 5 9 -1 -3 6EBIT, adj. 5 9 -1 -3 6
Associated companies 0 0 0 0 0Net interest -1 -3 -3 -3 -3Gains/losses on securities or financial instruments 0 0 0 0 0Other financial ItemsPre-tax profit 4 6 -4 -6 3Tax 0 0 0 0 0Minorities 0 0 0 0 0Result from discontinued operations/ Other 0 0 0 0 0Net income 4 6 -4 -6 3
Adjustments after tax 0 0 0 0 0Adjusted net income 4 6 -4 -6 3
EPS (USD) 0.23 0.21 -0.13 -0.19 0.08EPS, adj. (USD) 0.23 0.21 -0.13 -0.19 0.08
Balance sheet (USDm) 2011 2012 2013E 2014E 2015ELong-term interest bearing assets 0 0 0 0 0Fixed assets 159 261 270 257 243Other long-term assets 8 39 39 39 39Long-term assets 166 300 309 296 282
Other current assets 2 5 5 5 5Cash and liquid assets 41 32 12 13 15Current assets 44 37 17 17 20
Total assets 210 337 325 313 303
Equity 207 239 210 185 168
Minorities 0 0 0 0 0
Long term interest bearing debt 0 92 92 92 92Finance obligation 0 0 0 0 0Other long-term liabilities 0 0 18 31 37Long term liabilities 0 92 110 123 128
Short term interest bearing debt 0 0 0 0 0Other short term liabilities 3 6 5 5 6Current liabilities 3 6 5 5 6
Total liabilities and equity 210 337 325 313 303
Working capital -1 -1 -1 -1 -1Net debt -41 60 80 79 77
Cash flow (USDm) 2011 2012 2013E 2014E 2015EPre-tax profit 4 6 -4 -6 3- Associated companies 0 0 0 0 0+ Depreciation and amortization 6 12 15 15 15- Payable tax 0 0 0 0 0+/- Other operating items 2 13 18 13 6Cash flow from operations 11 32 29 22 24
Change in working capital 1 0 0 0 0Operating cash flow 12 31 29 22 24
Maintenance capex 0 0 -2 -2 -2Growth capex -79 -150 -22 0 0Acquisition capex 0 0 0 0 0Sale of assets 0 0 0 0 0Cash flow from investments -79 -150 -24 -2 -2
Free cash flow -67 -119 5 20 22
Dividend paid -4 -29 -19 -19 -19Share buy back 0 0 0 0 0Equity increase 120 54 0 0 0Cash flow from financing 116 25 -19 -19 -19
Other items -7 -8 -5 0 0
Change in net debt -41 102 20 -1 -2
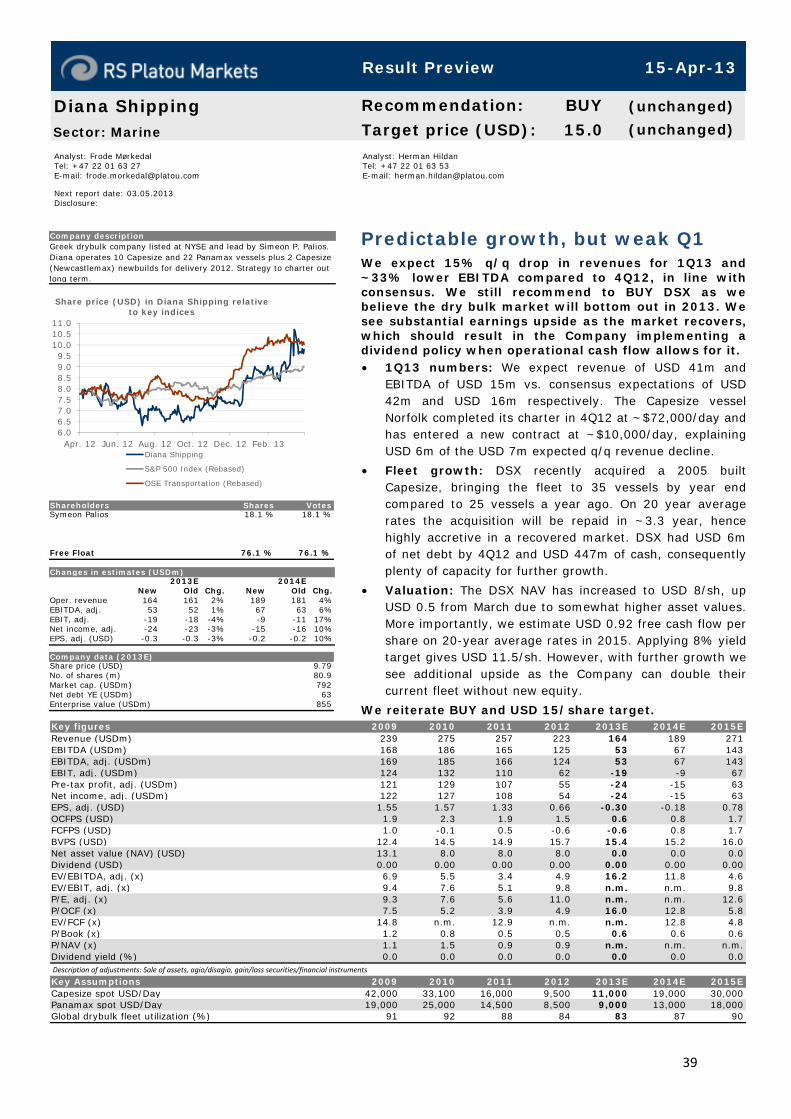
39
Analyst: Frode Mørkedal Tel: +47 22 01 63 27 E-mail: [email protected] Next report date: 03.05.2013 Disclosure:
Analyst: Herman Hildan Tel: +47 22 01 63 53 E-mail: [email protected]
Predictable growth, but weak Q1 We expect 15% q/q drop in revenues for 1Q13 and~33% lower EBITDA compared to 4Q12, in line withconsensus. We still recommend to BUY DSX as webelieve the dry bulk market will bottom out in 2013. Wesee substantial earnings upside as the market recovers,which should result in the Company implementing adividend policy when operational cash flow allows for it. • 1Q13 numbers: We expect revenue of USD 41m and
EBITDA of USD 15m vs. consensus expectations of USD42m and USD 16m respectively. The Capesize vessel Norfolk completed its charter in 4Q12 at ~$72,000/day andhas entered a new contract at ~$10,000/day, explainingUSD 6m of the USD 7m expected q/q revenue decline.
• Fleet growth: DSX recently acquired a 2005 built Capesize, bringing the fleet to 35 vessels by year end compared to 25 vessels a year ago. On 20 year averagerates the acquisition will be repaid in ~3.3 year, hencehighly accretive in a recovered market. DSX had USD 6mof net debt by 4Q12 and USD 447m of cash, consequentlyplenty of capacity for further growth.
• Valuation: The DSX NAV has increased to USD 8/sh, up USD 0.5 from March due to somewhat higher asset values.More importantly, we estimate USD 0.92 free cash flow pershare on 20-year average rates in 2015. Applying 8% yield target gives USD 11.5/sh. However, with further growth we see additional upside as the Company can double theircurrent fleet without new equity.
We reiterate BUY and USD 15/share target.
Diana ShippingSector: Marine
Recommendation: BUY (unchanged)
Target price (USD): 15.0 (unchanged)
Company descriptionGreek drybulk company listed at NYSE and lead by Simeon P. Palios. Diana operates 10 Capesize and 22 Panamax vessels plus 2 Capesize (Newcastlemax) newbuilds for delivery 2012. Strategy to charter out long term.
6.06.57.07.58.08.59.09.5
10.010.511.0
Apr. 12 Jun. 12 Aug. 12 Oct. 12 Dec. 12 Feb. 13
Share price (USD) in Diana Shipping relative to key indices
Diana Shipping
S&P 500 Index (Rebased)
OSE Transportation (Rebased)
Shareholders Shares VotesSymeon Palios 18.1 % 18.1 %
Free Float 76.1 % 76.1 %
Changes in estimates (USDm)2013E 2014E
New Old Chg. New Old Chg.Oper. revenue 164 161 2% 189 181 4%EBITDA, adj. 53 52 1% 67 63 6%EBIT, adj. -19 -18 -4% -9 -11 17%Net income, adj. -24 -23 -3% -15 -16 10%EPS, adj. (USD) -0.3 -0.3 -3% -0.2 -0.2 10%
Company data (2013E)Share price (USD) 9.79No. of shares (m) 80.9Market cap. (USDm) 792Net debt YE (USDm) 63Enterprise value (USDm) 855
Description of adjustments: Sale of assets, agio/disagio, gain/loss securities/financial instruments
Key figures 2009 2010 2011 2012 2013E 2014E 2015ERevenue (USDm) 239 275 257 223 164 189 271EBITDA (USDm) 168 186 165 125 53 67 143EBITDA, adj. (USDm) 169 185 166 124 53 67 143EBIT, adj. (USDm) 124 132 110 62 -19 -9 67Pre-tax profit, adj. (USDm) 121 129 107 55 -24 -15 63Net income, adj. (USDm) 122 127 108 54 -24 -15 63EPS, adj. (USD) 1.55 1.57 1.33 0.66 -0.30 -0.18 0.78OCFPS (USD) 1.9 2.3 1.9 1.5 0.6 0.8 1.7FCFPS (USD) 1.0 -0.1 0.5 -0.6 -0.6 0.8 1.7BVPS (USD) 12.4 14.5 14.9 15.7 15.4 15.2 16.0Net asset value (NAV) (USD) 13.1 8.0 8.0 8.0 0.0 0.0 0.0Dividend (USD) 0.00 0.00 0.00 0.00 0.00 0.00 0.00EV/EBITDA, adj. (x) 6.9 5.5 3.4 4.9 16.2 11.8 4.6EV/EBIT, adj. (x) 9.4 7.6 5.1 9.8 n.m. n.m. 9.8P/E, adj. (x) 9.3 7.6 5.6 11.0 n.m. n.m. 12.6P/OCF (x) 7.5 5.2 3.9 4.9 16.0 12.8 5.8EV/FCF (x) 14.8 n.m. 12.9 n.m. n.m. 12.8 4.8P/Book (x) 1.2 0.8 0.5 0.5 0.6 0.6 0.6P/NAV (x) 1.1 1.5 0.9 0.9 n.m. n.m. n.m.Dividend yield (%) 0.0 0.0 0.0 0.0 0.0 0.0 0.0
Key Assumptions 2009 2010 2011 2012 2013E 2014E 2015ECapesize spot USD/Day 42,000 33,100 16,000 9,500 11,000 19,000 30,000Panamax spot USD/Day 19,000 25,000 14,500 8,500 9,000 13,000 18,000Global drybulk fleet utilization (%) 91 92 88 84 83 87 90
Result Preview 15-Apr-13
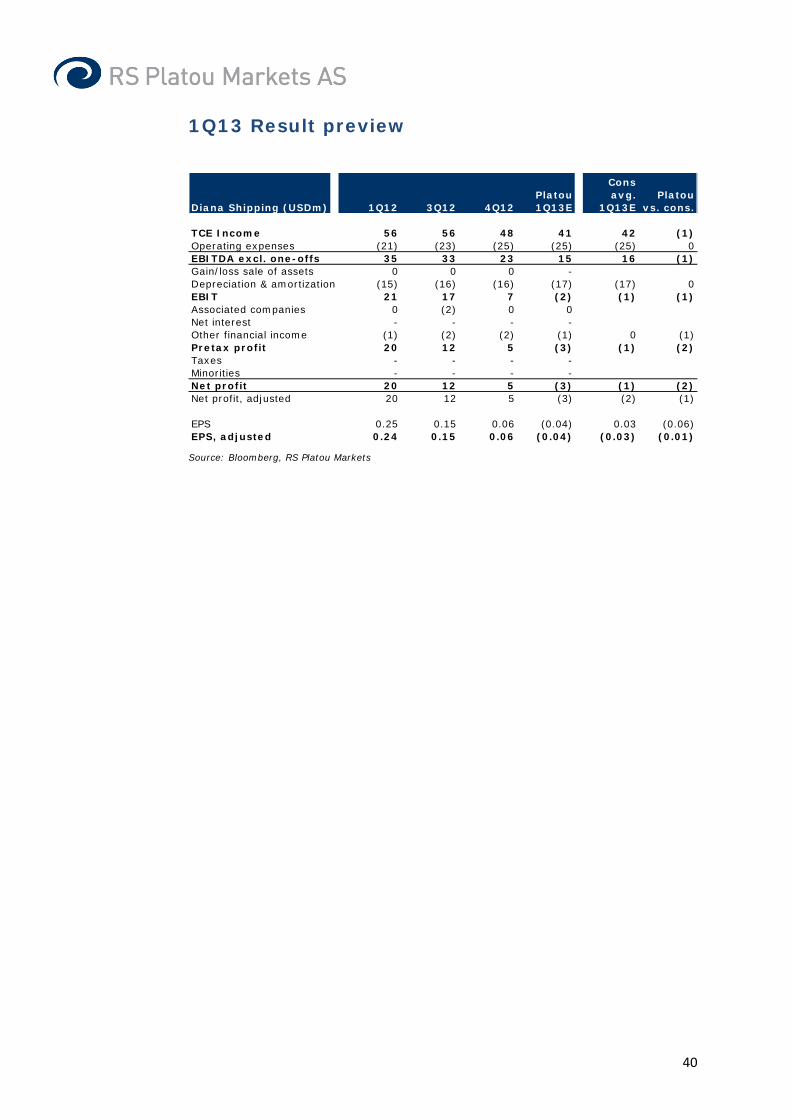
40
1Q13 Result preview
Source: Bloomberg, RS Platou Markets
Diana Shipping (USDm) 1Q12 3Q12 4Q12Platou 1Q13E
Cons avg.
1Q13EPlatou
vs. cons.
TCE Income 56 56 48 41 42 (1)Operating expenses (21) (23) (25) (25) (25) 0EBITDA excl. one-offs 35 33 23 15 16 (1)Gain/loss sale of assets 0 0 0 -Depreciation & amortization (15) (16) (16) (17) (17) 0EBIT 21 17 7 (2) (1) (1)Associated companies 0 (2) 0 0Net interest - - - -Other financial income (1) (2) (2) (1) 0 (1)Pretax profit 20 12 5 (3) (1) (2)Taxes - - - -Minorities - - - -Net profit 20 12 5 (3) (1) (2)Net profit, adjusted 20 12 5 (3) (2) (1)
EPS 0.25 0.15 0.06 (0.04) 0.03 (0.06)EPS, adjusted 0.24 0.15 0.06 (0.04) (0.03) (0.01)

41
Profit and loss (USDm) 2009 2010 2011 2012 2013E 2014E 2015ETotal revenue 239 275 257 223 164 189 271Voyage expenses & commissions -12 -12 -11 -8 -7 -8 -11Time-charter equivalent 227 263 246 215 157 181 260
Operating expenses -59 -78 -80 -91 -104 -113 -117
EBITDA, adj. 169 185 166 124 53 67 143Gain/loss sale of assets 0 1 -1 1 0 0 0EBITDA 168 186 165 125 53 67 143Depreciation -45 -53 -55 -62 -71 -76 -76Amortization/Write down 0 0 0 0 0 0 0EBIT 123 133 110 63 -19 -9 67EBIT, adj. 124 132 110 62 -19 -9 67
Associated companies 0 0 1 -2 -1 -1 0Net interest -2 -4 -4 -6 -5 -5 -4Gains/losses on securities or financial instruments -1 -2 -1 -1 0 0 0Other financial Items 0 0 0 0Pre-tax profit 121 127 106 55 -24 -15 63Tax 0 0 0 0 0 0 0Minorities 0 -1 0 0 0 0 0Result from discontinued operations/ Other 0 0 0 0 0 0 0Net income 121 127 106 55 -24 -15 63
Adjustments after tax 1 1 1 -1 0 0 0Adjusted net income 122 127 108 54 -24 -15 63
EPS (USD) 1.54 1.57 1.31 0.67 -0.30 -0.18 0.78EPS, adj. (USD) 1.55 1.57 1.33 0.66 -0.30 -0.18 0.78
Balance sheet (USDm) 2009 2010 2011 2012 2013E 2014E 2015ELong-term interest bearing assets 0 0 0 0 0 0 0Fixed assets 1,009 1,218 1,132 1,245 1,273 1,196 1,120Other long-term assets 14 13 40 30 30 29 29Long-term assets 1,023 1,231 1,172 1,276 1,302 1,225 1,149
Other current assets 15 9 16 20 15 17 25Cash and liquid assets 282 345 417 447 361 386 460Current assets 297 355 433 467 376 403 484
Total assets 1,320 1,585 1,604 1,743 1,678 1,628 1,633
Equity 999 1,170 1,209 1,266 1,242 1,228 1,291
Minorities 0 0 0 0 0 0 0
Long term interest bearing debt 276 376 346 414 377 340 277Finance obligation 0 0 0 0 0 0 0Other long-term liabilities 13 7 2 1 1 1 1Long term liabilities 289 383 347 415 378 341 278
Short term interest bearing debt 5 7 28 47 47 47 47Other short term liabilities 27 25 20 15 11 12 18Current liabilities 32 33 48 61 58 59 65
Total liabilities and equity 1,320 1,585 1,604 1,743 1,678 1,628 1,633
Working capital -12 -16 -4 6 4 5 7Net debt -1 38 -43 14 63 1 -136
Cash flow (USDm) 2009 2010 2011 2012 2013E 2014E 2015EPre-tax profit 121 127 106 55 -24 -15 63- Associated companies 0 0 -1 2 1 1 0+ Depreciation and amortization 45 53 55 62 71 76 76- Payable tax 0 0 0 0 0 0 0+/- Other operating items -12 2 5 12 0 0 0Cash flow from operations 153 182 166 130 48 63 139
Change in working capital -1 4 -12 -10 2 -1 -2Operating cash flow 152 186 154 120 50 62 137
Maintenance capex 0 0 0 0 0 0 0Growth capex -65 -198 -86 -170 -99 0 0Acquisition capex -8 0 -25 0 0 0 0Sale of assets 0 0 0 0 0 0 0Cash flow from investments -73 -198 -111 -170 -99 0 0
Free cash flow 79 -12 44 -50 -49 62 137
Dividend paid 0 0 0 0 0 0 0Share buy back 0 0 0 0 0 0 0Equity increase 98 41 0 0 0 0 0Cash flow from financing 98 41 0 0 0 0 0
Other items 0 -68 38 -8 0 0 0
Change in net debt -177 39 -82 58 49 -62 -137
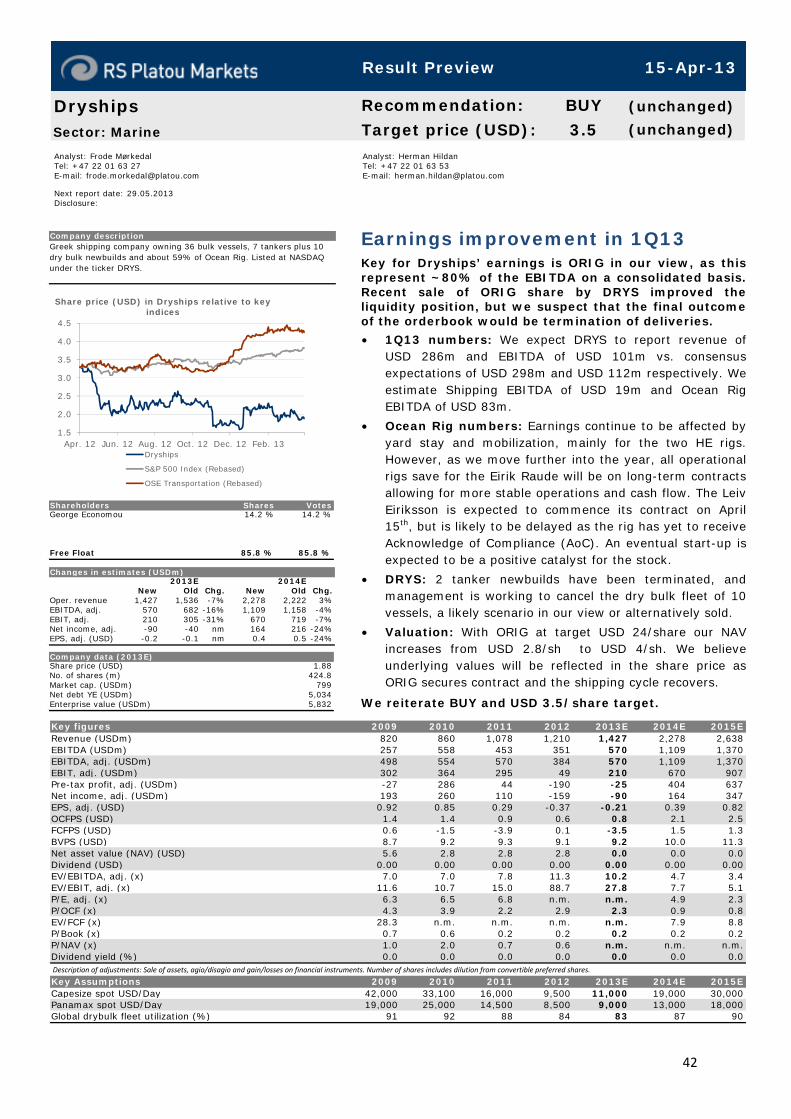
42
Analyst: Frode Mørkedal Tel: +47 22 01 63 27 E-mail: [email protected] Next report date: 29.05.2013 Disclosure:
Analyst: Herman Hildan Tel: +47 22 01 63 53 E-mail: [email protected]
Earnings improvement in 1Q13 Key for Dryships’ earnings is ORIG in our view, as thisrepresent ~80% of the EBITDA on a consolidated basis.Recent sale of ORIG share by DRYS improved theliquidity position, but we suspect that the final outcomeof the orderbook would be termination of deliveries.
• 1Q13 numbers: We expect DRYS to report revenue of USD 286m and EBITDA of USD 101m vs. consensusexpectations of USD 298m and USD 112m respectively. Weestimate Shipping EBITDA of USD 19m and Ocean RigEBITDA of USD 83m.
• Ocean Rig numbers: Earnings continue to be affected by yard stay and mobilization, mainly for the two HE rigs.However, as we move further into the year, all operationalrigs save for the Eirik Raude will be on long-term contracts allowing for more stable operations and cash flow. The Leiv Eiriksson is expected to commence its contract on April15th, but is likely to be delayed as the rig has yet to receiveAcknowledge of Compliance (AoC). An eventual start-up is expected to be a positive catalyst for the stock.
• DRYS: 2 tanker newbuilds have been terminated, and management is working to cancel the dry bulk fleet of 10vessels, a likely scenario in our view or alternatively sold.
• Valuation: With ORIG at target USD 24/share our NAV increases from USD 2.8/sh to USD 4/sh. We believe underlying values will be reflected in the share price asORIG secures contract and the shipping cycle recovers.
We reiterate BUY and USD 3.5/share target.
DryshipsSector: Marine
Recommendation: BUY (unchanged)
Target price (USD): 3.5 (unchanged)
Company descriptionGreek shipping company owning 36 bulk vessels, 7 tankers plus 10 dry bulk newbuilds and about 59% of Ocean Rig. Listed at NASDAQ under the ticker DRYS.
1.5
2.0
2.5
3.0
3.5
4.0
4.5
Apr. 12 Jun. 12 Aug. 12 Oct. 12 Dec. 12 Feb. 13
Share price (USD) in Dryships relative to key indices
Dryships
S&P 500 Index (Rebased)
OSE Transportation (Rebased)
Shareholders Shares VotesGeorge Economou 14.2 % 14.2 %
Free Float 85.8 % 85.8 %
Changes in estimates (USDm)2013E 2014E
New Old Chg. New Old Chg.Oper. revenue 1,427 1,536 -7% 2,278 2,222 3%EBITDA, adj. 570 682 -16% 1,109 1,158 -4%EBIT, adj. 210 305 -31% 670 719 -7%Net income, adj. -90 -40 nm 164 216 -24%EPS, adj. (USD) -0.2 -0.1 nm 0.4 0.5 -24%
Company data (2013E)Share price (USD) 1.88No. of shares (m) 424.8Market cap. (USDm) 799Net debt YE (USDm) 5,034Enterprise value (USDm) 5,832
Description of adjustments: Sale of assets, agio/disagio and gain/losses on financial instruments. Number of shares includes dilution from convertible preferred shares.
Key figures 2009 2010 2011 2012 2013E 2014E 2015ERevenue (USDm) 820 860 1,078 1,210 1,427 2,278 2,638EBITDA (USDm) 257 558 453 351 570 1,109 1,370EBITDA, adj. (USDm) 498 554 570 384 570 1,109 1,370EBIT, adj. (USDm) 302 364 295 49 210 670 907Pre-tax profit, adj. (USDm) -27 286 44 -190 -25 404 637Net income, adj. (USDm) 193 260 110 -159 -90 164 347EPS, adj. (USD) 0.92 0.85 0.29 -0.37 -0.21 0.39 0.82OCFPS (USD) 1.4 1.4 0.9 0.6 0.8 2.1 2.5FCFPS (USD) 0.6 -1.5 -3.9 0.1 -3.5 1.5 1.3BVPS (USD) 8.7 9.2 9.3 9.1 9.2 10.0 11.3Net asset value (NAV) (USD) 5.6 2.8 2.8 2.8 0.0 0.0 0.0Dividend (USD) 0.00 0.00 0.00 0.00 0.00 0.00 0.00EV/EBITDA, adj. (x) 7.0 7.0 7.8 11.3 10.2 4.7 3.4EV/EBIT, adj. (x) 11.6 10.7 15.0 88.7 27.8 7.7 5.1P/E, adj. (x) 6.3 6.5 6.8 n.m. n.m. 4.9 2.3P/OCF (x) 4.3 3.9 2.2 2.9 2.3 0.9 0.8EV/FCF (x) 28.3 n.m. n.m. n.m. n.m. 7.9 8.8P/Book (x) 0.7 0.6 0.2 0.2 0.2 0.2 0.2P/NAV (x) 1.0 2.0 0.7 0.6 n.m. n.m. n.m.Dividend yield (%) 0.0 0.0 0.0 0.0 0.0 0.0 0.0
Key Assumptions 2009 2010 2011 2012 2013E 2014E 2015ECapesize spot USD/Day 42,000 33,100 16,000 9,500 11,000 19,000 30,000Panamax spot USD/Day 19,000 25,000 14,500 8,500 9,000 13,000 18,000Global drybulk fleet utilization (%) 91 92 88 84 83 87 90
Result Preview 15-Apr-13
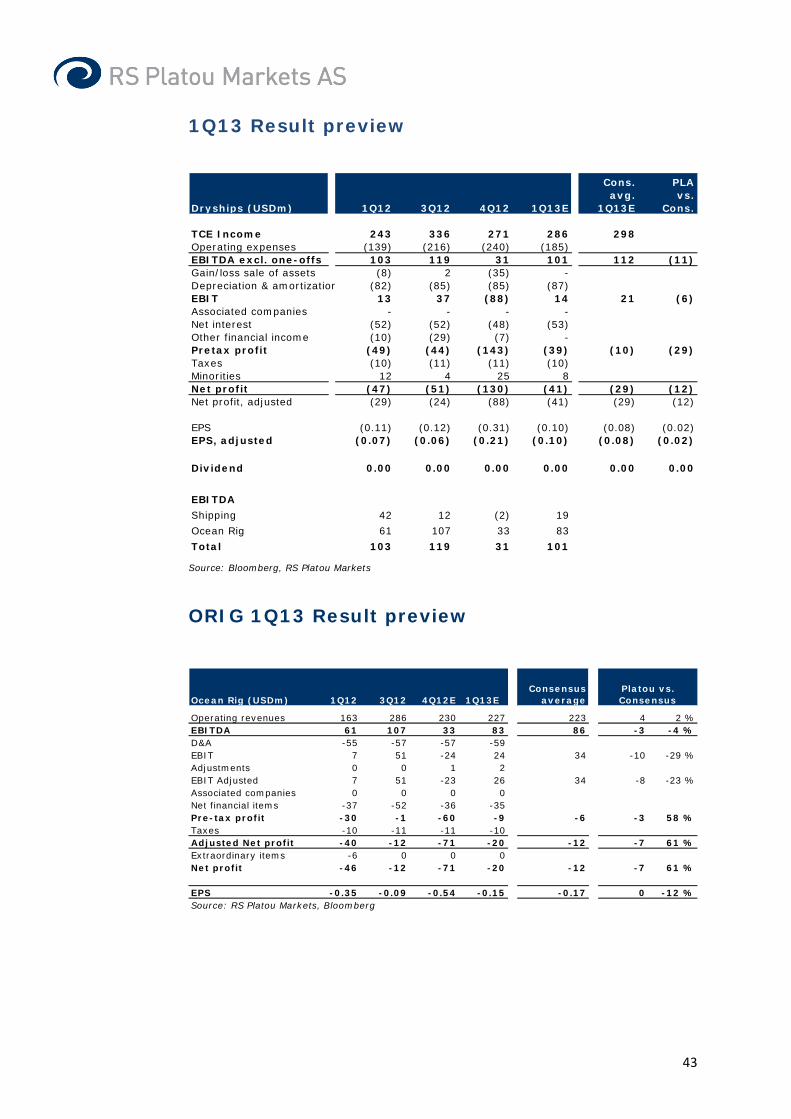
43
1Q13 Result preview
Source: Bloomberg, RS Platou Markets
ORIG 1Q13 Result preview
Dryships (USDm) 1Q12 3Q12 4Q12 1Q13E
Cons. avg.
1Q13E
PLA vs.
Cons.
TCE Income 243 336 271 286 298Operating expenses (139) (216) (240) (185)EBITDA excl. one-offs 103 119 31 101 112 (11)Gain/loss sale of assets (8) 2 (35) -Depreciation & amortization (82) (85) (85) (87)EBIT 13 37 (88) 14 21 (6)Associated companies - - - -Net interest (52) (52) (48) (53)Other financial income (10) (29) (7) -Pretax profit (49) (44) (143) (39) (10) (29)Taxes (10) (11) (11) (10)Minorities 12 4 25 8Net profit (47) (51) (130) (41) (29) (12)Net profit, adjusted (29) (24) (88) (41) (29) (12)
EPS (0.11) (0.12) (0.31) (0.10) (0.08) (0.02)EPS, adjusted (0.07) (0.06) (0.21) (0.10) (0.08) (0.02)
Dividend 0.00 0.00 0.00 0.00 0.00 0.00
EBITDA
Shipping 42 12 (2) 19
Ocean Rig 61 107 33 83
Total 103 119 31 101
Ocean Rig (USDm) 1Q12 3Q12 4Q12E 1Q13EConsensus
averagePlatou vs. Consensus
Operating revenues 163 286 230 227 223 4 2 %EBITDA 61 107 33 83 86 -3 -4 %D&A -55 -57 -57 -59EBIT 7 51 -24 24 34 -10 -29 %Adjustments 0 0 1 2EBIT Adjusted 7 51 -23 26 34 -8 -23 %Associated companies 0 0 0 0Net financial items -37 -52 -36 -35Pre-tax profit -30 -1 -60 -9 -6 -3 58 %Taxes -10 -11 -11 -10Adjusted Net profit -40 -12 -71 -20 -12 -7 61 %Extraordinary items -6 0 0 0Net profit -46 -12 -71 -20 -12 -7 61 %
EPS -0.35 -0.09 -0.54 -0.15 -0.17 0 -12 %Source: RS Platou Markets, Bloomberg
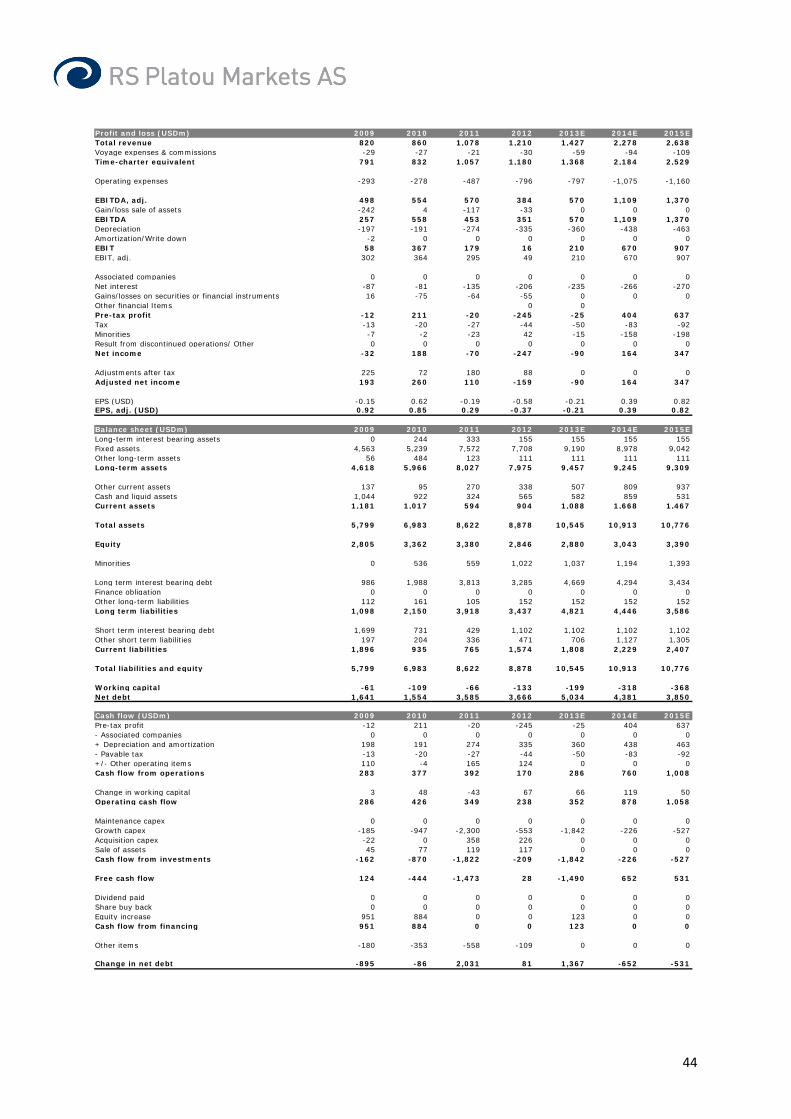
44
Profit and loss (USDm) 2009 2010 2011 2012 2013E 2014E 2015ETotal revenue 820 860 1,078 1,210 1,427 2,278 2,638Voyage expenses & commissions -29 -27 -21 -30 -59 -94 -109Time-charter equivalent 791 832 1,057 1,180 1,368 2,184 2,529
Operating expenses -293 -278 -487 -796 -797 -1,075 -1,160
EBITDA, adj. 498 554 570 384 570 1,109 1,370Gain/loss sale of assets -242 4 -117 -33 0 0 0EBITDA 257 558 453 351 570 1,109 1,370Depreciation -197 -191 -274 -335 -360 -438 -463Amortization/Write down -2 0 0 0 0 0 0EBIT 58 367 179 16 210 670 907EBIT, adj. 302 364 295 49 210 670 907
Associated companies 0 0 0 0 0 0 0Net interest -87 -81 -135 -206 -235 -266 -270Gains/losses on securities or financial instruments 16 -75 -64 -55 0 0 0Other financial Items 0 0Pre-tax profit -12 211 -20 -245 -25 404 637Tax -13 -20 -27 -44 -50 -83 -92Minorities -7 -2 -23 42 -15 -158 -198Result from discontinued operations/ Other 0 0 0 0 0 0 0Net income -32 188 -70 -247 -90 164 347
Adjustments after tax 225 72 180 88 0 0 0Adjusted net income 193 260 110 -159 -90 164 347
EPS (USD) -0.15 0.62 -0.19 -0.58 -0.21 0.39 0.82EPS, adj. (USD) 0.92 0.85 0.29 -0.37 -0.21 0.39 0.82
Balance sheet (USDm) 2009 2010 2011 2012 2013E 2014E 2015ELong-term interest bearing assets 0 244 333 155 155 155 155Fixed assets 4,563 5,239 7,572 7,708 9,190 8,978 9,042Other long-term assets 56 484 123 111 111 111 111Long-term assets 4,618 5,966 8,027 7,975 9,457 9,245 9,309
Other current assets 137 95 270 338 507 809 937Cash and liquid assets 1,044 922 324 565 582 859 531Current assets 1,181 1,017 594 904 1,088 1,668 1,467
Total assets 5,799 6,983 8,622 8,878 10,545 10,913 10,776
Equity 2,805 3,362 3,380 2,846 2,880 3,043 3,390
Minorities 0 536 559 1,022 1,037 1,194 1,393
Long term interest bearing debt 986 1,988 3,813 3,285 4,669 4,294 3,434Finance obligation 0 0 0 0 0 0 0Other long-term liabilities 112 161 105 152 152 152 152Long term liabilities 1,098 2,150 3,918 3,437 4,821 4,446 3,586
Short term interest bearing debt 1,699 731 429 1,102 1,102 1,102 1,102Other short term liabilities 197 204 336 471 706 1,127 1,305Current liabilities 1,896 935 765 1,574 1,808 2,229 2,407
Total liabilities and equity 5,799 6,983 8,622 8,878 10,545 10,913 10,776
Working capital -61 -109 -66 -133 -199 -318 -368Net debt 1,641 1,554 3,585 3,666 5,034 4,381 3,850
Cash flow (USDm) 2009 2010 2011 2012 2013E 2014E 2015EPre-tax profit -12 211 -20 -245 -25 404 637- Associated companies 0 0 0 0 0 0 0+ Depreciation and amortization 198 191 274 335 360 438 463- Payable tax -13 -20 -27 -44 -50 -83 -92+/- Other operating items 110 -4 165 124 0 0 0Cash flow from operations 283 377 392 170 286 760 1,008
Change in working capital 3 48 -43 67 66 119 50Operating cash flow 286 426 349 238 352 878 1,058
Maintenance capex 0 0 0 0 0 0 0Growth capex -185 -947 -2,300 -553 -1,842 -226 -527Acquisition capex -22 0 358 226 0 0 0Sale of assets 45 77 119 117 0 0 0Cash flow from investments -162 -870 -1,822 -209 -1,842 -226 -527
Free cash flow 124 -444 -1,473 28 -1,490 652 531
Dividend paid 0 0 0 0 0 0 0Share buy back 0 0 0 0 0 0 0Equity increase 951 884 0 0 123 0 0Cash flow from financing 951 884 0 0 123 0 0
Other items -180 -353 -558 -109 0 0 0
Change in net debt -895 -86 2,031 81 1,367 -652 -531

45
Analyst: Frode Mørkedal Tel: +47 22 01 63 27 E-mail: [email protected] Next report date: 00.00.0000 Disclosure:
Analyst: Herman Hildan Tel: +47 22 01 63 53 E-mail: [email protected]
Improved results on lower costs We expect Euronav in 1Q13 to have generatedunderlying similar TCE revenues as in the prior quarterbut expiry of high-cost charters helped reduce costs.
• Rate expectations: We look for VLCC spot rates of $17,000/day vs. $15,000/day in 4Q12. Although Euronavunderperformed the market in the prior quarter with VLCCearnings of $12,800, we assume results in line with themarket for 1Q13. The Suezmax spot vessels are assumedto have generated $13,000/day, up from $11,000/day asaverage for the market and Euronav’s $8,500/day during4Q12.
• Fewer charter-ins: Euronav has now reduced their TC-in fleet to 1 VLCC and 20% of one Suezmax. In November2012, Euronav terminated the VLCC TI Guardian which was supposed to run until Oct 2013. The cancellation reducedcharter-in costs with USD 13m or USD 4m per quarter.
• Sale of newbuild: The last Suezmax newbuild, the Cap Isabella, was sold for USD 54m in March 2013. This wasthe same as the remaining capex. Still, debt repaymentsfor 2013 total USD 207m of which USD 87m representsmaturity of liabilities that we assume are refinanced. IfEuronav is successful with this, the Company should avoida solvency crisis but the risks remain high, in our view.
With unattractive valuation and no immediate rebound for the tanker market expected, we reiterate our SELL recommendation.
EuronavSector: Marine
Recommendation: SELL (unchanged)
Target price (EUR): 3.0 (unchanged)
Company descriptionTanker company operating VLCC and Suezmax crude tankers. Its VLCC vessels are mostly traded spot as part of the Tanker International pool while most of its Suezmax vessels are tied to long term charter agreements. Based in Antwerp and listed at Euronext.
3
4
5
6
7
8
9
10
apr. 12 jun. 12 aug.12
okt. 12 des. 12 feb. 13 apr. 13
Share price (EUR) in Euronav relative to key indices
Euronav
S&P 500 Index (Rebased)
OSE Transportation (Rebased)
Shareholders Shares VotesSaverco 29.0 % 29.0 %Tanklog 21.0 % 21.0 %Victrix 10.3 % 10.3 %Euronav 3.4 % 3.4 %Free Float 40.0 % 40.0 %
Changes in estimates (USDm)2012E 2013E
New Old Chg. New Old Chg.Oper. revenue 421 417 1% 321 339 -5%EBITDA, adj. 139 148 -6% 143 141 2%EBIT, adj. -39 -29 -32% -30 -39 23%Net income, adj. -98 -87 -13% -94 -103 9%EPS, adj. (USD) -2.0 -1.7 -13% -1.9 -2.1 9%
Company data (2012E)Share price (EUR) 3.32No. of shares (m) 50.0Market cap. (USDm) 217Net debt YE (USDm) 1 189Enterprise value (USDm) 1 407
Description of adjustments: Sale of assets, agio/disagio, gain/loss securities/financial instruments
Key figures 2009 2010 2011 2012E 2013E 2014E 2015ERevenue (USDm) 468 531 401 421 321 343 494EBITDA (USDm) 195 260 128 117 143 168 318EBITDA, adj. (USDm) 196 256 132 139 143 168 318EBIT, adj. (USDm) 33 84 -37 -39 -30 -5 146Pre-tax profit, adj. (USDm) -25 19 -109 -121 -94 -64 96Net income, adj. (USDm) -23 14 -105 -98 -94 -64 96EPS, adj. (USD) -0.45 0.29 -2.11 -1.96 -1.88 -1.29 1.91OCFPS (USD) 2.3 2.5 1.1 1.6 1.6 2.2 5.3FCFPS (USD) -4.9 1.9 1.8 -0.5 1.6 2.2 5.3BVPS (USD) 19.0 21.6 19.6 17.3 15.5 14.2 16.1Net asset value (NAV) (USD) 18.4 2.3 2.3 2.3 0.0 0.0 0.0Dividend (USD) 0.15 0.13 0.00 0.00 0.00 0.00 0.00EV/EBITDA, adj. (x) 13.2 8.2 10.7 10.2 9.3 7.3 3.0EV/EBIT, adj. (x) 79.9 25.2 n.m. n.m. n.m. n.m. 6.6P/E, adj. (x) n.m. 58.9 n.m. n.m. n.m. n.m. 2.3P/OCF (x) 9.4 6.6 4.3 2.8 2.7 2.0 0.8EV/FCF (x) n.m. 22.7 15.3 n.m. 17.1 11.3 3.6P/Book (x) 1.2 0.8 0.2 0.3 0.3 0.3 0.3P/NAV (x) 1.2 7.3 2.1 1.9 n.m. n.m. n.m.Dividend yield (%) 0.7 0.8 0.0 0.0 0.0 0.0 0.0
Key Assumptions 2009 2010 2011 2012E 2013E 2014E 2015EVLCC spot USD/Day 28 000 34 500 17 000 21 000 20 000 25 000 43 000Suezmax spot USD/Day 25 900 28 000 17 000 15 000 18 000 22 000 34 000
Result Preview 15-Apr-13
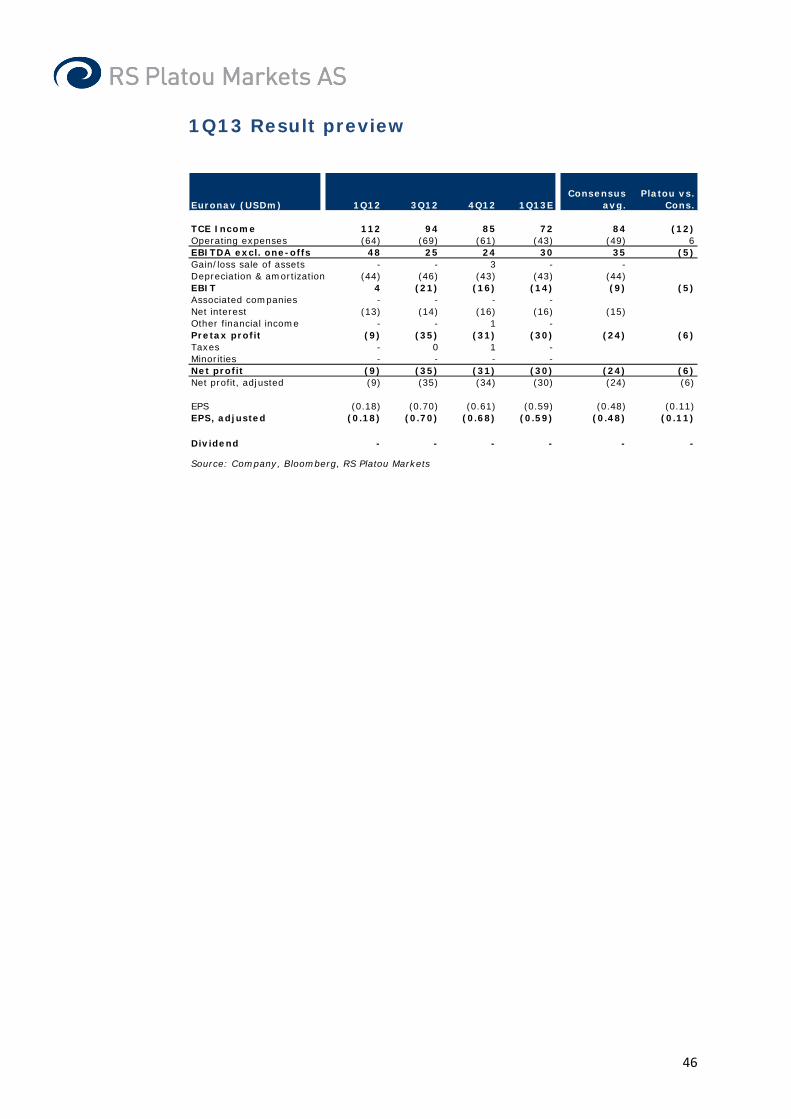
46
1Q13 Result preview
Euronav (USDm) 1Q12 3Q12 4Q12 1Q13EConsensus
avg.Platou vs.
Cons.
TCE Income 112 94 85 72 84 (12)Operating expenses (64) (69) (61) (43) (49) 6EBITDA excl. one-offs 48 25 24 30 35 (5)Gain/loss sale of assets - - 3 - -Depreciation & amortization (44) (46) (43) (43) (44)EBIT 4 (21) (16) (14) (9) (5)Associated companies - - - -Net interest (13) (14) (16) (16) (15)Other financial income - - 1 -Pretax profit (9) (35) (31) (30) (24) (6)Taxes - 0 1 -Minorities - - - -Net profit (9) (35) (31) (30) (24) (6)Net profit, adjusted (9) (35) (34) (30) (24) (6)
EPS (0.18) (0.70) (0.61) (0.59) (0.48) (0.11)EPS, adjusted (0.18) (0.70) (0.68) (0.59) (0.48) (0.11)
Dividend - - - - - -
Source: Company, Bloomberg, RS Platou Markets
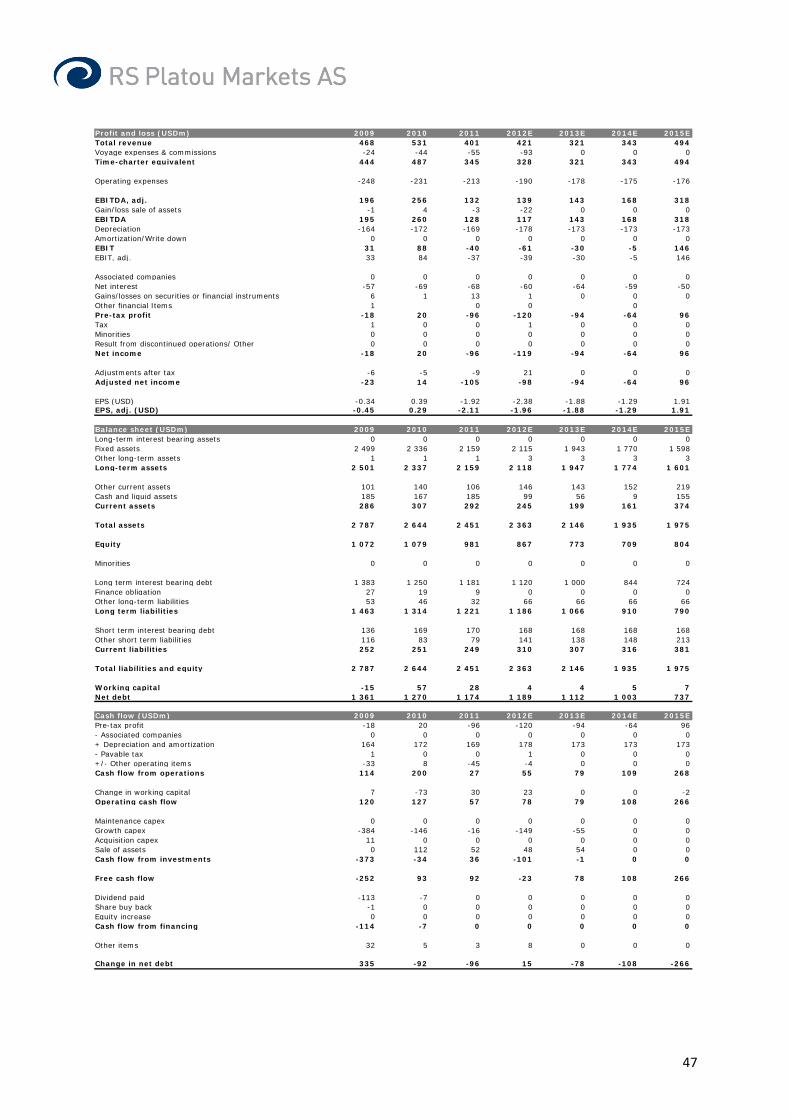
47
Profit and loss (USDm) 2009 2010 2011 2012E 2013E 2014E 2015ETotal revenue 468 531 401 421 321 343 494Voyage expenses & commissions -24 -44 -55 -93 0 0 0Time-charter equivalent 444 487 345 328 321 343 494
Operating expenses -248 -231 -213 -190 -178 -175 -176
EBITDA, adj. 196 256 132 139 143 168 318Gain/loss sale of assets -1 4 -3 -22 0 0 0EBITDA 195 260 128 117 143 168 318Depreciation -164 -172 -169 -178 -173 -173 -173Amortization/Write down 0 0 0 0 0 0 0EBIT 31 88 -40 -61 -30 -5 146EBIT, adj. 33 84 -37 -39 -30 -5 146
Associated companies 0 0 0 0 0 0 0Net interest -57 -69 -68 -60 -64 -59 -50Gains/losses on securities or financial instruments 6 1 13 1 0 0 0Other financial Items 1 0 0 0Pre-tax profit -18 20 -96 -120 -94 -64 96Tax 1 0 0 1 0 0 0Minorities 0 0 0 0 0 0 0Result from discontinued operations/ Other 0 0 0 0 0 0 0Net income -18 20 -96 -119 -94 -64 96
Adjustments after tax -6 -5 -9 21 0 0 0Adjusted net income -23 14 -105 -98 -94 -64 96
EPS (USD) -0.34 0.39 -1.92 -2.38 -1.88 -1.29 1.91EPS, adj. (USD) -0.45 0.29 -2.11 -1.96 -1.88 -1.29 1.91
Balance sheet (USDm) 2009 2010 2011 2012E 2013E 2014E 2015ELong-term interest bearing assets 0 0 0 0 0 0 0Fixed assets 2 499 2 336 2 159 2 115 1 943 1 770 1 598Other long-term assets 1 1 1 3 3 3 3Long-term assets 2 501 2 337 2 159 2 118 1 947 1 774 1 601
Other current assets 101 140 106 146 143 152 219Cash and liquid assets 185 167 185 99 56 9 155Current assets 286 307 292 245 199 161 374
Total assets 2 787 2 644 2 451 2 363 2 146 1 935 1 975
Equity 1 072 1 079 981 867 773 709 804
Minorities 0 0 0 0 0 0 0
Long term interest bearing debt 1 383 1 250 1 181 1 120 1 000 844 724Finance obligation 27 19 9 0 0 0 0Other long-term liabilities 53 46 32 66 66 66 66Long term liabilities 1 463 1 314 1 221 1 186 1 066 910 790
Short term interest bearing debt 136 169 170 168 168 168 168Other short term liabilities 116 83 79 141 138 148 213Current liabilities 252 251 249 310 307 316 381
Total liabilities and equity 2 787 2 644 2 451 2 363 2 146 1 935 1 975
Working capital -15 57 28 4 4 5 7Net debt 1 361 1 270 1 174 1 189 1 112 1 003 737
Cash flow (USDm) 2009 2010 2011 2012E 2013E 2014E 2015EPre-tax profit -18 20 -96 -120 -94 -64 96- Associated companies 0 0 0 0 0 0 0+ Depreciation and amortization 164 172 169 178 173 173 173- Payable tax 1 0 0 1 0 0 0+/- Other operating items -33 8 -45 -4 0 0 0Cash flow from operations 114 200 27 55 79 109 268
Change in working capital 7 -73 30 23 0 0 -2Operating cash flow 120 127 57 78 79 108 266
Maintenance capex 0 0 0 0 0 0 0Growth capex -384 -146 -16 -149 -55 0 0Acquisition capex 11 0 0 0 0 0 0Sale of assets 0 112 52 48 54 0 0Cash flow from investments -373 -34 36 -101 -1 0 0
Free cash flow -252 93 92 -23 78 108 266
Dividend paid -113 -7 0 0 0 0 0Share buy back -1 0 0 0 0 0 0Equity increase 0 0 0 0 0 0 0Cash flow from financing -114 -7 0 0 0 0 0
Other items 32 5 3 8 0 0 0
Change in net debt 335 -92 -96 15 -78 -108 -266
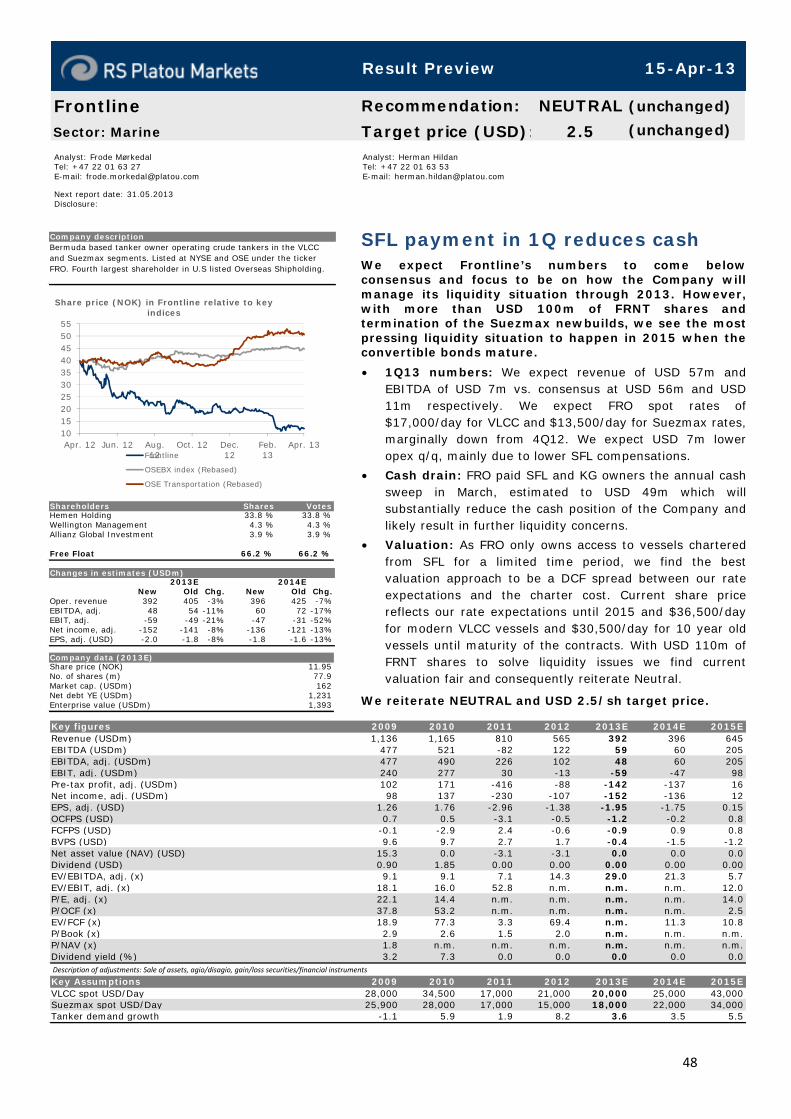
48
Analyst: Frode Mørkedal Tel: +47 22 01 63 27 E-mail: [email protected] Next report date: 31.05.2013 Disclosure:
Analyst: Herman Hildan Tel: +47 22 01 63 53 E-mail: [email protected]
SFL payment in 1Q reduces cash We expect Frontline’s numbers to come belowconsensus and focus to be on how the Company willmanage its liquidity situation through 2013. However,with more than USD 100m of FRNT shares andtermination of the Suezmax newbuilds, we see the mostpressing liquidity situation to happen in 2015 when the convertible bonds mature.
• 1Q13 numbers: We expect revenue of USD 57m and EBITDA of USD 7m vs. consensus at USD 56m and USD11m respectively. We expect FRO spot rates of$17,000/day for VLCC and $13,500/day for Suezmax rates, marginally down from 4Q12. We expect USD 7m loweropex q/q, mainly due to lower SFL compensations.
• Cash drain: FRO paid SFL and KG owners the annual cash sweep in March, estimated to USD 49m which willsubstantially reduce the cash position of the Company and likely result in further liquidity concerns.
• Valuation: As FRO only owns access to vessels chartered from SFL for a limited time period, we find the bestvaluation approach to be a DCF spread between our rateexpectations and the charter cost. Current share pricereflects our rate expectations until 2015 and $36,500/day for modern VLCC vessels and $30,500/day for 10 year oldvessels until maturity of the contracts. With USD 110m ofFRNT shares to solve liquidity issues we find currentvaluation fair and consequently reiterate Neutral.
We reiterate NEUTRAL and USD 2.5/sh target price.
FrontlineSector: Marine
Recommendation: NEUTRAL (unchanged)
Target price (USD): 2.5 (unchanged)
Company descriptionBermuda based tanker owner operating crude tankers in the VLCC and Suezmax segments. Listed at NYSE and OSE under the ticker FRO. Fourth largest shareholder in U.S listed Overseas Shipholding.
10152025303540455055
Apr. 12 Jun. 12 Aug.12
Oct. 12 Dec.12
Feb.13
Apr. 13
Share price (NOK) in Frontline relative to key indices
Frontline
OSEBX index (Rebased)
OSE Transportation (Rebased)
Shareholders Shares VotesHemen Holding 33.8 % 33.8 %Wellington Management 4.3 % 4.3 %Allianz Global Investment 3.9 % 3.9 %
Free Float 66.2 % 66.2 %
Changes in estimates (USDm)2013E 2014E
New Old Chg. New Old Chg.Oper. revenue 392 405 -3% 396 425 -7%EBITDA, adj. 48 54 -11% 60 72 -17%EBIT, adj. -59 -49 -21% -47 -31 -52%Net income, adj. -152 -141 -8% -136 -121 -13%EPS, adj. (USD) -2.0 -1.8 -8% -1.8 -1.6 -13%
Company data (2013E)Share price (NOK) 11.95No. of shares (m) 77.9Market cap. (USDm) 162Net debt YE (USDm) 1,231Enterprise value (USDm) 1,393
Description of adjustments: Sale of assets, agio/disagio, gain/loss securities/financial instruments
Key figures 2009 2010 2011 2012 2013E 2014E 2015ERevenue (USDm) 1,136 1,165 810 565 392 396 645EBITDA (USDm) 477 521 -82 122 59 60 205EBITDA, adj. (USDm) 477 490 226 102 48 60 205EBIT, adj. (USDm) 240 277 30 -13 -59 -47 98Pre-tax profit, adj. (USDm) 102 171 -416 -88 -142 -137 16Net income, adj. (USDm) 98 137 -230 -107 -152 -136 12EPS, adj. (USD) 1.26 1.76 -2.96 -1.38 -1.95 -1.75 0.15OCFPS (USD) 0.7 0.5 -3.1 -0.5 -1.2 -0.2 0.8FCFPS (USD) -0.1 -2.9 2.4 -0.6 -0.9 0.9 0.8BVPS (USD) 9.6 9.7 2.7 1.7 -0.4 -1.5 -1.2Net asset value (NAV) (USD) 15.3 0.0 -3.1 -3.1 0.0 0.0 0.0Dividend (USD) 0.90 1.85 0.00 0.00 0.00 0.00 0.00EV/EBITDA, adj. (x) 9.1 9.1 7.1 14.3 29.0 21.3 5.7EV/EBIT, adj. (x) 18.1 16.0 52.8 n.m. n.m. n.m. 12.0P/E, adj. (x) 22.1 14.4 n.m. n.m. n.m. n.m. 14.0P/OCF (x) 37.8 53.2 n.m. n.m. n.m. n.m. 2.5EV/FCF (x) 18.9 77.3 3.3 69.4 n.m. 11.3 10.8P/Book (x) 2.9 2.6 1.5 2.0 n.m. n.m. n.m.P/NAV (x) 1.8 n.m. n.m. n.m. n.m. n.m. n.m.Dividend yield (%) 3.2 7.3 0.0 0.0 0.0 0.0 0.0
Key Assumptions 2009 2010 2011 2012 2013E 2014E 2015EVLCC spot USD/Day 28,000 34,500 17,000 21,000 20,000 25,000 43,000Suezmax spot USD/Day 25,900 28,000 17,000 15,000 18,000 22,000 34,000Tanker demand growth -1.1 5.9 1.9 8.2 3.6 3.5 5.5
Result Preview 15-Apr-13

49
1Q13 Result preview
Source: Bloomberg, RS Platou Markets
Frontline (USDm) 1Q12 3Q12 4Q12Platou 1Q13E
Consensus avg.
Platou vs. cons.
TCE Income 109 63 78 57 56 1Operating expenses (65) (64) (57) (50) (44) (6)EBITDA excl. one-offs 44 (1) 21 7 11 (5)Gain/loss sale of assets 11 3 14 9Depreciation & amortization (29) (28) (28) (27) (25) (2)Impairment on vessels - - - -EBIT 25 (26) 7 (11) (13) 2Associated companies (0) (0) (0) (0)Net interest (24) (24) (23) (23) (19) (4)Other financial income 6 0 (0) -Pretax profit 7 (49) (17) (34) (33) (2)Taxes (0) (0) (0) (0) 4 (4)Minorities 0 0 0 0Net profit 7 (49) (17) (34) (29) (5)Net profit, adjusted (10) (53) (30) (43) (36) (7)
EPS 0.09 (0.63) (0.21) (0.44) (0.30) (0.14)EPS, adjusted (0.12) (0.68) (0.38) (0.55) (0.43) (0.13)
Dividend 0.00 0.00 0.00 0.00 0.00 0.00

50
Profit and loss (USDm) 2009 2010 2011 2012 2013E 2014E 2015ETotal revenue 1,136 1,165 810 565 392 396 645Voyage expenses & commissions -219 -283 -296 -206 -143 -145 -235Time-charter equivalent 917 883 514 359 249 251 409
Operating expenses -440 -393 -288 -257 -201 -191 -204
EBITDA, adj. 477 490 226 102 48 60 205Gain/loss sale of assets 0 31 -308 20 11 0 0EBITDA 477 521 -82 122 59 60 205Depreciation -237 -213 -196 -115 -107 -107 -107Amortization/Write down 0 0 -121 0 0 0 0EBIT 240 308 -399 7 -48 -47 98EBIT, adj. 240 277 30 -13 -59 -47 98
Associated companies -1 -1 -1 -1 0 0 0Net interest -138 -136 -138 -95 -94 -90 -82Gains/losses on securities or financial instruments 5 -7 9 4 0 46 0Other financial Items 0 0 0Pre-tax profit 106 164 -528 -84 -142 -91 16Tax 0 0 -1 0 0 0 0Minorities -3 -3 -1 1 1 1 -4Result from discontinued operations/ Other 0 0 0 0 0 0 0Net income 103 161 -529 -83 -141 -91 12
Adjustments after tax -4 -24 299 -24 -11 -46 0Adjusted net income 98 137 -230 -107 -152 -136 12
EPS (USD) 1.32 2.07 -6.80 -1.07 -1.81 -1.17 0.15EPS, adj. (USD) 1.26 1.76 -2.96 -1.38 -1.95 -1.75 0.15
Balance sheet (USDm) 2009 2010 2011 2012 2013E 2014E 2015ELong-term interest bearing assets 70 62 101 88 88 88 88Fixed assets 2,833 3,082 1,348 1,203 1,071 964 857Other long-term assets 29 66 83 93 99 9 9Long-term assets 2,932 3,210 1,531 1,384 1,258 1,060 954
Other current assets 271 229 149 167 116 117 190Cash and liquid assets 513 359 161 138 45 94 135Current assets 783 588 310 305 161 211 325
Total assets 3,715 3,798 1,841 1,688 1,418 1,271 1,279
Equity 741 747 201 120 -43 -125 -104
Minorities 9 12 12 11 10 9 13
Long term interest bearing debt 761 1,191 494 463 443 420 396Finance obligation 1,580 1,337 957 898 848 806 763Other long-term liabilities 19 8 8 9 9 9 9Long term liabilities 2,359 2,535 1,460 1,370 1,299 1,235 1,168
Short term interest bearing debt 410 367 75 73 73 73 73Other short term liabilities 196 137 92 114 79 80 130Current liabilities 605 504 167 187 152 152 203
Total liabilities and equity 3,715 3,798 1,841 1,688 1,418 1,271 1,279
Working capital 75 92 57 53 37 37 61Net debt 2,167 2,474 1,266 1,209 1,231 1,118 1,009
Cash flow (USDm) 2009 2010 2011 2012 2013E 2014E 2015EPre-tax profit 106 164 -528 -84 -142 -91 16- Associated companies 1 1 1 1 0 0 0+ Depreciation and amortization 237 213 317 115 107 107 107- Payable tax 0 0 -1 0 0 0 0+/- Other operating items -56 -42 233 -11 -21 8 9Cash flow from operations 287 335 22 20 -57 24 132
Change in working capital 11 -17 35 4 16 0 -23Operating cash flow 299 318 57 24 -40 23 108
Maintenance capex 0 0 0 0 0 0 0Growth capex -147 -549 -107 -15 0 0 0Acquisition capex 77 278 204 1 -6 90 0Sale of assets 2 11 329 11 25 0 0Cash flow from investments -68 -260 426 -3 19 90 0
Free cash flow 230 58 483 21 -21 113 108
Dividend paid -70 -156 -17 0 0 0 0Share buy back 0 0 0 0 0 0 0Equity increase 0 0 0 0 0 0 0Cash flow from financing -70 -156 -17 0 0 0 0
Other items 48 -208 743 35 0 0 0
Change in net debt 193 489 -447 29 50 42 43

51
Analyst: Frode Mørkedal Tel: +47 22 01 63 27 E-mail: [email protected] Next report date: 31.05.2013 Disclosure: RS Platou Markets acted as Joint Lead Manager in the USD 210 million private placement of shares conducted in May 2012 and the USD 310 million private placement of shares conducted in January 2013.
Analyst: Herman Hildan Tel: +47 22 01 63 53 E-mail: [email protected]
Approaching vessel delivery We expect FRNT to report 1Q13 numbers end-May. During the quarter another VLCC should have beenterminated while more vessels may have been added tothe orderbook. The first eco-design vessel of 50 vesselson order will be delivered in 2Q13, lifting earnings until end 2015 when the last vessels are delivered. Wereiterate BUY and lift our target price to USD 10/sh,based on our belief of continued growth which will beaccretive on dividend capacity by the end of 2015 whenwe expect rates to be back to the 20 year average.
• 1Q13 numbers: We expect revenue of USD 17m and EBITDA of USD 8m vs. consensus at USD 18m and USD 6mrespectively. Vessels on the water have outperformedpeers, and we expect average VLCC rates of $20,400/dayand Suezmax of $13,000/day.
• Financing: FRNT is fully financed based on 70% debt financing of the USD 2.1bn orderbook as net equity raises2012/13 and receipts from the VLCC termination is ~USD650m. However, we expect the Company to continuegrowing aggressively which will likely result in additional equity raises ahead.
• Valuation: FRNT is valued at 15% free cash flow yield to equity (FCF/equity) on 20 yr average rates, fully invested.Our target reflects a 12% target. We calculate ~30%FCF/equity on 20 year average rates from additional orders based on current newbuild cost, hence, with continuedaggressive growth the final yield will likely be higher.
We reiterate BUY and lift target to USD 10/sh.
Frontline 2012Sector: Marine
Recommendation: BUY (unchanged)
Target price (USD): 10.0 (8.0)
Company descriptionBermuda based tanker owner operating 10 crude tankers and with substantial orderbook of fuel efficient newbuilds within product tankers, dry bulk and LPG. Strategy to become the leading global commodity shipping company within 3 years
20
25
30
35
40
45
50
Apr. 12 Jun. 12 Aug. 12 Oct. 12 Dec. 12 Feb. 13
Share price (NOK) in Frontline 2012 relative to key indices
Frontline 2012
OSEBX index (Rebased)
OSE Transportation (Rebased)
Shareholders Shares VotesHemen Holding 50.0 % 50.0 %
Free Float 50.0 % 50.0 %
Changes in estimates (USDm)2013E 2014E
New Old Chg. New Old Chg.Oper. revenue 166 165 1% 361 364 -1%EBITDA, adj. 53 52 3% 120 120 0%EBIT, adj. 23 22 7% 70 75 -7%Net income, adj. 9 9 -3% 44 58 -24%EPS, adj. (USD) 0.0 0.0 -3% 0.2 0.3 -24%
Company data (2013E)Share price (NOK) 45.75No. of shares (m) 215.0Market cap. (USDm) 1,721Net debt YE (USDm) 485Enterprise value (USDm) 2,207
Description of adjustments: Sale of assets, agio/disagio, gain/loss securities/financial instruments
Key figures 2011 2012 2013E 2014E 2015ERevenue (USDm) 141 166 361 933EBITDA (USDm) 50 53 120 371EBITDA, adj. (USDm) 50 53 120 371EBIT, adj. (USDm) 26 23 70 289Pre-tax profit, adj. (USDm) 12 9 44 242Net income, adj. (USDm) 12 9 44 242EPS, adj. (USD) 0.00 0.09 0.04 0.20 1.13OCFPS (USD) 0.0 0.2 -0.2 0.7 1.1FCFPS (USD) 0.0 -1.4 -1.3 -3.2 -2.9BVPS (USD) 2.8 3.1 3.7 3.9 5.1Net asset value (NAV) (USD) 0.0 4.1 0.0 0.0 0.0Dividend (USD) 0.00 0.00 0.00 0.00 0.00EV/EBITDA, adj. (x) 25.1 41.5 24.1 9.5EV/EBIT, adj. (x) 49.2 95.4 41.6 12.1P/E, adj. (x) n.m. 52.8 n.m. 39.5 7.1P/OCF (x) n.m. 30.0 n.m. 11.1 7.3EV/FCF (x) n.m. n.m. n.m. n.m.P/Book (x) 1.0 1.5 2.1 2.0 1.6P/NAV (x) n.m. 1.2 n.m. n.m. n.m.Dividend yield (%) 0.0 0.0 0.0 0.0 0.0
Key Assumptions 2011 2012 2013E 2014E 2015EVLCC spot USD/Day 28,000 24,000 25,000 43,000MR spot USD/day 13,600 14,000 15,000 18,500
Result Preview 15-Apr-13

52
1Q13 Result preview
Source: Bloomberg, RS Platou Markers
Frontline 2012 (USDm) 1Q12 3Q12 4Q12Platou 1Q13E
Cons. avg.
1Q13E
PLA vs. Cons.
avg
TCE Income 22 18 19 17 18 (1)Operating expenses (9) (8) (8) (9) (12) 3EBITDA excl. one-offs 14 10 11 8 6 2Gain/loss sale of assets - - - - -Depreciation & amortization (6) (6) (6) (6) (7) 1Impairment on vessels - - - - -EBIT 8 3 4 2 (1) 3Associated companies - - - - -Net interest (4) (3) (3) (3) (3) (0)Other financial income (1) (1) (1) - -Pretax profit 2 (1) 1 (1) (4) 3Taxes - - - - (0) 0Minorities - - - - -Net profit 2 (1) 1 (1) (1)Net profit, adjusted 3 0 2 (1) (4) 3
EPS 0.02 (0.01) 0.00 (0.01) (0.02) 0.01EPS, adjusted 0.03 0.00 0.01 (0.01) (0.02) 0.01

53
Profit and loss (USDm) 2011 2012 2013E 2014E 2015ETotal revenue 141 166 361 933Voyage expenses & commissions -58 -71 -155 -399Time-charter equivalent 83 95 207 534
Operating expenses -32 -42 -87 -163
EBITDA, adj. 50 53 120 371Gain/loss sale of assets 0 0 0 0EBITDA 50 53 120 371Depreciation -25 -30 -50 -82Amortization/Write down 0 0 0 0EBIT 26 23 70 289EBIT, adj. 26 23 70 289
Associated companies 0 0 0 0Net interest -14 -14 -26 -47Gains/losses on securities or financial instruments -4 0 0 0Other financial Items 0 0 0Pre-tax profit 8 9 44 242Tax 0 0 0 0Minorities 0 0 0 0Result from discontinued operations/ Other 0 0 0 0Net income 8 9 44 242
Adjustments after tax 4 0 0 0Adjusted net income 12 9 44 242
EPS (USD) 0.00 0.06 0.04 0.20 1.13EPS, adj. (USD) 0.00 0.09 0.04 0.20 1.13
Balance sheet (USDm) 2011 2012 2013E 2014E 2015ELong-term interest bearing assets 0 0 0 0 0Fixed assets 809 904 1,116 1,904 2,673Other long-term assets 8 8 8 8Long-term assets 809 912 1,124 1,911 2,681
Other current assets 25 98 189 153 284Cash and liquid assets 83 133 280 21 162Current assets 108 231 468 174 446
Total assets 917 1,142 1,592 2,086 3,127
Equity 280 489 804 848 1,090
Minorities 0 0 0 0 0
Long term interest bearing debt 627 641 691 1,070 1,828Finance obligation 0 0 0 0 0Other long-term liabilitiesLong term liabilities 627 641 691 1,070 1,828
Short term interest bearing debt 0 0 74 120 120Other short term liabilities 10 12 23 48 90Current liabilities 10 12 97 168 209
Total liabilities and equity 917 1,142 1,592 2,086 3,127
Working capital 15 86 166 105 194Net debt 544 508 485 1,169 1,785
Cash flow (USDm) 2011 2012 2013E 2014E 2015EPre-tax profit 8 9 44 242- Associated companies 0 0 0 0+ Depreciation and amortization 25 30 50 82- Payable tax 0 0 0 0+/- Other operating items 78 0 0 0Cash flow from operations 111 39 94 324
Change in working capital -90 -80 61 -90Operating cash flow 21 -41 155 235
Maintenance capex 0 0 -4 -6Growth capex -206 -454 -834 -845Acquisition capex 0 0 0 0Sale of assets 0 212 0 0Cash flow from investments -206 -242 -838 -851
Free cash flow -185 -283 -683 -617
Dividend paid 0 0 0 0Share buy back 0 0 0 0Equity increase 199 307 0 0Cash flow from financing 199 307 0 0
Other items -522 -1 0 0
Change in net debt 522 1 0 0
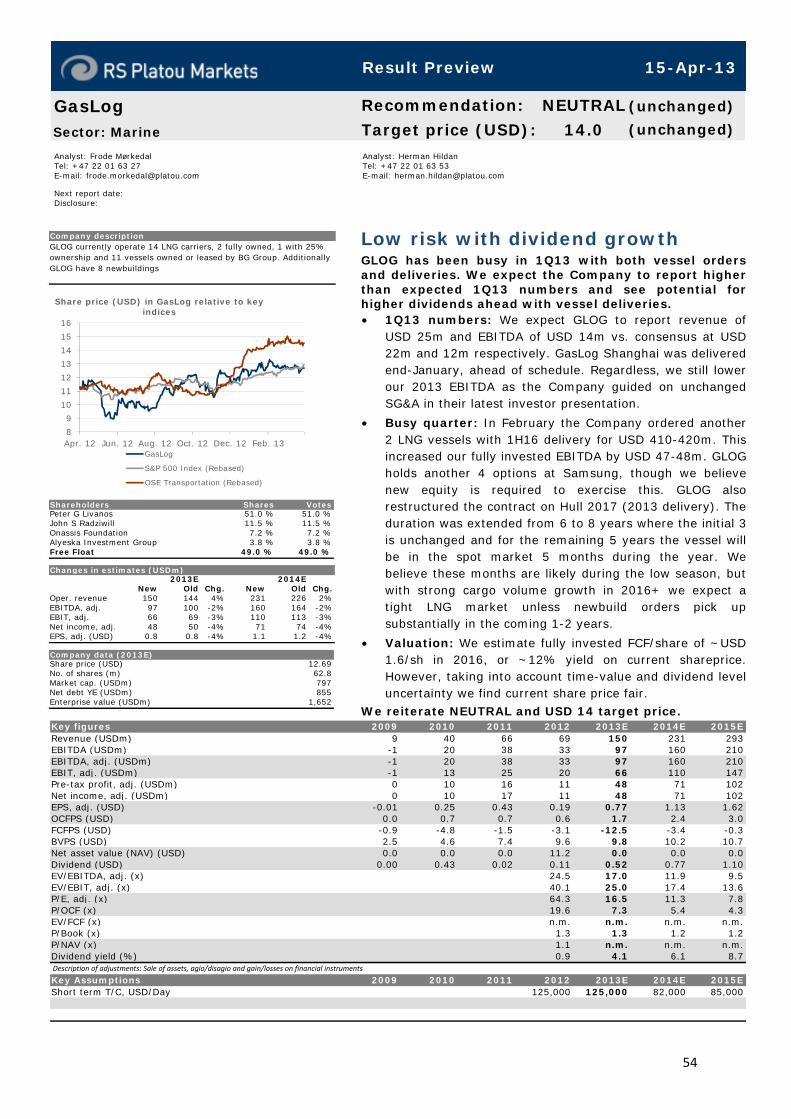
54
Analyst: Frode Mørkedal Tel: +47 22 01 63 27 E-mail: [email protected] Next report date: Disclosure:
Analyst: Herman Hildan Tel: +47 22 01 63 53 E-mail: [email protected]
Low risk with dividend growth GLOG has been busy in 1Q13 with both vessel ordersand deliveries. We expect the Company to report higher than expected 1Q13 numbers and see potential forhigher dividends ahead with vessel deliveries. • 1Q13 numbers: We expect GLOG to report revenue of
USD 25m and EBITDA of USD 14m vs. consensus at USD22m and 12m respectively. GasLog Shanghai was delivered end-January, ahead of schedule. Regardless, we still lowerour 2013 EBITDA as the Company guided on unchangedSG&A in their latest investor presentation.
• Busy quarter: In February the Company ordered another 2 LNG vessels with 1H16 delivery for USD 410-420m. This increased our fully invested EBITDA by USD 47-48m. GLOG holds another 4 options at Samsung, though we believenew equity is required to exercise this. GLOG alsorestructured the contract on Hull 2017 (2013 delivery). The duration was extended from 6 to 8 years where the initial 3is unchanged and for the remaining 5 years the vessel willbe in the spot market 5 months during the year. Webelieve these months are likely during the low season, butwith strong cargo volume growth in 2016+ we expect a tight LNG market unless newbuild orders pick upsubstantially in the coming 1-2 years.
• Valuation: We estimate fully invested FCF/share of ~USD 1.6/sh in 2016, or ~12% yield on current shareprice.However, taking into account time-value and dividend level uncertainty we find current share price fair.
We reiterate NEUTRAL and USD 14 target price.
GasLogSector: Marine
Recommendation: NEUTRAL (unchanged)
Target price (USD): 14.0 (unchanged)
Company descriptionGLOG currently operate 14 LNG carriers, 2 fully owned, 1 with 25% ownership and 11 vessels owned or leased by BG Group. Additionally GLOG have 8 newbuildings
8
9
10
11
12
13
14
15
16
Apr. 12 Jun. 12 Aug. 12 Oct. 12 Dec. 12 Feb. 13
Share price (USD) in GasLog relative to key indices
GasLog
S&P 500 Index (Rebased)
OSE Transportation (Rebased)
Shareholders Shares VotesPeter G Livanos 51.0 % 51.0 %John S Radziwill 11.5 % 11.5 %Onassis Foundation 7.2 % 7.2 %Alyeska Investment Group 3.8 % 3.8 %Free Float 49.0 % 49.0 %
Changes in estimates (USDm)2013E 2014E
New Old Chg. New Old Chg.Oper. revenue 150 144 4% 231 226 2%EBITDA, adj. 97 100 -2% 160 164 -2%EBIT, adj. 66 69 -3% 110 113 -3%Net income, adj. 48 50 -4% 71 74 -4%EPS, adj. (USD) 0.8 0.8 -4% 1.1 1.2 -4%
Company data (2013E)Share price (USD) 12.69No. of shares (m) 62.8Market cap. (USDm) 797Net debt YE (USDm) 855Enterprise value (USDm) 1,652
Description of adjustments: Sale of assets, agio/disagio and gain/losses on financial instruments
Key figures 2009 2010 2011 2012 2013E 2014E 2015ERevenue (USDm) 9 40 66 69 150 231 293EBITDA (USDm) -1 20 38 33 97 160 210EBITDA, adj. (USDm) -1 20 38 33 97 160 210EBIT, adj. (USDm) -1 13 25 20 66 110 147Pre-tax profit, adj. (USDm) 0 10 16 11 48 71 102Net income, adj. (USDm) 0 10 17 11 48 71 102EPS, adj. (USD) -0.01 0.25 0.43 0.19 0.77 1.13 1.62OCFPS (USD) 0.0 0.7 0.7 0.6 1.7 2.4 3.0FCFPS (USD) -0.9 -4.8 -1.5 -3.1 -12.5 -3.4 -0.3BVPS (USD) 2.5 4.6 7.4 9.6 9.8 10.2 10.7Net asset value (NAV) (USD) 0.0 0.0 0.0 11.2 0.0 0.0 0.0Dividend (USD) 0.00 0.43 0.02 0.11 0.52 0.77 1.10EV/EBITDA, adj. (x) 24.5 17.0 11.9 9.5EV/EBIT, adj. (x) 40.1 25.0 17.4 13.6P/E, adj. (x) 64.3 16.5 11.3 7.8P/OCF (x) 19.6 7.3 5.4 4.3EV/FCF (x) n.m. n.m. n.m. n.m.P/Book (x) 1.3 1.3 1.2 1.2P/NAV (x) 1.1 n.m. n.m. n.m.Dividend yield (%) 0.9 4.1 6.1 8.7
Key Assumptions 2009 2010 2011 2012 2013E 2014E 2015EShort term T/C, USD/Day 125,000 125,000 82,000 85,000
Result Preview 15-Apr-13
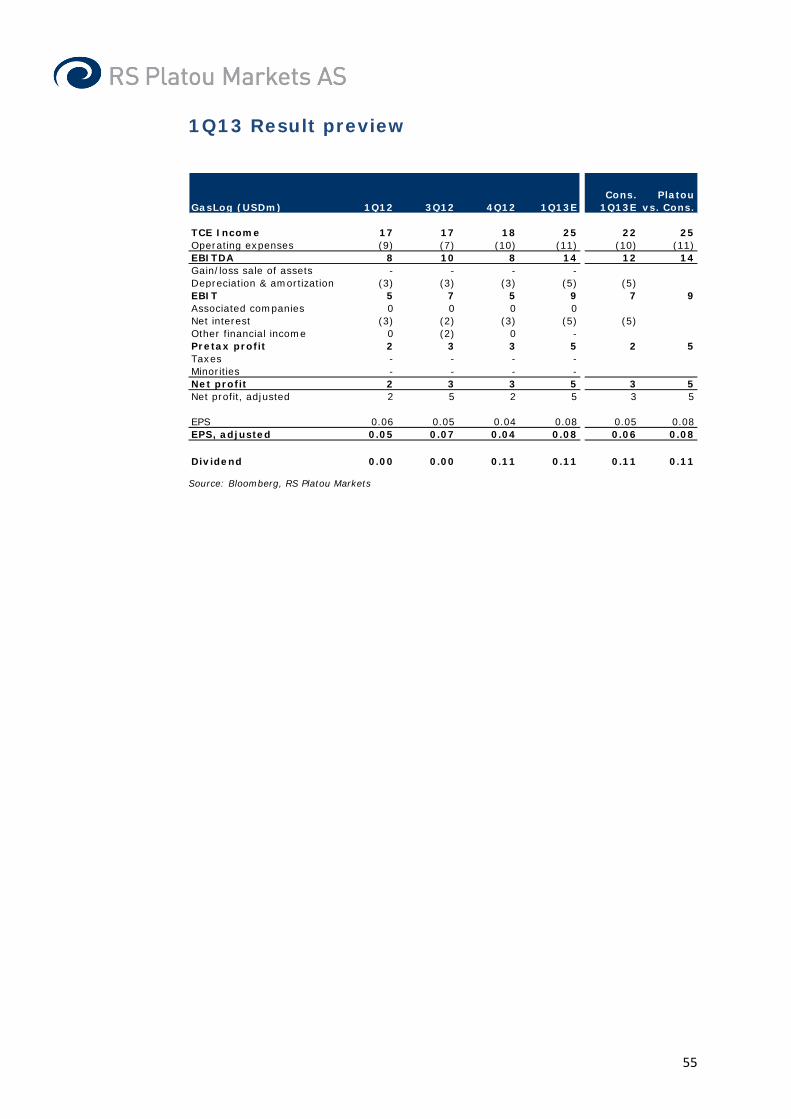
55
1Q13 Result preview
Source: Bloomberg, RS Platou Markets
GasLog (USDm) 1Q12 3Q12 4Q12 1Q13ECons.
1Q13EPlatou
vs. Cons.
TCE Income 17 17 18 25 22 25Operating expenses (9) (7) (10) (11) (10) (11)EBITDA 8 10 8 14 12 14Gain/loss sale of assets - - - -Depreciation & amortization (3) (3) (3) (5) (5)EBIT 5 7 5 9 7 9Associated companies 0 0 0 0Net interest (3) (2) (3) (5) (5)Other financial income 0 (2) 0 -Pretax profit 2 3 3 5 2 5Taxes - - - -Minorities - - - -Net profit 2 3 3 5 3 5Net profit, adjusted 2 5 2 5 3 5
EPS 0.06 0.05 0.04 0.08 0.05 0.08EPS, adjusted 0.05 0.07 0.04 0.08 0.06 0.08
Dividend 0.00 0.00 0.11 0.11 0.11 0.11

56
Profit and loss (USDm) 2009 2010 2011 2012 2013E 2014E 2015ETotal revenue 9 40 66 69 150 231 293Voyage expenses & commissions 0 0 0 0 0 0 0Time-charter equivalent 9 40 66 69 150 231 293
Operating expenses -9 -20 -29 -35 -52 -70 -83
EBITDA, adj. -1 20 38 33 97 160 210Gain/loss sale of assets 0 0 0 0 0 0 0EBITDA -1 20 38 33 97 160 210Depreciation 0 -7 -13 -13 -31 -51 -63Amortization/Write down 0 0 0 0 0 0 0EBIT -1 13 25 20 66 110 147EBIT, adj. -1 13 25 20 66 110 147
Associated companies 1 1 1 1 1 1 1Net interest 0 -5 -10 -10 -19 -40 -46Gains/losses on securities or financial instruments 5 0 -3 -7 0 0 0Other financial Items 0 0 0 0 0Pre-tax profit 4 10 14 4 48 71 102Tax 0 0 0 0 0 0 0Minorities 0 0 0 0 0 0 0Result from discontinued operations/ Other 0 0 0 0 0 0 0Net income 4 10 14 4 48 71 102
Adjustments after tax -5 0 3 7 0 0 0Adjusted net income 0 10 17 11 48 71 102
EPS (USD) 0.12 0.25 0.36 0.07 0.77 1.13 1.62EPS, adj. (USD) -0.01 0.25 0.43 0.19 0.77 1.13 1.62
Balance sheet (USDm) 2009 2010 2011 2012 2013E 2014E 2015ELong-term interest bearing assets 0 0 0 0 0 0 0Fixed assets 247 469 548 644 1,506 1,816 1,958Other long-term assets 17 17 31 45 46 47 48Long-term assets 264 485 579 689 1,552 1,862 2,006
Other current assets 1 3 8 4 11 16 21Cash and liquid assets 13 23 20 216 44 63 38Current assets 14 27 28 220 55 79 59
Total assets 278 512 607 909 1,607 1,941 2,065
Equity 91 172 290 603 619 641 673
Minorities 0 9 0 0 0 0 0
Long term interest bearing debt 171 288 257 229 873 1,151 1,216Finance obligation 0 0 0 0 0 0 0Other long-term liabilities 2 3 11 26 26 26 26Long term liabilities 173 290 267 255 900 1,178 1,242
Short term interest bearing debt 4 23 24 26 26 26 26Other short term liabilities 10 18 25 25 63 97 123Current liabilities 14 41 49 51 89 123 149
Total liabilities and equity 278 512 607 909 1,607 1,941 2,065
Working capital -9 -15 -17 -21 -52 -81 -103Net debt 162 287 261 39 855 1,114 1,204
Cash flow (USDm) 2009 2010 2011 2012 2013E 2014E 2015EPre-tax profit 4 10 14 4 48 71 102- Associated companies -1 -1 -1 -1 -1 -1 -1+ Depreciation and amortization 0 7 13 13 31 51 63- Payable tax 0 0 0 0 0 0 0+/- Other operating items -12 5 -1 16 0 0 0Cash flow from operations -9 20 25 32 78 120 164
Change in working capital 9 6 2 4 32 28 22Operating cash flow 0 26 27 36 110 149 185
Maintenance capex 0 0 0 0 0 0 -5Growth capex -45 -229 -88 -111 -894 -360 -200Acquisition capex 0 0 2 -102 0 0 0Sale of assets 13 16 0 0 0 0 0Cash flow from investments -32 -213 -86 -213 -894 -360 -205
Free cash flow -32 -187 -59 -177 -784 -211 -20
Dividend paid 0 -17 -1 -7 -33 -48 -69Share buy back 0 0 0 0 0 0 0Equity increase 19 85 93 311 0 0 0Cash flow from financing 19 69 92 304 -33 -48 -69
Other items -149 -6 -7 95 0 0 0
Change in net debt 162 125 -26 -222 816 260 89

57
Analyst: Frode Mørkedal Tel: +47 22 01 63 27 E-mail: [email protected] Next report date: 30.04.2013 Disclosure:
Analyst: Herman Hildan Tel: +47 22 01 63 53 E-mail: [email protected]
The cash burner We share the consensus view which expects a record weak quarter, with EBITDA approximately 10% of the quarterly interest cost. 4Q12 cash is sufficient to cover ~3 quarters at current cash burn, despite lenderswaiving debt instalments in 2013. SELL and USD 1/shreiterated as a recovery will benefit lenders and notshareholders or convertible bond holders.
• 1Q13 number: We expect USD 41m revenue and USD 2m of EBITDA, in line with consensus expecting USD 42m andUSD 3m respectively. 4Q12 cash was USD 73m and withlimited cash flow from operations and quarterly interestpayments of USD 22m this means that on a run-rate basis GNK will run out of cash by 4Q13. However, we expectrates to improve in 2H13, but not enough to reduce thedebt level by a meaningful amount. The capital structurerequires refinancing in our view, which will be painful for both shareholders and convertible bond holders. We notethat convertible bonds are currently trading in the low 30’s.
• Valuation: We see limited value for both shareholders and convertible bond holders. With negative NAV of ~USD364m and limited liquidity we see few alternatives otherthan to realise losses. On 20 year average rates EBITDA ofUSD 250m should be generated, pointing to an EV of USD1.7bn which indicates positive shareholder value. However,shareholders are unlikely to be willing to fund the liquiditygap until that point.
We reiterate SELL and USD 1/sh target price.
Genco ShippingSector: Marine
Recommendation: SELL (unchanged)
Target price (USD): 1.0 (unchanged)
Company descriptionDrybulk shipping company founded by Peter C. Georgiopoulos. Operates 53 vessels in all drybulk segments. Established in 2004 and based in New York. Listed at NYSE under the ticker GNK.
2
3
4
5
6
7
8
Apr. 12 Jun. 12 Aug. 12 Oct. 12 Dec. 12 Feb. 13
Share price (USD) in Genco Shipping relative to key indices
Genco Shipping
S&P 500 Index (Rebased)
OSE Transportation (Rebased)
Shareholders Shares Votes
Peter Georgiopoulos 9.5 % 9.5 %Dimensional Fund Advisors 5.9 % 5.9 %Vermillion Asset Management 5.0 % 5.0 %Free Float 86.3 % 86.3 %
Changes in estimates (USDm)2013E 2014E
New Old Chg. New Old Chg.Oper. revenue 202 203 -1% 305 306 0%EBITDA, adj. 40 42 -3% 137 139 -1%EBIT, adj. -100 -97 -3% -3 0 nmNet income, adj. -177 -179 1% -91 -92 2%EPS, adj. (USD) -4.0 -4.1 2% -2.0 -2.1 3%
Company data (2013E)Share price (USD) 2.29No. of shares (m) 44.3Market cap. (USDm) 101Net debt YE (USDm) 1,499Enterprise value (USDm) 1,600
Description of adjustments: Sale of assets, agio/disagio and gain/losses on financial instruments
Key figures 2009 2010 2011 2012 2013E 2014E 2015ERevenue (USDm) 380 449 392 226 202 305 420EBITDA (USDm) 299 337 249 70 40 137 247EBITDA, adj. (USDm) 299 336 248 69 40 137 247EBIT, adj. (USDm) 210 221 112 -70 -100 -3 107Pre-tax profit, adj. (USDm) 149 149 27 -157 -190 -93 18Net income, adj. (USDm) 149 141 25 -145 -177 -91 9EPS, adj. (USD) 4.74 3.92 0.60 -3.48 -4.00 -2.05 0.20OCFPS (USD) 7.0 7.3 3.8 -0.5 -1.0 1.2 3.7FCFPS (USD) -2.8 -16.9 0.6 -0.5 -1.0 0.9 3.4BVPS (USD) 29.5 32.4 32.7 28.5 24.2 22.1 22.1Net asset value (NAV) (USD) 6.2 -8.2 -8.2 -8.2 0.0 0.0 0.0Dividend (USD) 0.00 0.00 0.00 0.00 0.00 0.00 0.00EV/EBITDA, adj. (x) 6.1 6.1 7.0 23.2 39.6 11.4 5.8EV/EBIT, adj. (x) 8.7 9.4 15.5 n.m. n.m. n.m. 13.4P/E, adj. (x) 4.7 3.7 11.3 n.m. n.m. n.m. 11.7P/OCF (x) 3.2 2.0 1.8 n.m. n.m. 1.9 0.6EV/FCF (x) n.m. n.m. 70.0 n.m. n.m. 39.0 9.5P/Book (x) 0.8 0.4 0.2 0.1 0.1 0.1 0.1P/NAV (x) 3.6 n.m. n.m. n.m. n.m. n.m. n.m.Dividend yield (%) 0.0 0.0 0.0 0.0 0.0 0.0 0.0
Key Assumptions 2009 2010 2011 2012 2013E 2014E 2015ECapesize spot USD/Day 42,000 33,100 16,000 9,500 11,000 19,000 30,000Panamax spot USD/Day 19,000 25,000 14,500 8,500 9,000 13,000 18,000Global drybulk fleet utilization (%) 91 92 88 84 83 87 90
Result Preview 15-Apr-13

58
1Q13 Result preview
Source: Bloomberg, RS Platou Markets
Genco Shipping (USDm) 1Q12 3Q12 4Q12 1Q13E
Cons. avg.
1Q13E
PLA vs.
Cons
TCE Income 58 52 47 41 42 (1)Operating expenses (37) (37) (39) (39) (39) (0)EBITDA excl. one-offs 22 15 9 2 3 (2)Gain/loss sale of assets - - 0 -Depreciation & amortization (34) (35) (35) (35) (36) 1EBIT (13) (20) (26) (33) (33) (0)Associated companies - - - -Net interest (24) (21) (22) (22) (21)Other financial income (0) (0) 0 -Pretax profit (36) (42) (49) (56) (54) (2)Taxes (0) (0) (0) (0) 3 (3)Minorities 3 4 3 4Net profit (33) (38) (46) (52) (51) (1)Net profit, adjusted (33) (38) (46) (52) (51) (1)
EPS (0.87) (0.88) (1.04) (1.17) (1.04) (0.13)EPS, adjusted (0.87) (0.88) (1.05) (1.17) (1.04) (0.13)
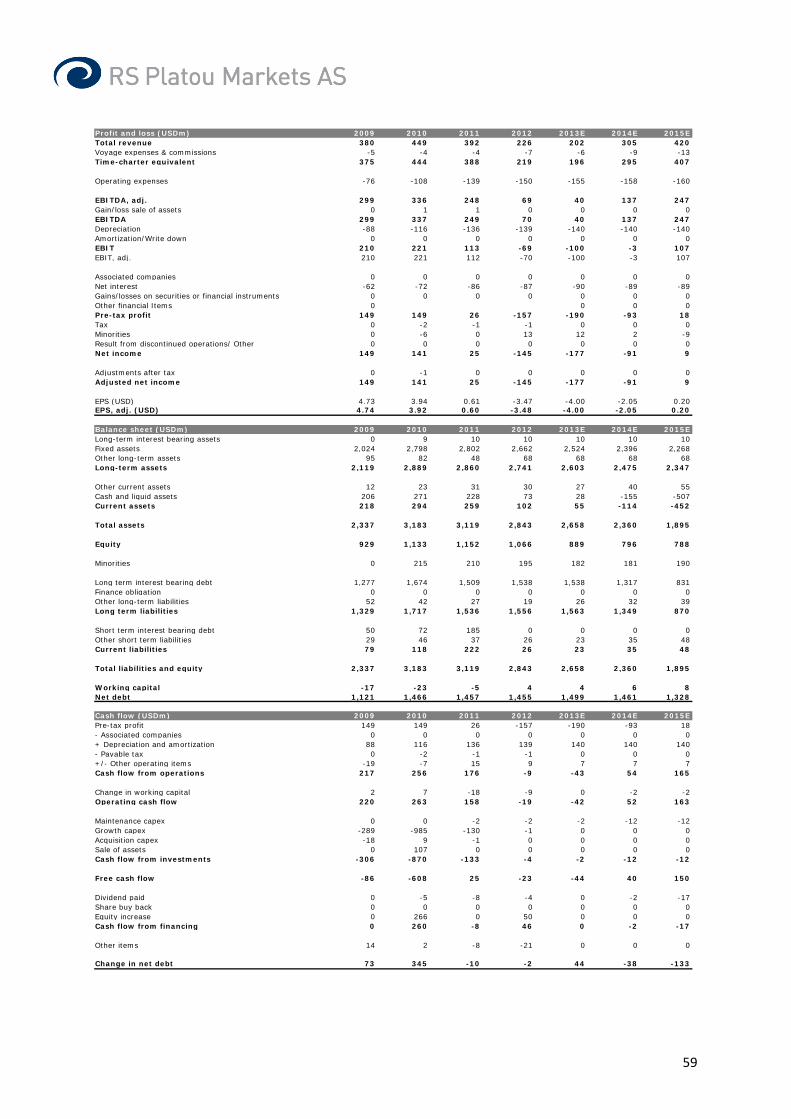
59
Profit and loss (USDm) 2009 2010 2011 2012 2013E 2014E 2015ETotal revenue 380 449 392 226 202 305 420Voyage expenses & commissions -5 -4 -4 -7 -6 -9 -13Time-charter equivalent 375 444 388 219 196 295 407
Operating expenses -76 -108 -139 -150 -155 -158 -160
EBITDA, adj. 299 336 248 69 40 137 247Gain/loss sale of assets 0 1 1 0 0 0 0EBITDA 299 337 249 70 40 137 247Depreciation -88 -116 -136 -139 -140 -140 -140Amortization/Write down 0 0 0 0 0 0 0EBIT 210 221 113 -69 -100 -3 107EBIT, adj. 210 221 112 -70 -100 -3 107
Associated companies 0 0 0 0 0 0 0Net interest -62 -72 -86 -87 -90 -89 -89Gains/losses on securities or financial instruments 0 0 0 0 0 0 0Other financial Items 0 0 0 0Pre-tax profit 149 149 26 -157 -190 -93 18Tax 0 -2 -1 -1 0 0 0Minorities 0 -6 0 13 12 2 -9Result from discontinued operations/ Other 0 0 0 0 0 0 0Net income 149 141 25 -145 -177 -91 9
Adjustments after tax 0 -1 0 0 0 0 0Adjusted net income 149 141 25 -145 -177 -91 9
EPS (USD) 4.73 3.94 0.61 -3.47 -4.00 -2.05 0.20EPS, adj. (USD) 4.74 3.92 0.60 -3.48 -4.00 -2.05 0.20
Balance sheet (USDm) 2009 2010 2011 2012 2013E 2014E 2015ELong-term interest bearing assets 0 9 10 10 10 10 10Fixed assets 2,024 2,798 2,802 2,662 2,524 2,396 2,268Other long-term assets 95 82 48 68 68 68 68Long-term assets 2,119 2,889 2,860 2,741 2,603 2,475 2,347
Other current assets 12 23 31 30 27 40 55Cash and liquid assets 206 271 228 73 28 -155 -507Current assets 218 294 259 102 55 -114 -452
Total assets 2,337 3,183 3,119 2,843 2,658 2,360 1,895
Equity 929 1,133 1,152 1,066 889 796 788
Minorities 0 215 210 195 182 181 190
Long term interest bearing debt 1,277 1,674 1,509 1,538 1,538 1,317 831Finance obligation 0 0 0 0 0 0 0Other long-term liabilities 52 42 27 19 26 32 39Long term liabilities 1,329 1,717 1,536 1,556 1,563 1,349 870
Short term interest bearing debt 50 72 185 0 0 0 0Other short term liabilities 29 46 37 26 23 35 48Current liabilities 79 118 222 26 23 35 48
Total liabilities and equity 2,337 3,183 3,119 2,843 2,658 2,360 1,895
Working capital -17 -23 -5 4 4 6 8Net debt 1,121 1,466 1,457 1,455 1,499 1,461 1,328
Cash flow (USDm) 2009 2010 2011 2012 2013E 2014E 2015EPre-tax profit 149 149 26 -157 -190 -93 18- Associated companies 0 0 0 0 0 0 0+ Depreciation and amortization 88 116 136 139 140 140 140- Payable tax 0 -2 -1 -1 0 0 0+/- Other operating items -19 -7 15 9 7 7 7Cash flow from operations 217 256 176 -9 -43 54 165
Change in working capital 2 7 -18 -9 0 -2 -2Operating cash flow 220 263 158 -19 -42 52 163
Maintenance capex 0 0 -2 -2 -2 -12 -12Growth capex -289 -985 -130 -1 0 0 0Acquisition capex -18 9 -1 0 0 0 0Sale of assets 0 107 0 0 0 0 0Cash flow from investments -306 -870 -133 -4 -2 -12 -12
Free cash flow -86 -608 25 -23 -44 40 150
Dividend paid 0 -5 -8 -4 0 -2 -17Share buy back 0 0 0 0 0 0 0Equity increase 0 266 0 50 0 0 0Cash flow from financing 0 260 -8 46 0 -2 -17
Other items 14 2 -8 -21 0 0 0
Change in net debt 73 345 -10 -2 44 -38 -133
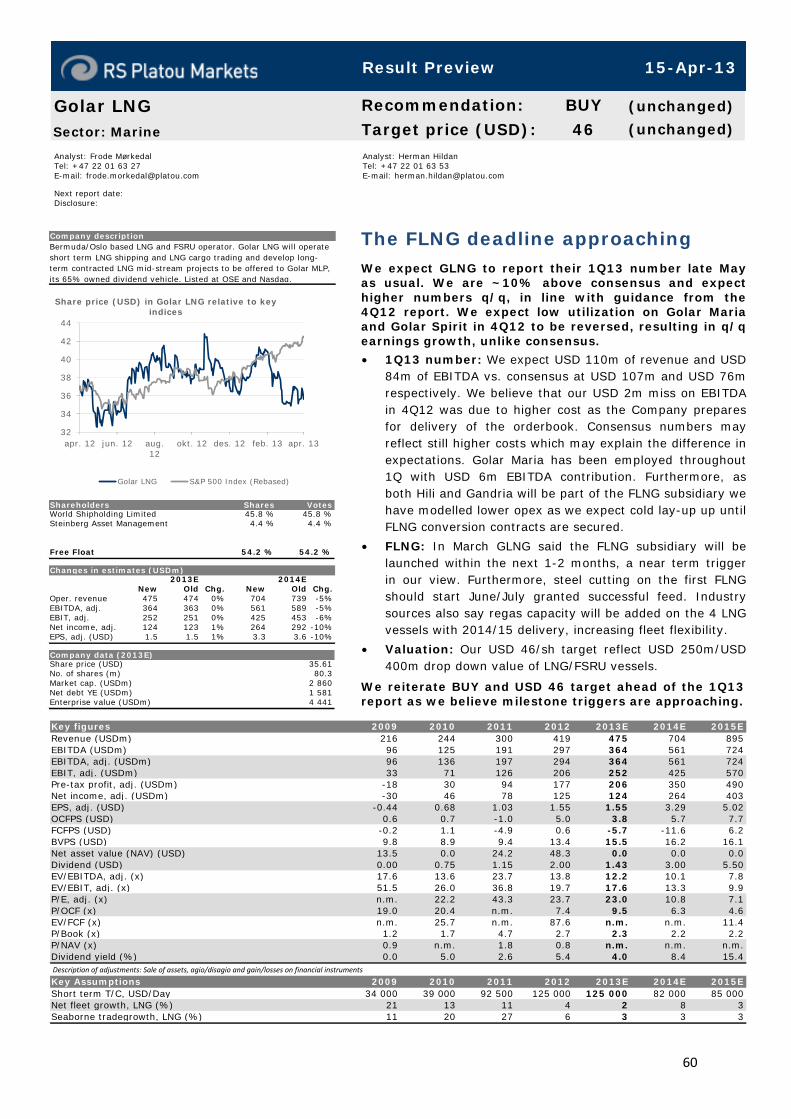
60
Analyst: Frode Mørkedal Tel: +47 22 01 63 27 E-mail: [email protected] Next report date: Disclosure:
Analyst: Herman Hildan Tel: +47 22 01 63 53 E-mail: [email protected]
The FLNG deadline approaching We expect GLNG to report their 1Q13 number late Mayas usual. We are ~10% above consensus and expecthigher numbers q/q, in line with guidance from the4Q12 report. We expect low utilization on Golar Mariaand Golar Spirit in 4Q12 to be reversed, resulting in q/qearnings growth, unlike consensus.
• 1Q13 number: We expect USD 110m of revenue and USD 84m of EBITDA vs. consensus at USD 107m and USD 76m respectively. We believe that our USD 2m miss on EBITDAin 4Q12 was due to higher cost as the Company preparesfor delivery of the orderbook. Consensus numbers mayreflect still higher costs which may explain the difference inexpectations. Golar Maria has been employed throughout 1Q with USD 6m EBITDA contribution. Furthermore, asboth Hili and Gandria will be part of the FLNG subsidiary wehave modelled lower opex as we expect cold lay-up up until FLNG conversion contracts are secured.
• FLNG: In March GLNG said the FLNG subsidiary will be launched within the next 1-2 months, a near term trigger in our view. Furthermore, steel cutting on the first FLNGshould start June/July granted successful feed. Industrysources also say regas capacity will be added on the 4 LNG vessels with 2014/15 delivery, increasing fleet flexibility.
• Valuation: Our USD 46/sh target reflect USD 250m/USD 400m drop down value of LNG/FSRU vessels.
We reiterate BUY and USD 46 target ahead of the 1Q13 report as we believe milestone triggers are approaching.
Golar LNGSector: Marine
Recommendation: BUY (unchanged)
Target price (USD): 46 (unchanged)
Company descriptionBermuda/Oslo based LNG and FSRU operator. Golar LNG will operate short term LNG shipping and LNG cargo trading and develop long-term contracted LNG mid-stream projects to be offered to Golar MLP, its 65% owned dividend vehicle. Listed at OSE and Nasdaq.
32
34
36
38
40
42
44
apr. 12 jun. 12 aug.12
okt. 12 des. 12 feb. 13 apr. 13
Share price (USD) in Golar LNG relative to key indices
Golar LNG S&P 500 Index (Rebased)
Shareholders Shares VotesWorld Shipholding Limited 45.8 % 45.8 %Steinberg Asset Management 4.4 % 4.4 %
Free Float 54.2 % 54.2 %
Changes in estimates (USDm)2013E 2014E
New Old Chg. New Old Chg.Oper. revenue 475 474 0% 704 739 -5%EBITDA, adj. 364 363 0% 561 589 -5%EBIT, adj. 252 251 0% 425 453 -6%Net income, adj. 124 123 1% 264 292 -10%EPS, adj. (USD) 1.5 1.5 1% 3.3 3.6 -10%
Company data (2013E)Share price (USD) 35.61No. of shares (m) 80.3Market cap. (USDm) 2 860Net debt YE (USDm) 1 581Enterprise value (USDm) 4 441
Description of adjustments: Sale of assets, agio/disagio and gain/losses on financial instruments
Key figures 2009 2010 2011 2012 2013E 2014E 2015ERevenue (USDm) 216 244 300 419 475 704 895EBITDA (USDm) 96 125 191 297 364 561 724EBITDA, adj. (USDm) 96 136 197 294 364 561 724EBIT, adj. (USDm) 33 71 126 206 252 425 570Pre-tax profit, adj. (USDm) -18 30 94 177 206 350 490Net income, adj. (USDm) -30 46 78 125 124 264 403EPS, adj. (USD) -0.44 0.68 1.03 1.55 1.55 3.29 5.02OCFPS (USD) 0.6 0.7 -1.0 5.0 3.8 5.7 7.7FCFPS (USD) -0.2 1.1 -4.9 0.6 -5.7 -11.6 6.2BVPS (USD) 9.8 8.9 9.4 13.4 15.5 16.2 16.1Net asset value (NAV) (USD) 13.5 0.0 24.2 48.3 0.0 0.0 0.0Dividend (USD) 0.00 0.75 1.15 2.00 1.43 3.00 5.50EV/EBITDA, adj. (x) 17.6 13.6 23.7 13.8 12.2 10.1 7.8EV/EBIT, adj. (x) 51.5 26.0 36.8 19.7 17.6 13.3 9.9P/E, adj. (x) n.m. 22.2 43.3 23.7 23.0 10.8 7.1P/OCF (x) 19.0 20.4 n.m. 7.4 9.5 6.3 4.6EV/FCF (x) n.m. 25.7 n.m. 87.6 n.m. n.m. 11.4P/Book (x) 1.2 1.7 4.7 2.7 2.3 2.2 2.2P/NAV (x) 0.9 n.m. 1.8 0.8 n.m. n.m. n.m.Dividend yield (%) 0.0 5.0 2.6 5.4 4.0 8.4 15.4
Key Assumptions 2009 2010 2011 2012 2013E 2014E 2015EShort term T/C, USD/Day 34 000 39 000 92 500 125 000 125 000 82 000 85 000Net fleet growth, LNG (%) 21 13 11 4 2 8 3Seaborne tradegrowth, LNG (%) 11 20 27 6 3 3 3
Result Preview 15-Apr-13

61
1Q13 Result preview
Source: Bloomberg, RS Platou Markets
Note that GLNG accelerated the 1Q13 dividend payment in 4Q12 due to tax uncertainty.
Golar LNG (USDm) 1Q12 3Q12 4Q12 1Q13ECons.
1Q13E
Cons. vs.
PLA
TCE Income 82 118 108 110 107 4Operating expenses (34) (24) (31) (26) (31) 4EBITDA adj. 48 93 77 84 76 8Gain/loss sale of assets 4 (0) (1) -Depreciation & amortization (20) (23) (24) (26) (23) (3)EBIT 32 70 53 58 53 5Associated companies 0 0 (0) -Net interest (6) (8) (10) (10) (11) 1Other financial income (3) (3) (3) -Pretax profit 23 59 39 49 43 6Taxes 1 (2) (3) (3)Minorities (9) (13) (14) (16)Net profit 15 45 23 30 28 2Net profit, adjusted 14 48 27 30 27 3
EPS 0.19 0.56 0.28 0.37 0.33 0.04EPS, adjusted 0.17 0.60 0.33 0.37 0.34 0.03
Dividend 0.33 0.43 0.85 0.00 0.44 -0.44
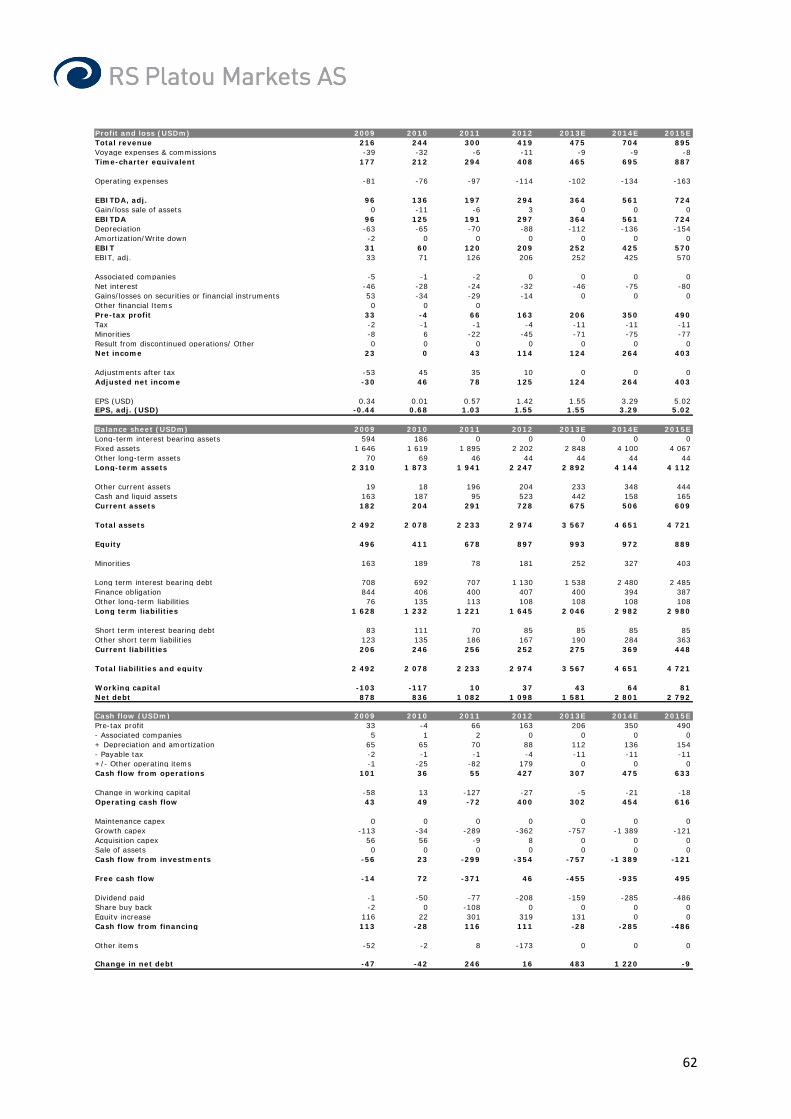
62
Profit and loss (USDm) 2009 2010 2011 2012 2013E 2014E 2015ETotal revenue 216 244 300 419 475 704 895Voyage expenses & commissions -39 -32 -6 -11 -9 -9 -8Time-charter equivalent 177 212 294 408 465 695 887
Operating expenses -81 -76 -97 -114 -102 -134 -163
EBITDA, adj. 96 136 197 294 364 561 724Gain/loss sale of assets 0 -11 -6 3 0 0 0EBITDA 96 125 191 297 364 561 724Depreciation -63 -65 -70 -88 -112 -136 -154Amortization/Write down -2 0 0 0 0 0 0EBIT 31 60 120 209 252 425 570EBIT, adj. 33 71 126 206 252 425 570
Associated companies -5 -1 -2 0 0 0 0Net interest -46 -28 -24 -32 -46 -75 -80Gains/losses on securities or financial instruments 53 -34 -29 -14 0 0 0Other financial Items 0 0 0Pre-tax profit 33 -4 66 163 206 350 490Tax -2 -1 -1 -4 -11 -11 -11Minorities -8 6 -22 -45 -71 -75 -77Result from discontinued operations/ Other 0 0 0 0 0 0 0Net income 23 0 43 114 124 264 403
Adjustments after tax -53 45 35 10 0 0 0Adjusted net income -30 46 78 125 124 264 403
EPS (USD) 0.34 0.01 0.57 1.42 1.55 3.29 5.02EPS, adj. (USD) -0.44 0.68 1.03 1.55 1.55 3.29 5.02
Balance sheet (USDm) 2009 2010 2011 2012 2013E 2014E 2015ELong-term interest bearing assets 594 186 0 0 0 0 0Fixed assets 1 646 1 619 1 895 2 202 2 848 4 100 4 067Other long-term assets 70 69 46 44 44 44 44Long-term assets 2 310 1 873 1 941 2 247 2 892 4 144 4 112
Other current assets 19 18 196 204 233 348 444Cash and liquid assets 163 187 95 523 442 158 165Current assets 182 204 291 728 675 506 609
Total assets 2 492 2 078 2 233 2 974 3 567 4 651 4 721
Equity 496 411 678 897 993 972 889
Minorities 163 189 78 181 252 327 403
Long term interest bearing debt 708 692 707 1 130 1 538 2 480 2 485Finance obligation 844 406 400 407 400 394 387Other long-term liabilities 76 135 113 108 108 108 108Long term liabilities 1 628 1 232 1 221 1 645 2 046 2 982 2 980
Short term interest bearing debt 83 111 70 85 85 85 85Other short term liabilities 123 135 186 167 190 284 363Current liabilities 206 246 256 252 275 369 448
Total liabilities and equity 2 492 2 078 2 233 2 974 3 567 4 651 4 721
Working capital -103 -117 10 37 43 64 81Net debt 878 836 1 082 1 098 1 581 2 801 2 792
Cash flow (USDm) 2009 2010 2011 2012 2013E 2014E 2015EPre-tax profit 33 -4 66 163 206 350 490- Associated companies 5 1 2 0 0 0 0+ Depreciation and amortization 65 65 70 88 112 136 154- Payable tax -2 -1 -1 -4 -11 -11 -11+/- Other operating items -1 -25 -82 179 0 0 0Cash flow from operations 101 36 55 427 307 475 633
Change in working capital -58 13 -127 -27 -5 -21 -18Operating cash flow 43 49 -72 400 302 454 616
Maintenance capex 0 0 0 0 0 0 0Growth capex -113 -34 -289 -362 -757 -1 389 -121Acquisition capex 56 56 -9 8 0 0 0Sale of assets 0 0 0 0 0 0 0Cash flow from investments -56 23 -299 -354 -757 -1 389 -121
Free cash flow -14 72 -371 46 -455 -935 495
Dividend paid -1 -50 -77 -208 -159 -285 -486Share buy back -2 0 -108 0 0 0 0Equity increase 116 22 301 319 131 0 0Cash flow from financing 113 -28 116 111 -28 -285 -486
Other items -52 -2 8 -173 0 0 0
Change in net debt -47 -42 246 16 483 1 220 -9
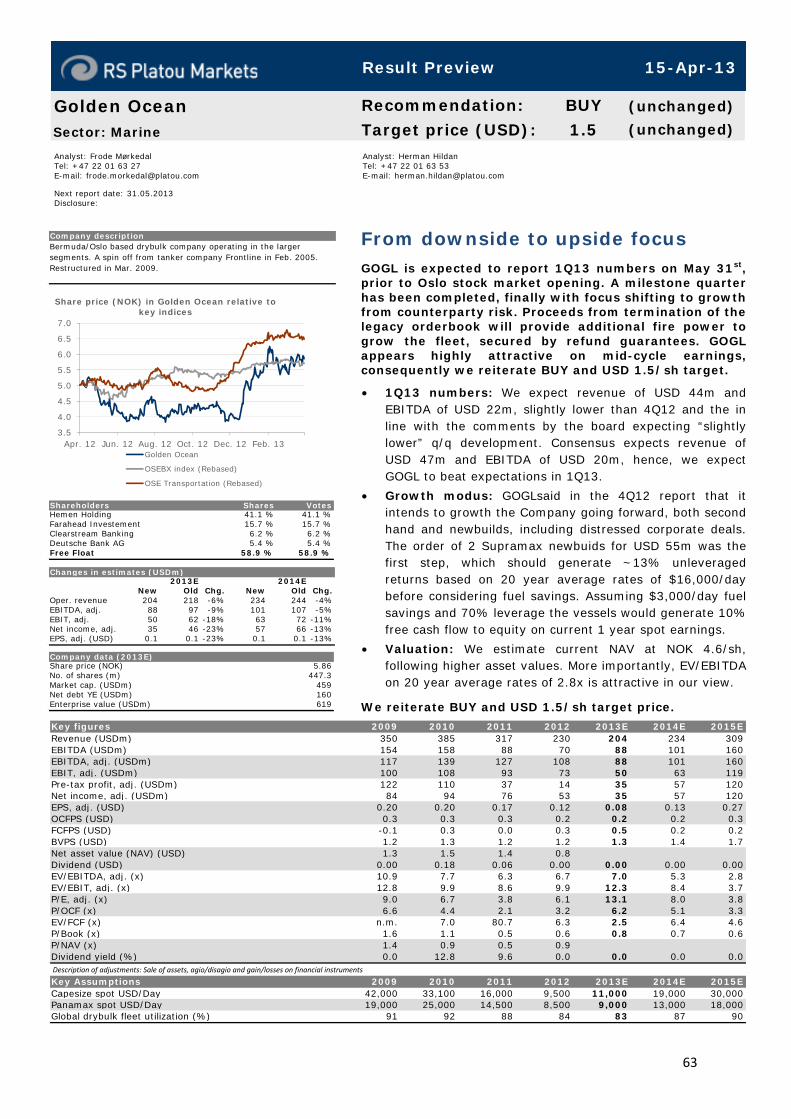
63
Analyst: Frode Mørkedal Tel: +47 22 01 63 27 E-mail: [email protected] Next report date: 31.05.2013 Disclosure:
Analyst: Herman Hildan Tel: +47 22 01 63 53 E-mail: [email protected]
From downside to upside focus GOGL is expected to report 1Q13 numbers on May 31st, prior to Oslo stock market opening. A milestone quarter has been completed, finally with focus shifting to growthfrom counterparty risk. Proceeds from termination of thelegacy orderbook will provide additional fire power togrow the fleet, secured by refund guarantees. GOGLappears highly attractive on mid-cycle earnings, consequently we reiterate BUY and USD 1.5/sh target.
• 1Q13 numbers: We expect revenue of USD 44m and EBITDA of USD 22m, slightly lower than 4Q12 and the inline with the comments by the board expecting “slightlylower” q/q development. Consensus expects revenue of USD 47m and EBITDA of USD 20m, hence, we expectGOGL to beat expectations in 1Q13.
• Growth modus: GOGLsaid in the 4Q12 report that it intends to growth the Company going forward, both secondhand and newbuilds, including distressed corporate deals. The order of 2 Supramax newbuids for USD 55m was thefirst step, which should generate ~13% unleveragedreturns based on 20 year average rates of $16,000/daybefore considering fuel savings. Assuming $3,000/day fuelsavings and 70% leverage the vessels would generate 10% free cash flow to equity on current 1 year spot earnings.
• Valuation: We estimate current NAV at NOK 4.6/sh, following higher asset values. More importantly, EV/EBITDAon 20 year average rates of 2.8x is attractive in our view.
We reiterate BUY and USD 1.5/sh target price.
Golden OceanSector: Marine
Recommendation: BUY (unchanged)
Target price (USD): 1.5 (unchanged)
Company descriptionBermuda/Oslo based drybulk company operating in the larger segments. A spin off from tanker company Frontline in Feb. 2005. Restructured in Mar. 2009.
3.5
4.0
4.5
5.0
5.5
6.0
6.5
7.0
Apr. 12 Jun. 12 Aug. 12 Oct. 12 Dec. 12 Feb. 13
Share price (NOK) in Golden Ocean relative to key indices
Golden Ocean
OSEBX index (Rebased)
OSE Transportation (Rebased)
Shareholders Shares VotesHemen Holding 41.1 % 41.1 %Farahead Investement 15.7 % 15.7 %Clearstream Banking 6.2 % 6.2 %Deutsche Bank AG 5.4 % 5.4 %Free Float 58.9 % 58.9 %
Changes in estimates (USDm)2013E 2014E
New Old Chg. New Old Chg.Oper. revenue 204 218 -6% 234 244 -4%EBITDA, adj. 88 97 -9% 101 107 -5%EBIT, adj. 50 62 -18% 63 72 -11%Net income, adj. 35 46 -23% 57 66 -13%EPS, adj. (USD) 0.1 0.1 -23% 0.1 0.1 -13%
Company data (2013E)Share price (NOK) 5.86No. of shares (m) 447.3Market cap. (USDm) 459Net debt YE (USDm) 160Enterprise value (USDm) 619
Description of adjustments: Sale of assets, agio/disagio and gain/losses on financial instruments
Key figures 2009 2010 2011 2012 2013E 2014E 2015ERevenue (USDm) 350 385 317 230 204 234 309EBITDA (USDm) 154 158 88 70 88 101 160EBITDA, adj. (USDm) 117 139 127 108 88 101 160EBIT, adj. (USDm) 100 108 93 73 50 63 119Pre-tax profit, adj. (USDm) 122 110 37 14 35 57 120Net income, adj. (USDm) 84 94 76 53 35 57 120EPS, adj. (USD) 0.20 0.20 0.17 0.12 0.08 0.13 0.27OCFPS (USD) 0.3 0.3 0.3 0.2 0.2 0.2 0.3FCFPS (USD) -0.1 0.3 0.0 0.3 0.5 0.2 0.2BVPS (USD) 1.2 1.3 1.2 1.2 1.3 1.4 1.7Net asset value (NAV) (USD) 1.3 1.5 1.4 0.8Dividend (USD) 0.00 0.18 0.06 0.00 0.00 0.00 0.00EV/EBITDA, adj. (x) 10.9 7.7 6.3 6.7 7.0 5.3 2.8EV/EBIT, adj. (x) 12.8 9.9 8.6 9.9 12.3 8.4 3.7P/E, adj. (x) 9.0 6.7 3.8 6.1 13.1 8.0 3.8P/OCF (x) 6.6 4.4 2.1 3.2 6.2 5.1 3.3EV/FCF (x) n.m. 7.0 80.7 6.3 2.5 6.4 4.6P/Book (x) 1.6 1.1 0.5 0.6 0.8 0.7 0.6P/NAV (x) 1.4 0.9 0.5 0.9Dividend yield (%) 0.0 12.8 9.6 0.0 0.0 0.0 0.0
Key Assumptions 2009 2010 2011 2012 2013E 2014E 2015ECapesize spot USD/Day 42,000 33,100 16,000 9,500 11,000 19,000 30,000Panamax spot USD/Day 19,000 25,000 14,500 8,500 9,000 13,000 18,000Global drybulk fleet utilization (%) 91 92 88 84 83 87 90
Result Preview 15-Apr-13
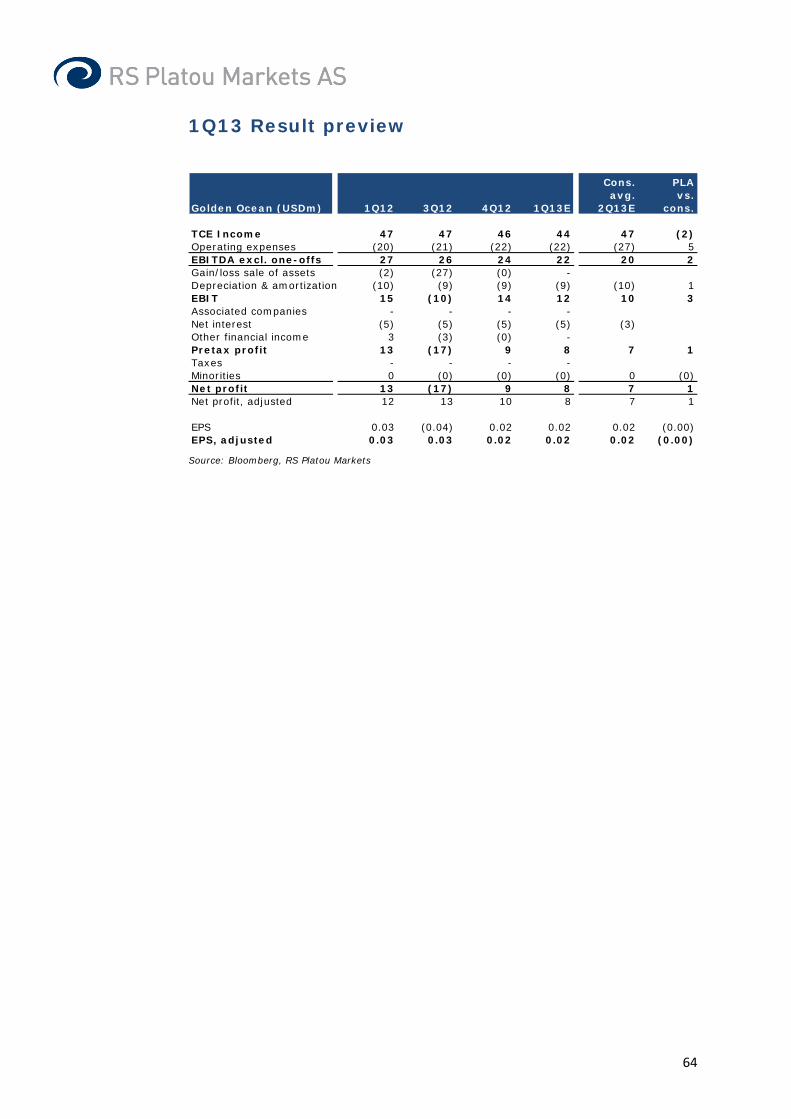
64
1Q13 Result preview
Source: Bloomberg, RS Platou Markets
Golden Ocean (USDm) 1Q12 3Q12 4Q12 1Q13E
Cons. avg.
2Q13E
PLA vs.
cons.
TCE Income 47 47 46 44 47 (2)Operating expenses (20) (21) (22) (22) (27) 5EBITDA excl. one-offs 27 26 24 22 20 2Gain/loss sale of assets (2) (27) (0) -Depreciation & amortization (10) (9) (9) (9) (10) 1EBIT 15 (10) 14 12 10 3Associated companies - - - -Net interest (5) (5) (5) (5) (3)Other financial income 3 (3) (0) -Pretax profit 13 (17) 9 8 7 1Taxes - - - -Minorities 0 (0) (0) (0) 0 (0)Net profit 13 (17) 9 8 7 1Net profit, adjusted 12 13 10 8 7 1
EPS 0.03 (0.04) 0.02 0.02 0.02 (0.00)EPS, adjusted 0.03 0.03 0.02 0.02 0.02 (0.00)

65
Profit and loss (USDm) 2009 2010 2011 2012 2013E 2014E 2015ETotal revenue 350 385 317 230 204 234 309Voyage expenses & commissions -77 -66 -71 -37 -26 -41 -60Time-charter equivalent 273 319 246 193 178 193 249
Operating expenses -155 -180 -120 -84 -90 -92 -89
EBITDA, adj. 117 139 127 108 88 101 160Gain/loss sale of assets 37 19 -39 -38 0 0 0EBITDA 154 158 88 70 88 101 160Depreciation -17 -31 -34 -36 -38 -38 -40Amortization/Write down 0 0 0 0 0 0 0EBIT 137 127 54 34 50 63 119EBIT, adj. 100 108 93 73 50 63 119
Associated companies 0 2 5 0 0 0 0Net interest -15 -20 -22 -20 -15 -6 0Gains/losses on securities or financial instruments 95 -2 -23 -3 0 0 0Other financial Items 0 0Pre-tax profit 217 108 14 12 35 57 120Tax 0 0 0 0 0 0 0Minorities -1 3 0 0 0 0 0Result from discontinued operations/ Other 0 0 0 0 0 0 0Net income 216 111 14 12 35 57 120
Adjustments after tax -132 -18 61 41 0 0 0Adjusted net income 84 94 76 53 35 57 120
EPS (USD) 0.52 0.24 0.03 0.03 0.08 0.13 0.27EPS, adj. (USD) 0.20 0.20 0.17 0.12 0.08 0.13 0.27
Balance sheet (USDm) 2009 2010 2011 2012 2013E 2014E 2015ELong-term interest bearing assets 0 0 0 0 0 0 0Fixed assets 939 951 1,002 868 660 628 632Other long-term assets 18 68 44 9 9 9 9Long-term assets 957 1,019 1,046 877 670 637 641
Other current assets 37 28 27 121 119 129 166Cash and liquid assets 93 180 138 113 232 195 246Current assets 130 208 166 233 351 324 413
Total assets 1,087 1,227 1,212 1,110 1,021 961 1,053
Equity 523 574 529 538 574 632 751
Minorities 4 1 0 0 1 1 1
Long term interest bearing debt 415 451 455 324 205 90 53Finance obligation 58 129 125 118 112 106 99Other long-term liabilities 3 3 2 2 2 2Long term liabilities 473 583 583 445 319 198 154
Short term interest bearing debt 64 42 69 76 76 76 76Other short term liabilities 22 28 30 52 51 55 71Current liabilities 86 70 99 127 127 131 147
Total liabilities and equity 1,087 1,227 1,212 1,110 1,021 961 1,053
Working capital 15 1 -3 69 68 74 95Net debt 445 442 511 406 160 76 -19
Cash flow (USDm) 2009 2010 2011 2012 2013E 2014E 2015EPre-tax profit 217 108 14 12 35 57 120- Associated companies 0 -2 -5 0 0 0 0+ Depreciation and amortization 17 31 34 36 38 38 40- Payable tax 0 0 0 0 0 0 0+/- Other operating items -138 -10 92 125 0 0 0Cash flow from operations 96 127 136 172 73 95 160
Change in working capital 19 14 3 -72 1 -6 -21Operating cash flow 114 141 139 101 74 90 139
Maintenance capex 0 0 0 0 0 0 0Growth capex -178 -173 -119 -41 170 -6 -44Acquisition capex 23 12 -10 40 0 0 0Sale of assets 7 171 0 15 0 0 0Cash flow from investments -148 10 -129 14 170 -6 -44
Free cash flow -34 152 10 114 244 84 95
Dividend paid 0 -57 -50 0 0 0 0Share buy back 0 0 -2 -4 0 0 0Equity increase 108 0 0 0 0 0 0Cash flow from financing 108 -57 -53 -4 0 0 0
Other items 124 -92 -26 -4 2 0 0
Change in net debt -198 -2 69 -106 -246 -84 -95

66
Analyst: Frode Mørkedal Tel: +47 22 01 63 27 E-mail: [email protected] Next report date: 23.05.2013 Disclosure:
Analyst: Herman Hildan Tel: +47 22 01 63 53 E-mail: [email protected]
Loss of Libra in 1Q13 Hoegh LNG will report their 1Q13 May 23rd. We expect significantly lower earnings due to LNG Libra being idle,another delay for the FLNG spin off and do not expectthe Company to exercise the option to acquire STXFrontier due to lower rates.
• 1Q13 numbers: We expect revenue of USD 28m and EBTIDA of USD 6m vs. consensus at USD 32m and USD11m respectively. EBITDA is down 50% q/q as LNG Libracompleted its USD 6m/quarter contract, and has sincebeen idle. We also expect somewhat higher operatingexpenses as the Company has covered LNG Libra expenses during the quarter previously covered by the client.
• Negative focus on spot vessels: We estimate the current idle cost of LNG Libra at ~$40,000/day. The LNGtanks are likely close to warm and consequently we expectthe Company to idle the vessel to reduce cost to ~$2,500/day during 2Q13 unless sold near term. TheNorman Lady contract will also expire in 3Q13, due to oldage (1973 built) and spot competition from other vesselsthe best case is contract extension at lower rate, in ourview. Nevertheless, both vessel contracts have limited impact on valuation, but focus could weigh negatively.
• STX Frontier: We believe HLNG requires ~$90,000/day for ~5 years to comply with the CMD guidance of 12%unleveraged returns. Competitors relying on contract priorto summer to secure financing will likely underbid this.
We reiterate NEUTRAL and USD 12 target price.
Hoegh LNGSector: Marine
Recommendation: NEUTRAL (unchanged)
Target price (USD): 12.0 (unchanged)
Company descriptionHöegh LNG is a fully integrated LNG transportation and services company operating a fleet of 7 LNG carriers including 2 Shuttle and Regasification Vessels (SRVs). The orderbook consists of 3 FSRUs on contract.
35
40
45
50
55
60
65
70
apr. 12 jun. 12 aug.12
okt. 12 des. 12 feb. 13 apr. 13
Share price (NOK) in Hoegh LNG relative to key indices
Hoegh LNG
OSEBX index (Rebased)
OSE Transportation (Rebased)
Shareholders Shares VotesLeif Hoegh & Co 44.2 % 44.2 %JP Morgan Clearing 4.0 % 4.0 %Trignis Argeuralph 2.9 % 2.9 %Morgan Stanley 2.7 % 2.7 %Free Float 55.8 % 55.8 %
Changes in estimates (USDm)2013E 2014E
New Old Chg. New Old Chg.Oper. revenue 129 134 -4% 181 195 -7%EBITDA, adj. 47 49 -4% 104 108 -3%EBIT, adj. 13 24 -44% 56 72 -22%Net income, adj. -26 -16 -69% -4 12 nmEPS, adj. (USD) -0.4 -0.2 -69% -0.1 0.2 nm
Company data (2013E)Share price (NOK) 49.00No. of shares (m) 69.9Market cap. (USDm) 598Net debt YE (USDm) 605Enterprise value (USDm) 1 202
Description of adjustments: Sale of assets, agio/disagio and gain/losses on financial instruments
Key figures 2009 2010 2011 2012 2013E 2014E 2015ERevenue (USDm) 68 95 110 136 129 181 318EBITDA (USDm) 11 24 26 57 47 104 229EBITDA, adj. (USDm) 8 24 26 41 47 104 229EBIT, adj. (USDm) 0 10 8 19 13 56 171Pre-tax profit, adj. (USDm) -7 -12 -17 8 -27 -4 101Net income, adj. (USDm) -10 -13 -18 -8 -26 -4 101EPS, adj. (USD) -0.38 -0.48 -0.47 -0.12 -0.38 -0.06 1.44OCFPS (USD) 1.9 -1.4 0.5 0.3 0.0 0.8 2.7FCFPS (USD) 1.9 -1.4 -2.3 -2.8 -2.8 -7.7 0.2BVPS (USD) 3.8 2.7 2.8 4.9 4.4 4.4 5.8Net asset value (NAV) (USD) 0.0 0.0 11.0 11.0 0.0 0.0 0.0Dividend (USD) 0.00 0.00 0.00 0.00 0.00 0.00 0.00EV/EBITDA, adj. (x) 31.4 23.8 25.5 16.7 7.5EV/EBIT, adj. (x) n.m. 53.1 89.2 31.1 10.1P/E, adj. (x) n.m. n.m. n.m. n.m. 5.9P/OCF (x) 18.5 27.1 n.m. 10.6 3.1EV/FCF (x) n.m. n.m. n.m. n.m. n.m.P/Book (x) 3.0 1.7 1.9 2.0 1.5P/NAV (x) 0.8 0.8 n.m. n.m. n.m.Dividend yield (%) 0.0 0.0 0.0 0.0 0.0
Key Assumptions 2009 2010 2011 2012 2013E 2014E 2015EShort term LNG T/C, USD/Day 34 000 39 000 90 000 125 000 125 000 82 000 85 000
Result Preview 15-Apr-13
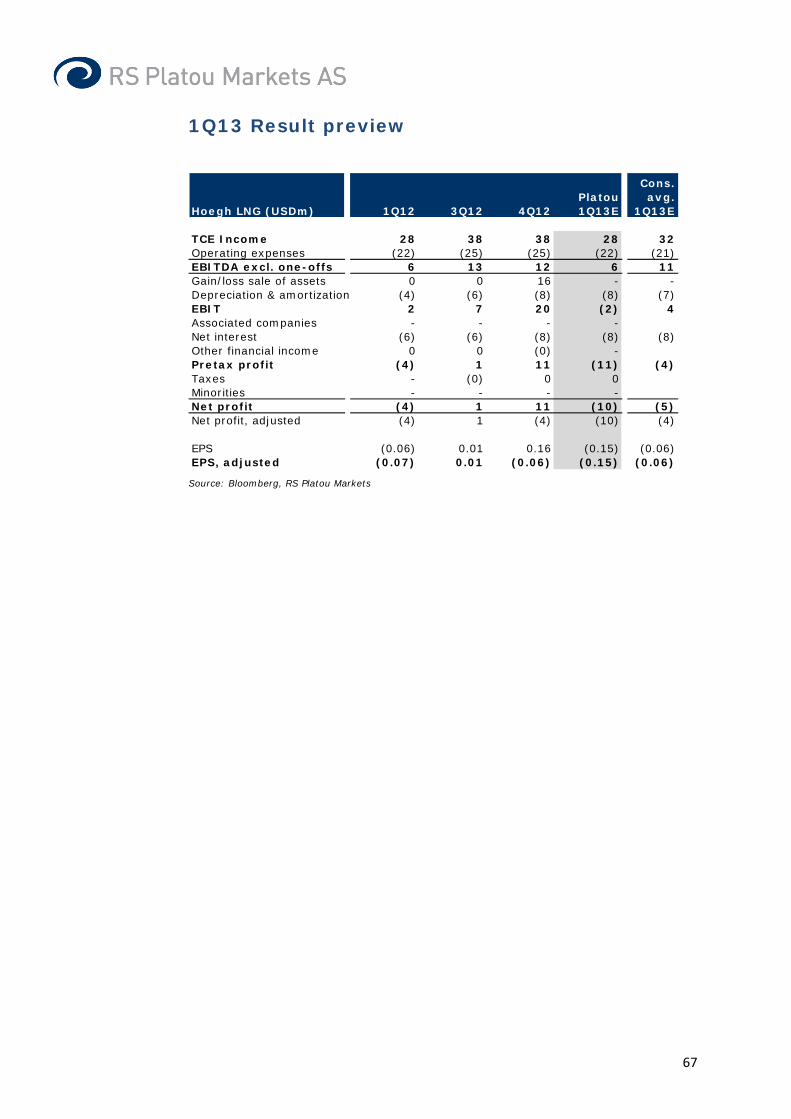
67
1Q13 Result preview
Source: Bloomberg, RS Platou Markets
Hoegh LNG (USDm) 1Q12 3Q12 4Q12Platou 1Q13E
Cons. avg.
1Q13E
TCE Income 28 38 38 28 32Operating expenses (22) (25) (25) (22) (21)EBITDA excl. one-offs 6 13 12 6 11Gain/loss sale of assets 0 0 16 - -Depreciation & amortization (4) (6) (8) (8) (7)EBIT 2 7 20 (2) 4Associated companies - - - -Net interest (6) (6) (8) (8) (8)Other financial income 0 0 (0) -Pretax profit (4) 1 11 (11) (4)Taxes - (0) 0 0Minorities - - - -Net profit (4) 1 11 (10) (5)Net profit, adjusted (4) 1 (4) (10) (4)
EPS (0.06) 0.01 0.16 (0.15) (0.06)EPS, adjusted (0.07) 0.01 (0.06) (0.15) (0.06)

68
Profit and loss (USDm) 2009 2010 2011 2012 2013E 2014E 2015ETotal revenue 68 95 110 136 129 181 318Voyage expenses & commissions 0 -1 0 0 0 0 0Time-charter equivalent 68 95 110 136 129 181 318
Operating expenses -59 -71 -84 -94 -82 -77 -88
EBITDA, adj. 8 24 26 41 47 104 229Gain/loss sale of assets 3 0 0 16 0 0 0EBITDA 11 24 26 57 47 104 229Depreciation -8 -14 -18 -23 -34 -48 -59Amortization/Write down 0 0 -1 0 0 0 0EBIT 3 10 6 35 13 56 171EBIT, adj. 0 10 8 19 13 56 171
Associated companies 0 0 0 0 0 0 0Net interest -10 -22 -25 -27 -40 -60 -70Gains/losses on securities or financial instruments 24 1 0 1 0 0 0Other financial Items 0 0Pre-tax profit 17 -11 -18 9 -27 -4 101Tax 0 -1 0 0 0 0 0Minorities 0 0 0 0 0 0 0Result from discontinued operations/ Other -5 0 0 0 0 0 0Net income 12 -12 -18 9 -26 -4 101
Adjustments after tax -22 -1 0 -17 0 0 0Adjusted net income -10 -13 -18 -8 -26 -4 101
EPS (USD) 0.47 -0.45 -0.47 0.14 -0.38 -0.06 1.44EPS, adj. (USD) -0.38 -0.48 -0.47 -0.12 -0.38 -0.06 1.44
Balance sheet (USDm) 2009 2010 2011 2012 2013E 2014E 2015ELong-term interest bearing assets 66 10 13 23 23 23 23Fixed assets 423 468 507 713 832 1 323 1 445Other long-term assets 77 82 93 83 123 178 178Long-term assets 566 560 613 820 979 1 525 1 646
Other current assets 8 60 5 6 4 6 10Cash and liquid assets 22 29 127 247 81 144 292Current assets 30 89 132 252 86 150 302
Total assets 596 649 745 1 072 1 064 1 675 1 948
Equity 101 74 133 344 309 305 406
Minorities 1 0 0 0 0 0 0
Long term interest bearing debt 396 439 426 539 578 1 178 1 314Finance obligation 0 0 114 111 111 111 111Other long-term liabilities 55 77 18 12 12 12 12Long term liabilities 451 516 558 661 700 1 301 1 436
Short term interest bearing debt 8 12 13 21 21 21 21Other short term liabilities 36 48 41 47 35 49 85Current liabilities 44 60 54 67 55 69 106
Total liabilities and equity 596 649 745 1 072 1 064 1 675 1 948
Working capital -28 12 -36 -41 -31 -43 -75Net debt 315 412 413 400 605 1 142 1 130
Cash flow (USDm) 2009 2010 2011 2012 2013E 2014E 2015EPre-tax profit 17 -11 -18 9 -27 -4 101- Associated companies 0 0 0 0 0 0 0+ Depreciation and amortization 8 14 20 23 34 48 59- Payable tax 0 -1 0 0 0 0 0+/- Other operating items -3 0 -32 -16 0 0 0Cash flow from operations 23 2 -30 16 7 44 160
Change in working capital 28 -40 48 5 -10 12 32Operating cash flow 50 -38 18 21 -3 56 192
Maintenance capex 0 0 0 0 0 0 0Growth capex 0 0 -57 -212 -153 -645 -180Acquisition capex 0 0 -45 0 -40 -55 0Sale of assets 0 0 0 0 0 106 0Cash flow from investments 0 0 -102 -212 -193 -594 -180
Free cash flow 50 -38 -85 -191 -196 -538 12
Dividend paid 0 0 0 0 0 0 0Share buy back 0 0 0 0 0 0 0Equity increase 0 0 126 209 0 0 0Cash flow from financing 0 0 126 209 0 0 0
Other items -366 -59 -43 -5 -9 0 0
Change in net debt 315 97 1 -13 204 538 -12
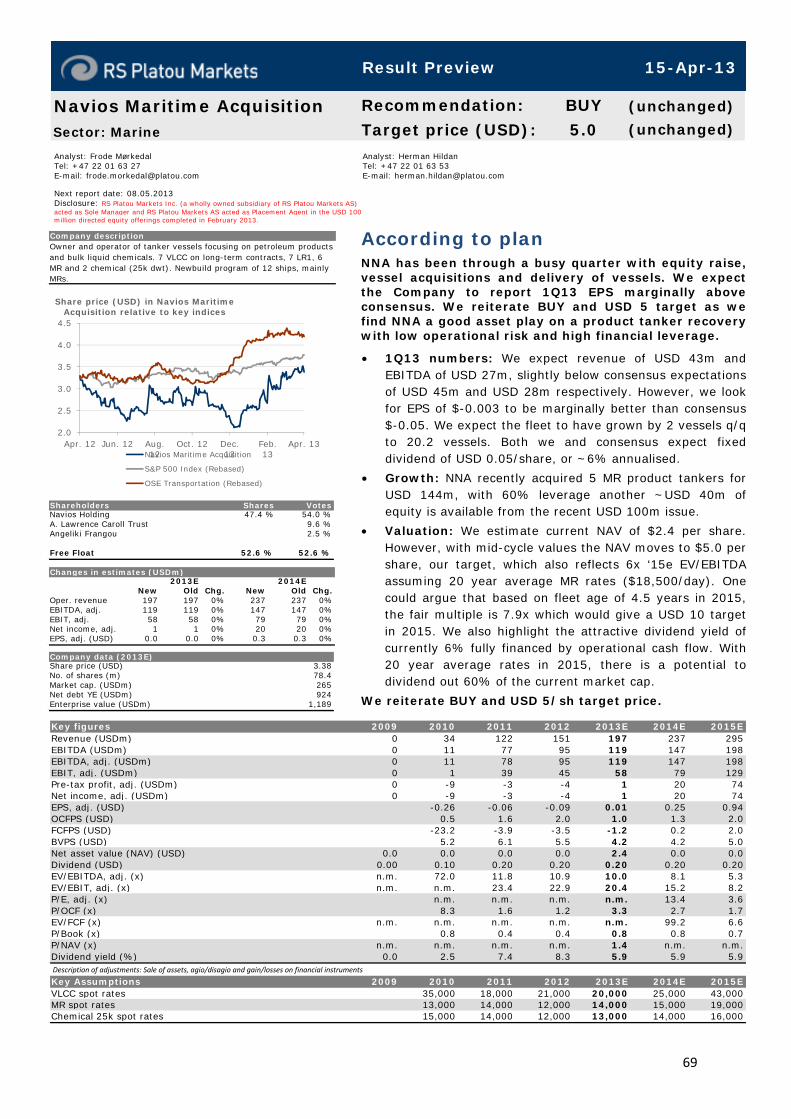
69
Analyst: Frode Mørkedal Tel: +47 22 01 63 27 E-mail: [email protected] Next report date: 08.05.2013 Disclosure: RS Platou Markets Inc. (a wholly owned subsidiary of RS Platou Markets AS) acted as Sole Manager and RS Platou Markets AS acted as Placement Agent in the USD 100 million directed equity offerings completed in February 2013.
Analyst: Herman Hildan Tel: +47 22 01 63 53 E-mail: [email protected]
According to plan NNA has been through a busy quarter with equity raise,vessel acquisitions and delivery of vessels. We expectthe Company to report 1Q13 EPS marginally aboveconsensus. We reiterate BUY and USD 5 target as wefind NNA a good asset play on a product tanker recovery with low operational risk and high financial leverage.
• 1Q13 numbers: We expect revenue of USD 43m and EBITDA of USD 27m, slightly below consensus expectationsof USD 45m and USD 28m respectively. However, we lookfor EPS of $-0.003 to be marginally better than consensus $-0.05. We expect the fleet to have grown by 2 vessels q/qto 20.2 vessels. Both we and consensus expect fixeddividend of USD 0.05/share, or ~6% annualised.
• Growth: NNA recently acquired 5 MR product tankers for USD 144m, with 60% leverage another ~USD 40m of equity is available from the recent USD 100m issue.
• Valuation: We estimate current NAV of $2.4 per share. However, with mid-cycle values the NAV moves to $5.0 per share, our target, which also reflects 6x ‘15e EV/EBITDAassuming 20 year average MR rates ($18,500/day). Onecould argue that based on fleet age of 4.5 years in 2015, the fair multiple is 7.9x which would give a USD 10 targetin 2015. We also highlight the attractive dividend yield ofcurrently 6% fully financed by operational cash flow. With20 year average rates in 2015, there is a potential todividend out 60% of the current market cap.
We reiterate BUY and USD 5/sh target price.
Navios Maritime AcquisitionSector: Marine
Recommendation: BUY (unchanged)
Target price (USD): 5.0 (unchanged)
Company descriptionOwner and operator of tanker vessels focusing on petroleum products and bulk liquid chemicals. 7 VLCC on long-term contracts, 7 LR1, 6 MR and 2 chemical (25k dwt). Newbuild program of 12 ships, mainly MRs.
2.0
2.5
3.0
3.5
4.0
4.5
Apr. 12 Jun. 12 Aug.12
Oct. 12 Dec.12
Feb.13
Apr. 13
Share price (USD) in Navios Maritime Acquisition relative to key indices
Navios Maritime Acquisition
S&P 500 Index (Rebased)
OSE Transportation (Rebased)
Shareholders Shares VotesNavios Holding 47.4 % 54.0 %A. Lawrence Caroll Trust 9.6 %Angeliki Frangou 2.5 %
Free Float 52.6 % 52.6 %
Changes in estimates (USDm)2013E 2014E
New Old Chg. New Old Chg.Oper. revenue 197 197 0% 237 237 0%EBITDA, adj. 119 119 0% 147 147 0%EBIT, adj. 58 58 0% 79 79 0%Net income, adj. 1 1 0% 20 20 0%EPS, adj. (USD) 0.0 0.0 0% 0.3 0.3 0%
Company data (2013E)Share price (USD) 3.38No. of shares (m) 78.4Market cap. (USDm) 265Net debt YE (USDm) 924Enterprise value (USDm) 1,189
Description of adjustments: Sale of assets, agio/disagio and gain/losses on financial instruments
Key figures 2009 2010 2011 2012 2013E 2014E 2015ERevenue (USDm) 0 34 122 151 197 237 295EBITDA (USDm) 0 11 77 95 119 147 198EBITDA, adj. (USDm) 0 11 78 95 119 147 198EBIT, adj. (USDm) 0 1 39 45 58 79 129Pre-tax profit, adj. (USDm) 0 -9 -3 -4 1 20 74Net income, adj. (USDm) 0 -9 -3 -4 1 20 74EPS, adj. (USD) -0.26 -0.06 -0.09 0.01 0.25 0.94OCFPS (USD) 0.5 1.6 2.0 1.0 1.3 2.0FCFPS (USD) -23.2 -3.9 -3.5 -1.2 0.2 2.0BVPS (USD) 5.2 6.1 5.5 4.2 4.2 5.0Net asset value (NAV) (USD) 0.0 0.0 0.0 0.0 2.4 0.0 0.0Dividend (USD) 0.00 0.10 0.20 0.20 0.20 0.20 0.20EV/EBITDA, adj. (x) n.m. 72.0 11.8 10.9 10.0 8.1 5.3EV/EBIT, adj. (x) n.m. n.m. 23.4 22.9 20.4 15.2 8.2P/E, adj. (x) n.m. n.m. n.m. n.m. 13.4 3.6P/OCF (x) 8.3 1.6 1.2 3.3 2.7 1.7EV/FCF (x) n.m. n.m. n.m. n.m. n.m. 99.2 6.6P/Book (x) 0.8 0.4 0.4 0.8 0.8 0.7P/NAV (x) n.m. n.m. n.m. n.m. 1.4 n.m. n.m.Dividend yield (%) 0.0 2.5 7.4 8.3 5.9 5.9 5.9
Key Assumptions 2009 2010 2011 2012 2013E 2014E 2015EVLCC spot rates 35,000 18,000 21,000 20,000 25,000 43,000MR spot rates 13,000 14,000 12,000 14,000 15,000 19,000Chemical 25k spot rates 15,000 14,000 12,000 13,000 14,000 16,000
Result Preview 15-Apr-13
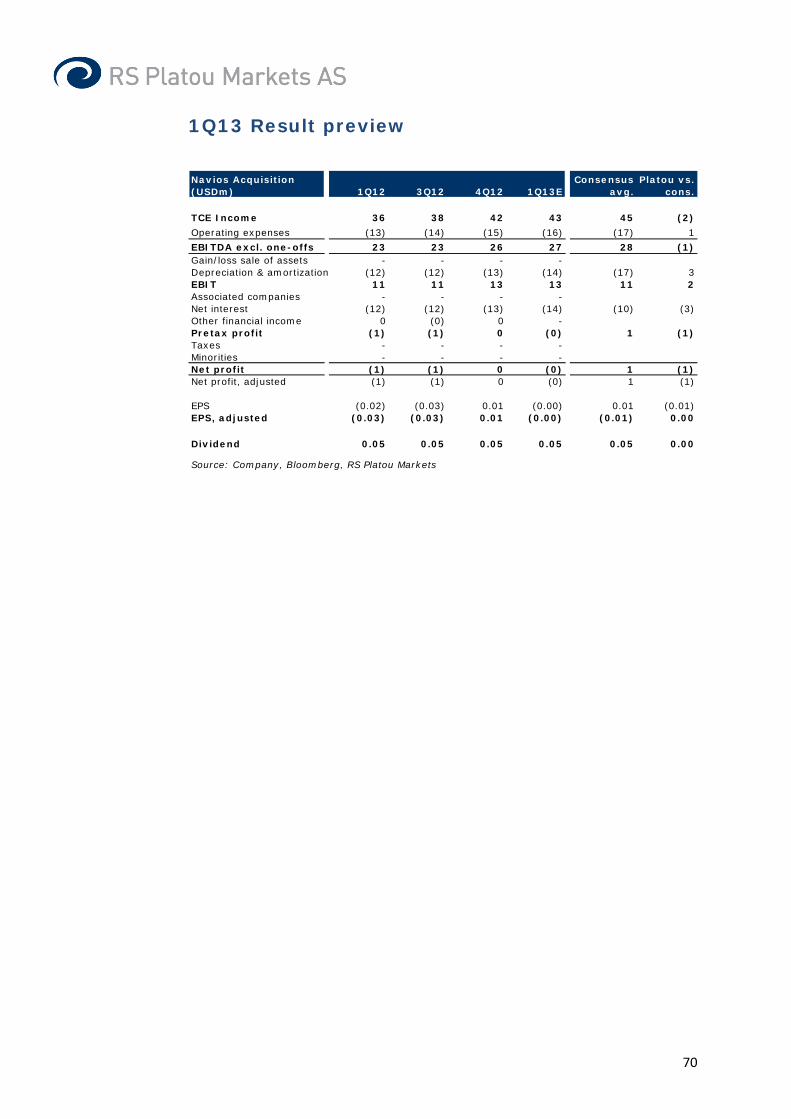
70
1Q13 Result preview
Navios Acquisition (USDm) 1Q12 3Q12 4Q12 1Q13E
Consensus avg.
Platou vs. cons.
TCE Income 36 38 42 43 45 (2)
Operating expenses (13) (14) (15) (16) (17) 1
EBITDA excl. one-offs 23 23 26 27 28 (1)Gain/loss sale of assets - - - -Depreciation & amortization (12) (12) (13) (14) (17) 3EBIT 11 11 13 13 11 2Associated companies - - - -Net interest (12) (12) (13) (14) (10) (3)Other financial income 0 (0) 0 -Pretax profit (1) (1) 0 (0) 1 (1)Taxes - - - -Minorities - - - -Net profit (1) (1) 0 (0) 1 (1)Net profit, adjusted (1) (1) 0 (0) 1 (1)
EPS (0.02) (0.03) 0.01 (0.00) 0.01 (0.01)EPS, adjusted (0.03) (0.03) 0.01 (0.00) (0.01) 0.00
Dividend 0.05 0.05 0.05 0.05 0.05 0.00
Source: Company, Bloomberg, RS Platou Markets

71
Profit and loss (USDm) 2009 2010 2011 2012 2013E 2014E 2015ETotal revenue 0 34 122 151 197 237 295Voyage expenses & commissions 0 0 0 0 0 0 0Time-charter equivalent 0 34 122 151 197 237 295
Operating expenses 0 -22 -44 -56 -78 -91 -97
EBITDA, adj. 0 11 78 95 119 147 198Gain/loss sale of assets 0 0 -1 0 0 0 0EBITDA 0 11 77 95 119 147 198Depreciation 0 -10 -39 -50 -61 -68 -69Amortization/Write down 0 0 0 0 0 0 0EBIT 0 1 38 45 58 79 129EBIT, adj. 0 1 39 45 58 79 129
Associated companies 0 0 0 0 0 0 0Net interest 0 -10 -42 -49 -58 -59 -55Gains/losses on securities or financial instruments 0 -5 0 0 0 0 0Other financial Items 0 0 0Pre-tax profit 0 -14 -4 -4 1 20 74Tax 0 0 0 0 0 0 0Minorities 0 0 0 0 0 0 0Result from discontinued operations/ Other 0 0 0 0 0 0 0Net income 0 -14 -4 -4 1 20 74
Adjustments after tax 0 5 1 0 0 0 0Adjusted net income 0 -9 -3 -4 1 20 74
EPS (USD) -0.41 -0.09 -0.09 0.01 0.25 0.94EPS, adj. (USD) -0.26 -0.06 -0.09 0.01 0.25 0.94
Balance sheet (USDm) 2009 2010 2011 2012 2013E 2014E 2015ELong-term interest bearing assets 0 19 32 21 21 21 21Fixed assets 0 826 1,020 1,217 1,318 1,336 1,267Other long-term assets 79 95 82 82 82 82Long-term assets 0 924 1,147 1,320 1,421 1,440 1,370
Other current assets 5 7 8 10 12 15Cash and liquid assets 0 76 41 43 99 107 214Current assets 0 81 48 51 109 119 229
Total assets 0 1,005 1,195 1,371 1,530 1,559 1,599
Equity 0 254 239 231 326 330 388
Minorities 0 0 0 0 0 0 0
Long term interest bearing debt 0 717 873 974 1,025 1,036 1,000Finance obligation 0 0 0 0 0 0 0Other long-term liabilities 6 5 97 97 97 97Long term liabilities 0 722 879 1,072 1,122 1,133 1,097
Short term interest bearing debt 0 5 12 20 20 20 20Other short term liabilities 0 24 66 48 63 76 94Current liabilities 0 29 78 68 83 95 114
Total liabilities and equity 0 1,005 1,195 1,371 1,530 1,559 1,599
Working capital 0 -19 -59 -40 -53 -63 -79Net debt 0 627 812 930 924 928 785
Cash flow (USDm) 2009 2010 2011 2012 2013E 2014E 2015EPre-tax profit 0 -14 -4 -4 1 20 74- Associated companies 0 0 0 0 0 0 0+ Depreciation and amortization 0 10 39 50 61 68 69- Payable tax 0 0 0 0 0 0 0+/- Other operating items 0 0 -7 55 0 0 0Cash flow from operations 0 -3 28 100 62 88 143
Change in working capital 0 19 40 -19 12 11 15Operating cash flow 0 16 68 82 74 98 159
Maintenance capex 0 0 0 0 0 0 0Growth capex 0 -774 -223 -225 -162 -86 0Acquisition capex 0 0 -7 0 0 0 0Sale of assets 0 0 0 0 0 0 0Cash flow from investments 0 -774 -230 -225 -162 -86 0
Free cash flow 0 -758 -162 -143 -88 12 159
Dividend paid 0 0 -10 -10 -8 -16 -16Share buy back 0 0 0 0 6 0 0Equity increase 0 0 0 0 96 0 0Cash flow from financing 0 0 -10 -10 94 -16 -16
Other items 0 131 -14 35 0 0 0
Change in net debt 0 627 185 118 -6 4 -143

72
Analyst: Frode Mørkedal Tel: +47 22 01 63 27 E-mail: [email protected] Next report date: 14.05.2013 Disclosure:
Analyst: Herman Hildan Tel: +47 22 01 63 53 E-mail: [email protected]
Improved quarter but still weak Neptune Orient Lines is expected to report improvedquarterly results vs. last year but also from 4Q12. Thatsaid, we have adjusted our full year 2013 estimatesdownwards due to the weaker than expected start of theyear. We find valuation unattractive on 2013 estimates but fair on 2014 estimates, hence we reiterate Neutral.
• 1Q13 expectations: We look for 1% decline in average freight rates to $2394/FEU. Volumes are expected to beflat. In 4Q12 the Company surprised (negatively) with ahigher reliance on Intra-Asia trades which saw volumes improve 17% q/q. This trade lane is expected to staydepressed in 2013 as cascading vessels from the mainEast-West trade lanes end up pressuring Intra-Asia rates. We look for 1Q13 EBITDA of USD 44m, up from USD 17min 4Q12 and USD -151m in 1Q12.
• Full year estimates: We factor in Asia-Europe spot rates of $1300/TEU for 2013 and Asia-USWC of $2300/FEU. We look for NOL average freight rates to drop 5% y-y. We factor in 10% increase in volumes reflecting 3% increase inthe fleet and average 12.8 voyages per ship, which is upfrom last year reflecting changing trade mix with moreshort-haul Intra-Asia trades. We lower our full year EBITDA from USD 555m to USD 319m. Consensus is at USD 600m.
NOL trades with high earnings multiples but should be supported by NAV on the downside, and the eventual recovery of the container ship market into 2014. We reiterate Neutral.
Neptune Orient LinesSector: Marine
Recommendation: NEUTRAL (unchanged)
Target price (SGD): 1.2 (1.2)
Company descriptionNOL is one of the largest container shipping companies with principal activities in Container shipping, Logistics and Terminal operations. Listed on Singapore exchange under the ticker NOL SP.
1.0
1.1
1.2
1.3
1.4
1.5
1.6
apr. 12 jun. 12 aug.12
okt. 12 des. 12 feb. 13 apr. 13
Share price (SGD) in Neptune Orient Lines relative to key indices
Neptune Orient Lines Straits Times Index (Rebased)
Shareholders Shares VotesTemasek Holdings 67.2 % 67.2 %
Free Float 32.8 % 32.8 %
Changes in estimates (USDm)2013E 2014E
New Old Chg. New Old Chg.Oper. revenue 10 029 9 725 3% 11 100 10 616 5%EBITDA, adj. 319 555 -42% 788 1 086 -27%EBIT, adj. -55 236 nm 377 745 -49%Net income, adj. -171 111 nm 258 622 -59%EPS, adj. (USD) -0.1 0.0 nm 0.1 0.2 -59%
Company data (2013E)Share price (SGD) 1.16No. of shares (m) 2 586.0Market cap. (USDm) 2 425Net debt YE (USDm) 3 530Enterprise value (USDm) 5 955
Description of adjustments: Sale of assets, agio/disagio and gain/losses on financial instruments
Key figures 2009 2010 2011 2012 2013E 2014E 2015ERevenue (USDm) 6 516 9 422 9 211 9 512 10 029 11 100 10 976EBITDA (USDm) -345 869 -29 -5 319 788 826EBITDA, adj. (USDm) -346 864 -30 103 319 788 826EBIT, adj. (USDm) -632 579 -325 -212 -55 377 426Pre-tax profit, adj. (USDm) -663 559 -364 -372 -113 316 381Net income, adj. (USDm) -705 485 -414 -323 -171 258 322EPS, adj. (USD) -0.34 0.19 -0.16 -0.12 -0.07 0.10 0.12OCFPS (USD) -0.3 0.3 -0.1 0.0 0.1 0.3 0.3FCFPS (USD) -0.3 0.1 -0.6 -0.4 -0.2 0.2 0.3BVPS (USD) 1.1 1.3 1.0 0.9 0.8 0.9 1.0Net asset value (NAV) (USD) 0.0 0.0 0.9 0.9 0.0 0.0 0.0Dividend (USD) 0.00 0.05 0.00 0.00 0.00 0.00 0.00EV/EBITDA, adj. (x) n.m. 5.5 n.m. 53.3 18.6 6.9 5.7EV/EBIT, adj. (x) n.m. 8.2 n.m. n.m. n.m. 14.5 11.1P/E, adj. (x) n.m. 9.0 n.m. n.m. n.m. 9.4 7.5P/OCF (x) n.m. 6.3 n.m. n.m. 11.4 3.5 3.4EV/FCF (x) n.m. 19.6 n.m. n.m. n.m. 10.9 6.6P/Book (x) 1.1 1.3 0.8 1.1 1.2 1.0 0.9P/NAV (x) n.m. n.m. 1.0 1.1 n.m. n.m. n.m.Dividend yield (%) 0.0 2.7 0.0 0.0 0.0 0.0 0.0
Key Assumptions 2009 2010 2011 2012 2013E 2014E 2015EBox rate change (%) y-y 22 -11 1 -5 2 0
Result Preview 15-Apr-13
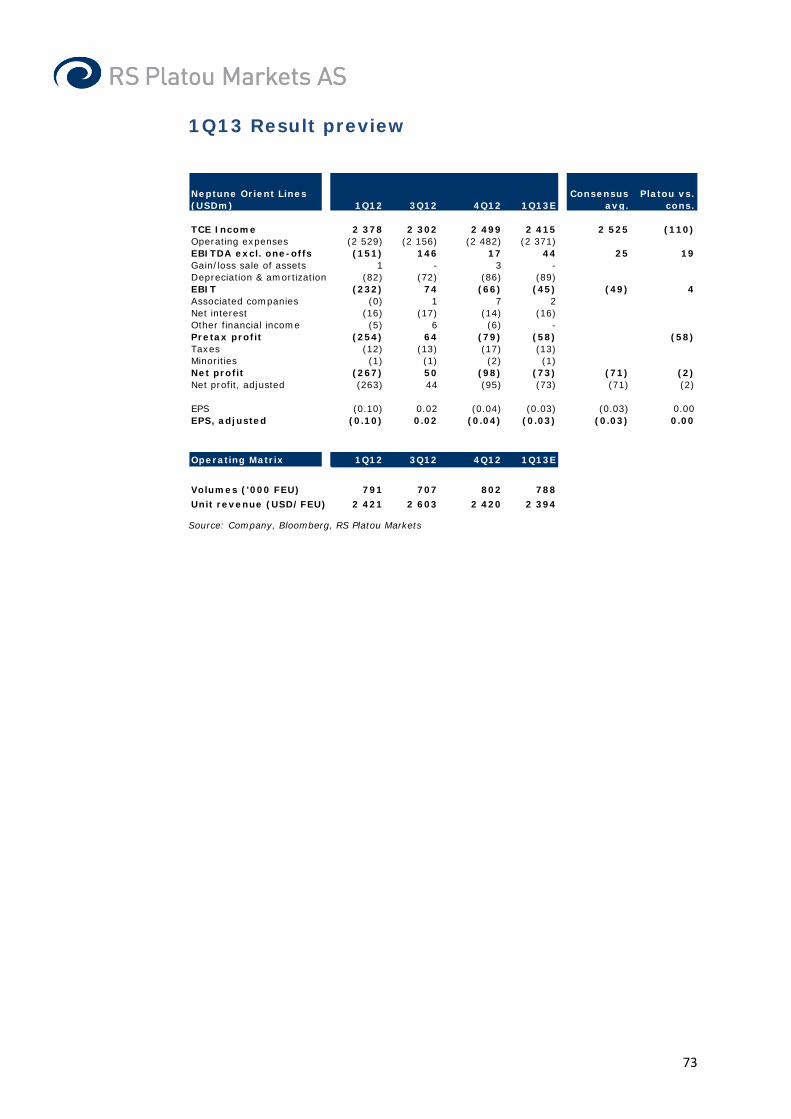
73
1Q13 Result preview
Source: Company, Bloomberg, RS Platou Markets
Neptune Orient Lines (USDm) 1Q12 3Q12 4Q12 1Q13E
Consensus avg.
Platou vs. cons.
TCE Income 2 378 2 302 2 499 2 415 2 525 (110)Operating expenses (2 529) (2 156) (2 482) (2 371)EBITDA excl. one-offs (151) 146 17 44 25 19Gain/loss sale of assets 1 - 3 -Depreciation & amortization (82) (72) (86) (89)EBIT (232) 74 (66) (45) (49) 4Associated companies (0) 1 7 2Net interest (16) (17) (14) (16)Other financial income (5) 6 (6) -Pretax profit (254) 64 (79) (58) (58)Taxes (12) (13) (17) (13)Minorities (1) (1) (2) (1)Net profit (267) 50 (98) (73) (71) (2)Net profit, adjusted (263) 44 (95) (73) (71) (2)
EPS (0.10) 0.02 (0.04) (0.03) (0.03) 0.00EPS, adjusted (0.10) 0.02 (0.04) (0.03) (0.03) 0.00
Operating Matrix 1Q12 3Q12 4Q12 1Q13E
Volumes ('000 FEU) 791 707 802 788
Unit revenue (USD/FEU) 2 421 2 603 2 420 2 394

74
Profit and loss (USDm) 2009 2010 2011 2012 2013E 2014E 2015ETotal revenue 6 516 9 422 9 211 9 512 10 029 11 100 10 976Voyage expenses & commissions 0 0 0 0 0 0 0Time-charter equivalent 6 516 9 422 9 211 9 512 10 029 11 100 10 976
Operating expenses -6 861 -8 558 -9 240 -9 409 -9 710 -10 312 -10 150
EBITDA, adj. -346 864 -30 103 319 788 826Gain/loss sale of assets 1 5 1 -108 0 0 0EBITDA -345 869 -29 -5 319 788 826Depreciation -286 -285 -295 -315 -375 -412 -400Amortization/Write down 0 0 0 0 0 0 0EBIT -632 584 -324 -320 -55 377 426EBIT, adj. -632 579 -325 -212 -55 377 426
Associated companies 3 5 9 9 9 9 9Net interest -35 -30 -49 -61 -67 -70 -55Gains/losses on securities or financial instruments -37 -29 -64 -15 0 0 0Other financial Items 0 0 0 0Pre-tax profit -700 530 -428 -387 -113 316 381Tax -39 -66 -45 -53 -53 -53 -53Minorities -2 -3 -4 -6 -6 -6 -6Result from discontinued operations/ Other 0 0 0 0 0 0 0Net income -741 461 -478 -446 -171 258 322
Adjustments after tax 36 24 63 123 0 0 0Adjusted net income -705 485 -414 -323 -171 258 322
EPS (USD) -0.36 0.18 -0.18 -0.17 -0.07 0.10 0.12EPS, adj. (USD) -0.34 0.19 -0.16 -0.12 -0.07 0.10 0.12
Balance sheet (USDm) 2009 2010 2011 2012 2013E 2014E 2015ELong-term interest bearing assets 0 0 0 0 0 0 0Fixed assets 3 509 3 691 4 790 5 372 5 661 5 442 5 042Other long-term assets 327 357 407 463 473 482 492Long-term assets 3 836 4 049 5 196 5 835 6 134 5 924 5 534
Other current assets 1 171 1 425 1 538 1 485 1 565 1 733 1 713Cash and liquid assets 333 977 228 897 976 886 1 272Current assets 1 504 2 402 1 766 2 382 2 542 2 619 2 985
Total assets 5 341 6 451 6 962 8 217 8 676 8 543 8 519
Equity 2 797 3 222 2 601 2 212 2 040 2 298 2 620
Minorities 44 43 51 54 59 65 71
Long term interest bearing debt 919 1 338 1 932 3 547 4 077 3 486 3 157Finance obligation 25 18 0 0 0 0 0Other long-term liabilities 198 213 252 247 247 247 247Long term liabilities 1 142 1 569 2 184 3 794 4 324 3 734 3 404
Short term interest bearing debt 21 21 422 429 429 429 429Other short term liabilities 1 337 1 595 1 704 1 728 1 822 2 017 1 994Current liabilities 1 358 1 616 2 126 2 158 2 252 2 446 2 424
Total liabilities and equity 5 341 6 451 6 962 8 217 8 676 8 543 8 519
Working capital -166 -170 -165 -244 -257 -284 -281Net debt 632 400 2 126 3 079 3 530 3 029 2 314
Cash flow (USDm) 2009 2010 2011 2012 2013E 2014E 2015EPre-tax profit -700 530 -428 -387 -113 316 381- Associated companies -3 -5 -9 -9 -9 -9 -9+ Depreciation and amortization 286 285 295 315 375 412 400- Payable tax -39 -66 -45 -53 -53 -53 -53+/- Other operating items 127 79 28 44 0 0 0Cash flow from operations -329 823 -160 -91 200 666 718
Change in working capital -221 -130 -4 78 13 27 -3Operating cash flow -551 693 -164 -12 213 693 715
Maintenance capex 0 0 0 0 0 0 0Growth capex -89 -471 -1 462 -1 002 -960 -192 0Acquisition capex -11 -6 -47 -46 0 0 0Sale of assets 27 28 14 150 295 0 0Cash flow from investments -73 -450 -1 495 -898 -665 -192 0
Free cash flow -624 243 -1 659 -910 -451 501 715
Dividend paid -42 -3 -97 -3 0 0 0Share buy back 0 0 0 0 0 0 0Equity increase 965 1 0 1 0 0 0Cash flow from financing 924 -1 -97 -1 0 0 0
Other items -91 -10 30 -41 0 0 0
Change in net debt -208 -232 1 726 953 451 -501 -715
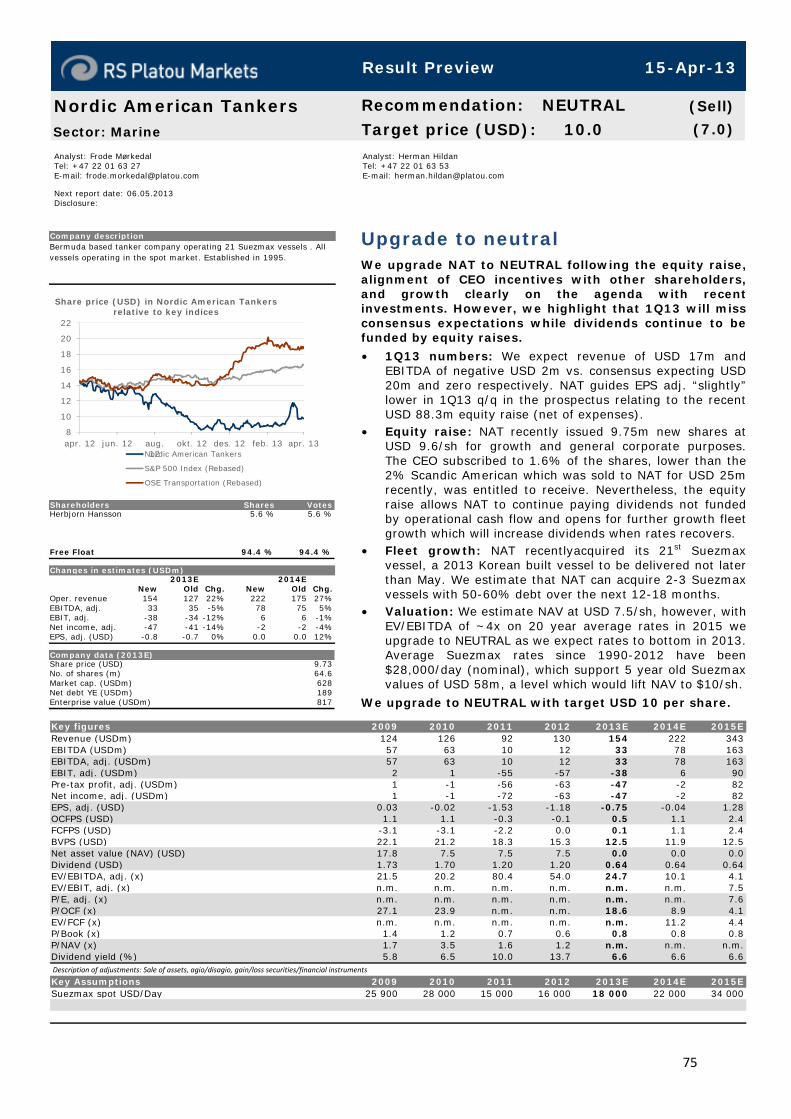
75
Analyst: Frode Mørkedal Tel: +47 22 01 63 27 E-mail: [email protected] Next report date: 06.05.2013 Disclosure:
Analyst: Herman Hildan Tel: +47 22 01 63 53 E-mail: [email protected]
Upgrade to neutral We upgrade NAT to NEUTRAL following the equity raise,alignment of CEO incentives with other shareholders, and growth clearly on the agenda with recentinvestments. However, we highlight that 1Q13 will missconsensus expectations while dividends continue to befunded by equity raises.
• 1Q13 numbers: We expect revenue of USD 17m and EBITDA of negative USD 2m vs. consensus expecting USD20m and zero respectively. NAT guides EPS adj. “slightly”lower in 1Q13 q/q in the prospectus relating to the recentUSD 88.3m equity raise (net of expenses).
• Equity raise: NAT recently issued 9.75m new shares at USD 9.6/sh for growth and general corporate purposes.The CEO subscribed to 1.6% of the shares, lower than the2% Scandic American which was sold to NAT for USD 25mrecently, was entitled to receive. Nevertheless, the equityraise allows NAT to continue paying dividends not funded by operational cash flow and opens for further growth fleetgrowth which will increase dividends when rates recovers.
• Fleet growth: NAT recentlyacquired its 21st Suezmax vessel, a 2013 Korean built vessel to be delivered not later than May. We estimate that NAT can acquire 2-3 Suezmax vessels with 50-60% debt over the next 12-18 months.
• Valuation: We estimate NAV at USD 7.5/sh, however, with EV/EBITDA of ~4x on 20 year average rates in 2015 weupgrade to NEUTRAL as we expect rates to bottom in 2013. Average Suezmax rates since 1990-2012 have been $28,000/day (nominal), which support 5 year old Suezmaxvalues of USD 58m, a level which would lift NAV to $10/sh.
We upgrade to NEUTRAL with target USD 10 per share.
Nordic American TankersSector: Marine
Recommendation: NEUTRAL (Sell)
Target price (USD): 10.0 (7.0)
Company descriptionBermuda based tanker company operating 21 Suezmax vessels . All vessels operating in the spot market. Established in 1995.
8
10
12
14
16
18
20
22
apr. 12 jun. 12 aug.12
okt. 12 des. 12 feb. 13 apr. 13
Share price (USD) in Nordic American Tankers relative to key indices
Nordic American Tankers
S&P 500 Index (Rebased)
OSE Transportation (Rebased)
Shareholders Shares VotesHerbjorn Hansson 5.6 % 5.6 %
Free Float 94.4 % 94.4 %
Changes in estimates (USDm)2013E 2014E
New Old Chg. New Old Chg.Oper. revenue 154 127 22% 222 175 27%EBITDA, adj. 33 35 -5% 78 75 5%EBIT, adj. -38 -34 -12% 6 6 -1%Net income, adj. -47 -41 -14% -2 -2 -4%EPS, adj. (USD) -0.8 -0.7 0% 0.0 0.0 12%
Company data (2013E)Share price (USD) 9.73No. of shares (m) 64.6Market cap. (USDm) 628Net debt YE (USDm) 189Enterprise value (USDm) 817
Description of adjustments: Sale of assets, agio/disagio, gain/loss securities/financial instruments
Key figures 2009 2010 2011 2012 2013E 2014E 2015ERevenue (USDm) 124 126 92 130 154 222 343EBITDA (USDm) 57 63 10 12 33 78 163EBITDA, adj. (USDm) 57 63 10 12 33 78 163EBIT, adj. (USDm) 2 1 -55 -57 -38 6 90Pre-tax profit, adj. (USDm) 1 -1 -56 -63 -47 -2 82Net income, adj. (USDm) 1 -1 -72 -63 -47 -2 82EPS, adj. (USD) 0.03 -0.02 -1.53 -1.18 -0.75 -0.04 1.28OCFPS (USD) 1.1 1.1 -0.3 -0.1 0.5 1.1 2.4FCFPS (USD) -3.1 -3.1 -2.2 0.0 0.1 1.1 2.4BVPS (USD) 22.1 21.2 18.3 15.3 12.5 11.9 12.5Net asset value (NAV) (USD) 17.8 7.5 7.5 7.5 0.0 0.0 0.0Dividend (USD) 1.73 1.70 1.20 1.20 0.64 0.64 0.64EV/EBITDA, adj. (x) 21.5 20.2 80.4 54.0 24.7 10.1 4.1EV/EBIT, adj. (x) n.m. n.m. n.m. n.m. n.m. n.m. 7.5P/E, adj. (x) n.m. n.m. n.m. n.m. n.m. n.m. 7.6P/OCF (x) 27.1 23.9 n.m. n.m. 18.6 8.9 4.1EV/FCF (x) n.m. n.m. n.m. n.m. n.m. 11.2 4.4P/Book (x) 1.4 1.2 0.7 0.6 0.8 0.8 0.8P/NAV (x) 1.7 3.5 1.6 1.2 n.m. n.m. n.m.Dividend yield (%) 5.8 6.5 10.0 13.7 6.6 6.6 6.6
Key Assumptions 2009 2010 2011 2012 2013E 2014E 2015ESuezmax spot USD/Day 25 900 28 000 15 000 16 000 18 000 22 000 34 000
Result Preview 15-Apr-13

76
1Q13 Result preview
Source: Bloomberg, RS Platou Markets
Nordic American Tanker (USDm) 1Q12 3Q12 4Q12
Platou 1Q13E
Consensus avg.
Platou vs. cons.
TCE Income 30 15 18 17 20 (3)
Operating expenses (22) (20) (18) (19) (19) 1
EBITDA excl. one-offs 8 (4) (1) (2) 0 (2)Gain/loss sale of assets - - - -Depreciation & amortization (17) (17) (18) (18) (16)EBIT (9) (22) (18) (19) (16) (3)Associated companies - - - -Net interest (1) (2) (2) (2) (2) (0)Other financial income 0 (0) 0 -Pretax profit (9) (23) (33) (22) (18) (4)Taxes - - - -Minorities - - - -Net profit (9) (23) (33) (22) (20) (2)Net profit, adjusted (10) (23) (21) (22) (19) (3)
EPS (0.18) (0.44) (0.61) (0.40) (0.40) 0.00EPS, adjusted (0.19) (0.44) (0.39) (0.40) (0.29) (0.11)
Dividend 0.30 0.30 0.30 0.16 0.16 0.00
77
Profit and loss (USDm) 2009 2010 2011 2012 2013E 2014E 2015ETotal revenue 124 126 92 130 154 222 343Voyage expenses & commissions -9 0 -13 -39 -46 -66 -103Time-charter equivalent 115 126 80 91 108 156 241
Operating expenses -58 -63 -70 -79 -75 -77 -78
EBITDA, adj. 57 63 10 12 33 78 163Gain/loss sale of assets 0 0 0 0 0 0 0EBITDA 57 63 10 12 33 78 163Depreciation -55 -63 -65 -69 -71 -73 -73Amortization/Write down 0 0 -16 0 0 0 0EBIT 2 1 -71 -57 -38 6 90EBIT, adj. 2 1 -55 -57 -38 6 90
Associated companies 0 0 0 0 0 0 0Net interest -1 -2 -1 -5 -8 -8 -8Gains/losses on securities or financial instruments 0 0 0 0 0 0 0Other financial Items 0Pre-tax profit 1 -1 -72 -62 -47 -2 82Tax 0 0 0 0 0 0 0Minorities 0 0 0 0 0 0 0Result from discontinued operations/ Other 0 0 0 0 0 0 0Net income 1 -1 -72 -62 -47 -2 82
Adjustments after tax 0 0 0 0 0 0 0Adjusted net income 1 -1 -72 -63 -47 -2 82
EPS (USD) 0.03 -0.02 -1.53 -1.18 -0.75 -0.04 1.28EPS, adj. (USD) 0.03 -0.02 -1.53 -1.18 -0.75 -0.04 1.28
Balance sheet (USDm) 2009 2010 2011 2012 2013E 2014E 2015ELong-term interest bearing assets 0 0 0 0 0 0 0Fixed assets 825 988 1 023 965 959 887 814Other long-term assets 11 23 19 42 50 50 50Long-term assets 836 1 011 1 042 1 007 1 009 937 864
Other current assets 80 54 59 23 34 49 75Cash and liquid assets 30 17 24 56 91 120 234Current assets 110 72 83 79 125 169 309
Total assets 947 1 083 1 125 1 086 1 134 1 105 1 173
Equity 934 993 868 809 810 766 807
Minorities 0 0 0 0 0 0 0
Long term interest bearing debt 0 75 230 250 280 280 280Finance obligation 0 0 0 0 0 0 0Other long-term liabilities 6 8 10 11 11 11 11Long term liabilities 6 83 240 261 291 291 291
Short term interest bearing debt 0 0 0 0 0 0 0Other short term liabilities 7 7 18 15 33 48 74Current liabilities 7 7 18 15 33 48 74
Total liabilities and equity 947 1 083 1 125 1 086 1 134 1 105 1 173
Working capital 73 47 41 8 0 0 1Net debt -30 58 206 194 189 160 46
Cash flow (USDm) 2009 2010 2011 2012 2013E 2014E 2015EPre-tax profit 1 -1 -72 -62 -47 -2 82- Associated companies 0 0 0 0 0 0 0+ Depreciation and amortization 55 63 81 69 71 73 73- Payable tax 0 0 0 0 0 0 0+/- Other operating items 5 -36 -27 -48 0 0 0Cash flow from operations 61 26 -18 -41 25 70 155
Change in working capital -16 25 6 33 8 0 0Operating cash flow 45 51 -12 -8 32 70 155
Maintenance capex 0 0 0 0 -17 0 0Growth capex -172 -196 -92 -3 0 0 0Acquisition capex 0 0 0 9 -8 0 0Sale of assets 0 0 0 0 0 0 0Cash flow from investments -172 -196 -92 6 -25 0 0
Free cash flow -127 -145 -104 -2 7 70 155
Dividend paid -95 -80 -54 -63 -41 -41 -41Share buy back 0 0 0 0 0 0 0Equity increase 237 137 0 76 0 0 0Cash flow from financing 141 57 -54 12 -41 -41 -41
Other items 0 0 10 1 40 0 0
Change in net debt -14 88 148 -12 -6 -29 -113
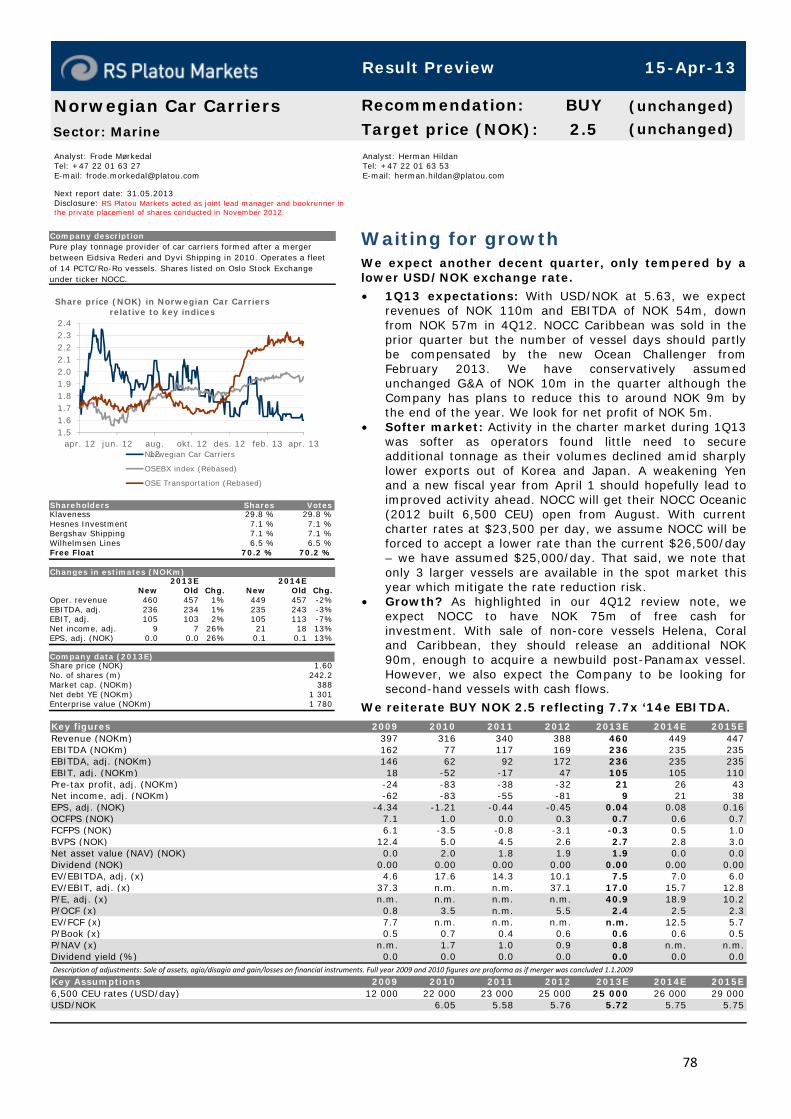
78
Analyst: Frode Mørkedal Tel: +47 22 01 63 27 E-mail: [email protected] Next report date: 31.05.2013 Disclosure: RS Platou Markets acted as joint lead manager and bookrunner in the private placement of shares conducted in November 2012.
Analyst: Herman Hildan Tel: +47 22 01 63 53 E-mail: [email protected]
Waiting for growth We expect another decent quarter, only tempered by alower USD/NOK exchange rate.
• 1Q13 expectations: With USD/NOK at 5.63, we expect revenues of NOK 110m and EBITDA of NOK 54m, downfrom NOK 57m in 4Q12. NOCC Caribbean was sold in theprior quarter but the number of vessel days should partlybe compensated by the new Ocean Challenger fromFebruary 2013. We have conservatively assumed unchanged G&A of NOK 10m in the quarter although theCompany has plans to reduce this to around NOK 9m bythe end of the year. We look for net profit of NOK 5m.
• Softer market: Activity in the charter market during 1Q13 was softer as operators found little need to secure additional tonnage as their volumes declined amid sharplylower exports out of Korea and Japan. A weakening Yenand a new fiscal year from April 1 should hopefully lead toimproved activity ahead. NOCC will get their NOCC Oceanic (2012 built 6,500 CEU) open from August. With currentcharter rates at $23,500 per day, we assume NOCC will beforced to accept a lower rate than the current $26,500/day– we have assumed $25,000/day. That said, we note thatonly 3 larger vessels are available in the spot market this year which mitigate the rate reduction risk.
• Growth? As highlighted in our 4Q12 review note, we expect NOCC to have NOK 75m of free cash forinvestment. With sale of non-core vessels Helena, Coraland Caribbean, they should release an additional NOK90m, enough to acquire a newbuild post-Panamax vessel. However, we also expect the Company to be looking forsecond-hand vessels with cash flows.
We reiterate BUY NOK 2.5 reflecting 7.7x ‘14e EBITDA.
Norwegian Car CarriersSector: Marine
Recommendation: BUY (unchanged)
Target price (NOK): 2.5 (unchanged)
Company descriptionPure play tonnage provider of car carriers formed after a merger between Eidsiva Rederi and Dyvi Shipping in 2010. Operates a fleet of 14 PCTC/Ro-Ro vessels. Shares listed on Oslo Stock Exchange under ticker NOCC.
1.51.61.71.81.92.02.12.22.32.4
apr. 12 jun. 12 aug.12
okt. 12 des. 12 feb. 13 apr. 13
Share price (NOK) in Norwegian Car Carriers relative to key indices
Norwegian Car Carriers
OSEBX index (Rebased)
OSE Transportation (Rebased)
Shareholders Shares VotesKlaveness 29.8 % 29.8 %Hesnes Investment 7.1 % 7.1 %Bergshav Shipping 7.1 % 7.1 %Wilhelmsen Lines 6.5 % 6.5 %Free Float 70.2 % 70.2 %
Changes in estimates (NOKm)2013E 2014E
New Old Chg. New Old Chg.Oper. revenue 460 457 1% 449 457 -2%EBITDA, adj. 236 234 1% 235 243 -3%EBIT, adj. 105 103 2% 105 113 -7%Net income, adj. 9 7 26% 21 18 13%EPS, adj. (NOK) 0.0 0.0 26% 0.1 0.1 13%
Company data (2013E)Share price (NOK) 1.60No. of shares (m) 242.2Market cap. (NOKm) 388Net debt YE (NOKm) 1 301Enterprise value (NOKm) 1 780
Description of adjustments: Sale of assets, agio/disagio and gain/losses on financial instruments. Full year 2009 and 2010 figures are proforma as if merger was concluded 1.1.2009
Key figures 2009 2010 2011 2012 2013E 2014E 2015ERevenue (NOKm) 397 316 340 388 460 449 447EBITDA (NOKm) 162 77 117 169 236 235 235EBITDA, adj. (NOKm) 146 62 92 172 236 235 235EBIT, adj. (NOKm) 18 -52 -17 47 105 105 110Pre-tax profit, adj. (NOKm) -24 -83 -38 -32 21 26 43Net income, adj. (NOKm) -62 -83 -55 -81 9 21 38EPS, adj. (NOK) -4.34 -1.21 -0.44 -0.45 0.04 0.08 0.16OCFPS (NOK) 7.1 1.0 0.0 0.3 0.7 0.6 0.7FCFPS (NOK) 6.1 -3.5 -0.8 -3.1 -0.3 0.5 1.0BVPS (NOK) 12.4 5.0 4.5 2.6 2.7 2.8 3.0Net asset value (NAV) (NOK) 0.0 2.0 1.8 1.9 1.9 0.0 0.0Dividend (NOK) 0.00 0.00 0.00 0.00 0.00 0.00 0.00EV/EBITDA, adj. (x) 4.6 17.6 14.3 10.1 7.5 7.0 6.0EV/EBIT, adj. (x) 37.3 n.m. n.m. 37.1 17.0 15.7 12.8P/E, adj. (x) n.m. n.m. n.m. n.m. 40.9 18.9 10.2P/OCF (x) 0.8 3.5 n.m. 5.5 2.4 2.5 2.3EV/FCF (x) 7.7 n.m. n.m. n.m. n.m. 12.5 5.7P/Book (x) 0.5 0.7 0.4 0.6 0.6 0.6 0.5P/NAV (x) n.m. 1.7 1.0 0.9 0.8 n.m. n.m.Dividend yield (%) 0.0 0.0 0.0 0.0 0.0 0.0 0.0
Key Assumptions 2009 2010 2011 2012 2013E 2014E 2015E6,500 CEU rates (USD/day) 12 000 22 000 23 000 25 000 25 000 26 000 29 000USD/NOK 6.05 5.58 5.76 5.72 5.75 5.75
Result Preview 15-Apr-13
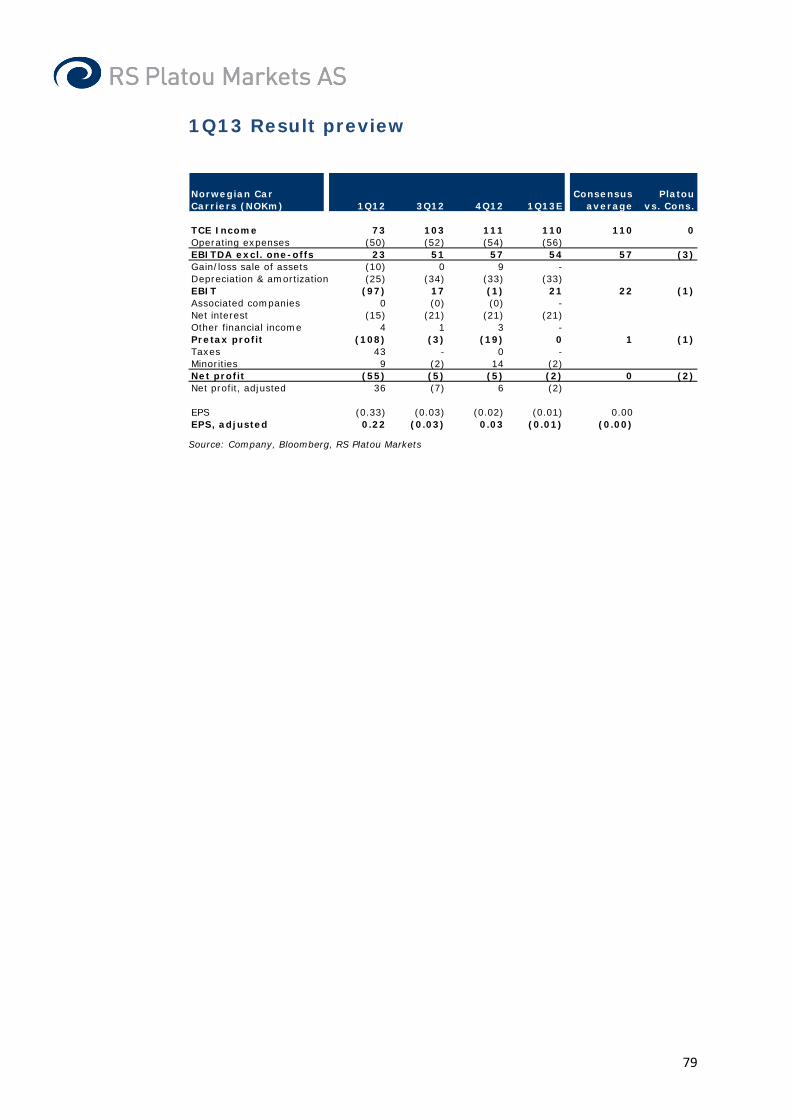
79
1Q13 Result preview
Source: Company, Bloomberg, RS Platou Markets
Norwegian Car Carriers (NOKm) 1Q12 3Q12 4Q12 1Q13E
Consensus average
Platou vs. Cons.
TCE Income 73 103 111 110 110 0Operating expenses (50) (52) (54) (56)EBITDA excl. one-offs 23 51 57 54 57 (3)Gain/loss sale of assets (10) 0 9 -Depreciation & amortization (25) (34) (33) (33)EBIT (97) 17 (1) 21 22 (1)Associated companies 0 (0) (0) -Net interest (15) (21) (21) (21)Other financial income 4 1 3 -Pretax profit (108) (3) (19) 0 1 (1)Taxes 43 - 0 -Minorities 9 (2) 14 (2)Net profit (55) (5) (5) (2) 0 (2)Net profit, adjusted 36 (7) 6 (2)
EPS (0.33) (0.03) (0.02) (0.01) 0.00EPS, adjusted 0.22 (0.03) 0.03 (0.01) (0.00)

80
Profit and loss (NOKm) 2009 2010 2011 2012 2013E 2014E 2015ETotal revenue 397 316 340 388 460 449 447Voyage expenses & commissions 0 0 0 0 0 0 0Time-charter equivalent 397 316 340 388 460 449 447
Operating expenses -251 -255 -248 -216 -224 -214 -212
EBITDA, adj. 146 62 92 172 236 235 235Gain/loss sale of assets 17 16 25 -4 0 0 0EBITDA 162 77 117 169 236 235 235Depreciation -128 -114 -109 -125 -131 -130 -124Amortization/Write down -51 0 -30 -118 0 0 0EBIT -17 -37 -22 -75 105 105 110EBIT, adj. 18 -52 -17 47 105 105 110
Associated companies -9 5 14 0 0 0 0Net interest -50 -52 -61 -75 -84 -79 -67Gains/losses on securities or financial instruments -16 19 -17 7 0 0 0Other financial Items 22 3 0 0Pre-tax profit -69 -60 -85 -143 21 26 43Tax 18 4 29 44 0 0 0Minorities 12 12 10 21 -11 -6 -6Result from discontinued operations/ Other 0 -22 12 0 0 0 0Net income -39 -67 -34 -78 9 21 38
Adjustments after tax -23 -16 -21 -3 0 0 0Adjusted net income -62 -83 -55 -81 9 21 38
EPS (NOK) -2.74 -0.97 -0.27 -0.43 0.04 0.08 0.16EPS, adj. (NOK) -4.34 -1.21 -0.44 -0.45 0.04 0.08 0.16
Balance sheet (NOKm) 2009 2010 2011 2012 2013E 2014E 2015ELong-term interest bearing assets 0 3 3 2 2 2 2Fixed assets 719 1 189 1 636 1 944 2 033 1 927 1 722Other long-term assets 57 100 68 20 20 20 20Long-term assets 777 1 292 1 706 1 966 2 056 1 949 1 744
Other current assets 9 26 35 49 59 57 57Cash and liquid assets 82 304 209 281 217 211 242Current assets 92 329 244 330 276 268 299
Total assets 868 1 621 1 950 2 296 2 331 2 217 2 043
Equity 175 411 470 556 566 586 624
Minorities 100 90 125 83 94 100 105
Long term interest bearing debt 405 848 996 1 382 1 380 1 242 1 025Finance obligation 0 0 0 0 0 0 0Other long-term liabilities 2 9 99 48 48 48 48Long term liabilities 407 857 1 095 1 431 1 428 1 290 1 074
Short term interest bearing debt 113 119 171 138 138 138 138Other short term liabilities 73 143 89 89 105 102 102Current liabilities 187 262 260 227 243 241 240
Total liabilities and equity 868 1 621 1 950 2 296 2 331 2 217 2 043
Working capital -64 -117 -54 -39 -46 -45 -45Net debt 437 664 958 1 240 1 301 1 169 921
Cash flow (NOKm) 2009 2010 2011 2012 2013E 2014E 2015EPre-tax profit -69 -60 -85 -143 21 26 43- Associated companies 9 -5 -14 0 0 0 0+ Depreciation and amortization 179 114 139 243 131 130 124- Payable tax 18 4 29 44 0 0 0+/- Other operating items -48 -39 -10 -73 0 0 0Cash flow from operations 88 13 59 71 152 156 168
Change in working capital 13 53 -63 -15 7 -1 0Operating cash flow 101 66 -4 56 159 155 167
Maintenance capex 0 -78 -61 -6 -6 -30 -29Growth capex 0 -249 -102 -738 -284 0 0Acquisition capex -14 0 -16 1 0 0 0Sale of assets 0 21 82 128 69 7 109Cash flow from investments -14 -305 -97 -614 -221 -23 81
Free cash flow 87 -239 -101 -558 -61 132 248
Dividend paid 0 0 0 0 0 0 0Share buy back 0 0 0 0 0 0 0Equity increase 55 182 119 191 0 0 0Cash flow from financing 55 182 119 191 0 0 0
Other items 97 -170 -312 86 0 0 0
Change in net debt -239 228 294 281 61 -132 -248

81
Analyst: Frode Mørkedal Tel: +47 22 01 63 27 E-mail: [email protected] Next report date: 07.05.2013 Disclosure:
Analyst: Herman Hildan Tel: +47 22 01 63 53 E-mail: [email protected]
Improved quarter expected On the back of a strong clean petroleum productsmarket, we expect Odfjell to outperform Stolt-Nielsen in the first quarter of 2013.
• 1Q13 expectation: Although Stolt-Nielsen disappointed with weaker than expected figures in its Dec-Feb quarter (volumes declined 2.9% and rates fell 1.8%), we expectOdfjell to report better Jan-Mar figures because of itshigher reliance on the spot market. The fact that Odfjellalso carries more CPP should be beneficial given the strongMR rates seen in 1Q13. We therefore expects Odfjell to report an improved quarter with chemical tankerscontributing EBITDA of USD 22m (+6% higher rates) andterminals USD 6m and LPG at USD 2m. Total EBITDAexcluding gains therefore expected at USD 30m vs. USD22m in the prior quarter.
• Valuation: We find valuation attractive at P/NAV 0.69x and EV/EBITDA 7.3x ‘14e and 6.4x ‘15e which reflectsexpectations of +8% and +9% higher rates in 2013 and2014, respectively.
• Balance sheet: Available liquidity was USD 267m pro forma by 4Q12. Assuming 65% bank financing on the four 46,000 dwt Hyundai Mipo newbuilds due 2014 andrefinancing of maturing bank balloons, the balance sheet issolid. We expect Odfjell to continue expanding within LPGand chemical tankers while the Terminals should be self-sufficient for the known expansion plans.
Odfjell has higher spot exposure than Stolt-Nielsen and should therefore see earnings grow faster once the market turns up in earnest. We reiterate BUY.
OdfjellSector: Marine
Recommendation: BUY (unchanged)
Target price (USD): 6.0 (unchanged)
Company descriptionOdfjell is a leading company in the global market for transportation and storage of chemicals and other speciality bulk liquids. Established in 1916 and based in Bergen. Listed at OSE under the ticker ODF and ODFB.
15
20
25
30
35
40
45
50
apr. 12 jun. 12 aug.12
okt. 12 des. 12 feb. 13 apr. 13
Share price (NOK) in Odfjell relative to key indices
Odfjell
OSEBX index (Rebased)
OSE Transportation (Rebased)
Shareholders Shares VotesNorchem ApS 39.5 % 39.5 %Odfjell SE 8.2 % 8.2 %Rederiet Odjfell AS 5.3 % 0.2 %JP Morgan Clearing 4.0 % 4.0 %Free Float 60.5 % 60.5 %
Changes in estimates (USDm)2013E 2014E
New Old Chg. New Old Chg.Oper. revenue 1 441 1 441 0% 1 730 1 730 0%EBITDA, adj. 154 153 0% 226 226 0%EBIT, adj. 24 24 1% 90 90 0%Net income, adj. -30 -30 1% 35 35 0%EPS, adj. (USD) -0.3 -0.4 1% 0.4 0.4 0%
Company data (2013E)Share price (NOK) 27.80No. of shares (m) 86.0Market cap. (USDm) 417Net debt YE (USDm) 1 202Enterprise value (USDm) 1 619
Description of adjustments: Sale of assets, agio/disagio and gain/losses on financial instruments
Key figures 2009 2010 2011 2012 2013E 2014E 2015ERevenue (USDm) 1 264 1 239 1 172 1 212 1 441 1 730 1 789EBITDA (USDm) 226 164 143 88 184 226 239EBITDA, adj. (USDm) 182 168 112 97 154 226 239EBIT, adj. (USDm) 31 23 -10 -33 24 90 98Pre-tax profit, adj. (USDm) 31 -24 -19 -92 4 39 48Net income, adj. (USDm) -42 -38 -56 -82 -30 35 44EPS, adj. (USD) -0.49 -0.44 -0.65 -0.96 -0.35 0.40 0.52OCFPS (USD) 1.7 2.0 2.2 0.5 0.9 1.8 2.1FCFPS (USD) 0.1 1.3 3.5 -1.0 0.8 -0.3 1.5BVPS (USD) 9.3 9.0 11.7 11.1 10.2 10.6 11.1Net asset value (NAV) (USD) 13.4 7.0 7.0 7.0 0.0 0.0 0.0Dividend (USD) 0.15 0.00 0.18 0.00 0.00 0.00 0.00EV/EBITDA, adj. (x) 11.9 12.9 13.9 16.1 10.5 7.3 6.4EV/EBIT, adj. (x) 69.8 96.3 n.m. n.m. 67.6 18.4 15.4P/E, adj. (x) n.m. n.m. n.m. n.m. n.m. 12.1 9.4P/OCF (x) 5.3 4.6 2.7 8.0 5.2 2.7 2.3EV/FCF (x) n.m. 19.2 5.2 n.m. 24.0 n.m. 11.6P/Book (x) 1.0 1.0 0.5 0.4 0.5 0.5 0.4P/NAV (x) 0.7 1.3 0.9 0.6 n.m. n.m. n.m.Dividend yield (%) 1.7 0.0 3.0 0.0 0.0 0.0 0.0
Key Assumptions 2009 2010 2011 2012 2013E 2014E 2015EChemical tanker utilization (%) 88.9 87.6 87.5 86.9 88.3 90.4 90.9
Result Preview 15-Apr-13
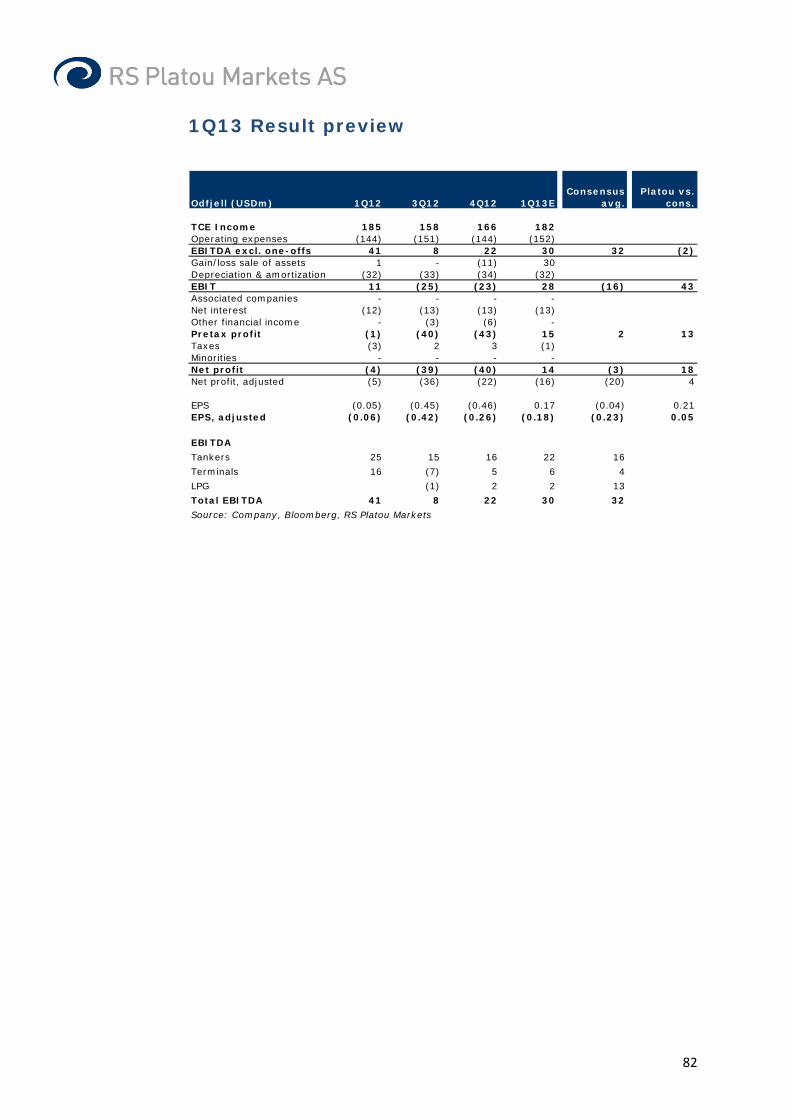
82
1Q13 Result preview
Odfjell (USDm) 1Q12 3Q12 4Q12 1Q13EConsensus
avg.Platou vs.
cons.
TCE Income 185 158 166 182Operating expenses (144) (151) (144) (152)EBITDA excl. one-offs 41 8 22 30 32 (2)Gain/loss sale of assets 1 - (11) 30Depreciation & amortization (32) (33) (34) (32)EBIT 11 (25) (23) 28 (16) 43Associated companies - - - -Net interest (12) (13) (13) (13)Other financial income - (3) (6) -Pretax profit (1) (40) (43) 15 2 13Taxes (3) 2 3 (1)Minorities - - - -Net profit (4) (39) (40) 14 (3) 18Net profit, adjusted (5) (36) (22) (16) (20) 4
EPS (0.05) (0.45) (0.46) 0.17 (0.04) 0.21EPS, adjusted (0.06) (0.42) (0.26) (0.18) (0.23) 0.05
EBITDA
Tankers 25 15 16 22 16
Terminals 16 (7) 5 6 4
LPG (1) 2 2 13
Total EBITDA 41 8 22 30 32
Source: Company, Bloomberg, RS Platou Markets
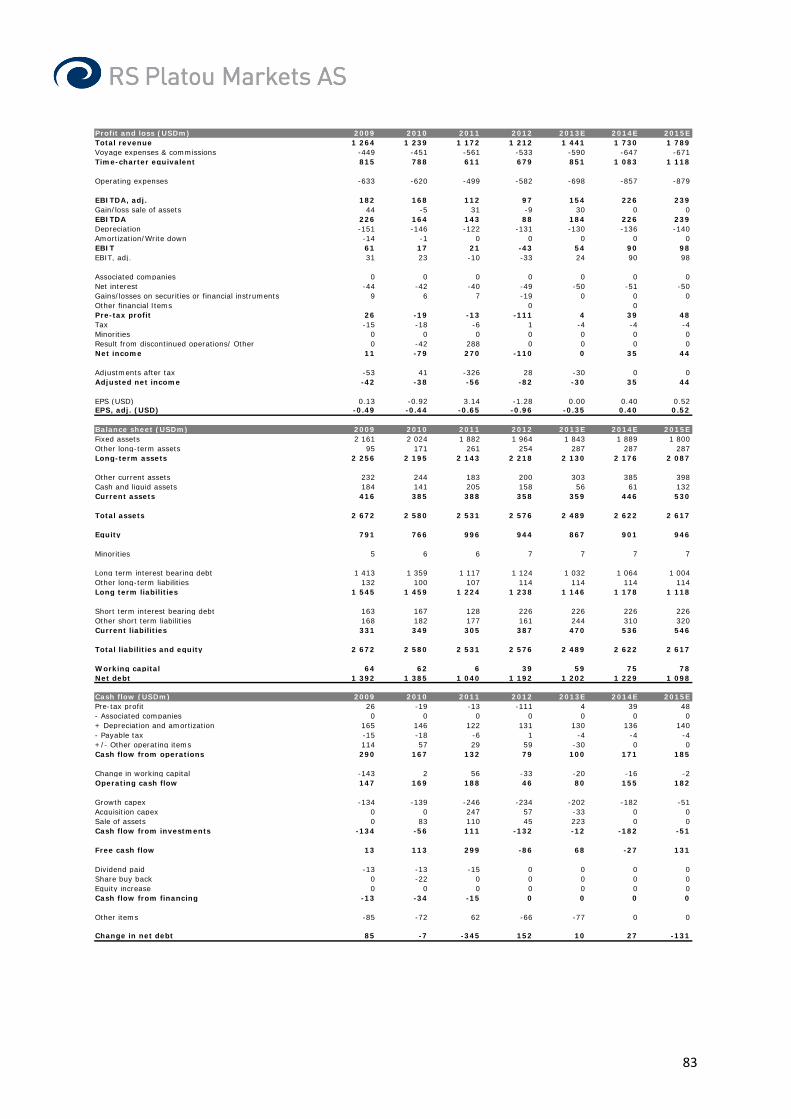
83
Profit and loss (USDm) 2009 2010 2011 2012 2013E 2014E 2015ETotal revenue 1 264 1 239 1 172 1 212 1 441 1 730 1 789Voyage expenses & commissions -449 -451 -561 -533 -590 -647 -671Time-charter equivalent 815 788 611 679 851 1 083 1 118
Operating expenses -633 -620 -499 -582 -698 -857 -879
EBITDA, adj. 182 168 112 97 154 226 239Gain/loss sale of assets 44 -5 31 -9 30 0 0EBITDA 226 164 143 88 184 226 239Depreciation -151 -146 -122 -131 -130 -136 -140Amortization/Write down -14 -1 0 0 0 0 0EBIT 61 17 21 -43 54 90 98EBIT, adj. 31 23 -10 -33 24 90 98
Associated companies 0 0 0 0 0 0 0Net interest -44 -42 -40 -49 -50 -51 -50Gains/losses on securities or financial instruments 9 6 7 -19 0 0 0Other financial Items 0 0Pre-tax profit 26 -19 -13 -111 4 39 48Tax -15 -18 -6 1 -4 -4 -4Minorities 0 0 0 0 0 0 0Result from discontinued operations/ Other 0 -42 288 0 0 0 0Net income 11 -79 270 -110 0 35 44
Adjustments after tax -53 41 -326 28 -30 0 0Adjusted net income -42 -38 -56 -82 -30 35 44
EPS (USD) 0.13 -0.92 3.14 -1.28 0.00 0.40 0.52EPS, adj. (USD) -0.49 -0.44 -0.65 -0.96 -0.35 0.40 0.52
Balance sheet (USDm) 2009 2010 2011 2012 2013E 2014E 2015EFixed assets 2 161 2 024 1 882 1 964 1 843 1 889 1 800Other long-term assets 95 171 261 254 287 287 287Long-term assets 2 256 2 195 2 143 2 218 2 130 2 176 2 087
Other current assets 232 244 183 200 303 385 398Cash and liquid assets 184 141 205 158 56 61 132Current assets 416 385 388 358 359 446 530
Total assets 2 672 2 580 2 531 2 576 2 489 2 622 2 617
Equity 791 766 996 944 867 901 946
Minorities 5 6 6 7 7 7 7
Long term interest bearing debt 1 413 1 359 1 117 1 124 1 032 1 064 1 004Other long-term liabilities 132 100 107 114 114 114 114Long term liabilities 1 545 1 459 1 224 1 238 1 146 1 178 1 118
Short term interest bearing debt 163 167 128 226 226 226 226Other short term liabilities 168 182 177 161 244 310 320Current liabilities 331 349 305 387 470 536 546
Total liabilities and equity 2 672 2 580 2 531 2 576 2 489 2 622 2 617
Working capital 64 62 6 39 59 75 78Net debt 1 392 1 385 1 040 1 192 1 202 1 229 1 098
Cash flow (USDm) 2009 2010 2011 2012 2013E 2014E 2015EPre-tax profit 26 -19 -13 -111 4 39 48- Associated companies 0 0 0 0 0 0 0+ Depreciation and amortization 165 146 122 131 130 136 140- Payable tax -15 -18 -6 1 -4 -4 -4+/- Other operating items 114 57 29 59 -30 0 0Cash flow from operations 290 167 132 79 100 171 185
Change in working capital -143 2 56 -33 -20 -16 -2Operating cash flow 147 169 188 46 80 155 182
Growth capex -134 -139 -246 -234 -202 -182 -51Acquisition capex 0 0 247 57 -33 0 0Sale of assets 0 83 110 45 223 0 0Cash flow from investments -134 -56 111 -132 -12 -182 -51
Free cash flow 13 113 299 -86 68 -27 131
Dividend paid -13 -13 -15 0 0 0 0Share buy back 0 -22 0 0 0 0 0Equity increase 0 0 0 0 0 0 0Cash flow from financing -13 -34 -15 0 0 0 0
Other items -85 -72 62 -66 -77 0 0
Change in net debt 85 -7 -345 152 10 27 -131
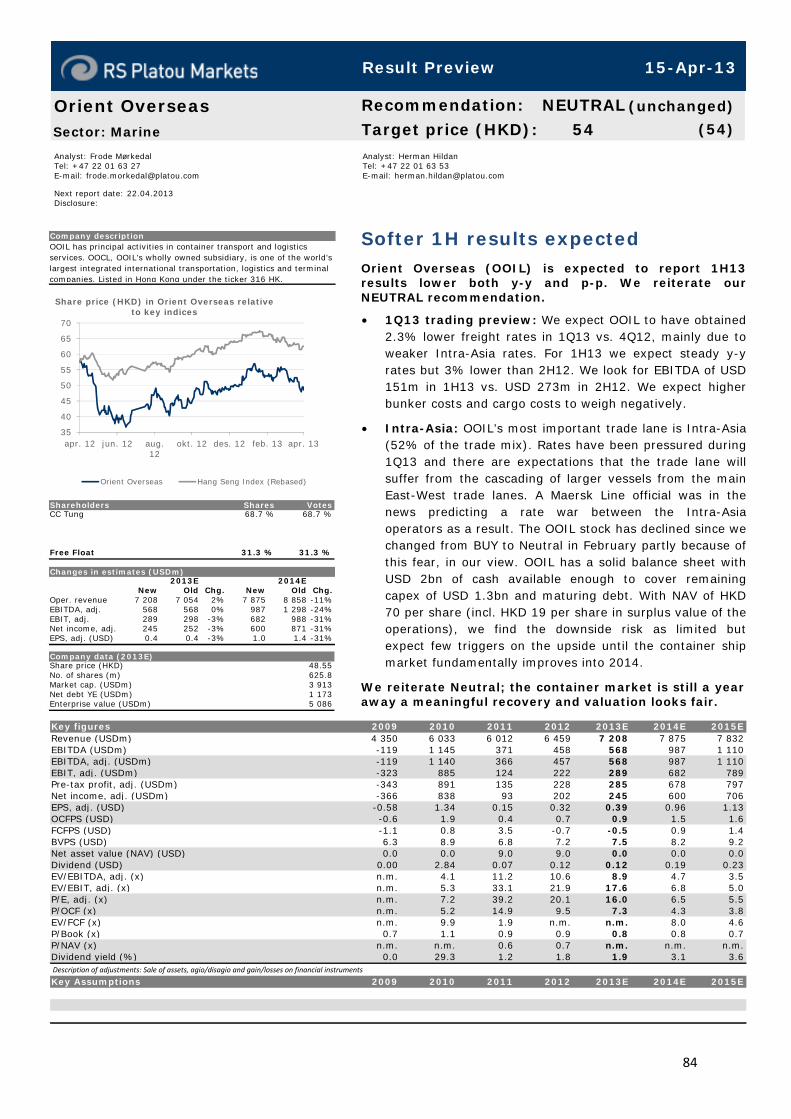
84
Analyst: Frode Mørkedal Tel: +47 22 01 63 27 E-mail: [email protected] Next report date: 22.04.2013 Disclosure:
Analyst: Herman Hildan Tel: +47 22 01 63 53 E-mail: [email protected]
Softer 1H results expected Orient Overseas (OOIL) is expected to report 1H13results lower both y-y and p-p. We reiterate our NEUTRAL recommendation.
• 1Q13 trading preview: We expect OOIL to have obtained 2.3% lower freight rates in 1Q13 vs. 4Q12, mainly due toweaker Intra-Asia rates. For 1H13 we expect steady y-y rates but 3% lower than 2H12. We look for EBITDA of USD 151m in 1H13 vs. USD 273m in 2H12. We expect higherbunker costs and cargo costs to weigh negatively.
• Intra-Asia: OOIL’s most important trade lane is Intra-Asia (52% of the trade mix). Rates have been pressured during1Q13 and there are expectations that the trade lane willsuffer from the cascading of larger vessels from the mainEast-West trade lanes. A Maersk Line official was in thenews predicting a rate war between the Intra-Asia operators as a result. The OOIL stock has declined since we changed from BUY to Neutral in February partly because ofthis fear, in our view. OOIL has a solid balance sheet withUSD 2bn of cash available enough to cover remainingcapex of USD 1.3bn and maturing debt. With NAV of HKD70 per share (incl. HKD 19 per share in surplus value of theoperations), we find the downside risk as limited butexpect few triggers on the upside until the container shipmarket fundamentally improves into 2014.
We reiterate Neutral; the container market is still a year away a meaningful recovery and valuation looks fair.
Orient OverseasSector: Marine
Recommendation: NEUTRAL (unchanged)
Target price (HKD): 54 (54)
Company descriptionOOIL has principal activities in container transport and logistics services. OOCL, OOIL's wholly owned subsidiary, is one of the world’s largest integrated international transportation, logistics and terminal companies. Listed in Hong Kong under the ticker 316 HK.
35
40
45
50
55
60
65
70
apr. 12 jun. 12 aug.12
okt. 12 des. 12 feb. 13 apr. 13
Share price (HKD) in Orient Overseas relative to key indices
Orient Overseas Hang Seng Index (Rebased)
Shareholders Shares VotesCC Tung 68.7 % 68.7 %
Free Float 31.3 % 31.3 %
Changes in estimates (USDm)2013E 2014E
New Old Chg. New Old Chg.Oper. revenue 7 208 7 054 2% 7 875 8 858 -11%EBITDA, adj. 568 568 0% 987 1 298 -24%EBIT, adj. 289 298 -3% 682 988 -31%Net income, adj. 245 252 -3% 600 871 -31%EPS, adj. (USD) 0.4 0.4 -3% 1.0 1.4 -31%
Company data (2013E)Share price (HKD) 48.55No. of shares (m) 625.8Market cap. (USDm) 3 913Net debt YE (USDm) 1 173Enterprise value (USDm) 5 086
Description of adjustments: Sale of assets, agio/disagio and gain/losses on financial instruments
Key figures 2009 2010 2011 2012 2013E 2014E 2015ERevenue (USDm) 4 350 6 033 6 012 6 459 7 208 7 875 7 832EBITDA (USDm) -119 1 145 371 458 568 987 1 110EBITDA, adj. (USDm) -119 1 140 366 457 568 987 1 110EBIT, adj. (USDm) -323 885 124 222 289 682 789Pre-tax profit, adj. (USDm) -343 891 135 228 285 678 797Net income, adj. (USDm) -366 838 93 202 245 600 706EPS, adj. (USD) -0.58 1.34 0.15 0.32 0.39 0.96 1.13OCFPS (USD) -0.6 1.9 0.4 0.7 0.9 1.5 1.6FCFPS (USD) -1.1 0.8 3.5 -0.7 -0.5 0.9 1.4BVPS (USD) 6.3 8.9 6.8 7.2 7.5 8.2 9.2Net asset value (NAV) (USD) 0.0 0.0 9.0 9.0 0.0 0.0 0.0Dividend (USD) 0.00 2.84 0.07 0.12 0.12 0.19 0.23EV/EBITDA, adj. (x) n.m. 4.1 11.2 10.6 8.9 4.7 3.5EV/EBIT, adj. (x) n.m. 5.3 33.1 21.9 17.6 6.8 5.0P/E, adj. (x) n.m. 7.2 39.2 20.1 16.0 6.5 5.5P/OCF (x) n.m. 5.2 14.9 9.5 7.3 4.3 3.8EV/FCF (x) n.m. 9.9 1.9 n.m. n.m. 8.0 4.6P/Book (x) 0.7 1.1 0.9 0.9 0.8 0.8 0.7P/NAV (x) n.m. n.m. 0.6 0.7 n.m. n.m. n.m.Dividend yield (%) 0.0 29.3 1.2 1.8 1.9 3.1 3.6
Key Assumptions 2009 2010 2011 2012 2013E 2014E 2015E
Result Preview 15-Apr-13
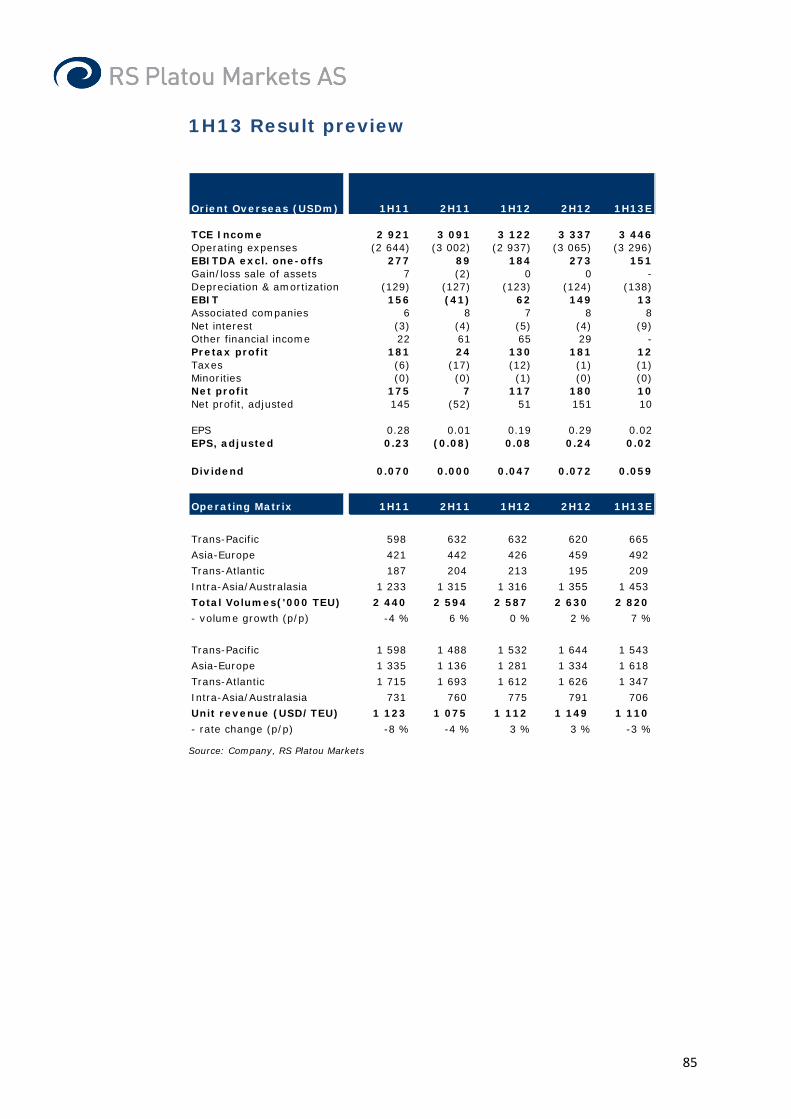
85
1H13 Result preview
Source: Company, RS Platou Markets
Orient Overseas (USDm) 1H11 2H11 1H12 2H12 1H13E
TCE Income 2 921 3 091 3 122 3 337 3 446Operating expenses (2 644) (3 002) (2 937) (3 065) (3 296)EBITDA excl. one-offs 277 89 184 273 151Gain/loss sale of assets 7 (2) 0 0 -Depreciation & amortization (129) (127) (123) (124) (138)EBIT 156 (41) 62 149 13Associated companies 6 8 7 8 8Net interest (3) (4) (5) (4) (9)Other financial income 22 61 65 29 -Pretax profit 181 24 130 181 12Taxes (6) (17) (12) (1) (1)Minorities (0) (0) (1) (0) (0)Net profit 175 7 117 180 10Net profit, adjusted 145 (52) 51 151 10
EPS 0.28 0.01 0.19 0.29 0.02EPS, adjusted 0.23 (0.08) 0.08 0.24 0.02
Dividend 0.070 0.000 0.047 0.072 0.059
Operating Matrix 1H11 2H11 1H12 2H12 1H13E
Trans-Pacific 598 632 632 620 665
Asia-Europe 421 442 426 459 492
Trans-Atlantic 187 204 213 195 209
Intra-Asia/Australasia 1 233 1 315 1 316 1 355 1 453
Total Volumes('000 TEU) 2 440 2 594 2 587 2 630 2 820
- volume growth (p/p) -4 % 6 % 0 % 2 % 7 %
Trans-Pacific 1 598 1 488 1 532 1 644 1 543
Asia-Europe 1 335 1 136 1 281 1 334 1 618
Trans-Atlantic 1 715 1 693 1 612 1 626 1 347
Intra-Asia/Australasia 731 760 775 791 706
Unit revenue (USD/TEU) 1 123 1 075 1 112 1 149 1 110
- rate change (p/p) -8 % -4 % 3 % 3 % -3 %

86
Profit and loss (USDm) 2009 2010 2011 2012 2013E 2014E 2015ETotal revenue 4 350 6 033 6 012 6 459 7 208 7 875 7 832Voyage expenses & commissions 0 0 0 0 0 0 0Time-charter equivalent 4 350 6 033 6 012 6 459 7 208 7 875 7 832
Operating expenses -4 469 -4 894 -5 646 -6 002 -6 640 -6 888 -6 722
EBITDA, adj. -119 1 140 366 457 568 987 1 110Gain/loss sale of assets 0 5 5 1 0 0 0EBITDA -119 1 145 371 458 568 987 1 110Depreciation -204 -255 -243 -235 -280 -304 -321Amortization/Write down -7 -11 -13 -11 -11 -11 -11EBIT -329 879 115 211 278 671 778EBIT, adj. -323 885 124 222 289 682 789
Associated companies 6 9 14 15 16 16 16Net interest -26 -8 -7 -9 -20 -20 -8Gains/losses on securities or financial instruments -10 19 83 94 0 0 0Other financial Items 0 0 0 0 0 0Pre-tax profit -360 899 205 311 274 667 786Tax -14 -29 -23 -14 -27 -67 -79Minorities -2 -8 -1 -1 -1 -1 -1Result from discontinued operations/ Other -25 1 005 0 0 0 0 0Net income -401 1 867 182 296 245 600 706
Adjustments after tax 35 -1 028 -88 -94 0 0 0Adjusted net income -366 838 93 202 245 600 706
EPS (USD) -0.64 2.98 0.29 0.47 0.39 0.96 1.13EPS, adj. (USD) -0.58 1.34 0.15 0.32 0.39 0.96 1.13
Balance sheet (USDm) 2009 2010 2011 2012 2013E 2014E 2015ELong-term interest bearing assets 0 5 11 18 18 18 18Fixed assets 3 798 3 860 4 205 4 665 5 213 5 239 5 084Other long-term assets 525 651 673 817 822 826 831Long-term assets 4 324 4 516 4 890 5 500 6 053 6 084 5 933
Other current assets 1 735 552 625 698 779 851 846Cash and liquid assets 1 271 4 004 2 215 2 068 1 107 1 373 1 834Current assets 3 006 4 556 2 839 2 765 1 886 2 224 2 680
Total assets 7 330 9 072 7 729 8 265 7 938 8 308 8 613
Equity 3 945 5 573 4 275 4 509 4 673 5 152 5 718
Minorities 24 7 7 6 7 8 9
Long term interest bearing debt 670 2 416 2 233 1 351 1 099 977 873Finance obligation 1 466 0 0 974 644 572 421Other long-term liabilities 34 53 54 72 72 72 72Long term liabilities 2 170 2 469 2 287 2 397 1 814 1 620 1 365
Short term interest bearing debt 432 248 439 556 556 556 556Other short term liabilities 760 776 721 797 889 971 966Current liabilities 1 192 1 024 1 160 1 352 1 445 1 527 1 522
Total liabilities and equity 7 330 9 072 7 729 8 265 7 938 8 308 8 613
Working capital 975 -224 -96 -99 -110 -121 -120Net debt 1 296 -1 344 446 796 1 173 714 -3
Cash flow (USDm) 2009 2010 2011 2012 2013E 2014E 2015EPre-tax profit -360 899 205 311 274 667 786- Associated companies -6 -9 -14 -15 -16 -16 -16+ Depreciation and amortization 211 266 256 247 291 316 332- Payable tax -14 -29 -23 -14 -27 -67 -79+/- Other operating items -122 85 -116 -70 0 0 0Cash flow from operations -291 1 212 308 459 521 900 1 024
Change in working capital -63 -38 -63 -34 11 10 -1Operating cash flow -354 1 175 246 425 533 910 1 023
Maintenance capex 0 0 0 0 0 0 0Growth capex -364 -214 -738 -732 -828 -331 -166Acquisition capex 0 -2 679 2 522 -217 0 0 0Sale of assets 34 2 195 157 74 0 0 0Cash flow from investments -329 -698 1 942 -875 -828 -331 -166
Free cash flow -683 477 2 187 -450 -295 579 857
Dividend paid -28 -322 -1 500 -30 -82 -120 -141Share buy back 0 0 0 0 0 0 0Equity increase 0 0 0 0 0 0 0Cash flow from financing -28 -322 -1 500 -30 -82 -120 -141
Other items -110 2 486 -2 478 131 0 0 0
Change in net debt 822 -2 640 1 790 350 377 -459 -716
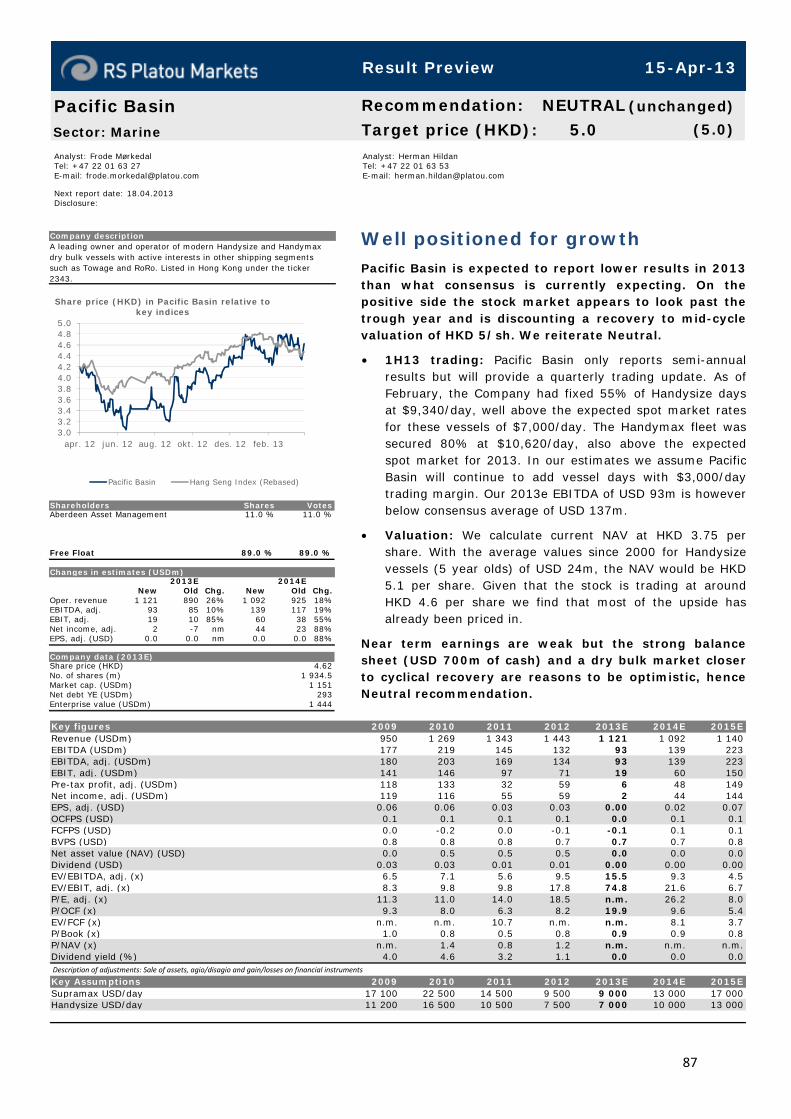
87
Analyst: Frode Mørkedal Tel: +47 22 01 63 27 E-mail: [email protected] Next report date: 18.04.2013 Disclosure:
Analyst: Herman Hildan Tel: +47 22 01 63 53 E-mail: [email protected]
Well positioned for growth Pacific Basin is expected to report lower results in 2013than what consensus is currently expecting. On thepositive side the stock market appears to look past the trough year and is discounting a recovery to mid-cycle valuation of HKD 5/sh. We reiterate Neutral.
• 1H13 trading: Pacific Basin only reports semi-annual results but will provide a quarterly trading update. As ofFebruary, the Company had fixed 55% of Handysize days at $9,340/day, well above the expected spot market ratesfor these vessels of $7,000/day. The Handymax fleet wassecured 80% at $10,620/day, also above the expectedspot market for 2013. In our estimates we assume PacificBasin will continue to add vessel days with $3,000/day trading margin. Our 2013e EBITDA of USD 93m is howeverbelow consensus average of USD 137m.
• Valuation: We calculate current NAV at HKD 3.75 per share. With the average values since 2000 for Handysizevessels (5 year olds) of USD 24m, the NAV would be HKD5.1 per share. Given that the stock is trading at aroundHKD 4.6 per share we find that most of the upside has already been priced in.
Near term earnings are weak but the strong balance sheet (USD 700m of cash) and a dry bulk market closer to cyclical recovery are reasons to be optimistic, henceNeutral recommendation.
Pacific BasinSector: Marine
Recommendation: NEUTRAL (unchanged)
Target price (HKD): 5.0 (5.0)
Company descriptionA leading owner and operator of modern Handysize and Handymax dry bulk vessels with active interests in other shipping segments such as Towage and RoRo. Listed in Hong Kong under the ticker 2343.
3.03.23.43.63.84.04.24.44.64.85.0
apr. 12 jun. 12 aug. 12 okt. 12 des. 12 feb. 13
Share price (HKD) in Pacific Basin relative to key indices
Pacific Basin Hang Seng Index (Rebased)
Shareholders Shares VotesAberdeen Asset Management 11.0 % 11.0 %
Free Float 89.0 % 89.0 %
Changes in estimates (USDm)2013E 2014E
New Old Chg. New Old Chg.Oper. revenue 1 121 890 26% 1 092 925 18%EBITDA, adj. 93 85 10% 139 117 19%EBIT, adj. 19 10 85% 60 38 55%Net income, adj. 2 -7 nm 44 23 88%EPS, adj. (USD) 0.0 0.0 nm 0.0 0.0 88%
Company data (2013E)Share price (HKD) 4.62No. of shares (m) 1 934.5Market cap. (USDm) 1 151Net debt YE (USDm) 293Enterprise value (USDm) 1 444
Description of adjustments: Sale of assets, agio/disagio and gain/losses on financial instruments
Key figures 2009 2010 2011 2012 2013E 2014E 2015ERevenue (USDm) 950 1 269 1 343 1 443 1 121 1 092 1 140EBITDA (USDm) 177 219 145 132 93 139 223EBITDA, adj. (USDm) 180 203 169 134 93 139 223EBIT, adj. (USDm) 141 146 97 71 19 60 150Pre-tax profit, adj. (USDm) 118 133 32 59 6 48 149Net income, adj. (USDm) 119 116 55 59 2 44 144EPS, adj. (USD) 0.06 0.06 0.03 0.03 0.00 0.02 0.07OCFPS (USD) 0.1 0.1 0.1 0.1 0.0 0.1 0.1FCFPS (USD) 0.0 -0.2 0.0 -0.1 -0.1 0.1 0.1BVPS (USD) 0.8 0.8 0.8 0.7 0.7 0.7 0.8Net asset value (NAV) (USD) 0.0 0.5 0.5 0.5 0.0 0.0 0.0Dividend (USD) 0.03 0.03 0.01 0.01 0.00 0.00 0.00EV/EBITDA, adj. (x) 6.5 7.1 5.6 9.5 15.5 9.3 4.5EV/EBIT, adj. (x) 8.3 9.8 9.8 17.8 74.8 21.6 6.7P/E, adj. (x) 11.3 11.0 14.0 18.5 n.m. 26.2 8.0P/OCF (x) 9.3 8.0 6.3 8.2 19.9 9.6 5.4EV/FCF (x) n.m. n.m. 10.7 n.m. n.m. 8.1 3.7P/Book (x) 1.0 0.8 0.5 0.8 0.9 0.9 0.8P/NAV (x) n.m. 1.4 0.8 1.2 n.m. n.m. n.m.Dividend yield (%) 4.0 4.6 3.2 1.1 0.0 0.0 0.0
Key Assumptions 2009 2010 2011 2012 2013E 2014E 2015ESupramax USD/day 17 100 22 500 14 500 9 500 9 000 13 000 17 000Handysize USD/day 11 200 16 500 10 500 7 500 7 000 10 000 13 000
Result Preview 15-Apr-13

88
1H13 Result preview
Pacific Basin(USDm) 2H11 1H12 2H12 1H13
TCE Income 428 365 391 293Operating expenses (342) (312) (310) (247)EBITDA excl. one-offs 86 53 81 47Gain/loss sale of assets (2) - (1) -Depreciation & amortization (36) (38) (25) (34)EBIT 48 15 54 13Associated companies (2) 1 2 2Net interest (16) (7) (7) (8)Other financial income - (3) (2) (17)Pretax profit 29 6 48 (10)Taxes (1) (2) 1 (2)Minorities - (200) (11) -Net profit 29 (196) 37 (12)Net profit, adjusted 30 7 52 5
EPS 0.01 (0.10) 0.02 (0.01)EPS, adjusted 0.02 0.00 0.03 0.00
Dividend 0.007 0.000 0.000 0.000
Source: Company, RS Platou Markets
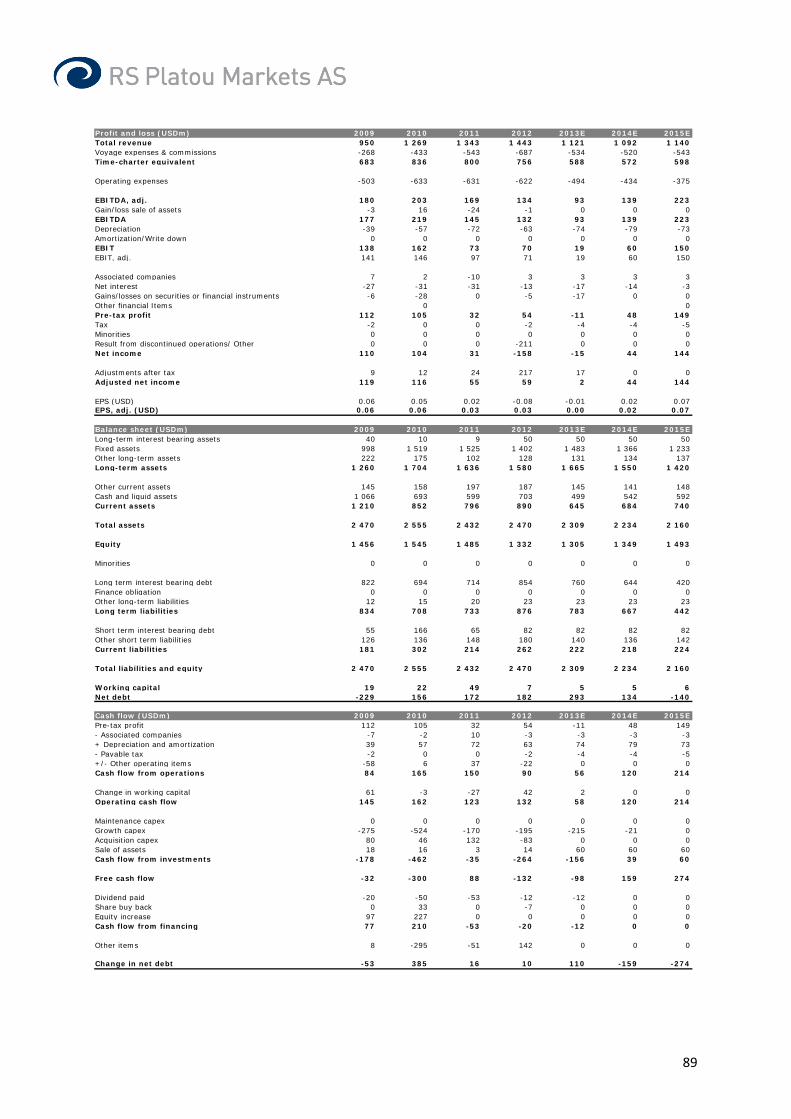
89
Profit and loss (USDm) 2009 2010 2011 2012 2013E 2014E 2015ETotal revenue 950 1 269 1 343 1 443 1 121 1 092 1 140Voyage expenses & commissions -268 -433 -543 -687 -534 -520 -543Time-charter equivalent 683 836 800 756 588 572 598
Operating expenses -503 -633 -631 -622 -494 -434 -375
EBITDA, adj. 180 203 169 134 93 139 223Gain/loss sale of assets -3 16 -24 -1 0 0 0EBITDA 177 219 145 132 93 139 223Depreciation -39 -57 -72 -63 -74 -79 -73Amortization/Write down 0 0 0 0 0 0 0EBIT 138 162 73 70 19 60 150EBIT, adj. 141 146 97 71 19 60 150
Associated companies 7 2 -10 3 3 3 3Net interest -27 -31 -31 -13 -17 -14 -3Gains/losses on securities or financial instruments -6 -28 0 -5 -17 0 0Other financial Items 0 0Pre-tax profit 112 105 32 54 -11 48 149Tax -2 0 0 -2 -4 -4 -5Minorities 0 0 0 0 0 0 0Result from discontinued operations/ Other 0 0 0 -211 0 0 0Net income 110 104 31 -158 -15 44 144
Adjustments after tax 9 12 24 217 17 0 0Adjusted net income 119 116 55 59 2 44 144
EPS (USD) 0.06 0.05 0.02 -0.08 -0.01 0.02 0.07EPS, adj. (USD) 0.06 0.06 0.03 0.03 0.00 0.02 0.07
Balance sheet (USDm) 2009 2010 2011 2012 2013E 2014E 2015ELong-term interest bearing assets 40 10 9 50 50 50 50Fixed assets 998 1 519 1 525 1 402 1 483 1 366 1 233Other long-term assets 222 175 102 128 131 134 137Long-term assets 1 260 1 704 1 636 1 580 1 665 1 550 1 420
Other current assets 145 158 197 187 145 141 148Cash and liquid assets 1 066 693 599 703 499 542 592Current assets 1 210 852 796 890 645 684 740
Total assets 2 470 2 555 2 432 2 470 2 309 2 234 2 160
Equity 1 456 1 545 1 485 1 332 1 305 1 349 1 493
Minorities 0 0 0 0 0 0 0
Long term interest bearing debt 822 694 714 854 760 644 420Finance obligation 0 0 0 0 0 0 0Other long-term liabilities 12 15 20 23 23 23 23Long term liabilities 834 708 733 876 783 667 442
Short term interest bearing debt 55 166 65 82 82 82 82Other short term liabilities 126 136 148 180 140 136 142Current liabilities 181 302 214 262 222 218 224
Total liabilities and equity 2 470 2 555 2 432 2 470 2 309 2 234 2 160
Working capital 19 22 49 7 5 5 6Net debt -229 156 172 182 293 134 -140
Cash flow (USDm) 2009 2010 2011 2012 2013E 2014E 2015EPre-tax profit 112 105 32 54 -11 48 149- Associated companies -7 -2 10 -3 -3 -3 -3+ Depreciation and amortization 39 57 72 63 74 79 73- Payable tax -2 0 0 -2 -4 -4 -5+/- Other operating items -58 6 37 -22 0 0 0Cash flow from operations 84 165 150 90 56 120 214
Change in working capital 61 -3 -27 42 2 0 0Operating cash flow 145 162 123 132 58 120 214
Maintenance capex 0 0 0 0 0 0 0Growth capex -275 -524 -170 -195 -215 -21 0Acquisition capex 80 46 132 -83 0 0 0Sale of assets 18 16 3 14 60 60 60Cash flow from investments -178 -462 -35 -264 -156 39 60
Free cash flow -32 -300 88 -132 -98 159 274
Dividend paid -20 -50 -53 -12 -12 0 0Share buy back 0 33 0 -7 0 0 0Equity increase 97 227 0 0 0 0 0Cash flow from financing 77 210 -53 -20 -12 0 0
Other items 8 -295 -51 142 0 0 0
Change in net debt -53 385 16 10 110 -159 -274

90
Analyst: Frode Mørkedal Tel: +47 22 01 63 27 E-mail: [email protected]
Analyst: Herman Hildan Tel: +47 22 01 63 53 E-mail: [email protected]
A quarter few can match Few peers can match the aggressive expansion pace STNG has been through over the last 4 months, addingabout USD 300m of capex per month. The Company hasdelivered on raising equity and putting money to work,what remains is securing vessel debt. This should befocus on the report, but news prior to the 1Q13 report is likely as Management already indicated potential forincreasing the USD 267m facility as DVB Bank joined thesyndicate. We expect STNG to continue the consistentstrategy of growing the eco-design fleet at a cyclicallow, with values already increasing from through levels.
• 1Q13 numbers: We expect STNG to report USD 48m of revenue and USD 12m of EBITDA, in line with consensusexpecting USD 46m and USD 12m. Management said on arecent conference call that 1Q13 consensus EPS of USD 0.05/sh was “appropriate”, consequently we do not expectany significant earnings surprises on the report. Weestimate USD 0.06/sh EPS, marginally above consensus.
• Fleet update: STNG took delivery of another 2 MR eco vessels in 1Q13, and we expect to see a consistentoutperformance compared to old design.
• Growth: USD 0.6bn of equity has been raised since December, 36 vessels has been ordered for USD 1.3bn,meaning that another USD 70m of equity is available for growth assuming 60% debt financing.
• Valuation: Our USD 13/sh target reflects 7.9x EV/EBITDA in 2015 on 20 year average rates.
We reiterate BUY and USD 13/sh target price.
Scorpio TankersSector: Marine
Recommendation: BUY (unchanged)
Target price (USD): 13.0 (unchanged)
Company descriptionSince its IPO in March 2010 the Company has grown its pure play product tanker fleet from 3 owned vessels to 53 currently, of which 46 are fuel-efficient and 39 still to be delivered.
5.05.56.06.57.07.58.08.59.09.5
Apr. 12 Jun. 12 Aug.12
Oct. 12 Dec.12
Feb.13
Apr. 13
Share price (USD) in Scorpio Tankers relative to key indices
Scorpio Tankers
S&P 500 Index (Rebased)
OSE Transportation (Rebased)
Shareholders Shares VotesLegatum Capital 10.0 % 10.0 %Claren Road 7.5 % 7.5 %Wellington 6.3 % 6.3 %Kensico Capital Management 4.8 %Free Float 90.0 % 90.0 %
Changes in estimates (USDm)2013E 2014E
New Old Chg. New Old Chg.Oper. revenue 227 228 0% 319 319 0%EBITDA, adj. 30 31 -2% 102 102 0%EBIT, adj. 5 6 -11% 56 56 0%Net income, adj. -3 -3 -25% 31 31 0%EPS, adj. (USD) 0.0 0.0 -25% 0.3 0.3 0%
Company data (2013E)Share price (USD) 8.49No. of shares (m) 123.5Market cap. (USDm) 1,049Net debt YE (USDm) 125Enterprise value (USDm) 1,173
Description of adjustments: Sale of assets, agio/disagio and gain/losses on financial instruments
Key figures 2009 2010 2011 2012 2013E 2014E 2015ERevenue (USDm) 28 39 82 115 227 319 521EBITDA (USDm) 11 11 9 -2 30 102 293EBITDA, adj. (USDm) 16 11 9 8 30 102 293EBIT, adj. (USDm) 9 1 -9 -7 5 56 212Pre-tax profit, adj. (USDm) 4 -2 -16 -26 -3 31 177Net income, adj. (USDm) 8 -2 -83 -15 -3 31 177EPS, adj. (USD) 1.44 -0.13 -2.77 -0.33 -0.03 0.25 1.43OCFPS (USD) 1.7 0.3 -0.4 0.2 0.1 0.6 2.0FCFPS (USD) 1.7 -15.4 -4.5 -1.8 -4.9 -6.9 2.0BVPS (USD) 11.0 10.7 7.5 6.5 7.0 7.2 8.7Net asset value (NAV) (USD) 0.0 0.0 7.0 7.0 0.0 0.0 0.0Dividend (USD) 1.55 0.00 0.00 0.00 0.00 0.00 0.00EV/EBITDA, adj. (x) 28.6 31.3 63.3 38.9 19.9 6.1EV/EBIT, adj. (x) n.m. n.m. n.m. n.m. 36.0 8.4P/E, adj. (x) n.m. n.m. n.m. n.m. 33.6 5.9P/OCF (x) 32.1 n.m. 43.5 n.m. 14.6 4.3EV/FCF (x) n.m. n.m. n.m. n.m. n.m. 7.2P/Book (x) 0.9 0.7 1.1 1.2 1.2 1.0P/NAV (x) n.m. 0.7 1.0 n.m. n.m. n.m.Dividend yield (%) 0.0 0.0 0.0 0.0 0.0 0.0
Key Assumptions 2009 2010 2011 2012 2013E 2014E 2015ELR2 spot USD/Day 18,000 12,000 12,000 17,000 19,000 27,000LR1 spot USD/Day 15,000 12,000 13,100 14,000 16,000 22,000MR spot USD/Day 14,000 14,000 12,600 14,000 15,000 18,500
Result Preview 15-Apr-13
RS Platou Markets AS acted as placement agent in the registered direct offering of USD 27 million in equity conducted in April 2012 and in the registered direct offering of USD 132 million in equity conducted in December 2012. In addition, RS Platou Markets, Inc. (wholly owned subsidiary of RS Platou Markets AS) acted as Sole Manager and RS Platou Markets AS acted as Placement Agent in the registered direct offering of USD 230 million in equity conducted in January 2013 and as Sole Manager/Lead Placement Agent in the registered direct offering of USD 235 million in equity conducted in March 2013.

91
1Q13 Result preview
Source: Bloomberg, RS Platou Markets
Scorpio Tankers (USDm) 1Q12 3Q12 4Q12
Platou 1Q13E
Consensus avg.
Platou vs. cons.
TCE Income 23 22 28 48 46 1Operating expenses (19) (22) (26) (36) (35) (1)EBITDA excl. one-offs 4 1 3 12 12 0Gain/loss sale of assets (4) (6) - -Depreciation & amortization (4) (3) (5) (5) (6) 1EBIT 1 (3) (2) 7 6 1Associated companies - - - -Net interest (1) (1) (2) (2) (2) 0Other financial income (0) (3) (1) -Pretax profit (5) (13) (5) 5 3 2Taxes - - - - 1 (1)Minorities - - - -Net profit (5) (13) (5) 5 4 1Net profit, adjusted (1) (4) (4) 5 5 0
EPS (0.14) (0.30) (0.11) 0.06 0.05 0.01EPS, adjusted (0.02) (0.09) (0.08) 0.06 0.05 0.01
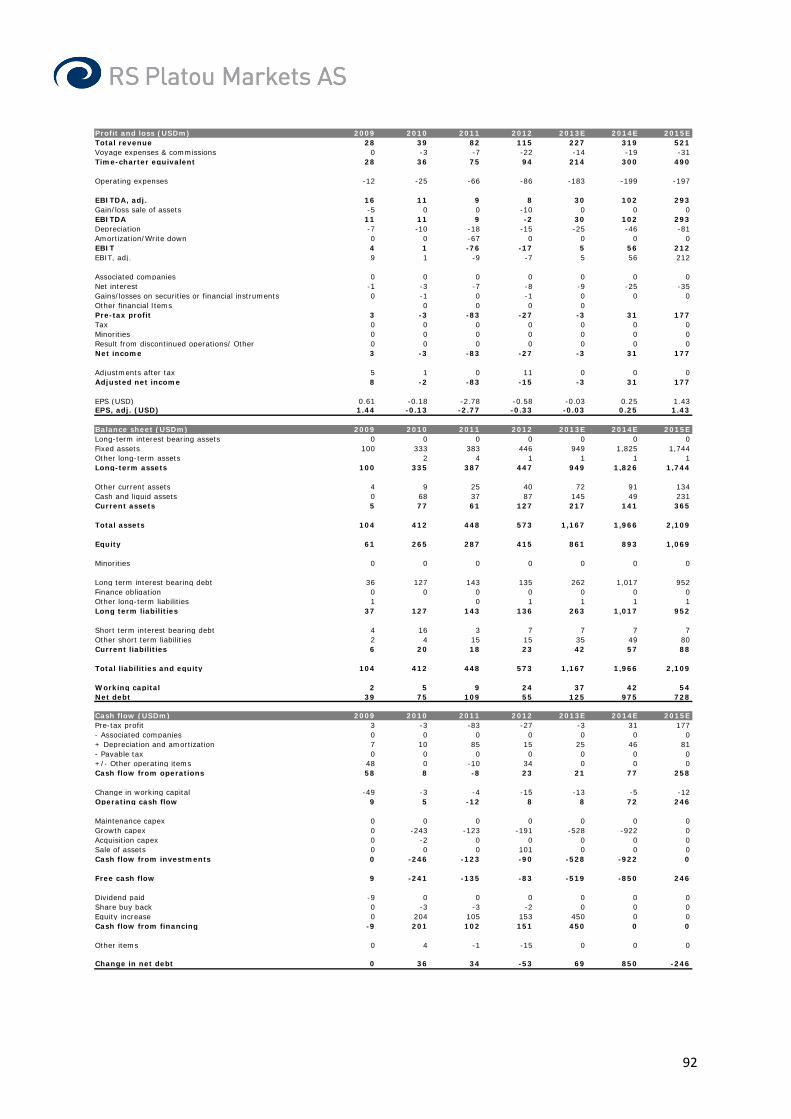
92
Profit and loss (USDm) 2009 2010 2011 2012 2013E 2014E 2015ETotal revenue 28 39 82 115 227 319 521Voyage expenses & commissions 0 -3 -7 -22 -14 -19 -31Time-charter equivalent 28 36 75 94 214 300 490
Operating expenses -12 -25 -66 -86 -183 -199 -197
EBITDA, adj. 16 11 9 8 30 102 293Gain/loss sale of assets -5 0 0 -10 0 0 0EBITDA 11 11 9 -2 30 102 293Depreciation -7 -10 -18 -15 -25 -46 -81Amortization/Write down 0 0 -67 0 0 0 0EBIT 4 1 -76 -17 5 56 212EBIT, adj. 9 1 -9 -7 5 56 212
Associated companies 0 0 0 0 0 0 0Net interest -1 -3 -7 -8 -9 -25 -35Gains/losses on securities or financial instruments 0 -1 0 -1 0 0 0Other financial Items 0 0 0 0Pre-tax profit 3 -3 -83 -27 -3 31 177Tax 0 0 0 0 0 0 0Minorities 0 0 0 0 0 0 0Result from discontinued operations/ Other 0 0 0 0 0 0 0Net income 3 -3 -83 -27 -3 31 177
Adjustments after tax 5 1 0 11 0 0 0Adjusted net income 8 -2 -83 -15 -3 31 177
EPS (USD) 0.61 -0.18 -2.78 -0.58 -0.03 0.25 1.43EPS, adj. (USD) 1.44 -0.13 -2.77 -0.33 -0.03 0.25 1.43
Balance sheet (USDm) 2009 2010 2011 2012 2013E 2014E 2015ELong-term interest bearing assets 0 0 0 0 0 0 0Fixed assets 100 333 383 446 949 1,825 1,744Other long-term assets 2 4 1 1 1 1Long-term assets 100 335 387 447 949 1,826 1,744
Other current assets 4 9 25 40 72 91 134Cash and liquid assets 0 68 37 87 145 49 231Current assets 5 77 61 127 217 141 365
Total assets 104 412 448 573 1,167 1,966 2,109
Equity 61 265 287 415 861 893 1,069
Minorities 0 0 0 0 0 0 0
Long term interest bearing debt 36 127 143 135 262 1,017 952Finance obligation 0 0 0 0 0 0 0Other long-term liabilities 1 0 1 1 1 1Long term liabilities 37 127 143 136 263 1,017 952
Short term interest bearing debt 4 16 3 7 7 7 7Other short term liabilities 2 4 15 15 35 49 80Current liabilities 6 20 18 23 42 57 88
Total liabilities and equity 104 412 448 573 1,167 1,966 2,109
Working capital 2 5 9 24 37 42 54Net debt 39 75 109 55 125 975 728
Cash flow (USDm) 2009 2010 2011 2012 2013E 2014E 2015EPre-tax profit 3 -3 -83 -27 -3 31 177- Associated companies 0 0 0 0 0 0 0+ Depreciation and amortization 7 10 85 15 25 46 81- Payable tax 0 0 0 0 0 0 0+/- Other operating items 48 0 -10 34 0 0 0Cash flow from operations 58 8 -8 23 21 77 258
Change in working capital -49 -3 -4 -15 -13 -5 -12Operating cash flow 9 5 -12 8 8 72 246
Maintenance capex 0 0 0 0 0 0 0Growth capex 0 -243 -123 -191 -528 -922 0Acquisition capex 0 -2 0 0 0 0 0Sale of assets 0 0 0 101 0 0 0Cash flow from investments 0 -246 -123 -90 -528 -922 0
Free cash flow 9 -241 -135 -83 -519 -850 246
Dividend paid -9 0 0 0 0 0 0Share buy back 0 -3 -3 -2 0 0 0Equity increase 0 204 105 153 450 0 0Cash flow from financing -9 201 102 151 450 0 0
Other items 0 4 -1 -15 0 0 0
Change in net debt 0 36 34 -53 69 850 -246

93
Analyst: Frode Mørkedal Tel: +47 22 01 63 27 E-mail: [email protected] Next report date: 24.05.2013 Disclosure:
Analyst: Herman Hildan Tel: +47 22 01 63 53 E-mail: [email protected]
Will dividends be increased again? We expect Ship Finance to report 1Q13 numbers end-May. During the quarter SFL issued a USD 350mconvertible bond at 3.25% and with historical double digit ROE growth, it is evident how value is created forshareholders. • 1Q13 numbers: We expect revenue of USD 69m and
EBITDA of USD 43m, down 11%/14% respectively. Lowerrevenue is due to USD 8m lower cash compensation from FRO as a result of a weaker crude tanker market q/q.
• Higher dividend: Historically SFL has raised dividends following acquisitions. The 2 car carriers acquired in 4Q12was fully operational in 1Q13, generating annual cash flowof ~USD 5m, which could lift dividends by USD 0.015/sh. One could also argue for higher dividend capacity as SFLrepaid the 8.5% bond with proceeds from the convertiblebond, reducing annual interest cost by ~USD 14m.
• Growth potential: We estimate USD 250m available equity for fleet expansion following the USD 89m equity raise, USD 70m liquidity effect from disposal of FROvessels and USD 100m larger than planned bond issue.Deploying this cash will be accretive on dividends with atrack record of 13-22% free cash flow to equity yield the last 2 years. On a fully invested basis the dividends shouldgrow by USD 0.4-0.5/sh, increasing dividends from USD 1.56/sh currently to above USD 2/sh, or 11-12% yield vs. historical yield valuation of 7%.
We reiterate BUY and USD 22/sh target price.
Ship FinanceSector: Marine
Recommendation: BUY (unchanged)
Target price (USD): 22 (unchanged)
Company descriptionBermuda based company leasing out tankers, offshore support vessels, drilling units and containers to among others Frontline and Seadrill. Almost 100% contract coverage with 10 years remaining charters and EBITDA-backlog of just below $5bn. Listed at NYSE
12
13
14
15
16
17
18
19
Apr. 12 Jun. 12 Aug.12
Oct. 12 Dec.12
Feb.13
Apr. 13
Share price (USD) in Ship Finance relative to key indices
Ship Finance
OSEBX index (Rebased)
OSE Transportation (Rebased)
Shareholders Shares VotesHemen Holdings 40.0 % 40.0 %
Free Float 60.0 % 60.0 %
Changes in estimates (USDm)2013E 2014E
New Old Chg. New Old Chg.Oper. revenue 302 318 -5% 353 355 -1%EBITDA, adj. 528 546 -3% 557 591 -6%EBIT, adj. 474 489 -3% 501 533 -6%Net income, adj. 117 128 -9% 156 184 -15%EPS, adj. (USD) 1.4 1.5 -9% 1.8 2.2 -15%
Company data (2013E)Share price (USD) 17.44No. of shares (m) 85.2Market cap. (USDm) 1,486Net debt YE (USDm) 1,547Enterprise value (USDm) 4,470
Description of adjustments: Sale of assets, agio/disagio and gain/losses on financial instruments. Adjusted EBITDA and Adjusted EBIT includes repayment of financial leases and 100% of the unconsolidated rig subsidiaries. Other figures as reported.
Key figures 2009 2010 2011 2012 2013E 2014E 2015ERevenue (USDm) 345 308 295 320 302 353 371EBITDA (USDm) 266 246 213 263 215 244 266EBITDA, adj. (USDm) 755 719 674 586 528 557 497EBIT, adj. (USDm) 725 685 624 531 474 501 442Pre-tax profit, adj. (USDm) 404 359 242 248 190 214 236Net income, adj. (USDm) 143 154 132 142 117 156 183EPS, adj. (USD) 1.93 1.95 1.67 1.76 1.37 1.83 2.15OCFPS (USD) 4.5 4.2 1.7 1.1 1.4 1.6 2.1FCFPS (USD) 7.4 2.9 -1.0 0.8 2.5 3.5 3.5BVPS (USD) 12.2 12.8 12.9 11.7 12.0 12.3 12.8Net asset value (NAV) (USD) 17.7 14.9 14.9 14.9 0.0 0.0 0.0Dividend (USD) 1.20 1.42 1.47 1.95 1.22 1.62 1.62EV/EBITDA, adj. (x) 6.6 7.3 5.8 7.8 8.5 7.6 8.0EV/EBIT, adj. (x) 6.9 7.7 6.3 8.6 9.4 8.4 8.9P/E, adj. (x) 7.1 11.1 5.6 9.4 12.7 9.5 8.1P/OCF (x) 3.0 5.1 5.5 15.5 12.2 10.7 8.2EV/FCF (x) 9.1 22.9 n.m. 73.4 20.8 14.2 13.1P/Book (x) 1.1 1.7 0.7 1.4 1.4 1.4 1.4P/NAV (x) 0.8 1.4 0.6 1.1 n.m. n.m. n.m.Dividend yield (%) 8.8 6.6 15.7 11.7 7.0 9.3 9.3
Key Assumptions 2009 2010 2011 2012 2013E 2014E 2015E
Result Preview 15-Apr-13

94
1Q13 Result preview
Source: RS Platou Markets
Ship Finance (USDm) 4Q11 2Q12 3Q12 4Q12Platou 1Q13E
TCE Income 76 84 74 78 69Operating expenses (23) (25) (27) (27) (26)EBITDA excl. one-offs 53 58 47 51 43Gain/loss sale of assets 2 22 2 22 18Depreciation & amortization (14) (14) (14) (14) (14)EBIT 42 66 35 58 47Associated companies 17 17 16 16 16Net interest (24) (20) (21) (21) (22)Other financial income (5) (2) 4 (2) -Pretax profit 30 61 35 51 42Taxes - - - - -Minorities - - - - -Net profit 30 61 35 51 42Net profit, adjusted 33 41 29 31 24
EPS 0.38 0.77 0.44 0.60 0.49EPS, adjusted 0.42 0.52 0.36 0.37 0.29
Dividend 0.30 0.39 0.39 0.78 0.00
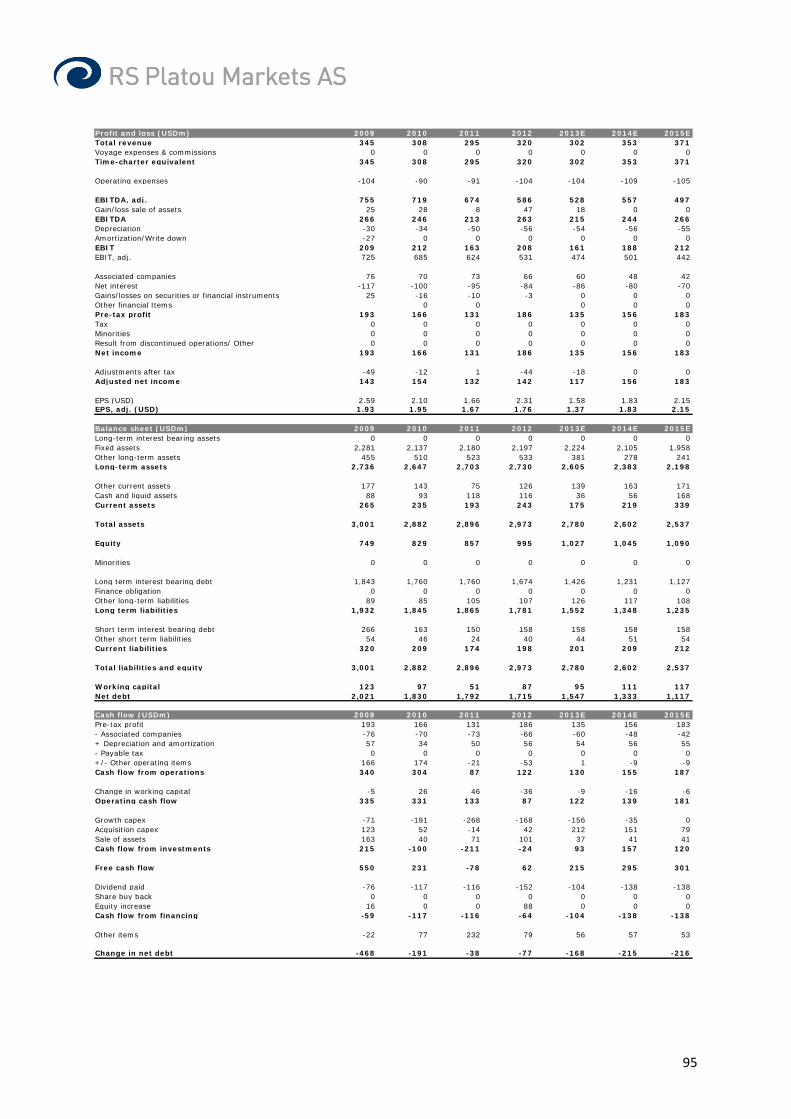
95
Profit and loss (USDm) 2009 2010 2011 2012 2013E 2014E 2015ETotal revenue 345 308 295 320 302 353 371Voyage expenses & commissions 0 0 0 0 0 0 0Time-charter equivalent 345 308 295 320 302 353 371
Operating expenses -104 -90 -91 -104 -104 -109 -105
EBITDA, adj. 755 719 674 586 528 557 497Gain/loss sale of assets 25 28 8 47 18 0 0EBITDA 266 246 213 263 215 244 266Depreciation -30 -34 -50 -56 -54 -56 -55Amortization/Write down -27 0 0 0 0 0 0EBIT 209 212 163 208 161 188 212EBIT, adj. 725 685 624 531 474 501 442
Associated companies 76 70 73 66 60 48 42Net interest -117 -100 -95 -84 -86 -80 -70Gains/losses on securities or financial instruments 25 -16 -10 -3 0 0 0Other financial Items 0 0 0 0 0Pre-tax profit 193 166 131 186 135 156 183Tax 0 0 0 0 0 0 0Minorities 0 0 0 0 0 0 0Result from discontinued operations/ Other 0 0 0 0 0 0 0Net income 193 166 131 186 135 156 183
Adjustments after tax -49 -12 1 -44 -18 0 0Adjusted net income 143 154 132 142 117 156 183
EPS (USD) 2.59 2.10 1.66 2.31 1.58 1.83 2.15EPS, adj. (USD) 1.93 1.95 1.67 1.76 1.37 1.83 2.15
Balance sheet (USDm) 2009 2010 2011 2012 2013E 2014E 2015ELong-term interest bearing assets 0 0 0 0 0 0 0Fixed assets 2,281 2,137 2,180 2,197 2,224 2,105 1,958Other long-term assets 455 510 523 533 381 278 241Long-term assets 2,736 2,647 2,703 2,730 2,605 2,383 2,198
Other current assets 177 143 75 126 139 163 171Cash and liquid assets 88 93 118 116 36 56 168Current assets 265 235 193 243 175 219 339
Total assets 3,001 2,882 2,896 2,973 2,780 2,602 2,537
Equity 749 829 857 995 1,027 1,045 1,090
Minorities 0 0 0 0 0 0 0
Long term interest bearing debt 1,843 1,760 1,760 1,674 1,426 1,231 1,127Finance obligation 0 0 0 0 0 0 0Other long-term liabilities 89 85 105 107 126 117 108Long term liabilities 1,932 1,845 1,865 1,781 1,552 1,348 1,235
Short term interest bearing debt 266 163 150 158 158 158 158Other short term liabilities 54 46 24 40 44 51 54Current liabilities 320 209 174 198 201 209 212
Total liabilities and equity 3,001 2,882 2,896 2,973 2,780 2,602 2,537
Working capital 123 97 51 87 95 111 117Net debt 2,021 1,830 1,792 1,715 1,547 1,333 1,117
Cash flow (USDm) 2009 2010 2011 2012 2013E 2014E 2015EPre-tax profit 193 166 131 186 135 156 183- Associated companies -76 -70 -73 -66 -60 -48 -42+ Depreciation and amortization 57 34 50 56 54 56 55- Payable tax 0 0 0 0 0 0 0+/- Other operating items 166 174 -21 -53 1 -9 -9Cash flow from operations 340 304 87 122 130 155 187
Change in working capital -5 26 46 -36 -9 -16 -6Operating cash flow 335 331 133 87 122 139 181
Growth capex -71 -191 -268 -168 -156 -35 0Acquisition capex 123 52 -14 42 212 151 79Sale of assets 163 40 71 101 37 41 41Cash flow from investments 215 -100 -211 -24 93 157 120
Free cash flow 550 231 -78 62 215 295 301
Dividend paid -76 -117 -116 -152 -104 -138 -138Share buy back 0 0 0 0 0 0 0Equity increase 16 0 0 88 0 0 0Cash flow from financing -59 -117 -116 -64 -104 -138 -138
Other items -22 77 232 79 56 57 53
Change in net debt -468 -191 -38 -77 -168 -215 -216
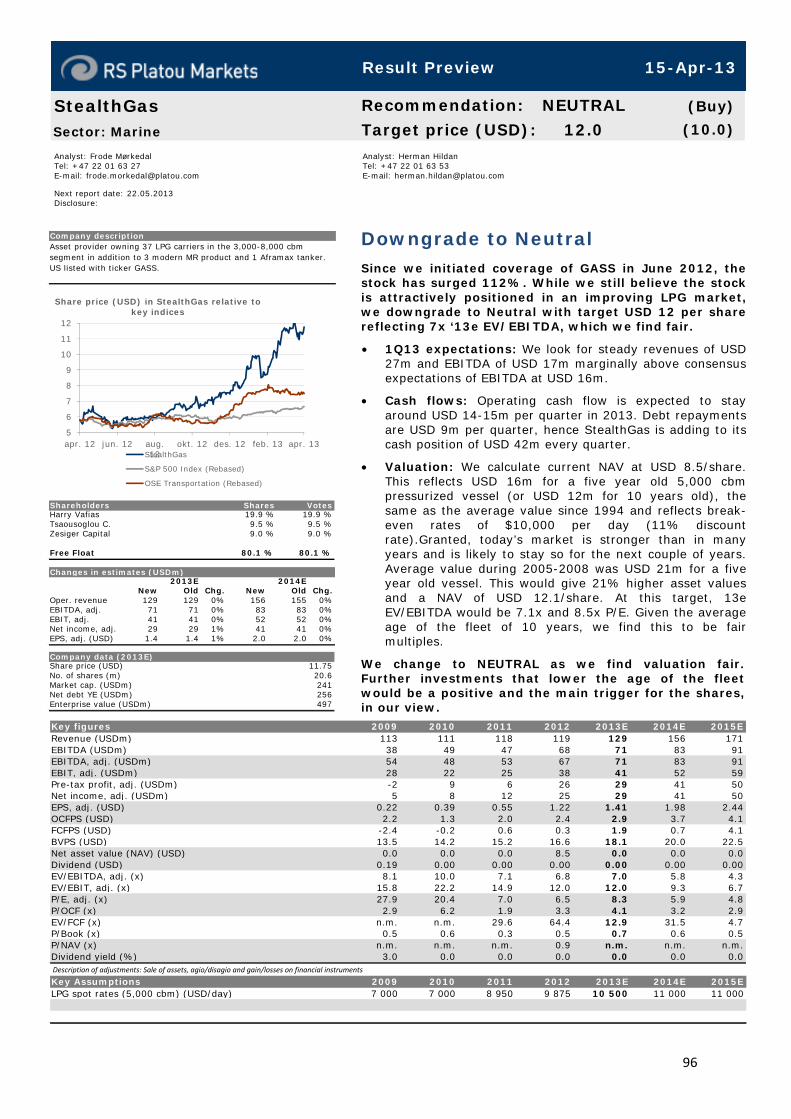
96
Analyst: Frode Mørkedal Tel: +47 22 01 63 27 E-mail: [email protected] Next report date: 22.05.2013 Disclosure:
Analyst: Herman Hildan Tel: +47 22 01 63 53 E-mail: [email protected]
Downgrade to Neutral Since we initiated coverage of GASS in June 2012, thestock has surged 112%. While we still believe the stockis attractively positioned in an improving LPG market,we downgrade to Neutral with target USD 12 per sharereflecting 7x ‘13e EV/EBITDA, which we find fair.
• 1Q13 expectations: We look for steady revenues of USD 27m and EBITDA of USD 17m marginally above consensusexpectations of EBITDA at USD 16m.
• Cash flows: Operating cash flow is expected to stay around USD 14-15m per quarter in 2013. Debt repaymentsare USD 9m per quarter, hence StealthGas is adding to itscash position of USD 42m every quarter.
• Valuation: We calculate current NAV at USD 8.5/share. This reflects USD 16m for a five year old 5,000 cbmpressurized vessel (or USD 12m for 10 years old), the same as the average value since 1994 and reflects break-even rates of $10,000 per day (11% discountrate).Granted, today’s market is stronger than in manyyears and is likely to stay so for the next couple of years.Average value during 2005-2008 was USD 21m for a five year old vessel. This would give 21% higher asset valuesand a NAV of USD 12.1/share. At this target, 13e EV/EBITDA would be 7.1x and 8.5x P/E. Given the average age of the fleet of 10 years, we find this to be fair multiples.
We change to NEUTRAL as we find valuation fair. Further investments that lower the age of the fleet would be a positive and the main trigger for the shares, in our view.
StealthGasSector: Marine
Recommendation: NEUTRAL (Buy)
Target price (USD): 12.0 (10.0)
Company descriptionAsset provider owning 37 LPG carriers in the 3,000-8,000 cbm segment in addition to 3 modern MR product and 1 Aframax tanker. US listed with ticker GASS.
5
6
7
8
9
10
11
12
apr. 12 jun. 12 aug.12
okt. 12 des. 12 feb. 13 apr. 13
Share price (USD) in StealthGas relative to key indices
StealthGas
S&P 500 Index (Rebased)
OSE Transportation (Rebased)
Shareholders Shares VotesHarry Vafias 19.9 % 19.9 %Tsaousoglou C. 9.5 % 9.5 %Zesiger Capital 9.0 % 9.0 %
Free Float 80.1 % 80.1 %
Changes in estimates (USDm)2013E 2014E
New Old Chg. New Old Chg.Oper. revenue 129 129 0% 156 155 0%EBITDA, adj. 71 71 0% 83 83 0%EBIT, adj. 41 41 0% 52 52 0%Net income, adj. 29 29 1% 41 41 0%EPS, adj. (USD) 1.4 1.4 1% 2.0 2.0 0%
Company data (2013E)Share price (USD) 11.75No. of shares (m) 20.6Market cap. (USDm) 241Net debt YE (USDm) 256Enterprise value (USDm) 497
Description of adjustments: Sale of assets, agio/disagio and gain/losses on financial instruments
Key figures 2009 2010 2011 2012 2013E 2014E 2015ERevenue (USDm) 113 111 118 119 129 156 171EBITDA (USDm) 38 49 47 68 71 83 91EBITDA, adj. (USDm) 54 48 53 67 71 83 91EBIT, adj. (USDm) 28 22 25 38 41 52 59Pre-tax profit, adj. (USDm) -2 9 6 26 29 41 50Net income, adj. (USDm) 5 8 12 25 29 41 50EPS, adj. (USD) 0.22 0.39 0.55 1.22 1.41 1.98 2.44OCFPS (USD) 2.2 1.3 2.0 2.4 2.9 3.7 4.1FCFPS (USD) -2.4 -0.2 0.6 0.3 1.9 0.7 4.1BVPS (USD) 13.5 14.2 15.2 16.6 18.1 20.0 22.5Net asset value (NAV) (USD) 0.0 0.0 0.0 8.5 0.0 0.0 0.0Dividend (USD) 0.19 0.00 0.00 0.00 0.00 0.00 0.00EV/EBITDA, adj. (x) 8.1 10.0 7.1 6.8 7.0 5.8 4.3EV/EBIT, adj. (x) 15.8 22.2 14.9 12.0 12.0 9.3 6.7P/E, adj. (x) 27.9 20.4 7.0 6.5 8.3 5.9 4.8P/OCF (x) 2.9 6.2 1.9 3.3 4.1 3.2 2.9EV/FCF (x) n.m. n.m. 29.6 64.4 12.9 31.5 4.7P/Book (x) 0.5 0.6 0.3 0.5 0.7 0.6 0.5P/NAV (x) n.m. n.m. n.m. 0.9 n.m. n.m. n.m.Dividend yield (%) 3.0 0.0 0.0 0.0 0.0 0.0 0.0
Key Assumptions 2009 2010 2011 2012 2013E 2014E 2015ELPG spot rates (5,000 cbm) (USD/day) 7 000 7 000 8 950 9 875 10 500 11 000 11 000
Result Preview 15-Apr-13
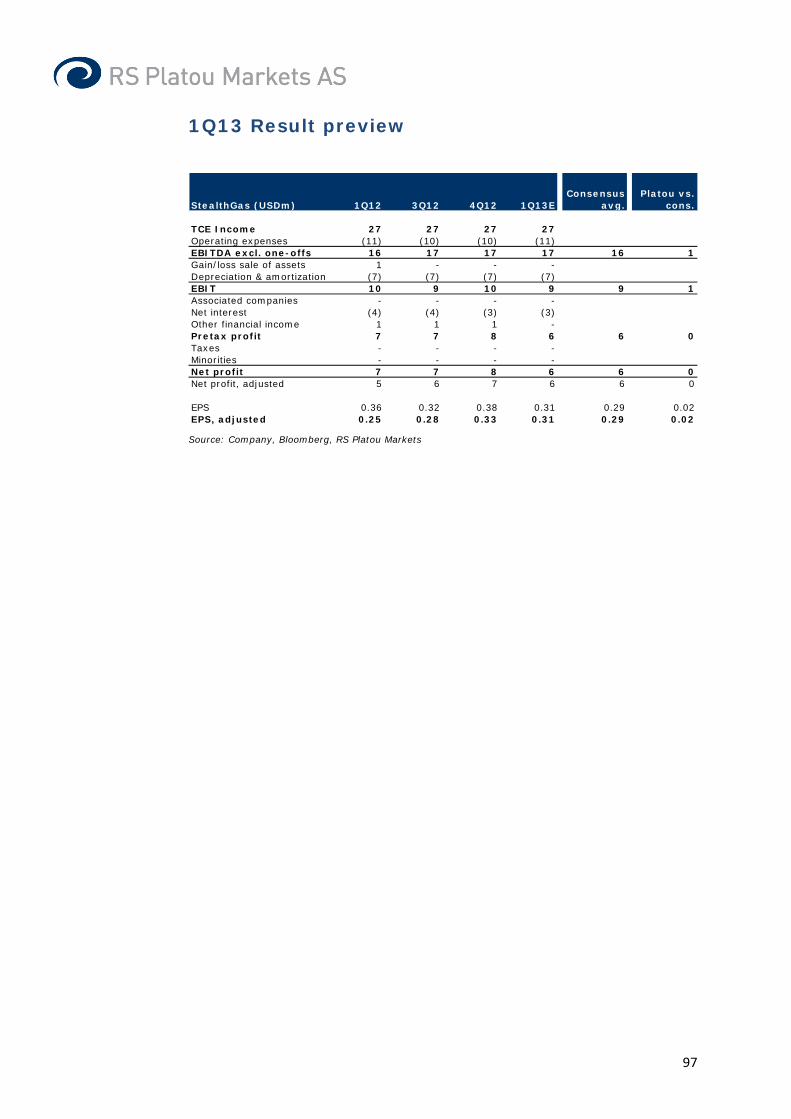
97
1Q13 Result preview
Source: Company, Bloomberg, RS Platou Markets
StealthGas (USDm) 1Q12 3Q12 4Q12 1Q13EConsensus
avg.Platou vs.
cons.
TCE Income 27 27 27 27Operating expenses (11) (10) (10) (11)EBITDA excl. one-offs 16 17 17 17 16 1Gain/loss sale of assets 1 - - -Depreciation & amortization (7) (7) (7) (7)EBIT 10 9 10 9 9 1Associated companies - - - -Net interest (4) (4) (3) (3)Other financial income 1 1 1 -Pretax profit 7 7 8 6 6 0Taxes - - - -Minorities - - - -Net profit 7 7 8 6 6 0Net profit, adjusted 5 6 7 6 6 0
EPS 0.36 0.32 0.38 0.31 0.29 0.02EPS, adjusted 0.25 0.28 0.33 0.31 0.29 0.02

98
Profit and loss (USDm) 2009 2010 2011 2012 2013E 2014E 2015ETotal revenue 113 111 118 119 129 156 171Voyage expenses & commissions -11 -14 -18 -13 -14 -17 -18Time-charter equivalent 103 98 100 107 116 139 153
Operating expenses -48 -49 -47 -40 -45 -56 -62
EBITDA, adj. 54 48 53 67 71 83 91Gain/loss sale of assets -17 1 -6 1 0 0 0EBITDA 38 49 47 68 71 83 91Depreciation -27 -27 -28 -29 -29 -32 -33Amortization/Write down -10 0 0 0 0 0 0EBIT 1 23 20 40 41 52 59EBIT, adj. 28 22 25 38 41 52 59
Associated companies 0 0 0 0 0 0 0Net interest -13 -13 -14 -13 -12 -11 -9Gains/losses on securities or financial instruments -2 -1 3 3 0 0 0Other financial Items 0 0Pre-tax profit -13 8 9 29 29 41 50Tax 0 0 0 0 0 0 0Minorities 0 0 0 0 0 0 0Result from discontinued operations/ Other 0 0 0 0 0 0 0Net income -13 8 9 29 29 41 50
Adjustments after tax 18 1 3 -4 0 0 0Adjusted net income 5 8 12 25 29 41 50
EPS (USD) -0.60 0.37 0.41 1.42 1.41 1.98 2.44EPS, adj. (USD) 0.22 0.39 0.55 1.22 1.41 1.98 2.44
Balance sheet (USDm) 2009 2010 2011 2012 2013E 2014E 2015ELong-term interest bearing assets 2 2 8 9 9 9 9Fixed assets 618 640 636 654 645 674 641Other long-term assets 3 1 2 1 1 1 1Long-term assets 623 643 646 664 655 684 651
Other current assets 25 15 6 7 7 9 10Cash and liquid assets 44 30 44 42 45 64 83Current assets 69 45 50 49 52 73 92
Total assets 692 688 696 713 707 757 743
Equity 301 306 313 342 371 412 462
Minorities 0 0 0 0 0 0 0
Long term interest bearing debt 310 310 317 310 274 278 212Finance obligation 0 0 0 0 0 0 0Other long-term liabilities 13 12 9 6 6 6 6Long term liabilities 323 322 327 315 279 283 217
Short term interest bearing debt 36 35 34 36 36 36 36Other short term liabilities 33 25 22 20 22 26 29Current liabilities 69 60 56 56 57 62 65
Total liabilities and equity 692 688 696 713 708 757 743
Working capital -8 -10 -16 -13 -14 -17 -19Net debt 300 314 299 294 256 240 156
Cash flow (USDm) 2009 2010 2011 2012 2013E 2014E 2015EPre-tax profit -13 8 9 29 29 41 50- Associated companies 0 0 0 0 0 0 0+ Depreciation and amortization 37 27 28 29 29 32 33- Payable tax 0 0 0 0 0 0 0+/- Other operating items 17 -9 0 -7 0 0 0Cash flow from operations 40 26 36 51 58 72 83
Change in working capital 8 2 6 -3 1 3 2Operating cash flow 48 28 42 49 59 75 84
Maintenance capex 0 0 0 0 0 0 0Growth capex -112 -71 -55 -63 -21 -60 0Acquisition capex -1 1 0 3 0 0 0Sale of assets 12 37 25 18 0 0 0Cash flow from investments -102 -33 -30 -42 -21 -60 0
Free cash flow -53 -5 13 7 39 15 84
Dividend paid -4 0 0 0 0 0 0Share buy back 0 -6 -2 0 0 0 0Equity increase 0 0 0 0 0 0 0Cash flow from financing -4 -6 -2 0 0 0 0
Other items -114 -2 4 -2 0 0 0
Change in net debt 172 14 -14 -5 -39 -15 -84

99
Analyst: Frode Mørkedal Tel: +47 22 01 63 27 E-mail: [email protected] Next report date: 17.05.2013 Disclosure:
Analyst: Herman Hildan Tel: +47 22 01 63 53 E-mail: [email protected]
Changed from dividends to growth Teekay Tankers changed its dividend policy in 4Q12,moving from a variable dividend to a fixed (lower)dividend payment of 3 cents per quarter (~4.5% annualyield). Instead the company will focus on growing thefleet at historically low vessel values.
• 1Q13 expectations: We assume Suezmax and Aframax spot rates of $13,000 and $11,000 per day, respectively.This should result in revenues of USD 44m and EBITDA ofUSD 15m. In 4Q12, TNK wrote down book vessel values byUSD 353m, which will reduce 1Q13 depreciation by USD5m to USD 13m. We estimate operating profit of USD 2m and net profit of USD -3m. EPS expected at $-0.04.
• From dividends to growth: With the new fixed dividendpay-out of 3 cents per quarter starting 1Q13, TNK hasmoved from a dividend play to growth. TNK announced inApril 2013 that it had ordered 4 fuel efficient LR2 producttankers at STX of Korea for USD 47m each with deliverylate 2015/early 2016. The Company also secured fixed-price options for another 12 LR2 newbuilds. The growth willbe funded by existing liquidity of USD 327m.
• Valuation: Current NAV is $1.8/share. However, including the 12 newbuild options, and assuming 12% higher assetvalues, NAV would increase to $4/share. This would reflectvalues for 5 year old MRs of USD 29m, LR2 of USD 36mand Suezmax of USD 49m.
We reiterate BUY on TNK with target USD 4 per share. We find TNK as an attractive bet on the tanker cycle with a strong balance sheet and built in growth with a quarterly dividend payment.
Teekay TankersSector: Marine
Recommendation: BUY (unchanged)
Target price (USD): 4.0 (unchanged)
Company descriptionSpin off from Teekay Corp owning 10 Suezmax, 12 Aframax, 3 LR2 and 3 MR product tankers plus 50% ownership in VLCC newbuild. TNK is regarded as a dividend play.
2
3
4
5
6
7
8
apr. 12 jun. 12 aug. 12 okt. 12 des. 12 feb. 13
Share price (USD) in Teekay Tankers relative to key indices
Teekay Tankers
S&P 500 Index (Rebased)
OSE Transportation (Rebased)
Shareholders Shares VotesTeekay Corp 25.0 % 53.0 %
Free Float 75.0 % 75.0 %
Changes in estimates (USDm)2013E 2014E
New Old Chg. New Old Chg.Oper. revenue 192 194 -1% 198 206 -4%EBITDA, adj. 73 77 -5% 84 89 -6%EBIT, adj. 23 5 nm 34 16 nmNet income, adj. 5 -26 nm 18 -10 nmEPS, adj. (USD) 0.1 -0.3 nm 0.2 -0.1 nm
Company data (2013E)Share price (USD) 2.60No. of shares (m) 83.6Market cap. (USDm) 217Net debt YE (USDm) 569Enterprise value (USDm) 786
Description of adjustments: Sale of assets, agio/disagio and gain/losses on financial instruments
Key figures 2009 2010 2011 2012 2013E 2014E 2015ERevenue (USDm) 113 139 121 155 192 198 291EBITDA (USDm) 70 81 50 65 73 84 173EBITDA, adj. (USDm) 70 83 64 65 73 84 173EBIT, adj. (USDm) 42 37 20 6 23 34 121Pre-tax profit, adj. (USDm) 30 22 -3 -10 5 18 105Net income, adj. (USDm) 30 24 10 -362 5 18 105EPS, adj. (USD) 1.05 0.57 0.17 -4.55 0.06 0.22 1.26OCFPS (USD) 2.1 1.4 0.9 0.6 0.7 0.8 1.9FCFPS (USD) 1.9 -0.7 0.9 0.4 0.4 0.6 0.4BVPS (USD) 6.4 8.6 7.9 3.6 3.6 3.7 4.8Net asset value (NAV) (USD) 3.9 1.8 0.0 1.8 0.0 0.0 0.0Dividend (USD) 1.40 1.24 0.72 0.32 0.12 0.12 0.12EV/EBITDA, adj. (x) 8.1 13.0 8.7 14.6 10.7 8.8 4.2EV/EBIT, adj. (x) 13.6 29.0 27.0 n.m. 34.7 22.2 5.9P/E, adj. (x) 8.1 21.5 21.0 n.m. 44.5 11.8 2.1P/OCF (x) 4.1 8.9 3.9 5.3 3.9 3.3 1.4EV/FCF (x) 10.7 n.m. 10.4 28.0 24.5 14.1 21.8P/Book (x) 1.3 1.4 0.4 0.8 0.7 0.7 0.5P/NAV (x) 2.2 7.0 n.m. 1.6 n.m. n.m. n.m.Dividend yield (%) 16.4 10.0 20.5 11.0 4.6 4.6 4.6
Key Assumptions 2009 2010 2011 2012 2013E 2014E 2015ESuezmax spot USD/Day 25 900 28 000 17 000 15 000 18 000 22 000 34 000Aframax spot USD/Day 14 900 21 200 13 000 15 000 15 000 18 000 28 000
Result Preview 15-Apr-13
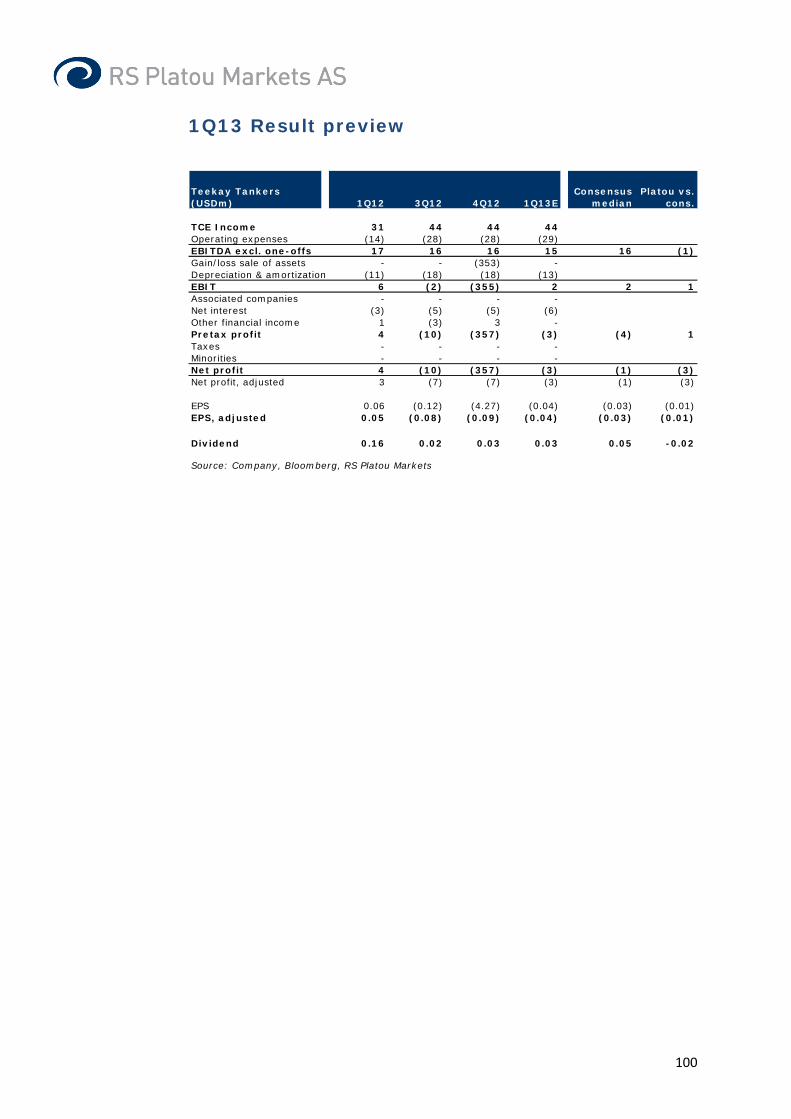
100
1Q13 Result preview
Teekay Tankers (USDm) 1Q12 3Q12 4Q12 1Q13E
Consensus median
Platou vs. cons.
TCE Income 31 44 44 44Operating expenses (14) (28) (28) (29)EBITDA excl. one-offs 17 16 16 15 16 (1)Gain/loss sale of assets - - (353) -Depreciation & amortization (11) (18) (18) (13)EBIT 6 (2) (355) 2 2 1Associated companies - - - -Net interest (3) (5) (5) (6)Other financial income 1 (3) 3 -Pretax profit 4 (10) (357) (3) (4) 1Taxes - - - -Minorities - - - -Net profit 4 (10) (357) (3) (1) (3)Net profit, adjusted 3 (7) (7) (3) (1) (3)
EPS 0.06 (0.12) (4.27) (0.04) (0.03) (0.01)EPS, adjusted 0.05 (0.08) (0.09) (0.04) (0.03) (0.01)
Dividend 0.16 0.02 0.03 0.03 0.05 -0.02
Source: Company, Bloomberg, RS Platou Markets

101
Profit and loss (USDm) 2009 2010 2011 2012 2013E 2014E 2015ETotal revenue 113 139 121 155 192 198 291Voyage expenses & commissions -3 -3 -3 -4 -5 -5 -8Time-charter equivalent 110 137 118 151 187 192 283
Operating expenses -40 -54 -55 -85 -113 -108 -110
EBITDA, adj. 70 83 64 65 73 84 173Gain/loss sale of assets 0 -2 -13 0 0 0 0EBITDA 70 81 50 65 73 84 173Depreciation -29 -45 -43 -59 -51 -51 -52Amortization/Write down 0 0 0 -353 0 0 0EBIT 42 35 7 -346 23 34 121EBIT, adj. 42 37 20 6 23 34 121
Associated companies 0 0 0 0 2 3 2Net interest -12 -13 -10 -16 -20 -18 -18Gains/losses on securities or financial instruments 9 -6 -6 1 0 0 0Other financial Items 0Pre-tax profit 39 16 -9 -361 5 18 105Tax 0 0 0 0 0 0 0Minorities 0 0 0 0 0 0 0Result from discontinued operations/ Other 0 0 0 0 0 0 0Net income 39 16 -9 -361 5 18 105
Adjustments after tax -9 8 19 -1 0 0 0Adjusted net income 30 24 10 -362 5 18 105
EPS (USD) 1.36 0.39 -0.15 -4.54 0.06 0.22 1.26EPS, adj. (USD) 1.05 0.57 0.17 -4.55 0.06 0.22 1.26
Balance sheet (USDm) 2009 2010 2011 2012 2013E 2014E 2015ELong-term interest bearing assets 0 0 0 0 0 0 0Fixed assets 506 757 717 895 868 831 907Other long-term assets 10 153 129 159 42 45 47Long-term assets 516 911 845 1 054 911 877 954
Other current assets 13 13 21 25 31 32 47Cash and liquid assets 10 12 16 26 146 167 267Current assets 23 26 37 51 177 199 314
Total assets 540 937 882 1 106 1 087 1 076 1 268
Equity 206 443 489 302 297 305 401
Minorities 0 0 0 0 0 0 0
Long term interest bearing debt 302 452 347 710 689 668 745Finance obligation 0 0 0 0 0 0 0Other long-term liabilities 10 23 23 35 35 35 35Long term liabilities 312 475 370 745 724 703 780
Short term interest bearing debt 4 2 2 25 25 25 25Other short term liabilities 18 17 20 33 41 42 62Current liabilities 22 19 22 58 66 67 87
Total liabilities and equity 540 937 882 1 106 1 087 1 076 1 268
Working capital -5 -4 1 -8 -10 -10 -15Net debt 295 442 333 709 569 526 503
Cash flow (USDm) 2009 2010 2011 2012 2013E 2014E 2015EPre-tax profit 39 16 -9 -361 5 18 105- Associated companies 0 0 0 0 -2 -3 -2+ Depreciation and amortization 29 45 43 411 51 51 52- Payable tax 0 0 0 0 0 0 0+/- Other operating items -17 -2 25 -15 0 0 0Cash flow from operations 51 60 59 35 54 66 155
Change in working capital 8 -2 -4 9 2 0 5Operating cash flow 59 58 55 44 56 67 160
Maintenance capex -6 -6 -2 0 -14 -14 -14Growth capex 0 -116 0 -5 -19 0 -113Acquisition capex 0 0 0 -5 0 0 0Sale of assets 0 35 0 0 9 0 0Cash flow from investments -6 -86 -2 -10 -24 -14 -127
Free cash flow 53 -28 53 34 32 53 33
Dividend paid -50 -55 -51 -32 -10 -10 -10Share buy back 0 0 0 0 0 0 0Equity increase 66 203 107 76 118 0 0Cash flow from financing 15 147 56 43 108 -10 -10
Other items -61 -266 0 -454 0 0 0
Change in net debt -7 147 -109 376 -141 -43 -23

102
Analyst: Frode Mørkedal Tel: +47 22 01 63 27 E-mail: [email protected] Next report date: 16.05.2013 Disclosure:
Analyst: Herman Hildan Tel: +47 22 01 63 53 E-mail: [email protected]
Improved earnings expected Thoresen Thai is expected to report higher earnings forthe quarter ended March 2013 (fiscal 2Q13) driven by improved Supramax bulk earnings and higher Mermaidcontribution.
• 2Q13 expectations: We look for Supramax earnings of $8,000 per day and unchanged owned fleet of 16Supramax vessels and 13 charter-in vessels. This should result in THB 241m vessel EBITDA (before G&A) from drybulk, up from THB 175m in 1Q13. We assume improvedutilization of the Subsea fleet (60% vs. 51% in 1Q13) while one of the two Drilling barges (MTR2) is assumed offhirethroughout the quarter. This gives Mermaid EBITDA beforeG&A of THB 493m vs. THB 433m in 1Q13. Mermaidrecently fixed out the MTR2 for two years at implied day rate of $100,000/day. This should lift earnings from 3Q13onwards. Baconco and UMS which had bumper quarters in1Q13 are assumed to report lower figures and margins.Overall we look for total consolidated vessel EBITDA of THB901m vs. THB 843m in 1Q13.
• Valuation: We calculate NAV of THB 12.7 per share with Mermaid and UMS at stock market value. If dry bulk assetvalues reach mid-cycle (20 year average) values (e.g. Supramax 5 year old at USD 28m), then NAV improves toTHB 17 per share. Given our increased Mermaid earnings estimates, we have lifted our target to THB 18 per sharereflecting 7.4x ‘13e EV/EBITDA.
We reiterate our Neutral recommendation given the current valuation of the shares.
Thoresen Thai AgenciesSector: Marine
Recommendation: NEUTRAL (unchanged)
Target price (THB): 18.0 (17.0)
Company descriptionIntegrated shipping group based in Thailand, having interests in dry bulk shipping, oil and gas services, coal mining and logistics segments. TTA is listed on the Stock Exchange of Thailand under the ticker TTA TB.
0
5
10
15
20
25
Apr-12 Jul-12 Oct-12 Jan-13 Apr-13
Share price in Thoresen Thai relative to key indices
Mercator Line Singapore MSCI Asia Pac ex Jap
Shareholders Shares VotesThai NVDR Co. 3.8 % 3.8 %
Free Float 96.2 % 96.2 %
Changes in estimates (THBm)2013E 2014E
New Old Chg. New Old Chg.Oper. revenue 18 102 17 179 5% 21 737 19 582 11%EBITDA, adj. 2 836 762 nm 6 029 2 769 nmEBIT, adj. 1 101 -1 048 nm 4 275 926 nmNet income, adj. 256 -1 253 nm 2 559 344 nmEPS, adj. (THB) 0.3 -1.5 nm 2.6 0.3 nm
Company data (2013E)Share price (THB) 18.20No. of shares (m) 991.2Market cap. (THBm) 18 040Net debt YE (THBm) 3 843Enterprise value (THBm) 21 883
Description of adjustments: Sale of assets, agio/disagio and gain/losses on financial instruments
Key figures 2009 2010 2011 2012 2013E 2014E 2015ERevenue (THBm) 20 393 18 048 17 565 16 339 18 102 21 737 24 445EBITDA (THBm) 3 723 2 995 2 521 1 822 2 836 6 029 8 486EBITDA, adj. (THBm) 3 670 2 333 1 932 1 822 2 836 6 029 8 486EBIT, adj. (THBm) 1 928 490 -152 103 1 101 4 275 6 731Pre-tax profit, adj. (THBm) 1 757 816 -123 -369 771 4 179 6 735Net income, adj. (THBm) 1 131 27 -983 -558 256 2 559 4 471EPS, adj. (THB) 1.60 0.04 -1.39 -0.79 0.30 2.58 4.51OCFPS (THB) 7.5 2.2 0.2 2.8 2.7 4.2 6.3FCFPS (THB) 0.7 -13.2 -5.4 0.5 1.1 4.1 6.2BVPS (THB) 43.9 44.5 43.7 36.2 31.6 34.8 39.9Net asset value (NAV) (THB) 0.0 12.7 12.7 12.7 0.0 0.0 0.0Dividend (THB) 0.70 0.22 0.76 0.60 0.00 0.00 0.00EV/EBITDA, adj. (x) 3.9 9.8 13.1 13.4 7.7 3.0 1.4EV/EBIT, adj. (x) 7.4 46.8 n.m. n.m. 19.9 4.2 1.7P/E, adj. (x) 16.0 n.m. n.m. n.m. 60.5 7.0 4.0P/OCF (x) 3.4 11.0 n.m. 7.5 6.7 4.4 2.9EV/FCF (x) 27.1 n.m. n.m. 67.3 23.7 4.4 1.9P/Book (x) 0.6 0.5 0.5 0.6 0.6 0.5 0.5P/NAV (x) n.m. 1.9 1.6 1.6 n.m. n.m. n.m.Dividend yield (%) 2.7 0.9 3.7 2.9 0.0 0.0 0.0
Key Assumptions 2009 2010 2011 2012 2013E 2014E 2015ESupramax USD/day 17 100 22 500 14 500 10 400 8 600 13 000 17 000Handysize USD/day 11 200 16 500 10 500 8 600 7 100 10 000 13 000
Result Preview 15-Apr-13
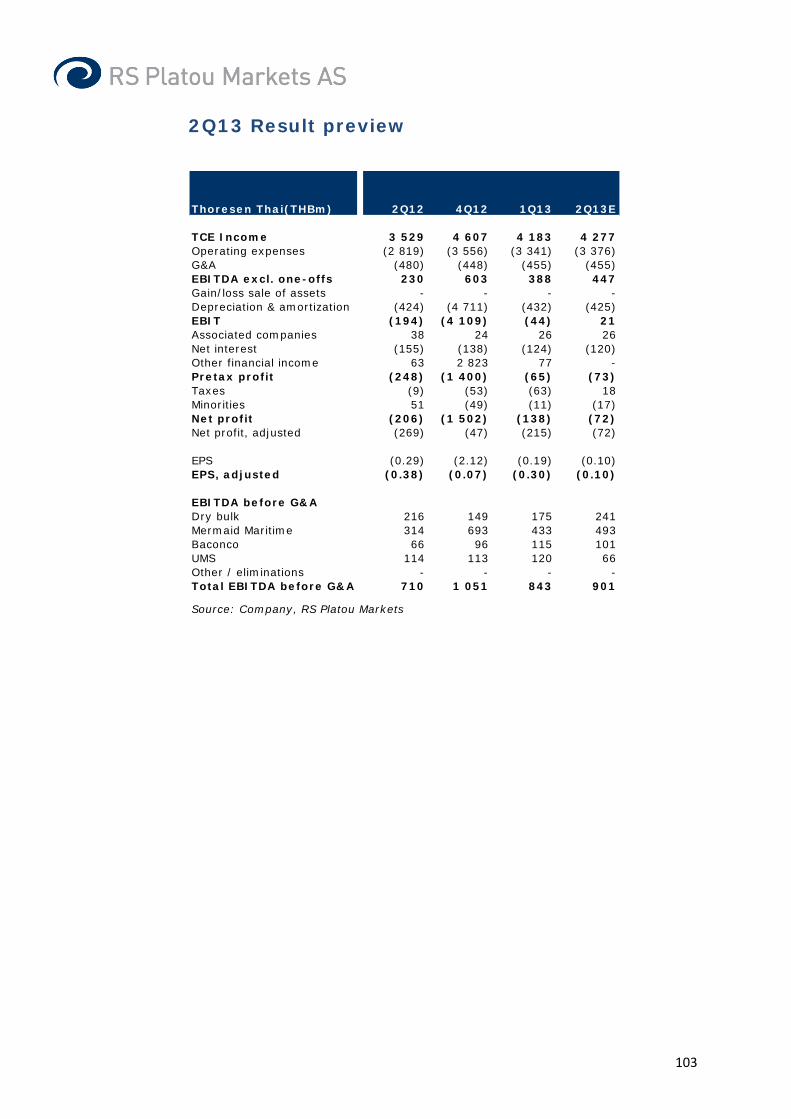
103
2Q13 Result preview
Thoresen Thai(THBm) 2Q12 4Q12 1Q13 2Q13E
TCE Income 3 529 4 607 4 183 4 277Operating expenses (2 819) (3 556) (3 341) (3 376)G&A (480) (448) (455) (455)EBITDA excl. one-offs 230 603 388 447Gain/loss sale of assets - - - -Depreciation & amortization (424) (4 711) (432) (425)EBIT (194) (4 109) (44) 21Associated companies 38 24 26 26Net interest (155) (138) (124) (120)Other financial income 63 2 823 77 -Pretax profit (248) (1 400) (65) (73)Taxes (9) (53) (63) 18Minorities 51 (49) (11) (17)Net profit (206) (1 502) (138) (72)Net profit, adjusted (269) (47) (215) (72)
EPS (0.29) (2.12) (0.19) (0.10)EPS, adjusted (0.38) (0.07) (0.30) (0.10)
EBITDA before G&ADry bulk 216 149 175 241Mermaid Maritime 314 693 433 493Baconco 66 96 115 101UMS 114 113 120 66Other / eliminations - - - -Total EBITDA before G&A 710 1 051 843 901
Source: Company, RS Platou Markets

104
Profit and loss (THBm) 2009 2010 2011 2012 2013E 2014E 2015ETotal revenue 20 393 18 048 17 565 16 339 18 102 21 737 24 445Voyage expenses & commissions 0 0 0 0 0 0 0Time-charter equivalent 20 393 18 048 17 565 16 339 18 102 21 737 24 445
Operating expenses -16 723 -15 715 -15 633 -14 517 -15 267 -15 708 -15 959
EBITDA, adj. 3 670 2 333 1 932 1 822 2 836 6 029 8 486Gain/loss sale of assets 52 663 589 0 0 0 0EBITDA 3 723 2 995 2 521 1 822 2 836 6 029 8 486Depreciation -1 742 -1 843 -2 084 -1 719 -1 735 -1 754 -1 754Amortization/Write down -37 -119 -554 -4 277 0 0 0EBIT 1 944 1 033 -117 -4 174 1 101 4 275 6 731EBIT, adj. 1 928 490 -152 103 1 101 4 275 6 731
Associated companies 30 80 110 129 104 104 104Net interest -253 -416 -670 -602 -434 -200 -100Gains/losses on securities or financial instruments 666 225 1 122 217 77 0 0Other financial Items 0 0Pre-tax profit 2 387 923 445 -4 430 848 4 179 6 735Tax -211 -256 -342 -167 -290 -1 045 -1 684Minorities -362 129 70 -22 -225 -575 -580Result from discontinued operations/ Other 0 0 0 0 0 0 0Net income 1 814 796 173 -4 619 333 2 559 4 471
Adjustments after tax -682 -769 -1 157 4 061 -77 0 0Adjusted net income 1 131 27 -983 -558 256 2 559 4 471
EPS (THB) 2.56 1.12 0.24 -6.52 0.39 2.58 4.51EPS, adj. (THB) 1.60 0.04 -1.39 -0.79 0.30 2.58 4.51
Balance sheet (THBm) 2009 2010 2011 2012 2013E 2014E 2015ELong-term interest bearing assets 0 0 0 0 0 0 0Fixed assets 22 969 26 042 26 800 25 769 25 710 24 054 22 398Other long-term assets 3 093 7 409 9 695 6 284 6 389 6 493 6 596Long-term assets 26 062 33 451 36 495 32 053 32 098 30 546 28 995
Other current assets 4 860 6 964 7 838 6 120 6 620 7 949 8 939Cash and liquid assets 10 719 8 458 3 797 4 388 7 206 10 564 16 004Current assets 15 579 15 422 11 636 10 508 13 826 18 513 24 943
Total assets 41 641 48 873 48 130 42 560 45 924 49 059 53 938
Equity 26 363 25 894 25 561 20 297 25 807 28 366 32 838
Minorities 4 729 5 638 5 353 5 314 5 525 6 100 6 680
Long term interest bearing debt 4 970 10 428 10 688 9 427 5 620 4 940 4 260Finance obligation 13 13 4 11 10 10 10Other long-term liabilities 101 99 106 143 152 152 152Long term liabilities 5 084 10 541 10 798 9 581 5 782 5 102 4 422
Short term interest bearing debt 2 004 3 858 3 748 4 598 5 419 5 419 5 419Other short term liabilities 3 462 2 943 2 670 2 770 3 391 4 072 4 579Current liabilities 5 466 6 801 6 418 7 368 8 810 9 491 9 998
Total liabilities and equity 41 641 48 873 48 130 42 560 45 924 49 059 53 938
Working capital 1 398 4 021 5 168 3 350 3 229 3 877 4 360Net debt -3 732 5 841 10 643 9 649 3 843 -195 -6 315
Cash flow (THBm) 2009 2010 2011 2012 2013E 2014E 2015EPre-tax profit 2 387 923 445 -4 430 848 4 179 6 735- Associated companies -30 -80 -110 -129 -104 -104 -104+ Depreciation and amortization 1 779 1 962 2 638 5 996 1 735 1 754 1 754- Payable tax -211 -256 -342 -167 -290 -1 045 -1 684+/- Other operating items 613 1 625 -1 338 -1 115 0 0 0Cash flow from operations 4 538 4 173 1 292 155 2 189 4 784 6 702
Change in working capital 750 -2 623 -1 147 1 819 121 -648 -483Operating cash flow 5 288 1 550 145 1 974 2 310 4 136 6 219
Maintenance capex -553 -255 -304 -241 -223 -99 -99Growth capex -4 726 -8 365 -4 122 -1 454 -1 797 0 0Acquisition capex -143 -3 650 -1 729 75 379 0 0Sale of assets 665 1 387 2 199 9 255 0 0Cash flow from investments -4 757 -10 883 -3 955 -1 612 -1 386 -99 -99
Free cash flow 530 -9 333 -3 810 362 924 4 038 6 120
Dividend paid -548 -379 -732 -357 -425 0 0Share buy back 0 0 0 0 0 0 0Equity increase 242 1 569 13 0 5 720 0 0Cash flow from financing -307 1 190 -719 -357 5 296 0 0
Other items 49 -1 430 -272 990 -414 0 0
Change in net debt -273 9 573 4 802 -994 -5 806 -4 038 -6 120

105
Analyst: Frode Mørkedal Tel: +47 22 01 63 27 E-mail: [email protected] Next report date: 08.05.2013 Disclosure:
Analyst: Herman Hildan Tel: +47 22 01 63 53 E-mail: [email protected]
Lower results on weaker volumes We expect WWASA to report declining results both y-y and q-q due to the weak car exports seen during 1Q13.
• 1Q13 expectations:WWASA is expected to report May 8, 2013. We look for total EBITDA of USD 109m vs. USD119m in 4Q12 and USD 140m in 1Q12. The main reason for the lower results is the declining Korean car exports.
• Korean car exports: At time of writing only Jan and Feb data was known. On average Korean car exports declined9% y-y and 6% q-q. We believe last year’s strong car exports from Korea to North America reflected build-up of inventories. Inventory reports show that Korean cars onstock have grown from an average 29 days of supply in thefirst 9 months of 2012 to 55 days of supply on March 1 thisyear. That corresponds to approx. 100,000 more unsold Korean cars on stock than a year ago. This growth ininventories is made out of imported cars as demand forlocally produced cars matched local transplant production.
• Our estimates: We look for 11% decline in volumes y-y as H&H volumes likely declined as well. We expect 9%decline in 2Q13 before a recovery with 1% and 3% y-y growth in the final two quarters. This results in full yearvolume decline of 4% vs. +5% in 2012. Still, bunker priceswhich averaged $655/ton last year is likely to be lower this year (we assume $640/ton). Overall we factor in EBITDA ofUSD 490m for 2013 vs. USD 583m in 2012. By comparisonconsensus expects USD 548m for 2013.
We estimate NAV of NOK 59/sh. However, given the likely negative estimate revisions by consensus, we reiterate Neutral.
Wilh. Wilhelmsen ASASector: Marine
Recommendation: NEUTRAL (unchanged)
Target price (USD): 10.0 (unchanged)
Company descriptionGlobal car and ro-ro shipping operator with integrated logistics solutions from factory to dealer.
30
35
40
45
50
55
60
apr. 12 jun. 12 aug.12
okt. 12 des. 12 feb. 13 apr. 13
Share price (NOK) in Wilh. Wilhelmsen ASA relative to key indices
Wilh. Wilhelmsen ASA
OSEBX index (Rebased)
OSE Transportation (Rebased)
Shareholders Shares VotesWilh. Wilhelmsen ASA 72.7 % 59.2 %Government Pension Fund Norway 5.6 % 3.8 %
Free Float 27.3 % 27.3 %
Changes in estimates (USDm)2013E 2014E
New Old Chg. New Old Chg.Oper. revenue 2 723 3 045 -11% 2 972 3 142 -5%EBITDA, adj. 490 583 -16% 620 645 -4%EBIT, adj. 333 430 -22% 463 492 -6%Net income, adj. 186 312 -40% 331 390 -15%EPS, adj. (USD) 0.1 0.1 -37% 0.1 0.1 -10%
Company data (2013E)Share price (NOK) 49.40No. of shares (m) 220.0Market cap. (USDm) 1 899Net debt YE (USDm) 1 166Enterprise value (USDm) 3 505
Description of adjustments: Sale of assets, agio/disagio and gain/losses on financial instruments. P&L based on Management report. Adjusted Enterprise Value with non-consolidated debt.
Key figures 2009 2010 2011 2012 2013E 2014E 2015ERevenue (USDm) 1 591 1 958 2 422 2 815 2 723 2 972 3 041EBITDA (USDm) 319 338 436 697 490 620 672EBITDA, adj. (USDm) 222 332 435 563 490 620 672EBIT, adj. (USDm) 53 196 292 413 333 463 515Pre-tax profit, adj. (USDm) 150 62 145 313 223 368 430Net income, adj. (USDm) -43 131 177 259 186 331 393EPS, adj. (USD) -0.02 0.05 0.07 0.08 0.06 0.11 0.12OCFPS (USD) 0.1 0.1 0.0 0.1 0.1 0.1 0.1FCFPS (USD) 0.0 0.1 -0.1 0.0 0.1 0.1 0.1BVPS (USD) 517.0 5.8 5.5 7.1 7.1 8.3 9.9Net asset value (NAV) (USD) 0.0 11.2Dividend (USD) 0.00 0.00 0.18 0.82 0.36 0.36 0.36EV/EBITDA, adj. (x) 8.3 6.2 6.1 7.1 5.6 5.0EV/EBIT, adj. (x) 14.2 9.2 8.4 10.5 7.5 6.6P/E, adj. (x) n.m. 72.3 n.m. n.m. 79.9 72.4P/OCF (x) 71.4 n.m. n.m. n.m. n.m. n.m.EV/FCF (x) 18.9 n.m. 46.2 22.6 16.6 13.7P/Book (x) 1.2 0.9 1.3 1.2 1.0 0.9P/NAV (x) 0.8Dividend yield (%) 0.0 3.8 9.1 4.2 4.2 4.2
Key Assumptions 2009 2010 2011 2012 2013E 2014E 2015E
Result Preview 15-Apr-13

106
1Q13 Result preview
Source: Company, Bloomberg, RS Platou Markets
Wilh. Wilhelmsen ASA (WWASA), USDm 1Q12 3Q12 4Q12 1Q13E
Consensus avgerage
Platou vs. cons.
TCE Income 408 434 404 400Operating expenses (268) (284) (285) (291)EBITDA excl. one-offs 140 150 119 109 126 (17)Gain/loss sale of assets - 134 - -Depreciation & amortization (36) (38) (38) (39)EBIT 104 246 81 70 86 (16)Associated companies - - - -Net interest (28) (26) (35) (26)Other financial income 16 (4) 25 -Pretax profit 92 216 70 44 68 (24)Taxes (3) (2) (33) (2)Minorities - - - -Net profit 88 214 37 42 68 (26)Net profit, adjusted 72 84 13 42 64 (22)
EPS 0.33 0.38 0.06 0.19 0.31EPS, adjusted 0.14 0.27 (0.02) 0.09 0.29
Operating profit per segment
Shipping 81 81 62 50
Logistics 24 162 21 23
Holding/other (1) 3 (2) (3)
Total operating profit 104 246 81 70

107
Profit and loss (USDm) 2009 2010 2011 2012 2013E 2014E 2015ETotal revenue 1 591 1 958 2 422 2 815 2 723 2 972 3 041Voyage expenses & commissions -610 -807 -1 043 -1 130 -1 117 -1 190 -1 190Time-charter equivalent 982 1 151 1 378 1 685 1 606 1 782 1 851
Operating expenses -760 -818 -943 -1 122 -1 116 -1 162 -1 179
EBITDA, adj. 222 332 435 563 490 620 672Gain/loss sale of assets 97 5 0 134 0 0 0EBITDA 319 338 436 697 490 620 672Depreciation -169 -137 -144 -150 -157 -157 -157Amortization/Write down 0 0 0 0 0 0 0EBIT 150 201 292 547 333 463 515EBIT, adj. 53 196 292 413 333 463 515
Associated companies 0 0 0 0 0 0 0Net interest -61 -93 -113 -118 -110 -95 -85Gains/losses on securities or financial instruments 157 -24 -36 17 0 0 0Other financial Items 0 -16 2 0 0Pre-tax profit 246 67 145 447 223 368 430Tax -35 29 -1 -37 -37 -37 -37Minorities 0 -1 -1 0 0 0 0Result from discontinued operations/ Other 66 -83 0 0 0 0 0Net income 277 13 143 410 186 331 393
Adjustments after tax -320 118 34 -152 0 0 0Adjusted net income -43 131 177 259 186 331 393
EPS (USD) 0.12 0.01 0.05 0.13 0.06 0.11 0.12EPS, adj. (USD) -0.02 0.05 0.07 0.08 0.06 0.11 0.12
Balance sheet (USDm) 2009 2010 2011 2012 2013E 2014E 2015ELong-term interest bearing assets 1 4 113 130 130 130 130Fixed assets 1 397 1 404 1 731 1 868 1 778 1 687 1 597Other long-term assets 672 746 876 1 031 1 246 1 559 1 918Long-term assets 2 070 2 154 2 720 3 029 3 154 3 376 3 645
Other current assets 32 98 36 37 35 43 47Cash and liquid assets 480 524 292 344 121 -26 -54Current assets 512 622 328 381 156 17 -7
Total assets 2 582 2 776 3 048 3 410 3 309 3 393 3 637
Equity 895 1 107 1 206 1 553 1 572 1 837 2 175
Minorities 0 0 0 0 0 0 0
Long term interest bearing debt 971 1 106 1 253 1 417 1 300 1 109 1 011Finance obligation 312 0 0 0 0 0 0Other long-term liabilities 251 275 284 280 280 280 280Long term liabilities 1 534 1 381 1 537 1 697 1 580 1 389 1 291
Short term interest bearing debt 115 214 230 117 117 117 117Other short term liabilities 38 74 75 43 40 50 54Current liabilities 153 288 305 160 157 167 171
Total liabilities and equity 2 582 2 776 3 048 3 410 3 309 3 393 3 637
Working capital -6 24 -39 -6 -6 -7 -8Net debt 917 792 1 078 1 060 1 166 1 122 1 052
Cash flow (USDm) 2009 2010 2011 2012 2013E 2014E 2015EPre-tax profit 246 67 145 447 223 368 430- Associated companies 0 0 0 0 0 0 0+ Depreciation and amortization 169 137 144 150 157 157 157- Payable tax -35 29 -1 -37 -37 -37 -37+/- Other operating items -37 145 -62 -306 -189 -277 -302Cash flow from operations 199 208 82 254 154 211 248
Change in working capital -24 35 33 -42 0 -2 -1Operating cash flow 175 243 115 212 155 209 247
Maintenance capex 0 0 0 0 0 0 0Growth capex -300 -102 -485 -270 0 0 0Acquisition capex 215 0 -33 -53 0 0 0Sale of assets 0 6 15 186 0 0 0Cash flow from investments -85 -96 -503 -137 0 0 0
Free cash flow 90 147 -388 75 155 209 247
Dividend paid -62 -15 -63 -85 -85 -85 -85Share buy back 0 0 0 0 0 0 0Equity increase 0 215 0 0 0 0 0Cash flow from financing -62 200 -63 -85 -85 -85 -85
Other items -58 -222 165 28 -176 -80 -91
Change in net debt 30 -125 286 -18 106 -44 -70

108
Analyst: Frode Mørkedal Tel: +47 22 01 63 27 E-mail: [email protected] Next report date: 08.05.2013 Disclosure:
Analyst: Herman Hildan Tel: +47 22 01 63 53 E-mail: [email protected]
Strong valuation backing While WWI is expected to report declining profits due tolower contribution from WWASA, the valuation of the WWI shares remain highly attractive, and with improvedmarkets for shipping and maritime services in the nextcouple of years, we reiterate our BUY recommendation.
• 1Q13 results expectations: We look for WWASA to contribute with EBITDA of USD 109m, about USD 10m lower q-q due to weaker volumes. WMS is expected to report rather steady EBITDA of USD 24m, thus after USD -6m from Holding, we look for EBITDA of USD 132m.
• WMS:The Maritime Services segment should continue to benefit from growth in world trade and the related shippingservices (marine products used onboard ships, crewing,technical services, ship agency, etc). This is the onlybusiness WW Holding owns 100% and is expected to remain so, although it could open for partnerships withinindividual business areas. Near term, however, weaknessin the shipping markets has resulted in lower EBIT-margins (7% in 4Q12 vs. 9% long-term target). We look for unchanged EBIT-margin in 1Q13 of 7%.
• Other activities: WW Holding Invest currently holds 8% of Qube Logistics of Australia and 35% of NorSea Group.
We reiterate BUY on WWI due to its attractive valuation.SOTP is currently USD 43 per share with WWASA at market. Our USD 37 target implies 15% discount and5.5x ‘13e EV/EBITDA.
Wilh. Wilhelmsen HoldingSector: Marine
Recommendation: BUY (unchanged)
Target price (USD): 37 (unchanged)
Company descriptionLeading global maritime industry group with long Norwegian tradition. Ranks as the world's largest operator in the roll-on, roll-off cargo segment and controls together with partners 130 vessels. Listed at OSE under the ticker WWI and WWIB.
120130140150160170180190200210
apr. 12 jun. 12 aug.12
okt. 12 des. 12 feb. 13 apr. 13
Share price (NOK) in Wilh. Wilhelmsen Holding relative to key indices
Wilh. Wilhelmsen Holding
OSEBX index (Rebased)
OSE Transportation (Rebased)
Shareholders Shares VotesTallyman AS 59.2 % 59.2 %Odin Funds 3.8 % 3.8 %Government Pension Fund Norway 3.0 % 3.0 %
Free Float 40.8 % 40.8 %
Changes in estimates (USDm)2013E 2014E
New Old Chg. New Old Chg.Oper. revenue 3 673 3 979 -8% 3 969 4 122 -4%EBITDA, adj. 596 687 -13% 729 754 -3%EBIT, adj. 413 507 -19% 546 574 -5%Net income, adj. 238 327 -27% 370 404 -8%EPS, adj. (USD) 5.1 7.0 -27% 8.0 8.7 -8%
Company data (2013E)Share price (NOK) 165.00No. of shares (m) 46.5Market cap. (USDm) 1 340Net debt YE (USDm) 1 127Enterprise value (USDm) 2 908
Description of adjustments: Sale of assets, agio/disagio and gain/losses on financial instruments. P&L based on Management report. Adjusted Enterprise Value with non-consolidated debt.
Key figures 2009 2010 2011 2012 2013E 2014E 2015ERevenue (USDm) 2 471 2 834 3 374 3 758 3 673 3 969 4 087EBITDA (USDm) 437 437 581 777 596 729 786EBITDA, adj. (USDm) 321 425 505 639 596 729 786EBIT, adj. (USDm) 144 258 331 463 413 546 604Pre-tax profit, adj. (USDm) 222 129 171 358 288 444 529Net income, adj. (USDm) -27 159 146 165 238 370 443EPS, adj. (USD) -0.59 3.41 3.13 3.54 5.12 7.96 9.52OCFPS (USD) 3.8 5.2 2.5 4.6 3.3 4.5 5.3FCFPS (USD) 1.9 3.2 -8.3 1.6 3.3 4.5 5.3BVPS (USD) 27.3 33.1 36.0 44.7 48.9 56.9 66.7Net asset value (NAV) (USD) 29.2 29.5 42.9 42.9 42.9 42.9 42.9Dividend (USD) 0.33 0.33 1.00 1.40 1.00 1.00 1.00EV/EBITDA, adj. (x) 8.8 6.5 5.6 4.6 4.9 3.8 3.2EV/EBIT, adj. (x) 19.8 10.7 8.5 6.4 7.0 5.0 4.2P/E, adj. (x) n.m. 8.5 7.2 8.0 5.6 3.6 3.0P/OCF (x) 5.6 5.6 9.2 6.2 8.7 6.4 5.4EV/FCF (x) 31.6 18.8 n.m. 39.6 18.8 13.2 10.3P/Book (x) 0.8 0.9 0.6 0.6 0.6 0.5 0.4P/NAV (x) 0.7 1.0 0.5 0.7 0.7 0.7 0.7Dividend yield (%) 1.5 1.1 4.4 5.0 3.5 3.5 3.5
Key Assumptions 2009 2010 2011 2012 2013E 2014E 2015E
Result Preview 15-Apr-13

109
1Q13 Result preview
Source: Company, Bloomberg, RS Platou Markets
Wilh. Wilhelmsen (WWI), USDm 1Q12 3Q12 4Q12 1Q13E
Consensus avgerage
Platou vs. cons.
TCE Income 643 661 647 643Operating expenses (495) (492) (506) (511)EBITDA excl. one-offs 148 170 141 132 155 (23)Gain/loss sale of assets 1 135 1 -Depreciation & amortization (43) (44) (45) (47)EBIT 106 261 96 85 114 (29)Associated companies - - - -Net interest (32) (31) (38) (31)Other financial income 24 (1) 23 -Pretax profit 97 230 81 54 102 (48)Taxes (3) (4) (39) (2)Minorities (25) (60) (11) (7)Net profit 69 166 31 46 59 (13)Net profit, adjusted 45 31 7 46 59 (13)
EPS 1.49 3.56 0.66 0.98 1.46EPS, adjusted 0.96 0.67 0.15 0.98 1.35
Operating profit per segment
Shipping 83 86 64 52
Logistics 24 162 21 24
Maritime Services 3 17 18 17
Holding -5 -5 -6 -7
Other 0 0 0 0
Total operating profit 106 261 96 85
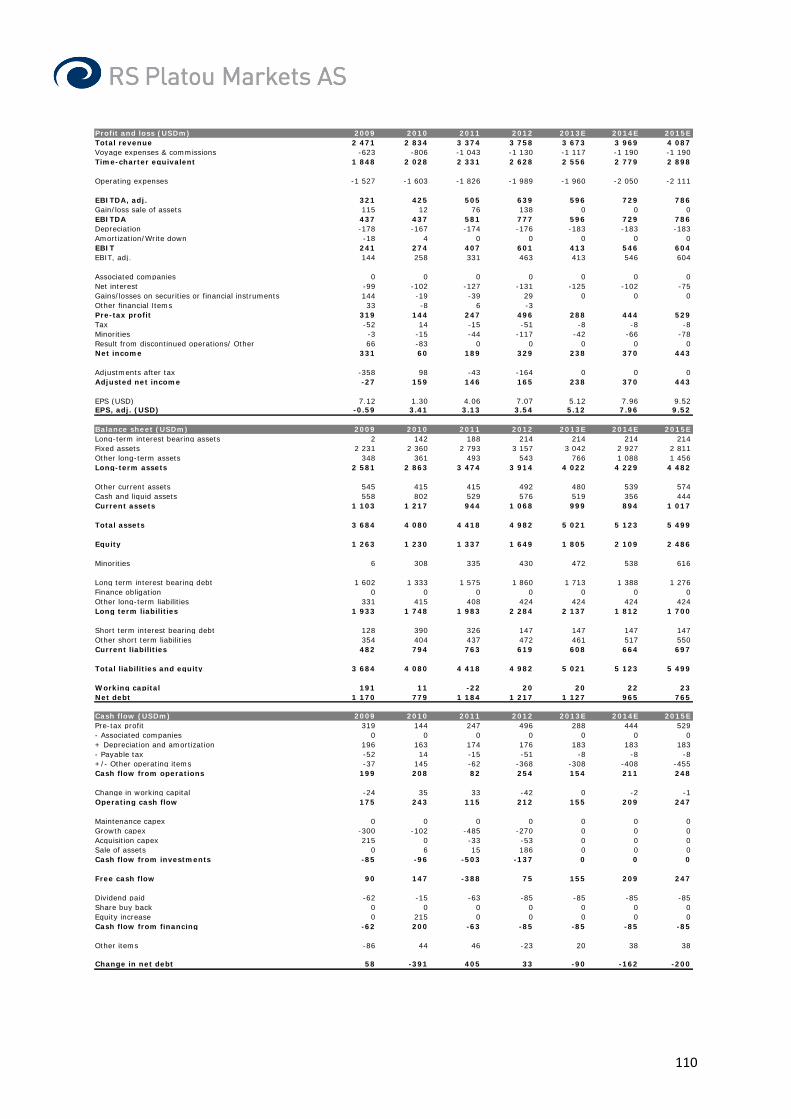
110
Profit and loss (USDm) 2009 2010 2011 2012 2013E 2014E 2015ETotal revenue 2 471 2 834 3 374 3 758 3 673 3 969 4 087Voyage expenses & commissions -623 -806 -1 043 -1 130 -1 117 -1 190 -1 190Time-charter equivalent 1 848 2 028 2 331 2 628 2 556 2 779 2 898
Operating expenses -1 527 -1 603 -1 826 -1 989 -1 960 -2 050 -2 111
EBITDA, adj. 321 425 505 639 596 729 786Gain/loss sale of assets 115 12 76 138 0 0 0EBITDA 437 437 581 777 596 729 786Depreciation -178 -167 -174 -176 -183 -183 -183Amortization/Write down -18 4 0 0 0 0 0EBIT 241 274 407 601 413 546 604EBIT, adj. 144 258 331 463 413 546 604
Associated companies 0 0 0 0 0 0 0Net interest -99 -102 -127 -131 -125 -102 -75Gains/losses on securities or financial instruments 144 -19 -39 29 0 0 0Other financial Items 33 -8 6 -3Pre-tax profit 319 144 247 496 288 444 529Tax -52 14 -15 -51 -8 -8 -8Minorities -3 -15 -44 -117 -42 -66 -78Result from discontinued operations/ Other 66 -83 0 0 0 0 0Net income 331 60 189 329 238 370 443
Adjustments after tax -358 98 -43 -164 0 0 0Adjusted net income -27 159 146 165 238 370 443
EPS (USD) 7.12 1.30 4.06 7.07 5.12 7.96 9.52EPS, adj. (USD) -0.59 3.41 3.13 3.54 5.12 7.96 9.52
Balance sheet (USDm) 2009 2010 2011 2012 2013E 2014E 2015ELong-term interest bearing assets 2 142 188 214 214 214 214Fixed assets 2 231 2 360 2 793 3 157 3 042 2 927 2 811Other long-term assets 348 361 493 543 766 1 088 1 456Long-term assets 2 581 2 863 3 474 3 914 4 022 4 229 4 482
Other current assets 545 415 415 492 480 539 574Cash and liquid assets 558 802 529 576 519 356 444Current assets 1 103 1 217 944 1 068 999 894 1 017
Total assets 3 684 4 080 4 418 4 982 5 021 5 123 5 499
Equity 1 263 1 230 1 337 1 649 1 805 2 109 2 486
Minorities 6 308 335 430 472 538 616
Long term interest bearing debt 1 602 1 333 1 575 1 860 1 713 1 388 1 276Finance obligation 0 0 0 0 0 0 0Other long-term liabilities 331 415 408 424 424 424 424Long term liabilities 1 933 1 748 1 983 2 284 2 137 1 812 1 700
Short term interest bearing debt 128 390 326 147 147 147 147Other short term liabilities 354 404 437 472 461 517 550Current liabilities 482 794 763 619 608 664 697
Total liabilities and equity 3 684 4 080 4 418 4 982 5 021 5 123 5 499
Working capital 191 11 -22 20 20 22 23Net debt 1 170 779 1 184 1 217 1 127 965 765
Cash flow (USDm) 2009 2010 2011 2012 2013E 2014E 2015EPre-tax profit 319 144 247 496 288 444 529- Associated companies 0 0 0 0 0 0 0+ Depreciation and amortization 196 163 174 176 183 183 183- Payable tax -52 14 -15 -51 -8 -8 -8+/- Other operating items -37 145 -62 -368 -308 -408 -455Cash flow from operations 199 208 82 254 154 211 248
Change in working capital -24 35 33 -42 0 -2 -1Operating cash flow 175 243 115 212 155 209 247
Maintenance capex 0 0 0 0 0 0 0Growth capex -300 -102 -485 -270 0 0 0Acquisition capex 215 0 -33 -53 0 0 0Sale of assets 0 6 15 186 0 0 0Cash flow from investments -85 -96 -503 -137 0 0 0
Free cash flow 90 147 -388 75 155 209 247
Dividend paid -62 -15 -63 -85 -85 -85 -85Share buy back 0 0 0 0 0 0 0Equity increase 0 215 0 0 0 0 0Cash flow from financing -62 200 -63 -85 -85 -85 -85
Other items -86 44 46 -23 20 38 38
Change in net debt 58 -391 405 33 -90 -162 -200

111
Disclaimer RS Platou Markets AS
RS Platou Markets AS is limited liability company incorporated in Norway (reg.no 942 274 238) and is authorised to provide banking and investment services in accordance with and pursuant to the Norwegian Securities Trading Act of 2007. RS Platou Markets AS is a subsidiary of RS Platou ASA, parent company in the RS Platou ASA Group, which comprise a full service international ship and offshore brokerage and securities. RS Platou Markets AS is under the supervision of the Norwegian Financial Supervisory Authority (Nw.: “Finanstilsynet”) and is a member of the Norwegian Securities Dealers Association (Nw.: Norges Fondsmeglerforbund). Internal rules have been developed in accordance with recommendations issued by the association. Important Information
This report is provided by RS Platou Markets AS and has been prepared by its equity research department solely for general information purposes to professional investors only. The report does not constitute and will not form part of and should not be construed as a solicitation of any offer to buy or sell any security, commodity or instrument or related derivative or to participate in any trading or investment strategy. This report is based solely on publicly available information. All information, including without limitation statements of fact, contained herein has been obtained and compiled in good faith from third party sources believed to be reliable, but has not been subject to independent verification. RS Platou Markets AS does consequently not make any undertaking, representation or warranty, express or implied, with respect to the accuracy or completeness of the report. The report is not to be relied upon as authoritative and should not be regarded as a substitute for the exercise of reasoned and independent judgement by the investor. Unless otherwise stated on the first page, the publication or report has not been reviewed by the company or companies in question before dissemination. In instances where all or part of a report is presented to the company or companies included in this report prior to publication, the purpose is to ensure that facts are correct. Estimates provided in this report are prepared by employees of RS Platou Markets AS’ equity research department. Please note that all prices and special levels are indicative, and may not be up to the date specified in this report. The opinions and estimates contained herein represent the view and judgment as of the dates specified (and in absence of such as of the date of the report), and are subject to change without notice. Delivery of this report shall not create any implication that RS Platou Markets AS assumes any obligation to, update or correct the information herein. The report contains certain forward-looking statements relating to the business, financial performance and results of the relevant issuers and/or industries and markets. Forward-looking statements concern future circumstances and results and other statements that are not historical facts, sometimes identified by the words "believes", expects", "predicts", "intends", "projects", "plans", "estimates", "aims", "foresees", "anticipates", "targets", and similar expressions. Any forward-looking statements and other information contained in this report, including assumptions, opinions and views cited from third party sources are solely opinions and forecasts which are subject to risks, uncertainties and other factors that may cause actual events to differ materially from any anticipated development. Neither Platou Markets nor any of its affiliates or employees provide any assurance that the assumptions underlying such forward-looking statements are free from errors nor do any of them accept any responsibility for the future accuracy of the opinions expressed in this report or the actual occurrence of the forecasted developments. Platou Markets does not assume any obligation to update any forward-looking statements or to conform these forward-looking statements to actual results. Please note that past performance of a company or financial instrument is not necessarily a guide to future performance.
Limitation of liability
This report has been prepared without regard to any particular investors’ objectives, financial situation or needs, anddoes not provide individually tailored investment advice or offer tax, regulatory, accounting or legal advice. The securities discussed in this report may not be suitable for all investors. This report has been prepared and issued for distribution to professional investors only and all recipients should seek independent investment advice prior to making any investment decision based on any information contained in this report. Prior to entering into any proposed transaction, recipients should determine, in consultation with their own investment, legal, tax, regulatory and accounting advisors, the economic risks and merits, as well as the legal, tax, regulatory and accounting characteristics and consequences, of the transaction.
112
Neither RS Platou Markets AS nor any of its parent or subsidiary undertakings or any such person’s affiliates, officers, employees or advisers accept any liability whatsoever as to any errors, omissions or misstatements contained herein and, accordingly, expressly disclaim any and all liabilities for any and all losses (whether direct or indirect) related to investments caused by or motivated by this report or information included herein. Any person receiving this report is deemed to have accepted this disclaimer which shall apply also should the estimates or opinions shown turn out to be to erroneous or incomplete or based upon incorrect or incomplete facts, interpretations or assessments or assumptions by RS Platou Markets AS, and irrespective of whether RS Platou Markets AS or any person related to RS Platou Markets AS are at fault.
Risks related to investments and recommendations
Any investment involves risks, such as the risk of no yield or the risk of losing the capital invested. Several factors could cause the actual results, performance or achievements of the companies and instruments described herein to be materially different from any future results, performance or achievements that may be expressed or implied by statements and information in this report, including, among others and without limitation, risks or uncertainties associated with the companies’ business, segments, development, growth management, financing, market acceptance and relations with customers. More generally an investment will involve risks related to general economic and business conditions, changes in domestic and foreign laws and regulations, taxes, changes in competition and pricing environments, fluctuations in currency exchange rates and interest rates and other factors. Should one or more of these risks or uncertainties materialise, or should underlying assumptions prove incorrect, actual results may vary materially from those described in this report. Some investments discussed by Platou Markets have high volatility and may therefore experience sudden and large changes in value that may cause. International investing may include additional risks related to political and economic uncertainties as well currency risk.
The analyst’s assessment of risk is identified by the following terms: High risk The share is likely to be considerably more volatile than the general index. The reason may be the
characteristics of the company or the company’s industry, or issues associated with the share as a security, such as a recent listing, a limited free float or the expectation of corporate action.
Medium risk The share is expected to be about as volatile as the general index.
Low risk The share is expected to fluctuate less than the general index, and the Company, the share or the industry has inherent characteristics that reduce the expected volatility of the share price.
The opinions and views contained herein are based on numerous assumptions as described in this report. Different assumptions could result in materially different results. Furthermore, the assumptions may not be realized.
Basis and methods for assessment
Recommendations in respect of shares and share related instruments are based on estimates using various valuation methods. These methods include analysis of earnings multiples, valuation of a company using discounted cash flow calculations and net asset value assessments. RS Platou Markets AS’ research department operates with 3 recommendation categories based on the expected absolute return within 6 months: Buy The return is estimated to be in excess of 15%. Neutral The return is estimated between 15% and minus 5%. Sell The return is estimated to be less than minus 5%.
Planned updates
There is no fixed schedule for updating the research included in this report. However, Platou Markets aims to update recommendations on a company when:
• The price target is achieved
• New accounting figures are released
• Any material news on a company or is industry is released

113
Prevention of conflicts of interests and authors independence
RS Platou Markets AS aims always to operate in compliance with appropriate business standards, including with respect to conflicts of interests and the content of reports produced by investment firms and other relevant standards. To limit possible conflicts of interests, the analysts within RS Platou Markets AS equity research department are separated from the corporate finance department in order to control the flow of information (“Chinese walls”) and subject to internal rules on the handling of inside and other confidential information, unpublished research material and contact with other departments. The object of the internal rules is to ensure that no analyst will abuse or cause others to abuse confidential information. The analyst(s) involved in the preparation of the various research included herein has not at the same time been involved in corporate assignments for companies described by him or her. The analysts have not been, nor are or will be, receiving direct or indirect compensation in exchange for expressing any of the views or the specific recommendations contained in the report. The analysts of RS Platou Market AS’s equity research department are eligible to remuneration from RS Platou Market AS’s general bonus scheme.
Share ownership and investment banking services
RS Platou Markets AS does not alone or together with affiliated companies hold more than 5% of the total share capital of any company on which it issues research. RS Platou Markets AS and its affiliates (and/or their employees) may, however, have investments in companies/financial instruments (or derivative thereof) featured in this report or have other financial interests in transactions involving these companies/financial instruments. In addition, RS Platou Markets AS may have or has acted as manager for and provided investment banking services to a number of companies mentioned in this report. In light of the broad range of financial services and ship brokerage activities offered and provided by RS Platou Markets AS and the RS Platou ASA Group, however, it can be assumed that RS Platou Markets AS and its affiliates may currently and may in the future be providing or aim to provide investment banking or other financial services of a confidential nature (and consequently not referenced herein or on the mentioned web site) to or on behalf of the issuers referred to in this report. For an overview of RS Platou Markets AS’ and/or its employees’ positions in financial instruments in addition to an overview of the companies to whom RS Platou Markets AS has provided investment banking services to over the latest 12 months, please RS Platou Markets AS web pagewww.platoumarkets.com.
Important Disclosures for recipients in the United States
This research report was prepared for information purposes only by RS Platou Markets AS, a foreign broker-dealer that is not registered in the United States. RS Platou Markets AS’ research reports are intended for distribution in the United States solely to "major U.S. institutional investors" in reliance on the exemption from broker-dealer registration provided by Rule 15a-6 of the United States Securities Exchange Act of 1934, as amended and may not be furnished to any other person in the United States. Each major U.S. institutional investor that receives a copy of a RS Platou Markets AS research report by its acceptance thereof represents and agrees that it shall not distribute or provide copies to any other person. Any U.S. recipient of this research report that desires to effect transactions in any securities discussed within this report should do so through RS Platou Markets, Inc., a U.S. registered broker-dealer and an affiliate of RS Platou Markets AS. All such transactions will be effected pursuant to Rule 15a-6 of the Securities Exchange Act of 1934 and related interpretations. Financial statements included in the report, if any, may have been prepared in accordance with non-U.S. accounting standards that may not be comparable to the financial statements of United States companies. It may be difficult to compel a non-U.S. company and its affiliates to subject themselves to U.S. laws or the jurisdiction of U.S. courts. The analysts whose names appear in this research report certify that all of the views expressed in this research report accurately reflect their personal views about the subject securities or issuers. The analysts also certify that no part of their compensation was, is, or will be directly or indirectly related to the specific recommendations or views expressed in this research report.
Other Jurisdictions
The distribution and receipt of this report may be restricted by rules and regulations in certain jurisdictions. Furthermore, the securities referred to in this report may in some jurisdictions not be eligible for sale. Persons into whose possession the report may come are required to inform themselves about and to comply with all applicable laws and regulations in force in any jurisdiction in or from which it invests or receives or possesses this report and must obtain any consent, approval or permission required under the laws and regulations in force in such jurisdiction.

114
The report is not intended for, and must not be distributed to, private customers and investors in the United Kingdom. The information in this report is not intended to be distributed or circulated in any manner in Canada and therefore should not be construed as any kind of financial recommendation or advice provided within the meaning of Canadian securities laws. For further disclosures on methods, risks, potential conflicts of interests etc. and applicable disclaimers relevant for this report and the information contained herein, please see www.platoumarkets.com. All estimates and opinions expressed in this report should be reviewed in conjunction with the information therein. This report may not be copied, reproduced or distributed, in whole or in part, by any recipient for any purpose without the prior written consent of RS Platou Markets AS. If you are not a client of RS Platou Markets AS, you are not entitled to receive this report. Any and all matters relating to this report shall be governed by and construed in accordance with the laws of Norway.