SHIFTING SNOWLINES AND SHORELINES
12
SHIFTING SNOWLINES AND SHORELINES The Intergovernmental Panel on Climate Change’s Special Report on the Ocean and Cryosphere and Implications for Washington State An EarthLab Member Organization
Transcript of SHIFTING SNOWLINES AND SHORELINES
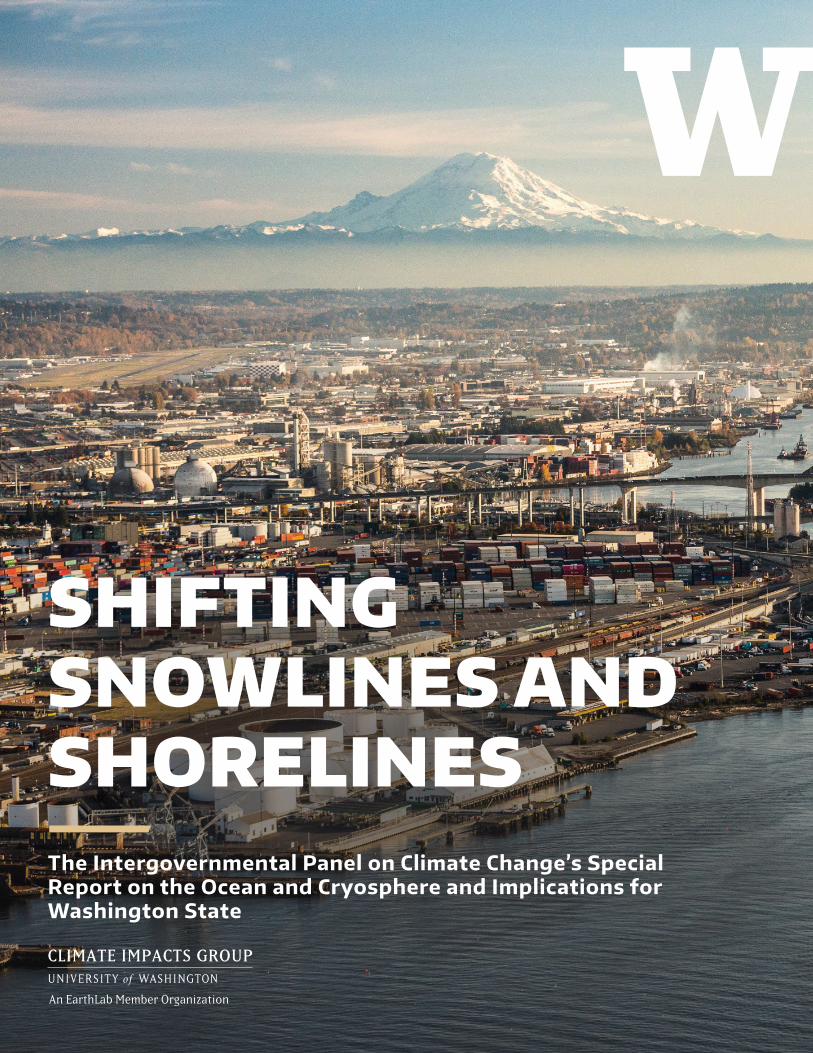
SHIFTING SNOWLINES AND SHORELINESThe Intergovernmental Panel on Climate Change’s Special Report on the Ocean and Cryosphere and Implications for Washington State
An EarthLab Member Organization
Page 1
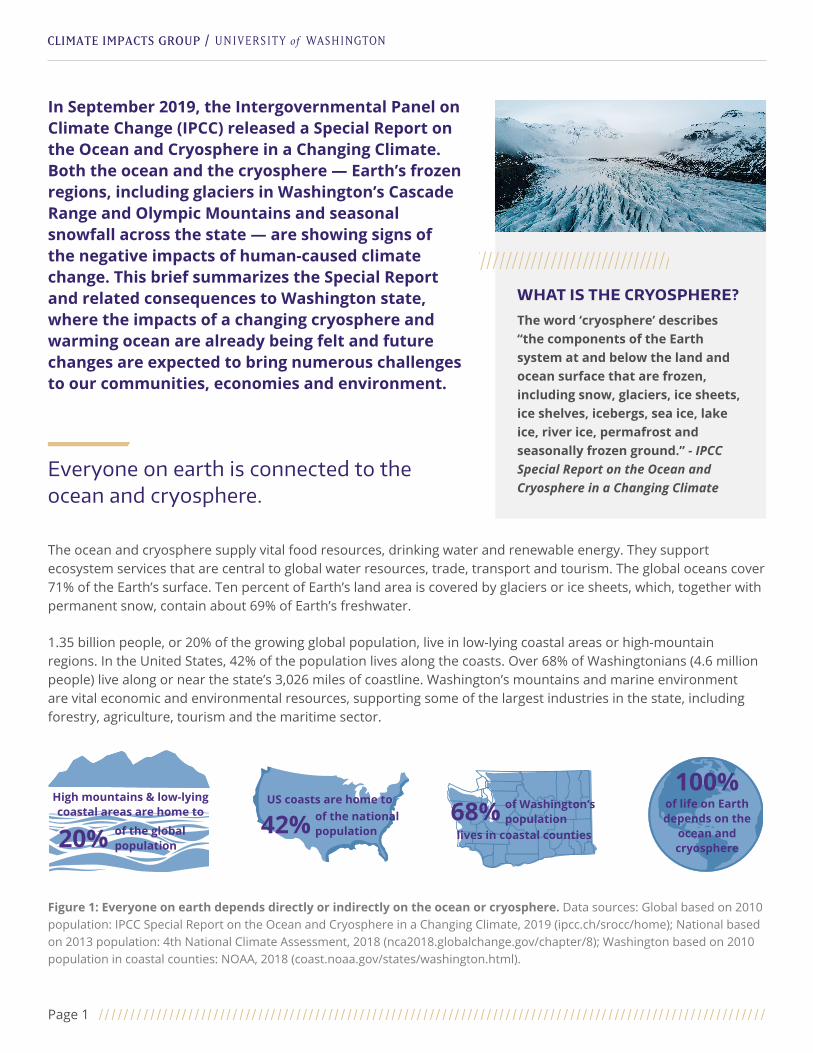
In September 2019, the Intergovernmental Panel on Climate Change (IPCC) released a Special Report on the Ocean and Cryosphere in a Changing Climate. Both the ocean and the cryosphere — Earth’s frozen regions, including glaciers in Washington’s Cascade Range and Olympic Mountains and seasonal snowfall across the state — are showing signs of the negative impacts of human-caused climate change. This brief summarizes the Special Report and related consequences to Washington state, where the impacts of a changing cryosphere and warming ocean are already being felt and future changes are expected to bring numerous challenges to our communities, economies and environment.
Everyone on earth is connected to the ocean and cryosphere.
The ocean and cryosphere supply vital food resources, drinking water and renewable energy. They support ecosystem services that are central to global water resources, trade, transport and tourism. The global oceans cover 71% of the Earth’s surface. Ten percent of Earth’s land area is covered by glaciers or ice sheets, which, together with permanent snow, contain about 69% of Earth’s freshwater.
1.35 billion people, or 20% of the growing global population, live in low-lying coastal areas or high-mountain regions. In the United States, 42% of the population lives along the coasts. Over 68% of Washingtonians (4.6 million people) live along or near the state’s 3,026 miles of coastline. Washington’s mountains and marine environment are vital economic and environmental resources, supporting some of the largest industries in the state, including forestry, agriculture, tourism and the maritime sector.
Figure 1: Everyone on earth depends directly or indirectly on the ocean or cryosphere. Data sources: Global based on 2010 population: IPCC Special Report on the Ocean and Cryosphere in a Changing Climate, 2019 (ipcc.ch/srocc/home); National based on 2013 population: 4th National Climate Assessment, 2018 (nca2018.globalchange.gov/chapter/8); Washington based on 2010 population in coastal counties: NOAA, 2018 (coast.noaa.gov/states/washington.html).
WHAT IS THE CRYOSPHERE?
The word ‘cryosphere’ describes “the components of the Earth system at and below the land and ocean surface that are frozen, including snow, glaciers, ice sheets, ice shelves, icebergs, sea ice, lake ice, river ice, permafrost and seasonally frozen ground.” - IPCC Special Report on the Ocean and Cryosphere in a Changing Climate
US coasts are home to
42% of the national population lives in coastal counties
68% of Washington’s population
100%of life on Earth depends on the
ocean and cryosphere
of the global population20%
High mountains & low-lying coastal areas are home to
Page 2
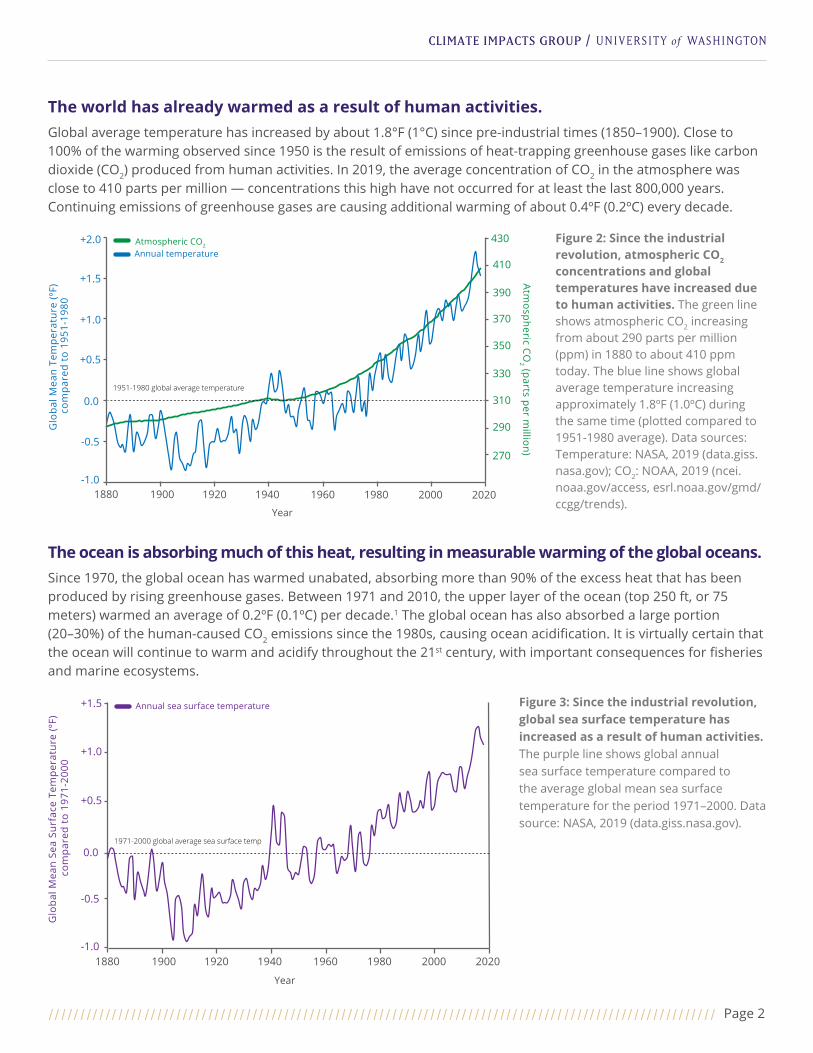
The world has already warmed as a result of human activities.Global average temperature has increased by about 1.8°F (1°C) since pre-industrial times (1850–1900). Close to 100% of the warming observed since 1950 is the result of emissions of heat-trapping greenhouse gases like carbon dioxide (CO2) produced from human activities. In 2019, the average concentration of CO2 in the atmosphere was close to 410 parts per million — concentrations this high have not occurred for at least the last 800,000 years. Continuing emissions of greenhouse gases are causing additional warming of about 0.4ºF (0.2ºC) every decade.
Figure 2: Since the industrial revolution, atmospheric CO2 concentrations and global temperatures have increased due to human activities. The green line shows atmospheric CO2 increasing from about 290 parts per million (ppm) in 1880 to about 410 ppm today. The blue line shows global average temperature increasing approximately 1.8ºF (1.0ºC) during the same time (plotted compared to 1951-1980 average). Data sources: Temperature: NASA, 2019 (data.giss.nasa.gov); CO2: NOAA, 2019 (ncei.noaa.gov/access, esrl.noaa.gov/gmd/ccgg/trends).
The ocean is absorbing much of this heat, resulting in measurable warming of the global oceans.Since 1970, the global ocean has warmed unabated, absorbing more than 90% of the excess heat that has been produced by rising greenhouse gases. Between 1971 and 2010, the upper layer of the ocean (top 250 ft, or 75 meters) warmed an average of 0.2ºF (0.1ºC) per decade.1 The global ocean has also absorbed a large portion (20–30%) of the human-caused CO2 emissions since the 1980s, causing ocean acidification. It is virtually certain that the ocean will continue to warm and acidify throughout the 21st century, with important consequences for fisheries and marine ecosystems.
Figure 3: Since the industrial revolution, global sea surface temperature has increased as a result of human activities. The purple line shows global annual sea surface temperature compared to the average global mean sea surface temperature for the period 1971–2000. Data source: NASA, 2019 (data.giss.nasa.gov).
270
290
310
330
350
370
390
410
430
1880 1900 1920 1940 1960 1980 2000 2020
Year
1951-1980 global average temperature
Glo
bal M
ean
Tem
pera
ture
(ºF)
co
mpa
red
to 1
951-
1980
Atmospheric CO2 Annual temperature
Atmospheric CO
2 (parts per million)
-1.0
-0.5
0.0
+0.5
+1.0
+1.5
+2.0
1880 1900 1920 1940 1960 1980 2000 2020
Year
1971-2000 global average sea surface temp
-1.0
-0.5
0.0
Glo
bal M
ean
Sea
Surf
ace
Tem
pera
ture
(ºF)
co
mpa
red
to 1
971-
2000
+0.5
+1.0
+1.5 Annual sea surface temperature
Page 3
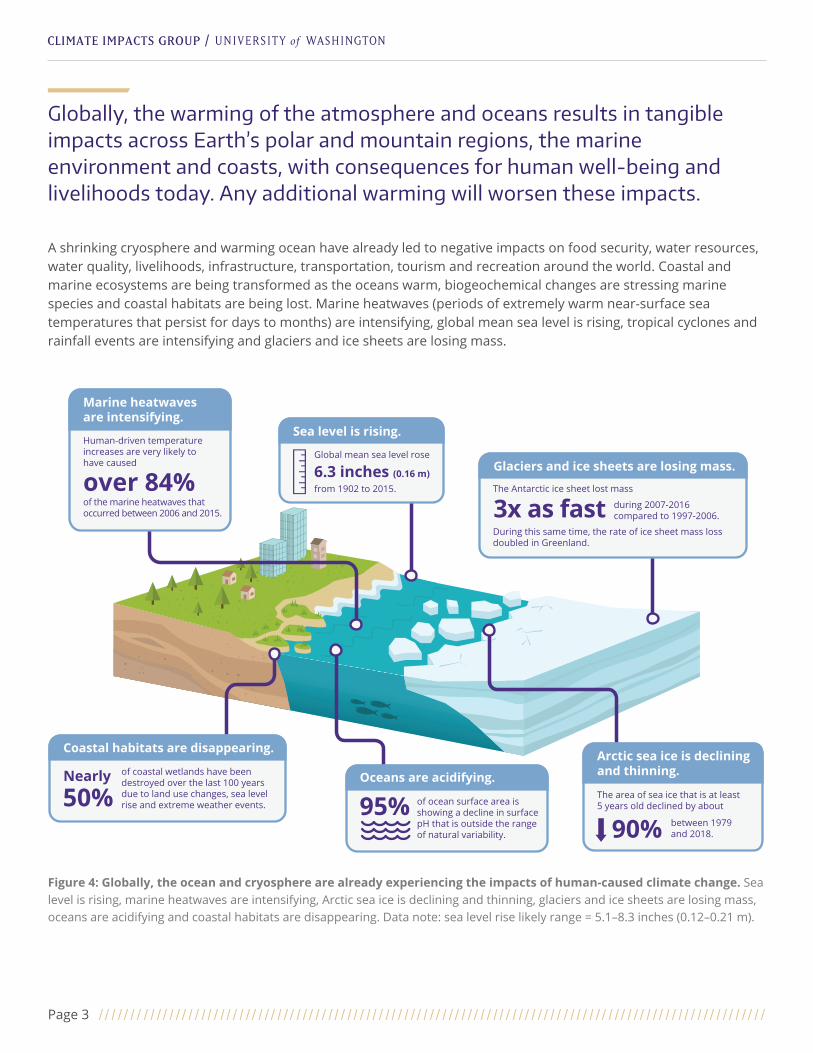
Globally, the warming of the atmosphere and oceans results in tangible impacts across Earth’s polar and mountain regions, the marine environment and coasts, with consequences for human well-being and livelihoods today. Any additional warming will worsen these impacts.
A shrinking cryosphere and warming ocean have already led to negative impacts on food security, water resources, water quality, livelihoods, infrastructure, transportation, tourism and recreation around the world. Coastal and marine ecosystems are being transformed as the oceans warm, biogeochemical changes are stressing marine species and coastal habitats are being lost. Marine heatwaves (periods of extremely warm near-surface sea temperatures that persist for days to months) are intensifying, global mean sea level is rising, tropical cyclones and rainfall events are intensifying and glaciers and ice sheets are losing mass.
Figure 4: Globally, the ocean and cryosphere are already experiencing the impacts of human-caused climate change. Sea level is rising, marine heatwaves are intensifying, Arctic sea ice is declining and thinning, glaciers and ice sheets are losing mass, oceans are acidifying and coastal habitats are disappearing. Data note: sea level rise likely range = 5.1–8.3 inches (0.12–0.21 m).
The area of sea ice that is at least 5 years old declined by about
Arctic sea ice is declining and thinning.
90% between 1979and 2018.
Oceans are acidifying.
of ocean surface area is showing a decline in surface pH that is outside the range of natural variability.
95%
Sea level is rising.
Global mean sea level rose
from 1902 to 2015.6.3 inches (0.16 m)
The Antarctic ice sheet lost mass
Glaciers and ice sheets are losing mass.
3x as fastDuring this same time, the rate of ice sheet mass loss doubled in Greenland.
during 2007-2016 compared to 1997-2006.
over 84%
Marine heatwaves are intensifying.
Human-driven temperature increases are very likely to have caused
of the marine heatwaves that occurred between 2006 and 2015.
of coastal wetlands have been destroyed over the last 100 years due to land use changes, sea level rise and extreme weather events.50%
Coastal habitats are disappearing.
Nearly

Page 4
The health of the global ocean and cryosphere is projected to decline further, with significant environmental, financial and social costs. These impacts will be not be distributed equally across countries, communities or industries. Continued warming will lead to increased stress on global water resources, loss of species and ecosystems, declines in the catch potential of global fisheries and increasing coastal damages as sea level rise accelerates. There is a real possibility for abrupt, rather than gradual, change that would be especially disruptive.
All coastal ecosystems are expected to experience increasing risks as the ocean warms. It is virtually certain that ocean warming will continue throughout the 21st century, with the upper ocean expected to absorb 5–7 times more heat than was taken up since 1970 (under a high greenhouse gas
emissions scenario (RCP 8.5)). Continued ocean carbon dioxide uptake by 2100 will significantly exacerbate ocean acidification. These changes will continue to influence the spatial distribution and abundance of many of the world’s fish and shellfish stocks, and will continue to have varied impacts on catches, livelihoods and local cultures.
Marine heatwaves are projected to become more frequent and intense, cover larger areas and last longer. By the end of the century under a high greenhouse gas emissions scenario (RCP 8.5), marine heatwaves could occur 50 times more frequently globally and be ten times more intense than they
were historically (1850–1900). Marine heatwaves negatively affect marine ecosystems, fisheries and water quality, bringing increasing risks to marine species and human health.
Land-based snow and ice will continue to decline, as glaciers and ice sheets lose mass, snowfall decreases and permafrost melts. Decreases in snowpack and glacier area have altered when, where and how much water is available in snowmelt- and glacier-fed river basins around the globe. These
changes are projected to increase under all future greenhouse gas emissions scenarios, stressing downstream ecosystems and the communities that rely on this water for drinking, hydropower generation and agricultural uses.
Antarctica may become a larger contributor to sea level rise by the end of the 21st century, which would accelerate the pace of sea-level rise in the Northern Hemisphere. By 2100 under a high greenhouse gas emissions scenario (RCP 8.5), global mean sea level rise is projected to be 2.8 ft
(0.84 m; likely range 2.0–3.6 ft (0.61–1.10 m)) and increasing by 0.6 inches (15 mm) per year. Globally, extreme sea level events that are currently expected to occur once per century are projected, under all emissions scenarios, to become annual events at many locations by mid-century. Globally, annual coastal flood damages are projected to increase significantly, with floods becoming 100 to 1000 times more costly by 2100 compared to today.
Page 5
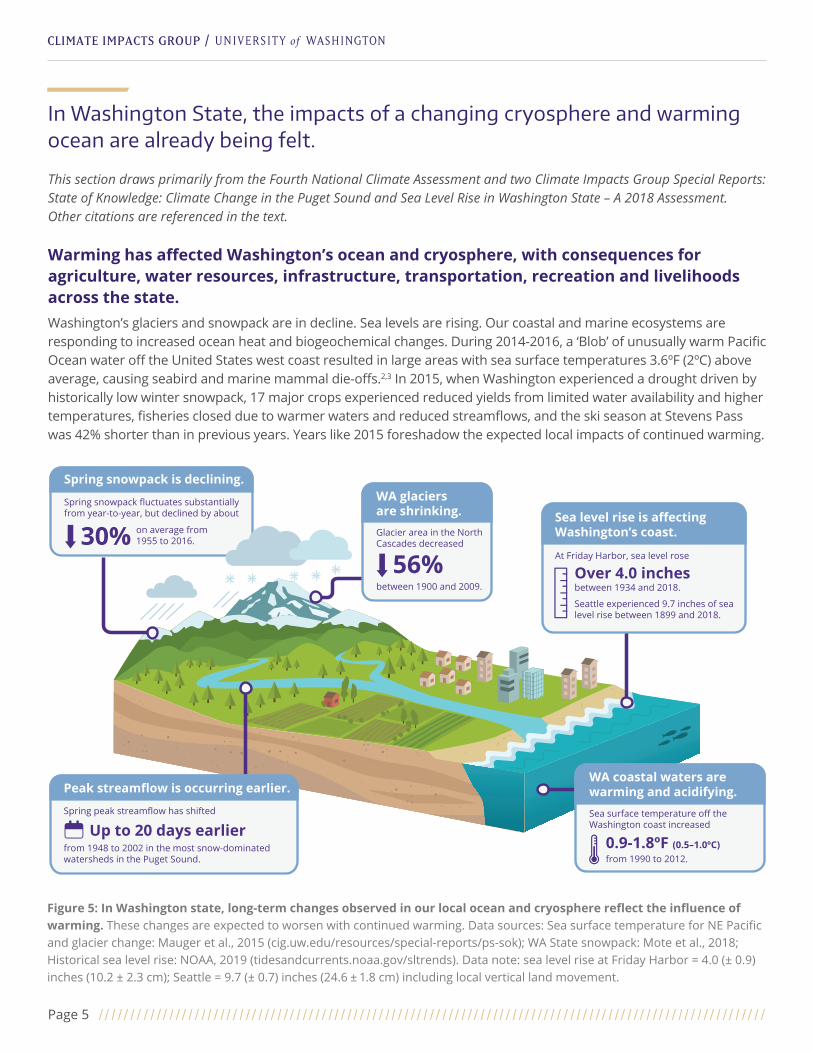
In Washington State, the impacts of a changing cryosphere and warming ocean are already being felt.
This section draws primarily from the Fourth National Climate Assessment and two Climate Impacts Group Special Reports: State of Knowledge: Climate Change in the Puget Sound and Sea Level Rise in Washington State – A 2018 Assessment. Other citations are referenced in the text.
Warming has affected Washington’s ocean and cryosphere, with consequences for agriculture, water resources, infrastructure, transportation, recreation and livelihoods across the state. Washington’s glaciers and snowpack are in decline. Sea levels are rising. Our coastal and marine ecosystems are responding to increased ocean heat and biogeochemical changes. During 2014-2016, a ‘Blob’ of unusually warm Pacific Ocean water off the United States west coast resulted in large areas with sea surface temperatures 3.6ºF (2ºC) above average, causing seabird and marine mammal die-offs.2,3 In 2015, when Washington experienced a drought driven by historically low winter snowpack, 17 major crops experienced reduced yields from limited water availability and higher temperatures, fisheries closed due to warmer waters and reduced streamflows, and the ski season at Stevens Pass was 42% shorter than in previous years. Years like 2015 foreshadow the expected local impacts of continued warming.
Spring snowpack is declining.
Spring snowpack fluctuates substantially from year-to-year, but declined by about
30% on average from 1955 to 2016.
WA glaciers are shrinking.
56%Glacier area in the North Cascades decreased
between 1900 and 2009.
Peak streamflow is occurring earlier.
Spring peak streamflow has shifted
Up to 20 days earlierfrom 1948 to 2002 in the most snow-dominated watersheds in the Puget Sound. from 1990 to 2012.
Sea surface temperature off the Washington coast increased
WA coastal waters are warming and acidifying.
0.9-1.8ºF (0.5–1.0ºC)
Sea level rise is affecting Washington’s coast.
At Friday Harbor, sea level rose
Over 4.0 inches
Seattle experienced 9.7 inches of sea level rise between 1899 and 2018.
between 1934 and 2018.
Figure 5: In Washington state, long-term changes observed in our local ocean and cryosphere reflect the influence of warming. These changes are expected to worsen with continued warming. Data sources: Sea surface temperature for NE Pacific and glacier change: Mauger et al., 2015 (cig.uw.edu/resources/special-reports/ps-sok); WA State snowpack: Mote et al., 2018; Historical sea level rise: NOAA, 2019 (tidesandcurrents.noaa.gov/sltrends). Data note: sea level rise at Friday Harbor = 4.0 (± 0.9) inches (10.2 ± 2.3 cm); Seattle = 9.7 (± 0.7) inches (24.6 ± 1.8 cm) including local vertical land movement.
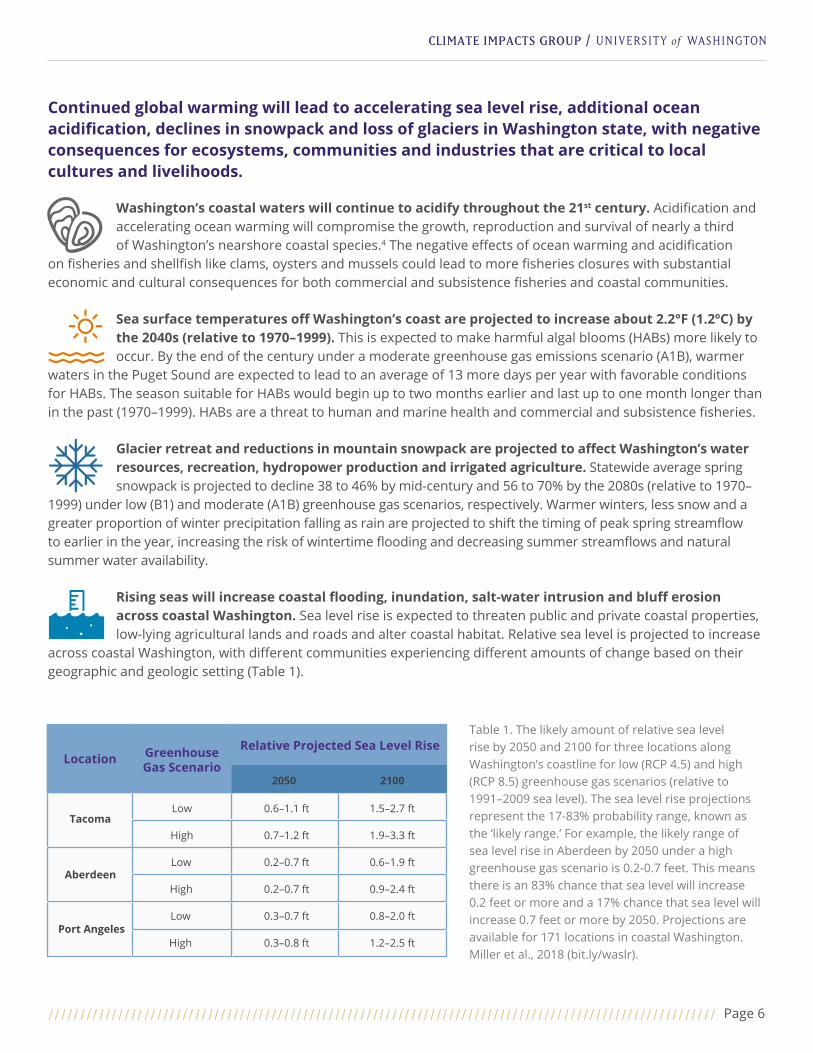
Table 1. The likely amount of relative sea level rise by 2050 and 2100 for three locations along Washington’s coastline for low (RCP 4.5) and high (RCP 8.5) greenhouse gas scenarios (relative to 1991–2009 sea level). The sea level rise projections represent the 17-83% probability range, known as the ‘likely range.’ For example, the likely range of sea level rise in Aberdeen by 2050 under a high greenhouse gas scenario is 0.2-0.7 feet. This means there is an 83% chance that sea level will increase 0.2 feet or more and a 17% chance that sea level will increase 0.7 feet or more by 2050. Projections are available for 171 locations in coastal Washington. Miller et al., 2018 (bit.ly/waslr).
Location GreenhouseGas Scenario
Relative Projected Sea Level Rise
2050 2100
Tacoma
Aberdeen
Low
High
Low
High
Low
High
0.6–1.1 ft
0.7–1.2 ft
0.2–0.7 ft
0.2–0.7 ft
0.3–0.7 ft
0.3–0.8 ft
1.5–2.7 ft
1.9–3.3 ft
0.6–1.9 ft
0.9–2.4 ft
0.8–2.0 ft
1.2–2.5 ftPort Angeles
Page 6
Continued global warming will lead to accelerating sea level rise, additional ocean acidification, declines in snowpack and loss of glaciers in Washington state, with negative consequences for ecosystems, communities and industries that are critical to local cultures and livelihoods.
Washington’s coastal waters will continue to acidify throughout the 21st century. Acidification and accelerating ocean warming will compromise the growth, reproduction and survival of nearly a third of Washington’s nearshore coastal species.4 The negative effects of ocean warming and acidification
on fisheries and shellfish like clams, oysters and mussels could lead to more fisheries closures with substantial economic and cultural consequences for both commercial and subsistence fisheries and coastal communities.
Sea surface temperatures off Washington’s coast are projected to increase about 2.2°F (1.2ºC) by the 2040s (relative to 1970–1999). This is expected to make harmful algal blooms (HABs) more likely to occur. By the end of the century under a moderate greenhouse gas emissions scenario (A1B), warmer
waters in the Puget Sound are expected to lead to an average of 13 more days per year with favorable conditions for HABs. The season suitable for HABs would begin up to two months earlier and last up to one month longer than in the past (1970–1999). HABs are a threat to human and marine health and commercial and subsistence fisheries.
Glacier retreat and reductions in mountain snowpack are projected to affect Washington’s water resources, recreation, hydropower production and irrigated agriculture. Statewide average spring snowpack is projected to decline 38 to 46% by mid-century and 56 to 70% by the 2080s (relative to 1970–
1999) under low (B1) and moderate (A1B) greenhouse gas scenarios, respectively. Warmer winters, less snow and a greater proportion of winter precipitation falling as rain are projected to shift the timing of peak spring streamflow to earlier in the year, increasing the risk of wintertime flooding and decreasing summer streamflows and natural summer water availability.
Rising seas will increase coastal flooding, inundation, salt-water intrusion and bluff erosion across coastal Washington. Sea level rise is expected to threaten public and private coastal properties, low-lying agricultural lands and roads and alter coastal habitat. Relative sea level is projected to increase
across coastal Washington, with different communities experiencing different amounts of change based on their geographic and geologic setting (Table 1).
Page 7
Climate risks increase with every additional amount of warming.
The extent of harm caused by global warming’s alteration of the ocean and cryosphere depends both on how much warming occurs and how well society prepares for the impacts of that warming. Faster reductions in greenhouse gas emissions and slower rates of warming will allow for greater opportunities to address the rising financial, social and environmental risks of continued warming.
The nations of the world have set a target of limiting global warming to 2.7ºF (1.5ºC) to prevent increasingly dangerous human-influence on the climate system.In 2015, 195 countries endorsed the Paris Agreement, committing to limit global temperature rise to “well below 2ºC” (3.6ºF) and “pursuing efforts to limit the temperature increase to 1.5ºC” (2.7ºF) above pre-industrial levels. Avoiding global warming of 1.5ºC is only possible through significant reductions in greenhouse gas emissions and removal of CO2 from the atmosphere. Although efforts to reduce emissions are already occurring, they must be rapidly scaled up in order to stabilize greenhouse gas concentrations in the atmosphere at a level that would prevent “dangerous interference with the climate system.” Stabilizing global temperature at any level requires reducing global greenhouse emissions to ‘net zero’.
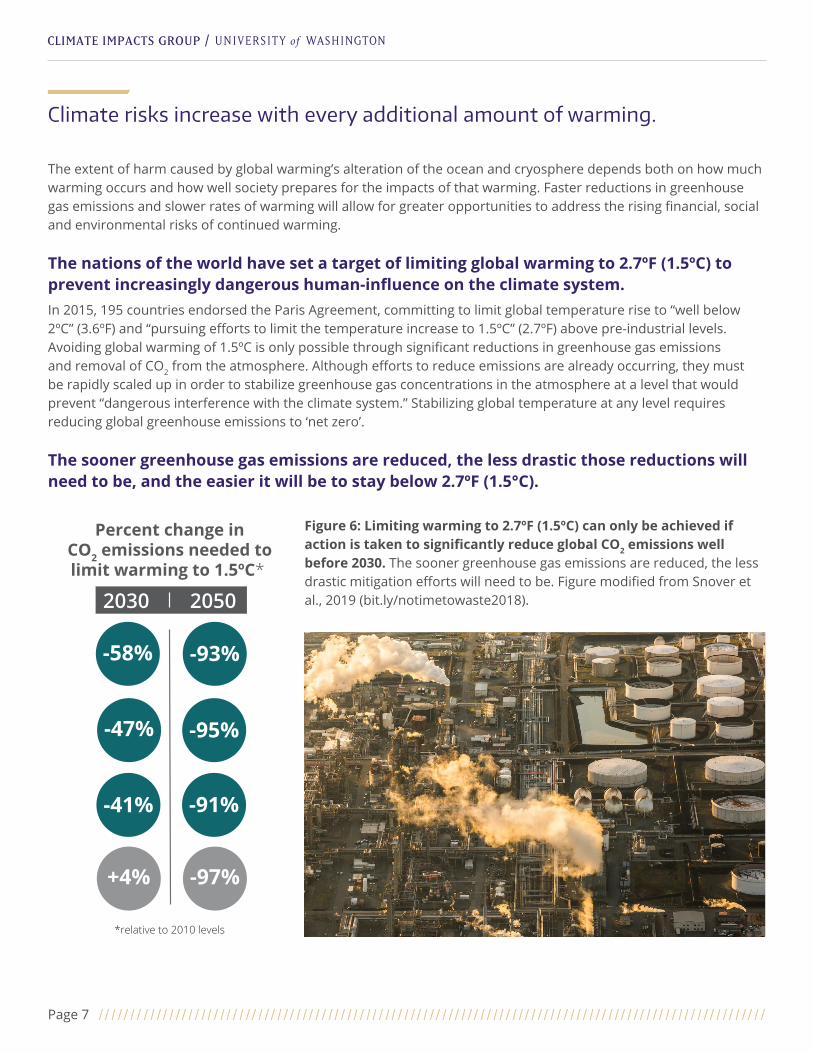
The sooner greenhouse gas emissions are reduced, the less drastic those reductions will need to be, and the easier it will be to stay below 2.7ºF (1.5°C).
Figure 6: Limiting warming to 2.7ºF (1.5ºC) can only be achieved if action is taken to significantly reduce global CO2 emissions well before 2030. The sooner greenhouse gas emissions are reduced, the less drastic mitigation efforts will need to be. Figure modified from Snover et al., 2019 (bit.ly/notimetowaste2018).2030 2050
Percent change in CO2 emissions needed to limit warming to 1.5ºC*
*relative to 2010 levels
-58% -93%
-95%-47%
-91%-41%
-97%+4%

Page 8
“The far-reaching services and options provided by ocean and cryosphere-related ecosystems can be supported by protection, restoration, precautionary ecosystem-based management of renewable resource use, and the reduction of pollution and other stressors.” - IPCC Special Report on the Ocean and Cryosphere in a Changing Climate
We must prepare our communities, economies and environment for the local consequences of a changing cryosphere and warming ocean.
This preparation can involve investments and actions that reduce exposure to increasing climate-related risks like extreme events, sea level rise and changing marine and freshwater resources. Preparation can also involve improving society’s ability to cope with and recover from impacts that do occur, and working to ensure that all regions and communities have the resources necessary for addressing these changes.
This preparation, also called climate adaptation, can be accelerated by identifying and addressing the ecological, financial, institutional and governance constraints that prevent ambitious action — from international governance to local decision-making and resource management practices. The IPCC identified key investment areas with significant potential to reduce climate-related risks and enhance climate resilience.
Increased cross-sectoral and regional collaboration can enable integration of adaptation efforts across sectors, jurisdictions and geographic and geopolitical boundaries. In Washington, the Puget Sound Climate Preparedness Collaborative is a network of local and tribal governments, agencies and
organizations working together to create regional climate resilience, including planning for sea level rise across jurisdictional boundaries.
Nature-based adaptation approaches can enhance climate resilience for both ecosystems and the built environment (e.g., transportation, water, wastewater and energy systems). For example, the Qwuloolt restoration project of the Tulalip Tribes and diverse partners in the lower Snohomish river
basin provides critical fish-rearing habitat in the estuary while maintaining protections for adjacent farmlands.5
Locally-specific scientific information about projected climate-related risks and potential consequences of alternative response options can empower public and private entities to characterize and manage the risks of climate change. Communities across the state rely on organizations like the
University of Washington Climate Impacts Group for the fundamental scientific understanding, data, tools and guidance necessary for preparing for and managing local climate impacts.
Education and capacity-building efforts about future climate risks and how they can be factored into today’s decisions are key for building climate resilience. A range of local, regional and national efforts are working to provide the education and capacity-building necessary for climate-smart decision-making.
Organizations like the Water Utility Climate Alliance provide training across the country to help water utilities and water-sector professionals prepare our drinking water and wastewater facilities for climate change-related impacts.
Page 9
Additional references: 1 IPCC Fifth Assessment Report, 2014.2 Bond et al., 2015. Causes and impacts of the 2014 warm anomaly in the NE Pacific. Geophys. Res. Lett., 42(9): 3414–3420.3 Jacox et al., 2018. Forcing of multiyear extreme ocean temperatures that impacted California current living marine resources in 2016. Bull. Amer. Meteor. Soc., 99(1), S27–S33.4 Washington State Blue Ribbon Panel on Ocean Acidification, 2012. Ocean Acidification: From Knowledge to Action: Washington State’s Strategic Response. Washington Department of Ecology.5 Qwuloolt Estuary Restoration Plan. qwuloolt.org/RestorationPlan/Objectives
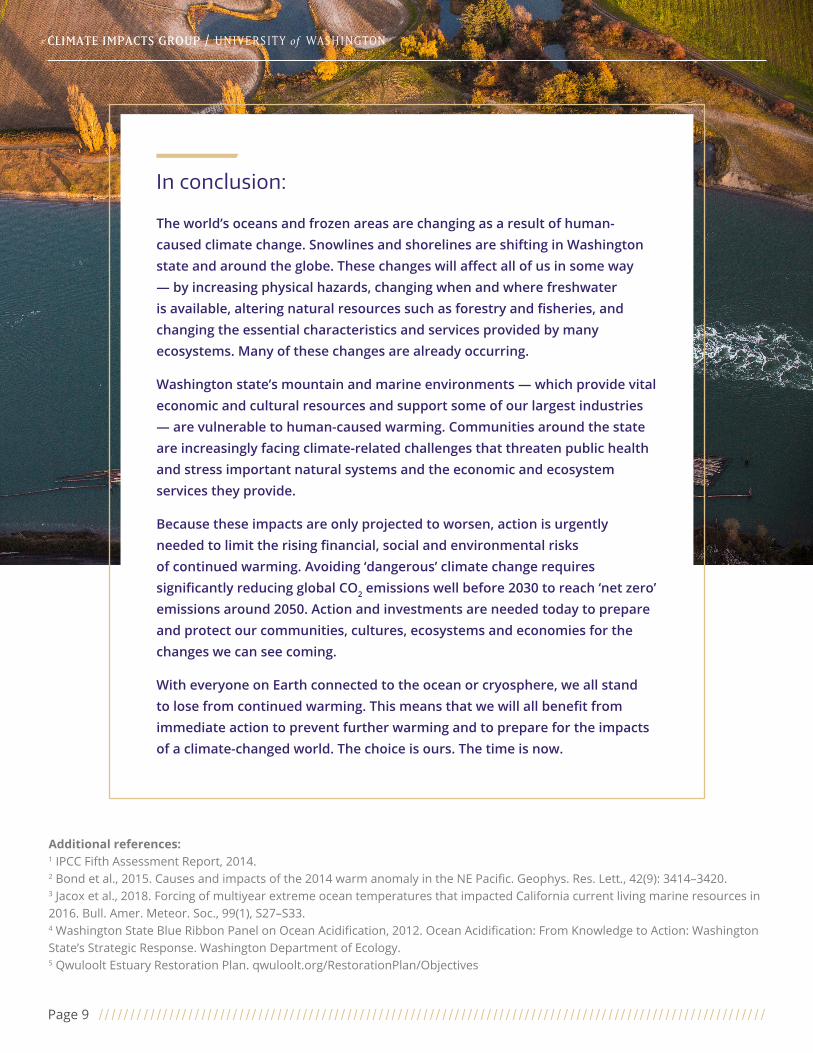
In conclusion:
The world’s oceans and frozen areas are changing as a result of human-caused climate change. Snowlines and shorelines are shifting in Washington state and around the globe. These changes will affect all of us in some way — by increasing physical hazards, changing when and where freshwater is available, altering natural resources such as forestry and fisheries, and changing the essential characteristics and services provided by many ecosystems. Many of these changes are already occurring.
Washington state’s mountain and marine environments — which provide vital economic and cultural resources and support some of our largest industries — are vulnerable to human-caused warming. Communities around the state are increasingly facing climate-related challenges that threaten public health and stress important natural systems and the economic and ecosystem services they provide.
Because these impacts are only projected to worsen, action is urgently needed to limit the rising financial, social and environmental risks of continued warming. Avoiding ‘dangerous’ climate change requires significantly reducing global CO2 emissions well before 2030 to reach ‘net zero’ emissions around 2050. Action and investments are needed today to prepare and protect our communities, cultures, ecosystems and economies for the changes we can see coming.
With everyone on Earth connected to the ocean or cryosphere, we all stand to lose from continued warming. This means that we will all benefit from immediate action to prevent further warming and to prepare for the impacts of a climate-changed world. The choice is ours. The time is now.
Page 10
FOR MORE INFORMATION
The IPCC Special Report on the Ocean and Cryosphere in a Changing Climate outlines the impacts of climate change on Earth’s mountain and marine environments and opportunities for avoiding and managing the risks associated with these changes. Link: ipcc.ch/srocc/home
The IPCC Special Report on Global Warming of 1.5ºC highlights the impacts of global warming of 1.5ºC above pre-industrial levels and related greenhouse gas emission reduction pathways. Link: ipcc.ch/sr15
No Time To Waste: The IPCC Special Report on Global Warming of 1.5ºC and the Implications for Washington State summarizes the global and local consequences of 1.5ºC and 2.0ºC of global warming and the urgent need for action. Link: bit.ly/notimetowaste2018
The Fourth National Climate Assessment, Volume Two describes the effects of climate change on the United States. Link: nca2018.globalchange.gov
Chapters 8 and 9 highlight observed and projected changes to U.S. coasts, oceans and marine environments. Links: nca2018.globalchange.gov/chapter/8; nca2018.globalchange.gov/chapter/9
Chapter 24 highlights the interconnected risks within the Northwest, with particular attention to natural resources, cultural heritage, infrastructure and health and communities. Link: nca2018.globalchange.gov/chapter/24
Climate Change Impacts and Adaptation in Washington State: Technical Summaries for Decision Makers summarizes existing knowledge about the likely effects of climate change on Washington State and the Pacific Northwest. Link: cig.uw.edu/resources/special-reports/wa-sok
State of Knowledge: Climate Change in Puget Sound summarizes existing knowledge concerning observed and likely future climate trends and their effects on the lands, waters and people of the Puget Sound region. Link: cig.uw.edu/resources/special-reports/ps-sok
Projected Sea Level Rise for Washington State – A 2018 Assessment provides community-scale sea level rise projections out to the year 2150 for 171 different locations around coastal Washington. The website includes an interactive data visualization. Link: cig.uw.edu/resources/special-reports

CIG.UW.EDUearthlab.uw.edu
Prepared by the University of Washington’s Climate Impacts Group, Washington state’s primary resource for science-based information and support for identifying and managing the effects of climate variability and change.
Roop, H.A., G.S. Mauger, H. Morgan, A.K. Snover, and M. Krosby, 2020. “Shifting Snowlines and Shorelines: The Intergovernmental Panel on Climate Change’s Special Report on the Ocean and Cryosphere and Implications for Washington State.” Briefing paper prepared by the Climate Impacts Group, University of Washington, Seattle. DOI: doi.org/10.6069/KTVN-WY66. Updated 01/2020.
Cover images: © Climate Impacts Group; aerial support provided by LightHawk.
An EarthLab Member Organization