Sheridan Elementary School CIAC Presentation April 10, 2012.
25
Sheridan Elementary School CIAC Presentation April 10, 2012
-
Upload
bertha-parker -
Category
Documents
-
view
213 -
download
0
Transcript of Sheridan Elementary School CIAC Presentation April 10, 2012.

Sheridan Elementary SchoolCIAC Presentation April 10, 2012

PresentersDixie Coleman-Principal
Gretchen Westerhaus-Primary Team Leader
Dan Dinkel-Intermediate Team Leader
Chris Bogenhagen-Instructional Coach
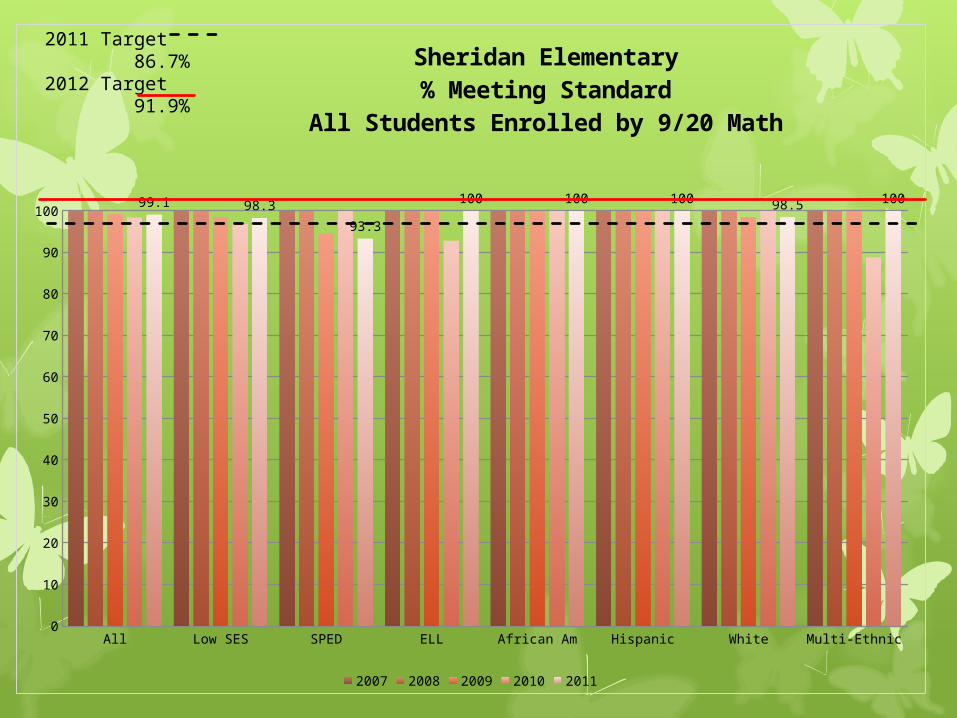
All Low SES SPED ELL African Am Hispanic White Multi-Ethnic0
10
20
30
40
50
60
70
80
90
100 99.1 98.3
93.3
100 100 100 98.5 100
Sheridan Elementary% Meeting Standard
All Students Enrolled by 9/20 Math
2007 2008 2009 2010 2011
2011 Target 86.7%2012 Target 91.9%

2007 2008 2009 2010 20110
10
20
30
40
50
60
70
80
90
100100 100 98.5
9698.3
Low SES
Low SES
49
st
ud
en
ts
65
st
ud
en
ts
40
st
ud
en
ts
65
st
ud
en
ts
58
st
ud
en
ts

2007 2008 2009 2010 20110
10
20
30
40
50
60
70
80
90
100100 100
94.4
100
93.3
ESS
SPED
18
st
ud
en
ts
16
st
ud
en
ts
15
st
ud
en
ts
21
st
ud
en
ts
15
st
ud
en
ts
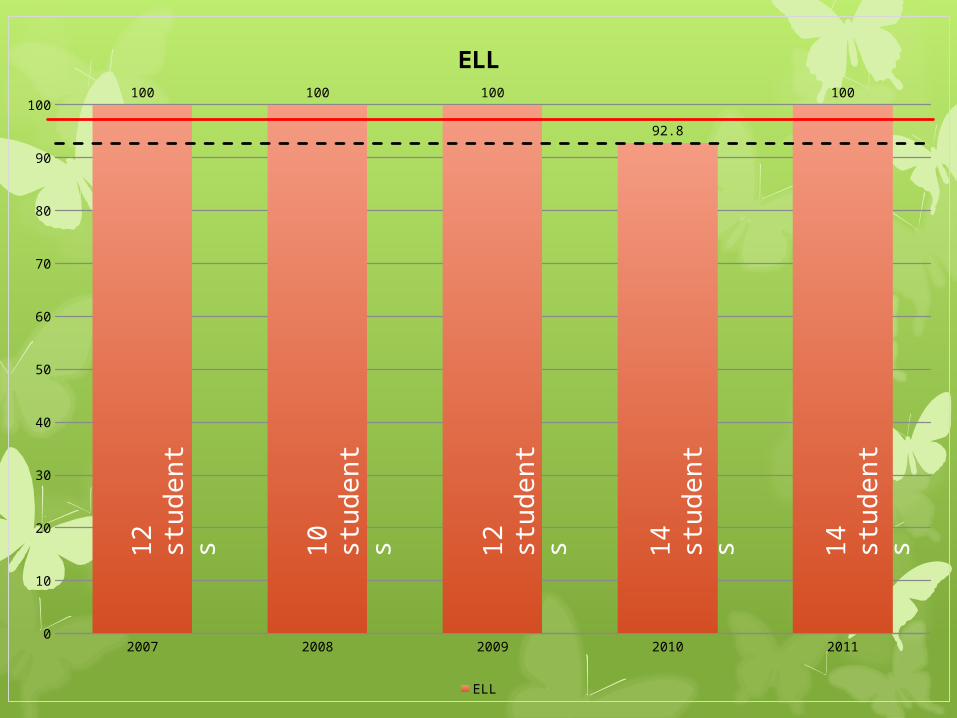
2007 2008 2009 2010 20110
10
20
30
40
50
60
70
80
90
100100 100 100
92.8
100
ELL
ELL
12
st
ud
en
ts
14
st
ud
en
ts
14
st
ud
en
ts
10
st
ud
en
ts
12
st
ud
en
ts

2007 2008 2009 2010 20110
10
20
30
40
50
60
70
80
90
100100 100 100 100 100
African American
African Am1
7
stu
den
ts
10
st
ud
en
ts
17
st
ud
en
ts
18
st
ud
en
ts
19
st
ud
en
ts
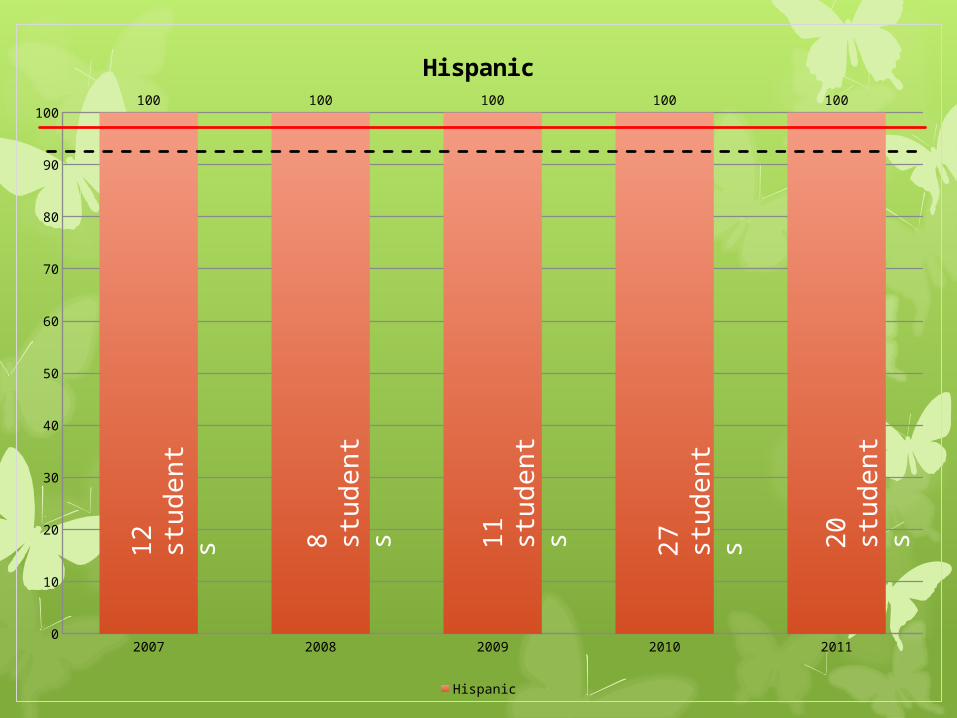
2007 2008 2009 2010 20110
10
20
30
40
50
60
70
80
90
100100 100 100 100 100
Hispanic
Hispanic2
7
stu
den
ts
11
st
ud
en
ts
20
st
ud
en
ts
8
stu
den
ts
12
st
ud
en
ts

2007 2008 2009 2010 20110
10
20
30
40
50
60
70
80
90
100100 100
98.5100
98.5
White
White
68
st
ud
en
ts
70
st
ud
en
ts
65
st
ud
en
ts
59
st
ud
en
ts
50
st
ud
en
ts
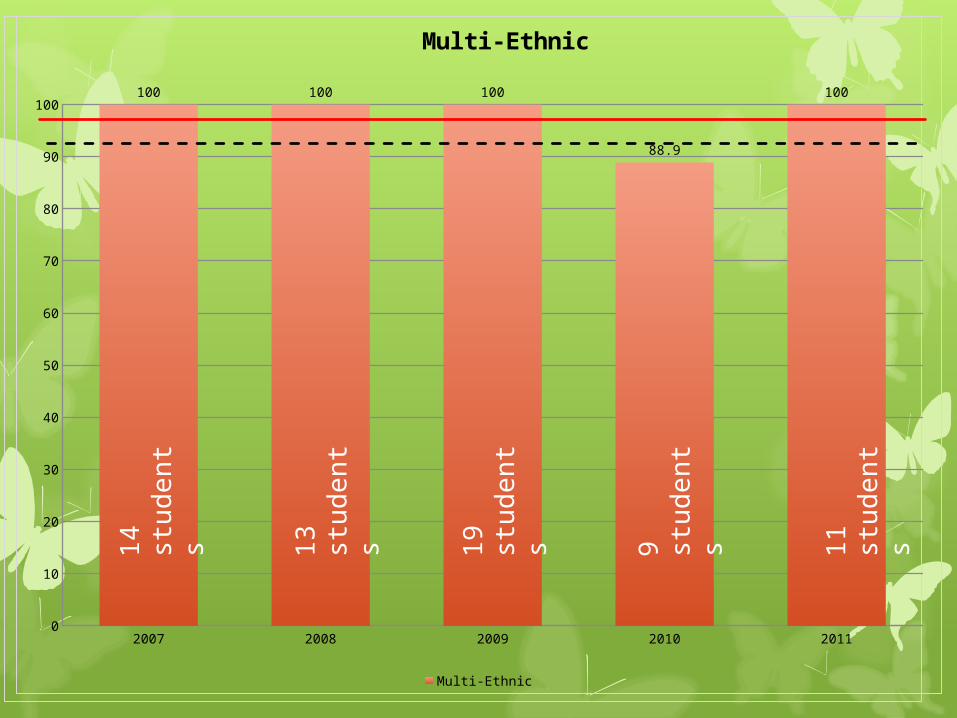
2007 2008 2009 2010 20110
10
20
30
40
50
60
70
80
90
100100 100 100
88.9
100
Multi-Ethnic
Multi-Ethnic
9
stu
den
ts
13
st
ud
en
ts
14
st
ud
en
ts
19
st
ud
en
ts
11
st
ud
en
ts

2009 3rd Graders 2010 4th Graders 2011 5th Graders0
5
10
15
20
25
30
35
0 0 0
30 30 30
Longitudinal Data
Students Below StandardStudents Meeting or Exceeding Standard

Academic Warning
Approaching Standard
Meets Standard
Exceeds Standard
Exemplary0
10
20
30
40
50
60
70
0 1
18
40
62
0 2
25
43
59
1 0
21
36
56
# of Students in Performance Categories
2009 2010 2011

All Low SES SPED ELL African Am Hispanic White Multi-Ethnic0
10
20
30
40
50
60
70
80
90
100 98.2 96.693.3
100 100 10096.9
100
Reading% of Students Meeting Standard
in school by 9/20
2007 2008 2009 2010 2011
2011 Target 87.8%2012 Target 91.9%

2007 2008 2009 2010 20110
10
20
30
40
50
60
70
80
90
100100
97.5100 100
96.6
Low SES
Low SES
44
students
40
students
65
students
65
students
58
students

2007 2008 2009 2010 20110
10
20
30
40
50
60
70
80
90
100100
93.7
100 100
93.3
ESS
SPED
15
students
16
students
18
students
21
students
15
students

2007 2008 2009 2010 20110
10
20
30
40
50
60
70
80
90
100100 100 100 100 100
ELL
ELL
11
students
10
students
12
students
14
students
14
students

2007 2008 2009 2010 20110
10
20
30
40
50
60
70
80
90
100100
94.7
100 100 100
African American
African Am
18
students
19
students
17
students
17
students
10
students

2007 2008 2009 2010 20110
10
20
30
40
50
60
70
80
90
100100 100 100 100 100
Hispanic
Hispanic
11
students
8 s
tudents
11
students
27
students
20
students

2007 2008 2009 2010 20110
10
20
30
40
50
60
70
80
90
100100 100 100 100
96.9
White
White
65
students
59
students
50
students
68
students
70
students

2009 3rd Graders 2010 4th Graders 2011 5th Graders0
5
10
15
20
25
30
35
0 0 1
30 30 29
Longitudinal Data
Students Below StandardStudents Meeting or Exceeding Standard

Academic Warning
Approaches Standard
Meets Standard
Exceeds Standard
Exemplary0
10
20
30
40
50
60
70
80
0 0
12
44
65
0 0
22
44
63
1 1
12
30
70
# of Students in Performance Categories
2009 2010 2011

Academic Warning
Approaches Standard
Meets Standard
Exceeds Standard
Exemplary0
10
20
30
40
50
60
70
80
0 0
12
44
65
0 0
22
44
63
1 1
12
30
70
# of Students in Performance Categories
2009 2010 2011

MTSS
Reading is the primary focus, but we do address Math as well.
Universal Measure-DIBELS
STAR scores also used beginning in October 2011
Tutoring Schedule Tutoring schedule.xlsx
Teachers spend time with the most at-risk students
Progress Monitoring Notebooks ESS Progress Monitoring.docx
Defined SIT Pathway Student Improvement Team Pathway Flowchart.docx

Principal/Teacher Reviews
Discuss At-A-Glance Sheets for Individual Students
Discuss MTSS Progress Monitoring DataReview SIT/ESAP FilesReview Class Data (Formatives, Interims,
Chapter Reviews)Discuss S.M.A.R.T. GoalPlan the next step for student, class, and
teacher growth

What’s Next For Sheridan
Transition to Common Core 2-5Revamp School Improvement Plan to match
CCSS ExpectationsContinue Team-Building and Relationship-
Building between Staff, Students, and Parents
Continue to assess and meet needs with MTSS, as well as build a resource library for interventions