
Shell Annual Report 2014
200
ANNUAL REPORT Royal Dutch Shell plc Annual Report and Form 20-F for the year ended December 31, 2014
Transcript of Shell Annual Report 2014

ANNUAL REPORT Royal Dutch Shell plc Annual Report and Form 20-F for the year ended December 31, 2014
CONTENTS 01INTRODUCTION01 Form 20-F02 Cross reference to Form 20-F04 Terms and abbreviations05 About this Report
06STRATEGIC REPORT06 Chairman’s message07 Chief Executive Officer’s review09 Business overview11 Risk factors15 Strategy and outlook16 Market overview18 Summary of results20 Performance indicators22 Selected financial data23 Upstream40 Downstream47 Corporate48 Liquidity and capital resources52 Environment and society56 Our people
58GOVERNANCE58 The Board of Royal Dutch Shell plc61 Senior Management62 Directors’ Report65 Corporate governance76 Audit Committee Report79 Directors’ Remuneration Report
99FINANCIALSTATEMENTS ANDSUPPLEMENTS
Consolidated Financial Statements142 Supplementary information – oil and
gas (unaudited)160 Parent Company Financial Statements17 Royal Dutch Shell Dividend Access
Trust Financial Statements
179ADDITIONALINFORMATION179 Shareholder information185 Section 13(r) of the US Securities
Exchange Act of 1934 disclosure186 Non-GAAP measures reconciliations187 Exhibits
Cover photoThe photo shows a Shell employee at ShellTechnology Centre Amsterdam (STCA).STCA has played a key role in Shell’stechnological developments for more than100 years. It comprises 80,000 squaremetres of laboratories, test facilities,workshops and offices. STCA’s work isvital for delivering affordable energywith less environmental impact.
Designed by Conran Design GroupTypeset by RR DonnelleyPrinted by Tuijtel under ISO 14001
99
1

UNITED STATES SECURITIES AND EXCHANGE COMMISSIONWashington, D.C. 20549
Form 20-FANNUAL REPORT PURSUANT TO SECTION 13 OR 15(d)
OF THE SECURITIES EXCHANGE ACT OF 1934For the fiscal year ended December 31, 2014
Commission file number 1-32575
Royal Dutch Shell plc(Exact name of registrant as specified in its charter)
England and Wales(Jurisdiction of incorporation or organisation)
Carel van Bylandtlaan 30, 2596 HR, The Hague, The NetherlandsTel. no: 011 31 70 377 9111
[email protected](Address of principal executive offices)
Securities registered pursuant to Section 12(b) of the ActTitle of Each Class Name of Each Exchange on Which RegisteredAmerican Depositary Shares representing two A ordinary sharesof the issuer with a nominal value of €0.07 each
New York Stock Exchange
American Depositary Shares representing two B ordinary sharesof the issuer with a nominal value of €0.07 each
New York Stock Exchange
0.625% Guaranteed Notes due 2015 New York Stock Exchange3.1% Guaranteed Notes due 2015 New York Stock Exchange3.25% Guaranteed Notes due 2015 New York Stock ExchangeFloating Rate Guaranteed Notes due 2015 New York Stock ExchangeFloating Rate Guaranteed Notes due 2016 New York Stock Exchange0.9% Guaranteed Notes due 2016 New York Stock Exchange1.125% Guaranteed Notes due 2017 New York Stock Exchange5.2% Guaranteed Notes due 2017 New York Stock Exchange1.9% Guaranteed Notes due 2018 New York Stock Exchange2.0% Guaranteed Notes due 2018 New York Stock Exchange4.3% Guaranteed Notes due 2019 New York Stock Exchange4.375% Guaranteed Notes due 2020 New York Stock Exchange2.375% Guaranteed Notes due 2022 New York Stock Exchange2.25% Guaranteed Notes due 2023 New York Stock Exchange3.4% Guaranteed Notes due 2023 New York Stock Exchange6.375% Guaranteed Notes due 2038 New York Stock Exchange5.5% Guaranteed Notes due 2040 New York Stock Exchange3.625% Guaranteed Notes due 2042 New York Stock Exchange4.55% Guaranteed Notes due 2043 New York Stock Exchange
Securities registered pursuant to Section 12(g) of the Act: noneSecurities for which there is a reporting obligation pursuant to Section 15(d) of the Act: none
Indicate the number of outstanding shares of each of the issuer’s classes of capital or common stock as of the close of the period covered by the annualreport.Outstanding as of December 31, 2014:3,867,361,824 A ordinary shares with a nominal value of €0.07 each.2,427,675,757 B ordinary shares with a nominal value of €0.07 each.Indicate by check mark if the registrant is a well-known seasoned issuer, as defined in Rule 405 of the Securities Act. Í Yes ‘ NoIf this report is an annual or transition report, indicate by check mark if the registrant is not required to file to Section 13pursuant reports or 15(d) of the Securities Exchange Act of 1934. ‘ Yes Í NoNote — Checking the box above will not relieve any registrant required to file reports pursuant to Section 13 or 15(d) ofthe Securities Exchange Act of 1934 from their obligations under those Sections.Indicate by check mark whether the registrant (1) has filed all reports required to be filed by Section 13 or 15(d) of theSecurities Exchange Act of 1934 during the preceding 12 months (or for such shorter period that the registrant wasrequired to file such reports), and (2) has been subject to such filing requirements for the past 90 days. Í Yes ‘ NoIndicate by check mark whether the registrant has submitted electronically and posted on its corporate website, if any,every Interactive Data File required to be submitted and posted pursuant to Rule 405 of Regulation S-T (§232.405 of thischapter) during the preceding 12 months (or for such shorter period that the registrant was required to submit and postsuch files). Í Yes ‘ NoIndicate by check mark whether the registrant is a large accelerated filer, an accelerated filer, or a non-accelerated filer.See definition of “accelerated filer and large accelerated filer” in Rule 12b-2 of the Exchange Act. (Check one):
Large accelerated filer Í Accelerated filer ‘ Non-accelerated filer ‘
Indicate by check mark which basis of accounting the registrant has used to prepare the financial statements included inthis filing: U.S. GAAP ‘
International Financial Reporting Standards as issued by the International Accounting Standards Board. Í Other ‘
If “Other” has been checked in response to the previous question, indicate by check mark which financial statement itemthe registrant has elected to follow. Item 17 ‘ Item 18 ‘
If this is an annual report, indicate by check mark whether the registrant is a shell company (as defined in Rule 12b-2 ofthe Exchange Act). ‘ Yes Í NoCopies of notices and communications from the Securities and Exchange Commission should be sent to:Royal Dutch Shell plcCarel van Bylandtlaan 302596 HR, The Hague, The NetherlandsAttn: Michiel Brandjes

02 INTRODUCTION
CROSS REFERENCE TO FORM 20-F SHELL ANNUAL REPORT AND FORM 20-F 2014
CROSS REFERENCE TO FORM 20-FPart I Pages
Item 1. Identity of Directors, Senior Management and Advisers N/AItem 2. Offer Statistics and Expected Timetable N/AItem 3. Key Information
A. Selected financial data 22, 181B. Capitalisation and indebtedness 50, 51C. Reasons for the offer and use of proceeds N/AD. Risk factors 11-14
Item 4. Information on the CompanyA. History and development of the company 9, 15,18, 23-30, 32, 40-42, 179, 186B. Business overview 9-21, 23-47, 52-57, 142-150, 158-159, 185C. Organisational structure 9, E2-E3D. Property, plant and equipment 15, 18-19, 23-46, 52-56, 142-159
Item 4A. Unresolved Staff Comments N/AItem 5. Operating and Financial Review and Prospects
A. Operating results 10-14, 18-47, 131-136B. Liquidity and capital resources 15, 18-19, 23-24, 32, 40-42, 48-51, 70, 114-115,
123-126, 131-136, 166, 177-178C. Research and development, patents and licences, etc. 10, 64, 112D. Trend information 9-10, 15-21, 23-26, 40-46E. Off-balance sheet arrangements 51F. Tabular disclosure of contractual obligations 51G. Safe harbour 51
Item 6. Directors, Senior Management and EmployeesA. Directors and senior management 58-61, 66-67B. Compensation 81-90C. Board practices 58-60, 62-81, 90, 97D. Employees 56, 140E. Share ownership 57, 81-98, 115-116, 137, 179
Item 7. Major Shareholders and Related Party TransactionsA. Major shareholders 74-75, 179-180B. Related party transactions 63, 113, 122, 140-141, 169-170, 178C. Interests of experts and counsel N/A
Item 8. Financial InformationA. Consolidated Statements and Other Financial Information 48-51, 99-141, 160-178B. Significant changes 64
Item 9. The Offer and ListingA. Offer and listing details 182B. Plan of distribution N/AC. Markets 179D. Selling shareholders N/AE. Dilution N/AF. Expenses of the issue N/A
Item 10. Additional InformationA. Share capital 49, 57, 64, 86-88, 109, 136-137, 164, 167-169, 176, 179B. Memorandum and articles of association 71-75C. Material contracts N/AD. Exchange controls 184E. Taxation 184-185F. Dividends and paying agents 62, 71-73, 179, 183, back coverG. Statement by experts N/AH. Documents on display 5I. Subsidiary information N/A
Item 11. Quantitative and Qualitative Disclosures About Market Risk 70-71, 111-117, 122, 131-136, 167, 177-178Item 12. Description of Securities Other than Equity Securities 179, 183-184
INTRODUCTION 03
SHELL ANNUAL REPORT AND FORM 20-F 2014 CROSS REFERENCE TO FORM 20-F
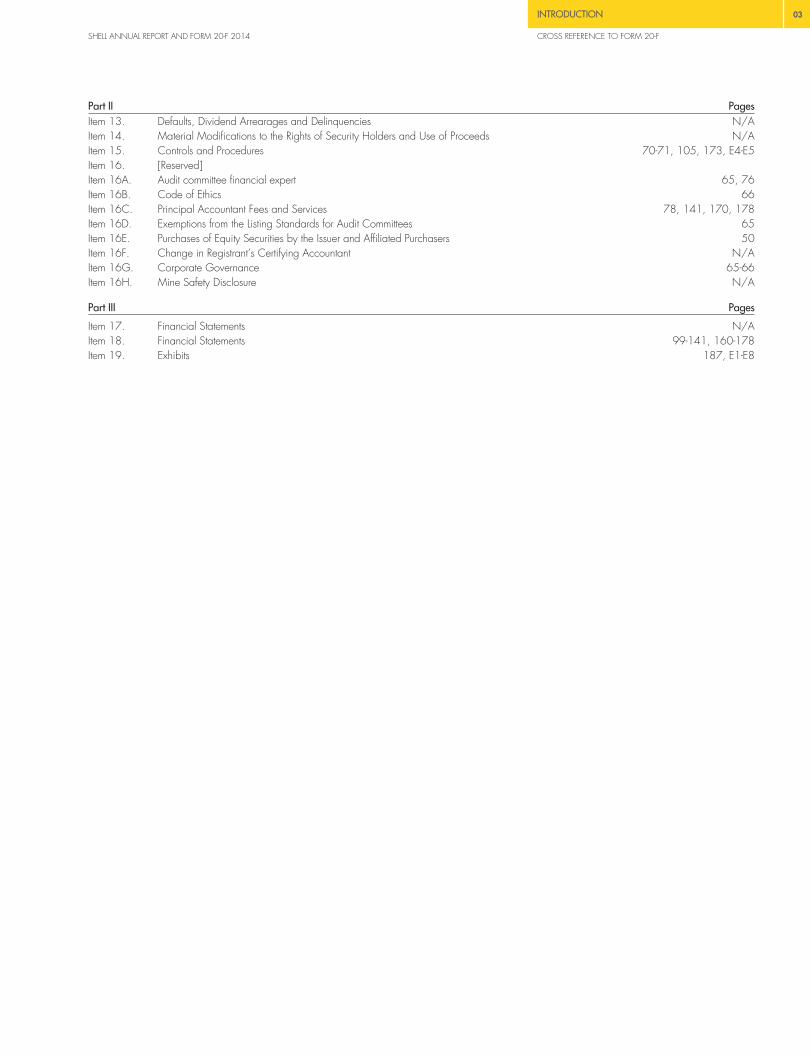
Part II PagesItem 13. Defaults, Dividend Arrearages and Delinquencies N/AItem 14. Material Modifications to the Rights of Security Holders and Use of Proceeds N/AItem 15. Controls and Procedures 70-71, 105, 173, E4-E5Item 16. [Reserved]Item 16A. Audit committee financial expert 65, 76Item 16B. Code of Ethics 66Item 16C. Principal Accountant Fees and Services 78, 141, 170, 178Item 16D. Exemptions from the Listing Standards for Audit Committees 65Item 16E. Purchases of Equity Securities by the Issuer and Affiliated Purchasers 50Item 16F. Change in Registrant’s Certifying Accountant N/AItem 16G. Corporate Governance 65-66Item 16H. Mine Safety Disclosure N/A
Part III Pages
Item 17. Financial Statements N/AItem 18. Financial Statements 99-141, 160-178Item 19. Exhibits 187, E1-E8

04 INTRODUCTION
TERMS AND ABBREVIATIONS SHELL ANNUAL REPORT AND FORM 20-F 2014
TERMS AND ABBREVIATIONSCURRENCIES
$ US dollar€ euro£ sterling
UNITS OF MEASUREMENT
acre approximately 0.004 square kilometresb(/d) barrels (per day)boe(/d) barrels of oil equivalent (per day); natural gas volumes are
converted to oil equivalent using a factor of 5,800 scfper barrel
kboe(/d) thousand barrels of oil equivalent (per day); natural gasvolumes are converted to oil equivalent using a factor of
5,800 scf per barrelMMBtu million British thermal unitsmtpa million tonnes per annumper day volumes are converted to a daily basis using a
calendar yearscf(/d) standard cubic feet (per day)
PRODUCTS
GTL gas to liquidsLNG liquefied natural gasLPG liquefied petroleum gasNGL natural gas liquids
MISCELLANEOUS
ADS American Depositary ShareAGM Annual General MeetingAPI American Petroleum InstituteCCS carbon capture and storageCCS earnings earnings on a current cost of supplies basisCO2 carbon dioxideDBP Deferred Bonus PlanEMTN euro medium-term noteEPS earnings per shareGAAP generally accepted accounting principlesHSSE health, safety, security and environmentIAS International Accounting StandardIFRS International Financial Reporting Standard(s)IPIECA the global oil and gas industry association for
environmental and social issuesLTIP Long-term Incentive PlanOGP International Association of Oil & Gas ProducersOML oil mining leaseOPEC Organization of the Petroleum Exporting CountriesPSC production-sharing contractPSP Performance Share PlanR&D research and developmentREMCO Remuneration CommitteeSEC US Securities and Exchange CommissionTRCF total recordable case frequencyTSR total shareholder returnWTI West Texas Intermediate

INTRODUCTION 05
SHELL ANNUAL REPORT AND FORM 20-F 2014 ABOUT THIS REPORT
ABOUT THIS REPORTThe Royal Dutch Shell plc Annual Report and Form 20-F (this Report)serves as the Annual Report and Accounts in accordance with UKrequirements and as the Annual Report on Form 20-F as filed with theUS Securities and Exchange Commission (SEC) for the year endedDecember 31, 2014, for Royal Dutch Shell plc (the Company) and itssubsidiaries (collectively referred to as Shell). This Report presents theConsolidated Financial Statements of Shell (pages 106-141), theParent Company Financial Statements of Shell (pages 162-170) andthe Financial Statements of the Royal Dutch Shell Dividend Access Trust(pages 174-178). Cross references to Form 20-F are set out onpages 2-3 of this Report.
Financial reporting terms used in this Report are in accordance withInternational Financial Reporting Standards (IFRS). The ConsolidatedFinancial Statements comprise the financial statements of the Companyand its subsidiaries. “Subsidiaries” and “Shell subsidiaries” refer tothose entities over which the Company has control, either directly orindirectly. Entities and unincorporated arrangements over which Shellhas joint control are generally referred to as “joint ventures” and “jointoperations” respectively, and entities over which Shell has significantinfluence but neither control nor joint control are referred to as“associates”.
In addition to the term “Shell”, in this Report “we”, “us” and “our” arealso used to refer to the Company and its subsidiaries in general or tothose who work for them. These terms are also used where no usefulpurpose is served by identifying the particular entity or entities. Theterm “Shell interest” is used for convenience to indicate the direct and/or indirect ownership interest held by Shell in an entity orunincorporated joint arrangement, after exclusion of all third-partyinterests.
Except as otherwise specified, the figures shown in the tables in thisReport are in respect of subsidiaries only, without deduction of anynon-controlling interest. However, the term “Shell share” is used forconvenience to refer to the volumes of hydrocarbons that areproduced, processed or sold through subsidiaries, joint ventures andassociates. All of a subsidiary’s production, processing or salesvolumes (including the share of joint operations) are included in theShell share, even if Shell owns less than 100% of the subsidiary. In thecase of joint ventures and associates, however, Shell-share figures arelimited only to Shell’s entitlement. In all cases, royalty payments in kindare deducted from the Shell share.
The financial statements contained in this Report have been preparedin accordance with the provisions of the Companies Act 2006 andwith IFRS as adopted by the European Union. As applied to thefinancial statements, there are no material differences from IFRS asissued by the International Accounting Standards Board (IASB);therefore, the financial statements have been prepared in accordancewith IFRS as issued by the IASB. IFRS as defined above includesinterpretations issued by the IFRS Interpretations Committee.
Except as otherwise noted, the figures shown in this Report are statedin US dollars. As used herein all references to “dollars” or “$” are tothe US currency.
This Report contains forward-looking statements (within the meaning ofthe US Private Securities Litigation Reform Act of 1995) concerning thefinancial condition, results of operations and businesses of Shell. Allstatements other than statements of historical fact are, or may bedeemed to be, forward-looking statements. Forward-looking statementsare statements of future expectations that are based on management’scurrent expectations and assumptions and involve known and unknownrisks and uncertainties that could cause actual results, performance orevents to differ materially from those expressed or implied in thesestatements. Forward-looking statements include, among other things,statements concerning the potential exposure of Shell to market risksand statements expressing management’s expectations, beliefs,estimates, forecasts, projections and assumptions. These forward-looking statements are identified by their use of terms and phrases suchas “anticipate”, “believe”, “could”, “estimate”, “expect”, “goals”,“intend”, “may”, “objectives”, “outlook”, “plan”, “probably”, “project”,“risks”, “schedule”, “seek”, “should”, “target”, “will” and similar termsand phrases. There are a number of factors that could affect the futureoperations of Shell and could cause those results to differ materiallyfrom those expressed in the forward-looking statements included in thisReport, including (without limitation): (a) price fluctuations in crude oiland natural gas; (b) changes in demand for Shell’s products;(c) currency fluctuations; (d) drilling and production results; (e) reservesestimates; (f) loss of market share and industry competition;(g) environmental and physical risks; (h) risks associated with theidentification of suitable potential acquisition properties and targets,and successful negotiation and completion of such transactions; (i) therisk of doing business in developing countries and countries subject tointernational sanctions; (j) legislative, fiscal and regulatorydevelopments including regulatory measures addressing climatechange; (k) economic and financial market conditions in variouscountries and regions; (l) political risks, including the risks ofexpropriation and renegotiation of the terms of contracts withgovernmental entities, delays or advancements in the approval ofprojects and delays in the reimbursement for shared costs; and(m) changes in trading conditions. Also see “Risk factors” for additionalrisks and further discussion. All forward-looking statements contained inthis Report are expressly qualified in their entirety by the cautionarystatements contained or referred to in this section. Readers should notplace undue reliance on forward-looking statements. Each forward-looking statement speaks only as of the date of this Report. Neither theCompany nor any of its subsidiaries undertake any obligation topublicly update or revise any forward-looking statement as a result ofnew information, future events or other information. In light of theserisks, results could differ materially from those stated, implied orinferred from the forward-looking statements contained in this Report.
This Report contains references to Shell’s website and to the ShellSustainability Report. These references are for the readers’ convenienceonly. Shell is not incorporating by reference any information posted onwww.shell.com or in the Shell Sustainability Report.
DOCUMENTS ON DISPLAYDocuments concerning the Company, or its predecessors for reportingpurposes, which are referred to in this Report have been filed with theSEC and may be examined and copied at the public reference facilitymaintained by the SEC at 100 F Street, N.E., Room 1580,Washington, DC 20549, USA. For further information on theoperation of the public reference room and the copy charges, call theSEC at 1-800-SEC-0330. All of the SEC filings made electronically byShell are available to the public on the SEC website at www.sec.gov(commission file number 001-32575). This Report is also available,free of charge, at www.shell.com/annualreport or at the offices ofShell in The Hague, the Netherlands and London, United Kingdom.Copies of this Report also may be obtained, free of charge, by mail.
06 STRATEGIC REPORT
CHAIRMAN’S MESSAGE SHELL ANNUAL REPORT AND FORM 20-F 2014
STRATEGIC REPORTCHAIRMAN’S MESSAGEThe energy landscape has fundamentally transformed in the nearly nineyears that I have served as Chairman.
Technological advances have enabled a surge in gas and oilproduction from deep beneath the ocean and unlocked important newshale resources over the last few years, for example.
Shell plans to continue to invest in innovative technology, talentedpeople and the development of new energy sources that will be vital tomeet rising long-term demand, while limiting carbon emissions.
But the short-term outlook for energy markets is uncertain.
The International Monetary Fund (IMF) estimates that the worldeconomy grew by 3.3% in 2014, unchanged from 2013. In January2015, the IMF revised its forecast for 2015 down from 3.8% to 3.5%,pointing to concerns over the Russian and eurozone economies,combined with slowing growth in China.
Concerns over economic growth, coupled with buoyant global oilproduction, drove a decline in crude oil prices during the second halfof 2014, ending a three-year spell of relatively high prices. Althoughthe Brent crude oil price averaged $99 per barrel in 2014, downfrom $109 in 2013, it ended the year at $55.
Shell will continue to look carefully at how and where to allocatecapital in an economic environment that remains fragile.
A sustained period of low oil prices could, of course, challenge theeconomics of some of our planned projects and make them lessattractive. But we must continue to take a long-term view in a worldwhere energy demand continues to rise.
ROBUST STRATEGYIn 2014, our steps to improve capital discipline helped deliver solidreturns to shareholders. We delivered strong cash flow for the yearand also completed our programme of divesting some parts of ourportfolio ahead of schedule and before oil prices fell in the second halfof the year.
Our strong balance sheet allows us to continue to invest, despite short-term price volatility, while our emphasis on employing innovativetechnologies will help make our new projects competitive sources ofsupply.
Many new energy resources will be needed in the longer term. Globalprimary energy demand could grow by 37% from 2012 to 2040,according to the International Energy Agency (IEA).
The IEA expects renewable energy to meet an increasing share ofglobal energy needs. But its central scenario, which takes into accountexisting government commitments and plans, points to a 14% rise in oilconsumption and a 55% rise in gas consumption by 2040.
Gas will be increasingly in demand partly because of the importantrole it can play in reducing carbon emissions when replacing coal,particularly in power plants.
Becoming the most competitive and innovative gas supplier has been aclear strategic goal for Shell throughout my time as Chairman,especially in liquefied natural gas (LNG), which is now central to theglobal trade in gas. Shell has evolved from being predominantly an oilproducer to a company that produces more gas than oil.
We are building a large floating LNG production facility, calledPrelude, which will help access gas resources in remote waters.Prelude is one example of the technological advances we are makingto help meet future demand.
Our deep-water technology is another. It enabled us to start productionin 2014 at major projects in the Gulf of Mexico and off the coasts ofMalaysia and Nigeria.
Through our joint venture Raízen in Brazil, we are also now one of theworld’s largest producers of low-carbon biofuel.
CLIMATE CHANGEIt is clear that new technologies will be needed to tackle climatechange effectively. For example, carbon capture and storage (CCS)technology to store carbon dioxide (CO2) safely underground couldsubstantially reduce the amount of CO2 emitted in energy production atlower cost than many other technologies.
But widespread government and industry support is needed to ensurethat enough CCS plants are built around the world to make asubstantial contribution to the wider drive to reduce CO2.
All sectors of society must work together to combat climate changeeffectively. One vital and pressing step is to set up effective systems forputting a price on carbon emissions. It is an efficient way to encouragecompanies to change their activities in ways that have a deep andlasting impact on emissions.
I was encouraged to hear at the United Nations (UN) Climate Summitin New York in September 2014 that the need for effective carbonpricing systems had broad support. I hope that significant progress canbe made on this at the crucial UN Climate Change Conference inParis in December 2015.
INNOVATION AND INNOVATORSI have had the privilege of working with many talented, creative andforward-thinking people at Shell. Their focus on developing innovativeways to produce and refine new energy resources should benefit ourshareholders and customers in the years ahead by keeping ourproducts competitive in any economic environment.
Perhaps the best example is the Pearl gas-to-liquids (GTL) complex inQatar. The final decision to go ahead with the project was taken atthe first Board meeting I chaired in 2006. Back then, there was somescepticism, outside Shell at least, about the project’s ambitious scopeand viability as a major investment.
We proved the sceptics wrong. Today we know that a GTL project onthis scale, it is the largest such plant in the world, does work.Watching Pearl develop and seeing its products now benefitingcustomers around the world has been one of the most rewardingexperiences during my time at Shell.
Pearl’s success underscores the importance of continuing our strategyof making disciplined investments in key projects and newtechnologies. This is how we can compete more effectively on theglobal stage as we continue to create value for our customers, partnersand investors.
Jorma OllilaChairman

STRATEGIC REPORT 07
SHELL ANNUAL REPORT AND FORM 20-F 2014 CHIEF EXECUTIVE OFFICER’S REVIEW
CHIEF EXECUTIVE OFFICER’SREVIEW
After my first year as Chief Executive Officer, I am pleased to see thatwe are delivering on our three key priorities of improved financialperformance, enhanced capital efficiency and continued strong projectdelivery.
We have come a long way. Shell’s earnings on a current cost ofsupplies basis attributable to shareholders improved in 2014compared with 2013, largely thanks to our prudent investment strategyand delivery of major new projects around the world.
We achieved these better results despite the fall in oil prices during thesecond half of 2014, a decline mainly caused by plentiful supply andweak global demand.
Our improved operational performance, prudent spending and sales ofassets that are not central to our strategy helped us enter this period oflow oil prices from a position of strength.
But there is still work to be done. I want to see more competitiveperformance across Shell in 2015 and beyond.
We continued our focus on safety, but sadly five people working forShell in 2014 lost their lives. There was also an explosion at ourMoerdijk chemical plant in the Netherlands, but thankfully it caused noserious injuries.
Tragically, we lost four colleagues and eight of their family members inthe Malaysia Airlines disaster over Ukraine in July. That was a deeplysaddening experience for all.
2014 MILESTONESFor 2014, our earnings on a current cost of supplies basis attributable toshareholders were $19 billion, which included impairments of $5 billionand gains on divestments of $2 billion, compared with $17 billion in2013, which included impairments of $4 billion. Net cash flow fromoperating activities rose to $45 billion from $40 billion in 2013.
We reduced our capital investment from $46 billion in 2013 to$37 billion.
Underlining our ongoing commitment to shareholder returns, wedistributed $12 billion to shareholders in dividends, including thosetaken as shares under our Scrip Dividend Programme, and spent$3 billion on share repurchases in 2014. This compares with$11 billion of dividends and $5 billion of share repurchases in 2013.
Our Upstream earnings rose from 2013 to 2014, reflecting improvedoperational performance and the start of production from new deep-water projects. These included Gumusut-Kakap in Malaysia, which isexpected to produce up to 135 thousand barrels per day of oilequivalent (boe/d) and the 40 thousand boe/d Bonga North Westdevelopment off the coast of Nigeria. We also began production fromthe Cardamom and Olympus platforms in the Gulf of Mexico. However,production from new projects was more than offset by the expiry of alicence in Abu Dhabi and the impact of asset sales. Our oil and gasproduction averaged 3.1 million boe/d in 2014, 4% less than in 2013.
The integration of the Repsol liquefied natural gas (LNG) businessesacquired in January helped boost our LNG sales to 24 million tonnes,up 22% on 2013.
It was a good year for our exploration drive, with 10 notablediscoveries. The resources we uncovered – including in the USA,Gabon and Malaysia – could be important sources of gas and oil fordecades to come.
We continued to streamline our Downstream operations, selling mostof our businesses in Australia and Italy, for example. While there issome growth potential in businesses such as chemicals, lubricants andin China, we continue to look for opportunities to reduce our costs andoptimise our Downstream portfolio.
PRUDENT PATH OF GROWTHThe fall in oil prices in 2014 was part of the volatility our industry hasalways faced. But it underlined the importance of being selective in ourinvestments and keeping a tight grip on costs.
Divestments, together with the initial public offering in Shell MidstreamPartners, L.P., generated $15 billion in proceeds in 2014. Theyincluded shale oil and gas interests in North America and downstreambusinesses in several countries, meeting our target for 2014-15 wellahead of schedule. We plan to continue to divest assets in 2015.
To improve returns and control costs during this period of low prices,we have also reduced our potential spending on organic growth by$15 billion for 2015-2017. For example, together with our partnersQatar Petroleum, we have decided not to proceed with the proposedAl Karaana petrochemicals project in Qatar because it is too costly inthe current environment.
We expect organic capital investment to be lower in 2015 than 2014levels of around $35 billion. But we want to preserve our growth toensure we continue to generate cash flow and dividends for ourshareholders. That is why we are still planning to invest ineconomically-sound projects this year in key growth areas, such asdeep water and LNG.
Clearly, we do not want to miss future growth opportunities simplybecause they may seem unaffordable in the low oil price world we seetoday.
However, in this period of economic uncertainty, we also need toremain cautious and are prepared to curb spending further ifwarranted by the evolving market outlook.
STRONG LONG-TERM DEMANDIn the long term, we expect demand for energy to continue to rise aspopulations and prosperity increase. Billions of people across thedeveloping world need better access to energy to improve their lives.
We expect the global energy supply mix to evolve significantly in thedecades ahead with gas, the cleanest-burning fossil fuel, becomingmore widely used for power generation. While we expect renewablessuch as wind, solar and biofuels to play an increasing role, oil andgas will be vital to meet the considerable expected increase in energydemand.
At the same time, the need to tackle climate change requires effectivepolicies that help meet the world’s energy needs while significantlyreducing carbon dioxide (CO2) emissions.
Facilities to capture and store CO2 should be a key part of the globalsolution. Our Quest project to capture and safely store CO2 from aCanadian oil sands facility is expected to be completed in 2015. Weare also planning a carbon capture and storage (CCS) facility at thePeterhead gas-fired power plant in the UK.

08 STRATEGIC REPORT
CHIEF EXECUTIVE OFFICER’S REVIEW SHELL ANNUAL REPORT AND FORM 20-F 2014
CHIEF EXECUTIVE OFFICER’S REVIEWCONTINUED
Effective carbon-pricing systems are needed. They can drive a shiftfrom coal- to gas-fired power generation, encourage greater energyefficiency and create the frameworks for the widespread use of CCS.
In the shorter term, the world economy is going through a period ofrelatively slow growth. There is no change in the long-term outlook forenergy demand, however, as the global population rises and livingstandards improve.
We will continue our strategy of strengthening our position as a leaderin the oil and gas industry while supplying energy in a responsibleway.
By stepping up our drive to improve our financial performance andcontinuing to invest in good projects and opportunities, we areworking hard to add more value for our shareholders.
This may mean making tough choices during a testing time for theenergy industry. But it will help Shell deliver where it matters – thebottom line. I am determined that we can and will combine thedisciplined pursuit of efficiency today with a vision of long-termsustainability which will secure our leadership role in the decades tocome.
Ben van BeurdenChief Executive Officer
STRATEGIC REPORT 09
SHELL ANNUAL REPORT AND FORM 20-F 2014 BUSINESS OVERVIEW
BUSINESS OVERVIEWHISTORYFrom 1907 until 2005, Royal Dutch Petroleum Company and The“Shell” Transport and Trading Company, p.l.c. were the two publicparent companies of a group of companies known collectively as the“Royal Dutch/Shell Group”. Operating activities were conductedthrough the subsidiaries of these parent companies. In 2005, RoyalDutch Shell plc became the single parent company of Royal DutchPetroleum Company and of The “Shell” Transport and TradingCompany, p.l.c., now The Shell Transport and Trading CompanyLimited.
Royal Dutch Shell plc (the Company) is a public limited companyregistered in England and Wales and headquartered in The Hague,the Netherlands.
ACTIVITIESShell is one of the world’s largest independent oil and gas companiesin terms of market capitalisation, operating cash flow and production.We aim for strong operational performance and productiveinvestments around the world.
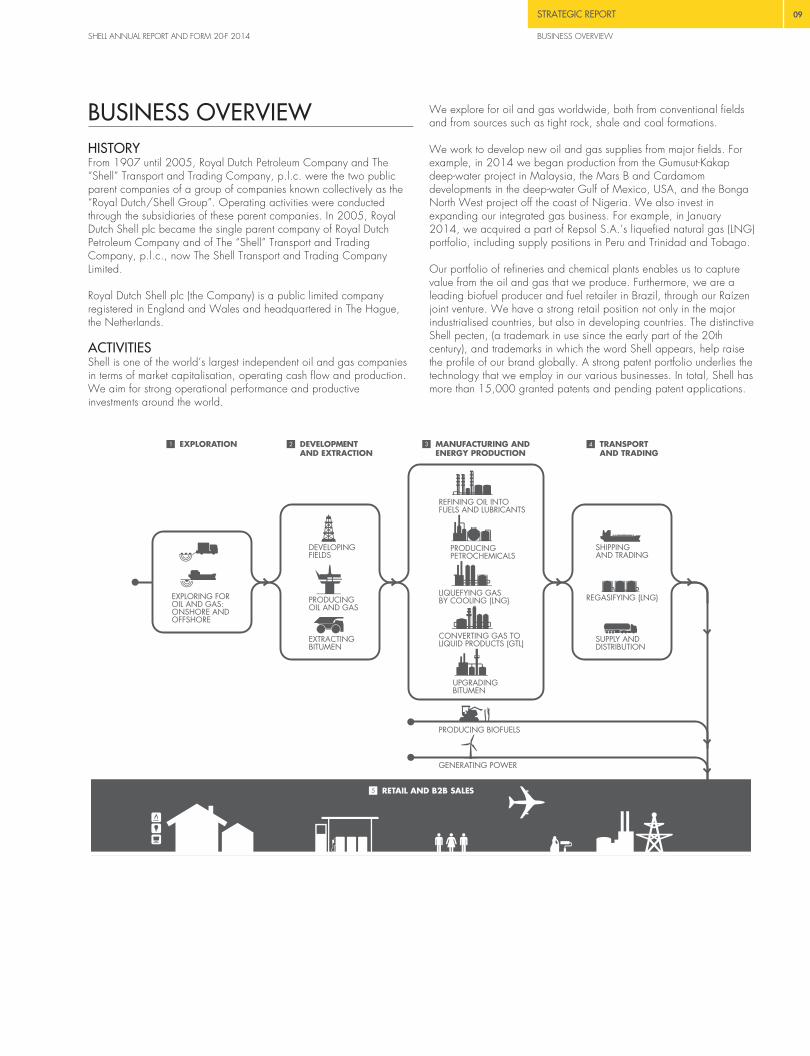
We explore for oil and gas worldwide, both from conventional fieldsand from sources such as tight rock, shale and coal formations.
We work to develop new oil and gas supplies from major fields. Forexample, in 2014 we began production from the Gumusut-Kakapdeep-water project in Malaysia, the Mars B and Cardamomdevelopments in the deep-water Gulf of Mexico, USA, and the BongaNorth West project off the coast of Nigeria. We also invest inexpanding our integrated gas business. For example, in January2014, we acquired a part of Repsol S.A.’s liquefied natural gas (LNG)portfolio, including supply positions in Peru and Trinidad and Tobago.
Our portfolio of refineries and chemical plants enables us to capturevalue from the oil and gas that we produce. Furthermore, we are aleading biofuel producer and fuel retailer in Brazil, through our Raízenjoint venture. We have a strong retail position not only in the majorindustrialised countries, but also in developing countries. The distinctiveShell pecten, (a trademark in use since the early part of the 20thcentury), and trademarks in which the word Shell appears, help raisethe profile of our brand globally. A strong patent portfolio underlies thetechnology that we employ in our various businesses. In total, Shell hasmore than 15,000 granted patents and pending patent applications.
GENERATING POWER
PRODUCING BIOFUELS
DEVELOPING FIELDS
PRODUCING OIL AND GAS
EXTRACTINGBITUMEN
EXPLORING FOR OIL AND GAS: ONSHORE AND OFFSHORE
PRODUCING PETROCHEMICALS
REFINING OIL INTO FUELS AND LUBRICANTS
CONVERTING GAS TO LIQUID PRODUCTS (GTL)
LIQUEFYING GAS BY COOLING (LNG)
UPGRADINGBITUMEN
SHIPPING AND TRADING
SUPPLY AND DISTRIBUTION
REGASIFYING (LNG)

10 STRATEGIC REPORT
BUSINESS OVERVIEW SHELL ANNUAL REPORT AND FORM 20-F 2014
BUSINESS OVERVIEW CONTINUED
BUSINESSES AND ORGANISATION
Upstream InternationalOur Upstream International business manages Shell’s Upstreamactivities outside the Americas. It explores for and recovers crude oil,natural gas and natural gas liquids, transports oil and gas, andoperates the upstream and midstream infrastructure necessary to deliveroil and gas to market. Upstream International also manages the LNGand GTL businesses outside the Americas, and markets and tradesnatural gas, including LNG, outside the Americas. It manages itsoperations primarily by line of business, with this structure overlayingcountry organisations. This organisation is supported by activities suchas Exploration and New Business Development.
Upstream AmericasOur Upstream Americas business manages Shell’s Upstream activitiesin North and South America. It explores for and recovers crude oil,natural gas and natural gas liquids, transports oil and gas andoperates the upstream and midstream infrastructure necessary to deliveroil and gas to market. Upstream Americas also extracts bitumen fromoil sands that is converted into synthetic crude oil. It manages the LNGbusiness in the Americas, including assets in Peru and Trinidad andTobago acquired in 2014. It also markets and trades natural gas inthe Americas. Additionally, it manages the US-based wind business. Itmanages its operations by line of business, supported by activities suchas Exploration and New Business Development.
DownstreamOur Downstream business manages Shell’s refining and marketingactivities for oil products and chemicals. These activities are organisedinto globally managed classes of business. Refining includesmanufacturing, supply and shipping of crude oil. Marketing sells arange of products including fuels, lubricants, bitumen and liquefiedpetroleum gas (LPG) for home, transport and industrial use. Chemicalsproduces and markets petrochemicals for industrial customers,including the raw materials for plastics, coatings and detergents.Downstream also trades Shell’s hydrocarbons and other energy-relatedproducts, supplies the Downstream businesses and provides shippingservices. Additionally, Downstream oversees Shell’s interests inalternative energy (including biofuels but excluding wind).
Projects & TechnologyOur Projects & Technology organisation manages the delivery ofShell’s major projects and drives research and innovation to createtechnology solutions. It provides technical services and technologycapability covering both Upstream and Downstream activities. It is alsoresponsible for providing functional leadership across Shell in the areasof safety and environment, contracting and procurement, and for allwells activities and CO2 management.
SEGMENTAL REPORTINGOur reporting segments are Upstream, Downstream and Corporate.Upstream combines the operating segments Upstream International andUpstream Americas. Upstream and Downstream earnings include theirrespective elements of Projects & Technology and of trading activities.Corporate comprises Shell’s holdings and treasury organisation,
including its self-insurance activities as well as its headquarters andcentral functions. See Note 2 to the “Consolidated FinancialStatements”.
REVENUE BY BUSINESS SEGMENT( INCLUDING INTER-SEGMENT SALES) $ MILLION
2014 2013 2012Upstream
Third parties 45,240 47,357 43,431Inter-segment 47,059 45,512 51,119
Total 92,299 92,869 94,550Downstream
Third parties 375,752 403,725 423,638Inter-segment 2,294 702 772
Total 378,046 404,427 424,410Corporate
Third parties 113 153 84Total 113 153 84
REVENUE BY GEOGRAPHICAL AREA(EXCLUDING INTER-SEGMENT SALES) $ MILLION
2014 % 2013 % 2012 %Europe 154,709 36.7 175,584 38.9 184,223 39.4Asia, Oceania,
Africa 149,869 35.6 157,673 34.9 156,310 33.5USA 70,813 16.8 72,552 16.1 91,571 19.6Other Americas 45,714 10.9 45,426 10.1 35,049 7.5Total 421,105 100.0 451,235 100.0 467,153 100.0
RESEARCH AND DEVELOPMENTInnovative technology provides ways for Shell to stand apart from itscompetitors. It helps our current businesses perform, and it makes futurebusinesses possible.
Since 2007, we have spent more to research and develop innovativetechnology than any other international oil and gas company. In2014, research and development (R&D) expenses were $1,222million, slightly down from $1,318 million in 2013 and$1,307 million in 2012.
Such levels of investment in R&D enable us to advance technologiesthat help us access new resources and better meet the needs of ourcustomers and partners. This includes: seismic processing andvisualisation software that reveal previously unnoticed geologicaldetails; drilling-rig equipment that delivers wells more quickly and moresafely; oil-recovery methods that increase production from fields;processes that refine crude oil and liquefy natural gas more efficiently;as well as fuel and lubricant formulations that perform better.
As in 2014, in 2015 we continue to focus strongly on technologiesthat support our various businesses and reduce the environmentalfootprint of our operations and products.

STRATEGIC REPORT 11
SHELL ANNUAL REPORT AND FORM 20-F 2014 RISK FACTORS
RISK FACTORSThe risks discussed below could have a material adverse effectseparately, or in combination, on our operational performance,earnings, cash flows and financial condition. Accordingly, investorsshould carefully consider these risks.
We are exposed to fluctuating prices of crude oil, natural gas, oilproducts and chemicals.Prices of crude oil, natural gas, oil products and chemicals are affectedby supply and demand, both globally and regionally. Moreover, pricesfor oil and gas can move independently from each other. Factors thatinfluence supply and demand include operational issues, natural disasters,weather, political instability, conflicts, economic conditions and actions bymajor oil-producing countries. Price fluctuations could have a materialeffect on our business, including on our cash flows and earnings. Forexample, in a low oil and gas price environment, Shell would generateless revenue from its Upstream production, and as a result some long-termprojects might become less profitable, or even incur losses. Additionally,low oil and gas prices could result in the debooking of proved oil or gasreserves, if they become uneconomic in this type of environment.Prolonged periods of low oil and gas prices, or rising costs, could result inprojects being delayed or cancelled and/or in the impairment of someassets. They may also impact our ability to maintain our long-terminvestment programme. In a high oil and gas price environment, we couldexperience sharp increases in costs, and under some production-sharingcontracts our entitlement to proved reserves would be reduced. Higherprices could also reduce demand for our products which might result inlower profitability, particularly in our Downstream business.
Our ability to deliver competitive returns and pursue commercialopportunities depends in part on the robustness and, ultimately, theaccuracy of our price assumptions.Shell reviews the oil and gas price assumptions it uses to evaluateproject decisions and commercial opportunities on a periodic basis.We generally test projects and other opportunities against a long-termprice range of $70-110 per barrel for Brent crude oil and$3.5-5.0 per million British thermal units for gas at the Henry Hub.While we believe our current long-term price assumptions are prudent,if such assumptions proved to be incorrect it could have a materialadverse effect on Shell. For near-term planning purposes, we stresstest the financial framework against a wider range of prices.
Our ability to achieve strategic objectives depends on how we react tocompetitive forces.We face competition in each of our businesses. While we seek todifferentiate our products, many of them are competing in commodity-type markets. If we do not manage our expenses adequately, our costefficiency could deteriorate and our unit costs may increase. This inturn could erode our competitive position. Increasingly, we competewith government-run oil and gas companies, particularly in seekingaccess to oil and gas resources. Today, these government-runcompanies control vastly greater quantities of oil and gas resourcesthan the major, publicly held oil and gas companies. Government-runentities have access to significant resources and may be motivated bypolitical or other factors in their business decisions, which may harmour competitive position or hinder our access to desirable projects.
As our business model involves treasury and trading risks, we areaffected by the global macroeconomic environment as well as financialand commodity market conditions.Shell subsidiaries, joint ventures and associates are subject to differingeconomic and financial market conditions throughout the world.Political or economic instability affects such markets. Shell uses debtinstruments such as bonds and commercial paper to raise significantamounts of capital. Should our access to debt markets become moredifficult, the potential impact on our liquidity could have an adverse
effect on our operations. Commodity trading is an important componentof our Upstream and Downstream businesses and is integrated with oursupply business. Treasury and trading risks include, among others,exposure to movements in interest rates, foreign exchange rates andcommodity prices, counterparty default and various operational risks. Asa global company doing business in more than 70 countries, we areexposed to changes in currency values and exchange controls. Whilewe undertake some currency hedging, we do not do so for all of ouractivities. See Notes 6 and 19 to the “Consolidated FinancialStatements”. Shell has significant financial exposure to the euro andcould be materially affected by a significant change in its value or anystructural changes to the European Union (EU) or the European Economicand Monetary Union affecting the euro. While we do not havesignificant direct exposure to sovereign debt, it is possible that ourpartners and customers may have exposure which could impair theirability to meet their obligations to us. Therefore, a sovereign debtdowngrade or default could have a material adverse effect on Shell.
Our future hydrocarbon production depends on the delivery of large andcomplex projects, as well as on our ability to replace proved oil and gasreserves.We face numerous challenges in developing capital projects,especially large ones. Challenges include uncertain geology, frontierconditions, the existence and availability of necessary technology andengineering resources, availability of skilled labour, project delays,expiration of licences and potential cost overruns, as well as technical,fiscal, regulatory, political and other conditions. These challenges areparticularly relevant in certain developing and emerging marketcountries, such as Iraq and Kazakhstan, and in frontier areas, such asthe Arctic. Such potential obstacles may impair our delivery of theseprojects, as well as our ability to fulfil related contractual commitments.Future oil and gas production will depend on our access to newproved reserves through exploration, negotiations with governmentsand other owners of proved reserves and acquisitions, as well asdeveloping and applying new technologies and recovery processes toexisting fields and mines. Failure to replace proved reserves couldresult in lower future production, cash flow and earnings.
In 2014, we have reduced our tight-gas and liquids-rich shaleportfolio. If future well results do not meet our expectations, there couldbe additional asset sales and/or impairments.
OIL AND GAS PRODUCTIONAVAILABLE FOR SALE MILLION BOE [A]
2014 2013 2012Shell subsidiaries 895 850 825Shell share of joint ventures and
associates 229 318 369Total 1,124 1,168 1,194
[A] Natural gas volumes are converted to oil equivalent using a factor of 5,800 scf per barrel.
PROVED DEVELOPED AND UNDEVELOPED OILAND GAS RESERVES [A][B] (AT DECEMBER 31) MILLION BOE [C]
2014 2013 2012Shell subsidiaries 10,181 10,835 9,873Shell share of joint ventures and
associates 2,900 3,109 3,701Total 13,081 13,944 13,574Attributable to non-
controlling interest [D] 11 12 18Attributable to Royal Dutch Shell
plc shareholders 13,070 13,932 13,556
[A] We manage our total proved reserves base without distinguishing between proved reservesfrom subsidiaries and those from joint ventures and associates.[B] Includes proved reserves associated with future production that will be consumed in operations.[C] Natural gas volumes are converted to oil equivalent using a factor of 5,800 scf per barrel.[D] Proved reserves attributable to non-controlling interest in Shell subsidiaries.

12 STRATEGIC REPORT
RISK FACTORS SHELL ANNUAL REPORT AND FORM 20-F 2014
RISK FACTORS CONTINUED
An erosion of our business reputation would have a negative impact onour brand, our ability to secure new resources and our licence to operate.Shell is one of the world’s leading energy brands, and its brand andreputation are important assets. The Shell General Business Principles(Principles) govern how Shell and its individual companies conducttheir affairs, and the Shell Code of Conduct (Code) instructs employeesand contractors on how to behave in line with the Principles. Ourchallenge is to ensure that all employees and contractors, more than100,000 in total, comply with these Principles and Code. Failure –real or perceived – to follow these Principles, or other real orperceived failures of governance or regulatory compliance, could harmour reputation. This could impact our licence to operate, damage ourbrand, harm our ability to secure new resources and limit our ability toaccess the capital markets. Many other factors may impact ourreputation, including those discussed in several of the other risk factors.
Our future performance depends on the successful development anddeployment of new technologies.Technology and innovation are essential to Shell to meet the world’senergy demands in a competitive way. If we do not develop the righttechnology, do not have access to it or do not deploy it effectively, thedelivery of our strategy and our licence to operate may be adverselyaffected. We operate in environments where the most advancedtechnologies are needed. While these technologies are regarded as safefor the environment with today’s knowledge, there is always the possibilityof unknown or unforeseeable environmental impacts that could harm ourreputation, licence to operate or expose us to litigation or sanctions.
Rising climate change concerns could lead to additional regulatorymeasures that may result in project delays and higher costs.In the future, in order to help meet the world’s energy demand, weexpect our production to rise and more of our production to come fromhigher energy-intensive sources than at present. Therefore, it isexpected that both the CO2 intensity of our production, as well as ourabsolute Upstream CO2 emissions, will increase as our businessgrows. Examples of such developments are our in-situ Peace Riverproject and our oil sands activities in Canada. Additionally, asproduction from Iraq increases, we expect that CO2 emissions fromflaring will rise as long as no gas gathering systems are in place. Wecontinue to work with our partners to find ways to capture the gas thatis flared. Over time, we expect that a growing share of our CO2
emissions will be subject to regulation and result in increasing ourcosts. Furthermore, continued and increased attention to climatechange, including activities by non-governmental and politicalorganisations, as well as more interest by the broader public, is likelyto lead to additional regulations designed to reduce greenhouse gasemissions. If we are unable to find economically viable, as well aspublicly acceptable, solutions that reduce our CO2 emissions for newand existing projects or products, we may experience additional costs,delayed projects, reduced production and reduced demand forhydrocarbons.
The nature of our operations exposes the communities in which we workand us to a wide range of health, safety, security and environment risks.The health, safety, security and environment (HSSE) risks to which weare potentially exposed cover a wide spectrum, given the geographicrange, operational diversity and technical complexity of Shell’s dailyoperations. We have operations, including oil and gas production,transport and shipping of hydrocarbons, and refining, in difficultgeographies or climate zones, as well as environmentally sensitiveregions, such as the Arctic or maritime environments, especially indeep water. These and other operations expose the communities inwhich we work and us to the risk, among others, of major processsafety incidents, effects of natural disasters, earth tremors, social unrest,personal health and safety lapses, and crime. If a major HSSE risk
materialises, such as an explosion or hydrocarbon spill, this couldresult in injuries, loss of life, environmental harm, disruption to businessactivities and, depending on their cause and severity, materialdamage to our reputation, exclusion from bidding on mineral rightsand eventually loss of licence to operate. In certain circumstances,liability could be imposed without regard to Shell’s fault in the matter.Requirements governing HSSE matters often change and are likely tobecome more stringent over time. The operator could be asked toadjust its future production plan, as we have seen in the Netherlands,impacting production and costs. We could incur significant additionalcosts in the future complying with such requirements or as a result ofviolations of, or liabilities under, HSSE laws and regulations, such asfines, penalties, clean-up costs and third-party claims.
Shell mainly self-insures its risk exposures.Shell insurance subsidiaries provide hazard insurance coverage toShell entities. While from time to time the insurance subsidiaries mayseek reinsurance for some of their risk exposures, such reinsurancewould not provide any material coverage in the event of an incidentlike BP Deepwater Horizon. Similarly, in the event of a materialenvironmental incident, there would be no material proceeds availablefrom third-party insurance companies to meet Shell’s obligations.
A further erosion of the business and operating environment in Nigeriawould adversely impact Shell.In our Nigerian operations we face various risks and adverseconditions, some of which deteriorated during 2014. These risks andconditions include: security issues surrounding the safety of our people,host communities and operations; sabotage and theft; our ability toenforce existing contractual rights; litigation; limited infrastructure;potential legislation that could increase our taxes or costs ofoperations; the impact of lower oil and gas prices on the governmentbudget; and regional instability created by militant activities. TheNigerian government is contemplating new legislation to govern thepetroleum industry which, if passed into law, would likely have asignificant adverse impact on Shell’s existing and future activities in thatcountry.
We operate in more than 70 countries that have differing degrees ofpolitical, legal and fiscal stability. This exposes us to a wide range ofpolitical developments that could result in changes to laws andregulations. In addition, Shell and its joint ventures and associates facethe risk of litigation and disputes worldwide.Developments in politics, laws and regulations can – and do – affectour operations. Potential developments include: forced divestment ofassets; expropriation of property; cancellation or forced renegotiationof contract rights; additional taxes including windfall taxes, restrictionson deductions and retroactive tax claims; trade controls; local contentrequirements; foreign exchange controls; and changing environmentalregulations and disclosure requirements. In our Upstream activitiesthese developments can and do affect land tenure, re-writing of leases,entitlement to produced hydrocarbons, production rates, royalties andpricing. Parts of our Downstream activities are subject to price controlsin some countries. From time to time, cultural and political factors playa role in unprecedented and unanticipated judicial outcomes thatcould adversely affect Shell. If we do not comply with policies andregulations, this may result in regulatory investigations, litigation andultimately sanctions.
Certain governments and regulatory bodies have, in the opinion ofShell, exceeded their constitutional authority by attempting unilaterallyto amend or cancel existing agreements or arrangements; by failing tohonour existing contractual commitments; and by seeking to adjudicatedisputes between private litigants. Additionally, certain governmentshave adopted laws and regulations that could potentially force us toviolate other countries’ laws and regulations, thus potentially subjectingus to both criminal and civil sanctions.

STRATEGIC REPORT 13
SHELL ANNUAL REPORT AND FORM 20-F 2014 RISK FACTORS
Our operations expose us to social instability, civil unrest, terrorism,piracy, acts of war and risks of pandemic diseases that could have anadverse impact on our business.As seen in recent years in Nigeria, north Africa and the Middle East,social and civil unrest, both in the countries in which we operate andelsewhere, can – and does – affect Shell. Such potential developmentsthat could impact our business include acts of political or economicterrorism, acts of piracy on the high seas, conflicts including war, civilunrest (including disruptions by non-governmental and politicalorganisations), and local security concerns that threaten the safeoperation of our facilities and transport of our products. The risks ofpandemic diseases, such as Ebola, can impact our operations directlyand indirectly. If such risks materialise, they could result in injuries anddisruption to business activities.
We rely heavily on information technology systems for our operations.The operation of many of our business processes depends on theavailability of information technology (IT) systems. Our IT systems areincreasingly concentrated in terms of geography, number of systems,and key contractors supporting the delivery of IT services. Shell, likemany other multinational companies, is the target of attempts to gainunauthorised access through the internet to our IT systems, includingmore sophisticated and coordinated attempts often referred to asadvanced persistent threats. Shell seeks to detect and investigate allsuch security incidents, aiming to prevent their recurrence. Disruption ofcritical IT services, or breaches of information security, could haveadverse consequences for Shell.
We have substantial pension commitments, whose funding is subject tocapital market risks.Liabilities associated with defined benefit plans can be significant, ascan the cash funding of such plans; both depend on variousassumptions. Volatility in capital markets, and the resultingconsequences for investment performance and interest rates, may resultin significant changes to the funding level of future liabilities. In case ofa shortfall, Shell might be required to make substantial cashcontributions, depending on the applicable local regulations. SeeNote 17 to the “Consolidated Financial Statements”.
The estimation of proved oil and gas reserves involves subjectivejudgements based on available information and the application ofcomplex rules, so subsequent downward adjustments are possible.The estimation of proved oil and gas reserves involves subjectivejudgements and determinations based on available geological,technical, contractual and economic information. Estimates may changebecause of new information from production or drilling activities, orchanges in economic factors, including changes in the price of oil or gasand changes in the taxation or regulatory policies of host governments orother events. Estimates may also be altered by acquisitions anddivestments, new discoveries, and extensions of existing fields andmines, as well as the application of improved recovery techniques.Published proved oil and gas reserves estimates may also be subject tocorrection due to errors in the application of published rules and changesin guidance. Any downward adjustment would indicate lower futureproduction volumes and may lead to impairment of some assets.
Many of our major projects and operations are conducted in jointarrangements or associates. This may reduce our degree of control, aswell as our ability to identify and manage risks.In cases where we are not the operator we have limited influence over,and control of, the behaviour, performance and costs of operation ofsuch joint arrangements or associates. Despite not having control, wecould still be exposed to the risks associated with these operations,including reputational, litigation (where joint and several liability mayapply) and government sanction risks. For example, our partners ormembers of a joint arrangement or an associate (particularly localpartners in developing countries) may not be able to meet theirfinancial or other obligations to the projects, threatening the viability ofa given project.
Violations of antitrust and competition law carry fines and expose usand/or our employees to criminal sanctions and civil suits.Antitrust and competition laws apply to Shell and its joint ventures andassociates in the vast majority of countries in which we do business. Shelland its joint ventures and associates have been fined for violations ofantitrust and competition law. These include a number of fines in the pastby the European Commission Directorate-General for Competition (DGCOMP). Due to the DG COMP’s fining guidelines, any future convictionof Shell and its joint ventures or associates for violation of EU competitionlaw could result in significantly larger fines. Violation of antitrust laws is acriminal offence in many countries, and individuals can be eitherimprisoned or fined. Furthermore, it is now common for persons orcorporations allegedly injured by antitrust violations to sue for damages.
Violations of anti-bribery and corruption law and anti-money launderinglaw carry fines and expose us and/or our employees to criminalsanctions and civil suits.In 2010, Shell agreed to a Deferred Prosecution Agreement (DPA) withthe US Department of Justice (DOJ) for violations of the Foreign CorruptPractices Act (FCPA), which arose in connection with its use of thefreight-forwarding firm Panalpina. In November 2013, followingShell’s fulfilment of the terms of the DPA, the criminal charges filed inconnection with the DPA were dismissed. Shell’s ethics andcompliance programme was enhanced during the DPA and remains infull force and effect. Any violations of the FCPA or other relevant anti-bribery and corruption legislation or anti-money laundering legislationcould have a material adverse effect on the Company.
Violations of data protection laws carry fines and expose us and/or ouremployees to criminal sanctions and civil suits.Data protection laws apply to Shell and its joint ventures andassociates in the vast majority of countries in which we do business.Over 100 countries have data protection laws and regulations.Additionally, the impending EU Data Privacy Regulation proposes toincrease penalties up to a maximum of 5% of global annual turnoverfor breach of the regulation. Non-compliance with data protectionlaws could expose Shell to regulatory investigations, which may resultin fines and penalties. Shell could also be subject to litigation frompersons or corporations allegedly affected by data protectionviolations. Violation of data protection laws is a criminal offence insome countries, and individuals can be either imprisoned or fined.

14 STRATEGIC REPORT
RISK FACTORS SHELL ANNUAL REPORT AND FORM 20-F 2014
RISK FACTORS CONTINUED
Violations of trade controls, including sanctions, expose us and ouremployees to criminal sanctions and civil suits.We use “trade controls” as an umbrella term for various national andinternational laws designed to regulate the movement of items acrossnational boundaries and restrict or prohibit trade and other dealingswith certain parties. The number and breadth of trade controls facedby Shell continues to expand. For example, the EU and the USAcontinue to impose restrictions and prohibitions on certain transactionsinvolving Iran and Syria. Additional trade controls directed at definedoil and gas activities in Russia were imposed by the EU and the USA in2014. In addition to the significant trade control programmesadministered by the EU and the USA, many other nations are alsoadopting such programmes. Any violation of one or more trade controlregimes may lead to significant penalties or prosecution of Shell or itsemployees.
We execute acquisitions and divestments in the pursuit of our strategy. Anumber of risks impact the success of such acquisitions and divestments.Acquisitions may not succeed due to reasons such as difficulties inintegrating activities and realising synergies, outcomes varying fromkey assumptions, host governments reacting or responding in adifferent manner from that envisaged, or liabilities and costs being
underestimated. Any of these would reduce our ability to realise theexpected benefits. We may not be able to successfully divest non-coreassets at acceptable prices, resulting in increased pressure on our cashposition. In the case of divestments, we may be held liable for pastacts, failures to act or liabilities that are different from those foreseen.We may also face liabilities if a purchaser fails to honour all of itscommitments.
Investors should also consider the following, which might limitshareholder remedies.
The Company’s Articles of Association determine the jurisdiction forshareholder disputes. This might limit shareholder remedies.Our Articles of Association generally require that all disputes betweenour shareholders in such capacity and the Company or our subsidiaries(or our Directors or former Directors), or between the Company and ourDirectors or former Directors, be exclusively resolved by arbitration inThe Hague, the Netherlands, under the Rules of Arbitration of theInternational Chamber of Commerce. Our Articles of Association alsoprovide that, if this provision is for any reason determined to be invalidor unenforceable, the dispute may only be brought to the courts ofEngland and Wales. Accordingly, the ability of shareholders to obtainmonetary or other relief, including in respect of securities law claims,may be determined in accordance with these provisions. See“Corporate governance”.
STRATEGIC REPORT 15
SHELL ANNUAL REPORT AND FORM 20-F 2014 STRATEGY AND OUTLOOK
STRATEGY AND OUTLOOKSTRATEGYOur strategy seeks to reinforce our position as a leader in the oil andgas industry, while helping to meet global energy demand in aresponsible way. We aim to balance growth with returns, by growingour cash flow and delivering competitive returns through economiccycles, to finance a competitive dividend and fund investment for futuregrowth. Safety and environmental and social responsibility are at theheart of our activities.
Intense competition exists for access to upstream resources and to newdownstream markets. But we believe that our technology, projectdelivery capability and operational excellence will remain keydifferentiators for our businesses. We expect over 80% of our capitalinvestment in 2015 to be in our Upstream businesses.
In Upstream, we focus on exploration for new liquids and natural gasreserves and on developing major new projects where our technologyand know-how add value to the resources holders.
In Downstream, we focus on turning crude oil into a range of refinedproducts, which are moved and marketed around the world fordomestic, industrial and transport use. In addition, we produce andsell petrochemicals for industrial use worldwide.
We focus on a series of strategic themes, each requiring distinctivetechnologies and risk management:
� Our upstream and downstream “engines” are strongly cash-generative, mature businesses, which will underpin our financialperformance to at least the end of this decade. We only makeinvestments in selective growth positions and apply Shell’s distinctivetechnology and operating performance to extend the productive livesof our assets and to enhance their profitability.
� Our growth priorities follow two strategic themes: integrated gasand deep water. These will provide our medium-term growth and weexpect them to become core engines in the future. We utilise Shell’stechnological know-how and global scale to unlock highlycompetitive resources positions.
� Our longer-term strategic themes are “resource plays” such as shaleoil and gas as well as “future opportunities”, including the Arctic,Iraq, Kazakhstan, Nigeria and heavy oil, where we believe largereserves positions could potentially become available, with the paceof development driven by market and local operating conditions, aswell as the regulatory environment.
Meeting the growing demand for energy worldwide in ways thatminimise environmental and social impact is a major challenge for theglobal energy industry. We aim to improve energy efficiency in ourown operations, support customers in managing their energy demandsand continue to research and develop technologies that increaseefficiency and reduce emissions in liquids and natural gas production.
Our commitment to technology and innovation continues to be at thecore of our strategy. As energy projects become more complex andmore technically demanding, we believe our engineering expertise willbe a deciding factor in the growth of our businesses. Our key strengthsinclude the development and application of technology, the financialand project-management skills that allow us to deliver large fielddevelopment projects, and the management of integrated value chains.
We aim to leverage our diverse and global business portfolio andcustomer-focused businesses built around the strength of the Shellbrand.
OUTLOOKWe continuously seek to improve our operating performance, with anemphasis on health, safety and environment, asset performance andoperating costs. For 2015, we will continue to focus on the three keypriorities set out in 2014: improving our financial performance,enhancing our capital efficiency and continuing our focus on projectdelivery.
In 2015, we expect organic capital investment to be lower than 2014levels of around $35 billion. We are considering further reductions tocapital investment should the evolving market outlook warrant that step,but are aiming to retain growth potential for the medium term. Assetsales are a key element of our strategy, improving our capitalefficiency by focusing our investment on the most attractive growthopportunities. Proceeds from sales of non-strategic assets in 2014, andfrom the initial public offering in Shell Midstream Partners, L.P., totalled$15 billion, successfully completing our divestment programme for2014-2015. The completed divestment programme will result invarious production and tax effects in 2015. We also expect higherlevels of downtime in 2015, especially in Upstream and Chemicals,driven by increased maintenance activities. We will continue theinitiatives started in 2014, which are expected to improve our NorthAmerica resource plays and Oil Products businesses. We have newinitiatives underway in 2015 that are expected to improve ourupstream engine and resource plays outside the Americas. The focus ofthese initiatives will be on the profitability of our portfolio and growthpotential.
Shell has built up a substantial portfolio of project options for futuregrowth. This portfolio has been designed to capture energy priceupside and manage Shell’s exposure to industry challenges from costinflation and political risk. Today’s lower oil prices are creatingopportunities to reduce our own costs and to take costs out of thesupply chain.
The statements in this “Strategy and outlook” section, including thoserelated to our growth strategies and our expected or potential futurecash flow from operations, capital investment, divestment proceedsand production, are based on management’s current expectations andcertain material assumptions and, accordingly, involve risks anduncertainties that could cause actual results, performance or events todiffer materially from those expressed or implied herein. See “Aboutthis Report” and “Risk factors”.

16 STRATEGIC REPORT
MARKET OVERVIEW SHELL ANNUAL REPORT AND FORM 20-F 2014
MARKET OVERVIEWGLOBAL ECONOMIC GROWTHAccording to the International Monetary Fund’s (IMF) January 2015World Economic Outlook, global economic growth was 3.3% in2014, unchanged from 2013. The IMF estimated that the eurozone’sgross domestic product (GDP) grew by 0.8% in 2014 compared witha contraction of 0.5% in 2013, US growth was 2.4%, up from 2.2%in 2013, while Chinese growth slowed from 7.8% in 2013 to 7.4%.The average GDP growth rate for emerging markets and developingeconomies fell to 4.4%, compared with 4.7% in 2013.
Growth in 2014 fell short of the IMF’s forecast of 3.7% made at thebeginning of 2014. Harsh winter weather in the first quarter weighedon US growth for the year, Japan’s growth was hampered by asubstantial increase in value added tax in the second quarter, while theeurozone’s return to growth has been slow. Meanwhile, growth hasslowed in important markets such as China, Russia and Brazil.
The IMF expects global economic growth to rise to 3.5% in 2015, butthat would still be less than the annual average of 3.9% for theprevious 10 years.
GLOBAL OIL AND GAS DEMAND AND SUPPLYReflecting the economic conditions described above, global oil demandrose by 0.7% (0.6 million barrels per day (b/d)) in 2014, according tothe International Energy Agency’s (IEA) January 2015 Oil Market Report.The IEA repeatedly revised down its oil demand growth estimate for theyear from 1.4 million b/d in early 2014. Demand grew in emergingeconomies, while remaining almost flat in advanced economies.
On the non-OPEC supply side, the US Energy Information Administrationreported another year of continued supply growth in the Lower 48 USstates: in 2014 supply grew by some 1 million b/d year-on-year. As aconsequence of somewhat reduced demand growth and strong non-OPEC supply growth, oil prices fell from about $110 per barrel (/b) inmid-2014 to $75/b just ahead of the November OPEC meeting atwhich the members decided to maintain their production at 30 millionb/d, rather than to reduce their production to balance non-OPEC supplygrowth. The market interpreted this decision as an increased risk ofoversupply and oil prices further declined to lows of around $54/b inDecember.
We estimate that global gas demand grew by about 1% in 2014,similar to growth in 2013, which is much lower than the average annualgrowth rate of about 2.5% in the past decade. A combination ofunusually mild weather, except in the USA, a decline in natural gasproduction and weak global economic growth led to a lower rate ofdemand growth in most regions. We believe that most of the growth indemand was in China and the USA, driven by their power generationand industrial sectors. European gas demand has weakened over thelast few years and this trend is likely to have continued in 2014,according to gas industry association Eurogas.
CRUDE OIL AND NATURAL GAS PRICESThe following table provides an overview of the main crude oil andnatural gas price markers that Shell is exposed to:
OIL AND GAS AVERAGE INDUSTRY PRICES [A]2014 2013 2012
Brent ($/b) 99 109 112West Texas Intermediate ($/b) 93 98 94Henry Hub ($/MMBtu) 4.3 3.7 2.8UK National Balancing Point (pence/therm) 50 68 60Japan Customs-cleared Crude ($/b) 108 110 115
[A] Yearly average prices are based on daily spot prices. The 2014 average price for JapanCustoms-cleared Crude excludes December data.
The Brent crude oil price, an international crude-oil benchmark, tradedin a range of $54-115/b in 2014, ending the year at $55/b. Boththe Brent and the West Texas Intermediate (WTI) average crude oilprices for 2014 were lower than in 2013, as a result of demandgrowth being outpaced by continued non-OPEC supply growth, inparticular in North America.
WTI continued to trade at a discount to Brent, and followed the Brentprice trajectory. The discount narrowed compared with 2013 after anexpansion in pipeline capacity helped improve access for refineries onthe US Gulf Coast to WTI that is delivered to the landlocked Cushing,Oklahoma, trading hub.
Looking ahead, substantial price volatility can be expected in the shortto medium term. Oil prices may strengthen if the global economyaccelerates, or if supply tightens as a result of a deceleration in non-OPEC production growth due to current price weakness, in particularUS light tight oil, or if supply disruptions occur in major producingcountries. Alternatively, oil prices may weaken further if economicgrowth slows or production continues to rise.
Unlike crude oil pricing, which is global in nature, gas prices varysignificantly from region to region. In the USA, the natural gas price atthe Henry Hub averaged $4.3 per million British thermal units (MMBtu)in 2014, 16% higher than in 2013, and traded in a range of$2.7-7.9/MMBtu. The year began with one of the coldest winters onrecord and Henry Hub average monthly gas prices peaked in Februaryat $5.8/MMBtu. But robust growth in gas production and normalweather in the summer led to a steep decline in prices from a high of$4.7/MMBtu in mid-June to $3.8/MMBtu by the end of July. An earlycold snap caused a price spike to $4.4/MMBtu in mid-November,but it had fallen to $3.0/MMbtu by the end of the year.
In Europe, gas prices fell. In the UK, the average price at the UKNational Balancing Point was 21% lower than in 2013. In continentalEurope, price decreases at the main gas trading hubs in Belgium,Germany and the Netherlands were similar to those at the UK NationalBalancing Point. Lower prices reflected milder than expected weatherand improved supplies of LNG on the global market. The dominanceof oil-indexed gas pricing is decreasing in continental Europe, withmany natural gas contracts now including spot market pricing as amajor component.
We also produce and sell natural gas in regions where supply,demand and regulatory circumstances differ markedly from those in theUSA or Europe. Long-term contracted LNG prices in Asia-Pacific arepredominantly indexed to the price of Japan Customs-cleared Crude(JCC). In Japan, LNG import contracts have historically been indexedto the JCC benchmark.
We see growing demand for LNG in China, India, the Middle East,South America and South-east Asia. In these markets, LNG supply isoffered on term and spot bases. North American export projects havebeen offering future gas supply linked to US Henry Hub prices.
CRUDE OIL AND NATURAL GAS PRICES FORINVESTMENT EVALUATIONThe range of possible future crude oil and natural gas prices used inproject and portfolio evaluations by Shell is determined after anassessment of short-, medium- and long-term price drivers underdifferent sets of assumptions. Historical analysis, trends and statisticalvolatility are considered in this assessment, as are analyses of possiblefuture economic conditions, geopolitics, actions by OPEC, productioncosts and the balance of supply and demand. Sensitivity analyses areused to test the impact of low-price drivers, such as economicweakness, and high-price drivers, such as strong economic growth andlow investment in new production capacity. Short-term events, such as

STRATEGIC REPORT 17
SHELL ANNUAL REPORT AND FORM 20-F 2014 MARKET OVERVIEW
relatively warm winters or cool summers affect demand. Supplydisruptions, due to weather or political instability, contribute to pricevolatility.
We expect oil and gas prices to remain volatile. For the purposes ofmaking investment decisions, generally we test the economicperformance of long-term projects against price ranges of $70-110/bfor Brent crude oil and $3.5-5.0/MMBtu for gas at the Henry Hub. Aspart of our normal business practice, the range of prices used for thispurpose is subject to review and change, and was last confirmed inthe fourth quarter of 2014. See “Risk factors”.
REFINING AND PETROCHEMICAL MARKET TRENDSIndustry refining margins were higher on average in 2014 than in2013 in the key refining hubs of the USA and Singapore, and werelittle changed in Europe. In particular, margins improved in the USAwhere increased domestic crude oil and natural gas productionlowered oil acquisition costs (relative to international prices). Somedemand growth, especially around the summer driving season in theUSA, also contributed to higher US Gulf Coast margins. In 2015,increased demand for middle distillates is expected to be a key driverof refining margins, supported by demand for gasoline in the middle ofthe year. However, the overall outlook remains unclear because ofcontinuing economic uncertainty, geopolitical tensions in some regionsthat could lead to supply disruptions and overcapacity in the globalrefining market.
In Chemicals, industry naphtha cracker margins increased from 2013,particularly in Asia where there was less cracker capacity available.US ethane cracker margins were high relative to naphtha crackermargins in other regions due to ample ethane supply. The outlook forpetrochemicals for 2015 is dependent on the growth of the globaleconomy, especially in Asia, and developments in raw material prices.

18 STRATEGIC REPORT
SUMMARY OF RESULTS SHELL ANNUAL REPORT AND FORM 20-F 2014
SUMMARY OF RESULTSINCOME FOR THE PERIOD $ MILLION
2014 2013 2012Earnings by segment [A]
Upstream 15,841 12,638 22,244Downstream 3,411 3,869 5,382Corporate (156) 372 (203)
Total segment earnings [A] 19,096 16,879 27,423Attributable to non-controlling interest (55) (134) (259)Earnings on a current cost of supplies basis attributable to Royal Dutch Shell plc
shareholders 19,041 16,745 27,164Current cost of supplies adjustment [A] (4,366) (353) (463)Non-controlling interest 199 (21) 11Income attributable to Royal Dutch Shell plc shareholders 14,874 16,371 26,712Non-controlling interest (144) 155 248Income for the period 14,730 16,526 26,960
[A] See Note 2 to the “Consolidated Financial Statements”. Segment earnings are presented on a current cost of supplies basis.
EARNINGS 2014-2012Global realised liquids prices were 8% lower in 2014 than in 2013.Global realised natural gas prices were 6% lower than in 2013, witha 20% increase in the Americas and an 11% decrease outside theAmericas.
Oil and gas production available for sale in 2014 was 3,080 thousandbarrels of oil equivalent per day (boe/d), compared with 3,199thousand boe/d in 2013. Liquids production was down 4% and naturalgas production decreased by 4% compared with 2013. Excluding theimpact of divestments, the Abu Dhabi licence expiry, production-sharingcontract price effects and security impacts in Nigeria, production volumesin 2014 increased by 2% compared with 2013.
Realised refining margins in 2014 were significantly higher overall andhigher in all regions apart from the US West Coast compared with 2013.The increase was driven by operational improvements and a strongermargin environment in most regions.
Earnings on a current cost of supplies basis (CCS earnings) attributableto shareholders in 2014 were 14% higher than in 2013, which in turnwere 38% lower than in 2012. Segment earnings are presented onthis basis.
CCS earnings exclude the effect of changes in the oil price on inventoryvaluation, as the purchase price of the volumes sold during a period isbased on the current cost of supplies during the same period, after makingallowance for the tax effect. Accordingly, when oil prices increase duringthe period, CCS earnings are likely to be lower than earnings calculatedon a first-in first-out (FIFO) basis. Similarly, in a period with declining oilprices, CCS earnings are likely to be higher than earnings calculated ona FIFO basis. This explains why 2014 CCS earnings were $4,366million higher than earnings calculated on a FIFO basis (2013: $353million higher; 2012: $463 million higher).
Upstream earnings in 2014 were $15,841 million, compared with$12,638 million in 2013 and $22,244 million in 2012. The 25%increase from 2013 to 2014 was mainly driven by increasedcontributions from liquids production volumes from both the start-up ofnew high-margin deep-water projects and improved operationalperformance, higher divestment gains, lower exploration expenses,primarily driven by fewer well write-offs, increased contributions fromTrading and lower impairment charges. These effects were partiallyoffset by the impact of declining oil prices and higher depreciation(excluding impairments). The 43% decrease from 2012 to 2013
reflected higher depreciation charges (partly driven by impairments),lower divestment gains, higher exploration expenses (mainly driven bywell write-offs), higher operating expenses and lower liquids and LNGrealisations. Earnings in 2013 were also impacted by a deteriorationin the operating environment in Nigeria and the impact of theweakening Australian dollar on a deferred tax liability. These effectswere partly offset by the contribution of our Pearl GTL plant in Qatarand higher gas price realisations in the Americas, together with net taxgains in 2013 compared with net tax charges and higherdecommissioning provisions in 2012.
Downstream earnings in 2014 were $3,411 million compared with$3,869 million in 2013 and $5,382 million in 2012. The 12%decrease from 2013 to 2014 reflected significantly higher charges forimpairment which were partially offset by higher realised refiningmargins, higher earnings from Trading and Supply and lower costs(mainly as a result of divestments). The 28% decrease from 2012 to2013 reflected significantly lower realised refining margins and highercharges for impairment, partly offset by higher contributions fromChemicals and Trading.
Corporate earnings in 2014 were a loss of $156 million, comparedwith a gain of $372 million in 2013 and a loss of $203 million in2012. Compared with 2013, Corporate earnings in 2014 reflectedlower tax credits, higher net interest expense and adverse currencyexchange rate effects. Compared with 2012, earnings in 2013 werehigher mainly due to a tax credit, the recharge to the businesssegments of certain costs and lower net interest expense, partly offsetby adverse currency exchange rate effects.
NET CAPITAL INVESTMENT AND GEARINGNet capital investment was $23.9 billion, 46% lower than in 2013.This was driven by higher proceeds from divestments and lower capitalinvestment (see “Non-GAAP measures reconciliations”).
Gearing was 12.2% at the end of 2014, compared with 16.1% at theend of 2013, as a result of a significant increase in cash and cashequivalents (driven by the lower net capital investment), combined witha 2% increase in total debt and a 5% decrease in equity.
PROVED RESERVES AND PRODUCTIONShell subsidiaries’ and the Shell share of joint ventures and associates’estimated net proved oil and gas reserves are summarised in“Upstream” and set out in more detail in “Supplementary information –oil and gas (unaudited)”.

STRATEGIC REPORT 19
SHELL ANNUAL REPORT AND FORM 20-F 2014 SUMMARY OF RESULTS
In 2014, Shell added 301 million boe of proved reserves beforetaking production into account, of which 271 million boe were fromShell subsidiaries and 30 million boe were from the Shell share of jointventures and associates. These additions were positively impacted bylower commodity prices (44 million boe) and negatively impacted bysales that exceeded purchases (274 million boe).
In 2014, total oil and gas production available for sale was1,124 million boe. An additional 40 million boe was produced andconsumed in operations. Production available for sale from subsidiarieswas 895 million boe with an additional 30 million boe consumed inoperations. The Shell share of the production available for sale of jointventures and associates was 229 million boe with an additional10 million boe consumed in operations.
Accordingly, after taking production into account, there was adecrease of 863 million boe in proved reserves, comprising adecrease of 654 million boe from subsidiaries and a decrease of209 million boe from the Shell share of joint ventures and associates.
KEY ACCOUNTING ESTIMATES AND JUDGEMENTSRefer to Note 3 to the “Consolidated Financial Statements” for adiscussion of key accounting estimates and judgements.
LEGAL PROCEEDINGSRefer to Note 25 to the “Consolidated Financial Statements” for adiscussion of legal proceedings.

20 STRATEGIC REPORT
PERFORMANCE INDICATORS SHELL ANNUAL REPORT AND FORM 20-F 2014
PERFORMANCE INDICATORSKEY PERFORMANCE INDICATORS
Total shareholder return2014 -3.0% 2013 8.6%
Total shareholder return (TSR) is the difference between the share priceat the start of the year and the share price at the end of the year, plusgross dividends delivered during the calendar year (reinvestedquarterly), expressed as a percentage of the year-start share price. TheTSRs of major publicly traded oil and gas companies can be directlycompared, providing a way to determine how Shell is performingagainst its industry peers.
Net cash from operating activities ($ billion)2014 45 2013 40
Net cash from operating activities is the total of all cash receipts andpayments associated with our sales of oil, gas, chemicals and otherproducts. The components that provide a reconciliation from income forthe period are listed in the “Consolidated Statement of Cash Flows”.This indicator reflects Shell’s ability to generate cash for bothinvestment and distribution to shareholders.
Project delivery2014 83% 2013 88%
Project delivery reflects Shell’s capability to complete major projects ontime and within budget on the basis of targets set in the annualBusiness Plan. The set of projects consists of at least 20 Shell-operatedcapital projects that are in the execution phase (post final investmentdecision).
Production available for sale (thousand boe/d)2014 3,080 2013 3,199
Production is the sum of all average daily volumes of unrefined oil andnatural gas produced for sale by Shell subsidiaries and Shell’s share ofthose produced for sale by joint ventures and associates. The unrefinedoil comprises crude oil, natural gas liquids, synthetic crude oil andbitumen. The gas volume is converted to equivalent barrels of oil tomake the summation possible. Changes in production have asignificant impact on Shell’s cash flow.
Equity sales of liquefied natural gas (million tonnes)2014 24.0 2013 19.6
Equity sales of liquefied natural gas (LNG) is a measure of theoperational performance of Shell’s Upstream business and LNG marketdemand.
Refinery and chemical plant availability2014 92.1% 2013 92.5%
Refinery and chemical plant availability is the weighted average of theactual uptime of plants as a percentage of their maximum possibleuptime. The weighting is based on the capital employed adjusted forcash and non-current liabilities. It excludes downtime due touncontrollable factors, such as hurricanes. This indicator is a measureof the operational excellence of Shell’s Downstream manufacturingfacilities.
Total recordable case frequency(injuries per million working hours)2014 0.99 2013 1.15
Total recordable case frequency (TRCF) is the number of staff orcontractor injuries requiring medical treatment or time off for everymillion hours worked. It is a standard measure of occupational safety.

STRATEGIC REPORT 21
SHELL ANNUAL REPORT AND FORM 20-F 2014 PERFORMANCE INDICATORS
ADDITIONAL PERFORMANCE INDICATORS
Earnings on a current cost of supplies basis attributable toRoyal Dutch Shell plc shareholders ($ million)2014 19,041 2013 16,745
Earnings per share on a current cost of supplies basis ($)2014 3.02 2013 2.66
Earnings on a current cost of supplies basis (CCS earnings) attributableto Royal Dutch Shell plc shareholders is the income for the period,adjusted for the after-tax effect of oil-price changes on inventory andnon-controlling interest. CCS earnings per share is calculated bydividing CCS earnings attributable to shareholders by the averagenumber of shares outstanding. See “Summary of results” and Note 2 tothe “Consolidated Financial Statements”.
Net capital investment ($ million)2014 23,899 2013 44,303
Net capital investment is a measure used to make decisions aboutallocating resources and assessing performance. It is defined as netcash used in investing activities as reported in the “ConsolidatedStatement of Cash Flows” plus exploration expense, excludingexploration wells written off, new finance leases and other adjustments.See “Non-GAAP measures reconciliations”.
Return on average capital employed2014 7.1% 2013 7.9%
Return on average capital employed (ROACE) is defined as annualincome, adjusted for after-tax interest expense, as a percentage ofaverage capital employed during the year. Capital employed is thesum of total equity and total debt. ROACE measures the efficiency ofShell’s utilisation of the capital that it employs and is a commonmeasure of business performance. See “Liquidity and capitalresources – Return on average capital employed”.
Gearing2014 12.2% 2013 16.1%
Gearing is defined as net debt (total debt less cash and cashequivalents) as a percentage of total capital (net debt plus total equity),at December 31. It is a measure of the degree to which Shell’soperations are financed by debt. See Note 14 to the “ConsolidatedFinancial Statements”.
Proved oil and gas reserves attributable to Royal Dutch Shellplc shareholders (million boe)2014 13,070 2013 13,932
Proved oil and gas reserves attributable to Royal Dutch Shell plcshareholders are the total estimated quantities of oil and gas from Shellsubsidiaries (excluding reserves attributable to non-controlling interest)and Shell’s share from joint ventures and associates that geoscienceand engineering data demonstrate, with reasonable certainty, to berecoverable in future years from known reservoirs, as at December 31,under existing economic conditions, operating methods andgovernment regulations. Gas volumes are converted to barrels of oilequivalent (boe) using a factor of 5,800 standard cubic feet perbarrel. Reserves are crucial to an oil and gas company, since theyconstitute the source of future production. Reserves estimates aresubject to change based on a wide variety of factors, some of whichare unpredictable. See “Risk factors”.
Operational spills of more than 100 kilograms2014 153 2013 174
The operational spills indicator is the number of incidents in respect ofactivities where we are the operator in which 100 kilograms or moreof oil or oil products were spilled as a result of those activities.
Employees (thousand)2014 94 2013 92
The employees indicator consists of the annual average full-timeemployee equivalent of the total number of people on full-time or part-time employment contracts with Shell subsidiaries including our shareof employees of certain additional joint operations.

22 STRATEGIC REPORT
SELECTED FINANCIAL DATA SHELL ANNUAL REPORT AND FORM 20-F 2014
SELECTED FINANCIAL DATAThe selected financial data set out below are derived, in part, from the “Consolidated Financial Statements”. This data should be read inconjunction with the “Consolidated Financial Statements” and related Notes, as well as with this Strategic Report.
CONSOLIDATED STATEMENT OF INCOME AND OF COMPREHENSIVE INCOME DATA $ MILLION2014 2013 2012 2011 2010
Revenue 421,105 451,235 467,153 470,171 368,056Income for the period 14,730 16,526 26,960 31,093 20,474(Loss)/income attributable to non-controlling interest (144) 155 248 267 347Income attributable to Royal Dutch Shell plc
shareholders 14,874 16,371 26,712 30,826 20,127Comprehensive income attributable to Royal Dutch
Shell plc shareholders 2,692 18,243 24,470 26,250 19,893
CONSOLIDATED BALANCE SHEET DATA $ MILLION2014 2013 2012 2011 2010
Total assets 353,116 357,512 350,294 337,474 317,271Total debt 45,540 44,562 37,754 37,175 44,332Share capital 540 542 542 536 529Equity attributable to Royal Dutch Shell plc
shareholders 171,966 180,047 174,749 158,480 140,453Non-controlling interest 820 1,101 1,433 1,486 1,767
EARNINGS PER SHARE $2014 2013 2012 2011 2010
Basic earnings per €0.07 ordinary share 2.36 2.60 4.27 4.97 3.28Diluted earnings per €0.07 ordinary share 2.36 2.60 4.26 4.96 3.28
SHARES NUMBER2014 2013 2012 2011 2010
Basic weighted average number of A and B shares 6,311,490,678 6,291,126,326 6,261,184,755 6,212,532,421 6,132,640,190Diluted weighted average number of A and B shares 6,311,605,118 6,293,381,407 6,267,839,545 6,221,655,088 6,139,300,098
OTHER FINANCIAL DATA $ MILLION2014 2013 2012 2011 2010
Net cash from operating activities 45,044 40,440 46,140 36,771 27,350Net cash used in investing activities 19,657 40,146 28,453 20,443 21,972Dividends paid 9,560 7,450 7,682 7,315 9,979Net cash used in financing activities 12,790 8,978 10,630 18,131 1,467Increase/(decrease) in cash and cash equivalents 11,911 (8,854) 7,258 (2,152) 3,725Earnings/(losses) by segment [A]
Upstream 15,841 12,638 22,244 24,466 15,935Downstream 3,411 3,869 5,382 4,170 2,950Corporate (156) 372 (203) 102 91
Total segment earnings 19,096 16,879 27,423 28,738 18,976Attributable to non-controlling interest (55) (134) (259) (205) (333)Earnings on a current cost of supplies basis
attributable to Royal Dutch Shell plc shareholders [B] 19,041 16,745 27,164 28,533 18,643Net capital investment [C]
Upstream 20,704 39,217 25,320 19,083 21,222Downstream 3,079 4,885 4,275 4,342 2,358Corporate 116 201 208 78 100
Total 23,899 44,303 29,803 23,503 23,680
[A] See Notes 2 and 4 to the “Consolidated Financial Statements”.[B] See table in “Summary of results”.[C] See “Non-GAAP measures reconciliations”.

STRATEGIC REPORT 23
SHELL ANNUAL REPORT AND FORM 20-F 2014 UPSTREAM
UPSTREAMKEY STATISTICS $ MILLION
2014 2013 2012Segment earnings 15,841 12,638 22,244Including:
Revenue (including inter-segment sales) 92,299 92,869 94,550Share of profit of joint ventures and associates 5,502 6,120 8,001Production and manufacturing expenses 20,093 18,471 16,354Selling, distribution and administrative expenses 1,055 1,194 1,211Exploration 4,224 5,278 3,104Depreciation, depletion and amortisation 17,868 16,949 11,387
Net capital investment [A] 20,704 39,217 25,320Oil and gas production available for sale (thousand boe/d) 3,080 3,199 3,262Equity LNG sales volume (million tonnes) 24.0 19.6 20.2Proved oil and gas reserves at December 31 (million boe) [B] 13,070 13,932 13,556
[A] See “Non-GAAP measures reconciliations”.[B] Excludes reserves attributable to non-controlling interest in Shell subsidiaries.
OVERVIEWOur Upstream businesses explore for and extract crude oil and naturalgas, often in joint arrangements with international and national oil andgas companies. This includes the extraction of bitumen from mined oilsands which we convert into synthetic crude oil. We liquefy naturalgas by cooling it and transport the liquefied natural gas (LNG) tocustomers around the world. We also convert natural gas to liquids(GTL) to provide high-quality fuels and other products, and we marketand trade crude oil and natural gas (including LNG) in support of ourUpstream businesses.
BUSINESS CONDITIONSGlobal oil demand rose by 0.7% (0.6 million barrels per day (b/d)) in2014, according to the International Energy Agency’s January 2015Oil Market Report. Demand grew in emerging economies whileremaining almost flat in advanced economies. The Brent crude oilprice, an international crude-oil benchmark, traded in a range of$54-115 per barrel (/b) in 2014, ending the year at $55/b.
We estimate that global gas demand grew by about 1% in 2014,similar to growth in 2013, which is much lower than the averageannual growth rate of about 2.5% in the past decade. A combinationof unusually mild weather, except in the USA, a decline in natural gasproduction and weak global economic growth led to a lower rate ofdemand growth in most regions. We believe that most of the growth indemand was in China and the USA, driven by their power generationand industrial sectors. European gas demand has weakened over thelast few years and this trend is likely to have continued in 2014,according to gas industry association Eurogas.
EARNINGS 2014-2013Segment earnings of $15,841 million included a net charge of$664 million, reflecting impairment charges of $2,406 million,predominantly related to tight-gas shale properties in the USA, andfurther charges of $718 million related to an update of an Australiandeferred tax asset and a deferred tax liability related to an associatecompany. These charges were partly offset by divestment gains of$2,073 million mainly related to Wheatstone and to a portion of ourshareholding in Woodside Petroleum Limited (Woodside) in Australia,Oil Mining Lease (OML) 24 in Nigeria and Haynesville in the USA.Other favourable impacts mainly related to the net effect of fair valueaccounting of commodity derivatives and certain gas contracts, and toamendments to our Dutch pension plan.
Segment earnings in 2013 of $12,638 million included a net chargeof $2,479 million, primarily related to the impairment of liquids-richshale properties in North America, partly offset by net tax gains andgains on divestments.
Excluding the net charges described above, segment earnings in2014 increased by 9% compared with 2013, driven by increasedcontributions from liquids production volumes from both the start-up ofnew high-margin deep-water projects and improved operationalperformance. Earnings also reflected lower exploration expenses,primarily driven by fewer well write-offs, and increased contributionsfrom Trading. Earnings were impacted by declining oil prices, losses inUpstream Americas tight-gas and liquids-rich shale, and higherdepreciation.
Global realised liquids prices were 8% lower than in 2013. Globalrealised gas prices were 6% lower than in 2013, with a 20% increasein the Americas and an 11% decrease outside the Americas.
Equity LNG sales volumes of 24.0 million tonnes were 22% higherthan in 2013, mainly reflecting the contribution from the Atlantic LNGand Peru LNG assets following the acquisition from Repsol S.A. inJanuary 2014, and higher volumes from Nigeria LNG which in 2013was impacted by reduced feed gas supply and the impact of ablockade of shipments.
EARNINGS 2013-2012Segment earnings in 2013 of $12,638 million included a net chargeof $2,479 million, as described above. Segment earnings in 2012 of$22,244 million included a net gain of $2,137 million, mainlyrelated to gains on divestments, partly offset by impairments foronshore gas assets in the USA, net tax charges and decommissioningprovisions.
Excluding the net charge and net gain described above, segmentearnings in 2013 decreased by 25% compared with 2012 becauseof higher exploration expenses (mainly driven by well write-offs),operating expenses and depreciation, and lower liquids and LNGrealisations. Earnings were also impacted by a deterioration in theoperating environment in Nigeria and the impact of the weakeningAustralian dollar on a deferred tax liability. This was partly offset by anincreased contribution from our Pearl GTL plant (Pearl) in Qatar andhigher gas prices in the Americas.
24 STRATEGIC REPORT
UPSTREAM SHELL ANNUAL REPORT AND FORM 20-F 2014
UPSTREAM CONTINUED
NET CAPITAL INVESTMENTNet capital investment was $21 billion in 2014, compared with$39 billion in 2013. Capital investment in 2014 was $31 billion (ofwhich $8 billion was exploration expenditure, including acquisitions ofunproved properties). Capital investment in 2013 was $40 billion.Divestment proceeds were $11 billion in 2014 compared with $1billion in 2013.
Net capital investment was lower than in 2013 mainly due to higherdivestment proceeds and lower expenditure on acquisitions. Majordivestment proceeds in 2014 relate to a portion of our shareholding inWoodside and to Wheatstone in Australia, Parque das Conchas(BC-10) in Brazil and Haynesville and Pinedale in the USA. In 2014,acquisition expenditure was lower than in 2013 which included theacquisition of interests in Libra and BC-10 in Brazil and expenditure forthe acquisition of LNG businesses from Repsol S.A.
PORTFOLIO ACTIONS AND BUSINESS DEVELOPMENTWe achieved the following operational milestones in 2014:
In Malaysia, first oil was produced from the Shell-operated Gumusut-Kakap deep-water development (Shell interest 29%). Peak productionof around 135 thousand barrels of oil equivalent per day (boe/d) isexpected. Work on the gas injection facilities is continuing.
Also in Malaysia, the Siakap North-Petai development (Shell interest21%) commenced production and is expected to deliver peakproduction of around 30 thousand boe/d.
In Nigeria, first oil was produced from the Shell-operated Bonga NorthWest deep-water development (Shell interest 55%) which is expectedto deliver peak production of around 40 thousand boe/d. Oil from thesubsea facilities is transported by a new undersea pipeline to theexisting Bonga floating production, storage and offloading (FPSO)export facility, which has been upgraded to handle the additional oilflow.
In the USA, there were two major start-ups in the deep-water Gulf ofMexico with first oil produced from the Mars B (Shell interest 71.5%)and Cardamom (Shell interest 100%) developments. Production fromthese developments is planned to ramp up to 80 thousand boe/d and50 thousand boe/d respectively.
The acquisition of part of Repsol S.A.’s LNG portfolio was completedin January 2014, including LNG supply positions in Peru and Trinidadand Tobago, for a net cash purchase price of $3.8 billion, adding7.2 million tonnes per annum (mtpa) of directly managed LNG volumesthrough long-term off-take agreements, including 4.2 mtpa of equityLNG plant capacity.
We also took several final investment decisions during 2014,including the following:
In Brunei, the final investment decision was taken on the Maharaja LelaSouth development (Shell interest 35%). The development is expectedto deliver peak production of 35 thousand boe/d.
In Nigeria, we took the final investment decision on the Bonga MainPhase 3 project (Shell interest 55%). The development is expected todeliver some 40 thousand boe/d at peak production through theexisting Bonga FPSO.
In the USA, we took the final investment decision on the CoulombPhase 2 project (Shell interest 100%) in the Gulf of Mexico. Thedevelopment is a subsea tie-back into the Na Kika semi-submersiblestorage platform and is expected to deliver some 20 thousand boe/dat peak production.
We continued to divest selected Upstream assets during 2014,including the following:
In Australia, we sold 78.27 million shares in Woodside for$3.0 billion, reducing Shell’s interest from 23% to 14%.
Also in Australia, we sold our 8% interest in the Wheatstone-lago jointventure and our 6.4% interest in the Wheatstone LNG project, which isunder development, for $1.5 billion.
In Brazil, we sold a 23% interest in the Shell-operated deep-waterproject BC-10 to Qatar Petroleum International for $1.2 billion,including closing adjustment.
Also in Brazil, we sold our non-operated 20% interest in the BM-ES-23concession in the Espirito Santos basin offshore for $0.2 billion.
In Canada, we sold our 100% interest in the Orion steam assistedgravity drainage project for $0.3 billion.
In Nigeria, we sold our 30% interest in OML 24 and related onshorefacilities for $0.6 billion.
In Upstream Americas tight-gas and liquids-rich shale, we completed areview of our portfolio and strategy. Major divestments of non-corepositions are now complete and in 2014 included our interests in:
� the Haynesville tight-gas shale asset in Louisiana, USA, for $1.1billion including closing adjustments;
� the Pinedale tight-gas shale asset in Wyoming, USA, for $0.9 billionincluding closing adjustments and 155 thousand net acres in theMarcellus and Utica shale areas in Pennsylvania, USA. We nowhold a 100% interest in the Tioga Area of Mutual Interest;
� approximately 106,000 net acres of the Eagle Ford liquids-richshale asset in Texas, USA, for $0.5 billion including closingadjustments;
� the Mississippi Lime acreage in Kansas, USA, for $0.1 billion; and� additional assets for a total of $0.5 billion.
AVAILABLE-FOR-SALE PRODUCTIONIn 2014, production was 3,080 thousand boe/d compared with3,199 thousand boe/d in 2013. Liquids and natural gas productionboth decreased by 4% compared with 2013.
Production was reduced by 10% as a result of the ADCO licenceexpiry in Abu Dhabi in January 2014, field declines and thedivestment of a number of assets (mainly shale assets in the Americasand the reduction in our shareholding in Woodside).
This reduction was partly offset by new field start-ups and thecontinuing ramp-up of existing projects, in particular Majnoon in Iraqand Mars B and BC-10 Phase 2 in the Americas, which contributedsome 130 thousand boe/d to production in 2014. Improvedoperational performance in 2014 provided further offset.
STRATEGIC REPORT 25
SHELL ANNUAL REPORT AND FORM 20-F 2014 UPSTREAM
PROVED RESERVESShell subsidiaries’ and the Shell share of joint ventures and associates’estimated net proved oil and gas reserves are summarised later in thisUpstream section and set out in more detail in “Supplementaryinformation – oil and gas (unaudited)”.
In 2014, Shell added 301 million boe of proved reserves beforetaking production into account, of which 271 million boe came fromShell subsidiaries and 30 million boe from the Shell share of jointventures and associates.
The change in the yearly average commodity prices between 2013and 2014 resulted in a net positive impact on the proved reserves of44 million boe.
In 2014, after taking into account production, our total provedreserves declined by 863 million boe.
Shell subsidiariesBefore taking production into account, Shell subsidiaries added271 million boe of proved reserves in 2014. This comprised42 million barrels of oil and natural gas liquids and 229 million boe(1,329 thousand million scf) of natural gas. Of the 271 million boe:276 million boe were from the net effects of revisions andreclassifications; 9 million boe were from improved recovery;191 million boe came from extensions and discoveries; and a netdecrease of 205 million boe related to purchases and sales.
After taking into account production of 925 million boe (of which30 million boe were consumed in operations), Shell subsidiaries’proved reserves decreased by 654 million boe in 2014.
Shell subsidiaries’ proved developed reserves decreased by 12 millionboe to 6,777 million boe, while proved undeveloped reservesdecreased by 642 million boe to 3,404 million boe.
The total addition of 271 million boe before taking production intoaccount included a net positive impact from commodity price changesof 43 million boe of proved reserves.
SYNTHETIC CRUDE OILOf the 301 million boe added to proved reserves, 81 million barrelswere synthetic crude oil. In 2014, we had synthetic crude oilproduction of 49 million barrels of which 2 million barrels wereconsumed in operations. At December 31, 2014, we had syntheticcrude oil proved reserves of 1,763 million barrels, of which 1,273million barrels were proved developed reserves and 490 millionbarrels were proved undeveloped reserves.
BITUMENOf the 301 million boe added to proved reserves, 12 million barrelswere bitumen. The addition of 12 million barrels comprised anincrease of 17 million barrels from net effects of revisions andreclassifications, and an addition of 1 million barrels from extensionsand discoveries and a decrease from sales of 6 million barrels. Aftertaking into account production of 6 million barrels, bitumen provedreserves were 428 million barrels at December 31, 2014.
Shell share of joint ventures and associatesBefore taking production into account, there was an increase of30 million boe in the Shell share of joint ventures and associates’proved reserves in 2014. This comprised 11 million barrels of oil andnatural gas liquids and 19 million boe (112 thousand million scf) ofnatural gas. Of the 30 million boe, 91 million boe came from the neteffects of revisions and reclassifications, 8 million boe came fromextensions and discoveries and a decrease of 69 million boe fromsales.
After taking into account production of 239 million boe (of which10 million boe were consumed in operations), the Shell share of jointventures and associates’ proved reserves decreased by 209 millionboe in 2014.
The Shell share of joint ventures and associates’ proved developedreserves decreased by 336 million boe to 2,206 million boe, andproved undeveloped reserves increased by 127 million boe to694 million boe.
The total addition of 30 million boe before taking production intoaccount was impacted by net positive impact from commodity pricechanges of 1 million boe of proved reserves.
Proved undeveloped reservesIn 2014, Shell subsidiaries’ and the Shell share of joint ventures andassociates‘ proved undeveloped reserves (PUD) decreased by 515million boe to 4,098 million boe. A number of Shell fields saw somechanges to proved undeveloped reserves, with the largest reductionsoccurring in the USA in Mars and in Europe in Schiehallion. The mostsignificant additions to the PUD occurred in Champion and ChampionWest in Asia and in Canada in Muskeg River Mine. The 515 millionboe decrease in proved undeveloped reserves comprised: a reductionof 259 million boe from revisions; a net reclassification of 125 millionboe from proved undeveloped to proved developed reserves; a netreclassification of 266 million boe from proved undeveloped reservesto contingent resource; an addition of 208 million boe fromextensions, discoveries and improved recovery; and a net decrease of73 million boe related to purchases and sales.
An amount of 174 million boe was matured to proved developedreserves from contingent resource as a result of project executionduring the year.
Shell proved undeveloped reserves held for five years or more (PUD5+)at December 31, 2014, amount to 1,600 million boe, a net increaseof 774 million boe compared with the end of 2013. These PUD5+remain undeveloped because development either: requires theinstallation of gas compression and the drilling of additional wells,which will be executed when required to support existing gas deliverycommitments (in Netherlands, Norway, the Philippines and Russia);requires gas cap blow down which is awaiting end-of-oil production(in Nigeria); or will take longer than five years because of thecomplexity and scale of the project (in countries like Kazakhstan). Theincrease in PUD5+ reflects the ageing of 808 million boe PUD bookedin 2009 and the transfer of 34 million boe PUD to proved developedreserves. The largest contributors to the increase of PUD5+ are MuskegRiver Mine, Gorgon and Jansz-lo. Two fields, Bonga and Val d’Agri,contribute to a reduction in PUD5+ due to projects being brought onstream. The Shell fields with the largest PUD5+ are now Muskeg RiverMine, followed by Gorgon, Groningen (second and third stagecompression), Jansz-lo and Kashaghan.
During 2014, Shell spent $17.3 billion on development activitiesrelated to PUD maturation.
DELIVERY COMMITMENTSShell sells crude oil and natural gas from its producing operationsunder a variety of contractual obligations. Most contracts generallycommit Shell to sell quantities based on production from specifiedproperties, although some natural gas sales contracts specify deliveryof fixed and determinable quantities, as discussed below.
In the past three years, with the exception of Brunei, Shell met allcontractual delivery commitments.
In the period 2015 to 2017, Shell is contractually committed to deliverto third parties and joint ventures and associates a total of
26 STRATEGIC REPORT
UPSTREAM SHELL ANNUAL REPORT AND FORM 20-F 2014
UPSTREAM CONTINUED
approximately 4,000 thousand million scf of natural gas from Shellsubsidiaries, joint ventures and associates. The sales contracts containa mixture of fixed and variable pricing formulae that are generallyreferenced to the prevailing market price for crude oil, natural gas orother petroleum products at the time of delivery.
The shortfall between Shell’s delivery commitments and its proveddeveloped reserves is estimated at 21% of Shell’s total gas deliverycommitments. This shortfall is expected to be met through thedevelopment of proved undeveloped reserves as well as new projectsand purchases on the spot market.
EXPLORATIONIn 2014, Shell made 10 notable discoveries, including in the USA,Gabon and Malaysia. Discoveries will be evaluated further in order toestablish the extent of commercially producible volumes they contain.
In 2014, Shell participated in 151 productive exploratory wells withproved reserves allocated (Shell share: 99 wells). For furtherinformation, see “Supplementary information – oil and gas (unaudited)– Acreage and wells”.
In 2014, Shell participated in a further 126 wells (Shell share: 77wells) that remained pending determination at December 31, 2014.
In total, the net acreage in Shell’s exploration portfolio decreased by34,000 square kilometres, comprising acreage decreases of 13,000square kilometres in South America (withdrawal), 11,500 squarekilometres in Australia (divestment), 8,000 square kilometres in Turkey(relinquishment), 5,000 square kilometres in Canada (divestment), andincreases in acreage of 11,500 square kilometres in Namibia (licenceaward) and 9,000 square kilometres in Greenland (equity increase).
BUSINESS AND PROPERTYShell subsidiaries, joint ventures and associates are involved in allaspects of upstream activities, including matters such as land tenure,entitlement to produced hydrocarbons, production rates, royalties,pricing, environmental protection, social impact, exports, taxes andforeign exchange.
The conditions of the leases, licences and contracts under which oiland gas interests are held vary from country to country. In almost allcases outside North America the legal agreements are generallygranted by or entered into with a government, government entity orgovernment-run oil and gas company, and the exploration risk usuallyrests with the independent oil and gas company. In North Americathese agreements may also be with private parties that own mineralrights. Of these agreements, the following are most relevant to Shell’sinterests:
� Licences (or concessions), which entitle the holder to explore forhydrocarbons and exploit any commercial discoveries. Under alicence, the holder bears the risk of exploration, development andproduction activities, and is responsible for financing these activities.In principle, the licence holder is entitled to the totality of productionless any royalties in kind. The government, government entity orgovernment-run oil and gas company may sometimes enter as aparticipant in a joint arrangement sharing the rights and obligationsof the licence but usually without sharing the exploration risk. In afew cases, the government entity, government-run oil and gascompany or agency has an option to purchase a certain share ofproduction.
� Lease agreements, which are typically used in North America andare usually governed by similar terms as licences. Participants mayinclude governments or private entities, and royalties are either paidin cash or in kind.
� Production-sharing contracts (PSCs) entered into with a government,government entity or government-run oil and gas company. PSCsgenerally oblige the independent oil and gas company, ascontractor, to provide all the financing and bear the risk ofexploration, development and production activities in exchange fora share of the production. Usually, this share consists of a fixed orvariable part that is reserved for the recovery of the contractor’s cost(cost oil). The remaining production is split with the government,government entity or government-run oil and gas company on a fixedor volume/revenue-dependent basis. In some cases, thegovernment, government entity or government-run oil and gascompany will participate in the rights and obligations of thecontractor and will share in the costs of development andproduction. Such participation can be across the venture or on afield-by-field basis. Additionally, as the price of oil or gas increasesabove certain predetermined levels, the independent oil and gascompany’s entitlement share of production normally decreases, andvice versa. Accordingly, its interest in a project may not be the sameas its entitlement.
Europe
DENMARKWe have a non-operating interest in a producing concession in Denmark(Shell interest 36.8%), which was granted in 1962 and will expire in 2042.The Danish government is one of our partners with a 20% interest.
IRELANDWe are the operator of the Corrib gas project (Shell interest 45%),which is at an advanced stage of construction. Corrib has the potentialto supply a significant proportion of the country’s gas requirement. Thepipeline connection between the offshore wells and the onshoreprocessing terminal is complete. Initial operation and testing ofequipment has commenced at the terminal, using gas from the nationalgrid in advance of first gas production from the field, which isexpected in 2015.
ITALYWe have two non-operating interests in Italy: the Val d’Agri producingconcession (Shell interest 39.23%) and the Tempa Rossa concession(Shell interest 25%). During the second quarter of 2014 we entered thefront-end engineering and design (FEED) phase on the non-operatedproject Val d’Agri Phase 2, which is expected to deliver peakproduction of some 65 thousand boe/d. The Tempa Rossa field isunder development and first oil is expected in 2018.
NETHERLANDSShell and ExxonMobil are 50:50 shareholders in NederlandseAardolie Maatschappij B.V. (NAM), the largest hydrocarbon producerin the Netherlands. An important part of NAM’s gas production comesfrom the onshore Groningen gas field, in which the Dutch governmenthas a 40% interest and NAM a 60% interest. NAM also has a 60%interest in the Schoonebeek oil field, which has been redevelopedusing enhanced oil recovery technology. NAM also operates asignificant number of other onshore gas fields and offshore gas fields inthe North Sea. In January 2015, the Minister of Economic Affairs ofthe Netherlands approved NAM’s production plan for the Groningenfield for 2014 to 2016. This caps production levels at 42.5 billioncubic metres for 2014 and 39.4 billion cubic metres in each of 2015and 2016, in an effort to diminish the potential for seismic activity.Since issuing his decision on the Groningen production plan, theMinister of Economic Affairs has stated that he intends to capproduction at 16.5 billion cubic metres for the first half of 2015.

STRATEGIC REPORT 27
SHELL ANNUAL REPORT AND FORM 20-F 2014 UPSTREAM
NORWAYWe are a partner in more than 30 production licences on theNorwegian continental shelf. We are the operator in 14 of these, ofwhich two are producing: the Ormen Lange gas field (Shell interest17.8%) and the Draugen oil field (Shell interest 44.6%). The otherproducing fields are Troll, Gjøa, Kvitebjørn and Valemon.
UKWe operate a significant number of our interests on the UK ContinentalShelf on behalf of a 50:50 joint arrangement with ExxonMobil. Mostof our UK oil and gas production comes from the North Sea. We havevarious non-operated interests in the Atlantic Margin area, principallyin the West of Shetlands area (Clair, Shell interest 28% andSchiehallion, Shell interest approximately 55%). We also have interestsranging from 20% to 49% in the Beryl area fields.
REST OF EUROPEShell also has interests in Albania, Austria, Germany, Greece,Greenland, Hungary, Slovakia, Spain and Ukraine.
Asia (including the Middle East and Russia)
BRUNEIShell and the Brunei government are 50:50 shareholders in BruneiShell Petroleum Company Sendirian Berhad (BSP). BSP has long-termoil and gas concession rights onshore and offshore Brunei, and sellsmost of its gas production to Brunei LNG Sendirian Berhad (BLNG,Shell interest 25%). BLNG was the first LNG plant in Asia-Pacific andsells most of its LNG on long-term contracts to customers in Asia.
We are the operator for the Block A concession (Shell interest 53.9%),which is under exploration and development, and also operator forexploration Block Q (Shell interest 50%). We have a 35% non-operating interest in the Block B concession, where gas andcondensate are produced from the Maharaja Lela Field. In February2014, the final investment decision was taken on the Maharaja LelaSouth development (Shell interest 35%). It is expected to deliver a totalpeak production of 35 thousand boe per day.
In addition, we have non-operating interests in deep-water explorationBlock CA-2 (Shell interest 12.5%) and in exploration Block N (Shellinterest 50%), both under PSCs.
CHINAWe operate the onshore Changbei tight-gas field under a PSC withChina National Petroleum Corporation (CNPC). The PSC includes thedevelopment of tight gas in different geological layers of the block. InSichuan, Shell and CNPC have agreed to appraise, develop andproduce from tight-gas and liquids-rich shale formations in the Jinqiublock under a PSC (Shell interest 49%) and have a PSC for shale-gasexploration, development and production in the Fushun Yongchuanblock (Shell interest 49%).
We also have an interest in three offshore oil and gas blocks in theYinggehai basin, each under a PSC (Shell interest 49%).
INDONESIAWe have a 35% participating interest in the offshore Masela blockwhere INPEX Masela is the operator. The Masela block contains theAbadi gas field. The operator has selected a floating LNG (FLNG)concept for the field’s development phase.
IRANShell transactions with Iran are disclosed separately. See“Section 13(r) of the US Securities Exchange Act of 1934 Disclosure”.
IRAQWe have a 45% interest in the Majnoon oil field that we operateunder a technical service contract that expires in 2030. The otherMajnoon shareholders are PETRONAS (30%) and the Iraqigovernment (25%), which is represented by the Missan OilCompany. Majnoon is located in southern Iraq and is one of theworld’s largest oil fields. In 2013, we successfully restartedproduction and Majnoon reached the milestone of first commercialproduction of 175 thousand boe/d. In 2014, production atMajnoon averaged 194 thousand boe/d.
We also have a 20% interest in the West Qurna 1 field. Ourparticipating interest in the West Qurna concession has increased from15% to 20% when the contract was renegotiated in 2014 and thegovernment share reduced from 25% to 5% and prorated to thefunding shareholders.
According to the provisions of both contracts, Shell’s equity entitlementvolumes will be lower than the Shell interest implies.
We also have a 44% interest in the Basrah Gas Company, whichgathers, treats and processes associated gas produced from theRumaila, West Qurna 1 and Zubair fields that was previously beingflared. The processed gas and associated products, such ascondensate and liquefied petroleum gas (LPG), are sold primarily tothe domestic market with the potential to export any surplus.
KAZAKHSTANWe have a 16.8% interest in the offshore Kashagan field, where theNorth Caspian Operating Company is the operator. Thisshallow-water field covers an area of approximately 3,400 squarekilometres. Phase 1 development of the field is expected to lead toplateau production of about 300 thousand boe/d, on a 100% basis,increasing further with additional phases of development. After the startof production from the Kashagan field in September 2013, operationshad to be stopped in October 2013 due to gas leaks from the sourgas pipeline. Following investigations, it has been decided that boththe oil and the gas pipeline will be replaced. Replacement activitiesare ongoing, with production expected to restart in 2017.
We have an interest of 55% in the Pearls PSC, covering an area ofapproximately 900 square kilometres in the Kazakh sector of theCaspian Sea. It includes two oil discoveries, Auezov and Khazar.
MALAYSIAWe explore for and produce oil and gas located offshore Sabah andSarawak under 19 PSCs, in which our interests range from 20% to85%.
Offshore Sabah, we operate five producing oil fields (Shell interestsranging from 29% to 50%). These include the Gumusut-Kakap deep-water field (Shell interest 29%) where production via a dedicatedfloating production system commenced in October 2014. We haveadditional interests ranging from 30% to 50% in PSCs for theexploration and development of four deep-water blocks. These includethe Malikai field (Shell interest 35%) which is being developed withShell as the operator. We also have a 21% interest in the SiakapNorth-Petai field, which commenced production in 2014, and a 30%interest in the Kebabangan field.
Offshore Sarawak, we are the operator of 17 producing gas fields(Shell interests ranging from 37.5% to 70%). Nearly all of the gasproduced is supplied to Malaysia LNG in Bintulu where we have a15% interest in the Dua (where our licence is due to expire in 2015)and Tiga LNG plants. We also have a 40% interest in the 2011Baram Delta EOR PSC and a 50% interest in Block SK-307.Additionally, we have interests in five exploration PSCs: DeepwaterBlock 2B, SK318, SK319, SK408 and SK320.

28 STRATEGIC REPORT
UPSTREAM SHELL ANNUAL REPORT AND FORM 20-F 2014
UPSTREAM CONTINUED
We operate a gas-to-liquids (GTL) plant (Shell interest 72%) adjacentto the Malaysia LNG facilities in Bintulu. Using Shell technology, theplant converts gas into high-quality middle distillates, drilling fluids,waxes and speciality products.
OMANWe have a 34% interest in Petroleum Development Oman (PDO); theOmani government has a 60% interest. PDO is the operator of morethan 160 oil fields, mainly located in central and southern Oman overan area of 114,000 square kilometres. The concession expires in2044. During 2014, the Amal steam enhanced oil recovery projecthas been ramping up towards its expected peak production followinga successful start-up in 2013.
We are also participating in the Mukhaizna oil field (Shell interest17%) where steam flooding, an enhanced oil recovery method, isbeing applied on a large scale.
We have a 30% interest in Oman LNG, which mainly supplies Asianmarkets under long-term contracts. We also have an 11% indirectinterest in Qalhat LNG, another LNG facility in the country.
QATARPearl in Qatar is the world’s largest GTL plant. Shell operates it undera development and production-sharing contract with the government.The fully integrated facility includes production, transport andprocessing of 1.6 billion scf/d of gas from Qatar’s North Field. It hasan installed capacity of about 140 thousand boe/d of high-qualityliquid hydrocarbon products and 120 thousand boe/d of NGL andethane. In 2014, Pearl produced 4.5 million tonnes of GTL products.
Of Pearl’s two trains, the first train is undergoing maintenance in thefirst quarter of 2015, for an estimated two month period.
We have a 30% interest in Qatargas 4, which comprises integratedfacilities to produce about 1.4 billion scf/d of gas from Qatar’s NorthField, an onshore gas-processing facility and an LNG train with acollective production capacity of 7.8 mtpa of LNG and 70 thousandboe/d of condensate and NGL. The LNG is shipped mainly to China,Europe and the United Arab Emirates.
RUSSIAWe have a 27.5% interest in Sakhalin-2, an integrated oil and gasproject located in a subarctic environment. In 2014, the projectproduced 320 thousand boe/d and the output of LNG exceeded10 million tonnes.
We have a 100% interest in an exploration and production licence forthe Lenzitsky block in the Yamalo Nenets Autonomous District. In2014, we returned the Arkatoisky (also in the Yamalo NenetsAutonomous District) and the Barun-Yustinsky (in Kalmykia) licenceblocks to the government.
We also have a 50% interest through Khanty-Mansiysk PetroleumAlliance V.O.F. (a 50:50 joint venture with Gazprom Neft) in threeexploration licence blocks in western Siberia: South Lungorsky 1,Yuilsky 4 and Yuilsky 5.
We have a 50% interest in the Salym fields in western Siberia, whereproduction was 130 thousand boe/d in 2014.
As a result of EU and US sanctions prohibiting defined oil and gasactivities in Russia, in 2014 we paused our liquids-rich shalesexploration activities, which were being undertaken through Salym andKhanty-Mansiysk Petroleum Alliance V.O.F.
UNITED ARAB EMIRATESIn Abu Dhabi, we held a concessionary interest of 9.5% in the oil andgas operations run by Abu Dhabi Company for Onshore OilOperations (ADCO) from 1939 to January 2014, when the licenceexpired. We also have a 15% interest in the licence of Abu DhabiGas Industries Limited (GASCO), which expires in 2028. GASCOexports propane, butane and heavier-liquid hydrocarbons, which itextracts from the wet gas associated with the oil produced by ADCO.
We also participate in a 30-year joint venture to potentially developthe Bab sour gas reservoirs in Abu Dhabi (Shell interest 40%). Shelland the Abu Dhabi National Oil Company are in a period ofcommercial and technical work that may lead to development, subjectto the signing of the respective joint-venture agreements.
REST OF ASIAShell also has interests in India, Japan, Jordan, the Philippines, SaudiArabia, Singapore, South Korea and Turkey.
Oceania
AUSTRALIAWe have interests in offshore production and exploration licences inthe North West Shelf (NWS) and Greater Gorgon areas of theCarnarvon Basin, as well as in the Browse Basin and Timor Sea. Someof these interests are held directly and others indirectly through ashareholding of 14% in Woodside, reduced from 23% by a sale ofshares in 2014. All interests in Australian assets quoted below aredirect interests.
Woodside is the operator of the Pluto LNG project. Woodside is alsothe operator on behalf of six joint-venture participants in the NWS gas,condensate and oil fields, which produced more than 500 thousandboe/d in 2014. Shell provides technical support for the NWSdevelopment.
We have a 50% interest in Arrow Energy Holdings Pty Limited (Arrow),a Queensland-based joint venture with PetroChina. Arrow owns coalbed methane assets and a domestic power business.
We have a 25% interest in the Gorgon LNG project, which involvesthe development of some of the largest gas discoveries to date inAustralia, beginning with the offshore Gorgon (Shell interest 25%) andJansz-lo (Shell interest 19.6%) fields. The Gorgon LNG project is underconstruction on Barrow Island and is expected to start before the endof 2016.
We are the operator of a permit in the Browse Basin in which twoseparate gas fields were found: Prelude in 2007 and Concerto in2009. We are developing these fields on the basis of our FLNGtechnology. The Prelude FLNG project (Shell interest 67.5%) isexpected to produce about 110 thousand boe/d of gas and NGL,delivering 3.6 mtpa of LNG, 1.3 mtpa of condensate and 0.4 mtpaof LPG. During 2014, construction of the Prelude FLNG projectcontinued, with a major milestone being the lifting of the first topsidemodules onto the deck of the hull.
We are also a partner in the Browse joint ventures (Shell interestsranging from 25% to 35%) covering the Brecknock, Calliance andTorosa gas fields. In 2013, the Browse joint venture selected Shell’sFLNG technology to progress to the basis of design phase of theproject.
STRATEGIC REPORT 29
SHELL ANNUAL REPORT AND FORM 20-F 2014 UPSTREAM
Our other interests include: a joint venture with Shell as the operator ofthe Crux gas and condensate field (Shell interest 82%); the Shell-operated AC/P41 block (Shell interest 75%); and the Sunrise gas fieldin the Timor Sea (Shell interest 26.6%). We sold our interest in theWheatstone-Iago joint venture and our 6.4% interest in the WheatstoneLNG project during the second quarter of 2014.
We are a partner in both Shell-operated and other, non-operated,exploration joint ventures in multiple basins including the Bonaparte,Exmouth Plateau, Greater Gorgon, Outer Canning and South Exmouth.
REST OF OCEANIAShell also has interests in New Zealand.
Africa
NIGERIAShell’s share of production, onshore and offshore, in Nigeria wasapproximately 300 thousand boe/d in 2014, compared withapproximately 265 thousand boe/d in 2013. Security issues andcrude oil theft in the Niger Delta continued to be significantchallenges in 2014.
OnshoreThe Shell Petroleum Development Company of Nigeria Ltd (SPDC) isthe operator of a joint arrangement (Shell interest 30%) that has morethan 25 Niger Delta onshore oil mining leases (OMLs), which expire in2019. To provide funding, modified carry agreements are in place forcertain key projects and are being reimbursed.
SPDC supplies gas to Nigeria LNG Ltd (NLNG) mainly through itsGbaran-Ubie and Soku projects. SPDC is undertaking a strategicreview of its interests in the eastern Niger Delta and has divested its30% interest in OML 24. Agreements have been signed for thedivestment of the SPDC interests in three other onshore OMLs;completion is subject to the consent of the Federal Government ofNigeria. Additional divestments may occur as a result of the strategicreview.
While the level of crude oil theft activities and sabotage in 2014 wassimilar to 2013, the impact on production was smaller due to variousmitigation measures. During 2014, force majeure related to securityissues, sabotage and crude oil theft was only declared once,compared with four times in 2013.
OffshoreOur main offshore deep-water activities are carried out by ShellNigeria Exploration and Production Company (SNEPCO, Shell interest100%) which has interests in four deep-water blocks. SNEPCOoperates OMLs 118 (including the Bonga field, Shell interest 55%) and135 (Bolia and Doro, Shell interest 55%) and holds a 43.75% interestin OML 133 (Erha) and a 50% interest in oil production lease245 (Zabazaba, Etan). SNEPCO also has an approximate 43%interest in the Bonga Southwest/Aparo development via its 55%interest in OML 118. Deep-water offshore activities are typicallygoverned through PSCs.
First oil was produced from the Bonga North West deep-waterdevelopment in the third quarter of 2014, while in October the finalinvestment decision on the Bonga Main phase 3 project was taken,which is expected to contribute some 40 thousand boe/d at peakproduction through the existing Bonga FPSO export facility.
SPDC also has an interest in six shallow-water offshore leases, ofwhich five are under final negotiation for extension for a period of 20years.
Liquefied natural gasShell has a 25.6% interest in NLNG, which operates six LNG trainswith a total capacity of 22.0 mtpa. In 2014, LNG production washigher than in 2013, as 2013 was impacted by gas supplyconstraints and the impact of a blockade of NLNG export facilities bythe Nigerian Maritime Administration and Safety Agency.
REST OF AFRICAShell also has interests in Algeria, Benin, Egypt, Gabon, Namibia,Somalia, South Africa, Tanzania and Tunisia.
North America
CANADAWe have more than 1,900 mineral leases in Canada, mainly inAlberta and British Columbia. We produce and market natural gas,NGL, synthetic crude oil and bitumen. In addition, we have significantexploration acreage offshore. Bitumen is a very heavy crude oilproduced through conventional methods as well as through enhancedoil recovery methods. Synthetic crude oil is produced by miningbitumen-saturated sands, extracting the bitumen from the sands andtransporting it to a processing facility where hydrogen is added toproduce a wide range of feedstocks for refineries.
Gas and liquids-rich shaleWe continued to develop fields in Alberta and British Columbia during2014 through drilling programmes and investment in infrastructure tofacilitate new production. We own and operate natural gasprocessing and sulphur-extraction plants in Alberta and natural gasprocessing plants in British Colombia. During 2014, we begandecommissioning our Burnt Timber gas facility in Alberta. Also in 2014we entered into a joint venture (Shell interest 50%) to evaluate aninvestment in an LNG export facility in Kitimat on the west coast ofCanada. This project completed FEED in 2014, with the finalinvestment decision expected not earlier than 2016 and cash flowsexpected early next decade.
Synthetic crude oilWe operate the Athabasca Oil Sands Project (AOSP) in north-eastAlberta as part of a joint arrangement (Shell interest 60%). The bitumenis transported by pipeline for processing at the Scotford Upgrader,which is also operated by Shell and located in the Edmonton area.The Quest carbon capture and storage project (Shell interest 60%),which is expected to capture and permanently store more than 1 mtpaof CO2 from the Scotford Upgrader, is under construction and isexpected to start operation towards the end of 2015.
We also have a number of other minable oil sands leases in theAthabasca region with expiry dates ranging from 2018 to 2025. Bycompleting a certain minimum level of development prior to theirexpiry, leases may be extended.
BitumenWe produce and market bitumen in the Peace River area of Alberta.Additional heavy oil resources and advanced recovery technologiesare under evaluation on approximately 1,200 square kilometres in theGrosmont oil sands area, also in northern Alberta. Construction of ourCarmon Creek project (Shell interest 100%), which began in 2013,continues. Carmon Creek is an in-situ project that is expected toproduce up to 80 thousand boe/d.

30 STRATEGIC REPORT
UPSTREAM SHELL ANNUAL REPORT AND FORM 20-F 2014
UPSTREAM CONTINUED
OffshoreWe have a 31.3% interest in the Sable Offshore Energy project, anatural-gas complex off the east coast of Canada and other acreagesin deep-water offshore Nova Scotia and Newfoundland. During2014, we sold a 50% interest in the Shelburne project offshore NovaScotia and retain a 50% interest as operator. We also have a numberof exploration licences off the west coast of British Columbia and in theMackenzie Delta in the Northwest Territories.
USAWe produce oil and gas in the Gulf of Mexico, heavy oil in Californiaand primarily tight gas and oil from liquids-rich shales in Pennsylvaniaand Texas. The majority of our oil and gas production interests areacquired under leases granted by the owner of the minerals underlyingthe relevant acreage, including many leases for federal onshore andoffshore tracts. Such leases usually run on an initial fixed term that isautomatically extended by the establishment of production for as longas production continues, subject to compliance with the terms of thelease (including, in the case of federal leases, extensive regulationsimposed by federal law).
Gulf of MexicoThe Gulf of Mexico is our major production area in the USA, andaccounts for over 50% of Shell’s oil and gas production in the country.We have an interest in approximately 450 federal offshore leases andour share of production averaged almost 225 thousand boe/d in2014. Key producing assets are Auger, Brutus, Enchilada, Mars,Na Kika, Olympus, Perdido, Ram-Powell and Ursa.
We continued significant exploration and development activities in theGulf of Mexico in 2014, with an average contracted offshore rig fleetof nine mobile rigs and five platform rigs. We also secured five blocksin the central and western lease sales in 2014.
OnshoreWe have significant tight-gas and liquids-rich shale acreage, includingin the Marcellus and Utica shales, centred on Pennsylvania in north-east USA and the Delaware Permian Basin in west Texas.
During 2014, we divested our interests in the Eagle Ford shaleformation in Texas, the Mississippi Lime in Kansas, the Utica shaleposition in Ohio and our acreage in the Sandwash Niobrara basins inColorado. In addition, we sold our Haynesville gas assets in Louisianafor cash and sold our Pinedale gas assets in Wyoming in exchange forcash and additional acreage in the Marcellus and Utica shale areas inPennsylvania.
In recent years, we have invested significant amounts in our tight-gasand liquids-rich shale portfolio. There is still a large amount of drillingthat must be conducted in our properties in order to establish our futureplans. Following the asset sales in 2014, the current focus is on de-risking and future development of our core assets, while continuing tolook for options to enhance the value of our portfolio in the currentmarket.
CaliforniaWe have a 51.8% interest in Aera Energy LLC (Aera), which has assetsin the San Joaquin Valley and Los Angeles Basin areas of southernCalifornia. Aera operates more than 15,000 wells, producingapproximately 130 thousand boe/d of heavy oil and gas.
AlaskaWe have more than 410 federal leases for exploration in the Beaufortand Chukchi seas in Alaska. In January 2014, we decided to suspendour 2014 drilling campaign due to obstacles raised by the NinthCircuit Court of Appeal’s decision with regard to the Department of theInterior’s (DOI) 2008 oil and gas lease sale in the Chukchi Sea.In August 2014, we submitted an Exploration Plan for a two-rigprogramme in the Chukchi Sea. In November 2014, the DOI issued adraft Supplemental Environmental Impact Statement (SEIS) and thecomment period closed in December 2014. We anticipate that theDOI will continue to work in accordance with their proposed timelineto complete the SEIS in sufficient time to allow us to pursue our plans todrill in 2015.
REST OF NORTH AMERICAShell also has interests in Mexico.
South America
BRAZILWe are the operator of several producing fields in the Campos Basin,offshore Brazil. They include the Bijupirá and Salema fields (Shellinterest 80%) and the BC-10 field (Shell interest 50%). We startedproduction from the BC-10 Phase 2 project in October 2013, whichreached peak production of 41 thousand boe/d in 2014. In 2013,we exercised our pre-emptive rights to acquire an additional 23% inthe BC-10 project and in 2014 we sold a 23% interest to QatarPetroleum International, which returned our interest to 50%.
We operate one block in the São Francisco onshore basin area (Shellinterest 60%) and operate one offshore exploration block in the SantosBasin, BM-S-54 (Shell interest 80%). We also have an interest in oneoffshore exploration block in the Espirito Santo basins, BM-ES-27 (Shellinterest 17.5%). In November 2014, we divested our 20% interest inBM-ES-23.
We also have an 18% interest in Brazil Companhia de Gas de SãoPaulo (Comgás), a natural gas distribution company in the state of SãoPaulo.
We have a 20% interest in a 35-year PSC to develop the Libra pre-saltoil field located in the Santos Basin.
In January 2015, we reached an agreement to divest our operatinginterest in our deep-water production asset Bijupira Salema, pendingregulatory approvals.
REST OF SOUTH AMERICAThe acquisition of part of Repsol S.A.’s LNG portfolio was completedin January 2014, including LNG supply positions in Peru and Trinidadand Tobago, adding 7.2 mtpa of directly managed LNG volumesthrough long-term off-take agreements, including 4.2 mtpa of equityLNG plant capacity.
Shell also has interests in Argentina, Colombia, French Guiana andVenezuela.
TradingWe market a portion of our share of equity production of LNG andalso trade LNG volumes around the world through our hubs in Dubaiand Singapore. We also market and trade natural gas, power,emission rights and crude oil from certain Shell Upstream operations inthe Americas and Europe.
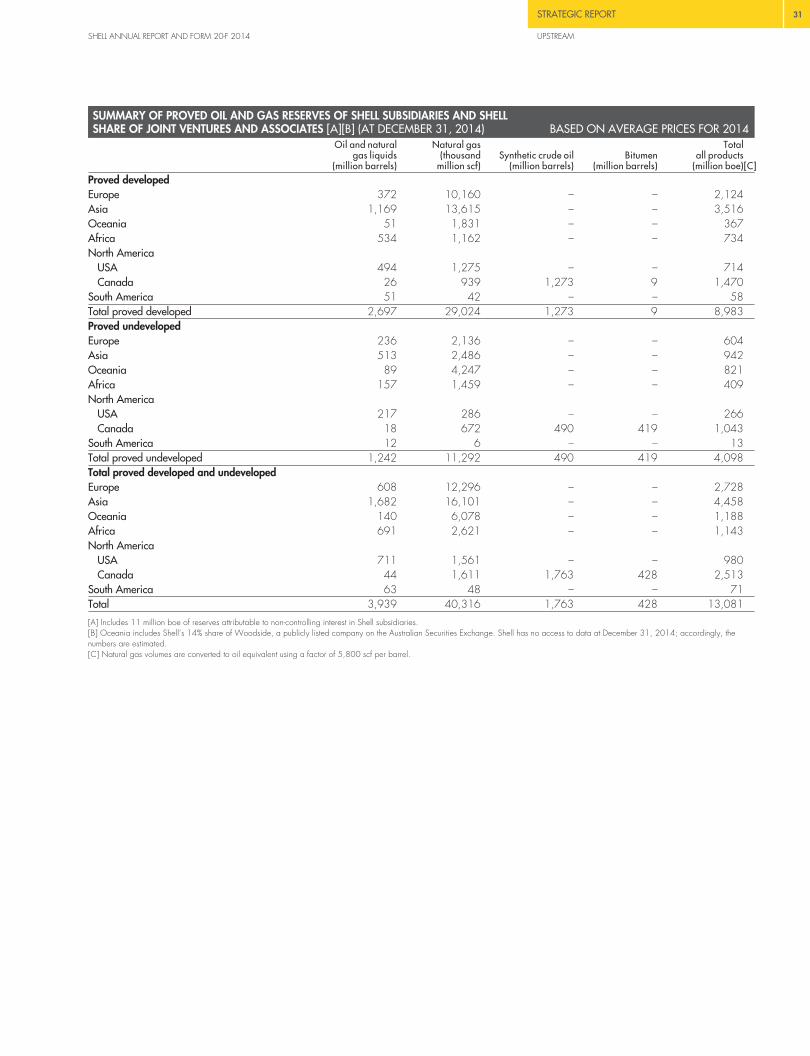
STRATEGIC REPORT 31
SHELL ANNUAL REPORT AND FORM 20-F 2014 UPSTREAM
SUMMARY OF PROVED OIL AND GAS RESERVES OF SHELL SUBSIDIARIES AND SHELLSHARE OF JOINT VENTURES AND ASSOCIATES [A][B] (AT DECEMBER 31, 2014) BASED ON AVERAGE PRICES FOR 2014
Oil and naturalgas liquids
(million barrels)
Natural gas(thousand
million scf)Synthetic crude oil
(million barrels)Bitumen
(million barrels)
Totalall products
(million boe)[C]Proved developedEurope 372 10,160 – – 2,124Asia 1,169 13,615 – – 3,516Oceania 51 1,831 – – 367Africa 534 1,162 – – 734North America
USA 494 1,275 – – 714Canada 26 939 1,273 9 1,470
South America 51 42 – – 58Total proved developed 2,697 29,024 1,273 9 8,983Proved undevelopedEurope 236 2,136 – – 604Asia 513 2,486 – – 942Oceania 89 4,247 – – 821Africa 157 1,459 – – 409North America
USA 217 286 – – 266Canada 18 672 490 419 1,043
South America 12 6 – – 13Total proved undeveloped 1,242 11,292 490 419 4,098Total proved developed and undevelopedEurope 608 12,296 – – 2,728Asia 1,682 16,101 – – 4,458Oceania 140 6,078 – – 1,188Africa 691 2,621 – – 1,143North America
USA 711 1,561 – – 980Canada 44 1,611 1,763 428 2,513
South America 63 48 – – 71Total 3,939 40,316 1,763 428 13,081
[A] Includes 11 million boe of reserves attributable to non-controlling interest in Shell subsidiaries.[B] Oceania includes Shell’s 14% share of Woodside, a publicly listed company on the Australian Securities Exchange. Shell has no access to data at December 31, 2014; accordingly, thenumbers are estimated.[C] Natural gas volumes are converted to oil equivalent using a factor of 5,800 scf per barrel.

32 STRATEGIC REPORT
UPSTREAM SHELL ANNUAL REPORT AND FORM 20-F 2014
UPSTREAM CONTINUED
LOCATION OF OIL AND GAS EXPLORATION ANDPRODUCTION ACTIVITIES [A] (AT DECEMBER 31, 2014)
Exploration
Developmentand/or
production Shell operator[B]
EuropeAlbania �
Denmark � �
Germany � �
Greenland � �
Ireland � �
Italy �
Netherlands � � �
Norway � � �
UK � � �
Ukraine � �
Asia [C]Brunei � � �
China � � �
Indonesia � �
Iraq � �
Jordan � �
Kazakhstan � �
Malaysia � � �
Oman � �
Philippines � � �
Qatar � � �
Russia � � �
Saudi Arabia �
Turkey � �
OceaniaAustralia � � �
New Zealand � � �
AfricaBenin �
Egypt � �
Gabon � � �
Namibia � �
Nigeria � � �
South Africa � �
Tanzania �
Tunisia � �
North AmericaUSA � � �
Canada � � �
South AmericaArgentina � � �
Brazil � � �
Colombia � �
French Guiana � �
[A] Includes joint ventures and associates. Where a joint venture or associate has propertiesoutside its base country, those properties are not shown in this table.[B] In several countries where “Shell operator” is indicated, Shell is the operator of some butnot all exploration and/or production ventures.[C] Shell suspended all exploration and production activities in Syria in December 2011.
CAPITAL INVESTMENT IN OIL AND GASEXPLORATION AND PRODUCTIONACTIVITIES BY GEOGRAPHICAL AREA $ MILLION
2014 2013
Oil and gas exploration and productionactivities
Europe [A] 4,273 4,770Asia 3,875 5,421Oceania 5,068 6,237Africa 2,825 2,639North America – USA 8,210 9,155North America – Canada 3,162 3,154South America 1,109 4,158
Total 28,522 35,534Other Upstream activities [B] 2,771 4,769Total Upstream [C] 31,293 40,303
[A] Includes Greenland.[B] Comprise LNG, GTL, trading and wind activities.[C] See “Non-GAAP measures reconciliations” for a reconciliation to capital expenditure.

STRATEGIC REPORT 33
SHELL ANNUAL REPORT AND FORM 20-F 2014 UPSTREAM
AVERAGE REALISED PRICE BY GEOGRAPHICAL AREA
OIL AND NATURAL GAS LIQUIDS $/BARREL2014 2013 2012
Shellsubsidiaries
Shell share ofjoint ventures
and associatesShell
subsidiaries
Shell share ofjoint ventures
and associatesShell
subsidiaries
Shell share ofjoint ventures
and associatesEurope 94.57 89.68 105.23 99.27 108.13 104.60Asia 89.47 96.85 96.46 70.34 107.76 67.33Oceania 82.26 88.07[A] 90.50 91.91[A] 91.62 90.14[A]Africa 100.55 – 110.14 – 112.45 –North America – USA 87.90 – 98.10[B] – 103.59 110.00North America – Canada 59.19 – 63.14 – 68.31 –South America 88.68 – 97.17 94.01 100.01 97.33Total 91.09 95.87 99.83[B] 72.69 107.15 76.01
[A] Includes Shell’s 14% share of Woodside as from June 2014 (previously: 23% as from April 2012; 24% before that date), a publicly listed company on the Australian Securities Exchange. Wehave limited access to data; accordingly, the numbers are estimated.[B] Average realised prices have been corrected from $101.00/b (USA) and $100.42/b (Total).
NATURAL GAS $/THOUSAND SCF2014 2013 2012
Shellsubsidiaries
Shell share ofjoint ventures
and associatesShell
subsidiaries
Shell share ofjoint ventures
and associatesShell
subsidiaries
Shell share ofjoint ventures
and associatesEurope 8.58 8.26 10.29 9.17 9.48 9.64Asia 4.57 11.50 4.51 10.73 4.81 10.13Oceania 10.49 11.01[A] 11.55 9.45[A] 11.14 9.48[A]Africa 2.71 – 2.84 – 2.74 –North America – USA 4.52 – 3.92 – 3.17 7.88North America – Canada 4.39 – 3.26 – 2.36 –South America 2.85 – 2.91 0.42 2.63 1.04Total 5.68 9.72 5.85 9.72 5.53 9.81
[A] Includes Shell’s 14% share of Woodside as from June 2014 (previously: 23% as from April 2012; 24% before that date), a publicly listed company on the Australian Securities Exchange. Wehave limited access to data; accordingly, the numbers are estimated.
SYNTHETIC CRUDE OIL $/BARREL2014 2013 2012Shell
subsidiariesShell
subsidiariesShell
subsidiariesNorth America – Canada 81.83 87.24 81.46
BITUMEN $/BARREL2014 2013 2012Shell
subsidiariesShell
subsidiariesShell
subsidiariesNorth America – Canada 70.19 67.40 68.97

34 STRATEGIC REPORT
UPSTREAM SHELL ANNUAL REPORT AND FORM 20-F 2014
UPSTREAM CONTINUED
AVERAGE PRODUCTION COST BY GEOGRAPHICAL AREA
OIL, NATURAL GAS LIQUIDS AND NATURAL GAS [A] $/BOE2014 2013 2012
Shellsubsidiaries
Shell share ofjoint ventures
and associatesShell
subsidiaries
Shell share ofjoint ventures
and associatesShell
subsidiaries
Shell share ofjoint ventures
and associatesEurope 19.47 4.25 17.66 3.57 14.50 3.56Asia 7.87 7.62 6.52 5.74 7.53 4.71Oceania 13.62 14.44[B] 11.55 13.17[B] 9.06 16.97[B]Africa 14.86 – 14.43 – 9.52 –North America – USA 21.35 – 21.57 – 20.09 18.24North America – Canada 22.96 – 22.20 – 19.47 –South America 25.26 – 37.72 16.96 16.36 11.01Total 15.10 6.68 14.35 5.52 12.47 6.05
[A] Natural gas volumes are converted to oil equivalent using a factor of 5,800 scf per barrel.[B] Includes Shell’s 14% share of Woodside as from June 2014 (previously: 23% as from April 2012; 24% before that date), a publicly listed company on the Australian Securities Exchange. Wehave limited access to data; accordingly, the numbers are estimated.
SYNTHETIC CRUDE OIL $/BARREL2014 2013 2012Shell
subsidiariesShell
subsidiariesShell
subsidiariesNorth America – Canada 42.46 41.81[A] 43.40[A]
[A] Average production costs have been corrected from $38.22/b (2013) and $40.40/b (2012).
BITUMEN $/BARREL2014 2013 2012Shell
subsidiariesShell
subsidiariesShell
subsidiariesNorth America – Canada 23.24 23.03 24.11

STRATEGIC REPORT 35
SHELL ANNUAL REPORT AND FORM 20-F 2014 UPSTREAM
OIL AND GAS PRODUCTION (AVAILABLE FOR SALE)
CRUDE OIL AND NATURAL GAS LIQUIDS [A] THOUSAND BARRELS2014 2013 2012
Shellsubsidiaries
Shell share ofjoint ventures
and associatesShell
subsidiaries
Shell share ofjoint ventures
and associatesShell
subsidiaries
Shell share ofjoint ventures
and associatesEurope
Denmark 18,834 – 20,927 – 26,748 –Italy 11,792 – 11,997 – 14,127 –Norway 14,893 – 14,589 – 14,568 –UK 14,746 – 14,445 – 22,075 –Other [B] 849 1,986 934 1,952 1,031 1,592
Total Europe 61,114 1,986 62,892 1,952 78,549 1,592Asia
Brunei 648 18,576 564 20,011 663 26,521Iraq 19,218 – 8,416 – 2,032 –Malaysia 16,754 – 15,441 – 14,916 –Oman 74,781 – 74,527 – 75,075 –Russia 23,579 10,403 25,152 10,527 – 38,180United Arab Emirates – 2,397 – 58,104 – 53,103Other [B] 27,165 8,115 25,202 8,155 19,668 8,341
Total Asia 162,145 39,491 149,302 96,797 112,354 126,145Total Oceania 9,191 3,688 9,371 4,771 10,181 6,494Africa
Gabon 12,144 – 10,781 – 13,957 –Nigeria 69,851 – 63,800 – 87,592 –Other [B] 5,008 – 4,254 – 4,477 –
Total Africa 87,003 – 78,835 – 106,026 –North America
USA 98,895 – 86,670 – 56,630 24,540Canada 8,389 – 7,626 – 5,456 –
Total North America 107,284 – 94,296 – 62,086 24,540South America
Brazil 16,575 – 7,706 – 12,628 –Other [B] 361 – 273 3,327 330 3,495
Total South America 16,936 – 7,979 3,327 12,958 3,495Total 443,673 45,165 402,675 106,847 382,154 162,266
[A] Includes natural gas liquids. Royalty sales are excluded. Reflects 100% of production attributable to subsidiaries except in respect of PSCs, where the figures shown represent the entitlement ofthe subsidiaries concerned under those contracts.[B] Comprises countries where 2014 production was lower than 7,300 thousand barrels or where specific disclosures are prohibited.

36 STRATEGIC REPORT
UPSTREAM SHELL ANNUAL REPORT AND FORM 20-F 2014
UPSTREAM CONTINUED
NATURAL GAS [A] MILLION STANDARD CUBIC FEET2014 2013 2012
Shellsubsidiaries
Shell share ofjoint ventures
and associatesShell
subsidiaries
Shell share ofjoint ventures
and associatesShell
subsidiaries
Shell share ofjoint ventures
and associatesEurope
Denmark 49,708 – 53,283 – 73,809 –Germany 66,718 – 73,123 – 79,558 –Netherlands – 581,028 – 721,344 – 661,548Norway 252,284 – 256,396 – 260,742 –UK 104,346 – 109,470 – 120,212 –Other [B] 15,840 – 15,409 – 15,849 –
Total Europe 488,896 581,028 507,681 721,344 550,170 661,548Asia
Brunei 22,228 155,244 18,442 164,446 18,616 187,231China 53,065 – 60,034 – 48,083 –Malaysia 241,908 – 238,940 – 209,505 –Russia 4,170 128,175 4,261 126,764 – 136,702Other [B] 420,169 118,198 378,412 115,469 291,132 115,870
Total Asia 741,540 401,617 700,089 406,679 567,336 439,803Oceania
Australia 132,801 87,830 125,654 100,707 128,869 88,834New Zealand 69,052 – 61,407 – 66,627 –
Total Oceania 201,853 87,830 187,061 100,707 195,496 88,834Africa
Egypt 54,079 – 46,072 – 51,589 –Nigeria 234,599 – 201,311 – 271,051 –
Total Africa 288,678 – 247,383 – 322,640 –North America
USA 360,846 – 394,538 – 388,647 1,816Canada 214,756 – 231,897 – 225,265 –
Total North America 575,602 – 626,435 – 613,912 1,816Total South America 12,449 – 11,896 444 16,213 377Total 2,309,018 1,070,475 2,280,545 1,229,174 2,265,767 1,192,378
[A] Reflects 100% of production attributable to subsidiaries except in respect of PSCs, where the figures shown represent the entitlement of the companies concerned under those contracts.[B] Comprises countries where 2014 production was lower than 41,795 million scf or where specific disclosures are prohibited.
SYNTHETIC CRUDE OIL THOUSAND BARRELS2014 2013 2012Shell
subsidiariesShell
subsidiariesShell
subsidiariesNorth America – Canada 46,934 46,017 45,903
BITUMEN THOUSAND BARRELS2014 2013 2012Shell
subsidiariesShell
subsidiariesShell
subsidiariesNorth America – Canada 5,779 6,903 7,401

STRATEGIC REPORT 37
SHELL ANNUAL REPORT AND FORM 20-F 2014 UPSTREAM
LNG AND GTL PLANTS AT DECEMBER 31, 2014
LNG LIQUEFACTION PLANTS IN OPERATION
LocationShell
interest (%)[A]100% capacity
(mtpa)[B]Atlantic LNG Point Fortin 20-25 14.8Australia North West Shelf Karratha 19 16.3Australia Pluto 1 Karratha 12 4.3Brunei LNG Lumut 25 7.8Malaysia LNG (Dua) [C] Bintulu 15 9.6Malaysia LNG (Tiga) Bintulu 15 7.7Nigeria LNG Bonny 26 22.0Oman LNG Sur 30 7.1Peru LNG Pampa Melchorita 20 4.5Qalhat (Oman) LNG Sur 11 3.7Qatargas 4 Ras Laffan 30 7.8Sakhalin LNG Prigorodnoye 27.5 9.6
[A] Interest may be held via indirect shareholding.[B] As reported by the operator.[C] Our interest in the Dua plant is due to expire in 2015.
LNG LIQUEFACTION PLANTS UNDER CONSTRUCTION
LocationShell
interest (%)100% capacity
(mtpa)Gorgon Barrow Island 25 15.3MMLS LNG Moveable units [A] 49 2.5Prelude Offshore Australia 67.5 3.6[A] Location pending final investment decision.
GTL PLANTS IN OPERATION
CountryShell
interest (%)100% capacity
(b/d)Bintulu Malaysia 72 14,700Pearl Qatar 100 140,000
EQUITY LNG SALES VOLUMES
SHELL SHARE OF EQUITY LNG SALES VOLUMES MILLION TONNES2014 2013 2012
Australia 3.7 3.7 3.6Brunei 1.5 1.7 1.7Malaysia 2.7 2.6 2.5Nigeria 5.0 4.4 5.1Oman 1.8 2.0 1.9Peru 0.8 – –Qatar 2.4 2.3 2.4Sakhalin 2.9 2.9 3.0Trinidad and Tobago 3.2 – –Total 24.0 19.6 20.2

38 STRATEGIC REPORT
UPSTREAM SHELL ANNUAL REPORT AND FORM 20-F 2014
UPSTREAM CONTINUED
EARNINGS AND CASH FLOW INFORMATION
2014 $ MILLIONNorth America South
AmericaEurope[A] Asia Oceania Africa USA Other TotalRevenue 17,891 35,629 3,299 11,129 13,553 9,250 1,548 92,299Share of profit of joint ventures and
associates 1,128 3,173 266 937 (4) 77 (75) 5,502Interest and other income 68 845 2,292 503 327 (71) 65 4,029Total revenue and other income 19,087 39,647 5,857 12,569 13,876 9,256 1,538 101,830Purchases excluding taxes 5,848 10,113 344 1,505 1,909 3,383 (63) 23,039Production and manufacturing expenses 3,255 4,905 809 2,483 4,572 3,391 678 20,093Taxes other than income tax 264 948 211 836 201 – 165 2,625Selling, distribution and administrative
expenses 777 103 9 1 136 7 22 1,055Research and development 642 28 – – 134 51 – 855Exploration 458 1,331 232 307 1,548 88 260 4,224Depreciation, depletion and amortisation 1,815 4,621 430 2,054 6,665 1,808 475 17,868Interest expense 364 90 55 144 211 60 29 953Income before taxation 5,664 17,508 3,767 5,239 (1,500) 468 (28) 31,118Taxation 3,599 7,542 2,103 2,416 (626) 78 165 15,277Income after taxation 2,065 9,966 1,664 2,823 (874) 390 (193) 15,841Net cash from operating activities 3,975 14,619 1,684 4,629 3,935 2,685 312 31,839Less: working capital movements 1,148 (1,470) (845) 616 (994) 360 (285) (1,470)Net cash from operating activities
excluding working capital movements 2,827 16,089 2,529 4,013 4,929 2,325 597 33,309
[A] Includes Greenland.
2013 $ MILLIONNorth America South
AmericaEurope[A] Asia Oceania Africa USA Other TotalRevenue 23,144 35,916 3,414 11,007 9,762 8,878 748 92,869Share of profit of joint ventures and
associates 1,469 3,235 111 1,162 1 55 87 6,120Interest and other income (123) 572 172 (14) 20 52 (20) 659Total revenue and other income 24,490 39,723 3,697 12,155 9,783 8,985 815 99,648Purchases excluding taxes 9,088 9,761 290 1,378 (1,175) 2,989 48 22,379Production and manufacturing expenses 2,998 4,162 762 1,978 4,588 3,594 389 18,471Taxes other than income tax 328 1,254 226 963 223 – 85 3,079Selling, distribution and administrative
expenses 993 85 7 1 47 26 35 1,194Research and development 648 15 – – 178 106 – 947Exploration 627 1,082 396 354 1,790 312 717 5,278Depreciation, depletion and amortisation 1,444 3,114 434 1,293 7,954 2,550 160 16,949Interest expense 359 76 47 133 210 61 24 910Income before taxation 8,005 20,174 1,535 6,055 (4,032) (653) (643) 30,441Taxation 4,883 10,977 475 3,100 (1,500) (203) 71 17,803Income after taxation 3,122 9,197 1,060 2,955 (2,532) (450) (714) 12,638Net cash from operating activities 5,215 12,834 1,717 5,027 3,775 1,414 132 30,114Less: working capital movements 1,251 (88) (929) 1,391 (86) (346) 119 1,312Net cash from operating activities
excluding working capital movements 3,964 12,922 2,646 3,636 3,861 1,760 13 28,802
[A] Includes Greenland.

STRATEGIC REPORT 39
SHELL ANNUAL REPORT AND FORM 20-F 2014 UPSTREAM
2012 $ MILLIONNorth America South
AmericaEurope[A] Asia Oceania Africa USA Other TotalRevenue 26,569 31,438 3,463 14,966 8,657 8,003 1,454 94,550Share of profit of joint ventures and
associates 1,667 3,866 395 950 1,150 25 (52) 8,001Interest and other income 70 793 2,107 984 569 149 164 4,836Total revenue and other income 28,306 36,097 5,965 16,900 10,376 8,177 1,566 107,387Purchases excluding taxes 10,689 8,699 277 1,878 659 2,958 85 25,245Production and manufacturing expenses 2,651 3,761 834 1,915 3,477 3,434 282 16,354Taxes other than income tax 350 410 318 1,248 39 – 144 2,509Selling, distribution and administrative
expenses 843 196 4 3 126 19 20 1,211Research and development 595 16 – – 135 121 2 869Exploration 398 460 175 699 802 372 198 3,104Depreciation, depletion and amortisation 1,583 1,903 306 1,277 3,930 2,072 316 11,387Interest expense 311 68 34 116 170 53 22 774Income before taxation 10,886 20,584 4,017 9,764 1,038 (852) 497 45,934Taxation 6,421 11,205 1,095 5,361 (121) (408) 137 23,690Income after taxation 4,465 9,379 2,922 4,403 1,159 (444) 360 22,244Net cash from operating activities 6,677 11,457 2,107 6,615 4,483 1,047 675 33,061Less: working capital movements 18 (587) 469 (410) 526 (73) 167 110Net cash from operating activities
excluding working capital movements 6,659 12,044 1,638 7,025 3,957 1,120 508 32,951
[A] Includes Greenland.

40 STRATEGIC REPORT
DOWNSTREAM SHELL ANNUAL REPORT AND FORM 20-F 2014
DOWNSTREAMKEY STATISTICS $ MILLION
2014 2013 2012Segment earnings [A] 3,411 3,869 5,382Including:
Revenue (including inter-segment sales) 378,046 404,427 424,410Share of earnings of joint ventures and associates [A] 1,698 1,525 1,354Production and manufacturing expenses 9,845 9,807 9,539Selling, distribution and administrative expenses 12,489 13,114 12,860Depreciation, depletion and amortisation 6,619 4,421 3,083
Net capital investment [B] 3,079 4,885 4,275Refinery availability (%) [C] 94 92 93Chemical plant availability (%) [C] 85 92 91Refinery processing intake (thousand b/d) 2,903 2,915 2,819Oil products sales volumes (thousand b/d) 6,365 6,164 6,235Chemicals sales volumes (thousand tonnes) 17,008 17,386 18,669
[A] See Notes 2 and 4 to the “Consolidated Financial Statements”. Segment earnings are presented on a current cost of supplies basis.[B] See “Non-GAAP measures reconciliation”.[C] The basis of calculation differs from that used for the “Refinery and chemical plant availability” measure in “Performance indicators”, which excludes downtime due to uncontrollable factors.
OVERVIEWShell’s Downstream organisation is made up of a number of differentbusiness activities, part of an integrated value chain, that collectivelyturn crude oil into a range of refined products, which are moved andmarketed around the world for domestic, industrial and transport use.The products we sell include gasoline, diesel, heating oil, aviationfuel, marine fuel, liquefied natural gas (LNG) for transport, lubricants,bitumen, sulphur and liquefied petroleum gas (LPG). In addition, weproduce and sell petrochemicals for industrial use worldwide.
Our Downstream activities comprise Refining, Pipelines, Marketing,Chemicals and Trading and Supply. Marketing includes Retail,Lubricants, Business to Business (B2B) and Alternative Energies.Chemicals has major manufacturing plants, located close to refineries,and its own marketing network. In Trading and Supply, we trade crudeoil, oil products and petrochemicals, to optimise feedstocks for Refiningand Chemicals, to supply our Marketing businesses and third parties,and for our own profit.
BUSINESS CONDITIONSIndustry refining margins were higher on average in 2014 than in2013 in the key refining hubs of the USA and Singapore, and werelittle changed in Europe. In particular, margins improved in the USAwhere increased domestic crude oil and natural gas productionlowered oil acquisition costs (relative to international prices). Somedemand growth, especially around the summer driving season in theUSA, also contributed to higher US Gulf Coast margins.
In 2015, increased demand for middle distillates is expected to be akey driver of refining margins, supported by demand for gasoline inthe middle of the year. However, the overall outlook remains unclearbecause of continuing economic uncertainty, geopolitical tensions insome regions that could lead to supply disruptions and overcapacity inthe global refining market.
In Chemicals, industry naphtha cracker margins increased from 2013,particularly in Asia where there was less cracker capacity available.US ethane cracker margins were high relative to naphtha crackermargins in other regions due to ample ethane supply. The outlook forpetrochemicals for 2015 is dependent on the growth of the globaleconomy, especially in Asia, and developments in raw material prices.
EARNINGS 2014-2013Segment earnings are presented on a current cost of supplies basis(see “Summary of results”), which in 2014 were $4,366 million higherthan earnings if presented on first-in, first-out basis (2013:$353 million higher). Segment earnings in 2014 were$3,411 million, 12% lower than 2013. Earnings in 2014 includednet charges of $2,854 million, mainly impairments, and in 2013included net charges of $597 million, described at the end of thissection. Excluding the impact of these net charges, earnings in 2014were 40% higher. The improvement was driven by higher realisedrefining margins from improved operating performance and a strongerindustry environment, higher earnings from Trading and Supply, andlower costs mainly as a result of divestments. Partly offsetting thesebenefits were lower earnings from Chemicals, impacted by marketconditions for intermediate products and shutdowns of some units atMoerdijk in the Netherlands.
Refining made a profit in 2014, compared with a loss in 2013.Realised refining margins were significantly higher overall and higherin all regions except the US West Coast. The increase was driven byoperational improvements and stronger industry margin environments inmost regions. In Europe, despite a slightly weaker margin environment,realised margins benefited from strong operational performances at thePernis and Rheinland sites. Realised margins in Canada were higher in2014 because the Scotford Upgrader was shut for part of 2013.US Gulf Coast realised margins benefited from improved operationalperformance. The margin environment in Asia improved. There was aloss of margins from the Geelong refinery in Australia which was soldin 2014. US West Coast realised margins were lower mainly due to amaintenance shutdown at Puget Sound in 2014. Motiva’s performancewas stronger in 2014 through both improved operational performanceand a stronger margin environment. Overall refinery availabilityincreased to 94% from 92% in 2013.
Trading and Supply earnings were significantly higher than 2013,benefiting from increased price volatility and profitable short positions inan oil market where prices declined during the second half of 2014.
Chemicals earnings were lower than in 2013, impacted by twoincidents at Moerdijk that disrupted operations. The first, an explosionand fire at the MSPO2 unit, caused a partial shutdown of the site buthad only limited financial impact. The second incident, a contaminationof the steam boiler water feed, caused a temporary shutdown of all unitsfor the fourth quarter of 2014 with more significant financial impact.

STRATEGIC REPORT 41
SHELL ANNUAL REPORT AND FORM 20-F 2014 DOWNSTREAM
We expect a significant impact to earnings in 2015 from some unitscontinuing to be non-operational. Additionally, earnings decreased forintermediate products due to weaker general market conditionscompared with 2013. Sales prices were higher in 2013 due toindustry supply constraints caused by competitor production outages.
Marketing earnings were higher than in 2013 across most businessesdespite the divestment of businesses in Australia and Italy. Driving theimprovement were stronger unit margins, helped by premium productpricing in Retail, active price management in Lubricants and LPG, andlower costs in Retail. Earnings from Raizen, our biofuels joint venture inBrazil, were higher than in 2013 despite the negative effects of theweakening Brazilian real, mainly as a result of stronger unit margins inthe Marketing business.
Oil products sales volumes were 3% higher than in 2013. HigherTrading volumes more than offset lower Marketing volumes, whichwere impacted by the sale of businesses in Australia and Italy.Excluding these portfolio effects, Marketing volumes were similar to2013.
Chemicals sales volumes were 2% lower than in 2013, mainly as aresult of plant outages at Moerdijk. Chemicals plant availabilitydecreased to 85% from 92% in 2013, mainly due to these outages.
Overall, operating expenses were 3% lower than in 2013. Productionand manufacturing expenses were similar to 2013 as the effects ofinflation and higher maintenance costs were offset by more favourableexchange rates and divestments. Selling, distribution andadministrative expenses decreased due to divestments, reducedspending related to lower volumes in some businesses and morefavourable exchange rates.
Depreciation, depletion and amortisation significantly increased in2014 compared with 2013, mainly due to impairments describedbelow. Excluding the impairments, depreciation decreased comparedwith 2013 due to divestments and reduced depreciation from impairedassets.
Segment earnings in 2014 included a net charge of $2,854 million,primarily from impairments (mainly in respect of refineries in Asia andEurope) and also from restructuring charges, fair value accounting ofcommodity derivatives and a provision connected to a prior year saleobligation. Partly offsetting these charges was a gain related to Dutchpension plan amendments.
Segment earnings in 2013 included a net charge of $597 million,resulting primarily from impairments and deferred tax adjustmentswhich were partly offset by a beneficial tax rate change in the UK andgains on divestments.
EARNINGS 2013-2012Segment earnings in 2013 were $3,869 million, 28% lower than in2012. Segment earnings were 16% lower excluding the impact of thenet charge of $597 million in 2013 described above and the net gainof $39 million in 2012 resulting from net gains on divestments and atax credit, partly offset by legal and environmental provisions. The 16%decrease was mostly due to Refining making a loss, due to weakermargins, which was partly offset by higher contributions fromChemicals and Trading. Contributions from Marketing were broadlysimilar to 2012.
Realised refining margins were significantly lower than in 2012 due toa deterioration in industry conditions. Industry refining margins werelower in all regions, except for US Gulf Coast margins which wereslightly higher. Lower US West Coast margins in 2013 reflected anexcess supply of gasoline in the region. Margins in 2013 were alsoimpacted by a narrower spread between the Brent and West Texas
Intermediate (WTI) crude oil price benchmarks, as an expansion inpipeline capacity increased the ability to move oil from the landlockedarea of Cushing, Oklahoma, where WTI is delivered. In Europe,margins remained weak due to: low regional demand; increasedimports from Asia, Russia and the USA; and limited exportopportunities to the USA due to high gasoline inventories there.Margins in Asia-Pacific were impacted by excess capacity and weakdemand due to an economic slowdown.
NET CAPITAL INVESTMENTNet capital investment was $3.1 billion in 2014 compared with$4.9 billion in 2013. The decrease was primarily due to higherdivestment proceeds, which were $2.8 billion in 2014 compared with$0.6 billion in 2013.
Capital investment was $5.9 billion in 2014 compared with$5.5 billion in 2013. In Refining and Chemicals, it increased by $0.5billion to $3.7 billion and in Marketing it decreased by $0.1 billion to$2.2 billion. In 2014, 54% of our capital investment was used tomaintain the integrity and performance of our asset base, comparedwith 61% in 2013.
PORTFOLIO ACTIONSIn Pipelines, we formed Shell Midstream Partners, L.P. (see “Businessand property – Pipelines” in this section).
In Lubricants, with our joint-venture partner Hyundai Oilbank, weopened a base oil manufacturing plant in Daesan, South Korea (Shellinterest 40%). The plant has the capacity to produce some13 thousand barrels of AP1 Group II base oils per day. The first batchof base oil was successfully blended in the Zhapu lubricant oilblending plant in China in August 2014. Shell will take a majority ofthe output from this plant in the first few years which will significantlyincrease the volume of Group II base oils for our supply chain in theregion.
In Chemicals, Shell has taken full control of Ellba Eastern (Pte) Ltd,through the acquisition of the outstanding 50% interest. The company,which was already operated by Shell, produces styrene monomer andpropylene oxide. The buyout enables integration with and optimisationof Shell’s existing asset base on Jurong Island, in Singapore, allowingfor future growth. With our partner Qatar Petroleum, we have decidednot to proceed with the Al Karaana petrochemicals project in Qatar.
Our Raízen joint venture in Brazil has commissioned a second-generation biofuels plant, which will use technology from Iogen Energyto produce about 40 million litres of cellulosic ethanol a year fromleaves, bark and other sugar cane waste. Additionally, Raizenacquired the fuel distributor Distribuidora Latina and its 200-plus retailstations.
We continued to review our portfolio to divest positions that fail todeliver competitive performance or no longer meet our longer-termstrategic objectives.
We sold the majority of our Downstream businesses in Australia andItaly. In Australia we retained the aviation business; in Italy we retainedthe lubricants business.
We sold our shareholdings in the Kralupy and Litvinov refineries in theCzech Republic. We announced the intention to explore viable optionsfor the Port Dickson refinery in Malaysia (Shell interest 51%), includingthe potential sale or conversion of operations to a storage terminal.
We signed an agreement to sell our retail, commercial fuels andbitumen businesses and supply terminals in Norway to ST1. They willcontinue to operate under the Shell brand. We intend to continue to

42 STRATEGIC REPORT
DOWNSTREAM SHELL ANNUAL REPORT AND FORM 20-F 2014
DOWNSTREAM CONTINUED
operate the aviation business as a joint venture with ST1. The Gasnor,marine and lubricants businesses are not included in the agreement.
We have announced our intention to sell the Fredericia refinery, retail,aviation and commercial fuels businesses in Denmark. We intend tocontinue to sell lubricants via a distributor.
BUSINESS AND PROPERTY
RefiningWe have interests in 24 refineries worldwide with the capacity toprocess a total of over 3.1 million barrels of crude oil per day (Shellshare). Approximately 35% of our refining capacity is in Europe andAfrica, with 39% in the Americas and 26% in Asia and Oceania.
The Port Arthur refinery in Texas, USA, owned by Motiva Enterprises LLC(Shell interest 50%), is the largest refinery in North America and includesone of the world’s largest single-site base oil manufacturing plants.
PipelinesShell Pipeline Company owns and operates seven tank farms acrossthe USA and transports more than 1.5 billion barrels of crude oil andrefined products a year through 3,800 miles of pipelines in the Gulf ofMexico and five US states. Our various non-operated ownershipinterests provide a further 8,000 pipeline miles and offer opportunitiesfor sharing best practices with other pipeline operators.
We carry more than 40 types of crude oil and more than 20 grades ofgasoline, as well as diesel fuel, aviation fuel, chemicals and ethylene.
Shell Midstream Partners L.P., was formed to own, operate, developand acquire pipelines and other midstream assets, and was listed onthe New York Stock Exchange under the ticker symbol “SHLX” onOctober 29, 2014. The partnership’s initial assets, which include aportion of Shell’s interest in four pipelines that transport crude oil andrefined products offshore from the Gulf of Mexico and along the USGulf Coast and East Coast, consist of interests in entities that owncrude oil and refined products pipelines which serve as keyinfrastructure for transporting growing volumes of oil, producedonshore and offshore, to Gulf Coast refining markets. It also deliversrefined products from those refineries to major demand centres. Shellcontrols the general partner and holds a majority share in the limitedpartnership.
Marketing
RETAILThere were close to 43,000 Shell-branded retail stations in over70 countries at the end of 2014. We have more than 100 years’experience in fuel development. In recent years, we have concentratedon developing fuels with special formulations designed to cleanengines and improve performance. We sell such fuels under the ShellV-Power brand in more than 60 countries.
LUBRICANTSAcross approximately 100 countries we make, market or selltechnically-advanced lubricants not only for passenger cars, trucks andcoaches but also for industrial machinery in the manufacturing, mining,power generation, agriculture and construction sectors.
We lead the global market in branded lubricants. Our passenger carand heavy-duty engine oil brands are the most popular in the USA andChina – the world’s largest markets for lubricants.
We have a global lubricants supply chain with a network of eightbase oil manufacturing plants, 50 lubricant blending plants, 18 greaseplants and four gas-to-liquids base oil storage hubs.
Through our marine activities we primarily provide lubricants, but alsofuels and related technical services, to the shipping and maritimesectors. We supply almost 100 grades of lubricants and 10 types offuel to vessels worldwide, ranging from large ocean-going tankers tosmall fishing boats.
BUSINESS TO BUSINESSOur Business to Business (B2B) activities encompass the sale of fuelsand speciality products and services to a broad range of commercialcustomers.
Shell Aviation fuels more than 7,000 aircraft every day atapproximately 800 airports in around 40 countries. On average, werefuel an aircraft every 12 seconds.
Shell Gas (LPG) provides liquefied petroleum gas and related servicesto retail, commercial and industrial customers for cooking, heating,lighting and transport.
Shell Commercial Fuels provides transport, industrial and heating fuels.Our range of products, from reliable main-grade fuels to premiumproducts, can offer tangible benefits. These include fuel economy,enhanced equipment performance, reduction in maintenance frequencyand costs as well as environmental benefits, such as reducedemissions. We continue to pursue opportunities in the LNG fortransport sector, developing projects that provide us and our customerswith the best commercial value. Shell is the first customer of a new,dedicated LNG for transport infrastructure at the Gas Access to Europe(Gate) terminal in the port of Rotterdam in the Netherlands. Shell hascommitted to buy capacity from the Gate terminal, which has enabledinvestment in the terminal expansion.
Shell Bitumen supplies on average 11,000 tonnes of products everyday to 1,600 customers worldwide and invests in technology researchand development to create innovative products.
Shell Sulphur Solutions is a business which manages the completevalue chain of sulphur, from refining to marketing. The businessprovides sulphur for industries such as mining and textiles and alsodevelops new products which incorporate sulphur, such as fertilisers.
ALTERNATIVE ENERGIESRaízen, our joint venture in Brazil, produces ethanol from sugar cane,and manages a retail network. With an annual production capacity ofmore than 2 billion litres, it is one of the largest biofuel producers inthe world. We investigate alternative energy technologies with a long-term view to develop them into profitable business opportunities. Wewere one of the first companies to invest in advanced biofuels andcontinue to research and explore the potential of hydrogen as a fuel.
Chemicals
MANUFACTURINGOur plants produce a range of base chemicals, including ethylene,propylene and aromatics, as well as intermediate chemicals, such asstyrene monomer, propylene oxide, solvents, detergent alcohols,ethylene oxide and ethylene glycol. We have the capacity to producenearly 6 million tonnes of ethylene a year.

STRATEGIC REPORT 43
SHELL ANNUAL REPORT AND FORM 20-F 2014 DOWNSTREAM
MARKETINGWe sell petrochemicals to about 1,000 major industrial customersworldwide. Our Chemicals business is one of the top 10 chemicalsenterprises in the world by revenue. Its products are used to makenumerous everyday items, from clothing and cars to detergents andbicycle helmets.
Trading and SupplyWe trade in physical and financial contracts, lease storage andtransportation capacities, and manage shipping activities globally.
With more than 1,500 storage tanks and approximately150 distribution facilities in around 25 countries, our supply anddistribution infrastructure is well positioned to make deliveries aroundthe world. This includes supplying feedstocks for our refineries andchemical plants and finished products such as gasoline, diesel andaviation fuel to our Marketing businesses and customers.
DOWNSTREAM BUSINESS ACTIVITIES WITH IRAN,SUDAN AND SYRIA
IranShell transactions with Iran are disclosed separately. See“Section 13(r) of the US Securities Exchange Act of 1934 Disclosure”.
SudanWe ceased all operational activities in Sudan in 2008. We have,however, continued soil remediation in 2014 related to earlieroperations in the country.
SyriaWe are in compliance with all EU and US sanctions. We supplylimited quantities of polyols via a Netherlands-based distributor toprivate sector customers in Syria. Polyols are commonly used for theproduction of foam in mattresses and soft furnishings.
DOWNSTREAM DATA TABLESThe tables below reflect Shell subsidiaries, the 50% Shell interest inMotiva in the USA and instances where Shell owns the crude oil orfeedstocks processed by a refinery. Other joint ventures and associatesare only included where explicitly stated.
OIL PRODUCTS – COST OF CRUDE OILPROCESSED OR CONSUMED [A] $ PER BARREL
2014 2013 2012Total 82.76 90.36 106.82
[A] Includes Upstream margin on crude oil supplied by Shell subsidiaries, joint ventures andassociates.
CRUDE DISTILLATIONCAPACITY [A] THOUSAND B/CALENDAR DAY [B]
2014 2013 2012Europe 1,033 1,033 1,084Asia 810 810 664Oceania 80 118 158Africa 82 82 83Americas 1,212 1,212 1,212Total 3,217 3,255 3,201
[A] Average operating capacity for the year, excluding mothballed capacity.[B] Calendar day capacity is the maximum sustainable capacity adjusted for normal unitdowntime.
ETHYLENE CAPACITY [A] THOUSAND TONNES/YEAR2014 2013 2012
Europe 1,659 1,659 1,659Asia 1,922 1,922 1,922Oceania – – –Africa – – –Americas 2,212 2,212 2,212Total 5,793 5,793 5,793
[A] Includes the Shell share of capacity entitlement (offtake rights) of joint ventures andassociates, which may be different from nominal equity interest. Nominal capacity is quoted asat December 31.
OIL PRODUCTS – CRUDE OILPROCESSED [A] THOUSAND B/D
2014 2013 2012Europe 941 1,010 1,069Asia 688 706 761Oceania 59 116 93Africa 69 61 70Americas 1,149 1,100 1,024Total 2,906 2,993 3,017
[A] Includes natural gas liquids, share of joint ventures and associates and processing forothers.
REFINERY PROCESSINGINTAKE [A] THOUSAND B/D
2014 2013 2012Crude oil 2,716 2,732 2,620Feedstocks 187 183 199Total 2,903 2,915 2,819Europe 941 933 970Asia 639 634 520Oceania 64 105 150Africa 69 54 62Americas 1,190 1,189 1,117Total 2,903 2,915 2,819
[A] Includes crude oil, natural gas liquids and feedstocks processed in crude distillation unitsand in secondary conversion units.
REFINERY PROCESSINGOUTTURN [A] THOUSAND B/D
2014 2013 2012Gasolines 1,049 1,049 995Kerosines 331 368 321Gas/Diesel oils 1,047 1,014 996Fuel oil 316 274 256Other 395 389 452Total 3,138 3,094 3,020
[A] Excludes “own use” and products acquired for blending purposes.
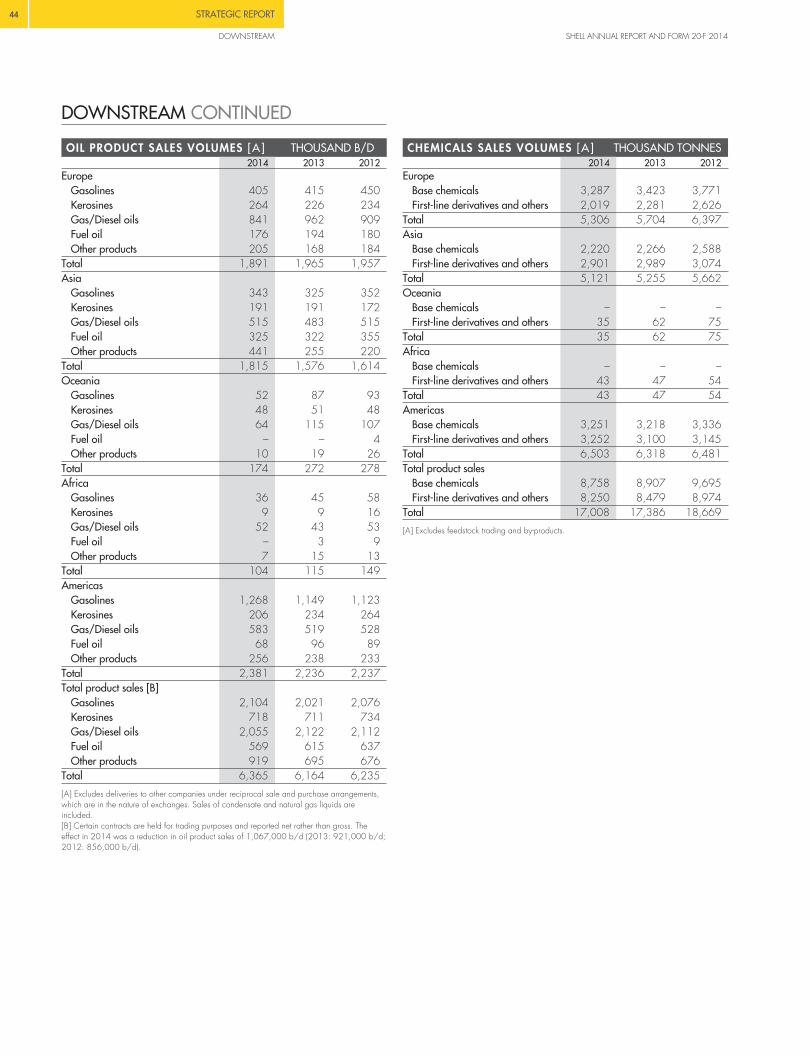
44 STRATEGIC REPORT
DOWNSTREAM SHELL ANNUAL REPORT AND FORM 20-F 2014
DOWNSTREAM CONTINUED
OIL PRODUCT SALES VOLUMES [A] THOUSAND B/D2014 2013 2012
EuropeGasolines 405 415 450Kerosines 264 226 234Gas/Diesel oils 841 962 909Fuel oil 176 194 180Other products 205 168 184
Total 1,891 1,965 1,957Asia
Gasolines 343 325 352Kerosines 191 191 172Gas/Diesel oils 515 483 515Fuel oil 325 322 355Other products 441 255 220
Total 1,815 1,576 1,614Oceania
Gasolines 52 87 93Kerosines 48 51 48Gas/Diesel oils 64 115 107Fuel oil – – 4Other products 10 19 26
Total 174 272 278Africa
Gasolines 36 45 58Kerosines 9 9 16Gas/Diesel oils 52 43 53Fuel oil – 3 9Other products 7 15 13
Total 104 115 149Americas
Gasolines 1,268 1,149 1,123Kerosines 206 234 264Gas/Diesel oils 583 519 528Fuel oil 68 96 89Other products 256 238 233
Total 2,381 2,236 2,237Total product sales [B]
Gasolines 2,104 2,021 2,076Kerosines 718 711 734Gas/Diesel oils 2,055 2,122 2,112Fuel oil 569 615 637Other products 919 695 676
Total 6,365 6,164 6,235
[A] Excludes deliveries to other companies under reciprocal sale and purchase arrangements,which are in the nature of exchanges. Sales of condensate and natural gas liquids areincluded.[B] Certain contracts are held for trading purposes and reported net rather than gross. Theeffect in 2014 was a reduction in oil product sales of 1,067,000 b/d (2013: 921,000 b/d;2012: 856,000 b/d).
CHEMICALS SALES VOLUMES [A] THOUSAND TONNES2014 2013 2012
EuropeBase chemicals 3,287 3,423 3,771First-line derivatives and others 2,019 2,281 2,626
Total 5,306 5,704 6,397Asia
Base chemicals 2,220 2,266 2,588First-line derivatives and others 2,901 2,989 3,074
Total 5,121 5,255 5,662Oceania
Base chemicals – – –First-line derivatives and others 35 62 75
Total 35 62 75Africa
Base chemicals – – –First-line derivatives and others 43 47 54
Total 43 47 54Americas
Base chemicals 3,251 3,218 3,336First-line derivatives and others 3,252 3,100 3,145
Total 6,503 6,318 6,481Total product sales
Base chemicals 8,758 8,907 9,695First-line derivatives and others 8,250 8,479 8,974
Total 17,008 17,386 18,669
[A] Excludes feedstock trading and by-products.
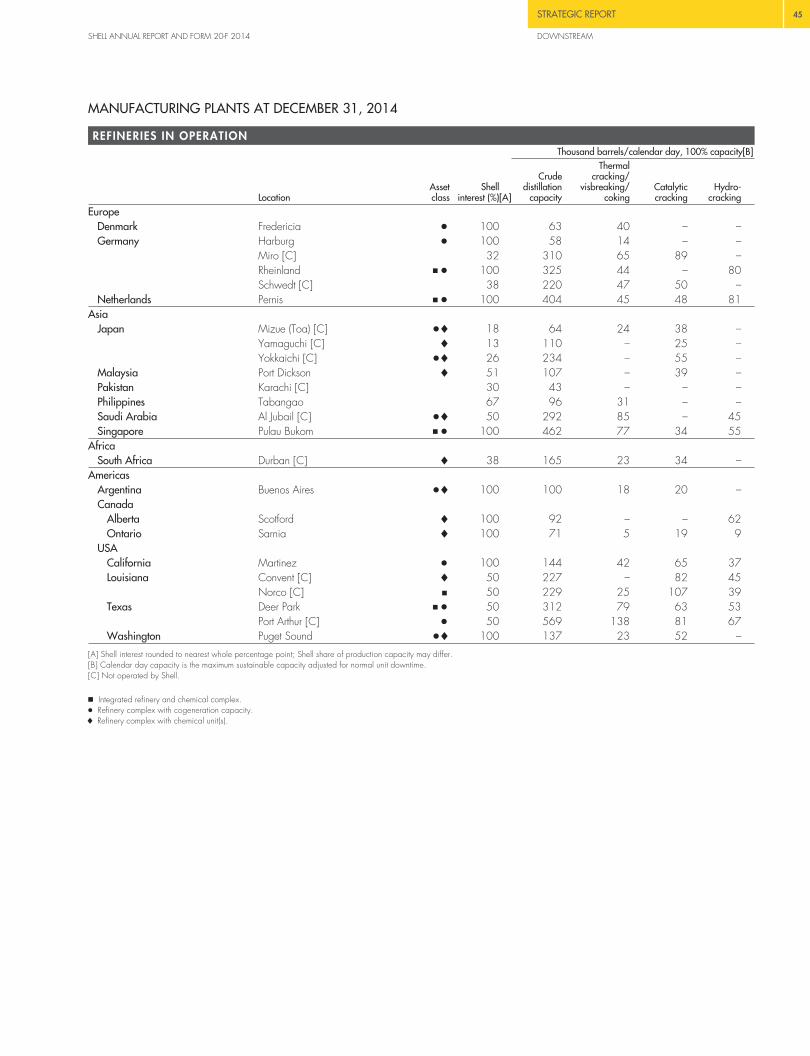
STRATEGIC REPORT 45
SHELL ANNUAL REPORT AND FORM 20-F 2014 DOWNSTREAM
MANUFACTURING PLANTS AT DECEMBER 31, 2014
REFINERIES IN OPERATIONThousand barrels/calendar day, 100% capacity[B]
LocationAssetclass
Shellinterest (%)[A]
Crudedistillation
capacity
Thermalcracking/
visbreaking/coking
Catalyticcracking
Hydro-cracking
EuropeDenmark Fredericia Š 100 63 40 – –Germany Harburg Š 100 58 14 – –
Miro [C] 32 310 65 89 –Rheinland � Š 100 325 44 – 80Schwedt [C] 38 220 47 50 –
Netherlands Pernis � Š 100 404 45 48 81Asia
Japan Mizue (Toa) [C] Š/ 18 64 24 38 –Yamaguchi [C] / 13 110 – 25 –Yokkaichi [C] Š/ 26 234 – 55 –
Malaysia Port Dickson / 51 107 – 39 –Pakistan Karachi [C] 30 43 – – –Philippines Tabangao 67 96 31 – –Saudi Arabia Al Jubail [C] Š/ 50 292 85 – 45Singapore Pulau Bukom � Š 100 462 77 34 55
AfricaSouth Africa Durban [C] / 38 165 23 34 –
AmericasArgentina Buenos Aires Š/ 100 100 18 20 –Canada
Alberta Scotford / 100 92 – – 62Ontario Sarnia / 100 71 5 19 9
USACalifornia Martinez Š 100 144 42 65 37Louisiana Convent [C] / 50 227 – 82 45
Norco [C] � 50 229 25 107 39Texas Deer Park � Š 50 312 79 63 53
Port Arthur [C] Š 50 569 138 81 67Washington Puget Sound Š/ 100 137 23 52 –
[A] Shell interest rounded to nearest whole percentage point; Shell share of production capacity may differ.[B] Calendar day capacity is the maximum sustainable capacity adjusted for normal unit downtime.[C] Not operated by Shell.
� Integrated refinery and chemical complex.Š Refinery complex with cogeneration capacity./ Refinery complex with chemical unit(s).

46 STRATEGIC REPORT
DOWNSTREAM SHELL ANNUAL REPORT AND FORM 20-F 2014
DOWNSTREAM CONTINUED
MAJOR CHEMICAL PLANTS IN OPERATION [A]Thousand tonnes/year, Shell share capacity
Location EthyleneStyrene
monomerEthylene
glycolHigherolefins[B]
Additionalproducts
EuropeGermany Rheinland 272 – – – ANetherlands Moerdijk [C] 972 725 155 – A, IUK Mossmorran [D] 415 – – – –
Stanlow [D] – – – 330 IAsia
China Nanhai [D] 475 320 175 – A, I, PJapan Yamaguchi [D] – – – 11 A, ISaudi Arabia Al Jubail [D] 366 400 – – A, OSingapore Jurong Island 281 1,069 1,005 – A, I, P, O
Pulau Bukom 800 – – – A, IAmericas
Canada Scotford – 485 520 – A, IUSA Deer Park 836 – – – A, I
Geismar – – 400 920 INorco 1,376 – – – A
Total 5,793 2,999 2,255 1,261
[A] Shell share of capacity of subsidiaries, joint arrangements and associates (Shell and non-Shell operated), excluding capacity of the Infineum additives joint ventures.[B] Higher olefins are linear alpha and internal olefins (products range from C6-C2024).[C] Due to a fire and separate breakdown of the steam boilers in 2014, Moerdijk was not fully in operation at December 31, 2014.[D] Not operated by Shell.
A Aromatics, lower olefins.I Intermediates.P Polyethylene, polypropylene.O Other.
OTHER CHEMICAL LOCATIONSLocation Products
EuropeGermany Karlsruhe A
Schwedt ANetherlands Pernis A, I, O
AsiaJapan Kawasaki A, I
Yokkaichi AMalaysia Bintulu I
Port Dickson AAfrica
South Africa Durban IAmericas
Argentina Buenos Aires ICanada Sarnia A, IUSA Martinez O
Mobile APuget Sound I
A Aromatics, lower olefins.I Intermediates.O Other.

STRATEGIC REPORT 47
SHELL ANNUAL REPORT AND FORM 20-F 2014 CORPORATE
CORPORATEEARNINGS $ MILLION
2014 2013 2012Net interest and investment expense (913) (832) (1,001)Foreign exchange (losses)/gains (263) (189) 169Other – including taxation 1,020 1,393 629Segment earnings (156) 372 (203)
OVERVIEWThe Corporate segment covers the non-operating activities supportingShell. It comprises Shell’s holdings and treasury organisation, includingits self-insurance activities as well as its headquarters and centralfunctions. All finance expense and income as well as related taxes areincluded in the Corporate segment earnings rather than in the earningsof the business segments.
The holdings and treasury organisation manages many of theCorporate entities and is the point of contact between Shell and theexternal capital markets. It conducts a broad range of transactions –from raising debt instruments to transacting foreign exchange. Treasurycentres in London, Singapore and Rio de Janeiro support theseactivities.
Headquarters and central functions provide business support in theareas of communications, finance, health, human resources,information technology, legal services, real estate and security. Theyalso provide support for the shareholder-related activities of theCompany. The central functions are supported by business servicecentres located around the world which process transactions, managedata and produce statutory returns, among other services. The majorityof the headquarters and central-function costs are recovered from thebusiness segments. Those costs that are not recovered are retained inCorporate.
EARNINGS 2014-2012Segment earnings for 2014 were a loss of $156 million, comparedwith a gain of $372 million in 2013 and a loss of $203 million in2012.
Net interest and investment expense increased by $81 million between2013 and 2014. Interest expense was higher, mostly driven by newbond issuances and additional finance leases, including thoseassumed as a result of the acquisition of Repsol LNG businesses. Theseeffects were partly offset by an improvement in the liquidity premiumassociated with currency swaps. In 2013, net interest and investmentexpense decreased by $169 million compared with 2012. Interestexpense was lower, mostly driven by an increase in the amount ofinterest capitalised due to the continued ramp-up of projects inAustralia and the Gulf of Mexico, and an improvement in the liquiditypremium associated with currency swaps. These effects were partlyoffset by lower interest income.
Foreign exchange losses of $263 million in 2014 (2013: losses of$189 million; 2012: gains of $169 million) were mainly due to theimpact of exchange rates on non-functional currency loans and cashbalances in operating units.
Other earnings decreased by $373 million in 2014 compared with2013, mainly due to lower tax credits. In 2013, other earnings were$764 million higher than in 2012, mainly due to a Danish tax creditand the recharge to the business segments of certain costs which werepreviously reported in Corporate.

48 STRATEGIC REPORT
LIQUIDITY AND CAPITAL RESOURCES SHELL ANNUAL REPORT AND FORM 20-F 2014
LIQUIDITY AND CAPITALRESOURCESWe manage our businesses to deliver strong cash flows to fundinvestment for profitable growth. Our aim is that, across the businesscycle, “cash in” (including cash from operations and divestments) atleast equals “cash out” (including capital expenditure, interest anddividends), while maintaining a strong balance sheet.
Gearing, calculated as net debt (total debt less cash and cashequivalents) as a percentage of total capital (net debt plus total equity),is a key measure of our capital structure. Across the business cycle weaim to manage gearing within a range of 0-30%. During 2014,gearing ranged from 11.7% to 16.1% (2013: 9.1% to 16.1%). SeeNote 14 to the “Consolidated Financial Statements”.
With respect to the objective of maintaining a strong balance sheet,our priorities for applying our cash are servicing debt commitments,paying dividends, investing for organic and inorganic growth, andreturning surplus cash to our shareholders.
OVERVIEWThe most significant factors affecting our operating cash flow areearnings and movements in working capital, which are mainlyimpacted by: realised prices for crude oil and natural gas; productionlevels of crude oil and natural gas; and refining and marketingmargins.
Since the contribution of Upstream to earnings is larger than that ofDownstream, changes affecting Upstream – particularly changes inrealised crude oil and natural gas prices and production levels – havethe largest impact on Shell’s operating cash flow. While Upstreambenefits from higher realised crude oil and natural gas prices, theextent of such benefit (and the extent of an impact from a decline inthese prices) depends on: the extent to which contractual arrangementsare tied to market prices; the dynamics of production-sharing contracts;the existence of agreements with governments or national oil and gascompanies that have limited sensitivity to crude oil prices; tax impacts;and the extent to which changes in commodity prices flow through intooperating costs. Changes in benchmark prices of crude oil and naturalgas in any particular period therefore provide only a broad indicatorof changes in Upstream earnings experienced in that period. In thelonger term, replacement of proved oil and gas reserves will affect ourability to maintain or increase production levels in Upstream, which inturn will affect our cash flow and earnings.
In Downstream, changes in any one of a range of factors derived fromeither within the industry or the broader economic environment caninfluence margins. The precise impact of any such changes dependson how the oil markets respond to them. The market response isaffected by factors such as: whether the change affects all crude oiltypes or only a specific grade; regional and global crude-oil andrefined-products inventories; and the collective speed of response ofthe industry refiners and product marketers in adjusting their operations.As a result, refinery and marketing margins fluctuate from region toregion and from period to period. Downstream earnings are reportedon a current cost of supplies basis, which excludes the effect ofchanges in the oil price on inventory carrying amounts. However, cashflow from operations is not affected by the reporting basis.
STATEMENT OF CASH FLOWSNet cash from operating activities in 2014 was $45.0 billion, anincrease from $40.4 billion in 2013. There was a cash inflow fromworking capital movements of $6.4 billion in 2014, compared with$2.9 billion in 2013. The decrease in net cash from operatingactivities in 2013 compared with 2012 ($46.1 billion) mainlyreflected the reduction in earnings and lower dividends from jointventures and associates
Net cash used in investing activities was $19.7 billion in 2014, adecrease from $40.1 billion in 2013. The decrease was mainly theresult of lower capital expenditure ($8.3 billion) and higher proceedsfrom the sale of assets ($8.7 billion). The increase in net cash used ininvesting activities in 2013 compared with 2012 ($28.4 billion) wasmainly the result of higher capital expenditure and lower proceedsfrom the sale of assets.
Net cash used in financing activities in 2014 was $12.8 billion(2013: $9.0 billion; 2012: $10.6 billion). This included payment ofdividends to Royal Dutch Shell plc shareholders of $9.4 billion (2013:$7.2 billion; 2012: $7.4 billion), repurchases of shares of$3.3 billion (2013: $5.0 billion; 2012: $1.5 billion) and interestpaid of $1.5 billion (2013: $1.3 billion; 2012: $1.4 billion), partlyoffset in 2014 by $1.0 billion received from the Shell MidstreamPartners, L.P. initial public offering and by net debt issued of $0.4billion (2013: net debt issued of $5.4 billion; 2012: issued debtoffset by debt repaid).
Cash and cash equivalents were $21.6 billion at December 31,2014 (2013: $9.7 billion; 2012: $18.6 billion).
CASH FLOW INFORMATION [A] $ BILLION2014 2013 2012
Net cash from operating activities excluding working capital movementsUpstream 33.3 28.8 32.9Downstream 4.5 7.5 8.0Corporate 0.8 1.2 1.8
Total 38.6 37.5 42.7Decrease/(increase) in inventories 8.0 0.6 (1.7)(Increase)/decrease in current receivables (1.6) 5.6 14.1Decrease in current payables – (3.3) (9.0)Decrease in working capital 6.4 2.9 3.4Net cash from operating activities 45.0 40.4 46.1Net cash used in investing activities (19.7) (40.1) (28.4)Net cash used in financing activities (12.8) (9.0) (10.6)Currency translation differences relating to cash and cash equivalents (0.6) (0.2) 0.2Increase/(decrease) in cash and cash equivalents 11.9 (8.9) 7.3Cash and cash equivalents at the beginning of the year 9.7 18.6 11.3Cash and cash equivalents at the end of the year 21.6 9.7 18.6
[A] See the “Consolidated Statement of Cash Flows”.
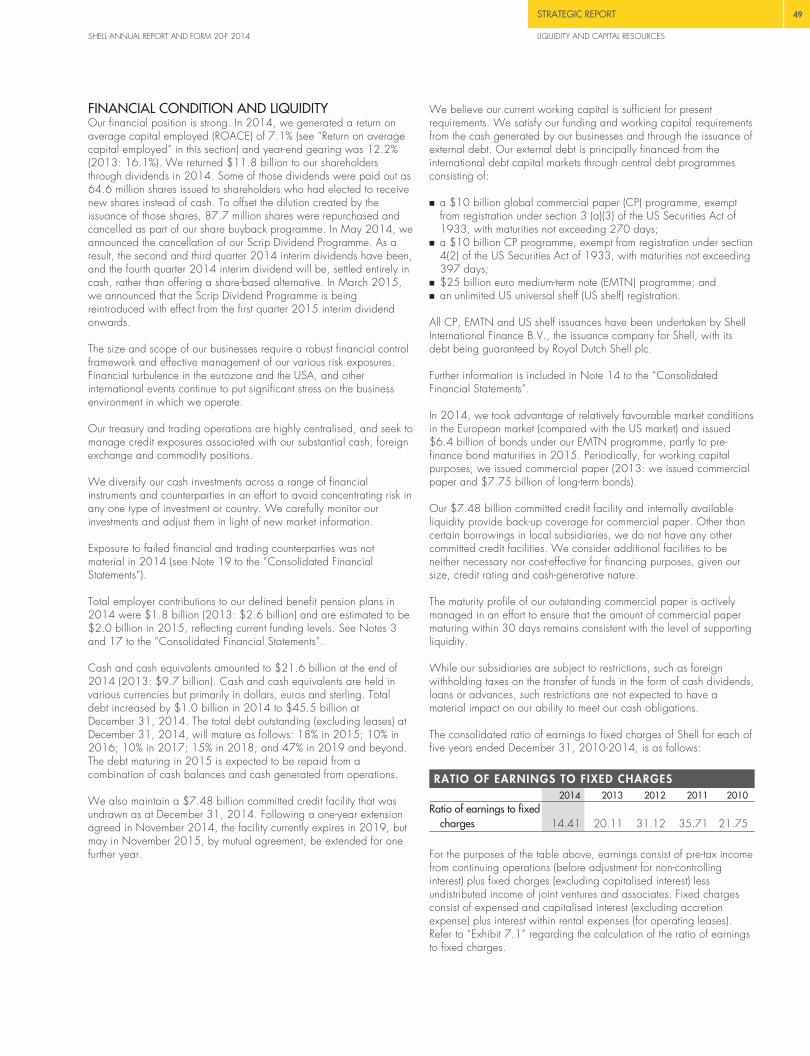
STRATEGIC REPORT 49
SHELL ANNUAL REPORT AND FORM 20-F 2014 LIQUIDITY AND CAPITAL RESOURCES
FINANCIAL CONDITION AND LIQUIDITYOur financial position is strong. In 2014, we generated a return onaverage capital employed (ROACE) of 7.1% (see “Return on averagecapital employed” in this section) and year-end gearing was 12.2%(2013: 16.1%). We returned $11.8 billion to our shareholdersthrough dividends in 2014. Some of those dividends were paid out as64.6 million shares issued to shareholders who had elected to receivenew shares instead of cash. To offset the dilution created by theissuance of those shares, 87.7 million shares were repurchased andcancelled as part of our share buyback programme. In May 2014, weannounced the cancellation of our Scrip Dividend Programme. As aresult, the second and third quarter 2014 interim dividends have been,and the fourth quarter 2014 interim dividend will be, settled entirely incash, rather than offering a share-based alternative. In March 2015,we announced that the Scrip Dividend Programme is beingreintroduced with effect from the first quarter 2015 interim dividendonwards.
The size and scope of our businesses require a robust financial controlframework and effective management of our various risk exposures.Financial turbulence in the eurozone and the USA, and otherinternational events continue to put significant stress on the businessenvironment in which we operate.
Our treasury and trading operations are highly centralised, and seek tomanage credit exposures associated with our substantial cash, foreignexchange and commodity positions.
We diversify our cash investments across a range of financialinstruments and counterparties in an effort to avoid concentrating risk inany one type of investment or country. We carefully monitor ourinvestments and adjust them in light of new market information.
Exposure to failed financial and trading counterparties was notmaterial in 2014 (see Note 19 to the “Consolidated FinancialStatements”).
Total employer contributions to our defined benefit pension plans in2014 were $1.8 billion (2013: $2.6 billion) and are estimated to be$2.0 billion in 2015, reflecting current funding levels. See Notes 3and 17 to the “Consolidated Financial Statements”.
Cash and cash equivalents amounted to $21.6 billion at the end of2014 (2013: $9.7 billion). Cash and cash equivalents are held invarious currencies but primarily in dollars, euros and sterling. Totaldebt increased by $1.0 billion in 2014 to $45.5 billion atDecember 31, 2014. The total debt outstanding (excluding leases) atDecember 31, 2014, will mature as follows: 18% in 2015; 10% in2016; 10% in 2017; 15% in 2018; and 47% in 2019 and beyond.The debt maturing in 2015 is expected to be repaid from acombination of cash balances and cash generated from operations.
We also maintain a $7.48 billion committed credit facility that wasundrawn as at December 31, 2014. Following a one-year extensionagreed in November 2014, the facility currently expires in 2019, butmay in November 2015, by mutual agreement, be extended for onefurther year.
We believe our current working capital is sufficient for presentrequirements. We satisfy our funding and working capital requirementsfrom the cash generated by our businesses and through the issuance ofexternal debt. Our external debt is principally financed from theinternational debt capital markets through central debt programmesconsisting of:
� a $10 billion global commercial paper (CP) programme, exemptfrom registration under section 3 (a)(3) of the US Securities Act of1933, with maturities not exceeding 270 days;
� a $10 billion CP programme, exempt from registration under section4(2) of the US Securities Act of 1933, with maturities not exceeding397 days;
� $25 billion euro medium-term note (EMTN) programme; and� an unlimited US universal shelf (US shelf) registration.
All CP, EMTN and US shelf issuances have been undertaken by ShellInternational Finance B.V., the issuance company for Shell, with itsdebt being guaranteed by Royal Dutch Shell plc.
Further information is included in Note 14 to the “ConsolidatedFinancial Statements”.
In 2014, we took advantage of relatively favourable market conditionsin the European market (compared with the US market) and issued$6.4 billion of bonds under our EMTN programme, partly to pre-finance bond maturities in 2015. Periodically, for working capitalpurposes, we issued commercial paper (2013: we issued commercialpaper and $7.75 billion of long-term bonds).
Our $7.48 billion committed credit facility and internally availableliquidity provide back-up coverage for commercial paper. Other thancertain borrowings in local subsidiaries, we do not have any othercommitted credit facilities. We consider additional facilities to beneither necessary nor cost-effective for financing purposes, given oursize, credit rating and cash-generative nature.
The maturity profile of our outstanding commercial paper is activelymanaged in an effort to ensure that the amount of commercial papermaturing within 30 days remains consistent with the level of supportingliquidity.
While our subsidiaries are subject to restrictions, such as foreignwithholding taxes on the transfer of funds in the form of cash dividends,loans or advances, such restrictions are not expected to have amaterial impact on our ability to meet our cash obligations.
The consolidated ratio of earnings to fixed charges of Shell for each offive years ended December 31, 2010-2014, is as follows:
RATIO OF EARNINGS TO FIXED CHARGES2014 2013 2012 2011 2010
Ratio of earnings to fixedcharges 14.41 20.11 31.12 35.71 21.75
For the purposes of the table above, earnings consist of pre-tax incomefrom continuing operations (before adjustment for non-controllinginterest) plus fixed charges (excluding capitalised interest) lessundistributed income of joint ventures and associates. Fixed chargesconsist of expensed and capitalised interest (excluding accretionexpense) plus interest within rental expenses (for operating leases).Refer to “Exhibit 7.1” regarding the calculation of the ratio of earningsto fixed charges.
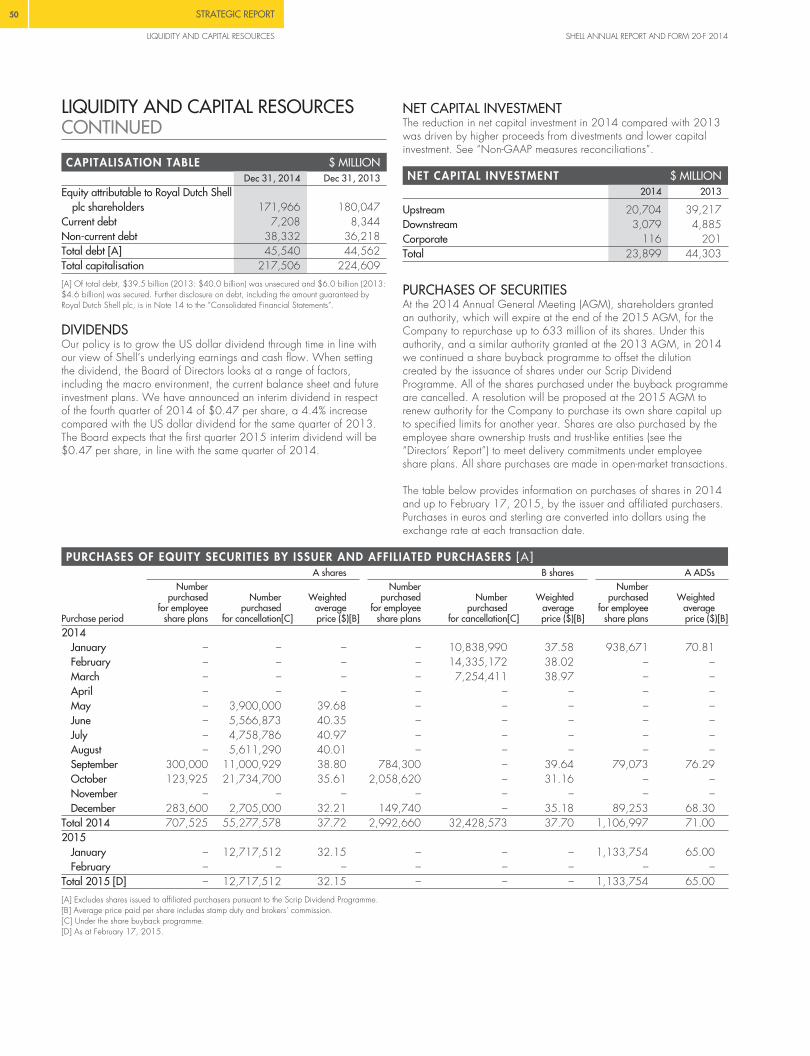
50 STRATEGIC REPORT
LIQUIDITY AND CAPITAL RESOURCES SHELL ANNUAL REPORT AND FORM 20-F 2014
LIQUIDITY AND CAPITAL RESOURCESCONTINUED
CAPITALISATION TABLE $ MILLIONDec 31, 2014 Dec 31, 2013
Equity attributable to Royal Dutch Shellplc shareholders 171,966 180,047
Current debt 7,208 8,344Non-current debt 38,332 36,218Total debt [A] 45,540 44,562Total capitalisation 217,506 224,609
[A] Of total debt, $39.5 billion (2013: $40.0 billion) was unsecured and $6.0 billion (2013:$4.6 billion) was secured. Further disclosure on debt, including the amount guaranteed byRoyal Dutch Shell plc, is in Note 14 to the “Consolidated Financial Statements”.
DIVIDENDSOur policy is to grow the US dollar dividend through time in line withour view of Shell’s underlying earnings and cash flow. When settingthe dividend, the Board of Directors looks at a range of factors,including the macro environment, the current balance sheet and futureinvestment plans. We have announced an interim dividend in respectof the fourth quarter of 2014 of $0.47 per share, a 4.4% increasecompared with the US dollar dividend for the same quarter of 2013.The Board expects that the first quarter 2015 interim dividend will be$0.47 per share, in line with the same quarter of 2014.
NET CAPITAL INVESTMENTThe reduction in net capital investment in 2014 compared with 2013was driven by higher proceeds from divestments and lower capitalinvestment. See “Non-GAAP measures reconciliations”.
NET CAPITAL INVESTMENT $ MILLION2014 2013
Upstream 20,704 39,217Downstream 3,079 4,885Corporate 116 201Total 23,899 44,303
PURCHASES OF SECURITIESAt the 2014 Annual General Meeting (AGM), shareholders grantedan authority, which will expire at the end of the 2015 AGM, for theCompany to repurchase up to 633 million of its shares. Under thisauthority, and a similar authority granted at the 2013 AGM, in 2014we continued a share buyback programme to offset the dilutioncreated by the issuance of shares under our Scrip DividendProgramme. All of the shares purchased under the buyback programmeare cancelled. A resolution will be proposed at the 2015 AGM torenew authority for the Company to purchase its own share capital upto specified limits for another year. Shares are also purchased by theemployee share ownership trusts and trust-like entities (see the“Directors’ Report”) to meet delivery commitments under employeeshare plans. All share purchases are made in open-market transactions.
The table below provides information on purchases of shares in 2014and up to February 17, 2015, by the issuer and affiliated purchasers.Purchases in euros and sterling are converted into dollars using theexchange rate at each transaction date.
PURCHASES OF EQUITY SECURITIES BY ISSUER AND AFFILIATED PURCHASERS [A]A shares B shares A ADSs
Purchase period
Numberpurchased
for employeeshare plans
Numberpurchased
for cancellation[C]
Weightedaverageprice ($)[B]
Numberpurchased
for employeeshare plans
Numberpurchased
for cancellation[C]
Weightedaverageprice ($)[B]
Numberpurchased
for employeeshare plans
Weightedaverageprice ($)[B]
2014January – – – – 10,838,990 37.58 938,671 70.81February – – – – 14,335,172 38.02 – –March – – – – 7,254,411 38.97 – –April – – – – – – – –May – 3,900,000 39.68 – – – – –June – 5,566,873 40.35 – – – – –July – 4,758,786 40.97 – – – – –August – 5,611,290 40.01 – – – – –September 300,000 11,000,929 38.80 784,300 – 39.64 79,073 76.29October 123,925 21,734,700 35.61 2,058,620 – 31.16 – –November – – – – – – – –December 283,600 2,705,000 32.21 149,740 – 35.18 89,253 68.30
Total 2014 707,525 55,277,578 37.72 2,992,660 32,428,573 37.70 1,106,997 71.002015
January – 12,717,512 32.15 – – – 1,133,754 65.00February – – – – – – – –
Total 2015 [D] – 12,717,512 32.15 – – – 1,133,754 65.00
[A] Excludes shares issued to affiliated purchasers pursuant to the Scrip Dividend Programme.[B] Average price paid per share includes stamp duty and brokers’ commission.[C] Under the share buyback programme.[D] As at February 17, 2015.
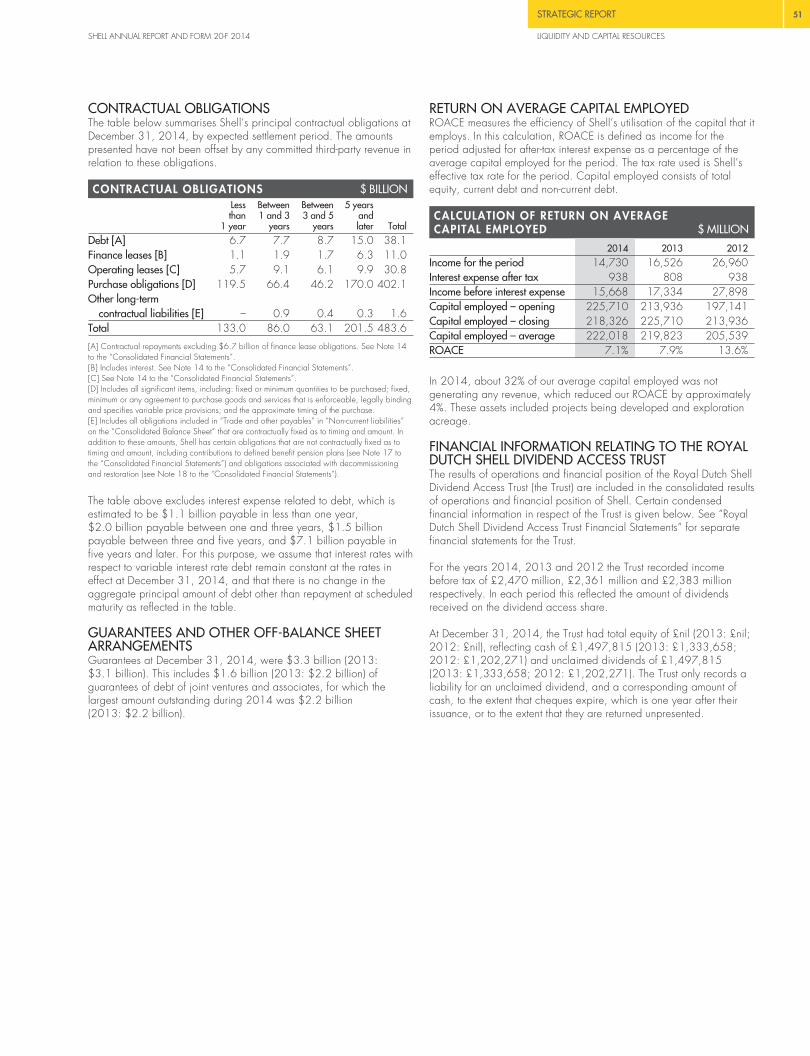
STRATEGIC REPORT 51
SHELL ANNUAL REPORT AND FORM 20-F 2014 LIQUIDITY AND CAPITAL RESOURCES
CONTRACTUAL OBLIGATIONSThe table below summarises Shell’s principal contractual obligations atDecember 31, 2014, by expected settlement period. The amountspresented have not been offset by any committed third-party revenue inrelation to these obligations.
CONTRACTUAL OBLIGATIONS $ BILLIONLessthan
1 year
Between1 and 3
years
Between3 and 5
years
5 yearsandlater Total
Debt [A] 6.7 7.7 8.7 15.0 38.1Finance leases [B] 1.1 1.9 1.7 6.3 11.0Operating leases [C] 5.7 9.1 6.1 9.9 30.8Purchase obligations [D] 119.5 66.4 46.2 170.0 402.1Other long-term
contractual liabilities [E] – 0.9 0.4 0.3 1.6Total 133.0 86.0 63.1 201.5 483.6
[A] Contractual repayments excluding $6.7 billion of finance lease obligations. See Note 14to the “Consolidated Financial Statements”.[B] Includes interest. See Note 14 to the “Consolidated Financial Statements”.[C] See Note 14 to the “Consolidated Financial Statements”.[D] Includes all significant items, including: fixed or minimum quantities to be purchased; fixed,minimum or any agreement to purchase goods and services that is enforceable, legally bindingand specifies variable price provisions; and the approximate timing of the purchase.[E] Includes all obligations included in “Trade and other payables” in “Non-current liabilities”on the “Consolidated Balance Sheet” that are contractually fixed as to timing and amount. Inaddition to these amounts, Shell has certain obligations that are not contractually fixed as totiming and amount, including contributions to defined benefit pension plans (see Note 17 tothe “Consolidated Financial Statements”) and obligations associated with decommissioningand restoration (see Note 18 to the “Consolidated Financial Statements”).
The table above excludes interest expense related to debt, which isestimated to be $1.1 billion payable in less than one year,$2.0 billion payable between one and three years, $1.5 billionpayable between three and five years, and $7.1 billion payable infive years and later. For this purpose, we assume that interest rates withrespect to variable interest rate debt remain constant at the rates ineffect at December 31, 2014, and that there is no change in theaggregate principal amount of debt other than repayment at scheduledmaturity as reflected in the table.
GUARANTEES AND OTHER OFF-BALANCE SHEETARRANGEMENTSGuarantees at December 31, 2014, were $3.3 billion (2013:$3.1 billion). This includes $1.6 billion (2013: $2.2 billion) ofguarantees of debt of joint ventures and associates, for which thelargest amount outstanding during 2014 was $2.2 billion(2013: $2.2 billion).
RETURN ON AVERAGE CAPITAL EMPLOYEDROACE measures the efficiency of Shell’s utilisation of the capital that itemploys. In this calculation, ROACE is defined as income for theperiod adjusted for after-tax interest expense as a percentage of theaverage capital employed for the period. The tax rate used is Shell’seffective tax rate for the period. Capital employed consists of totalequity, current debt and non-current debt.
CALCULATION OF RETURN ON AVERAGECAPITAL EMPLOYED $ MILLION
2014 2013 2012Income for the period 14,730 16,526 26,960Interest expense after tax 938 808 938Income before interest expense 15,668 17,334 27,898Capital employed – opening 225,710 213,936 197,141Capital employed – closing 218,326 225,710 213,936Capital employed – average 222,018 219,823 205,539ROACE 7.1% 7.9% 13.6%
In 2014, about 32% of our average capital employed was notgenerating any revenue, which reduced our ROACE by approximately4%. These assets included projects being developed and explorationacreage.
FINANCIAL INFORMATION RELATING TO THE ROYALDUTCH SHELL DIVIDEND ACCESS TRUSTThe results of operations and financial position of the Royal Dutch ShellDividend Access Trust (the Trust) are included in the consolidated resultsof operations and financial position of Shell. Certain condensedfinancial information in respect of the Trust is given below. See “RoyalDutch Shell Dividend Access Trust Financial Statements” for separatefinancial statements for the Trust.
For the years 2014, 2013 and 2012 the Trust recorded incomebefore tax of £2,470 million, £2,361 million and £2,383 millionrespectively. In each period this reflected the amount of dividendsreceived on the dividend access share.
At December 31, 2014, the Trust had total equity of £nil (2013: £nil;2012: £nil), reflecting cash of £1,497,815 (2013: £1,333,658;2012: £1,202,271) and unclaimed dividends of £1,497,815(2013: £1,333,658; 2012: £1,202,271). The Trust only records aliability for an unclaimed dividend, and a corresponding amount ofcash, to the extent that cheques expire, which is one year after theirissuance, or to the extent that they are returned unpresented.

52 STRATEGIC REPORT
ENVIRONMENT AND SOCIETY SHELL ANNUAL REPORT AND FORM 20-F 2014
ENVIRONMENT AND SOCIETYOur success in business depends on our ability to meet a range ofenvironmental and social challenges. We must show we can operatesafely and manage the effect our activities can have on neighbouringcommunities and society as a whole. If we fail to do this, we may incurliabilities or sanctions, lose business opportunities, harm our reputationor our licence to operate may be impacted.
The Shell General Business Principles (Principles) include a commitmentto sustainable development that involves balancing short- and long-terminterests, and integrating economic, environmental and social aspectsinto our business decisions. We have rigorous standards and a firmgovernance structure in place to help manage potential impacts. Wealso work with communities, business partners, non-governmentalorganisations and other bodies to address potential impacts and sharethe benefits of our operations and projects.
Data in this section are reported on a 100% basis in respect ofactivities where we are the operator. Reporting on this operationalcontrol basis differs from that applied for financial reporting purposesin the “Consolidated Financial Statements”. Detailed data andinformation on our 2014 environmental and social performance will bepublished in April 2015 in the Shell Sustainability Report.
SAFETYSustaining our licence to operate depends on maintaining the safetyand reliability of our operations. We manage safety risk across ourbusinesses through controls and compliance systems combined with asafety-focused culture. Our global standards and operating proceduresdefine the controls and physical barriers we require to preventincidents. For example, our offshore wells are designed with at leasttwo independent barriers to mitigate the risk of an uncontrolled releaseof hydrocarbons. We regularly inspect, test and maintain these barriersto ensure they meet our standards. We also routinely prepare andpractise our emergency response to potential incidents such as an oilspill or a fire. This involves working closely with local agencies tojointly test our plans and procedures. The tests continually improve ourreadiness to respond. If an incident does occur, we have proceduresin place to reduce the impact on people and the environment.
We continue to strengthen the safety culture among our employees andcontractors. We expect everyone working for us to intervene and stopwork that may appear to be unsafe. In addition to our ongoing safetyawareness programmes, we hold an annual global safety day to giveworkers time to reflect on how to prevent incidents. We expecteveryone working for us to comply with our 12 mandatory Life-SavingRules. If employees break these rules, they face disciplinary action upto and including termination of employment. If contractors break theLife-Saving Rules, they can be removed from the worksite.
While we continually work to minimise the likelihood of incidents,some do occur, for example, there was an explosion at our Moerdijkchemical site in the Netherlands in 2014. We investigate all incidentsto understand the underlying causes and translate these intoimprovements in standards or ways of working that can be appliedbroadly across similar facilities in Shell.
CLIMATE CHANGEGrowth in energy demand means that all sources of energy will beneeded over the longer term. With hydrocarbons forecast to providethe bulk of the energy needed over coming decades, policymakers arefocusing on regulations that balance energy demand withenvironmental concerns. The management of emissions of carbondioxide (CO2) will become increasingly important as concerns overclimate change lead to tighter environmental regulation.
We already assess potential costs associated with CO2 emissions whenevaluating projects. However, in future, governments may increasinglyimpose a price on CO2 emissions that relevant companies will have toincorporate in their investment plans and governments may also requirecompanies to apply technical measures to reduce their CO2 emissions.This could result in higher energy, product and project costs. Currentlyenacted, proposed and future legislation is also expected to increase thecost of doing business. Furthermore, in our own operations, we areworking to understand the potential physical impact of climate change inthe future on our facilities and new projects.
As energy demand increases and easily accessible oil and gasresources decline, we are developing resources that require moreenergy and require advanced technology to produce. As ourproduction becomes more energy intensive, we expect there will be anassociated increase in the direct CO2 emissions from the Upstreamfacilities we operate.
We are seeking cost-effective ways to manage CO2 emissions andsee potential business opportunities in developing such solutions. Ourmain contributions to reducing CO2 emissions are in four areas:supplying more natural gas; supplying more biofuels; progressingcarbon capture and storage (CCS) technologies; and implementingenergy efficiency measures in our operations. To support this, wecontinue to advocate the introduction of effective carbon pricing.
According to the International Energy Agency (IEA), almost 40% ofglobal primary energy is currently used to generate electricity. Formany countries, using more gas in power generation instead of coalcan make the largest contribution, at the lowest cost, to meeting theirCO2 emission reduction objectives. We expect that, in combinationwith renewables and use of CCS, natural gas will be essential forsignificantly lower CO2 emissions beyond 2020. With Shell’s leadingposition in liquified natural gas (LNG) and new technologies forrecovering gas from tight rock formations, we can supply natural gas toreplace coal in power generation.
We believe that low-carbon biofuels are one of the most viable waysto reduce CO2 from transport fuels in the coming years. Our Raízenjoint venture in Brazil produces low-carbon biofuel from sugar cane.We are also investing in research to help develop and commercialiseadvanced biofuels.
The IEA has stated that CCS could contribute around 15% of the CO2
mitigation effort required by 2050. To advance CCS technologies, Shellis involved in CCS projects including the Quest project in Canada, theMongstad test centre in Norway and the Gorgon CO2 injection projectin Australia. In 2012, we submitted a proposal for a project inPeterhead, in the UK, to store CO2 in a depleted gas reservoir in theNorth Sea. In 2014, Shell signed an agreement with the UK governmentto progress detailed design of the Peterhead CCS project. It couldpotentially capture and store around 10 million tonnes of CO2 over 10years from a gas-fired power station. These projects are part of animportant demonstration phase for CCS, during which governmentsupport is essential. Initiatives such as the European Union’s acceptanceof CCS as an offsetting activity under the Clean DevelopmentMechanism are a positive step in progressing such technologies.
We continue to work on improving energy efficiency at our oil and gasproduction projects, oil refineries and chemical plants. Measuresinclude our CO2 and energy management programme that focuses onthe efficient operation of existing equipment by using monitoringsystems which give us instant information that we can use to makeenergy-saving changes.
In addition, we work to help our customers conserve energy andreduce their CO2 emissions, including through the development andsale of advanced fuels and lubricants.

STRATEGIC REPORT 53
SHELL ANNUAL REPORT AND FORM 20-F 2014 ENVIRONMENT AND SOCIETY
Our direct greenhouse gas (GHG) emissions increased from 73 milliontonnes of CO2 equivalent in 2013 to 76 million in 2014. The increasein flaring, or burning off, of gas in our Upstream business was the maincontributor to this increase. The majority of this flaring takes place atfacilities where there is no infrastructure to capture the gas producedwith oil, known as associated gas. Gas flaring from these operationsmay rise further in coming years if oil production increases.
Most of the increase in flaring in 2014 relates to Majnoon in Iraq inline with increased oil production. Majnoon represented around 35%of our flaring in 2014. We have agreed two projects to capture mostof the associated gas from future production. The first project isscheduled to be completed in 2015. We expect lower flaring levelsstarting in 2016 when gas gathering equipment is operational.
In parallel, our involvement in Basrah Gas Company (BGC), a jointventure between Shell, South Gas Company and MitsubishiCorporation in the south of Iraq, continues to reduce flaring in thecountry. It is the largest gas project in Iraq’s history and the world’slargest flaring reduction project. BGC captures associated gas thatwould otherwise be flared from three non-operated oil fields in southernIraq (Rumaila, West Qurna 1 and Zubair) for use in the domesticmarket.
Around 30% of our flaring takes place in Nigeria, where achallenging operating environment and shortfalls in funding from thegovernment-owned Nigerian National Petroleum Company – whichhas the majority interest in a joint arrangement operated by ShellPetroleum Development Company of Nigeria Ltd (SPDC) – has slowedprogress on projects that are expected to gather additional associatedgas currently flared.
Greenhouse gas emissions data are provided below in accordancewith UK regulations introduced in 2013. Greenhouse gas emissionscomprise carbon dioxide, methane, nitrous oxide, hydrofluorocarbons,perfluorocarbons and sulphur hexafluoride. The data are calculatedusing locally regulated methods where they exist. Where there is nolocally regulated method, the data are calculated using the 2009 APICompendium which is the recognised industry standard under theGHG Protocol Corporate Accounting and Reporting Standard. Thereare inherent limitations to the accuracy of such data. Oil and gasindustry guidelines (IPIECA/API/OGP) indicate that a number ofsources of uncertainty can contribute to the overall uncertainty of acorporate emissions’ inventory.
GREENHOUSE GAS EMISSIONS2014 2013
Emissions (million tonnes of CO2 equivalent)Direct [A] 76 73Energy indirect [B] 10 10
Intensity ratios (tonne/tonne)All facilities [C] 0.23 0.22Downstream refineries [D] 0.29 0.30Upstream facilities [E] 0.14 0.12
[A] Emissions from the combustion of fuel and the operation of facilities.[B] Emissions from the purchase of electricity, heat, steam and cooling for our own use.[C] In tonnes of total direct and energy indirect emissions per tonne of crude oil and feedstocksprocessed and petrochemicals produced in Downstream manufacturing, and oil and gasproduced and gas processed by gas-to-liquid facilities in Upstream. The regulations require thereporting of a ratio which expresses the annual emissions in relation to a quantifiable factorassociated with our activities. However, oil and gas industry guidelines (IPIECA/API/OGP)state that only presenting normalised environmental performance data separately for differentbusiness activities would generally provide meaningful information. As a result, we are alsoreporting the most appropriate ratio for our Downstream and Upstream businesses.[D] In tonnes of direct and energy indirect emissions per tonne of crude oil and feedstocksprocessed. The ratio includes chemical plants where they are integrated with refineries.[E] In tonnes of direct and energy indirect emissions per tonne of oil and gas produced. Theratio excludes gas-to-liquids facilities.
SPILLSLarge spills of crude oil, oil products and chemicals associated withour operations can result in major clean-up costs as well as fines andother damages. They can also affect our licence to operate and harmour reputation. We have clear requirements and procedures designedto prevent spills, and our asset integrity programmes include thedesign, maintenance and operation of spill containment facilities.
Shell business units are responsible for organising and executing oil spillresponses in line with Shell guidelines as well as with relevant legal andregulatory requirements. All our offshore installations have plans in placeto respond to a spill. These plans detail response strategies andtechniques, available equipment, and trained personnel and contracts.We are able to call upon significant resources such as containmentbooms, collection vessels and aircraft. We are also able to draw uponthe contracted services of oil spill response organisations, if required.We conduct regular exercises that seek to ensure these plans remaineffective. We have further developed our capability to respond to spillsto water, and maintain a Global Response Support Network to supportworldwide response capability. This is also supported by our global OilSpill Excellence Center, which tests local capability, and maintainsShell’s capability globally to respond to a significant incident.
Shell is a founding member of the Marine Well Containment Company,a non-profit industry consortium providing a well-containment responsesystem for the Gulf of Mexico. In addition, Shell was a founding memberof the Subsea Well Response Project, an industry cooperative effort toenhance global well-containment capabilities. The additionalwell-containment capability developed by this project is now managedby an industry consortium via Oil Spill Response Limited.
Shell also maintains site-specific emergency response plans in the eventof an onshore spill. Like the offshore response plans, these aredesigned to meet Shell guidelines as well as relevant legal andregulatory requirements. They also provide for the initial assessment ofincidents and the mobilisation of resources needed to manage them.
In 2014, the number of operational spills of more than 100 kilogramsdecreased to 153 from 174 in 2013. At the end of February 2015,there were three spills under investigation in Nigeria that may result inadjustments.
Although most oil spills in Nigeria result from sabotage and theft ofcrude oil, there are instances where spills occur in our operations dueto operational failures, accidents or corrosion. SPDC responds to all oilspills, regardless of the cause, originating in the area immediatelysurrounding its pipelines and other facilities. It has been working toreduce operational spills that are under its control. It maintains a publicwebsite to track the response, investigation and clean-up of every spillfrom its facilities due to operational failure, sabotage or theft.
In January 2015, SPDC announced a £55 million settlementagreement with the Bodo community in respect of two operationalspills in 2008. The settlement provides for an individual payment toeach claimant who accepts the agreement in compensation for lossesarising from the spills, up to £35 million in total. The remaining£20 million payment will be made for the benefit of the Bodocommunity generally. In 2009, clean-up work took place, but we wereprevented from accessing some of the spill sites by the community, andthis area has subsequently seen additional spills as a result of oil theftand sabotage. Divisions within the community and the litigationprocess itself created further regrettable delays to the clean-up process.With the support of the former Dutch Ambassador to Nigeria and theinvolvement of the National Coalition on Gas Flaring and Oil Spills inthe Niger Delta (a federation of 25 Niger Delta environmental non-governmental organisations), the community agreed to separate out theclean-up activity from the litigation. Despite some further delays caused
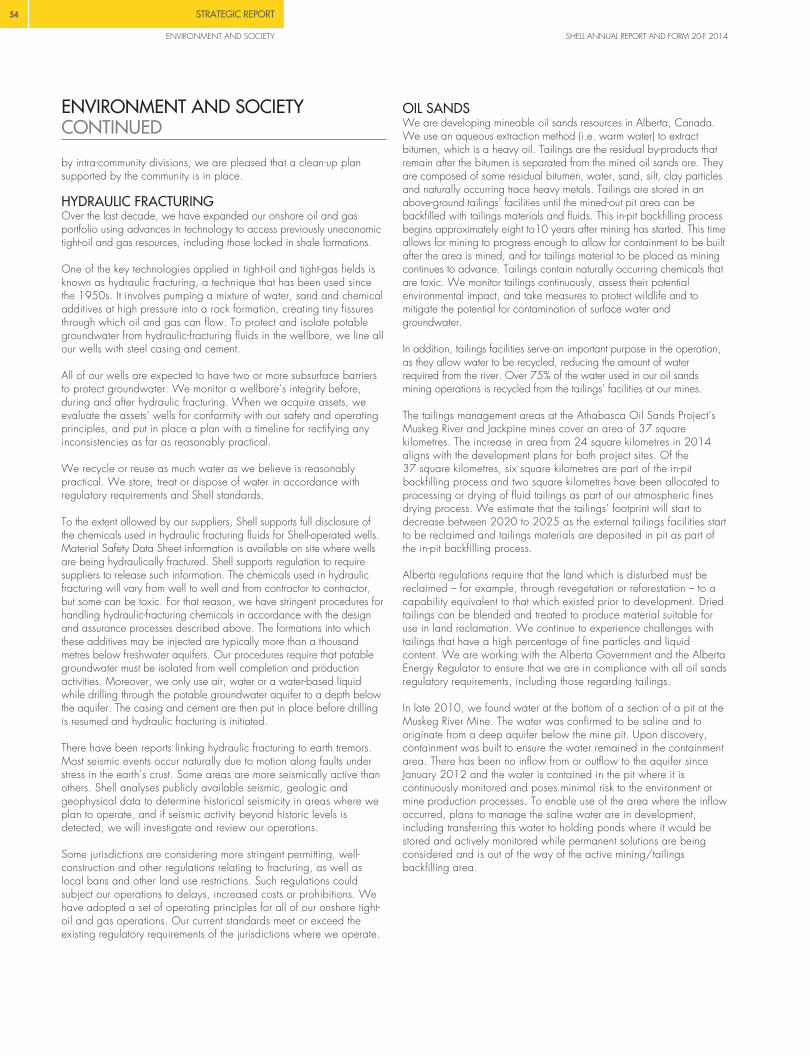
54 STRATEGIC REPORT
ENVIRONMENT AND SOCIETY SHELL ANNUAL REPORT AND FORM 20-F 2014
ENVIRONMENT AND SOCIETYCONTINUED
by intra-community divisions, we are pleased that a clean-up plansupported by the community is in place.
HYDRAULIC FRACTURINGOver the last decade, we have expanded our onshore oil and gasportfolio using advances in technology to access previously uneconomictight-oil and gas resources, including those locked in shale formations.
One of the key technologies applied in tight-oil and tight-gas fields isknown as hydraulic fracturing, a technique that has been used sincethe 1950s. It involves pumping a mixture of water, sand and chemicaladditives at high pressure into a rock formation, creating tiny fissuresthrough which oil and gas can flow. To protect and isolate potablegroundwater from hydraulic-fracturing fluids in the wellbore, we line allour wells with steel casing and cement.
All of our wells are expected to have two or more subsurface barriersto protect groundwater. We monitor a wellbore’s integrity before,during and after hydraulic fracturing. When we acquire assets, weevaluate the assets’ wells for conformity with our safety and operatingprinciples, and put in place a plan with a timeline for rectifying anyinconsistencies as far as reasonably practical.
We recycle or reuse as much water as we believe is reasonablypractical. We store, treat or dispose of water in accordance withregulatory requirements and Shell standards.
To the extent allowed by our suppliers, Shell supports full disclosure ofthe chemicals used in hydraulic fracturing fluids for Shell-operated wells.Material Safety Data Sheet information is available on site where wellsare being hydraulically fractured. Shell supports regulation to requiresuppliers to release such information. The chemicals used in hydraulicfracturing will vary from well to well and from contractor to contractor,but some can be toxic. For that reason, we have stringent procedures forhandling hydraulic-fracturing chemicals in accordance with the designand assurance processes described above. The formations into whichthese additives may be injected are typically more than a thousandmetres below freshwater aquifers. Our procedures require that potablegroundwater must be isolated from well completion and productionactivities. Moreover, we only use air, water or a water-based liquidwhile drilling through the potable groundwater aquifer to a depth belowthe aquifer. The casing and cement are then put in place before drillingis resumed and hydraulic fracturing is initiated.
There have been reports linking hydraulic fracturing to earth tremors.Most seismic events occur naturally due to motion along faults understress in the earth’s crust. Some areas are more seismically active thanothers. Shell analyses publicly available seismic, geologic andgeophysical data to determine historical seismicity in areas where weplan to operate, and if seismic activity beyond historic levels isdetected, we will investigate and review our operations.
Some jurisdictions are considering more stringent permitting, well-construction and other regulations relating to fracturing, as well aslocal bans and other land use restrictions. Such regulations couldsubject our operations to delays, increased costs or prohibitions. Wehave adopted a set of operating principles for all of our onshore tight-oil and gas operations. Our current standards meet or exceed theexisting regulatory requirements of the jurisdictions where we operate.
OIL SANDSWe are developing mineable oil sands resources in Alberta, Canada.We use an aqueous extraction method (i.e. warm water) to extractbitumen, which is a heavy oil. Tailings are the residual by-products thatremain after the bitumen is separated from the mined oil sands ore. Theyare composed of some residual bitumen, water, sand, silt, clay particlesand naturally occurring trace heavy metals. Tailings are stored in anabove-ground tailings’ facilities until the mined-out pit area can bebackfilled with tailings materials and fluids. This in-pit backfilling processbegins approximately eight to10 years after mining has started. This timeallows for mining to progress enough to allow for containment to be builtafter the area is mined, and for tailings material to be placed as miningcontinues to advance. Tailings contain naturally occurring chemicals thatare toxic. We monitor tailings continuously, assess their potentialenvironmental impact, and take measures to protect wildlife and tomitigate the potential for contamination of surface water andgroundwater.
In addition, tailings facilities serve an important purpose in the operation,as they allow water to be recycled, reducing the amount of waterrequired from the river. Over 75% of the water used in our oil sandsmining operations is recycled from the tailings’ facilities at our mines.
The tailings management areas at the Athabasca Oil Sands Project’sMuskeg River and Jackpine mines cover an area of 37 squarekilometres. The increase in area from 24 square kilometres in 2014aligns with the development plans for both project sites. Of the37 square kilometres, six square kilometres are part of the in-pitbackfilling process and two square kilometres have been allocated toprocessing or drying of fluid tailings as part of our atmospheric finesdrying process. We estimate that the tailings’ footprint will start todecrease between 2020 to 2025 as the external tailings facilities startto be reclaimed and tailings materials are deposited in pit as part ofthe in-pit backfilling process.
Alberta regulations require that the land which is disturbed must bereclaimed – for example, through revegetation or reforestation – to acapability equivalent to that which existed prior to development. Driedtailings can be blended and treated to produce material suitable foruse in land reclamation. We continue to experience challenges withtailings that have a high percentage of fine particles and liquidcontent. We are working with the Alberta Government and the AlbertaEnergy Regulator to ensure that we are in compliance with all oil sandsregulatory requirements, including those regarding tailings.
In late 2010, we found water at the bottom of a section of a pit at theMuskeg River Mine. The water was confirmed to be saline and tooriginate from a deep aquifer below the mine pit. Upon discovery,containment was built to ensure the water remained in the containmentarea. There has been no inflow from or outflow to the aquifer sinceJanuary 2012 and the water is contained in the pit where it iscontinuously monitored and poses minimal risk to the environment ormine production processes. To enable use of the area where the inflowoccurred, plans to manage the saline water are in development,including transferring this water to holding ponds where it would bestored and actively monitored while permanent solutions are beingconsidered and is out of the way of the active mining/tailingsbackfilling area.

STRATEGIC REPORT 55
SHELL ANNUAL REPORT AND FORM 20-F 2014 ENVIRONMENT AND SOCIETY
EXPLORATION IN ALASKAWe hold more than 410 federal leases for exploration in the Beaufortand Chukchi seas in Alaska. We previously operated for almost50 years in Alaska, including in both these seas, until 1998. We arefamiliar with these shallow waters and the hydrocarbon reservoirsbeneath them, which are of relatively low pressure.
In 2014, the US Coast Guard published its investigation on the 2012grounding of the Kulluk mobile offshore drilling unit (MODU), whichtook place around 1,900 kilometres from the drilling site. The vesselwas successfully recovered and ultimately recycled. There were nosignificant injuries or environmental damage associated with thegrounding. Identified issues have been addressed. Enhancements tothe programme based on lessons learned from 2012 operationsinclude:
� The Kulluk has been replaced by the Transocean Polar Pioneer,which is a harsh weather semi-submersible drilling unit.
� Modifications and subsequent sea trials have been conducted on theAiviq (towing vessel).
� Additional ships have been contracted to provide increased backupin operational support.
� An additional helicopter will be contracted to support aviationactivities and provide further backup for air operations.
� Global guidelines for wet towing of MODUs have been developed.They include processes and procedures for towing MODUs includingin harsh weather environments. Shell has shared these guidelines withthe US Coast Guard towing task force referenced in the report.
We have strengthened our contractor management and Arcticorganisation and, together with the contractors, improved our planningand processes.
To prepare for drilling off the coast of Alaska, we have developed awell intervention and oil spill response capability that includes cappingand oil spill response vessels. The Arctic Containment System has beenmodified since 2012 and is expected to be available for the 2015drilling season. Improvements have also been made to emergencyresponse assets and additional equipment has been purchased toenhance response capabilities based on the lessons learned during the2012 season. Maintenance and inventory of critical spare parts for theoil spill response equipment have been enhanced by utilising adedicated maintenance and storage facility in Anchorage. We have arange of equipment and vessels necessary to respond to a spill 24hours a day in case a spill happens during our exploration season inAlaska in 2015.
WATERFresh water availability and water management are increasinglyimportant strategic business issues for Shell and the energy industry ingeneral, bringing both challenges and opportunities. Global demandfor fresh water is growing while access to fresh water is becomingmore constrained in some parts of the world.
Shell’s water use may expand in the future with the further developmentof shale oil and gas, oil sands and our biofuel business. A combinationof increasing demand for water resources, growing stakeholderexpectations and concerns, and water-related legislation may driveactions that affect our ability to secure access to fresh water and todischarge water from our operations. Although the availability of freshwater is a global issue, water constraints are mainly local, requiring localsolutions. In areas of water scarcity, we develop water managementaction plans and design our operations to minimise their water use.
For example, at Groundbirch, a tight-gas asset in Canada, we arerecycling approximately 75% of the water produced. We also jointlycommissioned a recycling water treatment plant with the CanadianCity of Dawson Creek. The plant treats sewage wastewater for use byShell and the community.
At our oil sands operations in Canada, we use far less than our waterallocation from the Athabasca River and we seek to minimise theamount withdrawn during the winter months when the flow rate is low.We also reduce the amount of fresh water needed in operations byrecycling water from the tailings ponds. About 75% of the water weuse is recycled and we are investigating new ways to further reducefresh water intake.
Water is needed to produce ethanol and our biofuel joint ventureRaízen has been introducing a system that recycles 90% of the waterused in the industrial process.
Our Pearl GTL plant in Qatar does not take fresh water from its aridsurroundings. The water produced in the GTL manufacturing process isrecycled in the operation, fulfilling all the water needs of the plant.
BIOFUELSThe international market for biofuels is growing, driven largely by theintroduction of new energy policies in Europe and the USA that call formore renewable, lower-carbon fuels for transport. Shell predicts thatbiofuels will increase from 3% of the global transport fuel mix today toaround 10% by 2050. According to the IEA, sustainable biofuels areexpected to play an increasingly important role in helping to meet ourcustomers’ fuel needs and reduce CO2 emissions.
From cultivation to use, some biofuels emit significantly less CO2
compared with conventional gasoline. But this depends on severalfactors, such as how the raw materials are produced. Other challengesinclude concerns over land competing with food crops, labour rights,and the water used in the production process.
In 2014, we used around 9 billion litres of biofuel in our gasoline anddiesel blends worldwide, which makes us one of the world’s largestbiofuel suppliers. We include our own long-established sustainabilityclauses in our supply contracts and, where possible, we sourcebiofuels that have been certified against internationally recognisedsustainability standards. These clauses are designed to prevent thesourcing of biofuels from suppliers that may not abide by human rightsguidelines, or that may have cleared land rich in biodiversity.
We are also developing our own capabilities to produce sustainablebiofuel components. The Raízen joint venture produces approximately2 billion litres annually of ethanol from sugar cane in Brazil – the mostsustainable and cost competitive of today’s biofuels. This ethanol canreduce CO2 emissions by around 70% compared with gasoline, fromcultivation of the sugar cane to using the ethanol as fuel.
The joint-venture agreement includes developing joint sustainabilityprinciples, standards and operating procedures that also apply to third-party suppliers. We also continue to work with industry, governmentsand voluntary organisations towards the development of globalsustainability standards for biofuels.
We continue to invest in developing more advanced biofuels for thefuture. For example, in 2014 Raízen completed the construction of acommercial-scale pilot plant to produce second-generation bioethanol.This cellulosic ethanol will be generated from sugar cane by-productand therefore will have less impact on food and feed prices.Government support will be required to accelerate the speed ofadvanced biofuels development.
56 STRATEGIC REPORT
ENVIRONMENT AND SOCIETY SHELL ANNUAL REPORT AND FORM 20-F 2014
ENVIRONMENT AND SOCIETYCONTINUED
ENVIRONMENTAL COSTSWe are subject to a variety of environmental laws, regulations andreporting requirements in the countries where we operate. Infringingany of these laws, regulations and requirements could result insignificant costs, including clean-up costs, fines, sanctions and third-party claims, as well as harm our ability to do business and ourreputation.
Our ongoing operating expenses include the costs of avoidingunauthorised discharges into the air and water, and the safe disposaland handling of waste.
We place a premium on developing effective technologies that arealso safe for the environment. However, when operating at theforefront of technology, there is always the possibility that a newtechnology brings with it environmental impacts that have not beenassessed, foreseen or determined to be harmful, when originallyimplemented. While we believe we take all reasonable precautions tolimit these risks, we are subject to additional remedial environmentaland litigation costs as a result of our operations’ unknown andunforeseen impacts on the environment. Although these costs have sofar not been material to Shell, no assurance can be made that this willalways be the case.
In this regard, as oil and gas fields mature, it is possible in certaincircumstances for seismic activity to increase based on the uniquegeology of individual fields. For example, after more than 60 years ofdeveloping the Groningen gas field in the Netherlands, seismic activityhas increased leading to measurable earth tremors. Our Dutch jointventure Nederlandse Aardolie Maatschappij B.V. (NAM) has followedthe production plan approved in 2014 by the Minister of EconomicAffairs of the Netherlands. It is working with the government to identifyeffective responses and will follow any future requirements.
NEIGHBOURING COMMUNITIES AND HUMAN RIGHTSEarning the trust of local communities is essential to the success of ourprojects and operations. We have global requirements for socialperformance – how we perform in our relationship with communities.
The requirements set clear rules and expectations for how we engagewith and respect communities that may be impacted by our operations.Shell-operated major projects and facilities are required to have asocial performance plan and an effective community feedbackmechanism. This helps the business to understand the social context inwhich we plan to operate, identifies potential negative effects on thecommunity and manages impacts. In addition, we have specificrequirements intended to minimise our impact on indigenous peoples’traditional lifestyles and on handling involuntary resettlement.
Shell has long been involved with developments in business andhuman rights in line with the United Nations’ Guiding Principles onBusiness and Human Rights. Our Principles and Code of Conductrequire our employees and contractors to respect the human rights offellow workers and communities where we operate.
We have specific policies in place in areas across Shell’s activitieswhere respect for human rights is particularly important to the way weoperate, such as communities, labour, procurement and security. Wealso work with other companies and non-governmental organisations toimprove the way we apply these principles. Our approach to humanrights helps us operate in a responsible way, delivering projectswithout delays and minimising the social impacts of our operations. Italso enables us to better share the benefits of our activities, such ascreating new jobs and contracts that help develop local economies.
OUR PEOPLEOur people are central to our aim of being the world’s mostcompetitive and innovative energy company. We recruit, train andrecompense according to a people strategy based on three priorities:resourcing and developing talent now and in the future; strengtheningleadership and professionalism; and enhancing individual andorganisational performance.
EMPLOYEE OVERVIEWIn 2014, Shell employed an average of 94,000 people in more than70 countries. We continued to recruit externally to execute our strategyand growth plans for the future, hiring about 1,200 graduates and2,000 experienced professionals. The majority of each came fromtechnical disciplines. More than 30% of our graduate recruits camefrom universities outside Europe and the Americas in response toincreasing demand for skilled people in other regions.
The table below shows our average employee numbers bygeographical area. The increase in 2014 compared with 2013reflects our continuing growth strategy in Asia and the Americas.
EMPLOYEES BY GEOGRAPHICAL AREA(AVERAGE NUMBERS) THOUSAND
2014 2013 2012Europe 25 25 24Asia 28 27 25Oceania 2 3 3Africa 3 3 3North America 32 31 29South America 4 3 3Total 94 92 87
EMPLOYEE COMMUNICATION AND INVOLVEMENTWe strive to maintain a constructive working environment withemployees and, where appropriate, employee representative bodies.However, collective bargaining negotiations can result in disputes,strikes or work stoppages, such as the United Steelworkers union strikeinitiated on February 1, 2015 , at the Deer Park refinery andlaboratory in Texas, USA. While talks are ongoing, we look forwardto reaching a mutually acceptable settlement.
Two-way dialogue between management and staff is embedded in ourwork practices. On a quarterly basis, management briefs employeeson Shell’s operational and financial results through various channels,including team meetings, face-to-face gatherings, a personal emailfrom the Chief Executive Officer, webcasts and online publications.
The Shell People Survey is one of the principal tools used to measureemployee engagement: the degree of affiliation and commitment toShell. It provides insights into employees’ views and has had aconsistently high response rate. The average employee engagementscore in 2014 was 80% favourable, as it was in 2013.
We promote safe reporting of views about our processes andpractices. In addition to local channels, our global telephone helplineand website enable employees to report potential breaches of theShell General Business Principles and Code of Conduct, confidentiallyand anonymously, in a choice of several languages.

STRATEGIC REPORT 57
SHELL ANNUAL REPORT AND FORM 20-F 2014 OUR PEOPLE
DIVERSITY AND INCLUSIONWe have a culture that embraces diversity and fosters inclusion. Byembedding these principles in our operations, we have a betterunderstanding of the needs of our varied customers, partners andstakeholders throughout the world and can benefit from a wider talentpool. We provide equal opportunity in recruitment, careerdevelopment, promotion, training and rewards for all employees,including those with disabilities. Where possible, we make reasonableadjustments in job design and provide appropriate training foremployees who have become disabled.
We actively monitor representation of women and local nationals insenior leadership positions, and have talent-development processes tosupport us in delivering more diverse representation.
At the end of 2014, the proportion of women in senior leadershippositions was 18.1% compared with 17.2% in 2013. Seniorleadership positions is a Shell measure based on senior salary grouplevels and is distinct from the term “senior manager” in the statutorydisclosures set out below.
GENDER DIVERSITY DATA(AT DECEMBER 31, 2014) NUMBER
Men WomenDirectors of the Company 9 75% 3 25%Senior managers [A] 829 79% 217 21%Employees (thousands) 66 71% 28 29%
[A] Senior manager is defined in section 414C(9) of the Companies Act 2006 andaccordingly the number disclosed comprises the Executive Committee members who were notDirectors of the Company as well as other directors of Shell subsidiaries.
With effect from 2014, we revised our local nationals representationmetric to ensure it adequately takes account of the senior localnationals working overseas. In 20 selected key business countries, webegan measuring local national coverage, which is defined as thenumber of senior local nationals (both those working in the respectivecountry and those expatriated) as a percentage of the number of seniorleadership positions in their base country.
LOCAL NATIONAL COVERAGE(AT DECEMBER 31, 2014)
Number of selected countries2014 2013
Greater than 80% 12 12Less than 80% 8 8Total 20 20
EMPLOYEE SHARE PLANSShell has a number of share plans designed to align employees’interests with Shell’s performance through share ownership. Forinformation on the share-based compensation plans for ExecutiveDirectors, see the “Directors’ Remuneration Report”.
Performance Share Plan and Long-term Incentive PlanConditional awards of the Company’s shares are made under theterms of the Performance Share Plan (PSP) to some 17,000 employeeseach year. From 2015, senior executives will receive conditionalawards of the Company’s shares under the terms of the Long-termIncentive Plan (LTIP) rather than under the terms of the PSP. The extent towhich the awards vest under both plans is determined over athree-year performance period but the performance conditionsapplicable to each plan are different. Under the PSP, half of the awardis linked to the key performance indicators described in “PerformanceIndicators”, averaged over the period. The other half of the award islinked to a comparative performance condition which involves acomparison with four of our main competitors over the period, basedon four relative performance measures. Under the LTIP, the award issolely linked to the comparative performance condition describedabove. Under both plans, all shares that vest are increased by anamount equal to the notional dividends accrued on those shares duringthe period from the award date to the vesting date. In certaincircumstances awards may be adjusted before delivery or reclaimedafter delivery. None of the awards results in beneficial ownership untilthe shares vest. See Note 21 to the “Consolidated FinancialStatements”.
Restricted Share PlanUnder the Restricted Share Plan, awards are made on a highlyselective basis to senior staff. Shares are awarded subject to a three-year retention period. All shares that vest are increased by an amountequal to the notional dividends accrued on those shares during theperiod from the award date to the vesting date. In certaincircumstances awards may be adjusted before delivery or reclaimedafter delivery.
Global Employee Share Purchase PlanEligible employees in participating countries may participate in theGlobal Employee Share Purchase Plan. This plan enables them tomake contributions from net pay towards the purchase of theCompany’s shares at a 15% discount to the market price, either at thestart or at the end of an annual cycle, whichever date offers the lowermarket price.
UK Sharesave SchemeEligible employees of participating companies in the UK mayparticipate in the UK Sharesave Scheme. Options are granted over theCompany’s shares at market value on the invitation date. These optionsare normally exercisable after completion of a three-year or five-yearcontractual savings period.
UK Shell All Employee Share Ownership PlanEligible employees of participating companies in the UK mayparticipate in the Shell All Employee Share Ownership Plan, underwhich monthly contributions from gross pay are made towards thepurchase of the Company’s shares.
Strategic Report signed on behalf of the Board
/s/ Michiel Brandjes
Michiel BrandjesCompany SecretaryMarch 11, 2015

58 GOVERNANCE
THE BOARD OF ROYAL DUTCH SHELL PLC SHELL ANNUAL REPORT AND FORM 20-F 2014
GOVERNANCETHE BOARD OF ROYAL DUTCHSHELL PLCJORMA OLLILAChairmanBorn August 15, 1950. A Finnish national, appointed Chairman of theCompany with effect from June 2006.
From 1999 to 2006, he was Chairman and Chief Executive Officer ofNokia, and continued as Chairman until 2012. He was President andChief Executive Officer of Nokia from 1992 to 1999 and President ofNokia Mobile Phones from 1990 to 1992, after serving as SeniorVice President, Finance from 1986. He joined Nokia in 1985 as VicePresident of International Operations after starting his career atCitibank in London and Helsinki.
He is Chairman of the Board of Directors of Outokumpu Oyj, aNon-executive Director of Tetra Laval Group and an Advisory Partnerof Perella Weinberg Partners.
Chairman of the Nomination and Succession Committee
HANS WIJERSDeputy Chairman and Senior Independent DirectorBorn January 11, 1951. A Dutch national, appointed a Non-executiveDirector of the Company with effect from January 2009.
He was Chief Executive Officer and Chairman of the Board ofManagement of Akzo Nobel N.V. from 2003 to 2012, havingbecome a Board member in 2002. From 1999 to 2002, he was aSenior Partner at The Boston Consulting Group. He was Dutch Ministerfor Economic Affairs from 1994 to 1998, and was previouslyManaging Partner of The Boston Consulting Group. He obtained aPhD in economics from Erasmus University Rotterdam while teachingthere.
He is Chairman of the Supervisory Board of AFC Ajax N.V. and theSupervisory Board of Heineken N.V., a member of the SupervisoryBoard of HAL Holding N.V., a Non-executive Director ofGlaxoSmithKline plc and a trustee of various charities.
Member of the Nomination and Succession Committee
BEN VAN BEURDENChief Executive OfficerBorn April 23, 1958. A Dutch national, appointed Chief ExecutiveOfficer with effect from January 1, 2014.
He was Downstream Director from January to September 2013.Previously he was Executive Vice President Chemicals from December2006, when he served on the boards of a number of leading industryassociations, including the International Council of ChemicalsAssociations and the European Chemical Industry Council. Prior to this,he held a number of operational and commercial roles in bothUpstream and Downstream, including Vice President ManufacturingExcellence. He joined Shell in 1983, after graduating with a Master’sDegree in Chemical Engineering from Delft University of Technology,the Netherlands.
SIMON HENRYChief Financial OfficerBorn July 13, 1961. A British national, appointed Chief FinancialOfficer of the Company with effect from May 2009.
He was Chief Financial Officer for Exploration & Production from2004 to 2009, and was Head of Group Investor Relations from 2001to 2004. Prior to these roles, he held various finance posts includingFinance Manager of Marketing in Egypt, Controller for the Upstreambusiness in Egypt, Oil Products Finance Adviser for Asia-Pacific,Finance Director for the Mekong Cluster, and General ManagerFinance for the South East Asian Retail business. He joined Shell in1982 as an engineer at the Stanlow refinery in the UK and in 1989qualified as a member of the Chartered Institute of ManagementAccountants.
He was appointed a Non-executive Director of Lloyds Banking Groupplc with effect from June 2014.
GUY ELLIOTTNon-executive DirectorBorn December 26, 1955. A British national, appointed aNon-executive Director of the Company with effect from September2010.
He was Chief Financial Officer of Rio Tinto plc and Rio Tinto Limitedfrom 2002 to April 2013, and remained Senior Executive Director ofthese companies until the end of 2013. Prior to joining the Rio TintoGroup, he worked in investment banking and gained an MBA atINSEAD. From 2007 to 2010, he was a Non-executive Director ofCadbury plc, serving as Chairman of its Audit Committee from 2008to 2009 and as Senior Independent Director from 2008 to 2010.
He is a member of the UK Takeover Panel, which he joined in 2012,and was appointed Chairman of the Code Committee of the Panelwith effect from February 2014. He was appointed a Non-executiveDirector of SABMiller plc in July 2013 and later that year wasappointed Deputy Chairman and Senior Independent Director.
Chairman of the Audit Committee and Member of the Nominationand Succession Committee

GOVERNANCE 59
SHELL ANNUAL REPORT AND FORM 20-F 2014 THE BOARD OF ROYAL DUTCH SHELL PLC
EULEEN GOHNon-executive DirectorBorn April 20, 1955. A Singaporean national, appointed aNon-executive Director of the Company with effect from September 1,2014.
She is a chartered accountant and also has professional qualificationsin banking and taxation. She held various senior managementpositions with Standard Chartered Bank and was Chief ExecutiveOfficer of Standard Chartered Bank, Singapore from 2001 until2006.
She has also held non-executive appointments on various boardsincluding Aviva plc, MediaCorp Pte Limited, Singapore AirlinesLimited, Singapore Exchange Limited, Standard Chartered BankMalaysia Berhad and Standard Chartered Bank Thai pcl. She waspreviously Chairman of International Enterprise Singapore and theAccounting Standards Council, Singapore.
She is a Non-executive Director of CapitaLand Limited, DBS BankLimited, DBS Group Holdings Limited and SATS Limited, and a Trusteeof the Singapore Institute of International Affairs Endowment Fund. Sheis also Non-executive Chairman of the Singapore InternationalFoundation and a Non-executive Director of Singapore Health ServicesPte Limited, both not-for-profit organisations.
Member of the Audit Committee
CHARLES O. HOLLIDAYNon-executive DirectorBorn March 9, 1948. A US national, appointed a Non-executiveDirector of the Company with effect from September 2010.
He was Chief Executive Officer of DuPont from 1998 to 2009, andChairman from 1999 to 2009. He joined DuPont in 1970 afterreceiving a B.S. in industrial engineering from the University ofTennessee and held various manufacturing and business assignments,including a six-year, Tokyo-based posting as President of DuPont Asia/Pacific. He is Chairman of the National Academy of Engineering andis a founding member of the International Business Council. He haspreviously served as Chairman of The Business Council, Catalyst, theSociety of Chemical Industry – American Section and the WorldBusiness Council for Sustainable Development.
He is a member of the board of Directors of Bank of AmericaCorporation, having previously served as Chairman from 2010 untilSeptember 2014, and is a member of the board of Directors ofDeere & Company.
Chairman of the Corporate and Social Responsibility Committee andMember of the Remuneration Committee
GERARD KLEISTERLEENon-executive DirectorBorn September 28, 1946. A Dutch national, appointed aNon-executive Director of the Company with effect from November2010.
He was President/Chief Executive Officer and Chairman of the Boardof Management of Koninklijke Philips N.V. from 2001 to 2011.Having joined Philips in 1974, he held several positions before beingappointed as Chief Executive Officer of Philips’ Components division in1999 and Executive Vice-President of Philips in 2000. From 2010 to2013, he was a member of the board of Directors of Dell Inc. and,from 2009 to April 2014, he was a member of the Supervisory Boardof Daimler AG.
He is Chairman of Vodafone Group plc and a Non-executive Directorof IBEX Global Solutions plc.
Chairman of the Remuneration Committee and Member of the AuditCommittee
SIR NIGEL SHEINWALD GCMGNon-executive DirectorBorn June 26, 1953. A British national, appointed a Non-executiveDirector of the Company with effect from July 2012.
He was a senior British diplomat who served as British Ambassador tothe USA from 2007 to 2012, before retiring from the DiplomaticService. Prior to this, he served as Foreign Policy and Defence Adviserto the Prime Minister, and Head of the Cabinet Office Defence andOverseas Secretariat. He served as British Ambassador and PermanentRepresentative to the European Union in Brussels from 2000 to 2003.He joined the Diplomatic Service in 1976 and served in Brussels,Washington, Moscow, and in a wide range of policy roles in London.
He is a Senior Adviser to the Universal Music Group and a VisitingProfessor and Council Member of King’s College, London. In January2015, he was appointed a Non-executive Director of the InnoviaGroup.
Member of the Corporate and Social Responsibility Committee
LINDA G. STUNTZNon-executive DirectorBorn September 11, 1954. A US national, appointed aNon-executive Director of the Company with effect from June 2011.
She is a founding partner of the law firm of Stuntz, Davis & Staffier,P.C., based in Washington, DC. Her law practice includes energyand environmental regulation, as well as matters relating to governmentsupport of technology development and transfer. She chaired theElectricity Advisory Committee to the US Department of Energy from2008 to 2009, and was a member of the Board of Directors ofSchlumberger Limited from 1993 to 2010. From 1989 to 1993, sheheld senior policy positions at the US Department of Energy, includingDeputy Secretary. She played a principal role in the development andenactment of the Energy Policy Act of 1992. From 1981 to 1987, shewas an Associate Minority Counsel and Minority Counsel to theEnergy and Commerce Committee of the US House of Representatives.
She is a member of the boards of Directors of Raytheon Company andEdison International.
Member of the Audit Committee

60 GOVERNANCE
THE BOARD OF ROYAL DUTCH SHELL PLC SHELL ANNUAL REPORT AND FORM 20-F 2014
THE BOARD OF ROYAL DUTCHSHELL PLC CONTINUED
PATRICIA A. WOERTZNon-executive DirectorBorn March 17, 1953. A US national, appointed a Non-executiveDirector of the Company with effect from June 1, 2014.
She is Chairman and former Chief Executive Officer of Archer DanielsMidland Company in the USA, which she joined in 2006. She beganher career as a certified public accountant with Ernst & Ernst inPittsburgh, USA before joining Gulf Oil Corporation in 1977 whereshe held various positions in refining, marketing, strategic planningand finance. Following the merger of Gulf and Chevron in 1987, sheled international operations as President of Chevron Canada and,later, Chevron International Oil Company. With the merger of Chevronand Texaco in 2001, she was Executive Vice President responsible forglobal refining, marketing, lubricant, and supply and tradingoperations until 2006.
She is a member of the boards of Directors of The Procter & GambleCompany, UI LABS and World Business Chicago. She also leads theUS section of the US – Brazil CEO Forum and is a member of TheBusiness Council. In 2010, the US President appointed her to ThePresident’s Export Council.
Member of the Corporate and Social Responsibility Committee
GERRIT ZALMNon-executive DirectorBorn May 6, 1952. A Dutch national, appointed a Non-executiveDirector of the Company with effect from January 1, 2013.
He was an adviser to PricewaterhouseCoopers during 2007,Chairman of the trustees of the International Accounting StandardsBoard from 2007 to 2010, an adviser to Permira from 2007 to2008, and Chief Financial Officer of DSB Bank from 2007 to 2008.He was the Minister of Finance of the Netherlands twice, from 1994to 2002 and from 2003 to 2007. In between, he was Chairman ofthe parliamentary party of the VVD. Prior to 1994, he was head of theNetherlands Bureau for Economic Policy Analysis, a professor at VrijeUniversiteit Amsterdam and held various positions at the Ministry ofFinance and at the Ministry of Economic Affairs. He studied GeneralEconomics at Vrije Universiteit Amsterdam and received an HonoraryDoctorate in Economics from this university.
He is Chairman of the Managing Board of ABN AMRO Bank N.V., aposition he has held since 2010.
Member of the Corporate and Social Responsibility Committee andthe Remuneration Committee
MICHIEL BRANDJESCompany SecretaryBorn December 14, 1954. A Dutch national, appointed as CompanySecretary and General Counsel Corporate of the Company inFebruary 2005.
He joined Shell in 1980 as a Legal Adviser and was later appointedHead of Legal in Singapore. Following a period as Head of Legal inChina, he was appointed Company Secretary of Royal DutchPetroleum Company. In June 2014, he was appointed aNon-executive Director of Constellium N.V.
GOVERNANCE 61
SHELL ANNUAL REPORT AND FORM 20-F 2014 SENIOR MANAGEMENT
SENIOR MANAGEMENTThe Senior Management of the Company comprises the ExecutiveDirectors and those listed below. All are members of the ExecutiveCommittee (see page 68).
JOHN ABBOTTDownstream DirectorBorn March 24, 1960. A British national, appointed DownstreamDirector with effect from October 2013. Previously, he was ExecutiveVice President Manufacturing, responsible for oil refineries andpetrochemicals plants worldwide. He joined Shell in 1981, and hasheld a variety of management positions in refining, chemicals andupstream heavy oil, working in Canada, the Netherlands, Singapore,Thailand, the UK and the USA.
HARRY BREKELMANSProjects & Technology DirectorBorn June 11, 1965. A Dutch national, appointed Projects &Technology Director with effect from October 1, 2014. Previously, hewas Executive Vice President for Upstream International Operatedbased in the Netherlands. He joined Shell in 1990, and has held avariety of management positions in Exploration and Production, InternalAudit, and Group Strategy and Planning. From 2011 to 2013, hewas Country Chairman – Russia and Executive Vice President for Russiaand the Caspian region.
ANDREW BROWNUpstream International DirectorBorn January 29, 1962. A British national, appointed UpstreamInternational Director with effect from April 2012. Previously, he wasExecutive Vice President for Shell’s activities in Qatar and a member ofthe Upstream International Leadership Team. He was awarded theOrder of the British Empire in 2012 for his services to British-Qataribusiness relations.
DONNY CHINGLegal DirectorBorn February 14, 1964. A Malaysian national, appointed LegalDirector with effect from February 10, 2014. Previously, he wasGeneral Counsel for the Project & Technology business based in theNetherlands. He joined Shell in 1988 based in Australia, moving toHong Kong and later to London. In 2008, he was appointed Head ofLegal at Shell Singapore, having served as Associate General Counselfor the Gas & Power business in Asia-Pacific.
HUGH MITCHELLChief Human Resources & Corporate OfficerBorn February 13, 1957. A British national, appointed Chief HumanResources & Corporate Officer with effect from July 2009. Previously,he was Human Resources Director of Shell. In 2003, he wasappointed Director International, one of the Royal Dutch/Shell Group’sCorporate Centre Directors, having served as HR Vice President for theGlobal Oil Products business. He is a Non-executive Director of RSAInsurance Group plc.
MARVIN ODUMUpstream Americas DirectorBorn December 13, 1958. A US national, appointed UpstreamAmericas Director with effect from July 2009. Previously, he wasExecutive Vice President for the Americas for Shell Exploration &Production. In 2008, he was appointed President of Shell OilCompany, having served as Executive Vice President since 2005 withresponsibility for Shell’s Exploration & Production businesses in thewestern hemisphere.
62 GOVERNANCE
DIRECTORS’ REPORT SHELL ANNUAL REPORT AND FORM 20-F 2014
DIRECTORS’ REPORTMANAGEMENT REPORTThis Directors’ Report, together with the “Strategic Report” onpages 6-57, serves as the Management Report for the purpose ofDisclosure and Transparency Rule 4.1.8R.
FINANCIAL STATEMENTS AND DIVIDENDSThe “Consolidated Statement of Income” and “Consolidated BalanceSheet” can be found on pages 107 and 108 respectively.
The table below sets out the dividends on each class of share andeach class of American Depositary Share (ADS [A]). The Companyannounces its dividends in US dollars and, at a later date, announcesthe euro and sterling equivalent amounts using a market exchangerate.[A] ADSs are listed on the New York Stock Exchange under the symbols RDS.A and RDS.B.Each ADS represents two shares – two A shares in the case of RDS.A or two B shares in thecase of RDS.B.
Dividends on Royal Dutch Shell plc A shares (A shares) are paid bydefault in euros, although holders are able to elect to receive dividendsin sterling. Dividends on Royal Dutch Shell plc B shares (B shares) arepaid by default in sterling, although holders are able to elect to receivedividends in euros. Dividends on ADSs are paid in US dollars.
The Scrip Dividend Programme, which enabled shareholders toincrease their shareholding by choosing to receive new shares insteadof cash dividends (if approved by the Board), was cancelled witheffect from the second quarter 2014 interim dividend onwards [B]. Theprogramme is being reintroduced with effect from the first quarter2015 interim dividend onwards. More information can be found atwww.shell.com/scrip.[B] Only new A shares were issued under the programme, including to shareholders who heldB shares.
The Directors have announced a fourth-quarter interim dividend as setout in the table below, payable on March 20, 2015, to shareholderson the Register of Members at close of business on February 13,2015. The closing date for dividend currency election wasFebruary 27, 2015 [C]. The euro and sterling equivalentsannouncement date was March 6, 2015.[C] A different currency election date may apply to shareholders holding shares in a securitiesaccount with a bank or financial institution ultimately holding through Euroclear Nederland.Such shareholders can obtain the applicable deadlines from their broker, financialintermediary, bank or financial institution where they hold their securities account.
DIRECTORS’ RESPONSIBILITIES IN RESPECT OF THEPREPARATION OF THE ANNUAL REPORTAND ACCOUNTSThe Directors are responsible for preparing the Annual Report includingthe financial statements in accordance with applicable law andregulations. Company law requires the Directors to prepare financialstatements for each financial year. Under that law the Directors haveprepared the Consolidated and Parent Company Financial Statementsin accordance with International Financial Reporting Standards (IFRS)as adopted by the European Union (EU). In preparing these financialstatements, the Directors have also elected to comply with IFRS asissued by the International Accounting Standards Board (IASB). Undercompany law the Directors must not approve the financial statementsunless they are satisfied that they give a true and fair view of the stateof affairs of Shell and the Company and of the profit or loss of Shelland the Company for that period. In preparing these financialstatements, the Directors are required to:
� select suitable accounting policies and then apply them consistently;� make judgements and accounting estimates that are reasonable and
prudent; and� state whether IFRS as adopted by the EU and IFRS as issued by the
IASB have been followed.
The Directors are responsible for keeping adequate accounting recordsthat are sufficient to show and explain the transactions of Shell and theCompany and disclose with reasonable accuracy, at any time, thefinancial position of Shell and the Company and to enable them toensure that the financial statements comply with the Companies Act2006 and, as regards the Consolidated Financial Statements, withArticle 4 of the IAS Regulation and therefore are in accordance withIFRS as adopted by the EU. The Directors are also responsible forsafeguarding the assets of Shell and the Company and hence fortaking reasonable steps for the prevention and detection of fraud andother irregularities.
Each of the Directors, whose names and functions can be found onpages 58-60, confirms that, to the best of their knowledge:
� the financial statements, which have been prepared in accordancewith IFRS as adopted by the EU, and with IFRS as issued by theIASB, give a true and fair view of the assets, liabilities, financialposition and profit of Shell and the Company; and
� the Management Report includes a fair review of the developmentand performance of the business and the position of Shell, togetherwith a description of the principal risks and uncertainties that itfaces.
Furthermore, so far as each of the Directors is aware, there is norelevant audit information of which the auditors are unaware, andeach of the Directors has taken all the steps that ought to have beentaken in order to become aware of any relevant audit information andto establish that the auditors are aware of that information.
DIVIDENDS 2014A shares B shares[A] A ADSs B ADSs
$ € pence $ pence € $ $Q1 0.47 0.3468 28.03 0.47 28.03 0.3468 0.94 0.94Q2 0.47 0.3632 29.09 0.47 29.09 0.3632 0.94 0.94Q3 0.47 0.3828 30.16 0.47 30.16 0.3828 0.94 0.94Q4 0.47 0.4329 31.20 0.47 31.20 0.4329 0.94 0.94Total announced in respect of the year 1.88 1.5257 118.48 1.88 118.48 1.5257 3.76 3.76Amount paid during the year 1.4172 114.16 114.16 1.4172 3.72 3.72
[A] It is expected that holders of B shares will receive dividends through the dividend access mechanism applicable to such shares. The dividend access mechanism is described more fully onpage 72.

GOVERNANCE 63
SHELL ANNUAL REPORT AND FORM 20-F 2014 DIRECTORS’ REPORT
The Directors consider that the Annual Report including the financialstatements, taken as a whole, is fair, balanced and understandableand provides the information necessary for shareholders to assessShell’s performance, business model and strategy.
The Directors are responsible for the maintenance and integrity of theShell website (www.shell.com). Legislation in the UK governing thepreparation and dissemination of financial statements may differ fromlegislation in other jurisdictions.
GOING CONCERNThe “Strategic Report” includes information about Shell’s financialstrategy, financial condition, and liquidity and cash flows, as well asthe factors, including the principal risks, likely to affect Shell’s futuredevelopment. Further information on the management of Shell’s capitalstructure and use of financial instruments to support its operating plancan be found in Notes 14 and 19 to the “Consolidated FinancialStatements” respectively.
Shell’s operating plan for the foreseeable future demonstrates its abilityto operate its cash-generating activities, selling products to adiversified customer base. These activities are expected to generatesufficient cash to enable Shell to service its financing requirements, paydividends and fund its investing activities. As a result, the Directorshave a reasonable expectation that Shell has adequate resources tocontinue in operational existence for the foreseeable future andcontinue to adopt the going concern basis of accounting in preparingthe Consolidated and Parent Company Financial Statements containedin this Report.
REPURCHASES OF SHARESOn May 20, 2014, shareholders approved an authority, which willexpire at the end of the 2015 Annual General Meeting (AGM), for theCompany to repurchase up to a maximum of 633 million of its shares(excluding purchases for employee share plans). During 2014,55.3 million A shares with a nominal value of €3.9 million($4.7 million) (0.9% of the Company’s total issued share capital atDecember 31, 2014) and 32.4 million B shares with a nominal valueof €2.3 million ($2.7 million) (0.5% of the Company’s total issuedshare capital at December 31, 2014) were purchased for cancellationfor a total cost of $3.3 billion including expenses, at an average priceof $37.74 per A share and $38.33 per B share. The purpose of theshare buyback programme is to offset the dilution created by theissuance of shares for the Company’s Scrip Dividend Programme [A].[A] The Scrip Dividend Programme was cancelled with effect from the second quarter 2014interim dividend onwards, and is being reintroduced with effect from the first quarter 2015interim dividend onwards. More information can be found at www.shell.com/scrip.
From January 1, 2015, to February 17, 2015, a further 12.7 millionA shares (0.2% of the Company’s total issued share capital atDecember 31, 2014) were purchased for cancellation for a total costof $0.4 billion including expenses, at an average price of $32.15per share.
The Board continues to regard the ability to repurchase issued sharesin suitable circumstances as an important part of the financialmanagement of the Company. A resolution will be proposed at the2015 AGM to renew the authority for the Company to purchase itsown share capital up to specified limits for a further year. More detailof this proposal is given in the Notice of Annual General Meeting.
BOARD OF DIRECTORSThe Directors during the year were Josef Ackermann (who stood downon May 20, 2014), Ben van Beurden (appointed with effect fromJanuary 1, 2014), Guy Elliott, Euleen Goh (appointed with effect fromSeptember 1, 2014), Simon Henry, Charles O. Holliday, GerardKleisterlee, Jorma Ollila, Sir Nigel Sheinwald, Linda G. Stuntz,Hans Wijers, Patricia A. Woertz (appointed with effect from June 1,2014) and Gerrit Zalm.
RETIREMENT AND REAPPOINTMENT OF DIRECTORSIn line with the UK Corporate Governance Code (the Code), allDirectors will retire at the 2015 AGM and, subject to the Articles ofAssociation and their wish to continue as a Director of the Company,seek reappointment by shareholders. Jorma Ollila will not be seekingreappointment and will be standing down at the conclusion of the2015 AGM after having served as Chairman since June 2006 [A].[A] Subject to his reappointment as a Director of the Company by shareholders at the 2015AGM, Charles O.Holliday will succeed Jorma Ollila as Chairman with effect from theconclusion of the meeting.
The biographies of all current Directors are given on pages 58-60and, for those seeking reappointment, also in the Notice of AnnualGeneral Meeting. Details of the Executive Directors’ contracts can befound on page 97 and copies are available for inspection from theCompany Secretary. Furthermore, a copy of the form of these contractshas been filed with the US Securities and Exchange Commission (SEC)as an exhibit.
The terms and conditions of appointment of Non-executive Directorsare set out in their letters of appointment with the Company which, inaccordance with the Code, are available for inspection from theCompany Secretary.
No Director is, or was, materially interested in any contract subsistingduring or at the end of the year that was significant in relation to theCompany’s business. See also “Related party transactions” below.
DIRECTORS’ INTERESTSThe interests (in shares of the Company or calculated equivalents) ofthe Directors in office at the end of the year, including any interests ofa “connected person” (as defined in the Disclosure and TransparencyRules of the UK’s Financial Conduct Authority), can be found in the“Directors’ Remuneration Report” on pages 87-88.
Changes in Directors’ share interests during the period fromDecember 31, 2014, to March 11, 2015, including changes in theinterests in shares awarded under the Long-term Incentive Plan and theDeferred Bonus Plan, can also be found in the “Directors’ RemunerationReport” on pages 87-88.
QUALIFYING THIRD-PARTY INDEMNITIESThe Company has entered into a deed of indemnity with each Directorwho served during the year under identical terms. The deeds indemnifythe Directors to the widest extent permitted by the applicable laws ofEngland against all liability incurred as a Director or employee of theCompany or of certain other entities.
RELATED PARTY TRANSACTIONSOther than disclosures given in Notes 9 and 27 to the “ConsolidatedFinancial Statements”, there were no transactions or proposedtransactions that were material to either the Company or any relatedparty. Nor were there any transactions with any related party that wereunusual in their nature or conditions.

64 GOVERNANCE
DIRECTORS’ REPORT SHELL ANNUAL REPORT AND FORM 20-F 2014
DIRECTORS’ REPORT CONTINUED
POLITICAL CONTRIBUTIONSNo donations were made by the Company or any of its subsidiaries topolitical parties or organisations during the year. Shell Oil Companyadministers the non-partisan Shell Oil Company Employees’ PoliticalAwareness Committee (SEPAC), a political action committee registeredwith the US Federal Election Commission. Eligible employees maymake voluntary personal contributions to the SEPAC.
RECENT DEVELOPMENTS AND POST-BALANCE SHEETEVENTSThere are no material recent developments and post-balance sheetevents to report.
LIKELY FUTURE DEVELOPMENTSInformation relating to likely future developments can be found in the“Strategic Report”.
RESEARCH AND DEVELOPMENTShell carries out its research and development programmes in aworldwide network of technology centres complemented by externalpartnerships. The main technology centres are in India, theNetherlands and the USA, with other centres in Canada, China,Germany, Norway, Oman and Qatar. Further details of Shell’sresearch and development, including expenditure, can be found in the“Strategic Report” on page 10 as well as in the “ConsolidatedStatement of Income”.
DIVERSITY AND INCLUSIONInformation concerning diversity and inclusion can be found in the“Strategic Report” on page 57.
EMPLOYEE COMMUNICATION AND INVOLVEMENTInformation concerning employee communication and involvement canbe found in the “Strategic Report” on page 56.
CORPORATE SOCIAL RESPONSIBILITYA summary of Shell’s approach to corporate social responsibility canbe found in the “Strategic Report” on pages 52-56. Further details willbe available in the Shell Sustainability Report 2014.
GREENHOUSE GAS EMISSIONSInformation relating to greenhouse gas emissions can be found in the“Strategic Report” on page 53.
FINANCIAL RISK MANAGEMENT, OBJECTIVESAND POLICIESDescriptions of the use of financial instruments and Shell’s financial riskmanagement objectives and policies, and exposure to market risk(including price risk), credit risk and liquidity risk can be found inNote 19 to the “Consolidated Financial Statements”.
SHARE CAPITALThe Company’s issued share capital as at December 31, 2014, is setout in Note 10 to the “Parent Company Financial Statements”. Thepercentage of the total issued share capital represented by each classof share is given below.
SHARE CAPITAL PERCENTAGE %Share classA ordinary 61.55B ordinary 38.45Sterling deferred de minimis
TRANSFER OF SECURITIESThere are no significant restrictions on the transfer of securities.
SHARE OWNERSHIP TRUSTS AND TRUST-LIKE ENTITIESShell has three primary employee share ownership trusts and trust-likeentities: a Dutch foundation (stichting) and two US Rabbi Trusts. Theshares held by the Dutch foundation are voted by its Board and theshares in the US Rabbi Trusts are voted by the Voting Trustee, EvercoreTrust Company, N.A. Both the Board of the Dutch foundation and theVoting Trustee are independent of Shell.
The UK Shell All Employee Share Ownership Plan has a separaterelated share ownership trust. Shares held by the trust are voted by itstrustee, EES Corporate Trustees Limited, as directed by the participants.
SIGNIFICANT SHAREHOLDINGSInformation concerning significant shareholdings can be found onpage 180.
ARTICLES OF ASSOCIATIONInformation concerning the Articles of Association can be found onpages 71-75.
LISTING RULE INFORMATION [A]Information concerning the amount of interest capitalised by Shell canbe found in Note 6 to the “Consolidated Financial Statements”.[A] This information is given in accordance with Listing Rule 9.8.4R.
AUDITORSPricewaterhouseCoopers LLP has signified its willingness to continue inoffice and a resolution for its reappointment will be proposed at the2015 AGM.
CORPORATE GOVERNANCEThe Company’s statement on corporate governance is included in the“Corporate governance” report and is incorporated in this Directors’Report by way of reference.
ANNUAL GENERAL MEETINGThe AGM will be held on May 19, 2015, at the Circustheater,Circusstraat 4, 2586 CW, The Hague, The Netherlands. Details ofthe business to be put to shareholders at the AGM can be found in theNotice of Annual General Meeting.
Signed on behalf of the Board
/s/ Michiel Brandjes
Michiel BrandjesCompany SecretaryMarch 11, 2015

GOVERNANCE 65
SHELL ANNUAL REPORT AND FORM 20-F 2014 CORPORATE GOVERNANCE
CORPORATE GOVERNANCEDear Shareholders,
I am pleased to introduce this report which will be my last before I stepdown as Chairman and a Director of Royal Dutch Shell plc (the Company)at this year’s Annual General Meeting (AGM). I have always taken myresponsibility to ensure we meet the highest standards of corporategovernance very seriously, as I believe such standards are essential to thelong-term success of the Company and maintaining investors’ trust. Duringthe year we have again applied the main principles and relevantprovisions of the 2012 version of the Financial Reporting Council’s UKCorporate Governance Code (the Code), and I hope this report gives youa good understanding of the systems of governance and control whichcontinue to operate within the Company.
Following my decision to stand down as Chairman after a period of nineyears, the Nomination and Succession Committee, under thechairmanship of the Deputy Chairman, conducted a thorough search andbenchmarking exercise of internal and external candidates. We weredelighted to announce in October 2014 the appointment of Charles O.Holliday, currently a Non-executive Director, as my successor. Chad hasa distinguished track record as an international businessman and hisappointment has the unanimous support of the Board.
We welcomed two Non-executive Directors, Euleen Goh andPatricia A. Woertz, following their appointment at the 2014 AGM.They both received full and tailored induction programmes, which areongoing, and they are already bringing their individual skills,knowledge and experience to the boardroom.
The Board and the Nomination and Succession Committee believe theBoard should be a diverse mix of people and increasing its diversity isa priority in our succession planning. Gender diversity is an importantelement of this mix and last year I stated our aim that by 2015 at least25% of the Directors would be women. This is in line with therecommendations of the report by Lord Davies of Abersoch entitledWomen on Boards (Davies Report) and I am pleased to report that wesucceeded in meeting our goal by the end of 2014.
In accordance with the Code, we conducted an evaluation of ourperformance during the year, along with that of the Board committeesand individual directors. This was led by the Nomination andSuccession Committee. However, unlike last year, the process wasconducted in-house rather than being externally facilitated. One of theareas that we looked at was the extent to which suggestions from the2013 process were implemented in 2014. These included givinggreater focus to strategic matters, industry trends and risk, and toincreasing Board exposure to senior management below the level ofthe Executive Committee. I am pleased to say that the Boardconcluded that good progress had been made in all these areas.
Although we did not engage the services of an external facilitator, theprocess again proved to be very useful and benefited in particular from freshinsights and perspectives offered by the new Directors appointed during theyear. In keeping with the Code, it is the intention that the annual evaluationprocess will continue to be externally facilitated every three years.
Finally, I would like to thank my fellow Directors, past and present, fortheir commitment and support over the years in achieving the highstandards of corporate governance we have become accustomed towithin the Company. I wish my successor and the Board long andcontinued success.
Jorma OllilaChairmanMarch 11, 2015
STATEMENT OF COMPLIANCEThe Board confirms that throughout the year the Company has appliedthe main principles and complied with the relevant provisions set out inthe Code issued by the Financial Reporting Council in September2012 [A]. In addition to complying with applicable corporategovernance requirements in the UK, the Company must follow the rulesof Euronext Amsterdam as well as Dutch securities laws because of itslisting on that exchange. The Company must likewise follow USsecurities laws and the New York Stock Exchange (NYSE) rules andregulations because its securities are registered in the USA and listedon the NYSE.[A] In September 2014, the Financial Reporting Council issued an updated version of theCode which applies to accounting periods beginning on or after October 1, 2014.
NYSE GOVERNANCE STANDARDSIn accordance with the NYSE rules for foreign private issuers, theCompany follows home-country practice in relation to corporategovernance. However, foreign private issuers are required to have anaudit committee that satisfies the requirements of the US Securities andExchange Commission’s (SEC) Rule 10A-3. The Company’s AuditCommittee satisfies such requirements. The NYSE also requires a foreignprivate issuer to provide certain written affirmations and notices to theNYSE, as well as a summary of the significant ways in which itscorporate governance practices differ from those followed by domesticUS companies under NYSE listing standards (see NYSE Rule 303A.11).The Company’s summary of its corporate governance differences is givenbelow and can be found at www.shell.com/investor.
Non-executive Director independenceThe Board follows the provisions of the Code in determining Non-executive Director independence, which states that at least half of theBoard, excluding the Chairman, should comprise Non-executiveDirectors determined by the Board to be independent. In the case ofthe Company, the Board has determined that all the Non-executiveDirectors as at the end of 2014 are wholly independent.
Nominating/corporate governance committee andcompensation committeeThe NYSE listing standards require that a listed company maintain anominating/corporate governance committee and a compensationcommittee, both composed entirely of independent directors and withcertain specific responsibilities. The Company’s Nomination andSuccession Committee and Remuneration Committee both comply withthese requirements, except that the terms of reference of theNomination and Succession Committee require only a majority of thecommittee members to be independent.
Audit CommitteeAs required by NYSE listing standards, the Company maintains anAudit Committee for the purpose of assisting the Board’s oversight of itsfinancial statements, its internal audit function and its independentauditors. The Company’s Audit Committee is in full compliance with theSEC’s Rule 10A-3 and Section 303A.06 of the NYSE Listed CompanyManual. However, in accordance with English law, the Company’sAudit Committee makes recommendations to the Board for it to put toshareholders for approval in general meeting regarding theappointment, reappointment and removal of independent auditors.Consequently, the Company’s Audit Committee is not directlyresponsible for the appointment of independent auditors.
Shareholder approval of share-based compensationplansThe Company complies with the listing rules of the UK Listing Authority(UKLA), which require shareholder approval for the adoption of share-based compensation plans which are either long-term incentive plansin which one or more Directors can participate or plans which involveor may involve the issue of new shares or the transfer of

66 GOVERNANCE
CORPORATE GOVERNANCE SHELL ANNUAL REPORT AND FORM 20-F 2014
CORPORATE GOVERNANCECONTINUED
treasury shares. Under the UKLA rules, such plans cannot be changedto the advantage of participants without shareholder approval, exceptfor certain minor amendments, for example to benefit the administrationof the plan or to take account of tax benefits. The rules on therequirements to seek shareholder approval for share-basedcompensation plans, including those in respect of material revisions tosuch plans, may deviate from the NYSE listing standards.
Code of business conduct and ethicsThe NYSE listing standards require that listed companies adopt a codeof business conduct and ethics for all directors, officers and employeesand promptly disclose any waivers of the code for directors orexecutive officers. The Company has adopted the Shell GeneralBusiness Principles (see below), which satisfy the NYSE requirements.The Company also has internal procedures in place by which anyemployee can raise in confidence accounting, internal accountingcontrols and auditing concerns. Additionally, any employee can reportconcerns to management by telephone or over the internet withoutjeopardising their position (see below).
SHELL GENERAL BUSINESS PRINCIPLESThe Shell General Business Principles define how Shell subsidiaries areexpected to conduct their affairs. These principles include, amongother things, Shell’s commitment to support fundamental human rights inline with the legitimate role of business and to contribute to sustainabledevelopment. They can be found at www.shell.com/sgbp.
SHELL CODE OF CONDUCTDirectors and employees are required to comply with the Shell Code ofConduct, which is intended to help them put Shell’s business principlesinto practice. This code clarifies the basic rules and standards they areexpected to follow and the behaviour expected of them. It can befound at www.shell.com/codeofconduct.
CODE OF ETHICSExecutive Directors and Senior Financial Officers of Shell must alsocomply with a Code of Ethics. This code is specifically intended tomeet the requirements of Section 406 of the Sarbanes-Oxley Act andthe listing requirements of the NYSE (see above). It can be found atwww.shell.com/codeofethics.
SHELL GLOBAL HELPLINEEmployees, contract staff, third parties with whom Shell has a businessrelationship (such as customers, suppliers and agents), and any memberof the public (including shareholders) may raise ethics and complianceconcerns through the Shell Global Helpline. This is a worldwideconfidential reporting mechanism, operated by an external third party,which is available 24 hours a day, seven days a week by telephoneand at www.shell.com or www.compliance-helpline.com/shell.
BOARD STRUCTURE AND COMPOSITIONDuring 2014, the Board comprised the Chairman; two Executive Directors,namely the Chief Executive Officer (CEO) and the Chief Financial Officer(CFO); and Non-executive Directors, including the Deputy Chairman andSenior Independent Director [A], as follows:
PeriodNumber of Non-executive
DirectorsJanuary 1 to May 20 8May 21 to May 31 7June 1 to August 31 8September 1 to December 31 9
A list of current Directors, including their biographies, can be found onpages 58-60.[A] Josef Ackermann stood down as a Non-executive Director on May 20, 2014. Euleen Gohand Patricia A. Woertz were appointed as Non-executive Directors with effect fromSeptember 1, 2014, and June 1, 2014, respectively.
The Board recognises its collective responsibility for the long-termsuccess of the Company. Generally it meets eight times a year [B] andhas a formal schedule of matters reserved to it. This includes: overallstrategy and management; corporate structure and capital structure;financial reporting and control, including approval of the AnnualReport and Form 20-F, and interim dividends; oversight and review ofrisk management and internal control; significant contracts; andsuccession planning and new Board appointments. The full list ofmatters reserved to the Board for decision can be found atwww.shell.com/investor.[B] See page 67 for the number of meetings held in 2014.
ROLE OF DIRECTORSThe roles of the Chairman, a non-executive role, and the CEO areseparate, and the Board has agreed their respective responsibilities.
The Chairman is responsible for the leadership and management of theBoard and for ensuring that the Board and its committees functioneffectively. One way in which this is achieved is by ensuring Directorsreceive accurate, timely and clear information. He is also responsiblefor agreeing and regularly reviewing the training and developmentneeds of each Director (see “Induction and training” on page 67)which he does with the assistance of the Company Secretary.
The CEO bears overall responsibility for the implementation of thestrategy agreed by the Board, the operational management of theCompany and the business enterprises connected with it. He issupported in this by the Executive Committee which he chairs (seepage 68).
NON-EXECUTIVE DIRECTORSNon-executive Directors are appointed by the Board or byshareholders at general meetings and, in accordance with the Code,must seek re-election by shareholders on an annual basis. Their letter ofappointment refers to a specific term of office, such term being subjectto the provisions of the Code and the Company’s Articles ofAssociation (the Articles). Upon appointment, Non-executive Directorsconfirm they are able to allocate sufficient time to meet theexpectations of the role. Appointments are subject to three months’notice, and there is no compensation provision for early termination.
The Non-executive Directors bring a wide range and balance of skillsand international business experience to Shell. Through theircontribution to Board meetings and to Board committee meetings, theyare expected to challenge constructively and help develop proposalson strategy and bring independent judgement on issues ofperformance and risk. Generally, prior to each meeting of the Board,the Chairman and the Non-executive Directors meet without theExecutive Directors to discuss, among other things, the performance ofindividual Executive Directors. A number of Non-executive Directorsalso meet major shareholders from time to time.
The role of the Senior Independent Director is to provide a soundingboard for the Chairman and to serve as an intermediary for the otherDirectors when necessary. The Senior Independent Director is availableto shareholders if they have concerns which contact through the normalchannels of Chairman, CEO or CFO has failed to resolve or for whichsuch contact is inappropriate.
All the Non-executive Directors are considered by the Board to bewholly independent.

GOVERNANCE 67
SHELL ANNUAL REPORT AND FORM 20-F 2014 CORPORATE GOVERNANCE
CONFLICTS OF INTERESTCertain statutory duties with respect to directors’ conflicts of interest arein force under the Companies Act 2006 (the Act). In accordance withthe Act and the Articles, the Board may authorise any matter thatotherwise may involve any of the Directors breaching his or her duty toavoid conflicts of interest. The Board has adopted a procedure toaddress these requirements. It includes the Directors completingdetailed conflict of interest questionnaires. The matters disclosed in thequestionnaires are reviewed by the Board and, if consideredappropriate, authorised in accordance with the Act and the Articles.Conflicts of interest as well as any gifts and hospitality received by andprovided by Directors are kept under review by the Board.
SIGNIFICANT COMMITMENTS OF THE CHAIRMANThe Chairman’s other significant commitments are given in hisbiography on page 58.
INDEPENDENT PROFESSIONAL ADVICEAll Directors may seek independent professional advice in connectionwith their role as a Director. All Directors have access to the adviceand services of the Company Secretary. The Company has providedboth indemnities and directors’ and officers’ insurance to the Directorsin connection with the performance of their responsibilities. Copies ofthese indemnities and the directors’ and officers’ insurance policies areopen to inspection. Copies of these indemnities have been previouslyfiled with the SEC and are incorporated by reference as an exhibit tothis Report.
BOARD ACTIVITIES DURING THE YEARThe Board met seven times during the year. Six of the meetings wereheld in The Hague, the Netherlands, and one meeting was held inSeoul, South Korea. The agenda for each meeting included a numberof regular items, including reports from the CEO, the CFO and theother members of the Executive Committee, from each of the Boardcommittees and from the various functions, including finance (whichincludes investor relations), health and security, human resources, andlegal (which includes the Company Secretary). The Board alsoconsidered and approved each of the quarterly, half-year and full-yearfinancial results and dividend announcements and, at most meetings,considered a number of investment, divestment and financingproposals.
In part as a result of the performance evaluation process undertaken in2013, the Board gave greater focus in 2014 to strategic andperformance issues. In June, it held a full-day session on strategymatters which included a review of the tight-gas and liquids-rich shaleand Oil Products businesses, and the agenda for further businessreviews over the following 12 months. During the year, the Board alsoreceived reports and presentations on certain of our activities,including those in Australia, Canada, China, Iraq, Malaysia, Nigeria,Russia, Ukraine and the USA (including Alaska), and on asset integrityand process safety, litigation, risk management, safety andenvironmental performance, and senior management succession. Onoccasion, it held informal discussions with leading independent expertson matters of interest, such as strategy, climate change and otherenvironmental concerns, and energy transition scenarios.
INDUCTION AND TRAININGFollowing appointment to the Board, Directors receive acomprehensive induction tailored to their individual needs. Thisincludes site visits and meetings with senior management to enablethem to build up a detailed understanding of Shell’s business andstrategy, and the key risks and issues which they face. For Euleen Gohand Patricia A. Woertz, who were appointed with effect fromSeptember 1, 2014, and June 1, 2014, respectively, Director-specificbriefing materials were made available and induction sessions wereheld with various functions and businesses.
Throughout the year, regular updates on developments in legal matters,governance and accounting are provided to Directors. The Boardregards site visits as an integral part of ongoing Director training.Additional training is available so that Directors can update their skillsand knowledge as appropriate.
ATTENDANCE AT BOARD AND BOARD COMMITTEEMEETINGSAttendance during 2014 for all Board and Board committee meetingsis given in the table below.
ATTENDANCE AT BOARD AND BOARD COMMITTEE MEETINGS [A]
BoardAudit
Committee
Corporate andSocial Responsibility
Committee
Nomination andSuccessionCommittee
RemunerationCommittee
Josef Ackermann 2/2 2/2 2/2Ben van Beurden 7/7Guy Elliott 7/7 6/6 4/4Euleen Goh 2/2 2/2Simon Henry 7/7Charles O. Holliday 7/7 5/5 4/4Gerard Kleisterlee 7/7 6/6 2/2Jorma Ollila 7/7 6/6Sir Nigel Sheinwald 7/7 5/5Linda G. Stuntz 7/7 6/6Hans Wijers 7/7 6/6 2/2Patricia A. Woertz 4/4 2/3Gerrit Zalm 7/7 5/5 2/2
[A] The first figure represents attendance and the second figure the possible number of meetings. For example, 7/7 signifies attendance at seven out of seven possible meetings. Where a Directorstood down from the Board or a Board committee during the year, or was appointed during the year, only meetings before standing down or after the date of appointment are shown.

68 GOVERNANCE
CORPORATE GOVERNANCE SHELL ANNUAL REPORT AND FORM 20-F 2014
CORPORATE GOVERNANCECONTINUED
BOARD EVALUATIONDuring the year, the Board carried out a performance evaluation ofitself, its Committees, the Chairman and each of the other Directors.This was led by the Nomination and Succession Committee and, unlikethe process in 2013, was conducted in-house without engaging theservices of an external facilitator. In accordance with the Code, it isthe intention that the evaluation process will be externally facilitatedevery three years.
The 2014 process consisted of the Chairman holding one-to-oneinterviews with each of the Directors. The Directors were asked toconsider specific matters in advance, such as the functioning andeffectiveness of the Board, the extent to which suggestions from the2013 process had been implemented and the major issues andchallenges for 2015 and beyond. The Deputy Chairman conducted aseparate review of the Chairman’s performance which involved eachDirector completing a confidential questionnaire (see below) and anoffer to meet and discuss any particular issues. A review of each Boardcommittee was undertaken by the respective Committee Chairman byquestionnaire and discussed in the relevant committee.
In January 2015, the performance of the Board as a whole and theBoard committees was discussed by the Nomination and SuccessionCommittee and subsequently by the full Board. The discussions wereled by the Chairman and focused on issues such as the functioning,effectiveness and performance of the Board and Board committees, thefollow up on the priorities for change identified from the performanceevaluation held in 2013 and the quality of support. Discussion alsofocussed on the priorities of the Board in 2015 and beyond, and itwas agreed these included the following: the impact of the oil price onthe Company’s financial framework; performance management andreturn on investment; and the Company’s strategy regarding climatechange.
The performance evaluation of the Chairman was reviewed in asession led by the Deputy Chairman with attendance by all Directorsexcept for the Chairman. Directors had previously answered questionsconcerning the performance of the Chairman in relation to certainmatters, including the management of Board meetings, communicationand relationships with the CEO and other Directors, relationships withmajor shareholders and other stakeholders, and the key challenges for2015 and beyond. The Deputy Chairman reported that the Directorshad commented favourably on the Chairman’s open andapproachable style and that the unanimous view of the Chairman’sperformance in 2014 was positive. In view of the appointment ofCharles O. Holliday as successor to the current Chairman followingthe forthcoming AGM, it was recognised that 2015 would be atransitional year for the Chairman role.
The results of the evaluation of the CEO were discussed by theChairman and the Non-executive Directors.
EXECUTIVE COMMITTEEThe Executive Committee operates under the direction of the CEO insupport of his responsibility for the overall management of theCompany’s business and affairs. The CEO has final authority in allmatters of management that are not within the duties and authorities ofthe Board or of the shareholders’ general meeting.
The current composition of the Executive Committee is as follows:
EXECUTIVE COMMITTEEBen van Beurden CEO [A][B][C]Simon Henry CFO [A][B]John Abbott Downstream Director [B]Harry Brekelmans Projects & Technology Director [B][D]Andrew Brown Upstream International Director [B][E]Donny Ching Legal Director [B][F]Hugh Mitchell Chief Human Resources &
Corporate Officer [B]Marvin Odum Upstream Americas Director [B]
[A] Director of the Company.[B] Designated an Executive Officer pursuant to US Exchange Act Rule 3b-7. Beneficially ownsless than 1% of outstanding classes of securities.[C] Ben van Beurden was appointed CEO in succession to Peter Voser with effect fromJanuary 1, 2014.[D] Harry Brekelmans was appointed Projects & Technology Director in succession to MatthiasBichsel with effect from October 1, 2014.[E] For the period January 20, 2014 to March 31, 2014, Maarten Wetselaar, Executive VicePresident Integrated Gas, was acting Upstream International Director while Andrew Brown wason recuperation leave following a medical procedure.[F] Donny Ching was appointed Legal Director in succession to Peter Rees with effect fromFebruary 10, 2014. Peter Rees stood down with effect from January 10, 2014.
BOARD COMMITTEESThere are four Board committees made up of Non-executive Directors.These are the:
� Audit Committee;� Corporate and Social Responsibility Committee;� Nomination and Succession Committee; and� Remuneration Committee.
Each of these Board committees has produced a report which hasbeen approved by the relevant chairman. A copy of each committee’sterms of reference is available from the Company Secretary and canbe found at www.shell.com/investor.
Audit CommitteeThe Audit Committee report which sets out the composition and work ofthe Audit Committee is on pages 76-78.
Corporate and Social Responsibility CommitteeThe current members of the Corporate and Social ResponsibilityCommittee are Charles O. Holliday (Chairman of the Committee), SirNigel Sheinwald, Patricia A. Woertz (with effect from June 1, 2014)and Gerrit Zalm. The Committee met five times during the year; theCommittee members’ attendances are shown on page 67.
The Committee has a mandate to maintain a comprehensive overviewof the policies and performance of the subsidiaries of the Companywith respect to the Shell General Business Principles and the ShellCode of Conduct, as well as major issues of public concern.Conclusions and recommendations made by the Committee arereported directly to executive management and the Board.
The Committee fulfils its responsibilities by reviewing the managementof health, safety, security, environmental and social impacts of projectsand operations. It also monitors emerging environmental and socialissues. It additionally provides input into the Shell Sustainability Reportand reviews a draft of the report before publication.
In addition to holding regular formal meetings, the Committee visitsShell locations and meets with local staff and external stakeholders toobserve how Shell’s standards regarding health, safety, security, the

GOVERNANCE 69
SHELL ANNUAL REPORT AND FORM 20-F 2014 CORPORATE GOVERNANCE
environment and social performance are being implemented. In 2014,the Committee visited operations in Canada, including Groundbirch,Kitimat and the oil sands, and the Rijswijk Technology Centre in theNetherlands. It also visited Washington, DC, USA where it met withseveral non-governmental organisations.
Nomination and Succession CommitteeThe members of the Nomination and Succession Committee are JormaOllila (Chairman of the Committee), Guy Elliott (with effect fromMay 21, 2014) and Hans Wijers. Josef Ackermann stood down as amember of the Committee on May 20, 2014. The Committee met sixtimes during the year; the Committee members’ attendances are shownon page 67.
The Committee keeps under review the leadership needs of theCompany and identifies and nominates suitable candidates for theBoard’s approval to fill vacancies as and when they arise. In addition,it makes recommendations on who should be appointed Chairman ofthe Audit Committee, the Corporate and Social ResponsibilityCommittee and the Remuneration Committee and, in consultation withthe relevant chairman, recommends who should sit on the Boardcommittees. It also makes recommendations on corporate governanceguidelines, monitors compliance with corporate governancerequirements and makes recommendations on disclosures connectedwith corporate governance of its appointment processes.
During the year, the Committee dealt with the appointment of the newChairman (under the chairmanship of the Deputy Chairman), two newNon-executive Directors and the new Projects & Technology Director.In relation to the appointment of the new Chairman, it was assisted byan external search consultancy (see below) whose main role was topropose suitable external candidates. After careful consideration ofinternal and external candidates against established criteria, includingavailability of time to fulfil the responsibilities of the role, the Committeemade a recommendation to the Board to appoint Charles O. Hollidaywith effect from the conclusion of the 2015 AGM [A]. Theappointment process for the two new Non-executive Directors involvedthe Committee drawing up a candidate profile in terms of skills,knowledge, experience, nationality and gender and, following aninterview and benchmarking process, making a recommendation to theBoard. In both cases, the Board then sought shareholder approval forthe appointments at the 2014 AGM.
In addition to continuing its ongoing programme of successionplanning for the Non-executive Directors, the Committee consideredthe Executive Committee talent pipeline, Board committee membership,and a request from an Executive Director to accept an externaldirectorship. It also led the Board evaluation process, considered anypotential conflicts of interest and the independence of the Non-executive Directors and reviewed its terms of reference.
The Board takes the issue of boardroom diversity very seriously andbelieves that maintaining an appropriate balance of skills, knowledge,experience and backgrounds is key to its effective performance. Itbelieves gender diversity is an important element of this mix. In 2011,it issued a statement welcoming the recommendations of the DaviesReport and stated that it expected at least 25% of the Directors to bewomen by 2015, as recommended by the report. After theappointment of two women as Directors during the year, there were atotal of three women on the Board at the end of 2014, increasing thepercentage of women to 25%.
As part of its role in identifying and nominating suitable candidates forthe Board’s approval, the Nomination and Succession Committee willcontinue to review candidates from a variety of backgrounds and willseek to produce a list of candidates that fully reflects the Board’s goalof becoming more diverse.
The Committee maintains contact with leading global search firms toidentify and consider suitable candidates. It used the services of EgonZehnder in relation to the appointment of the new Chairman, andSpencer Stuart in relation to the appointment of Euleen Goh [B]. It didnot use an external search consultancy in relation to the appointment ofPatricia A. Woertz. It was not considered necessary to use openadvertising in relation to these appointments.[A] Charles O. Holliday’s biography can be found on page 59. As stated in the biography, hestood down as Chairman of Bank of America Corporation in September 2014.[B] Neither Egon Zehnder nor Spencer Stuart have any connection with the Company otherthan that of search consultants.
Remuneration CommitteeThe Directors’ Remuneration Report, which sets out the composition andwork of the Remuneration Committee, the Directors’ remuneration for2014 and the Directors’ Remuneration Policy which was approved byshareholders at the 2014 AGM, is on pages 79-98.
SHAREHOLDER COMMUNICATIONSThe Board recognises the importance of two-way communication withthe Company’s shareholders. The Chairman, the Deputy Chairman andSenior Independent Director, the CEO, the CFO and the ExecutiveVice President Investor Relations each meet regularly with majorshareholders and report the views of such shareholders to the Board.As well as the Company giving a balanced report of results andprogress at each AGM, all shareholders have an opportunity to askquestions in person. Shareholders are also free to contact theCompany directly at any time of the year via dedicated shareholderemail addresses or via dedicated shareholder telephone numbers asgiven on the inside back cover of this Report. Shell’s corporate websiteat www.shell.com/investor has information for institutional and retailshareholders alike.
The Company’s Registrar, Equiniti, operates an internet access facilityfor registered shareholders, providing details of their shareholdings atwww.shareview.co.uk. Facilities are also provided for shareholders tolodge proxy appointments electronically. The Company’s CorporateNominee provides a facility for investors to hold their shares in theCompany in paperless form.
RESULTS PRESENTATIONS AND ANALYSTS’ MEETINGSThe quarterly, half-yearly and annual results presentations as well as allmajor analysts’ meetings are announced in advance on the Shellwebsite and through a regulatory release. These presentations arebroadcast live via webcast and teleconference. Other meetings withanalysts or investors are not normally announced in advance, nor canthey be followed remotely by webcast or any other means. Proceduresare in place to ensure that discussions in such meetings are alwayslimited to non-material information or information already in the publicdomain.
Results and meeting presentations can be found at www.shell.com.This is in line with the requirement to ensure that all shareholders andother parties in the financial market have equal and simultaneousaccess to information that may influence the price of the Company’ssecurities.
NOTIFICATION OF MAJOR SHAREHOLDINGSInformation concerning notifications of major shareholdings can befound on page 180.
RESPONSIBILITY FOR PREPARING THE ANNUALREPORT AND ACCOUNTSInformation concerning the responsibility for preparing the AnnualReport and Accounts can be found on page 62.

70 GOVERNANCE
CORPORATE GOVERNANCE SHELL ANNUAL REPORT AND FORM 20-F 2014
CORPORATE GOVERNANCECONTINUED
CONTROLS AND PROCEDURESThe Board is responsible for maintaining a sound system of riskmanagement and internal control, and for regularly reviewing itseffectiveness. It has delegated authority to the Audit Committee toassist it in fulfilling its responsibilities in relation to internal control andfinancial reporting (see “Audit Committee Report”).
A single overall control framework is in place for the Company and itssubsidiaries that is designed to manage rather than eliminate the risk offailure to achieve business objectives. It therefore only provides areasonable and not an absolute assurance against materialmisstatement or loss.
The following diagram illustrates the control framework’s keycomponents: “Foundations”, “Management Processes” and“Organisation”. In 2013, the control framework was updated to putgreater emphasis on the link between objectives, risks, controls andassurance. “Foundations” comprises the objectives, principles and rulesthat underpin and establish boundaries for Shell’s activities.“Management Processes” refers to the more material managementprocesses, including how strategy, planning and appraisal are used toimprove performance and how risks are to be managed througheffective controls and assurance. “Organisation” sets out how thevarious legal entities relate to each other and how their businessactivities are organised and managed, and how authority isdelegated.
CONTROL FRAMEWORK
External Environment
Foundations Management Processes Organisation
Shell General Business Principles
Controls and Assurance
Standards and Manuals
Statement on Risk Management
Code of Conduct
Strategy, Planning and Appraisal
Board of Royal Dutch Shell plc, Chief Executive Officer and Executive Committee
Businesses and Functions Legal Entities
The system of risk management and internal control over financialreporting is an integral part of the control framework. Regular reviewsare performed to identify the significant risks to financial reporting andthe key controls designed to address them. These controls aredocumented, responsibility is assigned, and they are monitored fordesign and operating effectiveness. Controls found not to be effectiveare remediated.
The Board confirms that there is an ongoing process for identifying,evaluating and managing the significant risks to the achievement ofShell’s objectives. This has been in place throughout the year and upto the date of this Report and is regularly reviewed by the Board andaccords with the Internal Control: Guidance to Directors (formerlyknown as the Turnbull Guidance).
Shell has a variety of processes for obtaining assurance on theadequacy of risk management and internal control. The ExecutiveCommittee and the Audit Committee regularly consider group-level risksand associated control mechanisms. The Board has conducted itsannual review of the effectiveness of Shell’s system of risk managementand internal control, including financial, operational and compliancecontrols.
Pension plansShell has a number of ways to address key pension risks. Principalamong these is the Pensions Forum, a joint finance and humanresources body chaired by the CFO, which provides guidance onShell’s input to pension strategy, policy and operation. The Forum issupported by the Pensions Risk Committee in reviewing the results ofassurance processes with respect to pension risks (see “Risk factors”).
In general, local trustees manage the funded defined benefit pensionplans and set the required contributions based on independentactuarial valuations in accordance with local regulations rather thanthe IFRS measures. For further information regarding the judgementapplied in setting the actuarial assumptions under IFRS and itsrelationship to the financial position of Shell, see Notes 3 and 17 tothe “Consolidated Financial Statements”.
Treasury and tradingIn the normal course of business, financial instruments of various kindsare used for the purposes of managing exposure to interest rate,currency and commodity price movements.
Treasury standards are applicable to all subsidiaries, and eachsubsidiary is required to adopt a treasury policy consistent with thesestandards. These policies cover: financing structure; interest rate andforeign exchange risk management; insurance; counterparty riskmanagement; and use of derivative instruments. Wherever possible,treasury operations are carried out through specialist regionalorganisations without removing from each subsidiary the responsibilityto formulate and implement appropriate treasury policies.
Apart from forward foreign exchange contracts to meet knowncommitments, the use of derivative financial instruments by mostsubsidiaries is not permitted by their treasury policy.
Other than in exceptional cases, the use of external derivativeinstruments is confined to specialist trading and central treasuryorganisations that have appropriate skills, experience, supervision,control and reporting systems.
Shell’s operations expose it to market, credit and liquidity risk, asdescribed in Note 19 to the “Consolidated Financial Statements”.
Management’s evaluation of disclosure controls andprocedures of ShellAs indicated in the certifications in Exhibits 12.1 and 12.2 of thisReport, Shell’s CEO and CFO have evaluated the effectiveness ofShell’s disclosure controls and procedures as at December 31, 2014.On the basis of that evaluation, these officers have concluded thatShell’s disclosure controls and procedures are effective.

GOVERNANCE 71
SHELL ANNUAL REPORT AND FORM 20-F 2014 CORPORATE GOVERNANCE
Management’s report on internal control over financialreporting of ShellManagement, including the CEO and CFO, is responsible forestablishing and maintaining adequate internal control over Shell’sfinancial reporting and the production of the “Consolidated FinancialStatements”. It conducted an evaluation of the effectiveness of Shell’sinternal control over financial reporting and the production of the“Consolidated Financial Statements” based on the Internal Control –Integrated Framework (2013) issued by the Committee of SponsoringOrganizations of the Treadway Commission. On the basis of thisevaluation, management concluded that, as at December 31, 2014,the Company’s internal control over Shell’s financial reporting and theproduction of the “Consolidated Financial Statements” was effective.
PricewaterhouseCoopers LLP, the independent registered publicaccounting firm that audited the financial statements, has issued anattestation report on the Company’s internal control over financialreporting, as stated in their report on page 105.
The Trustee’s and management’s evaluation ofdisclosure controls and procedures for the Royal DutchShell Dividend Access TrustThe Trustee of the Royal Dutch Shell Dividend Access Trust (the Trustee)and Shell’s CEO and CFO have evaluated the effectiveness of thedisclosure controls and procedures in respect of the Dividend AccessTrust (the Trust) as at December 31, 2014. On the basis of thisevaluation, these officers have concluded that the disclosure controlsand procedures of the Trust are effective.
The Trustee’s and management’s report on internalcontrol over financial reporting of the Royal Dutch ShellDividend Access TrustThe Trustee is responsible for establishing and maintaining adequateinternal control over the Trust’s financial reporting. The Trustee and theCompany’s management conducted an evaluation of the effectivenessof internal control over financial reporting based on the Internal Control– Integrated Framework (2013) issued by the Committee of SponsoringOrganizations of the Treadway Commission. On the basis of thisevaluation, the Trustee and management concluded that, as atDecember 31, 2014, the Trust’s internal control over financialreporting was effective.
PricewaterhouseCoopers CI LLP, the independent registered publicaccounting firm that audited the financial statements, has issued anattestation report on the Trustee’s and management’s internal controlover financial reporting, as stated in its report on page 173.
Changes in internal control over financial reportingThere has not been any change in the internal control over financialreporting of Shell or the Trust that occurred during the period coveredby this Report that has materially affected, or is reasonably likely tomaterially affect, the internal control over financial reporting. Materialfinancial information of the Trust is included in the “ConsolidatedFinancial Statements” and is therefore subject to the same disclosurecontrols and procedures as Shell. See the “Royal Dutch Shell DividendAccess Trust Financial Statements” for additional information.
ARTICLES OF ASSOCIATIONThe following summarises certain provisions of the Articles [A] and ofthe applicable laws of England. This summary is qualified in its entiretyby reference to the Articles and the Act.[A] Copies of the Articles have been previously filed with the SEC and are incorporated byreference as exhibits to this Report. They can be found at www.shell.com.
Management and DirectorsThe Articles provide that the Company’s Board of Directors must consistof not less than three members nor more than 20 members at any time.The Company has a single tier Board of Directors headed by aChairman, with management led by a CEO. See “Board structure andcomposition” on page 66.
Under the Articles, at every AGM any Director who was in office at thetime of the two previous AGMs and who did not retire at either of themmust retire, and any such Director will be eligible to stand forreappointment. Further, a Director who would not otherwise berequired to retire must retire if he or she has been in office, other thanas a Director holding an executive position, for a continuous period ofnine years or more at the date of the meeting, and any such Directorwill be eligible to stand for reappointment. However, notwithstandingthe provisions of the Articles, the Company complies with the Codethat requires all Directors to stand for annual reappointment byshareholders. At the AGM, shareholders can pass an ordinaryresolution to reappoint each of the Directors or to appoint anothereligible person in his or her place.
Under the Articles:
� a Director may not vote or be counted in the quorum in respect ofany matter in which he or she is materially interested including anymatter related to his or her own compensation;
� the Directors may exercise the Company’s power to borrow moneyprovided that the borrowings of Shell shall not, without the consentof an ordinary resolution of the Company’s shareholders, exceedtwo times the Company’s adjusted capital and reserves (thesepowers relating to borrowing may only be varied by specialresolution of shareholders); and
� Directors are not required to hold shares of the Company to qualifyas a Director.
Rights attaching to shares
DIVIDEND RIGHTS AND RIGHTS TO SHARE IN THE COMPANY’S PROFITUnder the applicable laws of England, dividends are payable onA and B shares only out of profits available for distribution, asdetermined in accordance with the Act and under IFRS.
Subject to the Act, if the Directors consider that the Company’sfinancial position justifies the payment of a dividend, the Companycan pay an interim dividend. Shareholders can declare dividends bypassing an ordinary resolution although such dividends cannot exceedthe amount recommended by the Board.
It is the intention that dividends will be announced and paid quarterly.Dividends are payable to persons registered as shareholders on therecord date relating to the relevant dividend. All dividends will bedivided and paid in proportions based on the amounts paid up on theCompany’s shares during any period for which that dividend is paid.
Any dividend or other money payable in cash relating to a share canbe paid by sending a cheque, warrant or similar financial instrumentpayable to the shareholder entitled to the dividend by post to theshareholder’s registered address. Alternatively, it can be madepayable to someone else named in a written instruction from theshareholder (or all joint shareholders) and sent by post to the addressspecified in that instruction. A dividend can also be paid by inter-banktransfer or by other electronic means (including payment throughCREST) directly to an account with a bank or other financial institution(or other organisation operating deposit accounts if allowed by theCompany) named in a written instruction from the person entitled toreceive the payment under the Articles. Such an account must be heldat an institution based in the UK unless the share on which the payment

72 GOVERNANCE
CORPORATE GOVERNANCE SHELL ANNUAL REPORT AND FORM 20-F 2014
CORPORATE GOVERNANCECONTINUED
is to be made is held by Euroclear Nederland and is subject to theDutch Securities Giro Act (“Wet giraal effectenverkeer”). Alternatively,a dividend can be paid in some other way if requested in writing by ashareholder (or all joint shareholders) and agreed to by the Company.The Company will not be responsible for a payment which is lost ordelayed.
Where any dividends or other amounts payable on a share have notbeen claimed, the Directors can invest them or use them in any otherway for the Company’s benefit until they are claimed. The Companywill not be a trustee of the money and will not be liable to pay intereston it. If a dividend or other money has not been claimed for 12 yearsafter being announced or becoming due for payment, it will beforfeited and go back to the Company, unless the Directors decideotherwise.
The Company expects that dividends on B shares will be paid under thedividend access mechanism described below. The Articles provide that ifany amount is paid by the issuer of the dividend access share by way ofdividend on the dividend access share and paid by the Trustee to anyholder of B shares, the dividend that the Company would otherwise payto such holder of B shares will be reduced by an amount equal to theamount paid to such holder of B shares by the Trustee.
DIVIDEND ACCESS MECHANISM FOR B SHARES
GeneralA and B shares are identical, except for the dividend accessmechanism, which will only apply to B shares. Dividends paid onA shares have a Dutch source for tax purposes and are subject toDutch withholding tax.
It is the expectation and the intention, although there can be nocertainty, that holders of B shares will receive dividends through thedividend access mechanism. Any dividends paid on the dividendaccess share will have a UK source for UK and Dutch tax purposes.There will be no Dutch withholding tax on such dividends and certainholders (not including US holders of B shares or B American DepositaryShares (ADSs)) will be entitled to a UK tax credit in respect of theirproportional shares of such dividends. For further details regarding thetax treatment of dividends paid on the A and B shares and ADSs, referto “Taxation” on pages 184-185.
Description of dividend access mechanismA dividend access share has been issued by The Shell Transport andTrading Company Limited (Shell Transport) to Computershare Trustees(Jersey) Limited as Trustee. Pursuant to a declaration of trust, the Trusteewill hold any dividends paid in respect of the dividend access shareon trust for the holders of B shares and will arrange for promptdisbursement of such dividends to holders of B shares. Interest andother income earned on unclaimed dividends will be for the account ofShell Transport and any dividends which are unclaimed after 12 yearswill revert to Shell Transport. Holders of B shares will not have anyinterest in the dividend access share and will not have any rightsagainst Shell Transport as issuer of the dividend access share. The onlyassets held on trust for the benefit of the holders of B shares will bedividends paid to the Trustee in respect of the dividend access share.
The declaration and payment of dividends on the dividend accessshare will require board action by Shell Transport and will be subjectto any applicable limitations in law or in the Shell Transport articles ofassociation in effect. In no event will the aggregate amount of thedividend paid by Shell Transport under the dividend access mechanismfor a particular period exceed the aggregate of the dividendannounced by the Board of the Company on B shares in respect of thesame period.
Operation of the dividend access mechanismIf, in connection with the announcement of a dividend by the Companyon B shares, the Board of Shell Transport elects to declare and pay adividend on the dividend access share to the Trustee, the holders ofB shares will be beneficially entitled to receive their share of thatdividend pursuant to the declaration of trust (and arrangements will bemade to ensure that the dividend is paid in the same currency in whichthey would have received a dividend from the Company).
If any amount is paid by Shell Transport by way of a dividend on thedividend access share and paid by the Trustee to any holder ofB shares, the dividend which the Company would otherwise pay onB shares will be reduced by an amount equal to the amount paid tosuch holders of B shares by the Trustee.
The Company will have a full and unconditional obligation, in theevent that the Trustee does not pay an amount to holders of B shareson a cash dividend payment date (even if that amount has been paidto the Trustee), to pay immediately the dividend announced onB shares. The right of holders of B shares to receive distributions fromthe Trustee will be reduced by an amount equal to the amount of anypayment actually made by the Company on account of any dividendon B shares.
If for any reason no dividend is paid on the dividend access share,holders of B shares will only receive dividends from the Companydirectly. Any payment by the Company will be subject to Dutchwithholding tax (unless an exemption is obtained under Dutch law orunder the provisions of an applicable tax treaty).
The dividend access mechanism has been approved by theDutch Revenue Service pursuant to an agreement(“vaststellingsovereenkomst”) with the Company and N.V. KoninklijkeNederlandsche Petroleum Maatschappij (Royal Dutch PetroleumCompany) dated October 26, 2004, as supplemented and amendedby an agreement between the same parties dated April 25, 2005.The agreement states, among other things, that dividend distributionson the dividend access share by Shell Transport will not be subject toDutch dividend withholding tax provided that the dividend accessmechanism is structured and operated substantially as set out above.
The Company may not extend the dividend access mechanism to anyfuture issuances of B shares without the approval of the Dutch RevenueService.
Accordingly, the Company would not expect to issue additionalB shares unless that approval were obtained or the Company were todetermine that the continued operation of the dividend accessmechanism was unnecessary. Any further issue of B shares is subject toadvance consultation with the Dutch Revenue Service.
The dividend access mechanism may be suspended or terminated atany time by the Company’s Directors or the Directors of ShellTransport, for any reason and without financial recompense. Thismight, for instance, occur in response to changes in relevant taxlegislation.
GOVERNANCE 73
SHELL ANNUAL REPORT AND FORM 20-F 2014 CORPORATE GOVERNANCE
The daily operations of the Trust are administered on behalf of Shell bythe Trustee. Material financial information of the Trust is included in the“Consolidated Financial Statements” and is therefore subject to thesame disclosure controls and procedures as Shell.
DISPUTES BETWEEN A SHAREHOLDER OR AMERICAN DEPOSITARY SHAREHOLDER AND ROYAL DUTCH SHELL PLC, ANY SUBSIDIARY, DIRECTOR ORPROFESSIONAL SERVICE PROVIDERThe Articles generally require that, except as noted below, all disputes:(i) between a shareholder in such capacity and the Company and/orits Directors, arising out of or in connection with the Articles orotherwise; (ii) so far as permitted by law, between the Company andany of its Directors in their capacities as such or as the Company’semployees, including all claims made by the Company or on its behalfagainst Directors; (iii) between a shareholder in such capacity and theCompany’s professional service providers (which could include theCompany’s auditors, legal counsel, bankers and ADS depositaries);and (iv) between the Company and its professional service providersarising in connection with any claim within the scope of (iii) above,shall be exclusively and finally resolved by arbitration in The Hague,the Netherlands, under the Rules of Arbitration of the InternationalChamber of Commerce (ICC), as amended from time to time. Thiswould include all disputes arising under UK, Dutch or US law(including securities laws), or under any other law, between partiescovered by the arbitration provision. Accordingly, the ability ofshareholders to obtain monetary or other relief, including in respect ofsecurities law claims, may be determined in accordance with theseprovisions, and the ability of shareholders to obtain monetary or otherrelief may therefore be limited and their cost of seeking and obtainingrecoveries in a dispute may be higher than otherwise would be thecase.
The tribunal shall consist of three arbitrators to be appointed inaccordance with the ICC rules. The chairman of the tribunal must haveat least 20 years’ experience as a lawyer qualified to practise in acommon law jurisdiction which is within the Commonwealth (asconstituted on May 12, 2005) and each other arbitrator must have atleast 20 years’ experience as a qualified lawyer.
Pursuant to the exclusive jurisdiction provision in the Articles, if a courtor other competent authority in any jurisdiction determines that thearbitration requirement described above is invalid or unenforceable inrelation to any particular dispute in that jurisdiction, then that disputemay only be brought in the courts of England and Wales, as is thecase with any derivative claim brought under the Act. The governinglaw of the Articles is the substantive law of England.
Disputes relating to the Company’s failure or alleged failure to pay allor part of a dividend which has been announced and which has fallendue for payment will not be subject to the arbitration and exclusivejurisdiction provisions of the Articles. Any derivative claim broughtunder the Act will not be subject to the arbitration provisions of theArticles.
Pursuant to the relevant Depositary agreement, each holder of ADSs isbound by the arbitration and exclusive jurisdiction provisions of theArticles as described in this section as if that holder were ashareholder.
VOTING RIGHTS AND GENERAL MEETINGS OF SHAREHOLDERS
Shareholders’ meetingsUnder the applicable laws of England, the Company is required ineach year to hold an AGM of shareholders in addition to any othermeeting of shareholders that may be held. Each AGM must be held inthe period six months from the date following the Company’saccounting reference date. Additionally, shareholders may submitresolutions in accordance with Section 338 of the Act.
Directors have the power to convene a general meeting ofshareholders at any time. In addition, Directors must convene ameeting upon the request of shareholders holding not less than 5% ofthe Company’s paid-up capital carrying voting rights at generalmeetings of shareholders pursuant to Section 303 of the Act. A requestfor a general meeting of shareholders must state the general nature ofthe business to be dealt with at the meeting, and must be authenticatedby the requesting shareholders. If Directors fail to call such a meetingwithin 21 days from receipt of the request, the shareholders thatrequested the general meeting, or any of them representing more thanhalf of the total voting rights of all shareholders that requested themeeting, may themselves convene a meeting which must be calledwithin three months. Any such meeting must be convened in the samemanner, as nearly as possible, as that in which meetings are requiredto be convened by the Directors.
The Company is required to give at least 21 clear days’ notice of anyAGM or any other general meeting of the Company.
The Articles require that in addition to any requirements under thelegislation, the notice for any general meeting must state where themeeting is to be held (the principal meeting place) and the location ofany satellite meeting place, which shall be identified as such in thenotice. At the same time that notice is given for any general meeting,an announcement of the date, time and place of that meeting will, ifpractical, be published in a national newspaper in the Netherlands.The rules of the UKLA, Euronext Amsterdam and the NYSE require theCompany to inform holders of its securities of the holding of meetingswhich they are entitled to attend.
A shareholder is entitled to appoint a proxy (who is not required to beanother shareholder) to represent and vote on behalf of the shareholderat any general meeting of shareholders, including the AGM, if a dulycompleted form of proxy has been received by the Company not lessthan 48 hours before the meeting.
Business may not be transacted at any general meeting, including theAGM, unless a quorum is present. A quorum is two people who areentitled to vote at that general meeting. They can be shareholders whoare personally present or proxies for shareholders entitled to vote atthat general meeting or a combination of both.
If a quorum is not present within five minutes of the time fixed for ageneral meeting to start or within any longer period not exceeding onehour which the chairman of the meeting can decide, and if the meetingwas called by shareholders, it will be cancelled. Any other meetingwill be adjourned to a day (being not less than 10 days later,excluding the day on which it is adjourned and the day for which it isreconvened), time and place decided upon by the chairman of themeeting. One shareholder present in person or by proxy and entitledto vote will constitute a quorum at any adjourned general meeting.
Record datesEntitlement to attend and vote at the AGM is determined by referenceto the Company’s Register of Members. In order to attend and vote atthe AGM, a member must be entered on the Register of Members orthe register of the Royal Dutch Shell Corporate Nominee no later thanthe record date. The record date will not be more than 48 hoursbefore the meeting, not taking account of any part of a day that is nota working day.
Voting rightsA and B shares have identical voting rights and vote together as asingle class on all matters including the election of directors unless amatter affects the rights of one class as a separate class. If a resolutionaffects the rights attached to either class of shares as a separate class,it must be approved either in writing by shareholders holding at leastthree-quarters of the issued shares of that class by amount, excluding

74 GOVERNANCE
CORPORATE GOVERNANCE SHELL ANNUAL REPORT AND FORM 20-F 2014
CORPORATE GOVERNANCECONTINUED
any shares of that class held as treasury shares, or by specialresolution passed at a separate meeting of the registered holders of therelevant class of shares.
It is the intention that all voting at general meetings will be by way of apoll. A poll is voting by means of a ballot where the number of sharesheld by each voting shareholder is counted, as opposed to voting byway of a show of hands where the actual number of shares held byvoting shareholders is not taken into account. Under the Act, if a poll isdemanded, the resolution conducted on a poll must be approved byholders of at least a majority of the votes cast at the meeting. Specialresolutions require the affirmative vote of at least three-quarters of thevotes cast at the meeting to be approved.
On a poll, every holder of A or B shares present in person or by proxyhas one vote for every share he or she holds. This is subject to anyrights or restrictions which are given to any class of shares inaccordance with the Articles. No shareholder is entitled to vote if he orshe has been served with a restriction order after failure to provide theCompany with information concerning interests in his or her sharesrequired to be provided under Section 793 of the Act.
Major shareholders have no differing voting rights.
Rights in a winding upIf the Company is voluntarily wound up, the liquidator can distribute toshareholders any assets remaining after the liquidator’s fees andexpenses have been paid and all sums due to prior ranking creditors(as defined under the laws of England) have been paid. Under theArticles, the holders of the sterling deferred shares would be entitled(such entitlement ranking in priority to the rights of holders of ordinaryshares) to receive an amount equal to the aggregate of the capitalpaid up or credited as paid up on each sterling deferred share butwould not be entitled to participate further in the profits or assets of theCompany. Any assets remaining after the entitlements of the holders ofsterling deferred shares are satisfied would be distributed to theholders of A and B shares pro rata according to their shareholdings.
Redemption provisionsOrdinary shares are not subject to any redemption provisions.
Sinking fund provisionsOrdinary shares are not subject to any sinking fund provision under theArticles or as a matter of the laws of England.
Liability to further callsNo holder of the Company’s ordinary shares is currently liable to makeadditional contributions of capital in respect of the Company’sordinary shares.
Discriminating provisionsThere are no provisions discriminating against a shareholder becauseof his or her ownership of a particular number of shares.
Variation of rightsThe Act provides that the Articles can be amended by a specialresolution of the Company’s shareholders.
The Articles provide that, if permitted by legislation, the rights attachedto any class of shares can be changed if this is approved either inwriting by shareholders holding at least three-quarters of the issuedshares of that class by amount (excluding any shares of that class heldas treasury shares) or by a special resolution passed at a separatemeeting of the holders of the relevant class of shares. At each such
separate meeting, all of the provisions of the Articles relating toproceedings at a general meeting apply, except that: (i) a quorum willbe present if at least one shareholder who is entitled to vote is presentin person or by proxy who owns at least one-third in amount of theissued shares of the class; (ii) any shareholder who is present in personor by proxy and entitled to vote can demand a poll; and (iii) at anadjourned meeting, one person entitled to vote and who holds sharesof the class, or his or her proxy, will be a quorum. These provisions arenot more restrictive than required by law in England.
Limitations on rights to own sharesThere are no limitations imposed by the Articles or the applicable lawsof England on the rights to own shares, including the right of non-residents or foreign persons to hold or vote the Company’s shares,other than limitations that would generally apply to all shareholders.
CHANGE OF CONTROLThere are no provisions in the Articles or of corporate legislation inEngland that would delay, defer or prevent a change of control.
THRESHOLD FOR DISCLOSURE OF SHARE OWNERSHIPThe Disclosure and Transparency Rules of the UK’s Financial ConductAuthority impose an obligation on persons [A] to notify the Companyof the percentage of voting rights held as a shareholder, or through thedirect or indirect holding of financial instruments, if the percentage ofvoting rights held in the Company reaches, exceeds or falls below 3%or any 1% threshold above 3%.[A] For this purpose “persons” includes companies, natural persons, legal persons andpartnerships.
Section 793 of the Act governs the Company’s right to investigate whohas an interest in its shares. Under that section, a public company canserve a notice on any person it knows or has reasonable cause tobelieve is, or was at any time in the preceding three years, interestedin its shares in order to obtain certain information about that interest.
The Articles provide that in any statutory notice under the relevantlegislation, the Company will ask for details of those who have aninterest and the extent of their interest in a particular holding. TheArticles also provide that when a person receives a statutory notice, hehas 14 days to comply with it. If he does not do so or if he makes astatement in response to the notice which is false or inadequate insome important way, the Company may, on notice, restrict the rightsrelating to the identified shares. The restriction notice will state that theidentified shares no longer give the shareholder any right to attend orvote either personally or by proxy at a shareholders’ meeting or toexercise any right in relation to shareholders’ meetings. Where theidentified shares make up 0.25% or more (in amount or in number) ofthe existing shares of a class at the date of delivery of the restrictionnotice, the restriction notice can also contain the following furtherrestrictions: (i) Directors can withhold any dividend or part of adividend or other money otherwise payable in respect of the identifiedshares without any liability to pay interest when such money is finallypaid to the shareholder; and (ii) Directors can refuse to register atransfer of any of the identified shares which are certificated sharesunless Directors are satisfied that they have been sold outright to anindependent third party. Once a restriction notice has been given,Directors are free to cancel it or exclude any shares from it at any timethey think fit. In addition, they must cancel the restriction notice withinseven days of being satisfied that all information requested in thestatutory notice has been given. Also, where any of the identifiedshares are sold and Directors are satisfied that they were sold outrightto an independent third party, they must cancel the restriction noticewithin seven days of receipt of notification of the sale. The Articles donot restrict in any way the provision of the legislation which applies tofailures to comply with notices under the legislation.

GOVERNANCE 75
SHELL ANNUAL REPORT AND FORM 20-F 2014 CORPORATE GOVERNANCE
The UK City Code on Takeovers and Mergers (the Takeover Code)imposes disclosure obligations on parties subject to the TakeoverCode’s disclosure regime. The Takeover Code requires that anopening position disclosure be made after the commencement of anoffer period and, if later, after the announcement that first identifies anofferor. An opening position disclosure must be made by any personthat is interested in 1% or more of any class of relevant securities of anyparty to the offer. The Takeover Code also requires any person who is,or becomes, interested in 1% or more of any class of relevant securitiesof an offeree company or any securities exchange offeror to make adealing disclosure if the person deals in any relevant securities of theofferee company or any securities exchange offeror during an offerperiod. Where two or more persons act together pursuant to anagreement or understanding, whether formal or informal, to acquire orcontrol an interest in relevant securities, they will normally be deemedto be a single person for the purpose of the relevant provisions of theTakeover Code.
Rule 13d-1 of the US Securities Exchange Act of 1934 requires that aperson or group acquiring beneficial ownership of more than 5% ofequity securities registered under the US Securities Exchange Actdiscloses such information to the SEC within 10 days after theacquisition.
CAPITAL CHANGESThe conditions imposed by the Articles for changes in capital are notmore stringent than those required by the applicable laws of England.
FURTHER INFORMATIONThe following information can be found at www.shell.com/investor:
� the terms of reference of the Audit Committee, Corporate and SocialResponsibility Committee, Nomination and Succession Committeeand Remuneration Committee (these documents explain theCommittees’ roles and the authority the Board delegates to them);
� the full list of matters reserved to the Board for decision;� Shell General Business Principles;� Shell Code of Conduct;� Code of Ethics for Executive Directors and Senior Financial Officers;
and� Articles of Association.
Signed on behalf of the Board
/s/ Michiel Brandjes
Michiel BrandjesCompany SecretaryMarch 11, 2015

76 GOVERNANCE
AUDIT COMMITTEE REPORT SHELL ANNUAL REPORT AND FORM 20-F 2014
AUDIT COMMITTEE REPORTDear Shareholders,
I am pleased to present our annual Audit Committee report, which Itrust will provide you with some useful insights into our work and theissues we considered during the year. In September we welcomedEuleen Goh as the fourth member of our Committee. As the AuditCommittee we assist the Board in fulfilling its oversight responsibilitiesin areas such as the integrity of financial reporting, the effectiveness ofthe risk management and internal control system and relatedgovernance and compliance matters. We are also responsible formaking a recommendation to the Board on the appointment or re-appointment of the external auditor.
During 2014, we held six Committee meetings where we were briefedon and discussed a variety of topics. We also arranged for anadditional session where we reviewed the Downstream price/marginassumptions that formed the basis for the impairment charges followingmanagement’s own review of the refining assets. The Committee alsopaid specific attention to the impairment charges relating to Shell’sNorth American tight-gas and liquids-rich shale properties. Werequested and reviewed the outcomes of Shell’s post-investmentreviews for certain major projects, acquisitions and disposals.
In addition to our usual disclosures on how we have discharged ourresponsibilities during the year, we explain in the report those issueswe considered to be significant in relation to Shell’s 2014Consolidated Financial Statements, and how we addressed them. Wehave advised the Board that the 2014 Annual Report including thefinancial statements, taken as a whole, is fair, balanced andunderstandable, and provides the information necessary forshareholders to assess Shell’s performance, business model andstrategy. We also explain how we arrived at this conclusion.
As indicated in last year’s report, the Company has started a tenderprocess for the appointment of its external auditor. We expect tocomplete the process in mid-2015, with the intention that the successfulfirm be recommended for appointment at the 2016 Annual GeneralMeeting (AGM) in respect of the audit for the 2016 financial year.This will follow new European and UK rules affecting the mandatorytendering of statutory audit services. To assist the Committee inoverseeing the selection process and making a recommendation to theBoard with respect to the appointment of the external auditor for2016, a tender advisory committee has been established, which I amchairing, to monitor the process and participate in engagements withpotential candidates.
The Committee paid close attention to the succession and transitionprocess for certain key staff during the year and also received apresentation on succession planning for Shell’s other key financialpositions.
Finally, we conducted our annual performance evaluation andconcluded that the Committee was effective and able to fulfil its role inaccordance with its terms of reference, which can be found atwww.shell.com/investor.
Guy ElliottChairman of the Audit CommitteeMarch 10, 2015
COMPOSITION OF THE AUDIT COMMITTEEThe current members of the Audit Committee are Guy Elliott (Chairmanof the Committee), Gerard Kleisterlee, Linda G. Stuntz and, as ofSeptember 1, 2014, Euleen Goh, all of whom are financially literate,independent, Non-executive Directors. For the purposes of the Code,Guy Elliott qualifies as a person with “recent and relevant financialexperience” and for the purposes of US securities laws is an “auditcommittee financial expert”. The Committee met six times during theyear; the Committee members’ attendances are shown on page 67.
RESPONSIBILITIESThe key responsibilities of the Committee are to assist the Board infulfilling its oversight responsibilities in relation to: financial reporting;the effectiveness of the system of risk management and internal control;compliance with applicable external legal and regulatoryrequirements; monitoring the qualifications, expertise, resources andindependence of both the internal and external auditors; and assessingeach year the auditors’ performance and effectiveness. The Committeekeeps the Board informed of the Committee’s activities andrecommendations. Where the Committee is not satisfied with, orwherever it considers action or improvement is required concerningany aspect of financial reporting, risk management and internalcontrol, compliance or audit-related activities, it promptly reports theseconcerns to the Board.
ACTIVITIESThe Committee in its meetings covers a variety of topics. These includeboth standing items that the Committee considers as a matter of course,typically in relation to the quarterly results announcements, controlissues, accounting policies and judgements and reporting matters, aswell as a range of specific topics relevant to the overall controlframework of the Company. The Committee invites the Chief ExecutiveOfficer, the Chief Financial Officer, the Legal Director, the ChiefInternal Auditor, the Executive Vice President Controller, the VicePresident Accounting and Reporting and the external auditor to attendeach meeting. Other members of management attend as and whenrequested. At every meeting the Committee holds private sessionsseparately with the external auditor and the Chief Internal Auditorwithout members of management being present.
During 2014, the Committee received comprehensive reports frommanagement and the internal and external auditors. In particular, itdiscussed with the Chief Financial Officer, the Executive Vice PresidentController, the Vice President Accounting and Reporting and theexternal auditor issues that arose on accounting policies, practices andreporting, and reviewed aggregated whistle-blowing reports, internalaudit reports and analyses of financial reporting matters. TheCommittee further assessed the robustness of information and riskmanagement and security measures, including cyber security, anddiscussed the annual report of the Chief Ethics and ComplianceOfficer. The Committee also discussed the Company’s Annual Reportand Accounts, half-year report and quarterly unaudited financialstatements with management and the external auditor, and it reviewedthe Internal Audit Department’s annual audit plan and the performanceassessment of the Internal Audit function. The Committee also requestedreports on such matters that it deemed appropriate, for example,governance of operated and non-operated ventures and regulatory, ITand dealing risks associated with trading activities.
As requested by the Board, the Committee has advised the Board of itsview that the Annual Report including the financial statements for theyear ended December 31, 2014, taken as a whole, is fair, balancedand understandable and provides the information necessary forshareholders to assess Shell’s performance, business model andstrategy (see the “Directors’ Report” on page 63). To arrive at thisconclusion the Committee critically assessed drafts of the Annual Reportincluding the financial statements and discussed with management theprocess undertaken to ensure that it was fair, balanced and
GOVERNANCE 77
SHELL ANNUAL REPORT AND FORM 20-F 2014 AUDIT COMMITTEE REPORT
understandable. This process included: requesting confirmation fromthe owners of each section of the Annual Report that the content of theirrespective section is fair and balanced; ensuring that consistentmateriality thresholds are applied; taking into account comments fromthe external auditor; and receiving affirmation from the ExecutiveCommittee. The Committee further reviewed and considered theDirectors’ half-year and full-year statements with respect to the goingconcern basis of accounting.
SYSTEM OF RISK MANAGEMENT AND INTERNALCONTROLIn 2014, the Committee reviewed and discussed regular reports onrisks, controls and assurance, including the annual assessment of thesystem of risk management and internal control, in order to monitor theeffectiveness of the procedures for internal control over financialreporting. This included the Company’s evaluation of the internalcontrol system as required under Section 404 of the Sarbanes-OxleyAct.
SIGNIFICANT ISSUESThe Committee assessed the following significant accounting andreporting issues that arose in relation to Shell’s 2014 ConsolidatedFinancial Statements. The Committee was satisfied with how each ofthese issues was resolved. As part of this assessment the Committeereceived reports, requested and received clarification frommanagement, and sought assurance and received input from theexternal auditor.
ImpairmentsThe Committee considered management’s review of Downstreamrefining assets and critically assessed the appropriateness of theimpairment charges in the first quarter in respect of assets in Asia andEurope, including the write-off of the carrying amount of the Bukomrefinery in Singapore, and of the impairment charges in the secondquarter in Upstream which were mainly related to tight-gas propertiesin the USA. The Committee focused on the trigger for impairmenttesting and the assumptions used in determining the charges. SeeNotes 3 and 8 to the “Consolidated Financial Statements”.
Following the significant fall in oil and gas prices in the second half of2014, the Committee reviewed further potential short-term impairmentrisks at the year end. It supported management’s conclusion that nofurther impairments were required for the 2014 Consolidated FinancialStatements. This will remain an area of focus for the Committee for2015.
DisposalsThe Committee examined the accounting for assets subject to abinding sales agreement and consequential disposals, includingUpstream assets in Australia, Brazil, Canada, Nigeria, and the USAand Downstream assets in Australia and Italy. Special attention wasgiven to the accounting for any retained obligations, the assumptionsused in determining any resulting charges, and the tax treatment.
Acquisition of Repsol LNG businessesThe Committee reviewed the accounting for the acquisition of Repsol’sLNG businesses outside North America. Areas of judgement which theCommittee considered and queried included fair valuations,recognition of goodwill, related tax issues and required provisions.See Note 29 to the “Consolidated Financial Statements”.
Change in shareholding in WoodsideThe Committee reviewed the accounting impact of the reduction inShell’s shareholding in Woodside Petroleum Limited (Woodside). TheCommittee accepted that Shell continued to have significant influenceover Woodside and should continue to account for the interest as anassociate.
Discount rates for retirement benefit obligationsThe Committee was briefed on the impact of the significant decline indiscount rates on the assumptions used in the measurement of Shell’sretirement benefit obligations at the year end and the consequentialincrease in the net liability during 2014. Assurance on this wasprovided by our external actuaries. See Notes 3 and 17 to the“Consolidated Financial Statements”.
EXTERNAL AUDITORDuring 2014, the Committee evaluated the effectiveness of the externalauditor, PricewaterhouseCoopers LLP (PwC), and the external auditprocess, taking into account the results of Shell management’s internalsurvey relating to the external auditor’s performance as well asmanagement’s review and recommendations and its own experienceswith the external auditor. Key criteria of the evaluation included:professionalism in areas including competence, integrity andobjectivity; efficiency, covering aspects such as service level and costefficiency; thought leadership and value added; and compliance withrelevant legislative, regulatory and professional requirements. PwCappointed a new lead partner in 2014 as his predecessor hadcompleted five years in the role.
Following due consideration, the Committee recommended to theBoard that PwC be reappointed for the year ended December 31,2014. There were no contractual obligations that restricted theCommittee’s ability to make such a recommendation.
As required under UK and US auditing standards, the Committeereceived a letter from the external auditor confirming its independence.
The last competitive audit tender was in 2005 when PwC wasappointed as auditor of the Company. Following the Company’sdecision in 2013 to start the tender process for the appointment of theexternal auditor, a market assessment was carried out in 2014 toidentify suitable, appropriately experienced candidates to participatein the tender. A request for those selected to submit their proposal wassent out towards the end of the year. The tender advisory committee,chaired by the Chairman of the Audit Committee, monitors, providesadvice and reports to the Audit Committee in respect of the tenderprocess, and has engagements with the potential external auditorcandidates. The Audit Committee expects to be in a position to make arecommendation to the Board to enable the Board to decide in mid-2015 which firm it will propose to be appointed as the externalauditor at the 2016 AGM in respect of the 2016 financial year.
NON-AUDIT SERVICESThe Committee has adopted a policy on the engagement of theexternal auditor to supply non-audit services. This policy, designed tosafeguard auditor objectivity and independence, includes guidelineson permitted and non-permitted services, and on services requiringspecific approval by the Committee.
Examples of non-permitted services are actuarial services, bookkeepingservices, valuation services (unless the services are unrelated tofinancial reporting), management or recruitment services, legal servicesand expert services unrelated to the audit, tax advice and broker ordealer, investment adviser or banking services.

78 GOVERNANCE
AUDIT COMMITTEE REPORT SHELL ANNUAL REPORT AND FORM 20-F 2014
AUDIT COMMITTEE REPORTCONTINUED
For other services, because of their knowledge, experience and/or forreasons of confidentiality, it can be more efficient or prudent to engagethe external auditor rather than another party. Under the policy,permitted services must not present a conflict of interest. The Committeereviews quarterly reports from management on the extent of thepermitted non-audit services provided in accordance with the policy orfor which specific approval is being sought. Non-audit services in thefollowing categories can be contracted without further individual priorapproval provided the fee value for each contract does not exceed$500,000:
� tax compliance work that is part of assurance process for the auditof the Consolidated or Parent Company Financial Statements or theaccounts of subsidiaries;
� regulatory compliance audits; and� verification of non-financial data for public disclosure.
Any other non-audit services must be specifically approved by the AuditCommittee before the external auditor is contracted.
The scope of the permitted non-audit services contracted with theexternal auditor in 2014 consisted mainly of tax compliance work andthe associated compensation amounted to 2% of total auditor’sremuneration.
FEESNote 28 to the “Consolidated Financial Statements” provides the detailof the auditor’s remuneration.

GOVERNANCE 79
SHELL ANNUAL REPORT AND FORM 20-F 2014 DIRECTORS’ REMUNERATION REPORT
DIRECTORS’ REMUNERATIONREPORTPrinciplesThe principles underpinning the Remuneration Committee’s (REMCO)approach to executive remuneration remain unchanged. They serve asthe foundation for everything we do, and are listed below.
� Alignment with Shell’s strategy: the Executive Directors’compensation package should be strongly linked to the achievementof stretch targets that are seen as indicators of the execution ofShell’s strategy.
� Pay for performance: the majority of Executive Directors’compensation (excluding benefits and pension) should be linkeddirectly to Shell’s performance through variable pay instruments.
� Competitiveness: remuneration levels should be determined byreference to companies of comparable size, complexity and globalscope.
� Long-term creation of shareholder value: Executive Directors shouldalign their interests with those of shareholders by holding shares inRoyal Dutch Shell plc (the Company).
� Consistency: the remuneration structure for Executive Directors shouldgenerally be consistent with that for the Senior Management of Shell.This consistency builds a culture of alignment with Shell’s purposeand a common approach to sharing in Shell’s success.
� Compliance: decisions should be made in the context of the ShellGeneral Business Principles and REMCO should ensure compliancewith applicable laws and corporate governance requirements whendesigning and implementing policies and plans.
� Risk assessment: the remuneration structures and rewards shouldmeet risk-assessment tests to ensure that shareholder interests aresafeguarded and that inappropriate actions are avoided.
STATEMENT BY THE CHAIRMAN OF THEREMUNERATION COMMITTEE
Dear Shareholders,
As the new REMCO Chairman, I am pleased to present Shell’s 2014Directors’ Remuneration Report. I outline below our performance andremuneration determinations, all of which have been made in thecontext of REMCO’s long-held remuneration principles, noted above,which I endorse.
PERFORMANCE2014 saw successful delivery of our financial, operational excellenceand sustainable development agendas. Cash flow from operationswas ahead of target at $45 billion. There was strong operationalperformance across our businesses. Major projects came on-line asplanned, with four new deep-water start-ups contributing to our cashflow. Liquefied natural gas (LNG) sales and refinery and chemicalplant availability were ahead of target. Our safety record continued toimprove, with total recordable case frequency reduced to below oneinjury per million working hours. REMCO was therefore pleased toapprove an annual bonus scorecard outcome of 1.45.
Shell has improved its competitive position in the oil and gas industrywith strong relative three-year performance in production and cashflow, and median earnings per share (EPS) performance. The three-year total shareholder return (TSR) was disappointing. As a result, the2012 Long-term Incentive Plan (LTIP) award vested below target at84% (or 42% of the maximum) and the Chief Executive Officer’s (CEO)2012 Performance Share Plan (PSP) award (which was granted to himprior to being appointed a Director) vested at 97% (or 49% of themaximum).
DECISIONS MADEAs disclosed in the 2013 Annual Report on Remuneration:
� The base salary and pensionable salary for our CEO, Ben vanBeurden, who succeeded Peter Voser with effect from January 1,2014, was set at €1,400,000.
� Peter Voser stood down from the Board with effect fromDecember 31, 2013. The key elements of his remuneration until hisdeparture from Shell on March 31, 2014, acting as adviser to Benvan Beurden to ensure a stable transition, were also disclosed in the2013 report.
� For LTIP awards from 2014 onwards, the relative hydrocarbonproduction growth performance measure has been replaced byrelative return on average capital employed (ROACE) growth,putting greater focus on capital efficiency.
� The shareholding requirement as a percentage of base salary hasbeen increased: CEO 700% from 300%; Chief Financial Officer(CFO) 400% from 200%.
We received shareholder approval for new share plans at the 2014Annual General Meeting (AGM). The key changes are:
� share plan simplification:� fixed mandatory deferral of 50% of bonus into shares;� removal of matching shares in the Deferred Bonus Plan (DBP),
replacing the value of this in the LTIP; and� pro-rating of outstanding LTIP awards for leavers from annual to
monthly service calculations.
The Executive Directors’ annual bonuses reward the achievement ofinternal key performance indicators (KPIs) described in “Performanceindicators”. The LTIP measures, linked to the strategy outlined in“Strategy and outlook”, are cash and earnings generation and capitaldiscipline as well as the value created for shareholders. The LTIPrewards outperformance relative to our peers.
REMCO has tied Executive Directors’ compensation closely to long-term performance. Further long-term alignment with shareholders isachieved through high shareholding guidelines, an additional two-yearretention period after vesting of the LTIP and compulsory deferral of50% of the annual bonus into shares to be retained for three years.Incentives are subject to malus and clawback provisions.
THIS REPORTThis Directors’ Remuneration Report for 2014 has been prepared inaccordance with relevant UK corporate governance and legalrequirements, in particular Schedule 8 of The Large and Medium-sizedCompanies and Groups (Accounts and Reports) Regulations 2008 (asamended). The Board has approved this report.
This report consists of two further sections:
� the Annual Report on Remuneration, describing 2014 remunerationas well as implementation of the policy in 2015, which will besubject to an advisory vote at the 2015 AGM; and
� the Directors’ Remuneration Policy which was approved byshareholders at the 2014 AGM and is included for reference.
80 GOVERNANCE
DIRECTORS’ REMUNERATION REPORT SHELL ANNUAL REPORT AND FORM 20-F 2014
DIRECTORS’ REMUNERATION REPORTCONTINUED
SHAREHOLDER ENGAGEMENTWe held meetings with a number of shareholders in November andDecember 2014 during which we shared updates on remunerationdevelopments in 2014 and the approved changes for 2015.
IMPACT OF BEN VAN BEURDEN’S PRIOR ASSIGNMENT IN THE UK ANDPROMOTION ON SINGLE TOTAL FIGURE OF REMUNERATIONAs a long-serving, internationally mobile employee, and member of ourDutch defined benefit pension plan, Ben van Beurden’s promotion toCEO and prior assignment in the UK resulted in a significant increasein pension accrual and related tax equalisation. His benefits weremanaged consistently with those of other employees in a workforcebuilt on promotion from within and international mobility, reflecting thelong-term and global nature of Shell’s business. The CEO did notbenefit from any special treatment. If he had been employed in theNetherlands during his previous assignment, there would have been noDutch tax liability on pension accrual in respect of that assignment.
The pension accrual reflects Ben van Beurden’s salary increase onpromotion, at a time when he participated in a final salary pensionplan, along with other Shell employees in the Netherlands who joinedbefore July 2013. As disclosed in last year’s report, Ben van Beurden’sUK assignment prior to his board appointment resulted in a UK taxliability in respect of his pension benefits. For UK tax purposes, theincrease in his pension benefit is assessed over the UK tax year (toApril 5, 2014) and therefore reflects the impact of his salary increaseon promotion. Shell has paid the UK tax on the pension accrual inaccordance with the tax equalisation policy applicable to allexpatriate employees.
CHANGES FOR 2015� There are important changes to our Dutch pension arrangements with
effect from January 1, 2015: from 2015, and consistent with thetreatment for other employees hired before July 2013, the maximumpensionable salary for the CEO will be €89,900. A net pay savingsarrangement has been introduced (employer contribution: 24% ofsalary in excess of €89,900 for the CEO) with the option to take ascash as an alternative to pension contributions (in either case subjectto income tax).
� We are making some changes to our sustainable developmentmeasures in the annual bonus scorecard, with the addition of Tier 1Process Safety events and increased weight of operational spillsvolumes, as explained on page 83. Effective process safetymanagement is fundamental to preventing significant safety andenvironmental incidents and REMCO now wishes to see thisreflected in Executive Director remuneration.
� As announced on October 30, 2014, Charles O. Holliday willbecome Chairman with effect from the conclusion of 2015 AGM,subject to his reappointment as a Director at the AGM. His annualfees following his appointment have been set at €850,000.
As always, I welcome your feedback and look forward to meeting youat our AGM on May 19, 2015.
Gerard KleisterleeChairman of REMCOMarch 11, 2015

GOVERNANCE 81
SHELL ANNUAL REPORT AND FORM 20-F 2014 DIRECTORS’ REMUNERATION REPORT
ANNUAL REPORT ONREMUNERATION
The Annual Report on Remuneration sets out:
� REMCO and its responsibilities and activities;� a summary of our policy in place in 2014, our approved policy,
effective January 1, 2015, and planned implementation in 2015;� the statement of implementation of the approved policy in 2015;
and� Directors’ remuneration for 2014.
The base currency in this Annual Report on Remuneration is the euro,as this is the currency of the base salary and country of employment ofthe Executive Directors. Where amounts are shown in other currencies,an average exchange rate for the relevant year is used, unless aspecific date is stated, in which case the average exchange rate forthe specific date is used.
REMUNERATION COMMITTEEThe following Directors were members of REMCO during 2014:
� Gerard Kleisterlee (Chairman of REMCO with effect from May 21,2014);
� Hans Wijers (Chairman of REMCO until he stood down on May 20,2014);
� Josef Ackermann (stood down on May 20, 2014);� Charles O. Holliday; and� Gerrit Zalm (with effect from May 21, 2014).
Their biographies are given on pages 58-60; REMCO meetingattendance is given on page 67.
REMCO’s key responsibilities in respect of Executive Directors include:
� setting remuneration policy;� agreeing performance frameworks, setting targets and reviewing
performance;� determining actual remuneration and benefits; and� determining contractual terms.
In addition, REMCO has the responsibility for the Chairman of theBoard’s remuneration and for recommending and monitoring the leveland structure of remuneration for Senior Management.
REMCO operates within its terms of reference, which are reviewedregularly and updated whenever necessary. They were last updated onJanuary 28, 2015 and are available at www.shell.com. Alternatively,copies can be obtained from the Company Secretary.
Advice from within Shell on various subjects including the ExecutiveDirectors’ Scorecard and the remuneration of Senior Management wasprovided by:
� Ben van Beurden, CEO;� Hugh Mitchell, Chief Human Resources & Corporate Officer and
Secretary to REMCO; and� Stephanie Boyde, Executive Vice President Remuneration, Benefits &
Services.
The Chairman of the Board and the CEO were consulted onremuneration proposals affecting the CFO.
During 2014, REMCO met four times and its activities included:
� approving the 2013 Directors’ Remuneration Report;� approving the 2014 share plan rules;� consulting with major shareholders in April, November and
December;� setting annual bonus performance measures and targets;� deciding on base salaries for the CEO and the CFO;� determining the 2013 annual bonus outcomes;� vesting of the 2011 LTIP, DBP and PSP awards;� reviewing malus and clawback provisions;� reviewing pension arrangements as a result of regulatory changes in
the Netherlands;� reviewing the implication of the length of service of Simon Henry in
the Netherlands (now treated as a normal Dutch tax resident; taxequalisation of pension);
� reviewing the Chairman’s fees (Charles O. Holliday not beingpresent during this discussion);
� tracking external developments and assessing their impact on Shell’sremuneration policy; and
� reviewing REMCO’s operation.

82 GOVERNANCE
DIRECTORS’ REMUNERATION REPORT SHELL ANNUAL REPORT AND FORM 20-F 2014
REMUNERATION STRUCTUREShort term Medium term Long term
� Base salary.� Annual bonus based on scorecard of short-term
strategic targets and individual achievement.
� 50% of bonus deferred into shares for threeyears.
� LTIP based on relative performance over threeyears. Shares to be retained for two years aftervesting.
� Shareholding requirement for tenure in role.� Bonus and LTIP subject to malus and
clawback provisions.
REMUNERATION POLICY AND PRACTICE AT A GLANCEPolicy that applied in 2014 Summary of the shareholder-approved policy (effective
January 1, 2015). Full policy set out pages 91-98Implementation of the shareholder-approved policy in2015
Base salary and pensionable salary� CEO base salary and pensionable
salary: €1,400,000.� CFO base salary: €1,010,000 (+2.5%);
pensionable salary: £750,000 (+4.2%).
� Reviewed annually after considering a range offactors including market positioning, tenure andexperience, planned increase for otheremployees, Shell’s and individual performance.Maximum: €2,000,000.
� CEO base salary and pensionable salary:€1,430,000 (+2.1%).
� CFO base salary: €1,030,000 (+2.0%);pensionable salary: £765,000 (+2.0%).
BenefitsSingle total figure table impacted by:� UK tax liability that arose in respect of the CEO’s
pension accruals during his assignment in theUK.
� Tax liability that arose in respect of foreignpension contributions as a result of the CFO’slength of service in the Netherlands.
� Typically include car allowance, transport toand from home and office, medical insurance.
� Mobility policies and tax equalisation related toexpatriate employment before Boardappointment, or to offset double taxation, mayalso apply.
� CEO and CFO will receive standard benefits.
Annual bonus and DBP� Target bonus as a % of base salary:
CEO 150%; CFO 120%.� Maximum: CEO 250%; CFO 240%.� Scorecard measures: operational cash flow
(30%); operational excellence (50%); andsustainable development (20%).
� Bonus paid in respect of 2014: CEO 236% ofbase salary, CFO 188% of base salary. 50%mandatory deferral.
� Subject to malus and clawback provisions.
� Target bonus as a % of base salary:CEO 150%; CFO 120%.
� Maximum: CEO 250%; CFO 240%.� Calculated as base salary x target bonus % x
scorecard result (0–2) against short-term strategictargets, adjusted for individual performance witha 0–1.2 multiplier.
� 50% delivered in cash, 50% deferred intoshares and released after three years, togetherwith dividend shares accrued over the deferralperiod.
� Subject to malus and clawback provisions.
� Same bonus opportunity as in 2014. Somechanges to the sustainable developmentmeasure (addition of Tier 1 Process Safetyevents and increased weight of operationalspills volume).
� Mandatory deferral of 50% of bonus.� No longer receive matching shares on
deferred bonus.� Subject to malus and clawback provisions.
LTIP� Award as a % of base salary: CEO 300%; CFO
240%.� Performance measures: TSR (30%), EPS (30%),
ROACE (20%) and net cash from operatingactivities (20%).
� Holding period of two years post vesting.� Vesting of 2012 award: 84% (42% of
maximum). Vesting of 2012 PSP award: 97%(49% of maximum).
� Maximum award: 400% of base salary.Between 0% and 200% of the initial award mayvest depending on relative performance over athree-year period.
� Vesting capped at 50% of the maximum payoutif there is no vesting on the TSR element.
� Additional shares are released representing thevalue of dividends payable on vested shares.
� Vested shares must be held for a further twoyears.
� Subject to malus and clawback provisions.
� Executive Directors no longer receivematching shares on deferred bonuses and thevalue has been moved to the LTIP.
� Therefore awards increased to 340% of basesalary for the CEO and 270% of base salaryfor the CFO.
� Same performance measures as in 2014.� Holding period of two years post vesting.
Pension� CEO: Dutch defined benefit pension plan.
Significant increase in accrual as a result of hispromotion.
� CFO: UK defined benefit plans.
� Retirement benefits maintained in base countrypension arrangements.
� Pensionable base salaries reviewed annually.
� CEO: pension changed from final salary tocapped salary (maximum pensionable salaryfor future defined benefit accruals of€89,900). A net pay savings arrangementhas been introduced (employer contribution:24% of salary in excess of €89,900).
� CFO: No change.
Shareholding requirement� CEO: 300% of base salary; CFO: 200% of
base salary. Actual holding at year end: CEO37% of base salary; CFO 831% of base salary.
� CEO: 700% of base salary; CFO: 400% ofbase salary.
� Expected to be reached through retention ofvested shares, within five years of appointmentand maintained for the full period ofappointment.
� Shareholding requirement increased to:CEO: 700% of base salary; CFO: 400% ofbase salary.
GOVERNANCE 83
SHELL ANNUAL REPORT AND FORM 20-F 2014 DIRECTORS’ REMUNERATION REPORT
STATEMENT OF 2015 POLICY IMPLEMENTATION
Comparator groupThe 2015 key benchmarking comparator group is unchanged from2014 and consists of BP, Chevron, ExxonMobil and Total (“the otheroil majors”) as well as a selection of major Europe-based companies.
2015 EUROPEAN COMPARATOR GROUP
Allianz BHP Billiton Rio TintoAnglo American Deutsche Bank RocheAstraZeneca Diageo SABMillerBarclays GlaxoSmithKline SiemensBayer HSBC UnileverBAT Novartis VodafoneBG Group Philips
SalariesEffective from January 1, 2015, base salaries were set at€1,430,000 (+2.1%) for Ben van Beurden, CEO and €1,030,000(+2.0%) for Simon Henry, CFO.
Pensionable base salaries were set at €1,430,000 (+2.1%) for Benvan Beurden and £765,000 (+2.0%) for Simon Henry.
Annual bonusThe 2015 performance measures are aligned with our KPIs andcomprise:
� operational cash flow (30%);� operational excellence (50%), consisting of: project delivery,
upstream production, liquefied natural gas (LNG) sales, refinery andchemical plant availability; and
� sustainable development (20%). In 2014, 10% of the annual bonusscorecard was based on total recordable case frequency (TRCF).This will be changed for 2015 to 5% TRCF and 5% Tier 1 ProcessSafety events (defined as an unplanned release of any material,including non-toxic and non-flammable materials from a process,resulting in harm to members of the company workforce or aneighbouring community, damage to equipment or exceeding athreshold). A further 10% is based on internal measures (spills,energy intensity and use of fresh water) with changes for 2015 toincrease the weighting of spill volumes and removal of spill numbers,which are covered in the new process safety measure.
Annual bonus scorecard targets are not disclosed prospectivelybecause to do so in a meaningful manner would require the disclosureof commercially sensitive information. As we did for 2013 and 2014,we intend to disclose scorecard targets in a future Directors’Remuneration Report when they are no longer deemed to becommercially sensitive. Retrospective disclosure of detailed personaltargets is inappropriate as these are deemed commercially sensitive.
Long-term incentive awards
LONG-TERM INCENTIVE PLANOn January 30, 2015, a conditional award of performance sharesunder the LTIP was made to the Executive Directors. The award had aface value of 340% of base salary for the CEO and 270% of basesalary for the CFO, resulting in the following shares being awardedconditionally: 180,575 Royal Dutch Shell plc A shares (A shares) toBen van Beurden, and 99,451 Royal Dutch Shell plc B shares (Bshares) to Simon Henry.
For LTIP awards made in 2015, consistent with 2014, performance isassessed over a three-year period based on relative performancecompared with the other oil majors on the following measures andvested shares are subject to a two-year holding period post vesting:
� TSR, calculated in US dollars using a 90-day averaging periodaround the start and end of the performance period (30%);
� diluted EPS growth on a current cost of supplies basis (30%);� net cash growth from operating activities (20%); and� return on average capital employed (ROACE) growth (20%). For this
purpose, in order to facilitate the comparison, the calculation ofROACE differs from that described in “Performance indicators” asthere is no adjustment for after-tax interest expense.
DEFERRED BONUS PLAN50% of the annual bonus awarded will be deferred into shares to beretained for three years.
Malus and clawbackBonus, DBP and LTIP are subject to malus (withholding) and clawback(recovery) provisions and may apply in case of direct responsibility orsupervisory accountability.
Malus applies if Shell restates the relevant year(s’) financial statementsdue to material non-compliance with any financial reportingrequirement; as a result of misconduct or misconduct by an individual,through the individual’s direction or non-direction, which influenced themetrics and outcomes used in determining the individual’s annualbonus or LTIP outcome; any material breach of health and safety orenvironment regulations; serious reputational damage to Shell; materialfailure of risk management; or other exceptional events at the discretionof REMCO.
Malus also applies after employment ends if the individual:(a) breaches any provision of his/her employment contract whichapplies after cessation of employment or any provision of anagreement entered into on termination of employment; (b) is found tohave committed fraud or dishonesty with respect to Shell; (c) wilfullydamaged the assets of or engaged in misconduct which, in anymaterial respect, is or was injurious to Shell; (d) wrongfully disclosed orused any proprietary or confidential information which is related to thebusiness, properties or affairs of Shell and the release of which isdetrimental, in any material respect, to the competitive position orgoodwill of Shell; (e) engaged in any activity which, in any materialrespect, reasonably constituted a conflict with the interests of Shell; or(f) breached any business principle or a term of any code of conductapplicable to employees or former employees of Shell.
Clawback applies in case of restatement of financial statements due tomaterial non-compliance with any financial reporting requirement or asa result of the individual’s misconduct or misconduct through theindividual’s direction or non-direction, which influenced the metrics andoutcomes used in determining his/her annual bonus or LTIP outcome.
PensionThere are important changes to our Netherlands pension arrangementswith effect from January 1, 2015. Consistent with the treatment forother employees, Ben van Beurden’s maximum pensionable salary willbe €89,900. Past service benefits will be fixed in value based onpensionable salary and service as at December 31, 2014. A net paysavings arrangement has been introduced (with employer contributionswhich are age-dependent and for 2015 are 24% of salary in excessof €89,900 for Ben van Beurden) with the option to take cash as analternative to pension contributions (in either case subject to incometax). The estimated annual figure that will be reported in the 2015report is €440,000.

84 GOVERNANCE
DIRECTORS’ REMUNERATION REPORT SHELL ANNUAL REPORT AND FORM 20-F 2014
Non-executive Directors’ fees
NON-EXECUTIVE DIRECTORS’ FEES 2015€ Other fees
Chairman of the Board [A] 850,000 Non-executiveDirectors receivean additional feeof €5,000 for anyBoard meetinginvolvingintercontinentaltravel – exceptfor one meetinga year held in alocation other thanThe Hague.
Non-executive Director 130,000Senior Independent Director 55,000Audit Committee
Chairman [B] 55,000Member 25,000
Corporate and Social ResponsibilityCommitteeChairman [B] 35,000Member 17,250
Nomination and Succession CommitteeChairman [B] 25,000Member 12,000
Remuneration CommitteeChairman [B] 35,000Member 17,250
[A] With effect from the conclusion of the 2015 AGM. Current fee €825,000.[B] The chairman of a committee does not receive an additional fee for membership of thatcommittee.
The Chairman’s fee is determined by REMCO and the annual fee forthe new Chairman, with effect from May 20, 2015, subject to hisreappointment as a Director at the 2015 AGM, has been set at€850,000 (Charles O.Holliday did not attend this discussion).
A Non-executive Director receives a basic fee, and there is anadditional fee(s) for the Senior Independent Director and either aBoard committee chairmanship or Board committee membership foreach committee. Non-executive Directors receive an additional fee of€5,000 for any Board meeting involving intercontinental travel, exceptfor one meeting a year held in a location other than The Hague.Business expenses (including transport between home and office andoccasional business-required spouse travel) and associated tax arepaid or reimbursed by Shell. The Chairman is offered Shell-providedaccommodation in The Hague.
The Board reviews Non-executive Directors’ fees periodically to ensurethat they are aligned with those of other major listed companies. Areview was carried out in 2014, which resulted in an increase in thebasic fee from €125,000 to €130,000 and an increase in the AuditCommittee Chairman fee from €45,000 to €55,000, effectiveJanuary 1, 2015.
Annual fees for 2015 are indicated in the “Non-executive Directors’fees 2015” table.
DIRECTORS’ REMUNERATION FOR 2014
Non-executive Directors’ remuneration for 2014
SINGLE TOTAL FIGURE OF REMUNERATION FOR NON-EXECUTIVE DIRECTORS (AUDITED) € THOUSANDFees Taxable benefits[A] Total
2014 2013 2014 2013 2014 2013Josef Ackermann [B] 60 154 2 2 62 156Guy Elliott 177 170 1 7 178 177Euleen Goh [C] 60 – – – 60 –Charles O. Holliday 207 207 15 19 222 226Gerard Kleisterlee 171 150 – 2 171 152Jorma Ollila [D] 825 825 133 114 958 939Sir Nigel Sheinwald 142 142 – 8 142 150Linda G. Stuntz 180 180 – 19 180 199Hans Wijers 206 227 – 4 206 231Patricia A. Woertz [C] 93 – – – 93 –Gerrit Zalm 153 142 – 4 153 146
[A] UK regulations require the inclusion of benefits where these would be taxable in the UK, on the assumption that Directors are tax resident in the UK. On this premise, the taxable benefitsamounts include the cost of Non-executive Director’s occasional business-required spouse travel. Shell also pays for travel between home and the head office in The Hague, where Board andcommittee meetings are typically held, as well as related hotel and subsistence costs. For consistency, these business expenses are not reported as taxable benefits as for most Non-executiveDirectors this is international travel and hence would not be taxable in the UK.[B] Josef Ackermann stood down on May 20, 2014. No payments for loss of office were made.[C] Euleen Goh was appointed with effect from September 1, 2014. Patricia A. Woertz was appointed with effect from June 1, 2014.[D] The taxable benefits amounts for Jorma Ollila include company-provided transport (2014: €77,430) and the use of an apartment (2014: €47,963).

GOVERNANCE 85
SHELL ANNUAL REPORT AND FORM 20-F 2014 DIRECTORS’ REMUNERATION REPORT
Executive Directors’ remuneration for 2014
SINGLE TOTAL FIGURE OF REMUNERATION FOR EXECUTIVE DIRECTORS (AUDITED) € THOUSANDBen van Beurden Simon Henry
2014 2014 2013Salaries 1,400 1,010 985Taxable benefits 35 32 52Total fixed remuneration 1,435 1,042 1,037Annual bonus [A] 3,300 1,900 900LTIP, DBP and PSP [B] 863 2,857 1,986Total variable remuneration 4,163 4,757 2,886Total direct remuneration 5,598 5,799 3,923Pension [C] 10,695 442 508Tax equalisation [D] 7,905 244 –Total remuneration including pension and tax equalisation 24,198 6,485 4,431
in dollars 32,158 8,619 5,887in sterling 19,510 5,229 3,764
[A] The full value of the bonus, comprising both the non-deferred and deferred value. For 2014, 50% is deferred into the DBP. The market price of A and B shares on January 30, 2015 (€26.93and £21.045 respectively), were used to determine the number of deferred bonus shares, resulting in 61,281 A shares for Ben van Beurden and 33,972 B shares for Simon Henry.[B] Remuneration for performance periods of more than one year, comprising the value of released LTIP awards, DBP performance matching shares and released PSP awards. The amountsreported for 2014 relate to the 2012 awards, which vested on February 17, 2015, at the market price of €28.97 and £22.47 for A and B shares respectively. The value in respect of the LTIP,DBP and PSP is calculated as the product of: the gross number of shares of the original award in the case of the LTIP and PSP, or performance matching shares in the case of the DBP, plus accrueddividend shares; the vesting percentage; and the closing market price of A or B shares at the vesting date. The market price of B shares is converted into euros using the exchange rate on therespective date. The original deferred bonus share awards, which are those represented by the deferred bonus and dividend shares accrued on these shares, are not considered as long-termremuneration, as they relate to the short-term annual bonus value. Only the performance matching shares and dividend shares accrued on those shares are considered as long-term remuneration,since they relate to performance periods of more than one year.[C] The accrual for the period (net of inflation) multiplied by 20 in accordance with UK reporting regulations.[D] For Ben van Beurden, this arose as a result of the impact of his promotion and is related to the increase in pension accrual. For Simon Henry, the amount is in respect of the length of time hehas been resident in the Netherlands and contributing to a foreign pension plan.
Notes to the single total figure of remuneration forExecutive Directors table (audited)
SALARIESAs disclosed in the 2013 Directors’ Remuneration Report, REMCO setBen van Beurden’s base salary and pensionable salary for 2014 at€1,400,000 and, effective from January 1, 2014, Simon Henry’sbase salary at €1,010,000 (+2.5%) and pensionable salary at£750,000 (+4.2%).
TAXABLE BENEFITSExecutive Directors received car allowances or lease cars, transport toand from home and office, occasional business-required spouse travel,as well as employer contributions to life and medical insurance plans.Where appropriate, tax equalisation and relocation support policieswere applied.
ANNUAL BONUSThe business scorecard contains independent business measuresgrouped in three sections: operational cash flow, operationalexcellence and sustainable development. At the start of the year,REMCO sets a target range and weighting for each scorecardmeasure. The actual outcome for each measure results in a score ofbetween zero and two, with a score of one representing “At target”.These scores are multiplied by the respective weighting of eachmeasure and aggregated, resulting in a mathematical scorecardoutcome of between zero and two. REMCO may then make anadjustment to the overall scorecard outcome in view of the widerbusiness performance for the year.
Individual performanceAn Executive Director’s individual performance is also taken intoaccount in determining his annual bonus. Individual performance isassessed against personal targets. Retrospective disclosure of detailedpersonal targets is inappropriate as these are deemed to becommercially sensitive.
Conclusion of the 2014 annual bonusThe mathematical scorecard outcome for 2014 was 1.45 andREMCO approved this outcome, based on strong operational cashflow of $45 billion and delivering a high proportion of flagshipprojects on time and on budget. REMCO was particularly pleased tosee outstanding sustainable development results, including thecontinuing decrease in total recordable case frequency, now belowone injury per million working hours. On this basis, the bonus wouldhave been €3,045,000 for the CEO and €1,757,000 for the CFO.
The CEO took early action on capital discipline, made successfuldivestments, and followed up with a structure of performance unitreviews that has helped to further focus the portfolio. REMCOdetermined an individual performance factor of 1.08 against a rangeof 0-1.2 for the CEO, leading to a final bonus outcome of€3,300,000.
REMCO noted the CFO’s personal contribution in driving strong cashflow performance, with a strengthened capital management process, asolid balance sheet and finance and IT cost containment across ourbusinesses, and determined an individual performance factor of1.08 against a range of 0-1.2 for the CFO, leading to a final bonusoutcome of €1,900,000.

86 GOVERNANCE
DIRECTORS’ REMUNERATION REPORT SHELL ANNUAL REPORT AND FORM 20-F 2014
ANNUAL REPORT ON REMUNERATIONCONTINUED
2014 ANNUAL BONUS OUTCOME (AUDITED)Bonus as a % of base salary
MeasuresWeight
(% of scorecard)Target
setResult
achieved Score (0-2)Ben van Beurden Simon Henry
Target Achieved Target AchievedOperational cash flow ($ billion) [A] 30% 43.0 45.1 1.34 45% 60% 36% 48%Operational excellence 50% 1.40 75% 105% 60% 84%Project delivery: identified projects on time and budget (%) 20% 75% 83% 1.40Production (kboe/d) 12% 3,079 3,080 1.02LNG sales (mtpa) 6% 23.0 24.0 2.00Refinery and chemical plant availability (%) 12% 91.1 92.1 1.49Sustainable development 20% 1.75 30% 53% 24% 42%Total recordable case frequency (incidents/million hours) 10% 1.22 0.99 1.77Targeted internal measures (score 0-2) [B] 10% 1.0 1.74 1.74
100% 150% 120%Mathematical scorecard outcome 1.45Final 2014 bonus [C] € (% of base salary) 3,300,000 (236%) 1,900,000 (188%)
[A] Excluding tax on divestments.[B] Spills, energy intensity and use of fresh water.[C] Annual bonus = (base salary x target bonus % x scorecard result), adjusted for individual performance by a factor of 1.08.
LONG-TERM INCENTIVE PLANIn 2012, Simon Henry was granted a conditional award ofperformance shares under the LTIP. This award was based on 240% ofbase salary, with a maximum vesting of 480%. The terms of this 2012LTIP award are the same as those applying to the 2014 LTIP awards,other than hydrocarbon production growth being a relativeperformance measure in the 2012 award, replaced by ROACEgrowth in the 2014 award.
At the end of the performance period (January 1, 2012 toDecember 31, 2014), Shell was ranked fourth among its peer groupin terms of TSR (30% weight), third in terms of diluted EPS growth on acurrent cost of supplies basis (30% weight), second in terms ofhydrocarbon production growth (20% weight) and second in terms ofgrowth in net cash from operating activities (20% weight). REMCOalso considered the underlying financial performance of Shell anddecided to vest 84% of shares under the LTIP, without applying anydiscretionary adjustment, resulting in 80,645 B shares for SimonHenry. At vesting, these shares (including accrued dividend shares)had a value of €2,450,131. The vested shares from the LTIP aresubject to a further two-year holding period.
DEFERRED BONUS PLANSimon Henry was granted performance matching shares under theDBP. The performance period was January 1, 2012 to December 31,2014. Given that the performance condition of the DBP is the same asfor the 2012 LTIP, REMCO decided to vest 84% of the performancematching shares under the DBP, without applying any discretionaryadjustment, resulting in 13,405 B shares for Simon Henry. At vesting,these shares (including accrued dividend shares) had a value of€407,261.
PERFORMANCE SHARE PLANSelected employees participate in the Performance Share Plan (PSP).The operation of the PSP is similar to the LTIP, but differs, for example,in some performance measures and their relative weightings. In 2012,prior to his appointment to the Board, Ben van Beurden was granted aconditional award under the PSP. At the end of the performanceperiod, which was from January 1, 2012,to December 31, 2014, 97% vested, resulting in 29,801 A shares forBen van Beurden. At vesting, these shares (including accrued dividendshares) had a value of €863,186.
PENSION AND RELATED TAX EQUALISATIONThe 2014 single total figure of remuneration includes twopension-related amounts:
� Pension: UK regulations require the inclusion of a pension value,which, for defined benefit pension plans, is the inflation-adjusteddifference between the pension benefit at the beginning and end ofthe year multiplied by 20. As a result of Ben van Beurden’spromotion to CEO, his pension benefit under the Dutch definedbenefit plan increased in value in 2014. The required UKmethodology overstates the pension value notably because of theretirement age of 67.
� Tax equalisation: as mentioned in the 2013 report, as a result of hispromotion, a UK tax charge arose in respect of pension accrualsduring Ben van Beurden’s assignment in the UK and this is settled byShell under its tax equalisation policy for expatriate staff. This is ourstandard mobility policy and the CEO did not benefit from anyspecial treatment. Mobility is a key element of our remunerationstrategy as we need to be able to move executives and key talentacross regions. Internal promotion is an important part of ourresourcing strategy given the long-term nature and breadth of Shell’sbusiness.

GOVERNANCE 87
SHELL ANNUAL REPORT AND FORM 20-F 2014 DIRECTORS’ REMUNERATION REPORT
SCHEME INTERESTS AWARDED
SCHEME INTERESTS AWARDED TO EXECUTIVE DIRECTORS IN 2014 (AUDITED) €
Potential amount vesting
Scheme interest typeType ofinterest awarded
End ofperformanceperiod Target award[A]
Minimumperformance(% of shares
awarded)[B]Maximum performance
(% of shares of the target award[A][C])LTIP Performance
sharesDecember 31,2016
Ben van Beurden: 163,998 Ashares, equivalent to 3 x basesalary or €4,200,000.Simon Henry: 89,648 B shares,equivalent to 2.4 x base salary or€2,424,000.
0% Maximum number of shares vestingis 200% of the number of sharesawarded, equivalent to€8,400,000 for Ben van Beurdenand €4,848,000 for Simon Henry.
DBP Performancematchingshares
December 31,2016
25% of 2013 annual bonus[D],which is €159,500 (6,228A shares) for Ben van Beurden and€225,000 (8,321 B shares) forSimon Henry.
0% Maximum number of shares vestingis 200% of the number of sharesawarded, equivalent to €319,000for Ben van Beurden and€450,000 for Simon Henry.
[A] Awards based on a market price at January 31, 2014 (close of the award date), for A and B shares of €25.61 and £22.25 respectively.[B] Minimum performance relates to the lowest level of achievement, for which no reward is given.[C] The equivalent values exclude share price movements and accrued dividend shares.[D] Ben van Beurden (prior to being appointed a Director) and Simon Henry elected to defer 50% of their 2013 bonus into DBP shares, half of which is matchable with additional performancematching shares. This results in performance matching shares with a value of 25% of their 2013 bonus.
To determine the appropriate award, REMCO considers the awardvalue to be a market competitive reward for medium- to long-termoutperformance of the business relative to the other oil majors onmeasures considered key indicators of the delivery of the strategy in themedium to long term.
The measures and weightings applying to both LTIP and DBP awardsfor 2014 are: TSR growth (30%); diluted EPS growth on a current costof supplies basis (30%); hydrocarbon production growth (20%); andnet cash growth from operating activities (20%).
VESTINGThe LTIP and DBP performance matching shares vest on the basis of therelative performance rankings as indicated in the table below.
RELATIVE PERFORMANCE RANKINGS
Shell’s rank against peers on eachof the four performance measures
Number of conditional performance sharesultimately awarded, taking into account theweightings of the four performance measures
1st 2 x initial LTIP award2 x half of the deferred bonus shares
2nd 1.5 x initial LTIP award1.5 x half of the deferred bonus shares
3rd 0.8 x initial LTIP award0.8 x half of the deferred bonus shares
4th or 5th Nil
If the TSR ranking is fourth or fifth, the level of the award that can vest on thebasis of the three other measures will be capped at 50% of the maximum.
REMCO retains discretion to adjust the calculated vesting outcome if itbelieves that this is distorted by circumstances which are unrelated toperformance, for example, reporting changes, ranking clustering,mathematical anomalies or corporate events in the comparator group.REMCO will consider using discretion to ensure that remunerationappropriately reflects Shell’s performance and may adjust the finalvesting outcome of the LTIP (and, therefore, DBP).
“At target” performance is equivalent to ranking positions which would, inline with the vesting schedule and TSR underpin, lead to a total of 100%vesting of the initial LTIP award and release of 100% of the DBPperformance matching shares. At maximum performance, 200% of thenumber of LTIP and DBP performance matching shares awarded will vest.
To deliver the shares under the LTIP and DBP, market-purchased sharesare used rather than the issuing of new shares.
STATEMENT OF DIRECTORS’ SHAREHOLDING ANDSHARE INTERESTS (AUDITED)REMCO believes that Executive Directors should align their interestswith those of shareholders by holding shares in the Company. In abusiness where it can take many years to reach a final investmentdecision on a project, and many further years of development before afacility comes on-stream, long-term shareholding properly alignsinterests of Executive Directors with those of shareholders.
Shareholding guidelinesUnder the policy effective from January 1, 2015, the CEO is expectedto build a shareholding with a value of 700% of base salary, andother Executive Directors 400% of base salary. Only unfettered sharescount. The bonus deferred into shares under the DBP (net of tax) andthe vested LTIP (subject to holding requirements) count towards theguidelines. Ben van Beurden has not yet met the required shareholdinglevel. Simon Henry has done so. There are no shareholding guidelinesfor Non-executive Directors.
Directors’ share interestsThe interests (in shares of the Company or calculated equivalents) ofthe Directors in office during the year, including any interests of theirconnected persons, are set out in the “Directors’ share interests” tableon the next page.
There were no changes in Directors’ share interests during the periodfrom December 31, 2014, to March 11, 2015, except in the case ofBen van Beurden whose interests increased by 14,304 A shares andSimon Henry whose interests increased by 62,586 B shares, resultingfrom the release of the 2012 PSP award, and the 2012 LTIP and DBPawards respectively, which vested on February 17, 2015, and GuyElliott whose interests increased by 100 B shares.

88 GOVERNANCE
DIRECTORS’ REMUNERATION REPORT SHELL ANNUAL REPORT AND FORM 20-F 2014
ANNUAL REPORT ON REMUNERATIONCONTINUED
As at March 11, 2015, the Directors and Senior Management(pages 58-61) of the Company beneficially owned individually and inaggregate (including shares under option) less than 1% of the totalshares of each class of the Company shares outstanding.
Directors’ scheme interestsThe table below shows the aggregate position for Directors’ interestsunder share schemes at December 31. For Ben van Beurden, these relateto awards made to him prior to being appointed a Director. These are Ashares for Ben van Beurden and B shares for Simon Henry. During theperiod from December 31, 2014, to March 11, 2015, scheme interestshave changed as a result of the vesting of the 2012 LTIP, DBP and PSPawards on February 17, 2015, and the 2015 LTIP and DBP awardsmade on January 30, 2015, as described on pages 86 and 83respectively.
DIRECTORS’ SCHEME INTERESTS (AUDITED)Share plan interests[A]
LTIP subject toperformance
conditions [B]
DBP not subject toperformance
conditions[C]
DBP subject toperformance
conditions[D]
PSP subject toperformance
conditions [E] Total2014 2013 2014 2013 2014 2013 2014 2013 2014 2013
Ben van Beurden 216,062 – 13,087 – 6,544 – 30,289 28,828 265,982 28,828Simon Henry 288,957 283,222 80,734 95,366 40,367 47,683 – – 410,058 426,271
[A] Includes unvested long-term incentive awards and notional dividend shares accrued at December 31. Interests are shown on the basis of the original awards. The shares subject to performanceconditions can vest at between 0% and 200%. Dividend shares accumulate each year on an assumed notional LTIP/DBP award. Such dividend shares are disclosed and recorded on the basis ofthe number of shares conditionally awarded but, when an award vests, dividend shares will be awarded only in relation to vested shares as if the vested shares were held from the award date.Shares released during the year are included in the “Directors’ share interests” table.[B] Total number of unvested LTIP shares at December 31, including dividend shares accrued on the original LTIP award.[C] The number of shares deferred from the bonus (original DBP award) and the dividend shares accrued on these at December 31, 2014. Delivery of the original DBP award and the relatedaccrued dividend shares is not subject to performance conditions.[D] The target number of performance matching shares, which correspond to the original DBP award. In accordance with the operation of the DBP, half of the shares from the bonus deferral arematchable with performance matching shares. The actual number of performance matching shares will be determined at vesting on the same basis as the LTIP vesting.[E] Total number of unvested PSP shares at December 31, including dividend shares accrued on the original award.
EXECUTIVE DIRECTORS’ SHAREHOLDING (AUDITED)
2014 shareholdingguideline (% of base salary)[A]
Value of shares countingtowards guideline (% of base
as at December 2014)[B]Ben van Beurden 300% 37%Simon Henry 200% 831%
[A] Increased in 2015 to 700% for Ben van Beurden and 400% for Simon Henry.[B] Representing the value of Directors’ share interests and the estimated after-tax value of DBPshares (not subject to performance conditions).
DIRECTORS’ SHARE INTERESTS [A] (AUDITED)January 1, 2014 December 31, 2014
A shares B shares A shares B sharesJosef Ackermann 10,523 – 10,523[B] –Ben van Beurden – – 12,289 –Guy Elliott – 5,677 – 5,677Euleen Goh – – – –Simon Henry 9,175 231,471 9,175 245,644Charles O. Holliday – 20,000[C] – 30,000[C]Gerard Kleisterlee 5,000 – 5,000 –Jorma Ollila 25,000 – 25,000 –Sir Nigel Sheinwald – 470 – 1,000Linda G. Stuntz – 8,400[D] – 8,400[D]Hans Wijers 5,251 – 5,251 –Patricia A. Woertz – –[E] – 6,000[F]Gerrit Zalm 2,026 – 2,026 –
[A] Includes vested LTIP awards subject to holding conditions. Excludes unvested interests inshares awarded under the LTIP, DBP and PSP.[B] Interests at May 20, 2014, when he stood down as a Director.[C] Held as 10,000 ADSs (RDS.B ADS) at January 1, 2014, and as 15,000 ADSs (RDS.BADS) at December 31, 2014. Each RDS.B ADS represents two B shares.[D] Held as 4,200 ADSs (RDS.B ADS). Each RDS.B ADS represents two B shares.[E] At the date of appointment.[F] Held as 3,000 ADSs (RDS.B ADS). Each RDS.B ADS represents two B shares.
TSR PERFORMANCE AND CEO PAY
Performance graphsThe graphs below compare the TSR performance of the Company overthe past six financial years with that of the companies comprising theEuronext 100 and the FTSE 100 share indices.
The Board regards the Euronext 100 and the FTSE 100 share indicesas appropriate broad market equity indices for comparison, as theyare the leading market indices in the Company’s home markets.
Dec-08
Valu
e of
hyp
othe
tical
10
0 ho
ldin
g
Dec-09 Dec-10 Dec-11 Dec-12 Dec-14Dec-13
HISTORICAL TSR PERFORMANCE (RDSA)growth in the value of a hypothetical 100 holding over six yearsEuronext 100 comparison based on 30 trading day average values
Euronext 100 RDSA
175
150
125
100
75
50
25
200
0

GOVERNANCE 89
SHELL ANNUAL REPORT AND FORM 20-F 2014 DIRECTORS’ REMUNERATION REPORT
£175
£150
£125
£100
£75
Valu
e of
hyp
othe
tical
£10
0 ho
ldin
gHISTORICAL TSR PERFORMANCE (RDSB)growth in the value of a hypothetical £100 holding over six yearsFTSE 100 comparison based on 30 trading day average values
£50
£25
£200
£0
FTSE 100 RDSB
Dec-08 Dec-09 Dec-10 Dec-11 Dec-12 Dec-13 Dec-14
CEO pay outcomesThe following table sets out the single total figure of remuneration, andthe annual bonus payout and long-term incentive (LTI) vesting ratescompared with the respective maximum opportunity, for the CEO forthe last six years.
CEO PAY OUTCOMES
Year CEO
Single totalfigure of
remuneration(€000)
Annualbonus
payoutagainst
maximumopportunity
LTI vestingrates
againstmaximum
opportunity2014 Ben van Beurden 24,198 94% 49%2013 Peter Voser 8,456 44% 30%2012 Peter Voser 18,246 83% 88%2011 Peter Voser 9,941 90% 30%2010 Peter Voser 10,611 100% 75%2009 Peter Voser 6,228 50% 0%2009 Jeroen van der Veer 3,748 66% 0%
Peter Voser stood down on December 31, 2013, and was succeededby Ben van Beurden. Jeroen van der Veer stood down on July 1,2009, and Peter Voser took over from that date. Only remunerationrelating to their position as CEO is included for 2009.
CHANGE IN REMUNERATION OF CEO ANDEMPLOYEES FROM 2013 TO 2014Ben van Beurden became CEO on January 1, 2014. There is thereforeno relevant comparative data for him for 2013. As a reminder, for2013, Peter Voser received a base salary of €1,640,000 and abonus of €1,800,000.
The CEO data compares the remuneration of Ben van Beurden for2014 with that of Peter Voser for 2013 and excludes taxable benefitsas these depend on individual circumstances. The comparator groupconsists of local employees in the Netherlands, the UK and the USA.This is considered to be a suitable employee comparator group,because:
� these are countries with a significant Shell employee base;� a large proportion of senior managers come from these countries;
and
� REMCO considers remuneration levels in these countries whensetting base salaries for Executive Directors.
Taxable benefits are those that align with the definition of taxablebenefits applying in the respective country. In line with the “Single totalfigure of remuneration for Executive Directors” table, the annual bonusis included in the year in respect of which it was earned.
CHANGE IN REMUNERATION OF CEO ANDEMPLOYEES
CEO[A] Employees
Salaries -15% 4%Taxable benefits N/A 10%[B]Annual bonus 83% 120%
[A] Data for the CEO reflects data for Ben van Beurden in 2014 and Peter Voser in 2013.[B] Mainly arising from an increase in US healthcare premiums.
RELATIVE IMPORTANCE OF SPEND ON PAYDistributions to shareholders by way of dividends and share buybacksand remuneration paid to or receivable by employees for the last fiveyears are set out below, together with annual percentage changes.
RELATIVE IMPORTANCE OF SPEND ON PAYDividends and share buybacks[A] Spend on pay (all employees)[B]
Year $ billion Annual change $ billion Annual change2014 14.6 -14% 16.4 0%2013 17.1 35% 16.4 9%2012 12.7 9% 15.1 3%2011 11.6 14% 14.6 4%2010 10.2 -3% 14.1 -4%
[A] Dividends paid, which includes the dividends settled in shares via our Scrip DividendProgramme, and repurchases of shares as reported in the “Consolidated Statement of Changesin Equity”.[B] Employee expense as reported in Note 26 to the “Consolidated Financial Statements”.
Spend on pay can be compared with the major costs associated withgenerating income by referring to the “Consolidated Statement ofIncome”. Over the last five years, the average spend on pay was 4%of the major costs of generating income. These costs are considered tobe the sum of: purchases; production and manufacturing expenses;selling, distribution and administrative expenses; research anddevelopment; exploration; and depreciation, depletion andamortisation.
PAYMENTS TO PAST DIRECTORS (AUDITED)Peter Voser repatriated to his base country, Switzerland, onDecember 31, 2013, and was employed by Shell Switzerland AGuntil his departure from Shell on March 31, 2014. For this period, hereceived a base salary of Swiss francs 635,000 and annual bonus (asdetermined by REMCO) of €615,000 (Swiss francs 749,298).
On February 17, 2015, Peter Voser’s and Malcolm Brinded’s 2012LTIP and DBP awards vested at 84%. The value at vesting of the LTIPshares was €5,059,432 for Peter Voser and €1,042,608 forMalcolm Brinded, following prorating, and the value at vesting of theperformance matching DBP shares was €922,293 for Peter Voser and€543,024 for Malcolm Brinded.
Jeroen van der Veer and Peter Voser exercised their remaining shareoptions in 2014.
Payments below €5,000 are not reported as they are considered deminimis below this level.
90 GOVERNANCE
DIRECTORS’ REMUNERATION REPORT SHELL ANNUAL REPORT AND FORM 20-F 2014
ANNUAL REPORT ON REMUNERATIONCONTINUED
TOTAL PENSION ENTITLEMENTS (AUDITED)During 2014, Ben van Beurden and Simon Henry accrued retirementbenefits under defined benefit plans. The pension accrued under theseplans at December 31, 2014, is set out below.
ACCRUED PENSION (AUDITED) THOUSANDLocal € $
Ben van Beurden €1,160 €1,160 $1,411Simon Henry £449 €575 $699
The age at which Ben van Beurden and Simon Henry can receive anypension benefit without actuarial reduction is 67 and 60 respectively.Any benefits on early retirement are reduced using actuarial factors toreflect early payment. No payments were made in 2014 regardingearly retirement or in lieu of retirement benefits.
Ben van BeurdenBen van Beurden is a member of the “Stichting Shell Pensioen Fonds”,the pension plan for Shell employees in the Netherlands who joinedbefore July 2013 that provides benefits in defined benefit form.Important changes to pension arrangements with effect from January 1,2015 are explained on page 83. As a result of these changes, Benvan Beurden has also joined the Shell net pension plan in theNetherlands with effect from January 1, 2015.
Simon HenrySimon Henry is a member of the Shell Overseas Contributory PensionFund (SOCPF) and the Shell Contributory Pension Fund (SCPF), withboth funded pension plans providing benefits in defined benefit form.The SOCPF provides benefits in respect of his periods of employmentoutside the UK, while the SCPF provides benefits in respect of hisperiods of employment in the UK. Simon Henry has elected to have hisbenefits from the SCPF restricted to the UK lifetime allowance with anyexcess provided from an unfunded arrangement, the ShellSupplementary Pension Plan.
EXTERNAL APPOINTMENTSThe Board considers external appointments to be valuable inbroadening Executive Directors’ knowledge and experience. Thenumber of outside directorships is generally limited to one. The Boardmust explicitly approve such appointments. Executive Directors areallowed to retain any cash or share-based compensation they receivefrom such external board directorships.
Simon Henry was appointed a Non-executive Director of LloydsBanking Group plc with effect from June 2014. His fee in 2014 was£53,750.
STATEMENT OF VOTING AT 2014 AGMThe Company’s 2014 AGM was held on May 20, 2014, in theNetherlands. The results of the polls in respect of Directors’remuneration were as follows:
APPROVAL OF DIRECTORS’ REMUNERATION POLICYVotes Number PercentageFor 3,167,299,751 92.90%Against 242,225,203 7.10%Total cast 3,409,524,954[A] 100.00%Withheld [B] 63,756,314
[A] Representing 53.47% of issued share capital.[B] A vote “withheld” is not a vote under English law and is not counted in the calculation ofthe proportion of the votes “for” and “against” a resolution.
APPROVAL OF DIRECTORS’ REMUNERATION REPORTVotes Number PercentageFor 3,083,923,360 93.31%Against 221,282,479 6.69%Total cast 3,305,205,839[A] 100.00%Withheld [B] 168,075,428
[A] Representing 51.84% of issued share capital.[B] A vote “withheld” is not a vote under English law and is not counted in the calculation ofthe proportion of the votes “for” and “against” a resolution.
Although there is no requirement to disclose the outcome of voting onshare plans, the LTIP was approved with 92.68% of votes in favourand the DBP with 98.29% in favour. Full details of voting on shareplans is disclosed in the AGM section of our website: www.shell.com.
DILUTIONIn any 10-year period, not more than 5% of the issued Ordinary sharecapital of the Company may be issued or issuable under executive(discretionary) share plans adopted by the Company. To date, noshareholder dilution has resulted from these plans, although it ispermitted under the rules of the plans subject to these limits.
DIRECTORS’ CONTRACTS AND LETTERS OFAPPOINTMENTExecutive Directors have employment contracts for an indefinite period.Non-executive Directors, including the Chairman, do not have anemployment contract but letters of appointment. Details of ExecutiveDirectors’ employment contracts can be found in the Directors’Remuneration Policy on page 97. Further details of Non-executiveDirector terms of appointment can be found in the “Directors’ Report”on page 63 and the “Corporate governance” report on page 66.
COMPENSATION OF DIRECTORS AND SENIORMANAGEMENTDuring the year ended December 31, 2014, Shell paid and/oraccrued compensation totalling $71 million (2013: $58 million) toDirectors and Senior Management for services in all capacities whileserving as a Director or member of Senior Management, including $4million (2013: $5 million) accrued to provide pension, retirement andsimilar benefits. The total includes costs incurred in respect ofadditional employee levies in the Netherlands and termination andrelated amounts. The amounts stated are those recognised in Shell’sincome on an IFRS basis. Personal loans or guarantees were notprovided to Directors or Senior Management. See Note 27 to the“Consolidated Financial Statements”.
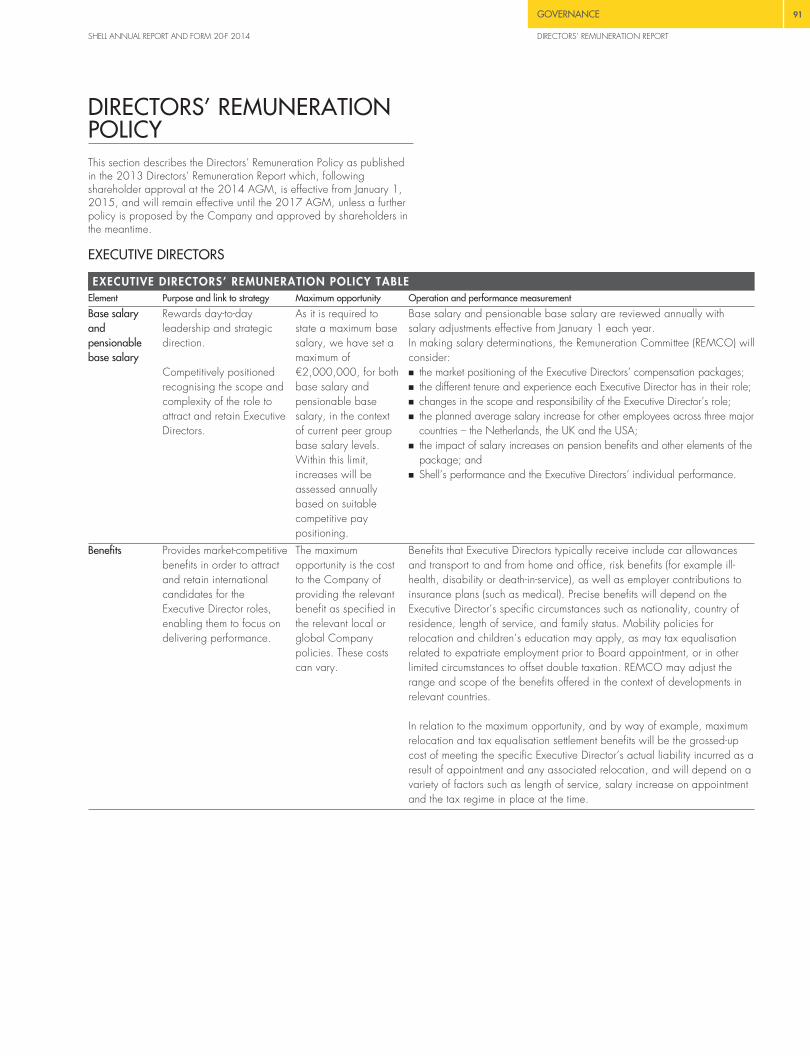
GOVERNANCE 91
SHELL ANNUAL REPORT AND FORM 20-F 2014 DIRECTORS’ REMUNERATION REPORT
DIRECTORS’ REMUNERATIONPOLICYThis section describes the Directors’ Remuneration Policy as publishedin the 2013 Directors’ Remuneration Report which, followingshareholder approval at the 2014 AGM, is effective from January 1,2015, and will remain effective until the 2017 AGM, unless a furtherpolicy is proposed by the Company and approved by shareholders inthe meantime.
EXECUTIVE DIRECTORS
EXECUTIVE DIRECTORS’ REMUNERATION POLICY TABLEElement Purpose and link to strategy Maximum opportunity Operation and performance measurement
Base salaryandpensionablebase salary
Rewards day-to-dayleadership and strategicdirection.
Competitively positionedrecognising the scope andcomplexity of the role toattract and retain ExecutiveDirectors.
As it is required tostate a maximum basesalary, we have set amaximum of€2,000,000, for bothbase salary andpensionable basesalary, in the contextof current peer groupbase salary levels.Within this limit,increases will beassessed annuallybased on suitablecompetitive paypositioning.
Base salary and pensionable base salary are reviewed annually withsalary adjustments effective from January 1 each year.In making salary determinations, the Remuneration Committee (REMCO) willconsider:� the market positioning of the Executive Directors’ compensation packages;� the different tenure and experience each Executive Director has in their role;� changes in the scope and responsibility of the Executive Director’s role;� the planned average salary increase for other employees across three major
countries – the Netherlands, the UK and the USA;� the impact of salary increases on pension benefits and other elements of the
package; and� Shell’s performance and the Executive Directors’ individual performance.
Benefits Provides market-competitivebenefits in order to attractand retain internationalcandidates for theExecutive Director roles,enabling them to focus ondelivering performance.
The maximumopportunity is the costto the Company ofproviding the relevantbenefit as specified inthe relevant local orglobal Companypolicies. These costscan vary.
Benefits that Executive Directors typically receive include car allowancesand transport to and from home and office, risk benefits (for example ill-health, disability or death-in-service), as well as employer contributions toinsurance plans (such as medical). Precise benefits will depend on theExecutive Director’s specific circumstances such as nationality, country ofresidence, length of service, and family status. Mobility policies forrelocation and children’s education may apply, as may tax equalisationrelated to expatriate employment prior to Board appointment, or in otherlimited circumstances to offset double taxation. REMCO may adjust therange and scope of the benefits offered in the context of developments inrelevant countries.
In relation to the maximum opportunity, and by way of example, maximumrelocation and tax equalisation settlement benefits will be the grossed-upcost of meeting the specific Executive Director’s actual liability incurred as aresult of appointment and any associated relocation, and will depend on avariety of factors such as length of service, salary increase on appointmentand the tax regime in place at the time.

92 GOVERNANCE
DIRECTORS’ REMUNERATION REPORT SHELL ANNUAL REPORT AND FORM 20-F 2014
DIRECTORS’ REMUNERATION POLICYCONTINUED
EXECUTIVE DIRECTORS’ REMUNERATION POLICY TABLE (CONTINUED)Element Purpose and link to strategy Maximum opportunity Operation and performance measurement
Annual bonusand DeferredBonus Plan(DBP)
Rewards performanceagainst a scorecard ofshort-term strategic targetsand individualachievement.
To reinforce alignment withshareholder interests, 50%is deferred and the other50% is delivered in cash.The deferred bonus isreleased in the form ofshares after a deferralperiod of three years, aswell as dividend sharesaccrued over the deferralperiod. Apart fromdividend shares, noadditional DBP shares areawarded.
Target levels (as apercentage of basesalary):� Chief Executive
Officer: 150%� Other Executive
Directors: 120%
Maximum bonus (as apercentage of basesalary):� Chief Executive
Officer: 250%� Other Executive
Directors: 240%
� The bonus is determined by reference to performance from January 1 toDecember 31 each year.
� Annual bonus = base salary x target bonus % x scorecard result (0–2);adjusted for individual performance with a 0–1.2 multiplier.
� Taking the Shell Business Plan into consideration, each year the Boardagrees the scorecard targets and weightings which support the delivery ofthe strategy. Measures are related to financial performance, operationalexcellence and sustainable development. Indicative weightings are 30%,50% and 20% respectively. REMCO retains the ability to adjustperformance measure targets and weightings year by year within the overalltarget and maximum payouts approved in the policy. Additionally,stretching individual targets are set.
� Scorecard targets will be disclosed retrospectively, with the timing of anydisclosure dependent on the commercial sensitivity of the target.
� Individual performance is reflected by adjusting the bonus outcome.Upward adjustment is capped at 20% and subject to the overall maximumbonus cap. There is no limit to downward adjustment.
� For the portion of the bonus deferred into shares, additional shares may bereleased representing the value of dividends payable on the vested shares,as if these had been owned from award date (“dividend shares”).
� The annual bonus and DBP have malus and clawback provisions.� There are no prescribed thresholds or minimum levels of performance that
equate to a prescribed payment under the policy and this structure can resultin no bonus payment being made.
Long-termIncentive Plan(LTIP)
Rewards medium- to long-term outperformance of thebusiness relative to otheroil majors on measureswhich are selectedbecause they are seen askey outcomes of thedelivery of the strategy.
Awards may be madeup to a value of 400%of base salary.
Awards may vest at upto 200% of the sharesoriginally awarded,plus dividends.
� Award levels are determined annually by REMCO and are set within themaximum approved in the policy.
� Awards may vest on the basis described in the notes below, between 0%and 200% of the initial award level depending on Shell’s performanceagainst a comparator group.
� Although it is possible for no LTIP shares to vest, on current measures andweightings, 16% of the initial LTIP award would vest if there was a positivevesting outcome in respect of the lowest-weighted measure.
� Performance is assessed over a three-year period based on relative growthof the following: total shareholder return (TSR)(30%), earnings per share(EPS) on a current cost of supplies basis (30%), return on average capitalemployed (ROACE)(20%) and net cash from operating activities (20%).Each measure can vest independently, but if the TSR measure does not resultin vesting, then the total vesting level will be capped at 50% of themaximum payout.
� REMCO may adjust or change the LTIP measures, targets and weightings toensure continued alignment with Shell’s strategy.
� Additional shares are released representing the value of dividends payableon the vested shares, as if these had been owned from the award date.
� Following payment of taxes, vested shares from LTIP awards must be heldfor a further two years to align with the strategic focus.
� LTIP shares are subject to malus and clawback.

GOVERNANCE 93
SHELL ANNUAL REPORT AND FORM 20-F 2014 DIRECTORS’ REMUNERATION REPORT
EXECUTIVE DIRECTORS’ REMUNERATION POLICY TABLE (CONTINUED)Element Purpose and link to strategy Maximum opportunity Operation and performance measurement
Pensions Provides a competitiveretirement provision in linewith the individual’s basecountry benefits policy, toattract and retain ExecutiveDirectors.
Pensions provide a stableincome after Shellemployment, allowingExecutive Directors to focuson delivering performance.
By reference topensionable basesalary, pensionaccrual andcontribution rates andother pensionableelements, asdetermined by therules of the basecountry pension planof which the ExecutiveDirector is a member.
Executive Directors’ retirement benefits are maintained in their base countrypension arrangements. Only base salary is pensionable, unless countryplan regulations specify otherwise. The rules of the relevant plans detail thepension benefits which members can receive on retirement (including on ill-health), death or leaving service. REMCO retains the right to amend theform of any Executive Director’s pension arrangements in response tochanges in legislation, so as to ensure that the original objective of thiselement of remuneration is preserved.
Pensionable base salaries are reviewed annually. For Executive Directorsemployed outside of their base country, euro base salaries are translatedinto their home currencies for pension plan purposes. Once their salariesare denominated in base country currency, they are maintained in line witheuro base salary increases taking into account exchange rate fluctuationsand other factors as determined by REMCO.
Shareholding Aligns interests of ExecutiveDirectors with those ofshareholders.
Shareholding (% ofbase salary):� Chief Executive
Officer: 700%� Other Executive
Directors: 400%
Executive Directors are expected to build up their shareholding to therequired level over a period of five years from appointment and, oncereached, to maintain this level for the full period of their appointment. Theintention is for the shareholding guideline to be reached through retentionof vested shares from share plans. REMCO will monitor individual progressand retains the ability to adjust the guideline in special circumstances on anindividual basis.
Notes to the Executive Directors’ remuneration policytable
BENEFITSExecutive Directors are eligible to receive the standard benefits andallowances provided to employees in their country of employment.Personal loans or guarantees are not provided to Executive Directors.Those working outside of their base country are also eligible to receivespecific benefits such as relocation support and school fees, consistentwith Shell’s mobility policies. Tax gross-up/tax equalisation may alsoapply in limited circumstances to offset double taxation. Where theExecutive Director was on an international assignment prior to boardappointment, there may be payments on behalf of the ExecutiveDirector in subsequent years in the form of tax equalisation settlements.Post-retirement benefits may be applicable in certain countries.
Apart from the benefits described above, Executive Directors andSenior Management have access to a chauffeured car, the provision ofhome security, and occasional business-required spouse travel, whichare generally considered legitimate business expenses rather thancomponents of remuneration. Where these would be taxable in theUK, their values are included as taxable benefits in the single totalfigure of remuneration table.
ANNUAL BONUS AND DEFERRED BONUS PLANREMCO uses the annual bonus to focus on short-term scorecard targetsthat the Board agrees each year as part of Shell’s Business Plan, andon individual performance against personal targets. Shell considersupfront disclosure of these targets in a meaningful manner to becommercially sensitive. The scorecard targets will be retrospectivelydisclosed in a future Directors’ Remuneration Report, when no longerdeemed to be commercially sensitive.
A scorecard with financial performance, operational excellence andsustainable development targets represents the link to business results.For 2015, the scorecard measures will consist of cash flow (30%weight), operational excellence (50% weight) and sustainabledevelopment (20% weight). Annual targets and weightings for eachmetric are set and approved by REMCO each year. The scorecardtargets are stretching but realistic.
2015 ANNUAL BONUS SCORECARD MEASURES FOREXECUTIVE DIRECTORS
30% weight 50% weight
Cash flowCash generated from operations that factorsin the impact of commodity price fluctuationsas well as business performance so that theExecutive Directors, like shareholders, sharethe effects of both.
Operational excellence� Project delivery: indicator of Shell’s
ability to deliver projects on-stream, ontime, and on budget.
� Upstream and Downstream indicatorsof the full and effective use of resources– both facilities and people.
20% weight
Sustainable developmentEqually weighted indicators of safety andenvironmental performance.
For years following 2015, the framework for the annual bonusscorecard, including metrics and weightings, will be reviewed anddetermined by REMCO and can be adjusted accordingly.
Performance is assessed over each calendar year. The outcome isusually known early in the following year, and REMCO translates thisinto a score of between zero and two. REMCO retains the right toexercise its judgement to adjust the mathematical bonus scorecardoutcome to ensure that the final bonus scorecard outcome for ExecutiveDirectors reflects other aspects of Shell’s performance whichREMCO deems appropriate for the reported year.
REMCO strengthens the Executive Directors’ individual accountabilityby increasing or decreasing their annual bonuses to take account ofhow well they have delivered against their individual performancetargets. These targets typically relate to qualitative differentiators notalready covered by the scorecard; for example, stakeholdermanagement, portfolio development, organisational leadership andbrand value. A positive individual adjustment corresponds withpersonal impact beyond expectations, and a negative adjustmentwould mean expectations were not completely met. Upwardadjustment for individual performance is capped at a multiple of 1.2 ofthe bonus, subject to the overall bonus maximum. There is no limit tothe downward adjustment.

94 GOVERNANCE
DIRECTORS’ REMUNERATION REPORT SHELL ANNUAL REPORT AND FORM 20-F 2014
DIRECTORS’ REMUNERATION POLICYCONTINUED
To reinforce alignment with shareholder interests, 50% of the annualbonus is deferred into the DBP and the other 50% is delivered in cash.The deferred bonus is released in the form of shares after a deferralperiod of three years along with dividend shares accrued over thedeferral period.
TIMELINE FOR DEFERRED BONUS PLAN
year 1 year 2 year 3 year 4 year 5
ReleaseAward
Deferral periodPerformance periodfor annual bonus
LONG-TERM INCENTIVE PLANThe LTIP focuses on performance relative to other oil majors.
To recognise the removal of the performance matching shares from theDBP, REMCO currently envisages 2015 LTIP awards will have a targetvalue of 340% and 270% of base salary for the Chief ExecutiveOfficer and other Executive Directors respectively. This is within thepolicy limit which allows REMCO to make awards up to 400% of basesalary.
The LTIP grants share-based awards which may vest by reference toShell’s performance against predefined measures over a three-yearperformance period. For 2015, these measures will consist of TSR, EPSgrowth on a current cost of supplies (CCS) basis, ROACE growth andnet cash growth from operating activities. REMCO will regularly reviewthe performance metrics and weightings. REMCO retains the right toadjust the metrics and/or weightings, so as to ensure that the LTIPcontinues to serve its intended purpose.
2015 LONG-TERM INCENTIVE MEASURES FOREXECUTIVE DIRECTORS
30% weight 20% weight
TSRAssessment of actual wealth created forshareholders.
Return on average capitalemployed (ROACE) growthIndicator of capital discipline.
30% weight 20% weight
EPS growth (on a CCS basis) [A]Indicator of the quality of revenue growthand cost management that underpinsTSR.
Net cash growth from operatingactivitiesSource of dividends and capital expenditurecommitments which support sustainablegrowth based on portfolio and costmanagement.
[A] Earnings per share on a CCS basis takes into account the changes in the cost of suppliesand thereby enables a consistent comparison with other oil majors.
For simplicity, we measure and rank growth based on the data pointsat the beginning of the three-year performance period relative to thedata points at the end of the period, using publicly reported data.
When comparing performance against four peer companies, therelative performance ranking is as indicated in the table below. TheLTIP comparator group currently consists of BP, Chevron, ExxonMobiland Total. REMCO retains the right to adjust the comparator group, to
ensure that it remains appropriate. If this leads to a change in thenumber of companies, the ranking framework (as set out below) maybe adjusted to ensure that the LTIP continues to meet its intendedpurpose and level of challenge.
RELATIVE PERFORMANCE RANKINGS
Shell’s rank against peers on eachof the four performance measures
Number of conditional performance sharesultimately awarded, taking into account theweightings of the four performance measures
1st 2 x initial LTIP award2nd 1.5 x initial LTIP award3rd 0.8 x initial LTIP award4th or 5th Nil
TSR underpinIf the TSR ranking is fourth or fifth, the level of the award that can veston the basis of the three other measures will be capped at 50% of themaximum payout for the LTIP.
VestingREMCO retains discretion to adjust the calculated vesting outcome if itbelieves that this is distorted by circumstances which are unrelated toperformance, for example, reporting changes, ranking clustering,mathematical anomalies or corporate events in the comparator group.Upward adjustment would only be considered after consultation withmajor shareholders. An explanation of any such adjustment would beset out in the relevant Directors’ Remuneration Report.
Performance is assessed over a three-year period. Vested shares fromthe LTIP are subject to a further two-year holding period post-vesting.
TIMELINE FOR LTIP SHARE AWARDS
year 1 year 2 year 3 year 4 year 5 year 6
ReleaseVesting
Retention periodPerformance period
Award
TREATMENT OF OUTSTANDING AWARDSIncentive awards granted prior to the approval and implementation ofthis policy and/or prior to an individual becoming an ExecutiveDirector will continue to vest and be delivered in accordance with theterms of the original award even if this is not consistent with the termsof this policy.
As at March 12, 2014, this applies to Executive Directors Ben vanBeurden and Simon Henry, and to former Directors Peter Voser,Malcolm Brinded and Jeroen van der Veer. Jeroen van der Veer andPeter Voser have share options which can be exercised until May 6,2014, and November 4, 2014, respectively. Ben van Beurden hasoutstanding awards under the Performance Share Plan (PSP), LTIP andDBP. Simon Henry, Peter Voser and Malcolm Brinded have outstandingawards under the LTIP and DBP. Some PSP performance measures andtheir relative weightings differ from those applicable to the LTIP andDBP. In line with the terms of the DBP awards granted between 2012and 2014, performance matching shares may vest.
PENSIONSExecutive Directors’ pensions are maintained in their base country, asare those of other employees working internationally.
Pension accruals are determined by the plan rules of the base countrypension plan of which the Executive Director is a member. These arenot subject to performance conditions.

GOVERNANCE 95
SHELL ANNUAL REPORT AND FORM 20-F 2014 DIRECTORS’ REMUNERATION REPORT
SHAREHOLDINGThe Chief Executive Officer is expected to build up a shareholding ofseven times his base salary over five years from appointment. OtherExecutive Directors are expected to build up a shareholding of fourtimes their base salary over the same period. In the event of anincrease to the guideline multiple of salary, for every additionalmultiple of salary required, the director will have one extra year toreach the increased guideline, subject to a maximum of five years fromthe date of the change.
The shareholding levels are expected to be achieved through retentionof vested LTIP and DBP shares. Executive Directors are expected tomaintain the shareholding level for the full period of their appointment.
Differences for Executive Directors from otheremployeesThe salary for each Executive Director is determined based on theindicators in the “Executive Directors’ remuneration policy table”, whichreflect the international nature of the Executive Directors’ labour market.The salary for other employees is normally set on a country basis.
Executive Directors are eligible to receive the standard benefits andallowances provided to staff in their country of employment. Theprovisions which are not generally available for other employees aredescribed in the second paragraph of “Benefits”.
The methodology used for determining the annual bonus for ExecutiveDirectors is broadly consistent with the approach to determining annualbonuses for Shell employees generally. However, the scorecard usedfor the majority of Shell staff differs in the make-up and weighting of themetrics used. Like Executive Directors, members of Senior Managementare required to defer part of their annual bonus in DBP shares.
Executive Directors are not eligible to receive new awards under otheremployee share plans although awards previously granted willcontinue to vest in accordance with the terms of the original award.Selected employees participate in the PSP. The operation of the PSP issimilar to the LTIP, but currently differs, for example, in someperformance measures and their relative weightings.
There are no special pension arrangements exclusive to ExecutiveDirectors.
Illustration of potential remuneration outcomesThe scenario charts below represent estimates under three scenarios(“Minimum”, “At target”, and “Maximum”) of the potential remuneration
outcomes for each Executive Director resulting from the application of2014 base salaries to awards, anticipated to be made in 2015 inaccordance with the policy.
The scenario charts are based on future policy award levels effectiveJanuary 1, 2015, combined with projected single total figures ofremuneration for Ben van Beurden and Simon Henry. The payscenarios are forward-looking and only serve to illustrate the futurepolicy. The scenarios are based on current incumbents and thus depictthe Chief Executive Officer (CEO) and Chief Financial Officer (CFO)roles.
These scenarios have been prepared on the following basis:
FIXED PAYIn all three scenarios fixed pay includes base salaries effectiveJanuary 1, 2014, as no determinations have yet been made as to any2015 salary increase. As the new Chief Executive Officer is notincluded in the table showing the 2012 and 2013 single total figureof remuneration for Executive Directors, Ben van Beurden’s benefits andpension values are estimates for a typical year. For the Chief FinancialOfficer pay scenarios, benefits and pension have been valued as perthe values included in that table.
ANNUAL INCENTIVEThe “Minimum” scenario assumes that Shell’s performance is such thatno bonus is payable. The “At target” scenario assumes Shell’sperformance results in a bonus equal to the target bonus of 150% ofbase salary for the Chief Executive Officer and 120% for the ChiefFinancial Officer. The “Maximum” scenario assumes Shell’sperformance results in the maximum bonus payment of 250% of basesalary for the Chief Executive Officer and 240% for the Chief FinancialOfficer. For the portion of the bonus deferred in DBP shares, thescenarios assume no share price movement and exclude dividendaccrual, although dividend accrual during the deferral period is afeature of the DBP.
LONG-TERM INCENTIVEThe “Minimum” scenario assumes that no LTIP awards vest. The “Attarget” scenario assumes the LTIP awards vest at target performance.For 2015, the target LTIP awards are illustrated as 340% of basesalary for the Chief Executive Officer and 270% for the Chief FinancialOfficer. The “Maximum” scenario for both assumes that the LTIPawards vest at the maximum, which for the 2015 awards is 200% ofthe shares originally awarded. The scenarios assume no share pricemovement and exclude dividend accrual, although dividend accrualduring the performance period is a feature of the LTIP.
CEO PAY SCENARIOS€ million
16
14
12
10
8
2.0
MinimumFixed payAnnual incentiveLong-term incentive
At target Maximum
8.9
15.0
100% 22%
24%
54%
64%
23%
13%
6
4
2
0
CFO PAY SCENARIOSmillion
16
14
12
10
8
6
4
2
0
1.6
5.5
9.4
100%
50%
22%28% 17%
25%
58%
MinimumFixed payAnnual incentiveLong-term incentive
At target Maximum
€
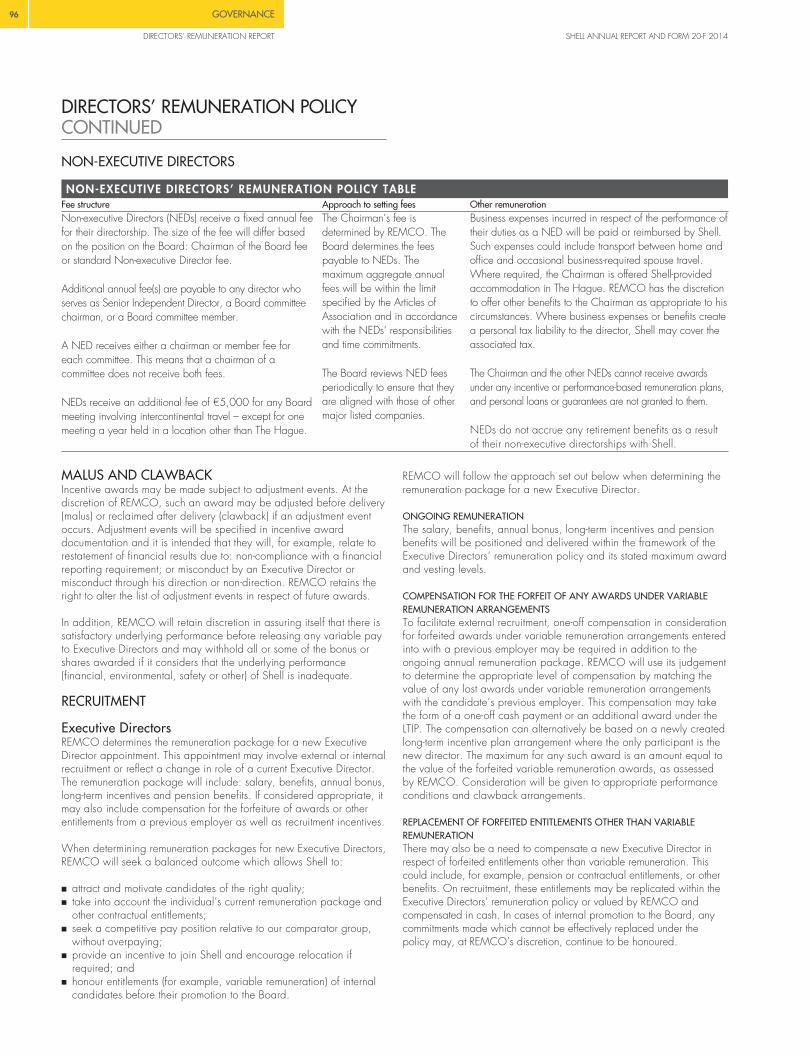
96 GOVERNANCE
DIRECTORS’ REMUNERATION REPORT SHELL ANNUAL REPORT AND FORM 20-F 2014
DIRECTORS’ REMUNERATION POLICYCONTINUED
NON-EXECUTIVE DIRECTORS
NON-EXECUTIVE DIRECTORS’ REMUNERATION POLICY TABLEFee structure Approach to setting fees Other remunerationNon-executive Directors (NEDs) receive a fixed annual feefor their directorship. The size of the fee will differ basedon the position on the Board: Chairman of the Board feeor standard Non-executive Director fee.
Additional annual fee(s) are payable to any director whoserves as Senior Independent Director, a Board committeechairman, or a Board committee member.
A NED receives either a chairman or member fee foreach committee. This means that a chairman of acommittee does not receive both fees.
NEDs receive an additional fee of €5,000 for any Boardmeeting involving intercontinental travel – except for onemeeting a year held in a location other than The Hague.
The Chairman’s fee isdetermined by REMCO. TheBoard determines the feespayable to NEDs. Themaximum aggregate annualfees will be within the limitspecified by the Articles ofAssociation and in accordancewith the NEDs’ responsibilitiesand time commitments.
The Board reviews NED feesperiodically to ensure that theyare aligned with those of othermajor listed companies.
Business expenses incurred in respect of the performance oftheir duties as a NED will be paid or reimbursed by Shell.Such expenses could include transport between home andoffice and occasional business-required spouse travel.Where required, the Chairman is offered Shell-providedaccommodation in The Hague. REMCO has the discretionto offer other benefits to the Chairman as appropriate to hiscircumstances. Where business expenses or benefits createa personal tax liability to the director, Shell may cover theassociated tax.
The Chairman and the other NEDs cannot receive awardsunder any incentive or performance-based remuneration plans,and personal loans or guarantees are not granted to them.
NEDs do not accrue any retirement benefits as a resultof their non-executive directorships with Shell.
MALUS AND CLAWBACKIncentive awards may be made subject to adjustment events. At thediscretion of REMCO, such an award may be adjusted before delivery(malus) or reclaimed after delivery (clawback) if an adjustment eventoccurs. Adjustment events will be specified in incentive awarddocumentation and it is intended that they will, for example, relate torestatement of financial results due to: non-compliance with a financialreporting requirement; or misconduct by an Executive Director ormisconduct through his direction or non-direction. REMCO retains theright to alter the list of adjustment events in respect of future awards.
In addition, REMCO will retain discretion in assuring itself that there issatisfactory underlying performance before releasing any variable payto Executive Directors and may withhold all or some of the bonus orshares awarded if it considers that the underlying performance(financial, environmental, safety or other) of Shell is inadequate.
RECRUITMENT
Executive DirectorsREMCO determines the remuneration package for a new ExecutiveDirector appointment. This appointment may involve external or internalrecruitment or reflect a change in role of a current Executive Director.The remuneration package will include: salary, benefits, annual bonus,long-term incentives and pension benefits. If considered appropriate, itmay also include compensation for the forfeiture of awards or otherentitlements from a previous employer as well as recruitment incentives.
When determining remuneration packages for new Executive Directors,REMCO will seek a balanced outcome which allows Shell to:
� attract and motivate candidates of the right quality;� take into account the individual’s current remuneration package and
other contractual entitlements;� seek a competitive pay position relative to our comparator group,
without overpaying;� provide an incentive to join Shell and encourage relocation if
required; and� honour entitlements (for example, variable remuneration) of internal
candidates before their promotion to the Board.
REMCO will follow the approach set out below when determining theremuneration package for a new Executive Director.
ONGOING REMUNERATIONThe salary, benefits, annual bonus, long-term incentives and pensionbenefits will be positioned and delivered within the framework of theExecutive Directors’ remuneration policy and its stated maximum awardand vesting levels.
COMPENSATION FOR THE FORFEIT OF ANY AWARDS UNDER VARIABLEREMUNERATION ARRANGEMENTSTo facilitate external recruitment, one-off compensation in considerationfor forfeited awards under variable remuneration arrangements enteredinto with a previous employer may be required in addition to theongoing annual remuneration package. REMCO will use its judgementto determine the appropriate level of compensation by matching thevalue of any lost awards under variable remuneration arrangementswith the candidate’s previous employer. This compensation may takethe form of a one-off cash payment or an additional award under theLTIP. The compensation can alternatively be based on a newly createdlong-term incentive plan arrangement where the only participant is thenew director. The maximum for any such award is an amount equal tothe value of the forfeited variable remuneration awards, as assessedby REMCO. Consideration will be given to appropriate performanceconditions and clawback arrangements.
REPLACEMENT OF FORFEITED ENTITLEMENTS OTHER THAN VARIABLEREMUNERATIONThere may also be a need to compensate a new Executive Director inrespect of forfeited entitlements other than variable remuneration. Thiscould include, for example, pension or contractual entitlements, or otherbenefits. On recruitment, these entitlements may be replicated within theExecutive Directors’ remuneration policy or valued by REMCO andcompensated in cash. In cases of internal promotion to the Board, anycommitments made which cannot be effectively replaced under thepolicy may, at REMCO’s discretion, continue to be honoured.
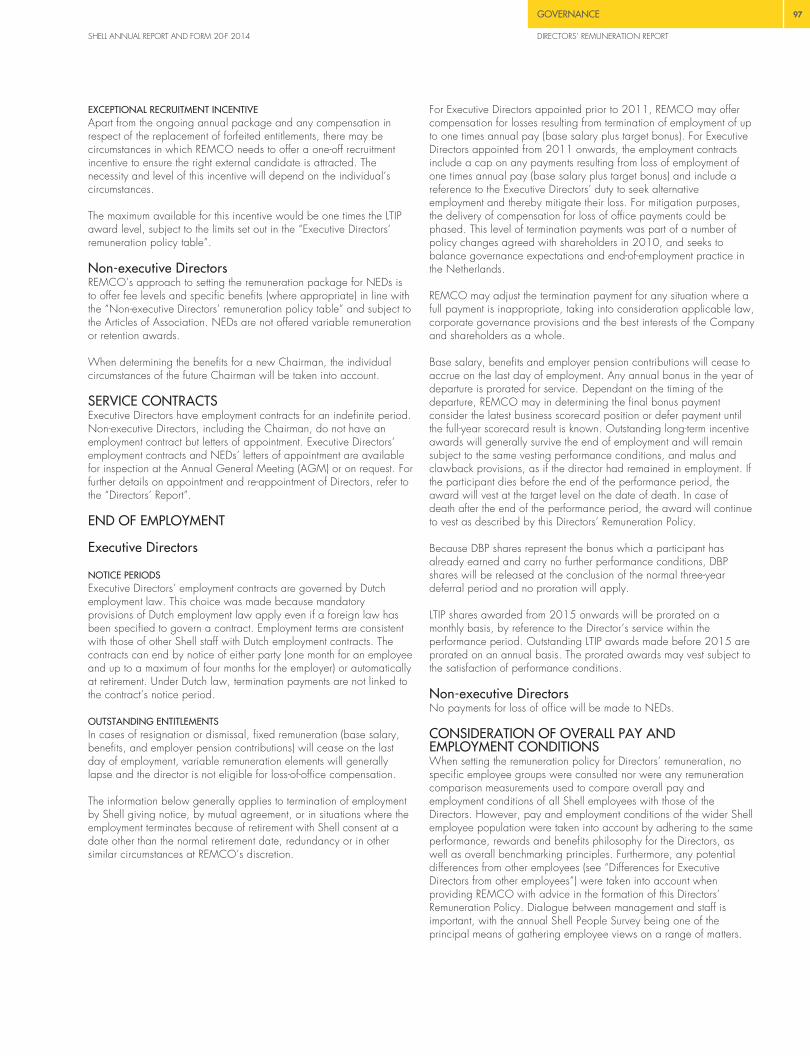
GOVERNANCE 97
SHELL ANNUAL REPORT AND FORM 20-F 2014 DIRECTORS’ REMUNERATION REPORT
EXCEPTIONAL RECRUITMENT INCENTIVEApart from the ongoing annual package and any compensation inrespect of the replacement of forfeited entitlements, there may becircumstances in which REMCO needs to offer a one-off recruitmentincentive to ensure the right external candidate is attracted. Thenecessity and level of this incentive will depend on the individual’scircumstances.
The maximum available for this incentive would be one times the LTIPaward level, subject to the limits set out in the “Executive Directors’remuneration policy table”.
Non-executive DirectorsREMCO’s approach to setting the remuneration package for NEDs isto offer fee levels and specific benefits (where appropriate) in line withthe “Non-executive Directors’ remuneration policy table” and subject tothe Articles of Association. NEDs are not offered variable remunerationor retention awards.
When determining the benefits for a new Chairman, the individualcircumstances of the future Chairman will be taken into account.
SERVICE CONTRACTSExecutive Directors have employment contracts for an indefinite period.Non-executive Directors, including the Chairman, do not have anemployment contract but letters of appointment. Executive Directors’employment contracts and NEDs’ letters of appointment are availablefor inspection at the Annual General Meeting (AGM) or on request. Forfurther details on appointment and re-appointment of Directors, refer tothe “Directors’ Report”.
END OF EMPLOYMENT
Executive Directors
NOTICE PERIODSExecutive Directors’ employment contracts are governed by Dutchemployment law. This choice was made because mandatoryprovisions of Dutch employment law apply even if a foreign law hasbeen specified to govern a contract. Employment terms are consistentwith those of other Shell staff with Dutch employment contracts. Thecontracts can end by notice of either party (one month for an employeeand up to a maximum of four months for the employer) or automaticallyat retirement. Under Dutch law, termination payments are not linked tothe contract’s notice period.
OUTSTANDING ENTITLEMENTSIn cases of resignation or dismissal, fixed remuneration (base salary,benefits, and employer pension contributions) will cease on the lastday of employment, variable remuneration elements will generallylapse and the director is not eligible for loss-of-office compensation.
The information below generally applies to termination of employmentby Shell giving notice, by mutual agreement, or in situations where theemployment terminates because of retirement with Shell consent at adate other than the normal retirement date, redundancy or in othersimilar circumstances at REMCO’s discretion.
For Executive Directors appointed prior to 2011, REMCO may offercompensation for losses resulting from termination of employment of upto one times annual pay (base salary plus target bonus). For ExecutiveDirectors appointed from 2011 onwards, the employment contractsinclude a cap on any payments resulting from loss of employment ofone times annual pay (base salary plus target bonus) and include areference to the Executive Directors’ duty to seek alternativeemployment and thereby mitigate their loss. For mitigation purposes,the delivery of compensation for loss of office payments could bephased. This level of termination payments was part of a number ofpolicy changes agreed with shareholders in 2010, and seeks tobalance governance expectations and end-of-employment practice inthe Netherlands.
REMCO may adjust the termination payment for any situation where afull payment is inappropriate, taking into consideration applicable law,corporate governance provisions and the best interests of the Companyand shareholders as a whole.
Base salary, benefits and employer pension contributions will cease toaccrue on the last day of employment. Any annual bonus in the year ofdeparture is prorated for service. Dependant on the timing of thedeparture, REMCO may in determining the final bonus paymentconsider the latest business scorecard position or defer payment untilthe full-year scorecard result is known. Outstanding long-term incentiveawards will generally survive the end of employment and will remainsubject to the same vesting performance conditions, and malus andclawback provisions, as if the director had remained in employment. Ifthe participant dies before the end of the performance period, theaward will vest at the target level on the date of death. In case ofdeath after the end of the performance period, the award will continueto vest as described by this Directors’ Remuneration Policy.
Because DBP shares represent the bonus which a participant hasalready earned and carry no further performance conditions, DBPshares will be released at the conclusion of the normal three-yeardeferral period and no proration will apply.
LTIP shares awarded from 2015 onwards will be prorated on amonthly basis, by reference to the Director’s service within theperformance period. Outstanding LTIP awards made before 2015 areprorated on an annual basis. The prorated awards may vest subject tothe satisfaction of performance conditions.
Non-executive DirectorsNo payments for loss of office will be made to NEDs.
CONSIDERATION OF OVERALL PAY ANDEMPLOYMENT CONDITIONSWhen setting the remuneration policy for Directors’ remuneration, nospecific employee groups were consulted nor were any remunerationcomparison measurements used to compare overall pay andemployment conditions of all Shell employees with those of theDirectors. However, pay and employment conditions of the wider Shellemployee population were taken into account by adhering to the sameperformance, rewards and benefits philosophy for the Directors, aswell as overall benchmarking principles. Furthermore, any potentialdifferences from other employees (see “Differences for ExecutiveDirectors from other employees”) were taken into account whenproviding REMCO with advice in the formation of this Directors’Remuneration Policy. Dialogue between management and staff isimportant, with the annual Shell People Survey being one of theprincipal means of gathering employee views on a range of matters.

98 GOVERNANCE
DIRECTORS’ REMUNERATION REPORT SHELL ANNUAL REPORT AND FORM 20-F 2014
DIRECTORS’ REMUNERATION POLICYCONTINUED
The Shell People Survey includes questions inviting employees’ viewson their pay and benefit arrangements.
REMCO is kept informed by the Chief Executive Officer, the ChiefHuman Resources & Corporate Officer and the Executive VicePresident Remuneration, Benefits & Services on the Group Scorecardand any relevant remuneration matters affecting Senior Managementand other senior executives, extending to multiple levels below theBoard.
CONSIDERATION OF SHAREHOLDER VIEWSREMCO engages with major shareholders on a regular basisthroughout the year and this allows it to test proposals whendeveloping the Directors’ Remuneration Policy. Specific examples ofREMCO responding to shareholder views include the increase to theshareholding guidelines, the update to the LTIP performance conditionsto include a relative ROACE growth measure, and the removal ofmatching share awards from the DBP.
ADDITIONAL POLICY STATEMENTREMCO reserves the right to make payments outside the policy inlimited exceptional circumstances, such as for regulatory, tax oradministrative purposes or to take account of a change in legislation orexchange controls, and only where REMCO considers such paymentsare necessary to give effect to the intent of the policy.
Signed on behalf of the Board
/s/ Michiel Brandjes
Michiel BrandjesCompany SecretaryMarch 11, 2015

FINANCIAL STATEMENTS AND SUPPLEMENTS 99
SHELL ANNUAL REPORT AND FORM 20-F 2014 CONSOLIDATED FINANCIAL STATEMENTS
FINANCIAL STATEMENTS ANDSUPPLEMENTSINDEPENDENT AUDITORS’REPORT TO THE MEMBERS OFROYAL DUTCH SHELL PLCREPORT ON THE CONSOLIDATED FINANCIALSTATEMENTS
Our opinionIn our opinion, the Consolidated Financial Statements of Royal DutchShell plc (the Company) and its subsidiaries (collectively Shell):
� give a true and fair view of the state of Shell’s affairs as atDecember 31, 2014 and of its income and cash flows for the yearthen ended;
� have been properly prepared in accordance with InternationalFinancial Reporting Standards (IFRS) as adopted by the EuropeanUnion; and
� have been prepared in accordance with the requirements of theCompanies Act 2006 and Article 4 of the IAS Regulation.
Separate opinion in relation to IFRS as issued by theInternational Accounting Standards Board (IASB)As explained in Note 1 to the Consolidated Financial Statements,Shell, in addition to complying with its legal obligation to apply IFRSas adopted by the European Union, has also applied IFRS as issuedby the IASB.
In our opinion, the Consolidated Financial Statements comply with IFRSas issued by the IASB.
What we have auditedThe Consolidated Financial Statements comprise:
� the Consolidated Statement of Income and Consolidated Statementof Comprehensive Income for the year ended December 31, 2014;
� the Consolidated Balance Sheet as at December 31, 2014;� the Consolidated Statement of Changes in Equity for the year ended
December 31, 2014;� the Consolidated Statement of Cash Flows for the year ended
December 31, 2014; and� the Notes to the Consolidated Financial Statements, which include a
summary of significant accounting policies and other explanatoryinformation.
Certain required disclosures have been presented elsewhere in theAnnual Report and Form 20-F (the Annual Report) rather than in theConsolidated Financial Statements. These are cross-referenced from theConsolidated Financial Statements and are identified as audited.
The financial reporting framework that has been applied in thepreparation of the Consolidated Financial Statements is applicable lawand IFRS as adopted by the European Union.
Our audit approach
OVERVIEW
Materiality � Overall materiality: $1,415 million whichrepresents 5% of income before taxation. Thisgroup materiality is allocated, at a lower level, tolocal audit teams.
Scoping � We conducted full scope audit procedures inrespect of operations in nine countries.
� We conducted limited scope audit procedures inrespect of operations in a further nine countries.
� Our audit scope addressed 70% of consolidatedrevenue and 66% of consolidated assets.
� The group audit team conducted an overallreview, and audit procedures over specific areasincluding acquisitions, divestments andimpairment.
Areas of focus � Recoverability of the carrying amount of refiningassets.
� Recoverability of the carrying amount of NorthAmerican tight-gas and liquids-rich shale assets.
� Impact of the deterioration in the short-term oil andgas price environment.
� Allocation of the purchase price in respect of theRepsol acquisition.
� Estimation of decommissioning and restorationprovisions.
� Estimation in respect of uncertain tax positionsand recognition of deferred tax assets.
� Accounting for divestments.� Accuracy of the recognition of unrealised trading
revenue.
OUR AUDIT APPROACHWe conducted our audit in accordance with International Standardson Auditing (UK and Ireland) (ISAs (UK and Ireland)).
We designed our audit by determining materiality and assessing therisks of material misstatement in the Consolidated Financial Statements.In particular, we looked at where the Directors made subjectivejudgements, for example, in respect of significant accounting estimatesthat involved making assumptions and considering future events thatare inherently uncertain. As in all of our audits, we also addressed therisk of management override of internal controls, including evaluatingwhether there was evidence of bias by the Directors that represented arisk of material misstatement due to fraud.
MATERIALITY APPLIED IN OUR WORKThe scope of our audit was influenced by our application ofmateriality. We set certain quantitative thresholds for materiality.These, together with qualitative considerations, helped us to determinethe scope of our audit and the nature, timing and extent of our auditprocedures and to evaluate the effect of misstatements, bothindividually and in aggregate, on the Consolidated FinancialStatements.

100 FINANCIAL STATEMENTS AND SUPPLEMENTS
CONSOLIDATED FINANCIAL STATEMENTS SHELL ANNUAL REPORT AND FORM 20-F 2014
Based on our judgement, we determined materiality for theConsolidated Financial Statements as a whole as follows:
Overall materiality $1,415 million (2013: $1,675 million).
How we determined it 5% of income before taxation.
Rationale for benchmarkapplied
We applied this benchmark, a generallyaccepted auditing practice, in theabsence of indicators that an alternativebenchmark would be more appropriate.
We agreed with the Audit Committee that we would report to themmisstatements identified during our audit above $75 million (2013:$75 million) as well as misstatements below that amount that, in ourview, warranted reporting for qualitative reasons.
In terms of the audit work at the local business unit level, this isperformed by reference to materiality either allocated as a proportionof the overall materiality, or materiality determined in the context oflocal reporting requirements, generally local statutory accounts.
DETERMINING THE SCOPE OF OUR AUDITWe determined the scope of our audit to ensure that we performedenough work to be able to give an opinion on the ConsolidatedFinancial Statements as a whole, taking into account the geographicspread of the Shell businesses, the nature of the accounting processesand controls, and the inherent features of the industry in which Shelloperates.
Shell is structured along three reportable segments: Upstream,Downstream and Corporate. The Consolidated Financial Statementsinclude Shell’s operating businesses and centralised functions spreadacross more than 70 countries.
In establishing the overall approach to the group audit, we determinedthe type of work required to be performed at the reporting units by us,as the group engagement team, or PwC component auditors fromwithin the UK and other network firms operating under our instruction.Where the work was performed by component auditors, wedetermined the level of our involvement necessary at those reportingunits to be able to conclude whether sufficient appropriate auditevidence had been obtained as a basis for our opinion on theConsolidated Financial Statements as a whole.
We identified 44 reporting units in nine countries that, in our view,required an audit of their complete financial information due to theirsize or risk characteristics. Specific audit procedures over certainbalances and transactions were performed on a further 36 reportingunits in 14 countries. The scoping of these reporting units resulted inaudit procedures being performed over 70% of consolidated revenueand 66% of consolidated assets. In addition, work at the componentlevel is supplemented by work at the group level by reference to riskand materiality.
During the year, the Senior Statutory Auditor visited 10 locations:Canada, Qatar, Russia, Singapore and the USA (twice), and each ofShell’s five business service centres. During these visits, he met withlocal management and component auditors. Other senior members ofthe group audit team also visited Shell’s operations in Nigeria,Singapore and the USA. Members of the group audit team performedonsite reviews of audit working papers for certain locations, includingGermany, Malaysia and the USA. The Senior Statutory Auditor alsohosted a planning workshop in November 2014 for audit partnersresponsible for the key reporting units.
OUR AREAS OF AUDIT FOCUSThe risks of material misstatement that had the greatest effect on ouraudit, including the allocation of our resources and effort, areidentified as areas of focus in the table below. We have also set outhow we tailored our audit to address these specific areas in order toprovide an opinion on the Consolidated Financial Statements as awhole, and any comments we make on the results of our proceduresshould be read in this context. This is not a complete list of all risksidentified by our audit.
Area of focusHow our audit addressed the area offocus
Recoverability of the carryingamount of refining assetsThe performance of and outlookfor refining assets in certainlocations, in particular Asia andEurope, continues to bechallenging due to excessglobal refining capacity againsta backdrop of reduced demandgrowth. This gives rise to aheightened risk of impairment.
The assessment of therecoverable amount of refineryassets, as calculated under boththe value-in-use and fair valueless cost to sell bases, requiresconsiderable judgement on thepart of management. Estimatesof future cash flows are basedon management’s views ofvariables such as futurecommodity prices, market supplyand demand, and productmargins.
During the year, managementidentified indicators of potentialimpairment in a number ofrefineries within Shell’s portfolio.Management preparedimpairment models for theserefineries and, as disclosed inNote 8 to the ConsolidatedFinancial Statements, a pre-taxaggregate impairment charge of$2.8 billion was recognised.Our focus was on the risk thatthe impairment charge may beunderstated or that impairmentcharges may also be requiredfor other refinery assets.
We confirmed the appropriatenessof management’s defined cashgenerating units (CGUs) within itsrefining business. We reviewedmanagement’s macro-economicassumptions, including forecastsupply and demand and theirassociated impact on margins, andcompared these with publishedforecasts issued by recognised thirdparty industry analysts. We foundthat management’s forecast marginswere consistent with these externalmarket views.
Detailed audit procedures wereperformed in respect of the risk-adjusted models for refineries wheremanagement’s review of the macro-economic assumptions suggestedthat asset write-downs may berequired. These procedures includedan assessment of the reasonablenessof the site-specific adjustments to theforecast margins, including alookback at prior performanceagainst regional benchmarkmargins, assessment of thereasonableness of volumethroughput forecasts, inflation ratesand the discount rate used. Ourconsideration included assessmentof the appropriateness of probabilityweightings applied to differingscenarios. We also validated theintegrity of the valuation modelsdeveloped by management as partof the impairment assessment andidentified no concerns.

FINANCIAL STATEMENTS AND SUPPLEMENTS 101
SHELL ANNUAL REPORT AND FORM 20-F 2014 CONSOLIDATED FINANCIAL STATEMENTS
Area of focusHow our audit addressed the area offocus
We performed sensitivity analysesaround the key assumptions, withthe calculation being most sensitiveto changes in the realised marginper barrel at each refinery. Wecalculated the extent to which theseassumptions would need to changebefore the impact was material andassessed the likelihood of thesemovements occurring. We assessedthe financial statement disclosures inlight of the analyses and considerthem to be appropriate.
Recoverability of the carryingamount of North American tight-gas and liquids-rich shale assetsThe 2014 strategic review ofthe North American tight-gasand liquids-rich shale portfoliowas performed in the context ofincreased capital discipline andthe commitment by managementto keep, fix or divest assets. Asa result, management identifiedcertain assets where it wasnecessary to consider whetherasset carrying amounts wererecoverable.
This resulted in a pre-taximpairment charge of $2.7billion in respect of certain tight-gas assets in the UpstreamAmericas portfolio.
In addition to confirming theappropriateness of management’sdefinition of CGUs for the relevantassets, we benchmarkedmanagement’s key macro-economicassumptions, such as future gas andliquids prices, and other generalassumptions used, such as thediscount and inflation rates, againstthird party data. We found theassumptions used by managementto be consistent with relevant thirdparty sources.
We performed detailed proceduresfor the assets where the need for animpairment review was identified bymanagement. For those assetsexpected to be retained in theportfolio, we checked themathematical accuracy ofmanagement’s risk-adjusted cashflow model on the value-in-use basis,confirmed that the oil or gasreserves incorporated into the modelwere consistent with the estimatesprepared by reservoir engineers,and assessed the reasonableness ofthe probability weighting assignedto potential scenarios. We foundthese models to be consistent withthe value-in-use approach defined inIFRS and management’s asset-specific business plans.
For those assets which were beingactively marketed, the impairmentassessment was performed on the fairvalue less cost to sell basis, with thefair value corroborated by referenceto indicative or final bids.
Area of focusHow our audit addressed the area offocus
Impact of the deterioration inthe short-term oil and gas priceenvironmentDuring the second half of 2014,the spot price of Brent crude oildeclined approximately 50%,from over $110/b to around$55/b at year end. The marketdrivers behind this short-term pricemovement could contribute to arevision in long-term price viewswhich are the key assumption inmanagement’s impairmentassessment.
We compared the short- and long-term price assumptions used bymanagement in their Upstreamimpairment testing to forward curvesat December 31, 2014 and recentforecasts published by brokers,economists, consultancies andrespected industry bodies such as theInternational Energy Agency, whichcreates a range of relevant third-partydata points.
We found that management’s short-term price assumptions were abovethe forward curve at December 31,2014 but that this had no materialimpact on management’simpairment conclusions.
With regard to long-term priceassumptions, we consideredmanagement’s assessment of thepotential effects on the carryingamount of exploration andproduction assets of a sustainedreduction in long-term prices, withinthe range established by the third-party data points. In particular wefocused our work on theGroundbirch tight-gas asset inCanada and concluded that thecarrying amount remainedsupportable in a lower long-termprice scenario.
We also considered the impact ofthe recent price movement ondeferred tax assets (as describedbelow) and the valuation ofderivatives and inventories. UnderIFRS, derivatives are recognised atfair value. We audited the year endvaluation, focusing on the keyjudgements, and identified nomaterial issues. Inventories arerecognised at the lower of cost andnet realisable value and at year endmanagement recorded write-downsto the carrying amount ofinventories. Based on our auditwork, we are satisfied that Shell’sinventory balances have beenappropriately recorded.
This adverse price movementreflects a current excess ofsupply over demand, withincreased uncertainty regardingthe medium and longer-termeffects. The key drivers behindthe excess supply include:
� The OPEC members decidingin November 2014 tomaintain current output levels;
� Russian oil production rising toa near post-Soviet era highdespite the imposition of EUand US sanctions; and
� US oil production reaching a30-year high, predominantlyas a result of shale oil.
This strong supply environmenthas coincided with weakeningglobal demand growth mainlydriven by a weaker economicoutlook for China, warmer winterweather in Europe, reducedconsumption in OECD countriesand continued economicuncertainty in the eurozone.
The carrying amounts ofexploration and productionassets and deferred tax assetsare dependent upon the futurecash flows and profits of thebusiness. Bearing in mind thelong-lived nature of Shell’sassets, the most criticalassumptions are the longer-termoil and gas prices, beyond thenext three to four years.

102 FINANCIAL STATEMENTS AND SUPPLEMENTS
CONSOLIDATED FINANCIAL STATEMENTS SHELL ANNUAL REPORT AND FORM 20-F 2014
Area of focusHow our audit addressed the area offocus
Assets which are relativelymature or short-lived will bemore exposed to the effect ofdepressed shorter-term prices. Italso leads to greater volatility inmark-to-market adjustments forcertain financial instruments andthe need to consider whether netrealisable value is lower thancost of crude oil and productinventories included in thebalance sheet.
Allocation of the purchase pricein respect of the RepsolacquisitionDuring the year, Shell completedthe acquisition of a portfolio ofLNG assets from Repsol S.A.The transaction fell under thescope of IFRS 3 BusinessCombinations and therefore theacquired assets and liabilitieswere recognised at fair value inShell’s Consolidated FinancialStatements. These assets includea number of long-term contractsfor the supply of LNG.Management engaged a thirdparty to provide an independentvaluation of these and otherassets and liabilities acquired.
We assessed the appropriateness ofthe valuation methodology adoptedin determining fair values, theunderlying assumptions and themathematical accuracy of thevaluation models. In particular, weconsidered whether it wasappropriate to allocate the majorityof the purchase price to acquiredcontracts, as detailed in Note 29 tothe Consolidated FinancialStatements, or whether a portion ofthe purchase price should berecognised as goodwill. Ourdetailed testing of the valuation ofthe contracts, including consideringthe reasonableness of significantunderlying assumptions, confirmedthe appropriateness ofmanagement’s valuation approachand the purchase price allocation.
Estimation of decommissioningand restoration provisionsThe calculation ofdecommissioning and restorationprovisions, which are primarily inrespect of Upstream assets,requires significant managementjudgement because of theinherent complexity in estimatingfuture costs. Thedecommissioning of offshoreinfrastructure is a relativelyimmature activity andconsequently there is limitedhistorical precedent againstwhich to benchmark estimates offuture cost. These factors increasethe complexity involved indetermining accurate accountingprovisions that are material toShell’s balance sheet.
We critically appraisedmanagement’s annual review ofprovisions and performed detailedtesting of the provision recorded inrespect of certain assets based on theassociated risk and materiality. Wefocused in particular on late-lifeassets, where changes to the costestimate directly impact the incomestatement rather than beingrecognised as an asset. Testinginvolved understanding themandatory or constructive obligationswith respect to the decommissioningof each asset based on thecontractual arrangements andrelevant local regulation to validatethe appropriateness of the method ofdecommissioning underpinning thecost estimate.
For these assets we considered thecompetence of the experts, whetherinternal or external to Shell, whoproduced the cost estimates.
Area of focusHow our audit addressed the area offocus
Shell review decommissioningand restoration provisions on anannual basis. This reviewincorporates the effects of anychanges in local regulations,management’s expectedapproach to decommissioningand discount rates, along withthe effects of changes inexchange rates.
We tested the accuracy ofcalculations and evaluated theappropriateness of the discount rateused. In addition, we performedsensitivity analyses to understand thepotential impact of reasonablechanges in assumptions on theprovisions recognised. This analysisconfirmed management’s view thatlikely changes in assumptions do notmaterially impact the provisionsrecorded.
Estimation in respect ofuncertain tax positions andrecognition of deferred taxassetsManagement is required toexercise considerable judgementwhen determining theappropriate amount to provide inrespect of uncertain tax positions,which are generally associatedwith acquisitions, divestments andother activities in countries wherethe tax regime is uncertain,immature or changing.
We performed detailed testing overthe tax positions in the significant taxjurisdictions in which Shell hasoperations, including utilising localtax expertise. Procedures includedtesting the rates applied to calculateprovisions and deferred taxbalances, and a probabilityassessment of the potential outcomeswhere uncertain tax positions exist,based on communications receivedfrom the relevant tax authorities andapplying our local knowledge andexperience.
Where deferred tax assets arise,management judgement isrequired to assess therecoverability of the balance, inparticular by reference toforecast future taxable income.The periods over which thedeferred tax assets are expectedto be recovered can beextensive.
With respect to deferred taxbalances, we examineddocumentation supporting therecoverability of deferred tax assetsrecognised, placing particularemphasis on the reasonableness ofthe forecasts which underpin theasset recognition, including theimpact of recent price deterioration.We found that support for therecognition of these deferred taxassets was consistent with the long-term business plans used bymanagement to manage andmonitor the performance of thebusiness, which were updatedduring the second half of 2014.
Accounting for divestmentsHaving publicly announced inearly 2014 the intention togenerate proceeds of$15 billion from the divestmentof assets in 2014 and 2015,Shell generated proceeds of$14 billion from divestmentsduring the year.
We read management’s accountingpapers associated with eachtransaction and assessed whetherthe proposed treatment wasconsistent with the requirements ofIFRS and agreed key assumptions orfacts within the papers to underlyingdocumentation such as the sale andpurchase agreements. Nodiscrepancies were noted between

FINANCIAL STATEMENTS AND SUPPLEMENTS 103
SHELL ANNUAL REPORT AND FORM 20-F 2014 CONSOLIDATED FINANCIAL STATEMENTS
Area of focusHow our audit addressed the area offocus
Our focus was on understandingthe contractual terms whichdefine the assets and liabilitiesdivested and also, in particular,any liabilities or obligationsretained or created. Additionalcomplexity can also arise wherea partial disposal occurs, as thiscan change the accounting forthe retained asset.
In particular, we placed focuson the divestments of themajority of the Downstreambusiness in Australia, onshoreUpstream assets in Nigeria anda portion of Shell’s interest inWoodside Petroleum Limited(Woodside).
the accounting treatment employedby Shell and the requirements ofIFRS.
For material transactions, weverified consideration received andagreed it to the proceedsrecognised in the cash flowstatement. We confirmed that theappropriate accounting entries,including de-recognition of divestedassets, were recorded. Wereviewed relevant contracts with aparticular focus on obligationsretained by Shell post-divestment.Our procedures confirmed thatappropriate consideration of theimpact of contractual terms onShell’s post-divestment balance sheethad been applied by management.
We also considered whether thereduction in Shell’s interest inWoodside altered Shell’s ability toexert significant influence overWoodside, to confirm that itremained appropriate to classifyWoodside as an associate.
Accuracy of the recognition ofunrealised trading revenueUnrealised revenue arises onShell’s trading activities becauseof the requirement under IFRS tofair value derivative contracts.These contracts principally relateto commodity supplyarrangements with derivativesembedded in the contractualterms.
Management are required toexercise judgement in valuingthese derivative contracts,particularly where the life of thecontract is beyond the liquidmarket period requiring bespokemodels and giving rise to a riskof material misstatement.Particular focus has been placedon the valuation of derivativecontracts at the balance sheetdate.
We assessed the overall commoditytrading process, including internalrisk management procedures andthe system and controls aroundorigination and maintenance ofcomplete and accurate informationrelating to derivative contracts. Wefound the controls in place to beoperating effectively and thereforeplaced reliance on these in ourtesting.
In addition, we tested the valuationof derivative contracts at December31, 2014 which require the use ofvaluation models. Our auditprocedures focused on the integrityof these valuation models and theincorporation of the contract termsand the key assumptions, includingfuture price assumptions anddiscount rates, in the models. Ourtesting confirmed that models usedto value contracts are appropriatefor the purposes of the valuations.
GOING CONCERNUnder the Listing Rules we are required to review the Directors’statement, set out on page 63, in relation to going concern. We havenothing to report having performed our review.
As noted in the Directors’ statement, the Directors have concluded thatit is appropriate to prepare the Consolidated Financial Statementsusing the going concern basis of accounting. The going concern basispresumes that Shell has adequate resources to remain in operation,and that the Directors intend it to do so, for at least one year from thedate the Consolidated Financial Statements were signed. As part ofour audit we have concluded that the Directors’ use of the goingconcern basis is appropriate.
However, because not all future events or conditions can be predicted,these statements are not a guarantee as to Shell’s ability to continue asa going concern.
OTHER REQUIRED REPORTING
Consistency of other information
COMPANIES ACT 2006 OPINIONIn our opinion, the information given in the Strategic Report and theDirectors’ Report for the financial year for which the ConsolidatedFinancial Statements are prepared is consistent with the ConsolidatedFinancial Statements.
ISAs (UK AND IRELAND) REPORTING
Under ISAs (UK and Ireland) we are required to report to you if, in ouropinion:
� information in the Annual Report is: We have no exceptions toreport arising from thisresponsibility.
� materially inconsistent with theinformation in the auditedConsolidated Financial Statements; or
� apparently materially incorrect basedon, or materially inconsistent with, ourknowledge of Shell acquired in thecourse of performing our audit; or
� otherwise misleading.
� the statement given by the Directors onpage 63, in accordance with the UKCorporate Governance Code (theCode) Provision C.1.1, that theyconsider the Annual Report including thefinancial statements, taken as a whole,is fair, balanced and understandableand provides the information necessaryfor members to assess Shell’sperformance, business model andstrategy is materially inconsistent withour knowledge of Shell acquired in thecourse of performing our audit.
We have no exceptions toreport arising from thisresponsibility.
� the section of the Annual Report onpages 76-78, as required by CodeProvision C.3.8, describing the workof the Audit Committee does notappropriately address matterscommunicated by us to the AuditCommittee.
We have no exceptions toreport arising from thisresponsibility.

104 FINANCIAL STATEMENTS AND SUPPLEMENTS
CONSOLIDATED FINANCIAL STATEMENTS SHELL ANNUAL REPORT AND FORM 20-F 2014
Adequacy of information and explanations receivedUnder the Companies Act 2006 we are required to report to you if, inour opinion, we have not received all the information and explanationswe require for our audit. We have no exceptions to report arising fromthis responsibility.
Directors’ remunerationUnder the Companies Act 2006 we are required to report to you if, inour opinion, certain disclosures of Directors’ remuneration specified bylaw are not made. We have no exceptions to report arising from thisresponsibility.
Corporate Governance statementUnder the Listing Rules we are required to review the part of theCorporate Governance statement relating to the Company’scompliance with nine provisions of the Code. We have nothing toreport having performed our review.
RESPONSIBILITIES FOR THE CONSOLIDATEDFINANCIAL STATEMENTS AND THE AUDIT
Our responsibilities and those of the DirectorsAs explained more fully in the Directors’ Responsibilities Statement setout on pages 62 and 63, the Directors are responsible for thepreparation of the Consolidated Financial Statements and for beingsatisfied that they give a true and fair view.
Our responsibility is to audit and express an opinion on theConsolidated Financial Statements in accordance with applicable lawand ISAs (UK and Ireland). Those standards require us to comply withthe Auditing Practices Board’s Ethical Standards for Auditors.
This report, including the opinions, has been prepared for and only forthe Company’s members as a body in accordance with Chapter 3 ofPart 16 of the Companies Act 2006 and for no other purpose. We donot, in giving these opinions, accept or assume responsibility for anyother purpose or to any other person to whom this report is shown orinto whose hands it may come save where expressly agreed by ourprior consent in writing.
What an audit of financial statements involvesAn audit involves obtaining evidence about the amounts anddisclosures in the Consolidated Financial Statements sufficient to givereasonable assurance that the Consolidated Financial Statements arefree from material misstatement, whether caused by fraud or error. Thisincludes an assessment of:
� whether the accounting policies are appropriate to Shell’scircumstances and have been consistently applied and adequatelydisclosed;
� the reasonableness of significant accounting estimates made by theDirectors; and
� the overall presentation of the Consolidated Financial Statements.
We primarily focus our work in these areas by assessing the Directors’judgements against available evidence, forming our own judgementsand evaluating the disclosures in the Consolidated FinancialStatements.
We test and examine information, using sampling and other auditingtechniques, to the extent we consider necessary to provide areasonable basis for us to draw conclusions. We obtain auditevidence through testing the effectiveness of controls, substantiveprocedures or a combination of both.
In addition, we read all the financial and non-financial information inthe Annual Report to identify material inconsistencies with the auditedConsolidated Financial Statements and to identify any information thatis apparently materially incorrect based on, or materially inconsistentwith, the knowledge acquired by us in the course of performing theaudit. If we become aware of any apparent material misstatements orinconsistencies we consider the implications for our report.
OTHER MATTERWe have reported separately on the Parent Company FinancialStatements of Royal Dutch Shell plc for the year ended December 31,2014, and on the information in the Directors’ Remuneration Reportthat is described as having been audited.
Ross Hunter (Senior Statutory Auditor)for and on behalf of PricewaterhouseCoopers LLPChartered Accountants and Statutory AuditorsLondon, United KingdomMarch 11, 2015
Note that the report set out above is included for the purposes ofRoyal Dutch Shell plc’s Annual Report and Accounts for 2014 onlyand does not form part of Royal Dutch Shell plc’s Annual Report onForm 20-F for 2014.

FINANCIAL STATEMENTS AND SUPPLEMENTS 105
SHELL ANNUAL REPORT AND FORM 20-F 2014 CONSOLIDATED FINANCIAL STATEMENTS
REPORT OF INDEPENDENTREGISTERED PUBLICACCOUNTING FIRMTO THE BOARD OF DIRECTORS AND ROYAL DUTCHSHELL PLC SHAREHOLDERS
In our opinion, the accompanying Consolidated Statement of Income,the Consolidated Statement of Comprehensive Income, theConsolidated Balance Sheet, the Consolidated Statement of Changesin Equity, the Consolidated Statement of Cash Flows and the relatedNotes to the Consolidated Financial Statements present fairly, in allmaterial respects, the financial position of Royal Dutch Shell plc (theCompany) and its subsidiaries (collectively Shell) at December 31,2014, and December 31, 2013, and the results of their operationsand cash flows for each of the three years in the period endedDecember 31, 2014, in conformity with International FinancialReporting Standards as issued by the International AccountingStandards Board and in conformity with International FinancialReporting Standards as adopted by the European Union. Also in ouropinion, the Company maintained, in all material respects, effectiveinternal control over financial reporting as of December 31, 2014,based on criteria established in Internal Control – IntegratedFramework (2013) issued by the Committee of SponsoringOrganizations of the Treadway Commission (COSO). The Company’smanagement is responsible for these Consolidated FinancialStatements, for maintaining effective internal control over financialreporting and for its assessment of the effectiveness of internal controlover financial reporting, included in Management’s Report on InternalControl over Financial Reporting of Shell set out on pages 70 and 71.Our responsibility is to express opinions on these ConsolidatedFinancial Statements and on the Company’s internal control overfinancial reporting based on our integrated audits. We conducted ouraudits in accordance with the standards of the Public CompanyAccounting Oversight Board (United States). Those standards requirethat we plan and perform the audits to obtain reasonable assuranceabout whether the Consolidated Financial Statements are free ofmaterial misstatement and whether effective internal control overfinancial reporting was maintained in all material respects. Our auditsof the Consolidated Financial Statements included examining, on a testbasis, evidence supporting the amounts and disclosures in theConsolidated Financial Statements, assessing the accounting principlesused and significant estimates made by management, and evaluating
the overall financial statement presentation. Our audit of internalcontrol over financial reporting included obtaining an understanding ofinternal control over financial reporting, assessing the risk that amaterial weakness exists, and testing and evaluating the design andoperating effectiveness of internal control based on the assessed risk.Our audits also included performing such other procedures as weconsidered necessary in the circumstances. We believe that our auditsprovide a reasonable basis for our opinions.
A company’s internal control over financial reporting is a processdesigned to provide reasonable assurance regarding the reliability offinancial reporting and the preparation of financial statements forexternal purposes in accordance with generally accepted accountingprinciples. A company’s internal control over financial reportingincludes those policies and procedures that: (i) pertain to themaintenance of records that, in reasonable detail, accurately and fairlyreflect the transactions and dispositions of the assets of the company;(ii) provide reasonable assurance that transactions are recorded asnecessary to permit preparation of financial statements in accordancewith generally accepted accounting principles, and that receipts andexpenditures of the company are being made only in accordance withauthorisations of management and directors of the company; and(iii) provide reasonable assurance regarding prevention or timelydetection of unauthorised acquisition, use, or disposition of thecompany’s assets that could have a material effect on the financialstatements.
Because of its inherent limitations, internal control over financialreporting may not prevent or detect misstatements. Also, projections ofany evaluation of effectiveness to future periods are subject to the riskthat controls may become inadequate because of changes inconditions, or that the degree of compliance with the policies orprocedures may deteriorate.
PricewaterhouseCoopers LLPLondon, United KingdomMarch 11, 2015
Note that the report set out above is included for the purposes of RoyalDutch Shell plc’s Annual Report on Form 20-F for 2014 only and doesnot form part of Royal Dutch Shell plc’s Annual Report and Accounts for2014.

106 FINANCIAL STATEMENTS AND SUPPLEMENTS
CONSOLIDATED FINANCIAL STATEMENTS SHELL ANNUAL REPORT AND FORM 20-F 2014
CONSOLIDATEDFINANCIAL STATEMENTS107 Consolidated Statement of Income107 Consolidated Statement of Comprehensive Income108 Consolidated Balance Sheet109 Consolidated Statement of Changes in Equity110 Consolidated Statement of Cash Flows111 Notes to the Consolidated Financial Statements111 Note 1 Basis of preparation111 Note 2 Accounting policies116 Note 3 Key accounting estimates and judgements117 Note 4 Segment information119 Note 5 Interest and other income119 Note 6 Interest expense119 Note 7 Intangible assets120 Note 8 Property, plant and equipment122 Note 9 Joint ventures and associates122 Note 10 Investments in securities123 Note 11 Trade and other receivables123 Note 12 Inventories123 Note 13 Cash and cash equivalents124 Note 14 Debt and lease arrangements126 Note 15 Trade and other payables127 Note 16 Taxation129 Note 17 Retirement benefits131 Note 18 Decommissioning and other provisions131 Note 19 Financial instruments and other derivative contracts136 Note 20 Share capital137 Note 21 Share-based compensation plans and shares held in trust137 Note 22 Other reserves139 Note 23 Dividends139 Note 24 Earnings per share140 Note 25 Legal proceedings and other contingencies140 Note 26 Employees140 Note 27 Directors and Senior Management141 Note 28 Auditor’s remuneration141 Note 29 Acquisition of Repsol LNG businesses outside North America

FINANCIAL STATEMENTS AND SUPPLEMENTS 107
SHELL ANNUAL REPORT AND FORM 20-F 2014 CONSOLIDATED FINANCIAL STATEMENTS
CONSOLIDATED STATEMENT OF INCOME $ MILLIONNOTES 2014 2013 2012
Revenue 421,105 451,235 467,153Share of profit of joint ventures and associates 9 6,116 7,275 8,948Interest and other income 5 4,123 1,089 5,599Total revenue and other income 431,344 459,599 481,700Purchases 327,278 353,199 369,725Production and manufacturing expenses 30,038 28,386 26,215Selling, distribution and administrative expenses 13,965 14,675 14,465Research and development 1,222 1,318 1,307Exploration 4,224 5,278 3,104Depreciation, depletion and amortisation 24,499 21,509 14,615Interest expense 6 1,804 1,642 1,757Income before taxation 28,314 33,592 50,512Taxation 16 13,584 17,066 23,552Income for the period 4 14,730 16,526 26,960(Loss)/income attributable to non-controlling interest (144) 155 248Income attributable to Royal Dutch Shell plc shareholders 14,874 16,371 26,712
Basic earnings per share ($) 24 2.36 2.60 4.27Diluted earnings per share ($) 24 2.36 2.60 4.26
CONSOLIDATED STATEMENT OF COMPREHENSIVE INCOME $ MILLIONNOTES 2014 2013 2012
Income for the period 14,730 16,526 26,960Other comprehensive income 22
Items that may be reclassified to income in later periods:Currency translation differences (5,321) (1,938) 1,394Unrealised losses on securities (797) (166) (815)Cash flow hedging gains 528 178 31Share of other comprehensive loss of joint ventures and associates 9 (156) (167) (222)
Total (5,746) (2,093) 388Items that are not reclassified to income in later periods:
Retirement benefits remeasurements (6,482) 3,833 (2,578)Other comprehensive (loss)/income for the period (12,228) 1,740 (2,190)Comprehensive income for the period 2,502 18,266 24,770Comprehensive (loss)/income attributable to non-controlling interest (190) 23 300Comprehensive income attributable to Royal Dutch Shell plc shareholders 2,692 18,243 24,470

108 FINANCIAL STATEMENTS AND SUPPLEMENTS
CONSOLIDATED FINANCIAL STATEMENTS SHELL ANNUAL REPORT AND FORM 20-F 2014
CONSOLIDATED BALANCE SHEET $ MILLIONNOTES Dec 31, 2014 Dec 31, 2013
AssetsNon-current assetsIntangible assets 7 7,076 4,394Property, plant and equipment 8 192,472 191,897Joint ventures and associates 9 31,558 34,613Investments in securities 10 4,115 4,715Deferred tax 16 8,131 5,785Retirement benefits 17 1,682 3,574Trade and other receivables 11 8,304 9,191
253,338 254,169Current assetsInventories 12 19,701 30,009Trade and other receivables 11 58,470 63,638Cash and cash equivalents 13 21,607 9,696
99,778 103,343Total assets 353,116 357,512LiabilitiesNon-current liabilitiesDebt 14 38,332 36,218Trade and other payables 15 3,582 4,065Deferred tax 16 12,052 11,943Retirement benefits 17 16,318 11,182Decommissioning and other provisions 18 23,834 19,698
94,118 83,106Current liabilitiesDebt 14 7,208 8,344Trade and other payables 15 64,864 70,112Taxes payable 16 9,797 11,173Retirement benefits 17 377 382Decommissioning and other provisions 18 3,966 3,247
86,212 93,258Total liabilities 180,330 176,364EquityShare capital 20 540 542Shares held in trust 21 (1,190) (1,932)Other reserves 22 (14,365) (2,037)Retained earnings 186,981 183,474Equity attributable to Royal Dutch Shell plc shareholders 171,966 180,047Non-controlling interest 820 1,101Total equity 172,786 181,148Total liabilities and equity 353,116 357,512
Signed on behalf of the Board
/s/ Simon Henry
Simon HenryChief Financial OfficerMarch 11, 2015
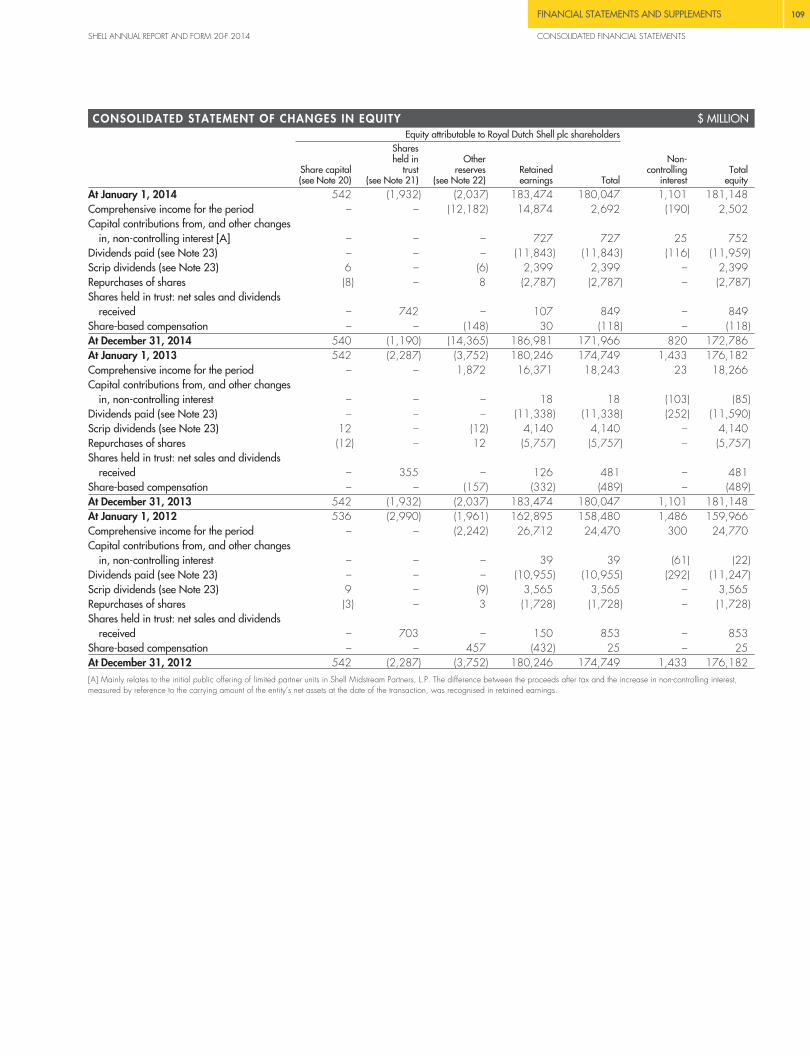
FINANCIAL STATEMENTS AND SUPPLEMENTS 109
SHELL ANNUAL REPORT AND FORM 20-F 2014 CONSOLIDATED FINANCIAL STATEMENTS
CONSOLIDATED STATEMENT OF CHANGES IN EQUITY $ MILLIONEquity attributable to Royal Dutch Shell plc shareholders
Share capital(see Note 20)
Sharesheld in
trust(see Note 21)
Otherreserves
(see Note 22)Retainedearnings Total
Non-controlling
interestTotal
equityAt January 1, 2014 542 (1,932) (2,037) 183,474 180,047 1,101 181,148Comprehensive income for the period – – (12,182) 14,874 2,692 (190) 2,502Capital contributions from, and other changes
in, non-controlling interest [A] – – – 727 727 25 752Dividends paid (see Note 23) – – – (11,843) (11,843) (116) (11,959)Scrip dividends (see Note 23) 6 – (6) 2,399 2,399 – 2,399Repurchases of shares (8) – 8 (2,787) (2,787) – (2,787)Shares held in trust: net sales and dividends
received – 742 – 107 849 – 849Share-based compensation – – (148) 30 (118) – (118)At December 31, 2014 540 (1,190) (14,365) 186,981 171,966 820 172,786At January 1, 2013 542 (2,287) (3,752) 180,246 174,749 1,433 176,182Comprehensive income for the period – – 1,872 16,371 18,243 23 18,266Capital contributions from, and other changes
in, non-controlling interest – – – 18 18 (103) (85)Dividends paid (see Note 23) – – – (11,338) (11,338) (252) (11,590)Scrip dividends (see Note 23) 12 – (12) 4,140 4,140 – 4,140Repurchases of shares (12) – 12 (5,757) (5,757) – (5,757)Shares held in trust: net sales and dividends
received – 355 – 126 481 – 481Share-based compensation – – (157) (332) (489) – (489)At December 31, 2013 542 (1,932) (2,037) 183,474 180,047 1,101 181,148At January 1, 2012 536 (2,990) (1,961) 162,895 158,480 1,486 159,966Comprehensive income for the period – – (2,242) 26,712 24,470 300 24,770Capital contributions from, and other changes
in, non-controlling interest – – – 39 39 (61) (22)Dividends paid (see Note 23) – – – (10,955) (10,955) (292) (11,247)Scrip dividends (see Note 23) 9 – (9) 3,565 3,565 – 3,565Repurchases of shares (3) – 3 (1,728) (1,728) – (1,728)Shares held in trust: net sales and dividends
received – 703 – 150 853 – 853Share-based compensation – – 457 (432) 25 – 25At December 31, 2012 542 (2,287) (3,752) 180,246 174,749 1,433 176,182[A] Mainly relates to the initial public offering of limited partner units in Shell Midstream Partners, L.P. The difference between the proceeds after tax and the increase in non-controlling interest,measured by reference to the carrying amount of the entity’s net assets at the date of the transaction, was recognised in retained earnings.

110 FINANCIAL STATEMENTS AND SUPPLEMENTS
CONSOLIDATED FINANCIAL STATEMENTS SHELL ANNUAL REPORT AND FORM 20-F 2014
CONSOLIDATED STATEMENT OF CASH FLOWS $ MILLIONNOTES 2014 2013 2012
Cash flow from operating activitiesIncome for the period 14,730 16,526 26,960Adjustment for:
Current taxation 13,757 18,582 22,722Interest expense (net) 1,598 1,448 1,543Depreciation, depletion and amortisation 24,499 21,509 14,615Net gains on sale of non-current assets and businesses (3,212) (382) (4,228)Decrease/(increase) in inventories 7,958 608 (1,746)(Increase)/decrease in current receivables (1,541) 5,648 14,145Decrease in current payables (12) (3,268) (9,008)Share of profit of joint ventures and associates (6,116) (7,275) (8,948)Dividends received from joint ventures and associates 6,902 7,117 10,573Deferred taxation, retirement benefits, decommissioning and
other provisions (1,720) (2,701) 341Other 2,500 2,937 201
Net cash from operating activities (pre-tax) 59,343 60,749 67,170Taxation paid (14,299) (20,309) (21,030)Net cash from operating activities 45,044 40,440 46,140Cash flow from investing activitiesCapital expenditure (31,854) (40,145) (32,576)Investments in joint ventures and associates (1,426) (1,538) (3,028)Proceeds from sale of property, plant and equipment and businesses 9,873 1,212 6,346Proceeds from sale of joint ventures and associates 4,163 538 698Other investments (net) (587) (388) (86)Interest received 174 175 193Net cash used in investing activities (19,657) (40,146) (28,453)Cash flow from financing activitiesNet (decrease)/increase in debt with maturity period within three months (3,332) 3,126 (165)Other debt:
New borrowings 7,778 9,146 5,108Repayments (4,089) (6,877) (4,960)
Interest paid (1,480) (1,307) (1,428)Change in non-controlling interest 989 (51) 23Cash dividends paid to:
Royal Dutch Shell plc shareholders 23 (9,444) (7,198) (7,390)Non-controlling interest (116) (252) (292)
Repurchases of shares (3,328) (5,000) (1,492)Shares held in trust: net sales/(purchases) and dividends received 232 (565) (34)Net cash used in financing activities (12,790) (8,978) (10,630)Currency translation differences relating to cash and cash equivalents (686) (170) 201Increase/(decrease) in cash and cash equivalents 13 11,911 (8,854) 7,258Cash and cash equivalents at January 1 9,696 18,550 11,292Cash and cash equivalents at December 31 21,607 9,696 18,550
FINANCIAL STATEMENTS AND SUPPLEMENTS 111
SHELL ANNUAL REPORT AND FORM 20-F 2014 CONSOLIDATED FINANCIAL STATEMENTS
NOTES TO THE CONSOLIDATED FINANCIAL STATEMENTS1 BASIS OF PREPARATIONThe Consolidated Financial Statements of Royal Dutch Shell plc (the Company) and its subsidiaries (collectively referred to as Shell) have beenprepared in accordance with the provisions of the Companies Act 2006 and Article 4 of the International Accounting Standards (IAS) Regulation,and therefore in accordance with International Financial Reporting Standards (IFRS) as adopted by the European Union. As applied to Shell, thereare no material differences from IFRS as issued by the International Accounting Standards Board (IASB); therefore the Consolidated FinancialStatements have been prepared in accordance with IFRS as issued by the IASB.
As described in the accounting policies in Note 2, the Consolidated Financial Statements have been prepared under the historical costconvention except for certain items measured at fair value. Those accounting policies have been applied consistently in all periods.
The Consolidated Financial Statements were approved and authorised for issue by the Board of Directors on March 11, 2015.
Accounting standards not yet adoptedThe final version of IFRS 9 Financial Instruments was issued in 2014 which sets out the requirements for recognising and measuring financialassets, financial liabilities and some contracts to buy or sell non-financial items. It replaces IAS 39 Financial Instruments: Recognition andMeasurement. IFRS 9 is required to be adopted by 2018. The impact for Shell is under review and IFRS 9 may facilitate further use of hedgeaccounting and also could result in different timing of income recognition in respect of certain investments in securities.
IFRS 11 Joint Arrangements was amended in 2014 to clarify the accounting for the acquisition of an interest or an additional interest in a jointoperation where the joint operation itself meets the IFRS definition of a business. The principles of business combination accounting, with someexceptions, should be applied to such transactions which take place on or after the implementation date. This differs from Shell’s current practicewhich is to account for these as asset acquisitions and therefore the amendment may result in further use of fair value measurements andrecognition of goodwill. IFRS 10 Consolidated Financial Statements and IAS 28 Investments in Associates and Joint Ventures were amended in2014 to clarify the accounting for the contribution of a business to a joint venture or an associate in exchange for an equity interest in that jointventure or associate. A full gain or loss on sale should be recognised for such transactions which take place on or after the implementation date,which differs from Shell’s current practice. It is not intended to early adopt these amendments, whose effective date is January 1, 2016, and theimpact on Shell will depend on future transactions.
IFRS 15 Revenue from Contracts with Customers was issued in 2014 and replaces IAS 18 Revenue and certain other pronouncements. It isrequired to be adopted by 2017. The impact is under review but IFRS 15 is not expected to have a significant effect on Shell’s accounting ordisclosures.
2 ACCOUNTING POLICIES
Nature of the Consolidated Financial StatementsThe Consolidated Financial Statements are presented in US dollars (dollars) and comprise the financial statements of the Company and itssubsidiaries, being those entities over which the Company has control, either directly or indirectly, through exposure or rights to their variablereturns and the ability to affect those returns through its power over the entities. Information about significant subsidiaries at December 31, 2014,is set out in Exhibit 8.
Subsidiaries are consolidated from the date on which control is obtained until the date that such control ceases, using consistent accountingpolicies. All inter-company balances and transactions, including unrealised profits arising from such transactions, are eliminated. Unrealised lossesare also eliminated unless the transaction provides evidence of an impairment of the asset transferred. Non-controlling interest represents theproportion of income, other comprehensive income and net assets in subsidiaries that is not attributable to the Company’s shareholders.
Nature of operations and segmental reportingShell is engaged in the principal aspects of the oil and gas industry in more than 70 countries and reports its business through three segments.Upstream combines the operating segments Upstream International and Upstream Americas, which are engaged in exploring for and recoveringcrude oil and natural gas; the liquefaction and transportation of gas; the extraction of bitumen from oil sands that is converted into synthetic crudeoil; and wind energy. These operating segments have similar economic characteristics because their earnings are significantly dependent oncrude oil and natural gas prices and production volumes, and because their projects generally require significant investment, are complex andgenerate revenues for many years. Downstream is engaged in manufacturing, supply and distribution and marketing activities for oil products andchemicals and in alternative energy (excluding wind). Corporate represents the key support functions, comprising Shell’s holdings and treasuryorganisation, including its self-insurance activities as well as its headquarters and central functions. Integrated within the Upstream andDownstream segments are Shell’s trading activities, and functions such as safety and environment, and CO2 management. Sales betweensegments are based on prices generally equivalent to commercially available prices.
Segment earnings are presented on a current cost of supplies basis (CCS earnings), which is the earnings measure used by the Chief ExecutiveOfficer (CEO) for the purposes of making decisions about allocating resources and assessing performance. On this basis, the purchase price ofvolumes sold during the period is based on the current cost of supplies during the same period after making allowance for the tax effect. CCSearnings therefore exclude the effect of changes in the oil price on inventory carrying amounts.

112 FINANCIAL STATEMENTS AND SUPPLEMENTS
CONSOLIDATED FINANCIAL STATEMENTS SHELL ANNUAL REPORT AND FORM 20-F 2014
[Note 2 continued]
Currency translationForeign currency transactions are translated using the exchange rate at the dates of the transactions or valuation where items are re-measured.Foreign exchange gains and losses resulting from the settlement of such transactions and from the translation at quarter-end exchange rates ofmonetary assets and liabilities denominated in foreign currencies (including those in respect of inter-company balances unless related to loans of along-term investment nature) are recognised in income, except when deferred in equity as qualifying cash flow hedges, and presented withininterest and other income or within purchases where not related to financing. Share capital issued in currencies other than the dollar is translatedat the exchange rate at the date of issue.
On consolidation, assets and liabilities of non-dollar entities are translated to dollars at year-end rates of exchange, while their statements ofincome, other comprehensive income and cash flows are translated at quarterly average rates. The resulting translation differences are recognisedas currency translation differences within other comprehensive income. Upon divestment of all or part of an interest in, or upon liquidation of, anentity, the appropriate portion of cumulative currency translation differences related to that entity are generally recognised in income.
Revenue recognitionRevenue from sales of oil, natural gas, chemicals and other products is recognised at the fair value of consideration received or receivable, afterdeducting sales taxes, excise duties and similar levies, when the significant risks and rewards of ownership have been transferred, which is whentitle passes to the customer. For sales by Upstream operations, this generally occurs when product is physically transferred into a vessel, pipe orother delivery mechanism; for sales by refining operations it is either when product is placed onboard a vessel or offloaded from the vessel,depending on the contractually agreed terms; and for wholesale sales of oil products and chemicals it is either at the point of delivery or the pointof receipt, depending on contractual conditions.
Revenue resulting from the production of oil and natural gas from properties in which Shell has an interest with partners in joint arrangements isrecognised on the basis of Shell’s working interest (entitlement method). Revenue resulting from the production of oil and natural gas underproduction-sharing contracts is recognised for those amounts relating to Shell’s cost recoveries and Shell’s share of the remaining production.Gains and losses on derivative contracts and the revenue and costs associated with other contracts that are classified as held for trading purposesare reported on a net basis in the Consolidated Statement of Income. Purchases and sales of hydrocarbons under exchange contracts that arenecessary to obtain or reposition feedstocks for refinery operations are presented net in the Consolidated Statement of Income.
Research and developmentDevelopment costs that are expected to generate probable future economic benefits are capitalised as intangible assets. All other research anddevelopment expenditure is recognised in income as incurred.
Exploration costsOil and natural gas exploration costs are accounted for under the successful efforts method: exploration costs are recognised in income whenincurred, except that exploratory drilling costs are included in property, plant and equipment pending determination of proved reserves.Exploration costs capitalised in respect of exploration wells that are more than 12 months old are written off unless: (a) proved reserves arebooked; or (b) (i) they have found commercially producible quantities of reserves and (ii) they are subject to further exploration or appraisalactivity in that either drilling of additional exploratory wells is underway or firmly planned for the near future or other activities are beingundertaken to sufficiently progress the assessing of reserves and the economic and operating viability of the project.
Property, plant and equipment and intangible assets
RECOGNITIONProperty, plant and equipment comprise assets owned by Shell, assets held by Shell under finance leases and assets operated by Shell ascontractor in production-sharing contracts. They include rights and concessions in respect of properties with proved reserves (proved properties)and with no proved reserves (unproved properties). Property, plant and equipment, including expenditure on major inspections, and intangibleassets are initially recognised in the Consolidated Balance Sheet at cost where it is probable that they will generate future economic benefits. Thisincludes capitalisation of decommissioning and restoration costs associated with provisions for asset retirement (see “Provisions”), certaindevelopment costs (see “Research and development”) and the effects of associated cash flow hedges (see “Derivative contracts”) as applicable.The accounting for exploration costs is described separately (see “Exploration costs”). Intangible assets include goodwill, capitalised off-take andsales contracts, software costs and trademarks. Interest is capitalised, as an increase in property, plant and equipment, on major capital projectsduring construction.
Property, plant and equipment and intangible assets are subsequently carried at cost less accumulated depreciation, depletion and amortisation(including any impairment). Gains and losses on disposals are determined by comparing the proceeds with the carrying amounts of assets soldand are recognised in income, within interest and other income.
DEPRECIATION, DEPLETION AND AMORTISATIONProperty, plant and equipment related to hydrocarbon production activities are depreciated on a unit-of-production basis over the proveddeveloped reserves of the field concerned, except in the case of assets whose useful lives differ from the lifetime of the field, in which case thestraight-line method is applied. Rights and concessions in respect of proved properties are depleted on the unit-of-production basis over the totalproved reserves of the relevant area. Where individually insignificant, unproved properties may be grouped and depreciated based on factorssuch as the average concession term and past experience of recognising proved reserves.

FINANCIAL STATEMENTS AND SUPPLEMENTS 113
SHELL ANNUAL REPORT AND FORM 20-F 2014 CONSOLIDATED FINANCIAL STATEMENTS
Other property, plant and equipment and intangible assets are depreciated and amortised on a straight-line basis over their estimated useful lives,except for goodwill, which is not amortised. They include major inspection costs, which are depreciated over the estimated period before the nextplanned major inspection (three to five years), and the following:
ASSET TYPE USEFUL LIFEProperty, plant and equipment
Held under finance leases lease termRefineries and chemical plants 20 yearsRetail service stations 15 yearsUpgraders 30 years
Intangible assetsLNG off-take and sales contracts 10 to 15 yearsSoftware 5 yearsTrademarks 40 years
Estimates of the useful lives and residual values of property, plant and equipment and intangible assets are reviewed annually and adjusted ifappropriate.
IMPAIRMENTThe carrying amount of goodwill is tested for impairment annually; in addition, assets other than unproved properties (see “Exploration costs”) aretested for impairment whenever events or changes in circumstances indicate that the carrying amounts for those assets may not be recoverable. Ifassets are determined to be impaired, the carrying amounts of those assets are written down to their recoverable amount, which is the higher offair value less costs to sell (see “Fair value measurements”) and value in use.
Value in use is determined as the amount of estimated risk-adjusted discounted future cash flows. For this purpose, assets are grouped into cash-generating units based on separately identifiable and largely independent cash inflows. Estimates of future cash flows used in the evaluation ofimpairment of assets are made using management’s forecasts of commodity prices, market supply and demand, product margins and, in the caseof exploration and production assets, expected production volumes. The latter takes into account assessments of field and reservoir performanceand includes expectations about both proved reserves and volumes that are expected to constitute proved reserves in the future (unprovedvolumes), which are risk-weighted utilising geological, production, recovery and economic projections. Cash flow estimates are risk-adjusted toreflect local conditions as appropriate and discounted at a rate based on Shell’s marginal cost of debt.
Impairments, except those related to goodwill, are reversed as applicable to the extent that the events or circumstances that triggered the originalimpairment have changed.
Impairment charges and reversals are reported within depreciation, depletion and amortisation.
On reclassification as held for sale, the carrying amounts of intangible assets and property, plant and equipment are also reviewed and, whereappropriate, written down to their fair value less costs to sell. No further provision for depreciation, depletion or amortisation is charged.
LeasesAgreements under which payments are made to owners in return for the right to use an asset for a period are accounted for as leases. Leases thattransfer substantially all the risks and rewards of ownership are recognised at the commencement of the lease term as finance leases withinproperty, plant and equipment and debt at the fair value of the leased asset or, if lower, at the present value of the minimum lease payments.Finance lease payments are apportioned between interest expense and repayments of debt. All other leases are classified as operating leasesand the cost is recognised in income on a straight-line basis.
Joint arrangements and associatesArrangements under which Shell has contractually agreed to share control (see “Nature of the Consolidated Financial Statements”) with anotherparty or parties are joint ventures where the parties have rights to the net assets of the arrangement, or joint operations where the parties haverights to the assets and obligations for the liabilities relating to the arrangement. Investments in entities over which Shell has the right to exercisesignificant influence but neither control nor joint control are classified as associates.
Investments in joint ventures and associates are accounted for using the equity method, under which the investment is initially recognised at costand subsequently adjusted for the Shell share of post-acquisition income less dividends received and the Shell share of other comprehensiveincome and other movements in equity, together with any loans of a long-term investment nature. Where necessary, adjustments are made to thefinancial statements of joint ventures and associates to bring the accounting policies used into line with those of Shell. In an exchange of assetsand liabilities for an interest in a joint venture, the non-Shell share of any excess of the fair value of the assets and liabilities transferred over thepre-exchange carrying amounts is recognised in income. Unrealised gains on other transactions between Shell and its joint ventures andassociates are eliminated to the extent of Shell’s interest in them; unrealised losses are treated similarly but may also result in an assessment ofwhether the asset transferred is impaired.
Shell recognises its assets and liabilities relating to its interests in joint operations, including its share of assets held jointly and liabilities incurredjointly with other partners.

114 FINANCIAL STATEMENTS AND SUPPLEMENTS
CONSOLIDATED FINANCIAL STATEMENTS SHELL ANNUAL REPORT AND FORM 20-F 2014
[Note 2 continued]
InventoriesInventories are stated at cost or net realisable value, whichever is lower. Cost comprises direct purchase costs (including transportation), cost ofproduction and manufacturing and taxes, and is determined using the first-in, first-out (FIFO) method for oil and chemicals and by the weightedaverage cost method for materials.
TaxationThe charge for current tax is calculated based on the income reported by the Company and its subsidiaries, as adjusted for items that are non-taxable or disallowed and using rates that have been enacted or substantively enacted by the balance sheet date.
Deferred taxation is determined, using the liability method, on temporary differences arising between the tax bases of assets and liabilities andtheir carrying amounts in the Consolidated Balance Sheet and on unused tax losses and credits carried forward.
Deferred tax assets and liabilities are calculated using the enacted or substantively enacted rates that are expected to apply when the asset orliability is recovered. They are not recognised where they arise on the initial recognition of goodwill or of an asset or liability in a transaction(other than in a business combination) that, at the time of the transaction, affects neither accounting nor taxable profit, or in respect of taxes onpossible future distributions of retained earnings of subsidiaries, joint ventures and associates where the timing of the distribution can be controlledby Shell and it is probable that the retained earnings will be reinvested by the entities concerned.
Deferred tax assets are recognised to the extent that it is probable that future taxable profits will be available against which the deductibletemporary differences, unused tax losses and credits carried forward can be utilised.
Income taxes are recognised in income except when they relate to items recognised in other comprehensive income, in which case the tax isrecognised in other comprehensive income. Income tax assets and liabilities are presented separately in the Consolidated Balance Sheet exceptwhere there is a right of set-off within fiscal jurisdictions and an intention to settle such balances on a net basis.
Retirement benefitsBenefits in the form of retirement pensions and healthcare and life insurance are provided to certain employees and retirees under defined benefitand defined contribution plans.
Obligations under defined benefit plans are calculated annually by independent actuaries using the projected unit credit method, which takes intoaccount employees’ years of service and, for pensions, average or final pensionable remuneration, and are discounted to their present valueusing interest rates of high-quality corporate bonds denominated in the currency in which the benefits will be paid and of a duration consistentwith the plan obligations. Where plans are funded, payments are made to independently managed trusts; assets held by those trusts aremeasured at fair value.
The amounts recognised in income in respect of defined benefit plans mainly comprise service cost and interest. Service cost comprises principallythe increase in the present value of the obligation for benefits resulting from employee service during the period (current service cost) and alsoamounts relating to past service and settlements or amendments of plans. Plan amendments are changes to benefits and are generally recognisedwhen all legal and regulatory approvals have been received and the effects have been communicated to members. Interest is calculated using thediscount rate on the net defined benefit liability or asset at the beginning of each year for each plan. Remeasurements of the net defined benefitliability or asset resulting from actuarial gains and losses and the return on plan assets excluding the amount recognised in income are recognisedin other comprehensive income.
For defined contribution plans, pension expense represents the amount of employer contributions payable for the period.
ProvisionsProvisions are recognised at the balance sheet date at management’s best estimate of the expenditure required to settle the present obligation. Non-current amounts are discounted at a rate intended to reflect the time value of money. Specific details for decommissioning and restoration costs aredescribed below. The carrying amounts of provisions are regularly reviewed and adjusted for new facts or changes in law or technology.
Provisions for decommissioning and restoration costs, which arise principally in connection with hydrocarbon production facilities and pipelines,are measured on the basis of current requirements, technology and price levels; the present value is calculated using amounts discounted over theuseful economic life of the assets. The liability is recognised (together with a corresponding amount as part of the related property, plant andequipment) once an obligation crystallises in the period when a reasonable estimate can be made. The effects of changes resulting from revisionsto the timing or the amount of the original estimate of the provision are reflected on a prospective basis, generally by adjustment to the carryingamount of the related property, plant and equipment.
Other provisions are recognised in income in the period in which an obligation arises and the amount can be reasonably estimated. Provisionsare measured based on current legal requirements and existing technology where applicable. Recognition of any joint and several liability isbased on management’s best estimate of the final pro-rata share of the liability. Provisions are determined independently of expected insurancerecoveries. Recoveries are recognised when virtually certain of realisation.
Financial instruments and other derivative contractsFinancial assets and liabilities are presented separately in the Consolidated Balance Sheet except where unconditional offsetting of outstandingbalances is allowed under offsetting, master netting and similar arrangements with counterparties and net settlement is regularly applied.

FINANCIAL STATEMENTS AND SUPPLEMENTS 115
SHELL ANNUAL REPORT AND FORM 20-F 2014 CONSOLIDATED FINANCIAL STATEMENTS
FINANCIAL ASSETS
Investments in securitiesInvestments in securities (also referred to as “securities”) comprise equity and debt securities classified on initial recognition as available-for-saleand are carried at fair value, except where their fair value cannot be measured reliably, in which case they are carried at cost, less anyimpairment. Unrealised holding gains and losses other than impairments are recognised in other comprehensive income, except for translationdifferences arising on foreign currency debt securities, which are recognised in income. On maturity or disposal, net gains and losses previouslydeferred in accumulated other comprehensive income are recognised in income.
Interest income on debt securities is recognised in income using the effective interest method. Dividends on equity securities are recognised inincome when receivable.
Cash and cash equivalentsCash and cash equivalents comprise cash at bank and in hand, including offsetting bank overdrafts, short-term bank deposits, money marketfunds, reverse repos and similar instruments that have a maturity of three months or less at the date of acquisition.
Trade receivablesTrade receivables are recognised initially at fair value based on amounts exchanged and subsequently at amortised cost less any impairment.
FINANCIAL LIABILITIESDebt and trade payables are recognised initially at fair value based on amounts exchanged, net of transaction costs, and subsequently atamortised cost, except for fixed rate debt subject to fair value hedging which is remeasured for the hedged risk (see “Derivative contracts”).
Interest expense on debt is accounted for using the effective interest method and, other than interest capitalised, is recognised in income.
DERIVATIVE CONTRACTSDerivatives are used in the management of interest rate risk, foreign currency risk and commodity price risk, and in the management of foreigncurrency cash balances. These derivative contracts are recognised at fair value.
Those derivatives qualifying and designated as hedges are either: (i) a “fair value” hedge of the change in fair value of a recognised asset orliability or an unrecognised firm commitment; or (ii) a “cash flow” hedge of the change in cash flows to be received or paid relating to arecognised asset or liability or a highly probable forecasted transaction.
A change in the fair value of a hedging instrument designated as a fair value hedge is recognised in income, together with the consequentialadjustment to the carrying amount of the hedged item. The effective portion of a change in fair value of a derivative designated as a cash flowhedge is recognised in other comprehensive income until the hedged transaction occurs; any ineffective portion is recognised in income. Wherethe hedged item is a non-financial asset or liability, the amount in accumulated other comprehensive income is transferred to the initial carryingamount of the asset or liability; for other hedged items, the amount in accumulated other comprehensive income is recognised in income when thehedged transaction affects income.
All relationships between hedging instruments and hedged items are documented, as well as risk management objectives and strategies forundertaking hedge transactions. The effectiveness of a hedge is also continually assessed and, when it ceases, hedge accounting is discontinued.
Gains and losses on derivatives not qualifying and designated as hedges, including forward sale and purchase contracts for commodities intrading operations that may be settled by the physical delivery or receipt of the commodity, are recognised in income.
Unless designated as hedging instruments, contracts to sell or purchase non-financial items that can be settled net as if the contracts were financialinstruments and that do not meet expected own use requirements (typically, forward sale and purchase contracts for commodities in tradingoperations), and contracts that are or contain written options, are recognised at fair value; associated gains and losses are recognised in income.
Derivatives embedded within contracts that are not already required to be recognised at fair value, and that are not closely related to the hostcontract in terms of economic characteristics and risks, are separated from their host contract and recognised at fair value; associated gains andlosses are recognised in income.
Fair value measurementsFair value measurements are estimates of the amounts for which assets or liabilities could be transferred at the measurement date, based on theassumption that such transfers take place between participants in principal markets and, where applicable, taking highest and best use into account.Where available, fair value measurements are derived from prices quoted in active markets for identical assets or liabilities. In the absence of suchinformation, other observable inputs are used to estimate fair value. Inputs derived from external sources are corroborated or otherwise verified, asappropriate. In the absence of publicly available information, fair value is determined using estimation techniques that take into account marketperspectives relevant to the asset or liability, in as far as they can reasonably be ascertained, based on predominantly unobservable inputs. Forderivative contracts where publicly available information is not available, fair value estimations are generally determined using models and othervaluation methods, the key inputs for which include future prices, volatility, price correlation, counterparty credit risk and market liquidity, asappropriate; for other assets and liabilities, fair value estimations are generally based on the net present value of expected future cash flows.
Share-based compensation plansThe fair value of share-based compensation expense arising from the Performance Share Plan (PSP) – Shell’s main equity-settled plan – isestimated using a Monte Carlo option pricing model and is recognised in income from the date of grant over the vesting period with a

116 FINANCIAL STATEMENTS AND SUPPLEMENTS
CONSOLIDATED FINANCIAL STATEMENTS SHELL ANNUAL REPORT AND FORM 20-F 2014
[Note 2 continued]
corresponding increase directly in equity. The model projects and averages the results for a range of potential outcomes for the vestingconditions, the principal assumptions for which are the share price volatility and dividend yields for Shell and four of its main competitors over thelast three years and the last 10 years. The change in the fair value of share-based compensation for cash-settled plans is recognised in incomewith a corresponding change in liabilities.
Shares held in trustShares in the Company, which are held by employee share ownership trusts and trust-like entities, are not included in assets but are reflected atcost as a deduction from equity as shares held in trust.
Acquisitions and disposals of interests in a businessAssets acquired and liabilities assumed when control is obtained over a business are recognised at their fair value at the date of the acquisition;the amount of the purchase consideration above this value is recognised as goodwill, with any non-controlling interest recognised as theproportionate share of the identifiable net assets. The acquisition of a non-controlling interest in a subsidiary and the disposal of an interest whileretaining control are accounted for as transactions within equity. The difference between the purchase consideration or disposal proceeds aftertax and the relevant proportion of the non-controlling interest, measured by reference to the carrying amount of the interest’s net assets at the dateof acquisition or disposal, is recognised in retained earnings as a movement in equity attributable to Royal Dutch Shell plc shareholders.
Consolidated Statement of Income presentationPurchases reflect all costs related to the acquisition of inventories and the effects of the changes therein, and include supplies used for conversioninto finished or intermediate products. Production and manufacturing expenses are the costs of operating, maintaining and managingproduction and manufacturing assets. Selling, distribution and administrative expenses include direct and indirect costs of marketing and sellingproducts.
3 KEY ACCOUNTING ESTIMATES AND JUDGEMENTSIn order to prepare the Consolidated Financial Statements in conformity with IFRS, management has to make estimates and judgements. Thematters described below are considered to be the most important in understanding the judgements that are involved in preparing these statementsand the uncertainties that could impact the amounts reported in the results of operations, financial condition and cash flows. Shell’s accountingpolicies are described in Note 2.
Estimation of proved oil and gas reservesUnit-of-production depreciation, depletion and amortisation charges are principally measured based on management’s estimates of proveddeveloped oil and gas reserves. Also, exploration drilling costs are capitalised pending the results of further exploration or appraisal activity,which may take several years to complete and before any related proved reserves can be booked.
Proved reserves are estimated by reference to available geological and engineering data and only include volumes for which access to market isassured with reasonable certainty. Estimates of proved reserves are inherently imprecise, require the application of judgement and are subject toregular revision, either upward or downward, based on new information such as from the drilling of additional wells, observation of long-termreservoir performance under producing conditions and changes in economic factors, including product prices, contract terms or developmentplans.
Changes to estimates of proved developed reserves affect prospectively the amounts of depreciation, depletion and amortisation charged and,consequently, the carrying amounts of exploration and production assets. It is expected, however, that in the normal course of business thediversity of the asset portfolio will limit the effect of such revisions. The outcome of, or assessment of plans for, exploration or appraisal activitymay result in the related capitalised exploration drilling costs being recognised in income in that period.
Information about the carrying amounts of exploration and production assets and the amounts charged to income, including depreciation,depletion and amortisation, is presented in Note 8.
Impairment of property, plant and equipment and intangible assetsFor the purposes of determining whether impairment of assets has occurred, and the extent of any impairment or its reversal, the key assumptionsmanagement uses in estimating risk-adjusted future cash flows for value-in-use measures are future oil and gas prices, expected productionvolumes and refining margins appropriate to the local circumstances and environment. These assumptions and the judgements of managementthat are based on them are subject to change as new information becomes available. Changes in economic conditions can also affect the rateused to discount future cash flow estimates.
Future price assumptions tend to be stable because management does not consider short-term increases or decreases in prices as being indicativeof long-term levels, but they are nonetheless subject to change. Expected production volumes, which comprise proved reserves and unprovedvolumes, are used for impairment testing because management believes this to be the most appropriate indicator of expected future cash flows.As discussed in “Estimation of proved oil and gas reserves”, reserves estimates are inherently imprecise. Furthermore, projections about unprovedvolumes are based on information that is necessarily less robust than that available for mature reservoirs. Due to the nature and geographicalspread of the business activity in which those assets are used, it is typically not practicable to estimate the likelihood or extent of impairmentsunder different sets of assumptions. The discount rate applied is reviewed annually.
Changes in assumptions could affect the carrying amounts of assets, and impairment charges and reversals will affect income.
Information about the carrying amounts of assets and impairments is presented in Notes 7 and 8.
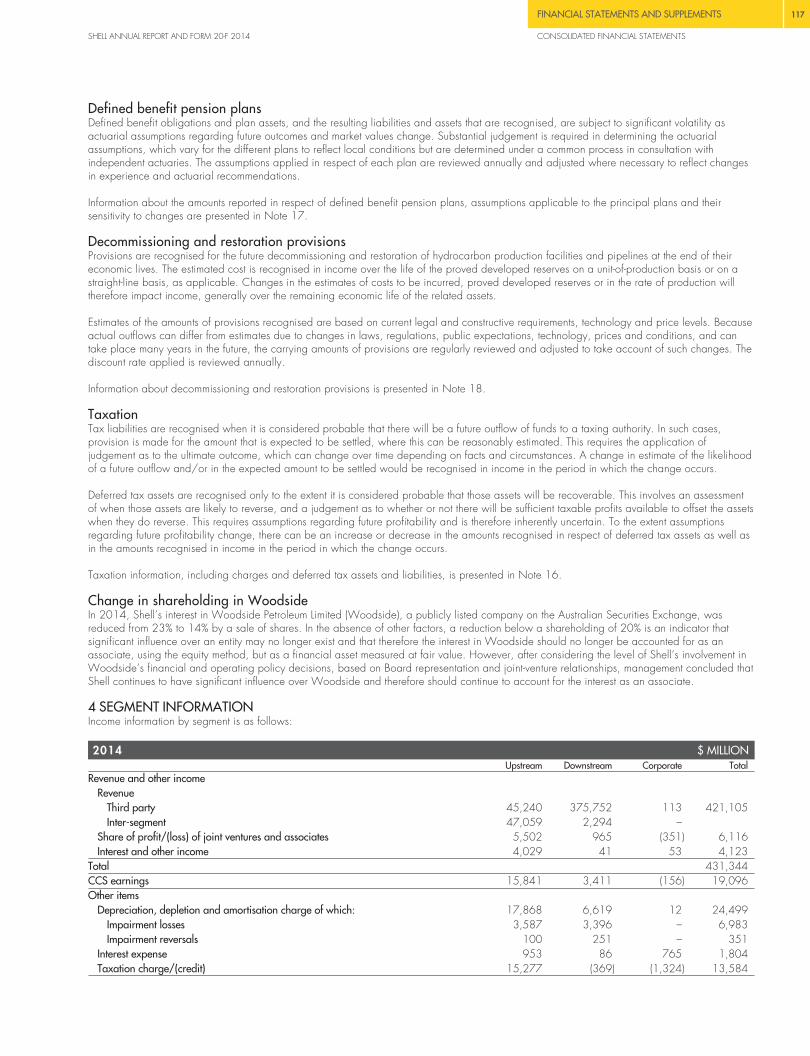
FINANCIAL STATEMENTS AND SUPPLEMENTS 117
SHELL ANNUAL REPORT AND FORM 20-F 2014 CONSOLIDATED FINANCIAL STATEMENTS
Defined benefit pension plansDefined benefit obligations and plan assets, and the resulting liabilities and assets that are recognised, are subject to significant volatility asactuarial assumptions regarding future outcomes and market values change. Substantial judgement is required in determining the actuarialassumptions, which vary for the different plans to reflect local conditions but are determined under a common process in consultation withindependent actuaries. The assumptions applied in respect of each plan are reviewed annually and adjusted where necessary to reflect changesin experience and actuarial recommendations.
Information about the amounts reported in respect of defined benefit pension plans, assumptions applicable to the principal plans and theirsensitivity to changes are presented in Note 17.
Decommissioning and restoration provisionsProvisions are recognised for the future decommissioning and restoration of hydrocarbon production facilities and pipelines at the end of theireconomic lives. The estimated cost is recognised in income over the life of the proved developed reserves on a unit-of-production basis or on astraight-line basis, as applicable. Changes in the estimates of costs to be incurred, proved developed reserves or in the rate of production willtherefore impact income, generally over the remaining economic life of the related assets.
Estimates of the amounts of provisions recognised are based on current legal and constructive requirements, technology and price levels. Becauseactual outflows can differ from estimates due to changes in laws, regulations, public expectations, technology, prices and conditions, and cantake place many years in the future, the carrying amounts of provisions are regularly reviewed and adjusted to take account of such changes. Thediscount rate applied is reviewed annually.
Information about decommissioning and restoration provisions is presented in Note 18.
TaxationTax liabilities are recognised when it is considered probable that there will be a future outflow of funds to a taxing authority. In such cases,provision is made for the amount that is expected to be settled, where this can be reasonably estimated. This requires the application ofjudgement as to the ultimate outcome, which can change over time depending on facts and circumstances. A change in estimate of the likelihoodof a future outflow and/or in the expected amount to be settled would be recognised in income in the period in which the change occurs.
Deferred tax assets are recognised only to the extent it is considered probable that those assets will be recoverable. This involves an assessmentof when those assets are likely to reverse, and a judgement as to whether or not there will be sufficient taxable profits available to offset the assetswhen they do reverse. This requires assumptions regarding future profitability and is therefore inherently uncertain. To the extent assumptionsregarding future profitability change, there can be an increase or decrease in the amounts recognised in respect of deferred tax assets as well asin the amounts recognised in income in the period in which the change occurs.
Taxation information, including charges and deferred tax assets and liabilities, is presented in Note 16.
Change in shareholding in WoodsideIn 2014, Shell’s interest in Woodside Petroleum Limited (Woodside), a publicly listed company on the Australian Securities Exchange, wasreduced from 23% to 14% by a sale of shares. In the absence of other factors, a reduction below a shareholding of 20% is an indicator thatsignificant influence over an entity may no longer exist and that therefore the interest in Woodside should no longer be accounted for as anassociate, using the equity method, but as a financial asset measured at fair value. However, after considering the level of Shell’s involvement inWoodside’s financial and operating policy decisions, based on Board representation and joint-venture relationships, management concluded thatShell continues to have significant influence over Woodside and therefore should continue to account for the interest as an associate.
4 SEGMENT INFORMATIONIncome information by segment is as follows:
2014 $ MILLIONUpstream Downstream Corporate Total
Revenue and other incomeRevenue
Third party 45,240 375,752 113 421,105Inter-segment 47,059 2,294 –
Share of profit/(loss) of joint ventures and associates 5,502 965 (351) 6,116Interest and other income 4,029 41 53 4,123
Total 431,344CCS earnings 15,841 3,411 (156) 19,096Other items
Depreciation, depletion and amortisation charge of which: 17,868 6,619 12 24,499Impairment losses 3,587 3,396 – 6,983Impairment reversals 100 251 – 351
Interest expense 953 86 765 1,804Taxation charge/(credit) 15,277 (369) (1,324) 13,584

118 FINANCIAL STATEMENTS AND SUPPLEMENTS
CONSOLIDATED FINANCIAL STATEMENTS SHELL ANNUAL REPORT AND FORM 20-F 2014
[Note 4 continued]
2013 $ MILLIONUpstream Downstream Corporate Total
Revenue and other incomeRevenue
Third party 47,357 403,725 153 451,235Inter-segment 45,512 702 –
Share of profit/(loss) of joint ventures and associates 6,120 1,543 (388) 7,275Interest and other income 659 273 157 1,089
Total 459,599CCS earnings 12,638 3,869 372 16,879Other items
Depreciation, depletion and amortisation charge of which: 16,949 4,421 139 21,509Impairment losses 4,678 749 – 5,427Impairment reversals 17 – – 17
Interest expense 910 83 649 1,642Taxation charge/(credit) 17,803 975 (1,712) 17,066
2012 $ MILLIONUpstream Downstream Corporate Total
Revenue and other incomeRevenue
Third party 43,431 423,638 84 467,153Inter-segment 51,119 772 –
Share of profit/(loss) of joint ventures and associates 8,001 1,240 (293) 8,948Interest and other income 4,836 305 458 5,599
Total 481,700CCS earnings 22,244 5,382 (203) 27,423Other items
Depreciation, depletion and amortisation charge of which: 11,387 3,083 145 14,615Impairment losses 980 138 3 1,121Impairment reversals – 24 – 24
Interest expense 774 89 894 1,757Taxation charge/(credit) 23,690 1,178 (1,316) 23,552
RECONCILIATION OF TOTAL CCS EARNINGS TO INCOME FOR THE PERIOD $ MILLION2014 2013 2012
Total CCS earnings 19,096 16,879 27,423Current cost of supplies adjustment:
Purchases (5,087) (525) (514)Taxation 1,454 154 165Share of (loss)/profit of joint ventures and associates (733) 18 (114)
Income for the period 14,730 16,526 26,960
Information by geographical area is as follows:
2014 $ MILLION
Europe
Asia,Oceania,
Africa USAOther
Americas TotalThird-party revenue, by origin 154,709 149,869 70,813 45,714 421,105Intangible assets, property, plant and
equipment, joint ventures and associatesat December 31 35,220 105,226 51,124 39,536 231,106
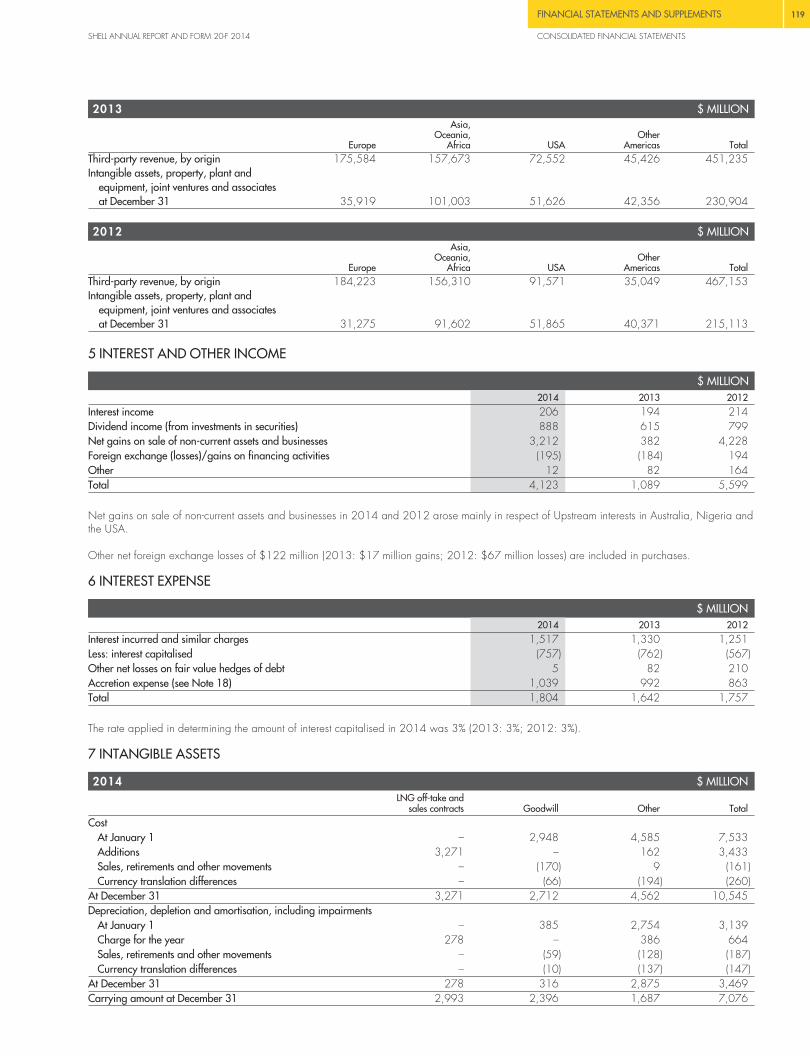
FINANCIAL STATEMENTS AND SUPPLEMENTS 119
SHELL ANNUAL REPORT AND FORM 20-F 2014 CONSOLIDATED FINANCIAL STATEMENTS
2013 $ MILLION
Europe
Asia,Oceania,
Africa USAOther
Americas TotalThird-party revenue, by origin 175,584 157,673 72,552 45,426 451,235Intangible assets, property, plant and
equipment, joint ventures and associatesat December 31 35,919 101,003 51,626 42,356 230,904
2012 $ MILLION
Europe
Asia,Oceania,
Africa USAOther
Americas TotalThird-party revenue, by origin 184,223 156,310 91,571 35,049 467,153Intangible assets, property, plant and
equipment, joint ventures and associatesat December 31 31,275 91,602 51,865 40,371 215,113
5 INTEREST AND OTHER INCOME
$ MILLION2014 2013 2012
Interest income 206 194 214Dividend income (from investments in securities) 888 615 799Net gains on sale of non-current assets and businesses 3,212 382 4,228Foreign exchange (losses)/gains on financing activities (195) (184) 194Other 12 82 164Total 4,123 1,089 5,599
Net gains on sale of non-current assets and businesses in 2014 and 2012 arose mainly in respect of Upstream interests in Australia, Nigeria andthe USA.
Other net foreign exchange losses of $122 million (2013: $17 million gains; 2012: $67 million losses) are included in purchases.
6 INTEREST EXPENSE
$ MILLION2014 2013 2012
Interest incurred and similar charges 1,517 1,330 1,251Less: interest capitalised (757) (762) (567)Other net losses on fair value hedges of debt 5 82 210Accretion expense (see Note 18) 1,039 992 863Total 1,804 1,642 1,757
The rate applied in determining the amount of interest capitalised in 2014 was 3% (2013: 3%; 2012: 3%).
7 INTANGIBLE ASSETS
2014 $ MILLIONLNG off-take and
sales contracts Goodwill Other TotalCost
At January 1 – 2,948 4,585 7,533Additions 3,271 – 162 3,433Sales, retirements and other movements – (170) 9 (161)Currency translation differences – (66) (194) (260)
At December 31 3,271 2,712 4,562 10,545Depreciation, depletion and amortisation, including impairments
At January 1 – 385 2,754 3,139Charge for the year 278 – 386 664Sales, retirements and other movements – (59) (128) (187)Currency translation differences – (10) (137) (147)
At December 31 278 316 2,875 3,469Carrying amount at December 31 2,993 2,396 1,687 7,076

120 FINANCIAL STATEMENTS AND SUPPLEMENTS
CONSOLIDATED FINANCIAL STATEMENTS SHELL ANNUAL REPORT AND FORM 20-F 2014
[Note 7 continued]
2013 $ MILLIONGoodwill Other Total
CostAt January 1 2,955 4,547 7,502Additions 57 315 372Sales, retirements and other movements (3) (284) (287)Currency translation differences (61) 7 (54)
At December 31 2,948 4,585 7,533Depreciation, depletion and amortisation, including impairments
At January 1 340 2,692 3,032Charge for the year 54 372 426Sales, retirements and other movements (1) (309) (310)Currency translation differences (8) (1) (9)
At December 31 385 2,754 3,139Carrying amount at December 31 2,563 1,831 4,394
Additions in 2014 mainly comprise assets acquired as a result of the acquisition of Repsol LNG businesses (see Note 29).
Goodwill at December 31, 2014 and 2013, principally relates to Pennzoil-Quaker State Company, a lubricants business in the Downstreamsegment based largely in North America. For impairment testing purposes, cash flow projections for this business reflected long-term growth ratesthat were assumed to be equal to the average expected inflation rate for the USA (2014: 2%; 2013: 2%) and were adjusted for a variety ofrisks, in particular volume and margin deterioration. The nominal pre-tax discount rate applied was 6% (2013: 6%).
8 PROPERTY, PLANT AND EQUIPMENT
2014 $ MILLIONExploration and production assets Manufacturing,
supply anddistribution Other Total
Explorationand evaluation Production
CostAt January 1 34,102 233,180 76,624 27,209 371,115Additions 5,457 21,958 5,633 2,042 35,090Sales, retirements and other movements (8,907) (11,821) (3,544) (3,274) (27,546)Currency translation differences (730) (8,592) (3,032) (2,106) (14,460)
At December 31 29,922 234,725 75,681 23,871 364,199Depreciation, depletion and amortisation, including impairments
At January 1 4,978 121,714 38,421 14,105 179,218Charge for the year 2,587 13,633 6,234 1,381 23,835Sales, retirements and other movements (3,679) (14,353) (3,323) (2,295) (23,650)Currency translation differences (76) (4,518) (1,985) (1,097) (7,676)
At December 31 3,810 116,476 39,347 12,094 171,727Carrying amount at December 31 26,112 118,249 36,334 11,777 192,472
2013 $ MILLIONExploration and production assets Manufacturing,
supply anddistribution Other Total
Explorationand evaluation Production
CostAt January 1 32,871 198,851 67,460 26,571 325,753Additions 8,517 24,269 3,544 2,230 38,560Sales, retirements and other movements (6,728) 12,781 5,711 (1,374) 10,390Currency translation differences (558) (2,721) (91) (218) (3,588)
At December 31 34,102 233,180 76,624 27,209 371,115Depreciation, depletion and amortisation, including impairments
At January 1 2,110 106,130 31,613 13,607 153,460Charge for the year 3,626 12,092 3,793 1,572 21,083Sales, retirements and other movements (728) 4,603 3,146 (1,047) 5,974Currency translation differences (30) (1,111) (131) (27) (1,299)
At December 31 4,978 121,714 38,421 14,105 179,218Carrying amount at December 31 29,124 111,466 38,203 13,104 191,897

FINANCIAL STATEMENTS AND SUPPLEMENTS 121
SHELL ANNUAL REPORT AND FORM 20-F 2014 CONSOLIDATED FINANCIAL STATEMENTS
The carrying amount at December 31, 2014, includes $46,193 million (2013: $41,115 million) of assets under construction. This amountexcludes exploration and evaluation assets. The carrying amount at December 31, 2014, also includes $1,412 million of assets classified asheld for sale (2013: $2,185 million).
Contractual commitments for the acquisition of property, plant and equipment at December 31, 2014, amounted to $4,565 million (2013:$6,769 million).
Exploration and production assets at December 31, 2014, include rights and concessions in respect of proved and unproved properties of$24,152 million (2013: $28,869 million). Exploration and evaluation assets principally comprise rights and concessions in respect of unprovedproperties and capitalised exploration drilling costs.
CARRYING AMOUNT OF PROPERTY, PLANT AND EQUIPMENT HELD UNDER FINANCE LEASES $ MILLIONDec 31, 2014 Dec 31, 2013
Exploration and production assets 2,686 2,595Manufacturing, supply and distribution 2,069 902Other 293 374Total 5,048 3,871
IMPAIRMENTS $ MILLION2014 2013 2012
Impairment losses [A]Exploration and production assets 3,585 4,528 940Manufacturing, supply and distribution 3,099 305 49Other 299 532 93
Total 6,983 5,365 1,082Impairment reversals [A]
Exploration and production assets 100 17 –Manufacturing, supply and distribution – – 23Other 244 – 1
Total 344 17 24
[A] Presented by segment in Note 4.
In 2014, an impairment review of the refining portfolio was carried out in response to the continuation of weak refining margins across theindustry, resulting in impairment charges of $2.8 billion in Downstream using a value-in-use methodology which included impairment of the fullcarrying amount of the Bukom refinery in Singapore. The key assumptions made by management related to future expected refining margins,planned improvements in operational performance, inflation rate and discount rate. Future changes to these assumptions, in particular refiningmargins, could lead to further impairments.
In response to changes to future capital expenditure plans, an impairment review of tight-gas properties in North America was also carried out,resulting in impairment charges of $2.7 billion in Upstream in respect of a number of US properties, including Bradford, Pinedale and SlipperyRock. The key assumptions made by management related to future disposal proceeds (where assets were in the process of being divested), long-term oil and gas prices, drilling and development plans, inflation rate and discount rate.
In the calculation of the value in use, cash flows were adjusted for risks specific to the related assets and the nominal pre-tax discount rate applied was 6%.
In response to the fall in oil and gas prices in the second half of 2014, management reviewed Shell’s short- and long-term price assumptions. Thisdid not lead to any further impairments being recognised.
Impairment losses in 2013 arose principally in Upstream in respect of the US tight-gas and liquids-rich shale portfolio, including the Eagle Fordand Kansas Mississippi Lime properties, certain of which were classified as held for sale at December 31, 2013. Impairment losses in 2012were driven generally by changes in development and production plans in Upstream.
CAPITALISED EXPLORATION DRILLING COSTS $ MILLION2014 2013 2012
At January 1 8,377 7,886 5,298Additions pending determination of proved reserves 4,370 5,978 6,395Amounts charged to expense (1,881) (2,742) (990)Reclassifications to productive wells on determination of proved reserves (2,116) (2,231) (2,748)Other movements (285) (514) (69)At December 31 8,465 8,377 7,886
Exploration drilling costs capitalised for periods greater than one year at December 31, 2014, analysed according to the most recent year ofactivity, are presented in the table on the next page. They comprise $871 million relating to 16 projects where drilling activities were underwayor firmly planned for the future and $3,456 million relating to 37 projects awaiting development concepts.

122 FINANCIAL STATEMENTS AND SUPPLEMENTS
CONSOLIDATED FINANCIAL STATEMENTS SHELL ANNUAL REPORT AND FORM 20-F 2014
[Note 8 continued]
Projects WellsNumber $ MILLION Number $ MILLION
Between 1 and 5 years 45 4,046 195 3,520Between 6 and 15 years 8 281 39 807Total 53 4,327 234 4,327
9 JOINT VENTURES AND ASSOCIATES
SHELL SHARE OF COMPREHENSIVE INCOME OF JOINT VENTURES AND ASSOCIATES $ MILLION2014 2013 2012
Jointventures Associates Total
Jointventures Associates Total
Jointventures Associates Total
Income for the period 1,813 4,303 6,116 2,541 4,734 7,275 4,071 4,877 8,948Other comprehensive (loss)/income for theperiod (90) (66) (156) 24 (191) (167) (56) (166) (222)Comprehensive income for the period 1,723 4,237 5,960 2,565 4,543 7,108 4,015 4,711 8,726
CARRYING AMOUNT OF INTERESTS IN JOINT VENTURES AND ASSOCIATES $ MILLIONDec 31, 2014 Dec 31, 2013
Jointventures Associates Total
Jointventures Associates Total
Net assets 20,387 11,171 31,558 21,889 12,724 34,613
TRANSACTIONS WITH JOINT VENTURES AND ASSOCIATES $ MILLION2014 2013 2012
Sales and charges to joint ventures and associates 48,379 52,003 51,484Purchases and charges from joint ventures and associates 36,567 35,941 44,597
These transactions principally comprise sales and purchases of goods and services in the ordinary course of business. Related balancesoutstanding at December 31, 2014 and 2013, are presented in Notes 11 and 15.
OTHER ARRANGEMENTS IN RESPECT OF JOINT VENTURES AND ASSOCIATES $ BILLIONDec 31, 2014 Dec 31, 2013
Commitments to make purchases from joint ventures and associates 131.2 131.8Commitments to provide debt or equity funding to joint ventures and associates 3.7 2.3Amounts guaranteed in respect of joint ventures and associates 1.6 2.2
10 INVESTMENTS IN SECURITIESInvestments in securities at December 31, 2014, comprise equity and debt securities. Equity securities principally comprise 15% interests in eachof Malaysia LNG Dua Sendirian Berhad and Malaysia LNG Tiga Sendirian Berhad. Debt securities comprise a portfolio required to be held byShell’s insurance entities as security for their activities.
Equity and debt securities carried at fair value totalled $3,776 million at December 31, 2014 (2013: $4,449 million), with the remainder carried atcost. Of these, $1,383 million (2013: $1,283 million) are measured by reference to prices in active markets for identical assets, and $2,393 million(2013: $3,166 million) are measured by reference to predominantly unobservable inputs. Assets in the latter category, all of which are equitysecurities, are measured based on expected dividend flows, adjusted for country and other risks as appropriate and discounted to their present value.In the case of the Malaysia LNG investments referred to above, were the oil price assumption used in their valuation to be decreased by $10 perbarrel with no change in other measurement inputs, their carrying amount would decrease by $228 million (2013: $354 million).
INVESTMENTS IN SECURITIES MEASURED USING PREDOMINANTLY UNOBSERVABLE INPUTS $ MILLION2014 2013
At January 1 3,166 3,281Losses recognised in other comprehensive income (776) (113)Purchases 72 11Sales (59) (16)Currency translation differences (10) 3At December 31 2,393 3,166

FINANCIAL STATEMENTS AND SUPPLEMENTS 123
SHELL ANNUAL REPORT AND FORM 20-F 2014 CONSOLIDATED FINANCIAL STATEMENTS
11 TRADE AND OTHER RECEIVABLES
$ MILLIONDec 31, 2014 Dec 31, 2013
Current Non-current Current Non-currentTrade receivables 28,393 – 39,094 –Other receivables 8,968 3,738 8,315 3,032Amounts due from joint ventures and associates 3,173 2,212 2,948 2,584Derivative contracts (see Note 19) 14,037 703 6,445 1,772Prepayments and deferred charges 3,899 1,651 6,836 1,803Total 58,470 8,304 63,638 9,191
The fair value of financial assets included above approximates the carrying amount and, other than of certain derivative contracts, is determinedfrom predominantly unobservable inputs.
Other receivables principally include income tax recoverable (see Note 16), other taxes recoverable and balances due from joint arrangementpartners.
Prepayments and deferred charges at December 31, 2013, included $3,385 million in respect of the acquisition of Repsol LNG businesses (seeNote 29).
Provisions for impairments deducted from trade and other receivables amounted to $533 million at December 31, 2014 (2013: $563 million).
OVERDUE TRADE RECEIVABLES $ MILLIONDec 31, 2014 Dec 31, 2013
Overdue 1–30 days 753 1,000Overdue 31–180 days 415 586Overdue more than 180 days 476 541Total 1,644 2,127
Information about offsetting, collateral and credit risk is presented in Note 19.
12 INVENTORIES
$ MILLIONDec 31, 2014 Dec 31, 2013
Oil and chemicals 17,842 28,212Materials 1,859 1,797Total 19,701 30,009
The cost of inventories recognised in income in 2014 includes net write-downs of $1,163 million (2013: $48 million net write-down reversals;2012: $51 million net write-downs).
13 CASH AND CASH EQUIVALENTS
$ MILLIONDec 31, 2014 Dec 31, 2013
Cash 5,095 4,806Short-term bank deposits 7,707 2,226Money market funds, reverse repos and other cash equivalents 8,805 2,664Total 21,607 9,696
Included in cash and cash equivalents at December 31, 2014, are amounts totalling $626 million (2013: $582 million) that are subject tocurrency controls or other legal restrictions. Information about credit risk is presented in Note 19.

124 FINANCIAL STATEMENTS AND SUPPLEMENTS
CONSOLIDATED FINANCIAL STATEMENTS SHELL ANNUAL REPORT AND FORM 20-F 2014
14 DEBT AND LEASE ARRANGEMENTS
DEBT $ MILLIONDec 31, 2014 Dec 31, 2013
Debt(excluding
financelease
liabilities)
Financelease
liabilities Total
Debt(excluding
financelease
liabilities)
Financelease
liabilities TotalShort-term debt 1,590 – 1,590 5,042 – 5,042Long-term debt due within 1 year 5,104 514 5,618 2,895 407 3,302Current debt 6,694 514 7,208 7,937 407 8,344Non-current debt 32,144 6,188 38,332 31,480 4,738 36,218Total 38,838 6,702 45,540 39,417 5,145 44,562
NET DEBT $ MILLION
Currentdebt
Non-currentdebt
Cash and cashequivalents
(see Note 13) Net debtAt January 1, 2014 (8,344) (36,218) 9,696 (34,866)Cash flow 6,518 (6,875) 12,597 12,240Other movements (5,472) 4,634 – (838)Currency translation differences 90 127 (686) (469)At December 31, 2014 (7,208) (38,332) 21,607 (23,933)At January 1, 2013 (7,833) (29,921) 18,550 (19,204)Cash flow 2,313 (7,708) (8,684) (14,079)Settlement of debt-related hedging derivatives (174) – – (174)Other movements (2,791) 1,317 – (1,474)Currency translation differences 141 94 (170) 65At December 31, 2013 (8,344) (36,218) 9,696 (34,866)
Shell management’s financial strategy is to manage Shell’s assets and liabilities with the aim that, across the business cycle, “cash in” at leastequals “cash out” while maintaining a strong balance sheet.
Gearing, calculated as net debt (total debt less cash and cash equivalents) as a percentage of total capital (net debt plus total equity), is a keymeasure of Shell’s capital structure. Across the business cycle management aims to manage gearing within a range of 0-30%. During 2014,gearing ranged from 11.7% to 16.1% (2013: 9.1% to 16.1%) and at December 31, 2014, it was 12.2% (2013: 16.1%).
GEARING $ MILLION, EXCEPT WHERE OTHERWISE INDICATEDDec 31, 2014 Dec 31, 2013
Net debt 23,933 34,866Total equity 172,786 181,148Total capital 196,719 216,014Gearing 12.2% 16.1%
With respect to the objective of maintaining a strong balance sheet, management prioritises the application of cash to the servicing of debtcommitments, paying dividends, investing for organic and inorganic growth and returning surplus cash to shareholders. Management’s policy isto grow the US dollar dividend through time in line with its view of Shell’s underlying earnings and cash flow.
Shell has access to international debt capital markets via two commercial paper (CP) programmes, a euro medium-term note (EMTN) programmeand a US universal shelf (US shelf) registration. Issuances under the CP programmes are supported by a committed credit facility and cash.
BORROWING FACILITIES AND AMOUNTS UNDRAWN $ MILLIONFacility Amount undrawn
Dec 31, 2014 Dec 31, 2013 Dec 31, 2014 Dec 31, 2013CP programmes 20,000 20,000 20,000 17,000EMTN programme 25,000 25,000 12,117 18,023US shelf registration unlimited unlimited n/a n/aCommitted credit facility 7,480 7,480 7,480 7,480

FINANCIAL STATEMENTS AND SUPPLEMENTS 125
SHELL ANNUAL REPORT AND FORM 20-F 2014 CONSOLIDATED FINANCIAL STATEMENTS
Under the CP programmes, Shell can issue debt of up to $10 billion with maturities not exceeding 270 days and $10 billion with maturities notexceeding 397 days. The EMTN programme is updated each year, most recently in August 2014. $6,394 million was issued under thisprogramme in 2014 (2013: $nil). The US shelf registration provides Shell with the flexibility to issue debt securities, ordinary shares, preferredshares and warrants. The registration is updated every three years and was last updated in October 2014. During 2014, no debt (2013:$7,750 million) was issued under the registration. The committed credit facility is available on same-day terms, at pre-agreed margins, and is dueto expire in 2019 but may, by mutual agreement, be extended for a further year. The terms and availability are not conditional on Shell’sfinancial ratios or its financial credit ratings.
In addition, other subsidiaries have access to short-term bank facilities totalling $3,760 million at December 31, 2014 (2013: $3,631 million).
Information about liquidity risk is presented in Note 19.
Interest rate swaps were entered into against certain of the fixed rate debt due to mature after more than one year, affecting the effective interestrate on these balances (see Note 19).
The following tables compare contractual cash flows for debt excluding finance lease liabilities at December 31, with the carrying amount in theConsolidated Balance Sheet. Contractual amounts reflect the effects of changes in currency exchange rates; differences from carrying amountsreflect the effects of discounting, premiums and, where hedge accounting is applied, fair value adjustments. Interest is estimated assuming interestrates applicable to variable rate debt remain constant and there is no change in aggregate principal amounts of debt other than repayment atscheduled maturity, as reflected in the table.
2014 $ MILLIONContractual payments Difference
fromcarryingamount
Carryingamount
Less than1 year
Between1 and 2
years
Between2 and 3
years
Between3 and 4
years
Between4 and 5
years5 years
and later TotalEMTN programme – 1,519 1,823 3,039 779 5,166 12,326 752 13,078US shelf registration 4,250 2,000 1,750 2,750 2,000 9,750 22,500 5 22,505Bank and other borrowings 2,421 262 319 130 49 74 3,255 – 3,255Total (excluding interest) 6,671 3,781 3,892 5,919 2,828 14,990 38,081 757 38,838Interest 1,107 1,076 955 833 644 7,050 11,665
2013 $ MILLIONContractual payments Difference
fromcarryingamount
Carryingamount
Less than1 year
Between1 and 2
years
Between2 and 3
years
Between3 and 4
years
Between4 and 5
years5 years
and later TotalCP programmes 3,000 – – – – – 3,000 – 3,000EMTN programme – – 1,721 2,066 3,443 – 7,230 652 7,882US shelf registration 2,500 4,250 2,000 1,750 2,750 11,750 25,000 72 25,072Bank and other borrowings 2,437 433 257 8 73 255 3,463 – 3,463Total (excluding interest) 7,937 4,683 3,978 3,824 6,266 12,005 38,693 724 39,417Interest 1,166 1,049 982 863 736 7,084 11,880
Debt is issued under the EMTN programme and US shelf registration by Shell International Finance B.V., a 100%-owned subsidiary of theCompany, and is underwritten by guarantees issued by the Company. Bank and other borrowings are raised by other subsidiaries with norecourse beyond the immediate borrower and/or the local assets.
The fair value of debt excluding finance lease liabilities at December 31, 2014, was $41,120 million (2013: $40,569 million) determinedfrom the prices quoted for those securities.
Lease arrangements are entered into, as lessee, for: in Upstream, principally drilling and ancillary equipment, service vessels, obligations undercertain power generation contracts (“tolling agreements”) and LNG vessels; in Downstream, principally tankers, storage capacity and retail sites;and in Corporate, principally land and buildings.

126 FINANCIAL STATEMENTS AND SUPPLEMENTS
CONSOLIDATED FINANCIAL STATEMENTS SHELL ANNUAL REPORT AND FORM 20-F 2014
[Note 14 continued]
The future minimum lease payments for finance and operating leases and the present value of future minimum finance lease payments atDecember 31, by payment date are as follows:
2014 $ MILLIONFinance leases Operating leases
Futureminimum
lease payments Interest
Present valueof future minimum
lease payments
Futureminimum
lease paymentsLess than 1 year 1,068 554 514 5,697Between 1 and 5 years 3,636 1,637 1,999 15,1995 years and later 6,254 2,065 4,189 9,929Total 10,958 4,256 6,702 30,825
2013 $ MILLIONFinance leases Operating leases
Futureminimum
lease payments Interest
Present valueof future minimum
lease payments
Futureminimum
lease paymentsLess than 1 year 850 443 407 5,814Between 1 and 5 years 3,010 1,426 1,584 15,0395 years and later 5,079 1,925 3,154 11,688Total 8,939 3,794 5,145 32,541
Finance lease liabilities are secured on the leased assets and include obligations under tolling agreements. The present value of the futureminimum lease payments under these agreements was $1,778 million at December 31, 2014 (2013: $1,952 million). The agreements maturebetween 2021 and 2024 and the average interest rate is 8%. Finance lease liabilities of $1,601 million relating to LNG vessels were assumedin 2014 as a result of the acquisition of Repsol LNG businesses (see Note 29).
The net present value of future minimum lease payments for operating leases at December 31, 2014 was $28,456 million (2013: $29,871million), discounting the payments at 2.0% (2013: 2.0%).
Future minimum lease payments at December 31, 2014, are stated before deduction of expected rental income from non-cancellable sub-leasesof $551 million (2013: $586 million) in respect of finance leases and $172 million (2013: $236 million) in respect of operating leases.
Operating lease expense in 2014 was $4,572 million (2013: $4,056 million; 2012: $3,631 million).
15 TRADE AND OTHER PAYABLES
$ MILLIONDec 31, 2014 Dec 31, 2013
Current Non-current Current Non-currentTrade payables 32,131 – 41,927 –Other payables 5,832 2,046 5,997 2,303Amounts due to joint ventures and associates 2,702 21 3,894 22Derivative contracts (see Note 19) 11,554 520 6,474 587Accruals and deferred income 12,645 995 11,820 1,153Total 64,864 3,582 70,112 4,065
The fair value of financial liabilities included above approximates the carrying amount and, other than of certain derivative contracts, isdetermined from predominantly unobservable inputs.
Other payables include balances due to joint arrangement partners and commitments for share repurchases undertaken on the Company’s behalfunder irrevocable, non-discretionary arrangements.
Information about offsetting, collateral and liquidity risk is presented in Note 19.

FINANCIAL STATEMENTS AND SUPPLEMENTS 127
SHELL ANNUAL REPORT AND FORM 20-F 2014 CONSOLIDATED FINANCIAL STATEMENTS
16 TAXATION
TAXATION CHARGE $ MILLION2014 2013 2012
Current taxationCharge in respect of current period 14,044 18,316 22,551Adjustment in respect of prior periods (287) 266 171
Total 13,757 18,582 22,722Deferred taxation
Relating to the origination and reversal of temporary differences, tax losses and credits (318) (1,064) 801Relating to changes in tax rates 19 (108) 247Adjustment in respect of prior periods 126 (344) (218)
Total (173) (1,516) 830Total taxation charge 13,584 17,066 23,552
RECONCILIATION OF APPLICABLE TAX CHARGE AT STATUTORY TAX RATES TO TAXATION CHARGE $ MILLION2014 2013 2012
Income before taxation 28,314 33,592 50,512Less: share of profit of joint ventures and associates (6,116) (7,275) (8,948)Income before taxation and share of profit of joint ventures and associates 22,198 26,317 41,564Applicable tax charge at statutory tax rates 11,206 16,463 23,790Adjustment in respect of prior periods (161) (78) (47)Tax effects of:
Derecognition/(recognition) of deferred tax assets 1,015 321 206Income not subject to tax at statutory rates (1,864) (1,077) (1,369)Expenses not deductible for tax purposes 2,271 1,134 965Deductible items not expensed (401) (545) (562)Taxable income not recognised 526 263 259
Other reconciling items, including amounts relating to changes in tax rate 992 585 310Taxation charge 13,584 17,066 23,552
The weighted average of statutory tax rates was 50.5% in 2014 (2013: 62.6%; 2012: 57.2%). The decrease from 2013 to 2014 was due toa change in the geographical mix of income in the Upstream segment, with a higher proportion of income in 2014 arising in jurisdictions subjectto relatively lower tax rates, partly offset by a change in the mix of Upstream and Downstream income, with a higher proportion arising inUpstream where tax rates are typically higher than in Downstream. The increase from 2012 to 2013 was principally due to a change in thegeographical mix of income in Upstream, with a higher proportion of Upstream income in 2013 arising in jurisdictions subject to relatively highertax rates.
The taxation charge includes not only those of general application but also taxes at higher rates levied on income from certain Upstream activitiesand various other taxes to which these activities are subjected.
The adjustments in respect of prior periods relate to events in the current period and reflect the effects of changes in rules, facts or other factorscompared with those used in establishing the current tax position or deferred tax balance in prior periods.
TAXES PAYABLE $ MILLIONDec 31, 2014 Dec 31, 2013
Income taxes 6,396 7,085Sales taxes, excise duties and similar levies and social security contributions 3,401 4,088Total 9,797 11,173
Included in other receivables at December 31, 2014 (see Note 11), is income tax receivable of $1,091 million (2013: $1,008 million).
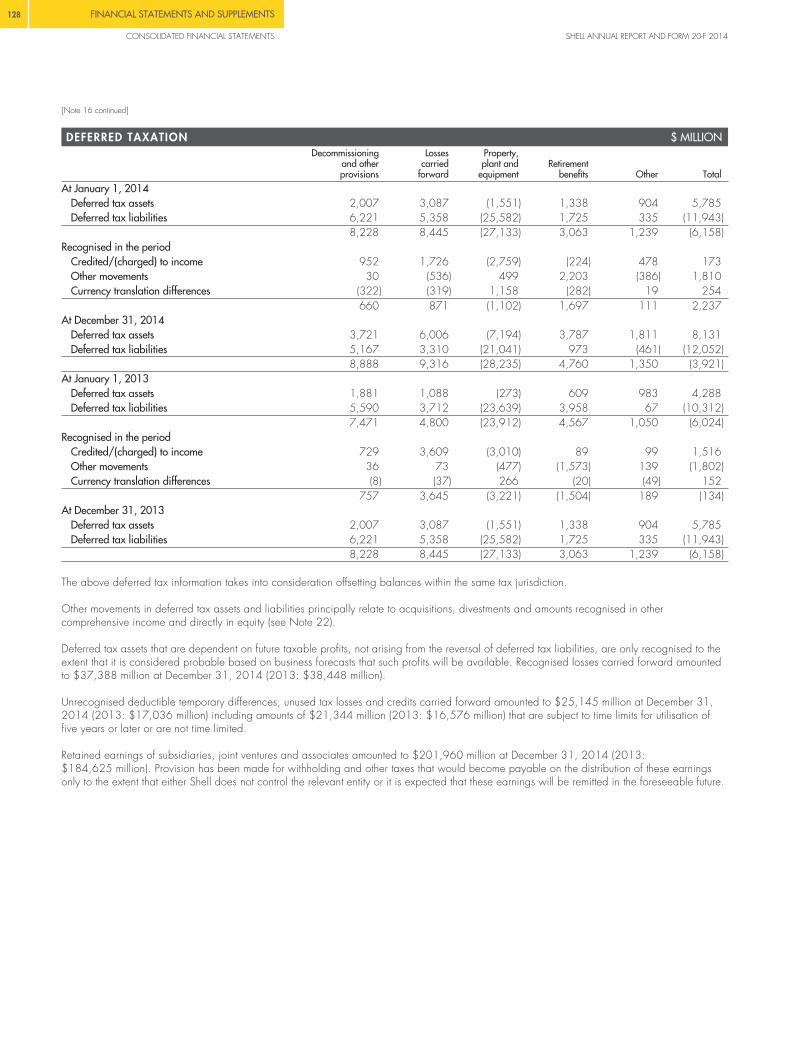
128 FINANCIAL STATEMENTS AND SUPPLEMENTS
CONSOLIDATED FINANCIAL STATEMENTS SHELL ANNUAL REPORT AND FORM 20-F 2014
[Note 16 continued]
DEFERRED TAXATION $ MILLIONDecommissioning
and otherprovisions
Lossescarried
forward
Property,plant and
equipmentRetirement
benefits Other TotalAt January 1, 2014
Deferred tax assets 2,007 3,087 (1,551) 1,338 904 5,785Deferred tax liabilities 6,221 5,358 (25,582) 1,725 335 (11,943)
8,228 8,445 (27,133) 3,063 1,239 (6,158)Recognised in the period
Credited/(charged) to income 952 1,726 (2,759) (224) 478 173Other movements 30 (536) 499 2,203 (386) 1,810Currency translation differences (322) (319) 1,158 (282) 19 254
660 871 (1,102) 1,697 111 2,237At December 31, 2014
Deferred tax assets 3,721 6,006 (7,194) 3,787 1,811 8,131Deferred tax liabilities 5,167 3,310 (21,041) 973 (461) (12,052)
8,888 9,316 (28,235) 4,760 1,350 (3,921)At January 1, 2013
Deferred tax assets 1,881 1,088 (273) 609 983 4,288Deferred tax liabilities 5,590 3,712 (23,639) 3,958 67 (10,312)
7,471 4,800 (23,912) 4,567 1,050 (6,024)Recognised in the period
Credited/(charged) to income 729 3,609 (3,010) 89 99 1,516Other movements 36 73 (477) (1,573) 139 (1,802)Currency translation differences (8) (37) 266 (20) (49) 152
757 3,645 (3,221) (1,504) 189 (134)At December 31, 2013
Deferred tax assets 2,007 3,087 (1,551) 1,338 904 5,785Deferred tax liabilities 6,221 5,358 (25,582) 1,725 335 (11,943)
8,228 8,445 (27,133) 3,063 1,239 (6,158)
The above deferred tax information takes into consideration offsetting balances within the same tax jurisdiction.
Other movements in deferred tax assets and liabilities principally relate to acquisitions, divestments and amounts recognised in othercomprehensive income and directly in equity (see Note 22).
Deferred tax assets that are dependent on future taxable profits, not arising from the reversal of deferred tax liabilities, are only recognised to theextent that it is considered probable based on business forecasts that such profits will be available. Recognised losses carried forward amountedto $37,388 million at December 31, 2014 (2013: $38,448 million).
Unrecognised deductible temporary differences, unused tax losses and credits carried forward amounted to $25,145 million at December 31,2014 (2013: $17,036 million) including amounts of $21,344 million (2013: $16,576 million) that are subject to time limits for utilisation offive years or later or are not time limited.
Retained earnings of subsidiaries, joint ventures and associates amounted to $201,960 million at December 31, 2014 (2013:$184,625 million). Provision has been made for withholding and other taxes that would become payable on the distribution of these earningsonly to the extent that either Shell does not control the relevant entity or it is expected that these earnings will be remitted in the foreseeable future.

FINANCIAL STATEMENTS AND SUPPLEMENTS 129
SHELL ANNUAL REPORT AND FORM 20-F 2014 CONSOLIDATED FINANCIAL STATEMENTS
17 RETIREMENT BENEFITSRetirement benefits are provided through a number of funded and unfunded defined benefit plans and defined contribution plans, the mostsignificant of which are in the Netherlands, UK and USA. Benefits comprise principally pensions; retirement healthcare and life insurance are alsoprovided in some countries.
RETIREMENT BENEFIT EXPENSE $ MILLION2014 2013 2012
Defined benefit plans:Current service cost, net of plan participants’ contributions 1,844 1,895 1,558Interest expense on defined benefit obligations 3,821 3,574 3,303Interest income on plan assets (3,524) (3,030) (2,893)Other (1,073) (6) (73)
Total 1,068 2,433 1,895Defined contribution plans 448 416 384Total retirement benefit expense 1,516 2,849 2,279
Other in 2014 mainly comprises the impact of amendments to the Dutch pension plan following regulatory changes in the Netherlands, which isreflected in other movements in defined benefit obligations.
Retirement benefit expense is presented principally within production and manufacturing expenses and selling, distribution and administrativeexpenses in the Consolidated Statement of Income. Interest income on plan assets is calculated using the rate applied to the related definedbenefit obligations for each plan.
REMEASUREMENTS $ MILLION2014 2013 2012
Actuarial gains/(losses) on defined benefit obligations:Due to changes in demographic assumptions (663) (261) (167)Due to changes in financial assumptions (14,313) 1,446 (8,362)Due to experience adjustments 135 (111) (250)
Total (14,841) 1,074 (8,779)Return on plan assets in excess of interest income 6,139 4,567 5,445Other movements (18) (284) –Total remeasurements (8,720) 5,357 (3,334)
Experience adjustments arise from differences between the actuarial assumptions made in respect of the year and actual outcomes.
DEFINED BENEFIT PLANS $ MILLIONDec 31, 2014 Dec 31, 2013
Obligations (101,331) (93,533)Plan assets 86,318 85,543Net liability (15,013) (7,990)Retirement benefits in the Consolidated Balance Sheet:
Non-current assets 1,682 3,574Non-current liabilities (16,318) (11,182)Current liabilities (377) (382)
Total (15,013) (7,990)
DEFINED BENEFIT OBLIGATIONS $ MILLION, EXCEPT WHERE OTHERWISE INDICATED2014 2013
At January 1 93,533 86,326Current service cost 1,844 1,895Interest expense 3,821 3,574Actuarial losses/(gains) 14,841 (1,074)Benefit payments (3,730) (3,610)Other movements (1,315) 4,614Currency translation differences (7,663) 1,808At December 31 101,331 93,533Comprising:
Funded pension plans 91,800 84,795Weighted average duration 18 years 17 years
Unfunded pension plans 5,016 4,357Weighted average duration 12 years 11 years
Other unfunded plans 4,515 4,381Weighted average duration 15 years 13 years

130 FINANCIAL STATEMENTS AND SUPPLEMENTS
CONSOLIDATED FINANCIAL STATEMENTS SHELL ANNUAL REPORT AND FORM 20-F 2014
[Note 17 continued]
DEFINED BENEFIT PLAN ASSETS $ MILLION, EXCEPT WHERE OTHERWISE INDICATED2014 2013
At January 1 85,543 72,935Return on plan assets (in excess of interest income) 6,139 4,567Interest income 3,524 3,030Employer contributions 1,833 2,578Plan participants’ contributions 95 91Benefit payments (3,487) (3,403)Other movements (344) 3,917Currency translation differences (6,985) 1,828At December 31 86,318 85,543Comprising:
Quoted in active markets:Equities 42% 39%Debt securities 40% 36%Other 1% 1%
Other:Equities 6% 6%Debt securities 2% 2%Real estate 4% 4%Investment funds 3% 9%Other 1% 2%
Cash 1% 1%
Other movements in the defined benefit obligations and defined benefit plan assets during 2013 principally reflected the impact of the first-timeinclusion of a number of individually immaterial plans, which were excluded prior to the adoption on January 1, 2013, of revised IAS 19Employee Benefits.
Long-term investment strategies of plans are generally determined by the relevant pension plan trustees using a structured asset liability modellingapproach to define the asset mix that best meets the objectives of optimising returns within agreed risk levels while maintaining adequate fundinglevels.
Employer contributions to defined benefit pension plans are set by local trustees based on actuarial valuations in accordance with localregulations and are estimated to be $2 billion in 2015.
The principal assumptions applied in determining the present value of defined benefit obligations and their bases were as follows:
� rates of increase in pensionable remuneration, pensions in payment and healthcare costs: historical experience and management’s long-termexpectation;
� discount rates: prevailing long-term AA corporate bond yields, chosen to match the currency and duration of the relevant obligation; and� mortality rates: published standard mortality tables for the individual countries concerned adjusted for Shell experience where statistically
significant.
The weighted averages for those assumptions and related sensitivity information at December 31 are presented below. Sensitivity informationindicates by how much the defined benefit obligations would increase or decrease if a given assumption were to increase or decrease with nochange in other assumptions.
$ MILLION, EXCEPT WHERE OTHERWISE INDICATEDEffect of using alternative assumptions
Assumptions used Increase/(decrease) in defined benefit obligations2014 2013 Range of assumptions 2014 2013
Rate of increase in pensionable remuneration 5% 5% -1% to +1% (2,633) to 3,250 (2,470) to 2,847Rate of increase in pensions in payment 2% 2% -1% to +1% (9,173) to 11,495 (7,703) to 9,312Rate of increase in healthcare costs 7% 7% -1% to +1% (480) to 591 (435) to 550Discount rate for pension plans 3% 4% -1% to +1% 17,816 to (13,674) 14,729 to (11,517)Discount rate for healthcare plans 4% 5% -1% to +1% 723 to (571) 650 to (520)Expected age at death for persons aged 60:
Men 87 years 87 years -1 year to +1 year (2,018) to 2,048 (1,764) to 1,773Women 89 years 89 years -1 year to +1 year (1,258) to 1,297 (1,076) to 1,095

FINANCIAL STATEMENTS AND SUPPLEMENTS 131
SHELL ANNUAL REPORT AND FORM 20-F 2014 CONSOLIDATED FINANCIAL STATEMENTS
18 DECOMMISSIONING AND OTHER PROVISIONS
$ MILLIONDecommissioning
and restoration Environmental Litigation Other Total
At January 1, 2014Current 1,340 362 126 1,419 3,247Non-current 17,085 979 417 1,217 19,698
18,425 1,341 543 2,636 22,945
Additional provisions 312 285 303 2,358 3,258Amounts charged against provisions (1,175) (209) (139) (829) (2,352)Accretion expense 971 26 16 26 1,039Remeasurements and other movements 4,093 (27) (49) (132) 3,885Currency translation differences (739) (52) (27) (157) (975)
3,462 23 104 1,266 4,855At December 31, 2014
Current 1,275 348 309 2,034 3,966Non-current 20,612 1,016 338 1,868 23,834
21,887 1,364 647 3,902 27,800At January 1, 2013
Current 1,356 366 390 1,109 3,221Non-current 14,715 1,032 307 1,381 17,435
16,071 1,398 697 2,490 20,656
Additional provisions 446 191 148 617 1,402Amounts charged against provisions (1,115) (272) (279) (575) (2,241)Accretion expense 929 20 10 33 992Remeasurements and other movements 2,118 27 (17) 70 2,198Currency translation differences (24) (23) (16) 1 (62)
2,354 (57) (154) 146 2,289At December 31, 2013
Current 1,340 362 126 1,419 3,247Non-current 17,085 979 417 1,217 19,698
18,425 1,341 543 2,636 22,945
The amount and timing of settlement in respect of these provisions are uncertain and dependent on various factors that are not always withinmanagement’s control. Additional provisions are stated net of reversals of provisions recognised in previous periods.
Of the decommissioning and restoration provision at December 31, 2014, an estimated $5,304 million is expected to be utilised within one tofive years, $6,147 million within six to 10 years, and the remainder in later periods.
Reviews of estimated decommissioning and restoration costs and the discount rate applied are carried out annually, which in 2014 resulted in anincrease of $4,827 million (2013: $1,426 million) in both the provision, reported within remeasurements and other movements, and thecorresponding property, plant and equipment assets reported within sales, retirements and other movements in Note 8.
Provisions for environmental costs relate to a number of events in different locations, none of which is individually significant.
Provisions for litigation costs at December 31, 2014, relate to a number of cases, none of which is individually significant. Further information ispresented in Note 25.
Other provisions principally comprise amounts recognised in respect of employee in- and end-of-service benefits, onerous contracts related todivestments and redundancy costs.
19 FINANCIAL INSTRUMENTS AND OTHER DERIVATIVE CONTRACTSFinancial instruments and other derivative contracts in the Consolidated Balance Sheet comprise investments in securities (see Note 10), cash andcash equivalents (see Note 13), debt (see Note 14) and certain amounts (including derivative contracts) reported within trade and otherreceivables (see Note 11) and trade and other payables (see Note 15).
RisksIn the normal course of business, financial instruments of various kinds are used for the purposes of managing exposure to interest rate, currencyand commodity price movements.

132 FINANCIAL STATEMENTS AND SUPPLEMENTS
CONSOLIDATED FINANCIAL STATEMENTS SHELL ANNUAL REPORT AND FORM 20-F 2014
[Note 19 continued]
Treasury standards are applicable to all subsidiaries and each subsidiary is required to adopt a treasury policy consistent with these standards.These policies cover: financing structure; interest rate and foreign exchange risk management; insurance; counterparty risk management; and useof derivative instruments. Wherever possible, treasury operations are carried out through specialist regional organisations without removing fromeach subsidiary the responsibility to formulate and implement appropriate treasury policies.
Apart from forward foreign exchange contracts to meet known commitments, the use of derivative financial instruments by most subsidiaries is notpermitted by their treasury policy.
Other than in exceptional cases, the use of external derivative instruments is confined to specialist trading and central treasury organisations thathave appropriate skills, experience, supervision, control and reporting systems.
Shell’s operations expose it to market, credit and liquidity risk, as described below.
MARKET RISKMarket risk is the possibility that changes in interest rates, currency exchange rates or the prices of crude oil, natural gas, LNG, refined products,chemical feedstocks, power and environmental products will adversely affect the value of assets, liabilities or expected future cash flows.
Interest rate riskMost debt is raised from central borrowing programmes. Shell’s policy continues to be to have debt principally denominated in dollars and tomaintain a largely floating interest rate exposure profile, however, the majority of the debt issued in recent years has been at fixed rates, takingadvantage of historically low interest rates available in the US debt markets. As a result the majority of the debt portfolio at December 31, 2014,is at fixed rates and this reduces Shell’s exposure to the dollar LIBOR interest rate, although it remains the most significant interest rate exposure.
The financing of most subsidiaries is structured on a floating-rate basis and, except in special cases, further interest rate risk management isdiscouraged.
On the basis of the floating rate net debt position at December 31, 2014 (both issued and hedged), and assuming other factors (principallyforeign exchange rates and commodity prices) remained constant and that no further interest rate management action was taken, an increase ininterest rates of 1% would increase pre-tax income by $17 million (2013: $87 million decrease).
The carrying amounts and maturities of debt and borrowing facilities are presented in Note 14. Interest expense is presented in Note 6.
Foreign exchange riskMany of the markets in which Shell operates are priced, directly or indirectly, in dollars. As a result, the functional currency of most Upstreamentities and those with significant cross-border business is the dollar. For Downstream entities, the local currency is typically the functionalcurrency. Consequently, Shell is exposed to varying levels of foreign exchange risk when an entity enters into transactions that are notdenominated in its functional currency, when foreign currency monetary assets and liabilities are translated at the balance sheet date and as aresult of holding net investments in operations that are not dollar-functional. The main currencies to which Shell is exposed are the Canadiandollar, euro, sterling and Malaysian ringgit. Each entity has treasury policies in place that are designed to measure and manage its foreignexchange exposures by reference to its functional currency.
Exchange rate gains and losses arise in the normal course of business from the recognition of receivables and payables and other monetary itemsin currencies other than an entity’s functional currency. Currency exchange risk may also arise in connection with capital expenditure. For majorprojects, an assessment is made at the final investment decision stage whether to hedge any resulting exposure.
Hedging of net investments in foreign operations or of income that arises in foreign operations that are non-dollar functional is not undertaken.
Assuming other factors (principally interest rates and commodity prices) remained constant and that no further foreign exchange risk managementaction were taken, a 10% appreciation against the dollar at December 31 of the main currencies to which Shell is exposed would have thefollowing pre-tax effects:
$ MILLIONIncrease/(decrease) in income Increase in net assets
2014 2013 2014 201310% appreciation against the dollar of:
Canadian dollar (111) (55) 1,709 1,853Euro 103 241 917 1,464Sterling (103) (176) 887 1,023Malaysian ringgit 288 225 263 263
The above sensitivity information is calculated by reference to carrying amounts of assets and liabilities at December 31 only. The pre-tax effecton income arises in connection with monetary balances denominated in currencies other than an entity’s functional currency; the pre-tax effect onnet assets arises principally from the translation of assets and liabilities of entities that are not dollar-functional.
Foreign exchange gains and losses arising from foreign currency transactions included in income are presented in Note 5.

FINANCIAL STATEMENTS AND SUPPLEMENTS 133
SHELL ANNUAL REPORT AND FORM 20-F 2014 CONSOLIDATED FINANCIAL STATEMENTS
Price riskCertain subsidiaries have a mandate to trade crude oil, natural gas, LNG, refined products, chemical feedstocks, power and environmentalproducts, and to use commodity derivatives (forwards, futures, swaps and options) as a means of managing price and timing risks arising fromthis trading. In effecting these transactions, the entities concerned operate within procedures and policies designed to ensure that risks, includingthose relating to the default of counterparties, are managed within authorised limits.
Risk management systems are used for recording and valuing instruments. Price risk exposure is monitored, and the acceptable level of exposuredetermined, by a market risk committee. There is regular reviewing of mandated trading limits by senior management, daily monitoring of marketrisk exposure using value-at-risk (VAR) techniques, daily monitoring of trading positions against limits, marking-to-fair value of trading exposureswith a department independent of traders reviewing the market values applied. Although trading losses can and do occur, the nature of thetrading portfolio and its management are considered adequate mitigants against the risk of significant losses.
VAR techniques based on variance/covariance or Monte Carlo simulation models are used to make a statistical assessment of the market riskarising from possible future changes in market values over a 24-hour period and within a 95% confidence level. The calculation of the range ofpotential changes in fair value takes into account positions, the history of price movements and the correlation of these price movements. Each ofthe models is regularly back-tested against actual fair value movements to ensure model integrity is maintained. With effect from 2014, the VARcalculation for North America gas and power has been updated to better reflect the exposure to market risks; 2013 data is presented on acomparable basis. All VAR ranges and year-end positions in respect of commodities traded in active markets, which are presented in the tablebelow, are calculated on a diversified basis in order to reflect the effect of offsetting risk within combined portfolios.
VALUE-AT-RISK (PRE-TAX) $ MILLION2014 2013
High Low Average Year-end High Low Average Year-end
Global oil 23 9 15 14 29 10 16 16North America gas and power 16 2 7 13 12 2 5 2Europe gas and power 7 1 2 3 4 – 2 1
CREDIT RISKPolicies are in place to ensure that wholesale sales of products are made to customers with appropriate creditworthiness. These policies includedetailed credit analysis and monitoring of trading partners and restricting large-volume trading activities to the highest-rated counterparties. Creditinformation is regularly shared between business and finance functions, with dedicated teams in place to quickly identify and respond to cases ofcredit deterioration. Mitigation measures are defined and implemented for high-risk business partners and customers, and include shortenedpayment terms, collateral or other security posting and vigorous collections. In addition, policies limit the amount of credit exposure to anyindividual financial institution. There are no material concentrations of credit risk, with individual customers or geographically, and there has beenno significant level of counterparty default in recent years.
Surplus cash is invested in a range of short-dated, secure and liquid instruments including short-term bank deposits, money market funds, reverserepos and similar instruments. The portfolio of these investments is diversified to avoid concentrating risk in any one instrument, country orcounterparty. Management monitors the investments regularly and adjusts the investment portfolio in light of new market information wherenecessary to ensure credit risk is effectively diversified.
In commodity trading, counterparty credit risk is managed within a framework of credit limits with utilisation being regularly reviewed. Credit riskexposure is monitored and the acceptable level is determined by a credit committee. Credit checks are performed by a department independentof traders, and are undertaken before contractual commitment. Where appropriate, netting arrangements, credit insurance, prepayments andcollateral are used to manage specific risks.
Shell routinely enters into offsetting, master netting and similar arrangements with trading and other counterparties to manage credit risk. Whereunconditional offsetting of outstanding balances is allowed under such arrangements and net settlement is regularly applied, the net asset orliability is recognised in the Consolidated Balance Sheet, otherwise assets and liabilities are presented gross. These amounts, as presented netand gross within trade and other receivables and trade and other payables in the Consolidated Balance Sheet at December 31, were as follows:
2014 $ MILLIONAmounts offset Amounts not offset
Net amountsGross amounts
before offsetAmounts
offsetNet amountsas presented
Cash collateralreceived/pledged
Other offsettinginstruments
Assets:Within trade receivables 13,964 8,982 4,982 6 119 4,857Within derivative contracts 38,151 27,437 10,714 209 7,065 3,440
Liabilities:Within trade payables 12,290 8,941 3,349 – 124 3,225Within derivative contracts 35,623 26,577 9,046 158 7,036 1,852

134 FINANCIAL STATEMENTS AND SUPPLEMENTS
CONSOLIDATED FINANCIAL STATEMENTS SHELL ANNUAL REPORT AND FORM 20-F 2014
[Note 19 continued]
2013 $ MILLIONAmounts offset Amounts not offset
Net amounts[A]Gross amounts
before offset[A]Amounts
offsetNet amountsas presented[A]
Cash collateralreceived/pledged
Other offsettinginstruments
Assets:Within trade receivables 15,109 10,557 4,552 – 344 4,208Within derivative contracts 21,166 14,866 6,300 239 3,360 2,701
Liabilities:Within trade payables 14,541 10,526 4,015 – 349 3,666Within derivative contracts 20,341 15,082 5,259 327 3,360 1,572
[A] Revised following a reassessment of contracts.
Amounts not offset principally relate to contracts where the intention to settle on a net basis was not clearly established at the balance sheet date.
The carrying amount of financial assets pledged as collateral for liabilities or contingent liabilities at December 31, 2014, and presented withintrade and other receivables, was $1,726 million (2013: $717 million). The carrying amount of collateral held at December 31, 2014, andpresented within trade and other payables, was $771 million (2013: $173 million). Collateral mainly relates to initial margins held withcommodity exchanges and over-the-counter counterparty variation margins.
LIQUIDITY RISKLiquidity risk is the risk that suitable sources of funding for Shell’s business activities may not be available. Management believes that it has accessto sufficient debt funding sources (capital markets), and to undrawn committed borrowing facilities to meet foreseeable requirements. Informationabout borrowing facilities is presented in Note 14.
Derivative contractsDerivative contracts are used principally as hedging instruments, however, because hedge accounting is not always applied, movements in thecarrying amounts of derivative contracts that are recognised in income are not always matched in the same period by the recognition of theincome effects of the related hedged items.
CARRYING AMOUNTS, MATURITIES AND HEDGINGThe carrying amounts of derivative contracts at December 31 (see Notes 11 and 15), designated and not designated as hedging instruments forhedge accounting purposes, were as follows:
2014 $ MILLIONAssets Liabilities
DesignatedNot
designated Total DesignatedNot
designated Total NetInterest rate swaps 113 – 113 – – – 113Forward foreign exchange contracts 3 523 526 152 229 381 145Currency swaps 116 186 302 199 – 199 103Commodity derivatives – 13,463 13,463 – 11,110 11,110 2,353Other contracts – 336 336 – 384 384 (48)Total 232 14,508 14,740 351 11,723 12,074 2,666
2013 $ MILLIONAssets Liabilities
DesignatedNot
designated Total DesignatedNot
designated Total NetInterest rate swaps 222 – 222 – – – 222Forward foreign exchange contracts 47 283 330 12 127 139 191Currency swaps 1,112 141 1,253 14 2 16 1,237Commodity derivatives – 6,014 6,014 – 6,206 6,206 (192)Other contracts – 398 398 – 700 700 (302)Total 1,381 6,836 8,217 26 7,035 7,061 1,156
Net gains before tax on derivative contracts, excluding realised commodity contracts and those accounted for as hedges, were $6,053 million in2014 (2013: $1,083 million as revised; 2012: $904 million net losses).
Certain contracts entered into to hedge price risk relating to forecast commodity transactions and foreign exchange risk relating to forecast capitalexpenditure were designated in cash flow hedging relationships. The net asset carrying amount of commodity derivative contracts designated ascash flow hedging instruments of $618 million at December 31, 2014 (2013: $66 million net liability), is presented after the offset of related

FINANCIAL STATEMENTS AND SUPPLEMENTS 135
SHELL ANNUAL REPORT AND FORM 20-F 2014 CONSOLIDATED FINANCIAL STATEMENTS
margin balances maintained with exchanges. Net gains of $576 million (2013: $36 million net losses) arising on these contracts, the majority ofwhich mature within three years, were recognised in other comprehensive income in 2014; a further $13 million net gains (2013: $6 million netlosses) were recognised in income.
Certain interest rate and currency swaps were designated in fair value hedges, principally in respect of debt for which the carrying amount of therelated derivatives, net of accrued interest, at December 31, 2014, was a net liability of $203 million (2013: net asset of $1,074 million).
In the course of trading operations, certain contracts are entered into for delivery of commodities that are accounted for as derivatives. Theresulting price exposures are managed by entering into related derivative contracts. These contracts are managed on a fair value basis and themaximum exposure to liquidity risk is the undiscounted fair value of derivative liabilities.
For a minority of commodity derivatives, carrying amounts cannot be derived from quoted market prices or other observable inputs, in which casefair value is estimated using valuation techniques such as Black-Scholes, option spread models and extrapolation using quoted spreads withassumptions developed internally based on observable market activity.
Other contracts include certain contracts that are held to sell or purchase commodities and others containing embedded derivatives, which arerequired to be recognised at fair value because of pricing or delivery conditions, even though they are only entered into to meet operationalrequirements. These contracts are expected to mature between 2015 and 2025, with certain contracts having early termination rights (for eitherparty). Valuations are derived from quoted market prices for the next six years; thereafter, from forward gas price formulae used in similarcontracts. Future gas price assumptions are the most significant input to this model, such that a decrease at December 31, 2014, of 10% in theprojected gas price would, assuming other inputs remained unchanged, increase pre-tax income by $83 million (2013: $181 million).
The contractual maturities of derivative liabilities at December 31 compare with their carrying amounts in the Consolidated Balance Sheet asfollows:
2014 $ MILLIONContractual maturities
Lessthan
1 year
Between1 and 2
years
Between2 and 3
years
Between3 and 4
years
Between4 and 5
years5 years
and later Total DiscountingCarrying
amountForward foreign exchange
contracts 362 34 4 – – – 400 (19) 381Currency swaps (6) 20 71 97 129 877 1,188 (989) 199Commodity derivatives 9,332 1,215 321 106 58 126 11,158 (48) 11,110Other contracts 99 105 105 104 59 – 472 (88) 384Total 9,787 1,374 501 307 246 1,003 13,218 (1,144) 12,074
2013 $ MILLIONContractual maturities
Lessthan
1 year
Between1 and 2
years
Between2 and 3
years
Between3 and 4
years
Between4 and 5
years5 years
and later Total DiscountingCarrying
amountForward foreign exchange
contracts 105 33 2 – – – 140 (1) 139Currency swaps 1 – – – 6 28 35 (19) 16Commodity derivatives 4,378 1,294 326 119 49 79 6,245 (39) 6,206Other contracts 173 168 160 154 148 83 886 (186) 700Total 4,657 1,495 488 273 203 190 7,306 (245) 7,061
FAIR VALUE MEASUREMENTSThe net carrying amounts of derivative contracts held at December 31, categorised according to the predominant source and nature of inputsused in determining the fair value of each contract, were as follows:
2014 $ MILLIONPrices in active markets
for identicalassets/liabilities
Otherobservable
inputsUnobservable
inputs TotalInterest rate swaps – 113 – 113Forward foreign exchange contracts – 145 – 145Currency swaps – 103 – 103Commodity derivatives (6) 2,410 (51) 2,353Other contracts 6 (359) 305 (48)Total – 2,412 254 2,666

136 FINANCIAL STATEMENTS AND SUPPLEMENTS
CONSOLIDATED FINANCIAL STATEMENTS SHELL ANNUAL REPORT AND FORM 20-F 2014
[Note 19 continued]
2013 $ MILLIONPrices in active markets
for identicalassets/liabilities
Otherobservable
inputsUnobservable
inputs TotalInterest rate swaps – 222 – 222Forward foreign exchange contracts – 191 – 191Currency swaps – 1,237 – 1,237Commodity derivatives (9) (280) 97 (192)Other contracts 35 36 (373) (302)Total 26 1,406 (276) 1,156
NET CARRYING AMOUNTS OF DERIVATIVE CONTRACTS MEASURED USING PREDOMINANTLYUNOBSERVABLE INPUTS $ MILLION
2014 2013At January 1 (276) (219)Net losses recognised in revenue (76) (142)Purchases (313) (34)Sales 264 (14)Recategorisations (net) 687 133Currency translation differences (32) –At December 31 254 (276)
Included in net losses recognised in revenue for 2014 are unrealised net losses totalling $158 million relating to assets and liabilities held atDecember 31, 2014 (2013: $40 million net gains).
20 SHARE CAPITAL
ISSUED AND FULLY PAID NUMBER OF SHARESOrdinary shares of €0.07 each Sterling deferred
shares of £1 eachA BAt January 1, 2014 3,898,011,213 2,472,839,187 50,000Scrip dividends 64,568,758 – –Repurchases of shares (55,277,578) (32,428,573) –At December 31, 2014 3,907,302,393 2,440,410,614 50,000At January 1, 2013 3,772,388,687 2,617,715,189 50,000Scrip dividends 125,622,526 – –Repurchases of shares – (144,876,002) –At December 31, 2013 3,898,011,213 2,472,839,187 50,000
NOMINAL VALUE $ MILLIONOrdinary shares of €0.07 each
TotalA BAt January 1, 2014 333 209 542Scrip dividends 6 – 6Repurchases of shares (5) (3) (8)At December 31, 2014 334 206 540At January 1, 2013 321 221 542Scrip dividends 12 – 12Repurchases of shares – (12) (12)At December 31, 2013 333 209 542
The total nominal value of sterling deferred shares is less than $1 million.
At the Company’s Annual General Meeting (AGM) on May 20, 2014, the Board was authorised to allot ordinary shares in the Company, and togrant rights to subscribe for or to convert any security into ordinary shares in the Company, up to an aggregate nominal amount of €147 million(representing 2,100 million ordinary shares of €0.07 each), and to list such shares or rights on any stock exchange. This authority expires at theearlier of the close of business on August 20, 2015, and the end of the AGM to be held in 2015, unless previously renewed, revoked or variedby the Company in a general meeting.

FINANCIAL STATEMENTS AND SUPPLEMENTS 137
SHELL ANNUAL REPORT AND FORM 20-F 2014 CONSOLIDATED FINANCIAL STATEMENTS
21 SHARE-BASED COMPENSATION PLANS AND SHARES HELD IN TRUST
SHARE-BASED COMPENSATION EXPENSE $ MILLION2014 2013 2012
Equity-settled plans 517 549 798Cash-settled plans 287 23 111Total 804 572 909
The principal share-based employee compensation plan is the PSP. Awards of shares and American Depository Shares (ADSs) of the Companyunder the PSP are granted upon certain conditions to eligible employees who are not members of the Executive Committee. The actual amount ofshares that may vest ranges from 0% to 200% of the awards, depending on the outcomes of prescribed performance conditions over a three-yearperiod beginning on January 1 of the award year. Shares and ADSs vest for nil consideration.
SHARE AWARDS UNDER THE PSP
Number of A shares(million)
Number of B shares(million)
Number of A ADSs(million)
Weighted averageremaining contractual
life (years)At January 1, 2014 30 11 9 1.0Granted 12 4 3Vested (9) (4) (3)At December 31, 2014 33 11 9 1.0At January 1, 2013 27 10 9 1.1Granted 11 4 3Vested (8) (3) (3)At December 31, 2013 30 11 9 1.0
Other plans offer employees opportunities to acquire shares and ADSs of the Company or receive cash benefits measured by reference to theCompany’s share price. Prior to the introduction in 2005 of the PSP, plans were operated under which options over shares and ADSs of theCompany were awarded to eligible employees. The options have a range of expiry dates until 2016 and no additional expense to Shell arisesin connection with them.
Shell employee share ownership trusts and trust-like entities purchase the Company’s shares in the open market to meet delivery commitmentsunder employee share plans. At December 31, 2014, they held 23.4 million A shares (2013: 37.2 million), 12.7 million B shares (2013: 15.8million) and 8.3 million A ADSs (2013: 11.2 million).
22 OTHER RESERVES
$ MILLION
Mergerreserve
Sharepremium
reserve
Capitalredemption
reserveShare plan
reserve
Accumulatedother
comprehensiveincome Total
At January 1, 2014 3,411 154 75 1,871 (7,548) (2,037)Other comprehensive loss attributable to Royal Dutch
Shell plc shareholders – – – – (12,182) (12,182)Scrip dividends (6) – – – – (6)Repurchases of shares – – 8 – – 8Share-based compensation – – – (148) – (148)At December 31, 2014 3,405 154 83 1,723 (19,730) (14,365)At January 1, 2013 3,423 154 63 2,028 (9,420) (3,752)Other comprehensive income attributable to Royal Dutch
Shell plc shareholders – – – – 1,872 1,872Scrip dividends (12) – – – – (12)Repurchases of shares – – 12 – – 12Share-based compensation – – – (157) – (157)At December 31, 2013 3,411 154 75 1,871 (7,548) (2,037)At January 1, 2012 3,432 154 60 1,571 (7,178) (1,961)Other comprehensive loss attributable to Royal Dutch
Shell plc shareholders – – – – (2,242) (2,242)Scrip dividends (9) – – – – (9)Repurchases of shares – – 3 – – 3Share-based compensation – – – 457 – 457At December 31, 2012 3,423 154 63 2,028 (9,420) (3,752)

138 FINANCIAL STATEMENTS AND SUPPLEMENTS
CONSOLIDATED FINANCIAL STATEMENTS SHELL ANNUAL REPORT AND FORM 20-F 2014
[Note 22 continued]
The merger reserve and share premium reserve were established as a consequence of the Company becoming the single parent company ofRoyal Dutch Petroleum Company and The “Shell” Transport and Trading Company, p.l.c., now The Shell Transport and Trading CompanyLimited, in 2005. The capital redemption reserve was established in connection with repurchases of shares of the Company. The share planreserve is maintained in respect of equity-settled share-based compensation plans (see Note 21); related current and deferred taxation reflecteddirectly within equity increased by $5 million in 2014 (2013: $5 million decrease; 2012: $7 million decrease).
Accumulated other comprehensive income comprises the following:
2014 $ MILLIONRecognised in 2014
Jan 1 Pre-tax Tax After tax
Share ofjoint ventures
andassociates
Non-controlling
interest
Attributable toRoyal Dutch
Shell plcshareholders Dec 31
Currency translation differencesRecognised in the year (4,832) (5) (4,837)Reclassified to income (484) – (484)
Net currency translation differences (551) (5,316) (5) (5,321) (112) 53 (5,380) (5,931)Unrealised gains/(losses) on securities
Recognised in the year (741) (12) (753)Reclassified to income (44) – (44)
Net unrealised gains/(losses) on securities 2,929 (785) (12) (797) (20) – (817) 2,112Cash flow hedging gains/(losses)
Recognised in the year 606 (23) 583Reclassified to income (56) 1 (55)
Net cash flow hedging gains/(losses) (46) 550 (22) 528 (24) – 504 458Retirement benefits remeasurements (9,880) (8,720) 2,238 (6,482) – (7) (6,489) (16,369)Total (7,548) (14,271) 2,199 (12,072) (156) 46 (12,182) (19,730)
2013 $ MILLIONRecognised in 2013
Jan 1 Pre-tax TaxAfter
tax
Share ofjoint ventures
andassociates
Non-controlling
interest
Attributable toRoyal Dutch
Shell plcshareholders Dec 31
Currency translation differencesRecognised in the year (2,031) 123 (1,908)Reclassified to income (30) – (30)
Net currency translation differences 1,466 (2,061) 123 (1,938) (210) 131 (2,017) (551)Unrealised gains/(losses) on securities
Recognised in the year (123) 3 (120)Reclassified to income (46) – (46)
Net unrealised gains/(losses) on securities 3,075 (169) 3 (166) 19 1 (146) 2,929Cash flow hedging gains/(losses)
Recognised in the year (47) 5 (42)Reclassified to income 227 (7) 220
Net cash flow hedging gains/(losses) (248) 180 (2) 178 24 – 202 (46)Retirement benefits remeasurements (13,713) 5,357 (1,524) 3,833 – – 3,833 (9,880)Total (9,420) 3,307 (1,400) 1,907 (167) 132 1,872 (7,548)
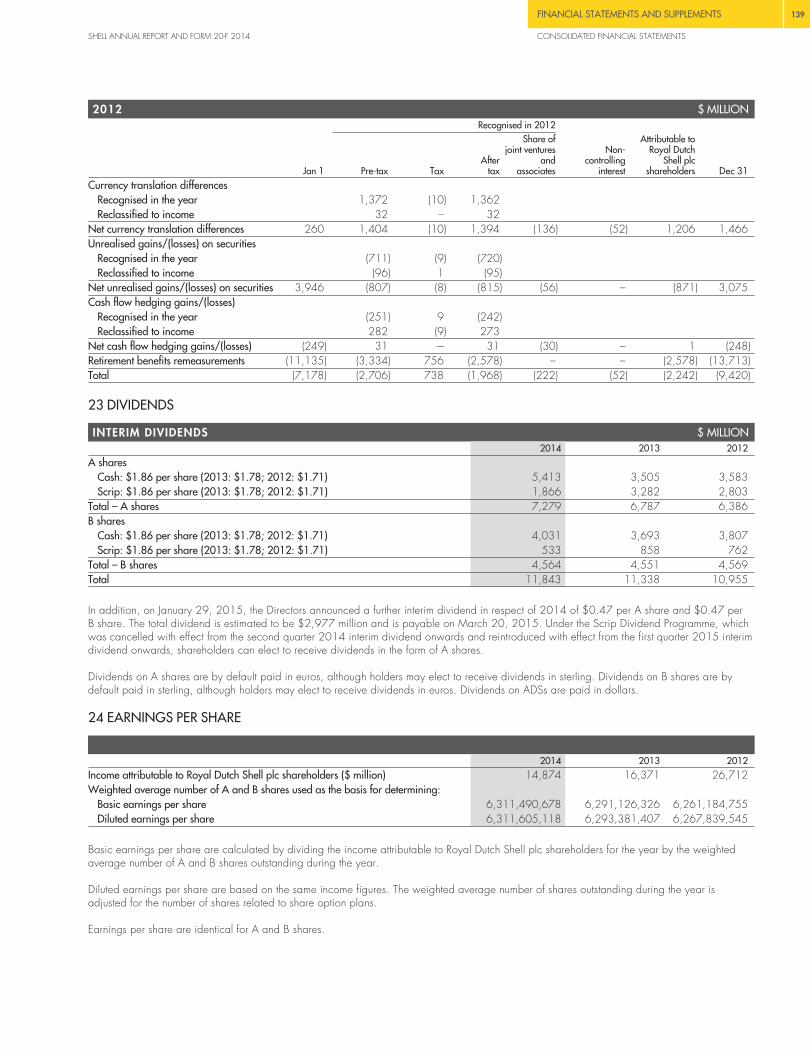
FINANCIAL STATEMENTS AND SUPPLEMENTS 139
SHELL ANNUAL REPORT AND FORM 20-F 2014 CONSOLIDATED FINANCIAL STATEMENTS
2012 $ MILLIONRecognised in 2012
Jan 1 Pre-tax TaxAfter
tax
Share ofjoint ventures
andassociates
Non-controlling
interest
Attributable toRoyal Dutch
Shell plcshareholders Dec 31
Currency translation differencesRecognised in the year 1,372 (10) 1,362Reclassified to income 32 – 32
Net currency translation differences 260 1,404 (10) 1,394 (136) (52) 1,206 1,466Unrealised gains/(losses) on securities
Recognised in the year (711) (9) (720)Reclassified to income (96) 1 (95)
Net unrealised gains/(losses) on securities 3,946 (807) (8) (815) (56) – (871) 3,075Cash flow hedging gains/(losses)
Recognised in the year (251) 9 (242)Reclassified to income 282 (9) 273
Net cash flow hedging gains/(losses) (249) 31 -– 31 (30) – 1 (248)Retirement benefits remeasurements (11,135) (3,334) 756 (2,578) – – (2,578) (13,713)Total (7,178) (2,706) 738 (1,968) (222) (52) (2,242) (9,420)
23 DIVIDENDS
INTERIM DIVIDENDS $ MILLION2014 2013 2012
A sharesCash: $1.86 per share (2013: $1.78; 2012: $1.71) 5,413 3,505 3,583Scrip: $1.86 per share (2013: $1.78; 2012: $1.71) 1,866 3,282 2,803
Total – A shares 7,279 6,787 6,386B shares
Cash: $1.86 per share (2013: $1.78; 2012: $1.71) 4,031 3,693 3,807Scrip: $1.86 per share (2013: $1.78; 2012: $1.71) 533 858 762
Total – B shares 4,564 4,551 4,569Total 11,843 11,338 10,955
In addition, on January 29, 2015, the Directors announced a further interim dividend in respect of 2014 of $0.47 per A share and $0.47 perB share. The total dividend is estimated to be $2,977 million and is payable on March 20, 2015. Under the Scrip Dividend Programme, whichwas cancelled with effect from the second quarter 2014 interim dividend onwards and reintroduced with effect from the first quarter 2015 interimdividend onwards, shareholders can elect to receive dividends in the form of A shares.
Dividends on A shares are by default paid in euros, although holders may elect to receive dividends in sterling. Dividends on B shares are bydefault paid in sterling, although holders may elect to receive dividends in euros. Dividends on ADSs are paid in dollars.
24 EARNINGS PER SHARE
2014 2013 2012Income attributable to Royal Dutch Shell plc shareholders ($ million) 14,874 16,371 26,712Weighted average number of A and B shares used as the basis for determining:
Basic earnings per share 6,311,490,678 6,291,126,326 6,261,184,755Diluted earnings per share 6,311,605,118 6,293,381,407 6,267,839,545
Basic earnings per share are calculated by dividing the income attributable to Royal Dutch Shell plc shareholders for the year by the weightedaverage number of A and B shares outstanding during the year.
Diluted earnings per share are based on the same income figures. The weighted average number of shares outstanding during the year isadjusted for the number of shares related to share option plans.
Earnings per share are identical for A and B shares.

140 FINANCIAL STATEMENTS AND SUPPLEMENTS
CONSOLIDATED FINANCIAL STATEMENTS SHELL ANNUAL REPORT AND FORM 20-F 2014
25 LEGAL PROCEEDINGS AND OTHER CONTINGENCIES
Pesticide litigationShell Oil Company (SOC), along with other agricultural chemical pesticide manufacturers and distributors, has been sued by public andquasi-public water purveyors alleging responsibility for groundwater contamination caused by applications of chemical pesticides. Most of theselaw suits assert various theories of strict liability and seek to recover actual damages, including water well treatment and remediation costs. All ofthe suits assert claims for punitive damages. There are approximately 30 such cases pending. Based on the claims asserted and SOC’s trackrecord with regard to amounts paid to resolve varying claims, management does not believe the outcome of these matters will have a materialimpact on Shell, however, no assurance can be provided.
Nigerian litigationShell subsidiaries and associates operating in Nigeria are parties to various environmental and contractual disputes. These disputes are atdifferent stages in litigation, including at the appellate stage, where judgements have been rendered against Shell. If taken at face value, theaggregate amount of these judgements would be material however, the management of Shell believes that the outcomes of these matters willultimately be resolved in a manner favourable to Shell. While these matters are not expected to have a material impact on Shell, no assurancecan be provided.
OtherIn the ordinary course of business, Shell subsidiaries are subject to a number of other loss contingencies arising from litigation and claims broughtby governmental and private parties. The operations and earnings of Shell subsidiaries continue, from time to time, to be affected to varyingdegrees by political, legislative, fiscal and regulatory developments, including those relating to the protection of the environment and indigenousgroups in the countries in which they operate. The industries in which Shell subsidiaries are engaged are also subject to physical risks of varioustypes. The nature and frequency of these developments and events, as well as their effect on future operations and earnings, are unpredictable.While these matters are not expected to have a material impact on Shell, no assurance can be provided.
26 EMPLOYEES
EMPLOYEE EXPENSE $ MILLION2014 2013 2012
Remuneration 13,092 12,047 11,133Social security contributions 944 907 789Retirement benefits (see Note 17) 1,516 2,849 2,279Share-based compensation (see Note 21) 804 572 909Total 16,356 16,375 15,110
AVERAGE EMPLOYEE NUMBERS THOUSAND2014 2013 2012
Upstream 33 31 26Downstream 47 48 48Corporate 14 13 13Total 94 92 87
Employees working in business service centres are included in the Corporate segment.
27 DIRECTORS AND SENIOR MANAGEMENT
REMUNERATION OF DIRECTORS OF THE COMPANY $ MILLION2014 2013 2012
Emoluments 24 11 14Gains on exercise of share options – – 4Value of released awards under long-term incentive plans 5 8 37Employer contributions to pension plans 1 1 1
Emoluments comprise salaries and fees, annual bonuses (for the period for which performance is assessed) and other benefits. Emoluments in2014 included $11 million for tax equalisation which arose mainly as a result of the promotion of the CEO. The value of released awards underlong-term incentive plans for the period is in respect of the performance period ending in that year. In 2014, retirement benefits were accrued inrespect of qualifying services under defined benefit plans by two Directors.
In addition to the amounts presented for 2012 were termination and related amounts of $6 million in respect of an Executive Director who stooddown during the year and gains of $3 million which arose on the exercise of share options after standing down.

FINANCIAL STATEMENTS AND SUPPLEMENTS 141
SHELL ANNUAL REPORT AND FORM 20-F 2014 CONSOLIDATED FINANCIAL STATEMENTS
DIRECTORS AND SENIOR MANAGEMENT EXPENSE $ MILLION2014 2013 2012
Short-term benefits 43 24 25Retirement benefits 4 5 5Share-based compensation 18 23 47Total 65 52 77
Directors and Senior Management comprise members of the Executive Committee and the Non-executive Directors of the Company.
Short-term benefits comprise salaries and fees, annual bonuses delivered in cash (for the period for which performance is assessed), other benefitsand employer social security contributions. Short-term benefits in 2014 included tax equalisation as described on the previous page. In addition,costs of $1 million were incurred in 2014 (2013: $6 million; 2012: $8 million) in respect of additional employee levies in the Netherlands.Share-based compensation in 2012 included exceptional costs recognised in respect of an Executive Director who stood down during the year.
In addition to the amounts presented for 2014 were termination and related amounts of $5 million (2013: $nil; 2012: $6 million) in respect ofDirectors and Senior Management who stood down during the year.
28 AUDITOR’S REMUNERATION
$ MILLION2014 2013 2012
Fees in respect of the audit of the Consolidated and Parent Company FinancialStatements, including audit of consolidation returns 5 5 5
Other audit fees, principally in respect of audits of accounts of subsidiaries 45 41 41Total audit fees 50 46 46Audit-related fees (for other services provided pursuant to legislation) 2 1 1Fees in respect of non-audit services (principally for tax compliance) 1 1 1Total 53 48 48
In addition, PricewaterhouseCoopers provides audit services to retirement benefit plans for employees of subsidiaries. Remuneration amounted to$1 million in 2014 (2013: $1 million; 2012: $2 million).
29 ACQUISITION OF REPSOL LNG BUSINESSES OUTSIDE NORTH AMERICAOn January 1, 2014, Shell acquired from Repsol S.A. all the voting rights in Repsol LNG Port Spain B.V., Repsol Comercializadora de Gas,S.A., Repsol LNG T&T Ltd, LNG Shipping Operation Services Netherlands B.V., Netherlands ALNG Holding Company B.V. and Repsol GNLPeru S.A.C., the activities of which comprise LNG operations located in Trinidad and Tobago and Peru, and related shipping and marketing. Theacquisition adds directly-managed LNG volumes to Shell’s existing portfolio. Cash consideration was $4,115 million, of which $3,385 millionwas paid on December 31, 2013 (see Note 11), and $730 million in 2014.
FAIR VALUE OF NET ASSETS ACQUIRED $ MILLIONIntangible assets 3,271Property, plant and equipment 1,198Joint ventures and associates 531Cash and cash equivalents 329Other assets 424Debt (1,601)Other liabilities (37)Consideration paid 4,115

142 FINANCIAL STATEMENTS AND SUPPLEMENTS
SUPPLEMENTARY INFORMATION – OIL AND GAS (UNAUDITED) SHELL ANNUAL REPORT AND FORM 20-F 2014
SUPPLEMENTARY INFORMATION – OIL AND GAS (UNAUDITED)The information set out on pages 142-159 is referred to as “unaudited” as a means of clarifying that it is not covered by the audit opinion of theindependent registered public accounting firm that has audited and reported on the “Consolidated Financial Statements”.
PROVED OIL AND GAS RESERVESProved reserves’ estimates are calculated pursuant to the US Securities and Exchange Commission (SEC) Rules and the Financial AccountingStandard Board’s Topic 932. The definitions used are in accordance with the SEC Rule 4-10 (a) of Regulation S-X.
We include proved reserves associated with future production that will be consumed in operations.
Proved reserves shown are net of any quantities of crude oil or natural gas that are expected to be (or could be) taken as royalties in kind. Provedreserves outside North America include quantities that will be settled in cash. Proved reserves include certain quantities of crude oil or natural gasthat will be produced under arrangements that involve Shell subsidiaries, joint ventures and associates in risks and rewards but do not transfer titleof the product to those entities.
Proved reserves cannot be measured exactly since estimation of reserves involves subjective judgement (see “Risk factors”). These estimates remainsubject to revision and are unaudited supplementary information.
The impact of the reclassification of certain entities, consistent with the change in their accounting treatment as a result of the adoption of IFRS 11Joint Arrangements with effect from January 1, 2013, resulted in a decrease in the Shell share of joint ventures and associates’ proved reservesduring 2013 and a corresponding increase in Shell subsidiaries’ proved reserves. These effects are referred to as “IFRS 11 reclassification” onpages 145,149 and 153.
PROVED RESERVES ASSURANCE PROCESSA central group of reserves experts, who on average have around 26 years’ experience in the oil and gas industry, undertake the primaryassurance of the proved reserves bookings. This group of experts is part of the Resources Assurance and Reporting (RAR) organisation within Shell.A Vice President with 33 years’ experience in the oil and gas industry currently heads the RAR organisation. He is a member of the Society ofPetroleum Engineers and holds a diploma of Ingénieur Civil des Ponts et Chaussées de France. The RAR organisation reports directly to anExecutive Vice President of Finance, who is a member of the Upstream Reserves Committee (URC). The URC is a multidisciplinary committeeconsisting of senior representatives from the Finance, Legal, Projects & Technology and Upstream organisations. The URC reviews and endorsesall major (larger than 20 million barrels of oil equivalent) proved reserves bookings and endorses the total aggregated proved reserves. Finalapproval of all proved reserves bookings remains with Shell’s Executive Committee. The Internal Audit function also provides secondary assurancethrough audits of the control framework.
ADDITIONAL INFORMATION CONCERNING PROVED RESERVESProved reserves can be either developed or undeveloped. Subsidiaries’ proved reserves at December 31, 2014, were divided into 67%developed and 33% undeveloped on a barrel of oil equivalent basis. For the Shell share of joint ventures and associates, the proved reserves atDecember 31, 2014, were divided into 76% developed and 24% undeveloped on a barrel of oil equivalent basis.
Proved reserves are recognised under various forms of contractual agreements. Shell’s proved reserves volumes at December 31, 2014, presentin agreements such as production-sharing contracts or other forms of economic entitlement contracts, where the Shell share of reserves can varywith commodity prices, were 1,191 million barrels of crude oil and natural gas liquids, and 11,984 thousand million scf of natural gas.

FINANCIAL STATEMENTS AND SUPPLEMENTS 143
SHELL ANNUAL REPORT AND FORM 20-F 2014 SUPPLEMENTARY INFORMATION – OIL AND GAS (UNAUDITED)
CRUDE OIL, NATURAL GAS LIQUIDS, SYNTHETIC CRUDE OIL AND BITUMENShell subsidiaries’ estimated net proved reserves of crude oil, natural gas liquids, synthetic crude oil and bitumen at the end of the year; theirshare of the net proved reserves of joint ventures and associates at the end of the year; and the changes in such reserves during the year are setout on pages 144-146.
Significant changes in proved developed and undeveloped reserves of crude oil, natural gas liquids, synthetic crude oil and bitumen arediscussed below.
Proved reserves 2014-2013
SHELL SUBSIDIARIES
EuropeThe net decrease of 129 million barrels in revisions and reclassifications resulted from field performance studies and development activities. Thereservoir performance analyses and updates in fields resulted in a worse performance than previously estimated in the UK and a betterperformance than historically predicted in Norway.
AsiaThe net increase of 120 million barrels in revisions and reclassifications resulted from field performance studies and development activities. Thereservoir performance analyses and updates in fields resulted in many relatively small contributions from fields in Iraq, Malaysia, Oman andRussia.
AfricaThe net increase of 126 million barrels in revisions and reclassifications resulted from field performance studies and development activities. Thereservoir performance analyses and updates in fields resulted in reserves volumes increases in our operations in Egypt, Gabon and Nigeria.
USAThe net decrease of 169 million barrels in revisions and reclassifications resulted from field performance studies and development activities.Reservoir performance analyses and updates in fields resulted in reserves volume decreases for the Mars, Stones and Ursa deep-water fields in theGulf of Mexico and for the Permian project. The Na Kika Coulomb deep-water field in the Gulf of Mexico benefited from a better than predictedreservoir performance.
CanadaThe net increase of 81 million barrels in synthetic crude oil revisions and reclassifications resulted from field performance studies and developmentactivities at the Athabasca Oil Sands Project’s Muskeg River and Jackpine mines.
Proved reserves 2013-2012
SHELL SUBSIDIARIES
AsiaThe net increase of 205 million barrels in revisions and reclassifications resulted from field performance studies and development activities. Thereservoir performance analyses and updates in multiple fields supported continuing better performance than historically predicted in Brunei,Malaysia, Oman and Russia.
USAThe increase of 158 million barrels in extensions and discoveries resulted from extensions in existing deep-water and light-tight-oil operations.
CanadaThe increase of 410 million barrels in improved recovery resulted from the application of improved recovery techniques in Carmon Creek as partof the Peace River thermal project.

144 FINANCIAL STATEMENTS AND SUPPLEMENTS
SUPPLEMENTARY INFORMATION – OIL AND GAS (UNAUDITED) SHELL ANNUAL REPORT AND FORM 20-F 2014
[Crude oil, natural gas liquids, synthetic crude oil and bitumen continued]
PROVED DEVELOPED AND UNDEVELOPED RESERVES 2014 MILLION BARRELS
Europe Asia Oceania Africa
North America SouthAmericaUSA Canada Total
Oil andNGL
Oil andNGL
Oil andNGL
Oil andNGL
Oil andNGL
Oil andNGL
Syntheticcrude oil Bitumen
Oil andNGL
Oil andNGL
Syntheticcrude oil Bitumen
Allproducts
Shell subsidiariesAt January 1 769 1,343 139 651 991 29 1,731 422 95 4,017 1,731 422 6,170Revisions and reclassifications (129) 120 2 126 (169) 3 81 17 (7) (54) 81 17 44Improved recovery – – – 9 – – – – – 9 – – 9Extensions and discoveries – 5 1 8 18 21 – 1 13 66 – 1 67Purchases of minerals in place – – – – – – – – – – – – –Sales of minerals in place – – (5) (15) (30) (1) – (6) (21) (72) – (6) (78)Production [A] (61) (162) (9) (88) (99) (8) (49) (6) (17) (444) (49) (6) (499)At December 31 579 1,306 128 691 711 44 1,763 428 63 3,522 1,763 428 5,713
Shell share of joint ventures andassociates
At January 1 29 381 24 – – – – – 17 451 – – 451Revisions and reclassifications 2 33 – – – – – – (17) 18 – – 18Improved recovery – – – – – – – – – – – – –Extensions and discoveries – 1 – – – – – – – 1 – – 1Purchases of minerals in place – – – – – – – – – – – – –Sales of minerals in place – – (8) – – – – – – (8) – – (8)Production (2) (39) (4) – – – – – – (45) – – (45)At December 31 29 376 12 – – – – – – 417 – – 417
Total 608 1,682 140 691 711 44 1,763 428 63 3,939 1,763 428 6,130Reserves attributable to non-
controlling interest in Shellsubsidiaries at December 31 – – – 9 – – – – – 9 – – 9
[A] Includes 2 million barrels consumed in operations.
PROVED DEVELOPED RESERVES 2014 MILLION BARRELS
Europe Asia Oceania Africa
North America SouthAmericaUSA Canada Total
Oil andNGL
Oil andNGL
Oil andNGL
Oil andNGL
Oil andNGL
Oil andNGL
Syntheticcrude oil Bitumen
Oil andNGL
Oil andNGL
Syntheticcrude oil Bitumen
Allproducts
Shell subsidiariesAt January 1 396 942 48 453 440 21 1,299 13 59 2,359 1,299 13 3,671At December 31 350 947 41 534 494 26 1,273 9 51 2,443 1,273 9 3,725
Shell share of joint ventures andassociates
At January 1 22 316 23 – – – – – 15 376 – – 376At December 31 22 222 10 – – – – – – 254 – – 254
PROVED UNDEVELOPED RESERVES 2014 MILLION BARRELS
Europe Asia Oceania Africa
North America SouthAmericaUSA Canada Total
Oil andNGL
Oil andNGL
Oil andNGL
Oil andNGL
Oil andNGL
Oil andNGL
Syntheticcrude oil Bitumen
Oil andNGL
Oil andNGL
Syntheticcrude oil Bitumen
Allproducts
Shell subsidiariesAt January 1 373 401 91 198 551 8 432 409 36 1,658 432 409 2,499At December 31 229 359 87 157 217 18 490 419 12 1,079 490 419 1,988
Shell share of joint ventures andassociates
At January 1 7 65 1 – – – – – 2 75 – – 75At December 31 7 154 2 – – – – – – 163 – – 163
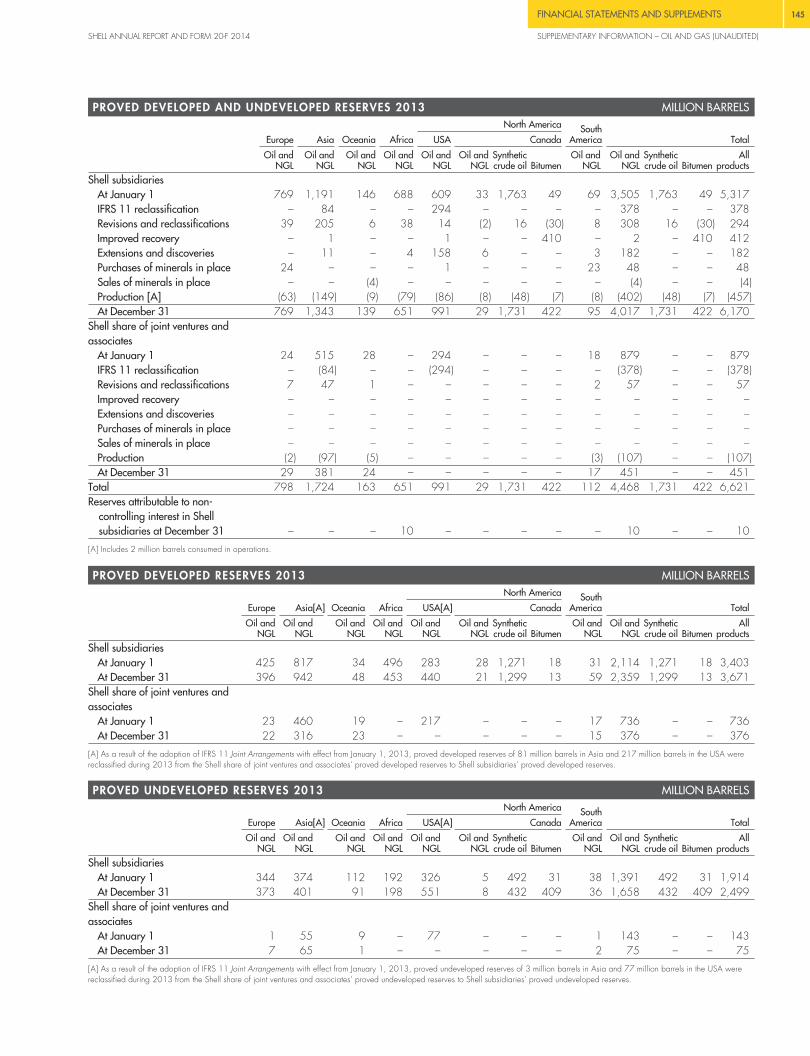
FINANCIAL STATEMENTS AND SUPPLEMENTS 145
SHELL ANNUAL REPORT AND FORM 20-F 2014 SUPPLEMENTARY INFORMATION – OIL AND GAS (UNAUDITED)
PROVED DEVELOPED AND UNDEVELOPED RESERVES 2013 MILLION BARRELS
Europe Asia Oceania Africa
North America SouthAmericaUSA Canada Total
Oil andNGL
Oil andNGL
Oil andNGL
Oil andNGL
Oil andNGL
Oil andNGL
Syntheticcrude oil Bitumen
Oil andNGL
Oil andNGL
Syntheticcrude oil Bitumen
Allproducts
Shell subsidiariesAt January 1 769 1,191 146 688 609 33 1,763 49 69 3,505 1,763 49 5,317IFRS 11 reclassification – 84 – – 294 – – – – 378 – – 378Revisions and reclassifications 39 205 6 38 14 (2) 16 (30) 8 308 16 (30) 294Improved recovery – 1 – – 1 – – 410 – 2 – 410 412Extensions and discoveries – 11 – 4 158 6 – – 3 182 – – 182Purchases of minerals in place 24 – – – 1 – – – 23 48 – – 48Sales of minerals in place – – (4) – – – – – – (4) – – (4)Production [A] (63) (149) (9) (79) (86) (8) (48) (7) (8) (402) (48) (7) (457)At December 31 769 1,343 139 651 991 29 1,731 422 95 4,017 1,731 422 6,170
Shell share of joint ventures andassociates
At January 1 24 515 28 – 294 – – – 18 879 – – 879IFRS 11 reclassification – (84) – – (294) – – – – (378) – – (378)Revisions and reclassifications 7 47 1 – – – – – 2 57 – – 57Improved recovery – – – – – – – – – – – – –Extensions and discoveries – – – – – – – – – – – – –Purchases of minerals in place – – – – – – – – – – – – –Sales of minerals in place – – – – – – – – – – – – –Production (2) (97) (5) – – – – – (3) (107) – – (107)At December 31 29 381 24 – – – – – 17 451 – – 451
Total 798 1,724 163 651 991 29 1,731 422 112 4,468 1,731 422 6,621Reserves attributable to non-
controlling interest in Shellsubsidiaries at December 31 – – – 10 – – – – – 10 – – 10
[A] Includes 2 million barrels consumed in operations.
PROVED DEVELOPED RESERVES 2013 MILLION BARRELS
Europe Asia[A] Oceania Africa
North America SouthAmericaUSA[A] Canada Total
Oil andNGL
Oil andNGL
Oil andNGL
Oil andNGL
Oil andNGL
Oil andNGL
Syntheticcrude oil Bitumen
Oil andNGL
Oil andNGL
Syntheticcrude oil Bitumen
Allproducts
Shell subsidiariesAt January 1 425 817 34 496 283 28 1,271 18 31 2,114 1,271 18 3,403At December 31 396 942 48 453 440 21 1,299 13 59 2,359 1,299 13 3,671
Shell share of joint ventures andassociates
At January 1 23 460 19 – 217 – – – 17 736 – – 736At December 31 22 316 23 – – – – – 15 376 – – 376
[A] As a result of the adoption of IFRS 11 Joint Arrangements with effect from January 1, 2013, proved developed reserves of 81 million barrels in Asia and 217 million barrels in the USA werereclassified during 2013 from the Shell share of joint ventures and associates’ proved developed reserves to Shell subsidiaries’ proved developed reserves.
PROVED UNDEVELOPED RESERVES 2013 MILLION BARRELS
Europe Asia[A] Oceania Africa
North America SouthAmericaUSA[A] Canada Total
Oil andNGL
Oil andNGL
Oil andNGL
Oil andNGL
Oil andNGL
Oil andNGL
Syntheticcrude oil Bitumen
Oil andNGL
Oil andNGL
Syntheticcrude oil Bitumen
Allproducts
Shell subsidiariesAt January 1 344 374 112 192 326 5 492 31 38 1,391 492 31 1,914At December 31 373 401 91 198 551 8 432 409 36 1,658 432 409 2,499
Shell share of joint ventures andassociates
At January 1 1 55 9 – 77 – – – 1 143 – – 143At December 31 7 65 1 – – – – – 2 75 – – 75
[A] As a result of the adoption of IFRS 11 Joint Arrangements with effect from January 1, 2013, proved undeveloped reserves of 3 million barrels in Asia and 77 million barrels in the USA werereclassified during 2013 from the Shell share of joint ventures and associates’ proved undeveloped reserves to Shell subsidiaries’ proved undeveloped reserves.

146 FINANCIAL STATEMENTS AND SUPPLEMENTS
SUPPLEMENTARY INFORMATION – OIL AND GAS (UNAUDITED) SHELL ANNUAL REPORT AND FORM 20-F 2014
[Crude oil, natural gas liquids, synthetic crude oil and bitumen continued]
PROVED DEVELOPED AND UNDEVELOPED RESERVES 2012 MILLION BARRELS
Europe Asia Oceania Africa
North America SouthAmericaUSA Canada Total
Oil andNGL
Oil andNGL
Oil andNGL
Oil andNGL
Oil andNGL
Oil andNGL
Syntheticcrude oil Bitumen
Oil andNGL
Oil andNGL
Syntheticcrude oil Bitumen
Allproducts
Shell subsidiariesAt January 1 723 1,104 175 731 532 35 1,680 55 63 3,363 1,680 55 5,098Revisions and reclassifications 24 191 5 95 80 3 131 1 12 410 131 1 542Improved recovery – 6 – – 4 – – – – 10 – – 10Extensions and discoveries 44 2 – 1 30 1 – 1 7 85 – 1 86Purchases of minerals in place 56 – – – 26 – – – – 82 – – 82Sales of minerals in place – – (24) (33) (6) (1) – (1) – (64) – (1) (65)Production [A] (78) (112) (10) (106) (57) (5) (48) (7) (13) (381) (48) (7) (436)At December 31 769 1,191 146 688 609 33 1,763 49 69 3,505 1,763 49 5,317
Shell share of joint ventures andassociates
At January 1 31 560 34 – 306 – – – 19 950 – – 950Revisions and reclassifications (5) 79 1 – 10 – – – 2 87 – – 87Improved recovery – – – – 3 – – – – 3 – – 3Extensions and discoveries – 2 – – – – – – – 2 – – 2Purchases of minerals in place – – – – – – – – – – – – –Sales of minerals in place – – (1) – – – – – – (1) – – (1)Production (2) (126) (6) – (25) – – – (3) (162) – – (162)At December 31 24 515 28 – 294 – – – 18 879 – – 879
Total 793 1,706 174 688 903 33 1,763 49 87 4,384 1,763 49 6,196Reserves attributable to non-
controlling interest in Shellsubsidiaries at December 31 – – – 16 – – – – – 16 – – 16
[A] Includes 2 million barrels consumed in operations.
PROVED DEVELOPED RESERVES 2012 MILLION BARRELS
Europe Asia Oceania Africa
North America SouthAmericaUSA Canada Total
Oil andNGL
Oil andNGL
Oil andNGL
Oil andNGL
Oil andNGL
Oil andNGL
Syntheticcrude oil Bitumen
Oil andNGL
Oil andNGL
Syntheticcrude oil Bitumen
Allproducts
Shell subsidiariesAt January 1 460 781 35 438 240 22 1,249 22 35 2,011 1,249 22 3,282At December 31 425 817 34 496 283 28 1,271 18 31 2,114 1,271 18 3,403
Shell share of joint ventures andassociates
At January 1 30 483 21 – 202 – – – 18 754 – – 754At December 31 23 460 19 – 217 – – – 17 736 – – 736
PROVED UNDEVELOPED RESERVES 2012 MILLION BARRELS
Europe Asia Oceania Africa
North America SouthAmericaUSA Canada Total
Oil andNGL
Oil andNGL
Oil andNGL
Oil andNGL
Oil andNGL
Oil andNGL
Syntheticcrude oil Bitumen
Oil andNGL
Oil andNGL
Syntheticcrude oil Bitumen
Allproducts
Shell subsidiariesAt January 1 263 323 140 293 292 13 431 33 28 1,352 431 33 1,816At December 31 344 374 112 192 326 5 492 31 38 1,391 492 31 1,914
Shell share of joint ventures andassociates
At January 1 1 77 13 – 104 – – – 1 196 – – 196At December 31 1 55 9 – 77 – – – 1 143 – – 143
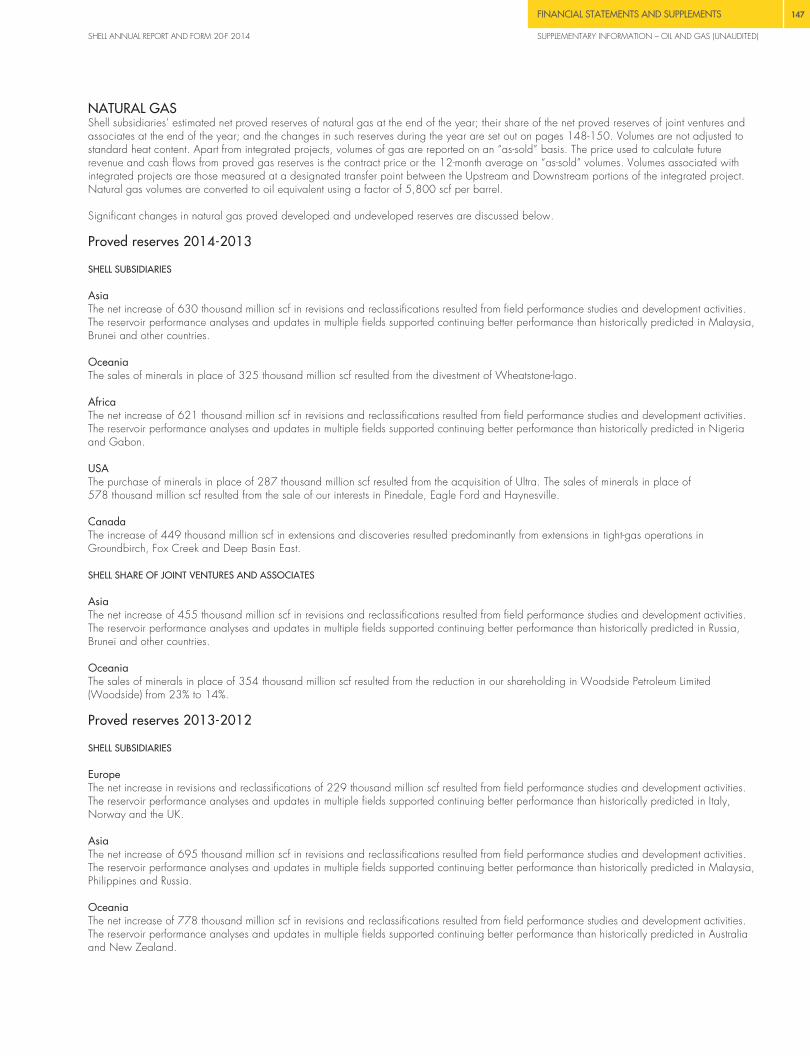
FINANCIAL STATEMENTS AND SUPPLEMENTS 147
SHELL ANNUAL REPORT AND FORM 20-F 2014 SUPPLEMENTARY INFORMATION – OIL AND GAS (UNAUDITED)
NATURAL GASShell subsidiaries’ estimated net proved reserves of natural gas at the end of the year; their share of the net proved reserves of joint ventures andassociates at the end of the year; and the changes in such reserves during the year are set out on pages 148-150. Volumes are not adjusted tostandard heat content. Apart from integrated projects, volumes of gas are reported on an “as-sold” basis. The price used to calculate futurerevenue and cash flows from proved gas reserves is the contract price or the 12-month average on “as-sold” volumes. Volumes associated withintegrated projects are those measured at a designated transfer point between the Upstream and Downstream portions of the integrated project.Natural gas volumes are converted to oil equivalent using a factor of 5,800 scf per barrel.
Significant changes in natural gas proved developed and undeveloped reserves are discussed below.
Proved reserves 2014-2013
SHELL SUBSIDIARIES
AsiaThe net increase of 630 thousand million scf in revisions and reclassifications resulted from field performance studies and development activities.The reservoir performance analyses and updates in multiple fields supported continuing better performance than historically predicted in Malaysia,Brunei and other countries.
OceaniaThe sales of minerals in place of 325 thousand million scf resulted from the divestment of Wheatstone-lago.
AfricaThe net increase of 621 thousand million scf in revisions and reclassifications resulted from field performance studies and development activities.The reservoir performance analyses and updates in multiple fields supported continuing better performance than historically predicted in Nigeriaand Gabon.
USAThe purchase of minerals in place of 287 thousand million scf resulted from the acquisition of Ultra. The sales of minerals in place of578 thousand million scf resulted from the sale of our interests in Pinedale, Eagle Ford and Haynesville.
CanadaThe increase of 449 thousand million scf in extensions and discoveries resulted predominantly from extensions in tight-gas operations inGroundbirch, Fox Creek and Deep Basin East.
SHELL SHARE OF JOINT VENTURES AND ASSOCIATES
AsiaThe net increase of 455 thousand million scf in revisions and reclassifications resulted from field performance studies and development activities.The reservoir performance analyses and updates in multiple fields supported continuing better performance than historically predicted in Russia,Brunei and other countries.
OceaniaThe sales of minerals in place of 354 thousand million scf resulted from the reduction in our shareholding in Woodside Petroleum Limited(Woodside) from 23% to 14%.
Proved reserves 2013-2012
SHELL SUBSIDIARIES
EuropeThe net increase in revisions and reclassifications of 229 thousand million scf resulted from field performance studies and development activities.The reservoir performance analyses and updates in multiple fields supported continuing better performance than historically predicted in Italy,Norway and the UK.
AsiaThe net increase of 695 thousand million scf in revisions and reclassifications resulted from field performance studies and development activities.The reservoir performance analyses and updates in multiple fields supported continuing better performance than historically predicted in Malaysia,Philippines and Russia.
OceaniaThe net increase of 778 thousand million scf in revisions and reclassifications resulted from field performance studies and development activities.The reservoir performance analyses and updates in multiple fields supported continuing better performance than historically predicted in Australiaand New Zealand.

148 FINANCIAL STATEMENTS AND SUPPLEMENTS
SUPPLEMENTARY INFORMATION – OIL AND GAS (UNAUDITED) SHELL ANNUAL REPORT AND FORM 20-F 2014
[Natural gas continued]
USAThe increase of 250 thousand million scf in extensions and discoveries related from extensions in existing deep-water and shale-gas and light-tight-oil operations.
CanadaThe net increase of 236 thousand million scf in revisions and reclassifications resulted from field performance studies and development activities.The reservoir performance analyses and updates in multiple fields supported continuing better performance than historically predicted. Theincrease of 344 thousand million scf in extensions and discoveries resulted predominantly from extensions in tight-gas, basin-centred gas and light-tight-oil operations.
SHELL SHARE OF JOINT VENTURES AND ASSOCIATES
AsiaThe net increase of 350 thousand million scf in revisions and reclassifications resulted from field performance studies and development activities.The reservoir performance analyses and updates in multiple fields supported continuing better production performance in Brunei and Qatar.
PROVED DEVELOPED AND UNDEVELOPED RESERVES 2014 THOUSAND MILLION STANDARD CUBIC FEETNorth America South
AmericaEurope Asia Oceania Africa USA Canada TotalShell subsidiaries
At January 1 4,767 10,170 6,092 2,257 2,199 1,500 74 27,059Revisions and reclassifications 175 630 (20) 621 (46) (5) (11) 1,344Improved recovery – – – – – – – –Extensions and discoveries – 82 46 61 73 449 8 719Purchases of minerals in place – – – – 287 – – 287Sales of minerals in place – – (325) (10) (578) (100) (8) (1,021)Production [A] (512) (811) (218) (308) (374) (233) (15) (2,471)At December 31 4,430 10,071 5,575 2,621 1,561 1,611 48 25,917
Shell share of joint ventures and associatesAt January 1 8,508 5,991 909 – – – 6 15,414Revisions and reclassifications (60) 455 34 – – – (6) 423Improved recovery – – – – – – – –Extensions and discoveries 6 26 11 – – – – 43Purchases of minerals in place – – – – – – – –Sales of minerals in place – – (354) – – – – (354)Production [B] (588) (442) (97) – – – – (1,127)At December 31 7,866 6,030 503 – – – – 14,399
Total 12,296 16,101 6,078 2,621 1,561 1,611 48 40,316Reserves attributable to non-controlling interest in Shell
subsidiaries at December 31 – 3 – 6 – – – 9
[A] Includes 162 thousand million standard cubic feet consumed in operations.[B] Includes 58 thousand million standard cubic feet consumed in operations.
PROVED DEVELOPED RESERVES 2014 THOUSAND MILLION STANDARD CUBIC FEETNorth America South
AmericaEurope Asia Oceania Africa USA Canada TotalShell subsidiaries
At January 1 3,942 9,132 1,621 946 1,492 908 48 18,089At December 31 3,774 9,114 1,398 1,162 1,275 939 42 17,704
Shell share of joint ventures and associatesAt January 1 6,856 4,894 806 – – – 4 12,560At December 31 6,386 4,501 433 – – – – 11,320
PROVED UNDEVELOPED RESERVES 2014 THOUSAND MILLION STANDARD CUBIC FEETNorth America South
AmericaEurope Asia Oceania Africa USA Canada TotalShell subsidiaries
At January 1 825 1,038 4,471 1,311 707 592 26 8,970At December 31 656 957 4,177 1,459 286 672 6 8,213
Shell share of joint ventures and associatesAt January 1 1,652 1,097 103 – – – 2 2,854At December 31 1,480 1,529 70 – – – – 3,079

FINANCIAL STATEMENTS AND SUPPLEMENTS 149
SHELL ANNUAL REPORT AND FORM 20-F 2014 SUPPLEMENTARY INFORMATION – OIL AND GAS (UNAUDITED)
PROVED DEVELOPED AND UNDEVELOPED RESERVES 2013 THOUSAND MILLION STANDARD CUBIC FEETNorth America South
AmericaEurope Asia Oceania Africa USA Canada TotalShell subsidiaries
At January 1 5,021 10,220 5,571 2,241 2,265 1,011 95 26,424IFRS 11 reclassification – 15 – – 87 – – 102Revisions and reclassifications 229 695 778 197 (4) 236 (26) 2,105Improved recovery – – – – – 160 – 160Extensions and discoveries 13 5 – 86 250 344 11 709Purchases of minerals in place 38 – – – 8 – 8 54Sales of minerals in place – – (55) – – – – (55)Production [A] (534) (765) (202) (267) (407) (251) (14) (2,440)At December 31 4,767 10,170 6,092 2,257 2,199 1,500 74 27,059
Shell share of joint ventures and associatesAt January 1 9,147 6,091 1,039 – 87 – 4 16,368IFRS 11 reclassification – (15) – – (87) – – (102)Revisions and reclassifications 92 350 (20) – – – 3 425Improved recovery – – – – – – – –Extensions and discoveries – 12 – – – – – 12Purchases of minerals in place – – – – – – – –Sales of minerals in place – – – – – – – –Production [B] (731) (447) (110) – – – (1) (1,289)At December 31 8,508 5,991 909 – – – 6 15,414
Total 13,275 16,161 7,001 2,257 2,199 1,500 80 42,473Reserves attributable to non-controlling interest in Shell
subsidiaries at December 31 – 6 – 6 – – – 12
[A] Includes 153 thousand million standard cubic feet consumed in operations.[B] Includes 63 thousand million standard cubic feet consumed in operations.
PROVED DEVELOPED RESERVES 2013 THOUSAND MILLION STANDARD CUBIC FEETNorth America South
AmericaEurope Asia[A] Oceania Africa USA[A] Canada TotalShell subsidiaries
At January 1 4,192 9,366 843 1,012 1,607 872 81 17,973At December 31 3,942 9,132 1,621 946 1,492 908 48 18,089
Shell share of joint ventures and associatesAt January 1 7,407 5,088 581 – 67 – 3 13,146At December 31 6,856 4,894 806 – – – 4 12,560
[A] As a result of the adoption of IFRS 11 Joint Arrangements with effect from January 1, 2013, proved developed reserves of 14 thousand million standard cubic feet in Asia and 67 thousandmillion standard cubic feet in the USA were reclassified during 2013 from the Shell share of joint ventures and associates’ proved developed reserves to Shell subsidiaries’ proved developedreserves.
PROVED UNDEVELOPED RESERVES 2013 THOUSAND MILLION STANDARD CUBIC FEETNorth America South
AmericaEurope Asia[A] Oceania Africa USA[A] Canada TotalShell subsidiaries
At January 1 829 854 4,728 1,229 658 139 14 8,451At December 31 825 1,038 4,471 1,311 707 592 26 8,970
Shell share of joint ventures and associatesAt January 1 1,740 1,003 458 – 20 – 1 3,222At December 31 1,652 1,097 103 – – – 2 2,854
[A] As a result of the adoption of IFRS 11 Joint Arrangements with effect from January 1, 2013, proved undeveloped reserves of 1 thousand million standard cubic feet in Asia and 20 thousandmillion standard cubic feet in the USA were reclassified during 2013 from the Shell share of joint ventures and associates’ proved undeveloped reserves to Shell subsidiaries’ proved undevelopedreserves.

150 FINANCIAL STATEMENTS AND SUPPLEMENTS
SUPPLEMENTARY INFORMATION – OIL AND GAS (UNAUDITED) SHELL ANNUAL REPORT AND FORM 20-F 2014
[Natural gas continued]
PROVED DEVELOPED AND UNDEVELOPED RESERVES 2012 THOUSAND MILLION STANDARD CUBIC FEETNorth America South
AmericaEurope Asia Oceania Africa USA Canada TotalShell subsidiaries
At January 1 5,498 10,691 5,952 2,800 3,196 2,045 104 30,286Revisions and reclassifications 14 160 136 (142) (1,076) (683) 8 (1,583)Improved recovery – – – – 16 – – 16Extensions and discoveries 68 – – 89 393 84 4 638Purchases of minerals in place 22 – – – 139 – – 161Sales of minerals in place – – (303) (163) (6) (191) – (663)Production [A] (581) (631) (214) (343) (397) (244) (21) (2,431)At December 31 5,021 10,220 5,571 2,241 2,265 1,011 95 26,424
Shell share of joint ventures and associatesAt January 1 9,903 6,262 1,142 – 63 – 6 17,376Revisions and reclassifications (89) 284 15 – 31 – (1) 240Improved recovery – – – – – – – –Extensions and discoveries 3 26 – – – – – 29Purchases of minerals in place – – – – – – – –Sales of minerals in place – – (21) – – – – (21)Production [B] (670) (481) (97) – (7) – (1) (1,256)At December 31 9,147 6,091 1,039 – 87 – 4 16,368
Total 14,168 16,311 6,610 2,241 2,352 1,011 99 42,792Reserves attributable to non-controlling interest in Shell
subsidiaries at December 31 – 6 – 7 – – – 13
[A] Includes 161 thousand million standard cubic feet consumed in operations.[B] Includes 60 thousand million standard cubic feet consumed in operations.
PROVED DEVELOPED RESERVES 2012 THOUSAND MILLION STANDARD CUBIC FEETNorth America South
AmericaEurope Asia Oceania Africa USA Canada TotalShell subsidiaries
At January 1 4,685 9,379 839 1,112 1,506 951 92 18,564At December 31 4,192 9,366 843 1,012 1,607 872 81 17,973
Shell share of joint ventures and associatesAt January 1 7,837 4,936 241 – 46 – 5 13,065At December 31 7,407 5,088 581 – 67 – 3 13,146
PROVED UNDEVELOPED RESERVES 2012 THOUSAND MILLION STANDARD CUBIC FEETNorth America South
AmericaEurope Asia Oceania Africa USA Canada TotalShell subsidiaries
At January 1 813 1,312 5,113 1,688 1,690 1,094 12 11,722At December 31 829 854 4,728 1,229 658 139 14 8,451
Shell share of joint ventures and associatesAt January 1 2,066 1,326 901 – 17 – 1 4,311At December 31 1,740 1,003 458 – 20 – 1 3,222
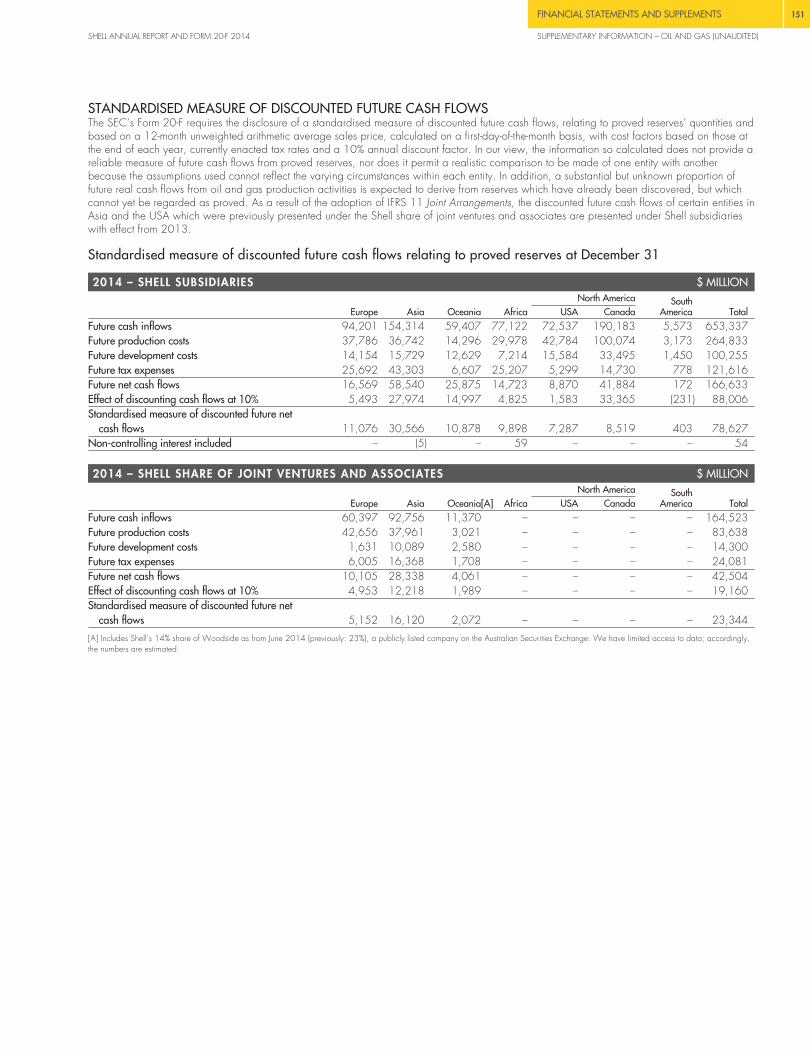
FINANCIAL STATEMENTS AND SUPPLEMENTS 151
SHELL ANNUAL REPORT AND FORM 20-F 2014 SUPPLEMENTARY INFORMATION – OIL AND GAS (UNAUDITED)
STANDARDISED MEASURE OF DISCOUNTED FUTURE CASH FLOWSThe SEC’s Form 20-F requires the disclosure of a standardised measure of discounted future cash flows, relating to proved reserves’ quantities andbased on a 12-month unweighted arithmetic average sales price, calculated on a first-day-of-the-month basis, with cost factors based on those atthe end of each year, currently enacted tax rates and a 10% annual discount factor. In our view, the information so calculated does not provide areliable measure of future cash flows from proved reserves, nor does it permit a realistic comparison to be made of one entity with anotherbecause the assumptions used cannot reflect the varying circumstances within each entity. In addition, a substantial but unknown proportion offuture real cash flows from oil and gas production activities is expected to derive from reserves which have already been discovered, but whichcannot yet be regarded as proved. As a result of the adoption of IFRS 11 Joint Arrangements, the discounted future cash flows of certain entities inAsia and the USA which were previously presented under the Shell share of joint ventures and associates are presented under Shell subsidiarieswith effect from 2013.
Standardised measure of discounted future cash flows relating to proved reserves at December 31
2014 – SHELL SUBSIDIARIES $ MILLIONNorth America South
AmericaEurope Asia Oceania Africa USA Canada TotalFuture cash inflows 94,201 154,314 59,407 77,122 72,537 190,183 5,573 653,337Future production costs 37,786 36,742 14,296 29,978 42,784 100,074 3,173 264,833Future development costs 14,154 15,729 12,629 7,214 15,584 33,495 1,450 100,255Future tax expenses 25,692 43,303 6,607 25,207 5,299 14,730 778 121,616Future net cash flows 16,569 58,540 25,875 14,723 8,870 41,884 172 166,633Effect of discounting cash flows at 10% 5,493 27,974 14,997 4,825 1,583 33,365 (231) 88,006Standardised measure of discounted future net
cash flows 11,076 30,566 10,878 9,898 7,287 8,519 403 78,627Non-controlling interest included – (5) – 59 – – – 54
2014 – SHELL SHARE OF JOINT VENTURES AND ASSOCIATES $ MILLIONNorth America South
AmericaEurope Asia Oceania[A] Africa USA Canada TotalFuture cash inflows 60,397 92,756 11,370 – – – – 164,523Future production costs 42,656 37,961 3,021 – – – – 83,638Future development costs 1,631 10,089 2,580 – – – – 14,300Future tax expenses 6,005 16,368 1,708 – – – – 24,081Future net cash flows 10,105 28,338 4,061 – – – – 42,504Effect of discounting cash flows at 10% 4,953 12,218 1,989 – – – – 19,160Standardised measure of discounted future net
cash flows 5,152 16,120 2,072 – – – – 23,344
[A] Includes Shell’s 14% share of Woodside as from June 2014 (previously: 23%), a publicly listed company on the Australian Securities Exchange. We have limited access to data; accordingly,the numbers are estimated.

152 FINANCIAL STATEMENTS AND SUPPLEMENTS
SUPPLEMENTARY INFORMATION – OIL AND GAS (UNAUDITED) SHELL ANNUAL REPORT AND FORM 20-F 2014
[Standardised measure of discounted future cash flows continued]
2013 – SHELL SUBSIDIARIES $ MILLIONNorth America South
AmericaEurope Asia Oceania Africa USA Canada TotalFuture cash inflows 129,740 162,149 67,288 77,958 103,657 180,827 9,025 730,644Future production costs 45,084 35,001 15,304 27,452 56,457 93,964 4,698 277,960Future development costs 17,186 14,259 17,863 8,473 24,653 27,806 1,285 111,525Future tax expenses 42,490 46,960 7,271 25,774 8,397 15,214 1,291 147,397Future net cash flows 24,980 65,929 26,850 16,259 14,150 43,843 1,751 193,762Effect of discounting cash flows at 10% 9,145 30,238 18,838 5,460 4,768 34,056 (42) 102,463Standardised measure of discounted future net
cash flows 15,835 35,691 8,012 10,799 9,382 9,787 1,793 91,299Non-controlling interest included – 5 – 188 – – – 193
2013 – SHELL SHARE OF JOINT VENTURES AND ASSOCIATES $ MILLIONNorth America South
AmericaEurope Asia Oceania[A] Africa USA Canada TotalFuture cash inflows 73,876 94,675 13,572 – – – 1,682 183,805Future production costs 55,680 41,504 3,040 – – – 696 100,920Future development costs 1,751 8,517 3,744 – – – 55 14,067Future tax expenses 6,203 17,286 2,004 – – – 494 25,987Future net cash flows 10,242 27,368 4,784 – – – 437 42,831Effect of discounting cash flows at 10% 4,097 11,669 1,753 – – – 132 17,651Standardised measure of discounted future net
cash flows 6,145 15,699 3,031 – – – 305 25,180
[A] Includes Shell’s 23% share of Woodside, a publicly listed company on the Australian Securities Exchange. We have limited access to data; accordingly, the numbers are estimated.
2012 – SHELL SUBSIDIARIES $ MILLIONNorth America South
AmericaEurope Asia Oceania Africa USA Canada TotalFuture cash inflows 129,581 154,672 65,144 82,382 65,975 150,393 6,942 655,089Future production costs 40,891 30,819 14,800 20,830 36,543 81,516 3,459 228,858Future development costs 18,717 13,151 21,943 7,350 15,708 17,573 1,836 96,278Future tax expenses 43,997 47,301 7,436 33,954 4,832 13,298 721 151,539Future net cash flows 25,976 63,401 20,965 20,248 8,892 38,006 926 178,414Effect of discounting cash flows at 10% 10,620 28,859 16,586 5,833 3,909 27,331 198 93,336Standardised measure of discounted future net
cash flows 15,356 34,542 4,379 14,415 4,983 10,675 728 85,078Non-controlling interest included – 8 – 281 – – – 289
2012 – SHELL SHARE OF JOINT VENTURES AND ASSOCIATES $ MILLIONNorth America South
AmericaEurope Asia Oceania[A] Africa USA Canada TotalFuture cash inflows 82,091 102,607 15,814 – 31,479 – 1,867 233,858Future production costs 57,542 47,685 3,710 – 9,434 – 827 119,198Future development costs 1,817 7,082 4,188 – 4,087 – 71 17,245Future tax expenses 8,894 19,740 2,399 – 6,846 – 520 38,399Future net cash flows 13,838 28,100 5,517 – 11,112 – 449 59,016Effect of discounting cash flows at 10% 6,277 11,737 2,169 – 4,854 – 133 25,170Standardised measure of discounted future netcash flows 7,561 16,363 3,348 – 6,258 – 316 33,846
[A] Includes Shell’s 23% share of Woodside as from April 2012 (previously: 24%), a publicly listed company on the Australian Securities Exchange. We have limited access to data; accordingly,the numbers are estimated.
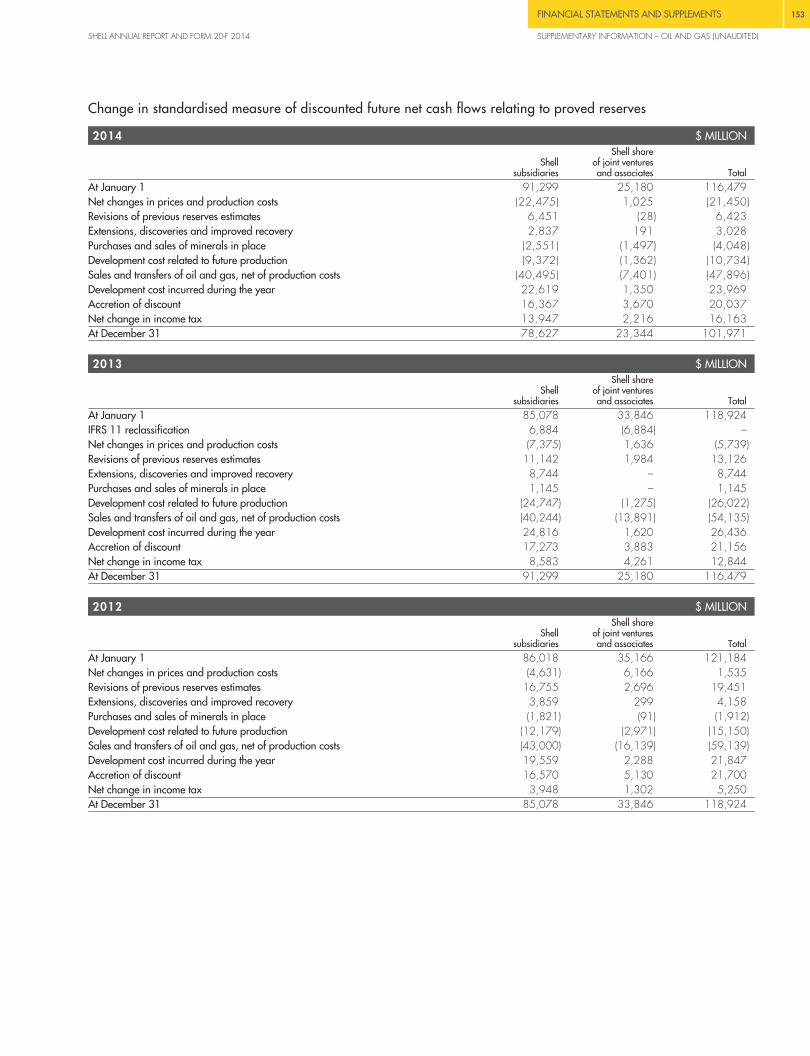
FINANCIAL STATEMENTS AND SUPPLEMENTS 153
SHELL ANNUAL REPORT AND FORM 20-F 2014 SUPPLEMENTARY INFORMATION – OIL AND GAS (UNAUDITED)
Change in standardised measure of discounted future net cash flows relating to proved reserves
2014 $ MILLION
Shellsubsidiaries
Shell shareof joint venturesand associates Total
At January 1 91,299 25,180 116,479Net changes in prices and production costs (22,475) 1,025 (21,450)Revisions of previous reserves estimates 6,451 (28) 6,423Extensions, discoveries and improved recovery 2,837 191 3,028Purchases and sales of minerals in place (2,551) (1,497) (4,048)Development cost related to future production (9,372) (1,362) (10,734)Sales and transfers of oil and gas, net of production costs (40,495) (7,401) (47,896)Development cost incurred during the year 22,619 1,350 23,969Accretion of discount 16,367 3,670 20,037Net change in income tax 13,947 2,216 16,163At December 31 78,627 23,344 101,971
2013 $ MILLION
Shellsubsidiaries
Shell shareof joint venturesand associates Total
At January 1 85,078 33,846 118,924IFRS 11 reclassification 6,884 (6,884) –Net changes in prices and production costs (7,375) 1,636 (5,739)Revisions of previous reserves estimates 11,142 1,984 13,126Extensions, discoveries and improved recovery 8,744 – 8,744Purchases and sales of minerals in place 1,145 – 1,145Development cost related to future production (24,747) (1,275) (26,022)Sales and transfers of oil and gas, net of production costs (40,244) (13,891) (54,135)Development cost incurred during the year 24,816 1,620 26,436Accretion of discount 17,273 3,883 21,156Net change in income tax 8,583 4,261 12,844At December 31 91,299 25,180 116,479
2012 $ MILLION
Shellsubsidiaries
Shell shareof joint venturesand associates Total
At January 1 86,018 35,166 121,184Net changes in prices and production costs (4,631) 6,166 1,535Revisions of previous reserves estimates 16,755 2,696 19,451Extensions, discoveries and improved recovery 3,859 299 4,158Purchases and sales of minerals in place (1,821) (91) (1,912)Development cost related to future production (12,179) (2,971) (15,150)Sales and transfers of oil and gas, net of production costs (43,000) (16,139) (59,139)Development cost incurred during the year 19,559 2,288 21,847Accretion of discount 16,570 5,130 21,700Net change in income tax 3,948 1,302 5,250At December 31 85,078 33,846 118,924

154 FINANCIAL STATEMENTS AND SUPPLEMENTS
SUPPLEMENTARY INFORMATION – OIL AND GAS (UNAUDITED) SHELL ANNUAL REPORT AND FORM 20-F 2014
OIL AND GAS EXPLORATION AND PRODUCTION ACTIVITIES CAPITALISED COSTSThe aggregate amount of property, plant and equipment and intangible assets relating to oil and gas exploration and production activities, andthe aggregate amount of the related depreciation, depletion and amortisation at December 31, are shown in the tables below.
Shell subsidiaries
$ MILLION2014 2013
CostProved properties [A] 228,532 225,754Unproved properties 30,161 34,282Support equipment and facilities 6,325 6,053
265,018 266,089Depreciation, depletion and amortisation
Proved properties [A] 113,943 117,709Unproved properties 3,867 5,019Support equipment and facilities 2,741 2,752
120,551 125,480Net capitalised costs 144,467 140,609
[A] Includes capitalised asset decommissioning and restoration costs and related depreciation.
Shell share of joint ventures and associates
$ MILLION2014 2013
CostProved properties [A] 42,524 43,378Unproved properties 3,504 3,693Support equipment and facilities 3,596 3,254
49,624 50,325Depreciation, depletion and amortisation
Proved properties [A] 22,916 23,468Unproved properties 78 108Support equipment and facilities 1,834 1,707
24,828 25,283Net capitalised costs 24,796 25,042
[A] Includes capitalised asset decommissioning and restoration costs and related depreciation.

FINANCIAL STATEMENTS AND SUPPLEMENTS 155
SHELL ANNUAL REPORT AND FORM 20-F 2014 SUPPLEMENTARY INFORMATION – OIL AND GAS (UNAUDITED)
OIL AND GAS EXPLORATION AND PRODUCTION ACTIVITIES COSTS INCURREDCosts incurred during the year in oil and gas property acquisition, exploration and development activities, whether capitalised or charged toincome currently, are shown in the tables below. Development costs include capitalised asset decommissioning and restoration costs and excludecosts of acquiring support equipment and facilities, but include depreciation thereon. As a result of the adoption of IFRS 11 Joint Arrangements,the costs incurred by certain entities in Asia and the USA, which were previously presented under the Shell share of joint ventures and associates,are presented under Shell subsidiaries with effect from 2013.
Shell subsidiaries
2014 $ MILLIONNorth America South
AmericaEurope[A] Asia Oceania Africa USA Canada TotalAcquisition of properties
Proved 2 57 – 132 36 – 10 237Unproved – 97 – 221 401 37 136 892
Exploration 680 1,339 415 254 2,546 851 717 6,802Development 5,139 3,189 5,111 2,717 6,482 2,437 409 25,484
[A] Includes Greenland.
2013 $ MILLIONNorth America South
AmericaEurope[A] Asia Oceania Africa USA Canada TotalAcquisition of properties
Proved 290 20 – 1 51 – 684 1,046Unproved 29 168 9 62 416 293 1,364 2,341
Exploration 752 1,493 448 504 3,496 1,400 592 8,685Development 4,309 3,225 5,720 2,293 5,314 1,742 830 23,433
[A] Includes Greenland.
2012 $ MILLIONNorth America South
AmericaEurope[A] Asia Oceania Africa USA Canada TotalAcquisition of properties
Proved 387 – – – 567 1 – 955Unproved 16 148 1,769 96 2,610 381 152 5,172
Exploration 472 867 352 559 4,898 1,058 479 8,685Development 3,080 2,773 4,901 1,733 3,621 2,113 354 18,575
[A] Includes Greenland.
Shell share of joint ventures and associatesJoint ventures and associates did not incur costs in the acquisition of oil and gas properties in 2014, 2013 or 2012.
2014 $ MILLIONNorth America South
AmericaEurope Asia Oceania Africa USA Canada Total
Exploration 18 181 162 – – – – 361Development 220 3,430 143 – – – – 3,793
2013 $ MILLIONNorth America South
AmericaEurope Asia Oceania Africa USA Canada Total
Exploration 42 272 321 – – – 13 648Development 169 2,545 293 – – – 23 3,030
2012 $ MILLIONNorth America South
AmericaEurope Asia Oceania Africa USA Canada Total
Exploration 38 323 103 – 10 – – 474Development 209 2,217 549 – 405 – 34 3,414

156 FINANCIAL STATEMENTS AND SUPPLEMENTS
SUPPLEMENTARY INFORMATION – OIL AND GAS (UNAUDITED) SHELL ANNUAL REPORT AND FORM 20-F 2014
OIL AND GAS EXPLORATION AND PRODUCTION ACTIVITIES EARNINGSThe results of operations for oil and gas producing activities are shown in the tables below. As a result of the adoption of IFRS 11 JointArrangements, the earnings of certain entities in Asia and the USA, which were previously presented under the Shell share of joint ventures andassociates, are presented under Shell subsidiaries with effect from 2013.
Shell subsidiaries
2014 $ MILLIONNorth America South
AmericaEurope[A] Asia Oceania Africa USA Canada TotalRevenue
Third parties 2,808 4,914 1,867 3,004 1,078 202 126 13,999Sales between businesses 7,869 13,973 990 6,516 9,903 7,399 1,376 48,026
Total 10,677 18,887 2,857 9,520 10,981 7,601 1,502 62,025Production costs excluding taxes 2,831 2,282 599 2,032 3,440 3,367 482 15,033Taxes other than income tax [B] 264 948 216 836 198 – 165 2,627Exploration 457 1,331 232 307 1,549 88 260 4,224Depreciation, depletion and amortisation 1,772 3,341 427 2,037 6,576 1,709 475 16,337Other costs/(income) 766 2,058 (2,123) 129 845 2,137 78 3,890Earnings before taxation 4,587 8,927 3,506 4,179 (1,627) 300 42 19,914Taxation charge/(credit) 3,362 6,800 2,113 2,404 (654) 60 157 14,242Earnings after taxation 1,225 2,127 1,393 1,775 (973) 240 (115) 5,672
[A] Includes Greenland.[B] Includes cash-paid royalties to governments outside North America.
2013 $ MILLIONNorth America South
AmericaEurope[A] Asia Oceania Africa USA Canada TotalRevenue
Third parties 4,116 5,535 1,982 2,690 3,416 52 64 17,855Sales between businesses 8,420 17,538 1,038 6,873 7,232 7,354 684 49,139
Total 12,536 23,073 3,020 9,563 10,648 7,406 748 66,994Production costs excluding taxes 2,656 1,762 481 1,753 3,336 3,303[B] 378 13,669[B]Taxes other than income tax [C] 328 1,254 231 963 223 – 85 3,084Exploration 627 1,082 396 354 1,790 312 717 5,278Depreciation, depletion and amortisation 1,400 2,268 423 1,276 7,858 2,366 160 15,751Other costs 1,052 3,713 40 419 1,395 2,129[B] 124 8,872[B]Earnings before taxation 6,473 12,994 1,449 4,798 (3,954) (704) (716) 20,340Taxation charge/(credit) 4,843 10,251 486 3,093 (1,461) (231) 71 17,052Earnings after taxation 1,630 2,743 963 1,705 (2,493) (473) (787) 3,288
[A] Includes Greenland.[B] Reflects the reclassification of certain costs.[C] Includes cash-paid royalties to governments outside North America.
2012 $ MILLIONNorth America South
AmericaEurope[A] Asia Oceania Africa USA Canada Total
RevenueThird parties 4,705 3,981 1,941 2,807 3,573 207 23 17,237Sales between businesses 10,275 16,450 1,129 10,364 3,906 6,443 1,431 49,998
Total 14,980 20,431 3,070 13,171 7,479 6,650 1,454 67,235Production costs excluding taxes 2,516 1,582 395 1,540 2,486 3,130[B] 255 11,904[B]Taxes other than income tax [C] 350 410 322 1,248 39 – 145 2,514Exploration 398 461 175 699 801 372 198 3,104Depreciation, depletion and amortisation 1,531 1,222 304 1,261 3,837 2,037 315 10,507Other costs/(income) 1,420 3,157 (1,769) (322) 421 1,963[B] 63 4,933[B]Earnings before taxation 8,765 13,599 3,643 8,745 (105) (852) 478 34,273Taxation charge/(credit) 6,310 10,733 1,104 5,358 (65) (413) 137 23,164Earnings after taxation 2,455 2,866 2,539 3,387 (40) (439) 341 11,109
[A] Includes Greenland.[B] Reflects the reclassification of certain costs.[C] Includes cash-paid royalties to governments outside North America.

FINANCIAL STATEMENTS AND SUPPLEMENTS 157
SHELL ANNUAL REPORT AND FORM 20-F 2014 SUPPLEMENTARY INFORMATION – OIL AND GAS (UNAUDITED)
Shell share of joint ventures and associates
2014 $ MILLIONNorth America South
AmericaEurope Asia Oceania[A] Africa USA Canada TotalThird party revenue 4,966 8,811 1,292 – – – – 15,069Total 4,966 8,811 1,292 – – – – 15,069Production costs excluding taxes 434 829 272 – – – – 1,535Taxes other than income tax [B] 2,634 2,518 24 – – – – 5,176Exploration 22 83 66 – – – 18 189Depreciation, depletion and amortisation 198 1,117 373 – – – – 1,688Other costs/(income) (6) 643 96 – – – 258 991Earnings before taxation 1,684 3,621 461 – – – (276) 5,490Taxation charge 608 1,256 190 – – – – 2,054Earnings after taxation 1,076 2,365 271 – – – (276) 3,436
[A] Includes Shell’s 14% share of Woodside as from June 2014 (previously: 23%), a publicly listed company on the Australian Securities Exchange. We have limited access to data; accordingly,the numbers are estimated.[B] Includes cash-paid royalties to governments outside North America.
2013 $ MILLIONNorth America South
AmericaEurope Asia Oceania[A] Africa USA Canada TotalThird party revenue 6,825 11,040 1,334 – – – 313 19,512Total 6,825 11,040 1,334 – – – 313 19,512Production costs excluding taxes 451 958 291 – – – 58 1,758Taxes other than income tax [B] 3,989 3,907 58 – – – 86 8,040Exploration 16 162 165 – – – 13 356Depreciation, depletion and amortisation 188 1,335 578 – – – 37 2,138Other costs/(income) (151) 694 310 – – – 40 893Earnings before taxation 2,332 3,984 (68) – – – 79 6,327Taxation charge/(credit) 879 1,655 (185) – – – 93 2,442Earnings after taxation 1,453 2,329 117 – – – (14) 3,885
[A] Includes Shell’s 23% share of Woodside, a publicly listed company on the Australian Securities Exchange. We have limited access to data; accordingly, the numbers are estimated.[B] Includes cash-paid royalties to governments outside North America.
2012 $ MILLIONNorth America South
AmericaEurope Asia Oceania[A] Africa USA Canada TotalThird party revenue 6,448 12,592 1,441 – 2,715 – 341 23,537Total 6,448 12,592 1,441 – 2,715 – 341 23,537Production costs excluding taxes 411 952 372 – 453 – 41 2,229Taxes other than income tax [B] 3,574 4,861 111 – 157 – 118 8,821Exploration 17 391 155 – 10 – – 573Depreciation, depletion and amortisation 209 1,310 335 – 269 – 41 2,164Other costs/(income) (390) 128 (80) – 13 – 252 (77)Earnings before taxation 2,627 4,950 548 – 1,813 – (111) 9,827Taxation charge 969 1,971 136 – 658 – 26 3,760Earnings after taxation 1,658 2,979 412 – 1,155 – (137) 6,067
[A] Includes Shell’s 23% share of Woodside as from April 2012 (previously: 24%), a publicly listed company on the Australian Securities Exchange. We have limited access to data; accordingly,the numbers are estimated.[B] Includes cash-paid royalties to governments outside North America.

158 FINANCIAL STATEMENTS AND SUPPLEMENTS
SUPPLEMENTARY INFORMATION – OIL AND GAS (UNAUDITED) SHELL ANNUAL REPORT AND FORM 20-F 2014
ACREAGE AND WELLSThe tables below reflect acreage and wells of Shell subsidiaries, joint ventures and associates. The term “gross” refers to the total activity in whichShell subsidiaries, joint ventures and associates have an interest. The term “net” refers to the sum of the fractional interests owned by Shellsubsidiaries plus the Shell share of joint ventures and associates’ fractional interests. Net data below are rounded to the nearest whole number.
OIL AND GAS ACREAGE (AT DECEMBER 31) THOUSAND ACRES2014 2013 2012
Developed Undeveloped Developed Undeveloped Developed UndevelopedGross Net Gross Net Gross Net Gross Net Gross Net Gross Net
Europe [A] 9,603 2,693 16,161 8,563 9,614 2,698 15,978 6,225 9,091 2,659 10,937 4,196Asia 25,724 9,252 46,487 25,155 26,349 9,275 56,373 27,791 26,989 9,400 53,460 26,604Oceania 1,657 433 71,941 25,992 1,659 466 74,055 29,811 1,703 467 70,575 26,469Africa 5,174 2,232 39,297 26,409 5,217 2,245 37,811 24,553 5,428 2,299 45,315 30,916North America – USA 1,635 1,131 6,133 5,047 1,901 1,213 8,432 6,613 1,837 1,176 8,878 6,990North America – Canada 1,132 748 33,094 27,223 1,259 832 33,307 28,677 1,181 785 31,086 25,117South America 100 52 8,637 4,081 162 89 15,116 7,210 162 76 17,242 9,668Total 45,025 16,541 221,750 122,470 46,161 16,818 241,072 130,880 46,391 16,862 237,493 129,960
[A] Includes Greenland.
NUMBER OF PRODUCTIVE WELLS [A] (AT DECEMBER 31)2014 2013 2012
Oil Gas Oil Gas Oil GasGross Net Gross Net Gross Net Gross Net Gross Net Gross Net
Europe 1,269 333 1,311 410 1,315 349 1,295 411 1,431 425 1,266 398Asia 7,529 2,643 353 198 8,187 2,578 340 192 7,392 2,345 248 118Oceania 44 3 625 235 44 5 655 244 48 5 574 217Africa 891 352 116 79 920 351 109 71 837 324 95 62North America – USA 15,313 7,760 2,555 1,849 15,347 8,150 4,316 2,878 15,108 7,630 4,618 2,808North America – Canada 325 320 1,125 878 337 331 1,238 949 460 393 1,165 880South America 25 15 7 2 74 31 7 2 73 29 7 2Total 25,396 11,426 6,092 3,651 26,224 11,795 7,960 4,747 25,349 11,151 7,973 4,485
[A] The number of productive wells with multiple completions (more than one formation producing into the same well bore) at December 31, 2014, was 1,815 gross (763 net); 2013: 2,200gross (805 net); 2012: 1,918 gross (694 net).
NUMBER OF NET PRODUCTIVE WELLS AND DRY HOLES DRILLED2014 2013 2012
Productive Dry Productive Dry Productive DryExploratory [A]
Europe 1 2 1 3 1 1Asia 2 10 2 9 3 4Oceania – 1 – 1 – 1Africa 4 4 6 3 3 7North America – USA 53 89 173[B] 33[B] 127[B] 11[B]North America – Canada 39 2 17[C] 2 37 9South America – 1 – 5 – 1
Total 99 109[D] 199 56 171 34Development
Europe 8 1 6 2 9 –Asia 243 9 218 6 255 4Oceania 6 1 12 – 7 –Africa 25 2 25 – 25 –North America – USA 392 3 447 2 352 –North America – Canada 22 – 57 1 49 2South America 3 – 4 – 1 –
Total 699 16 769 11 698 6
[A] Productive wells are wells with proved reserves allocated. Exploratory wells in the process of drilling are excluded and presented separately on page 159.[B] The number of net productive wells and dry holes drilled has been corrected from 175 and 34 respectively in 2013 and from 124 and 3 respectively in 2012.[C] The number of net productive wells has been corrected from 16.[D] Includes 50 net exploratory wells sold in North and South America.

FINANCIAL STATEMENTS AND SUPPLEMENTS 159
SHELL ANNUAL REPORT AND FORM 20-F 2014 SUPPLEMENTARY INFORMATION – OIL AND GAS (UNAUDITED)
NUMBER OF WELLS IN THE PROCESS OF EXPLORATORY DRILLING [A] 2014
At January 1
Wells in the process ofdrilling at January 1 and
allocated provedreserves during the year
Wells in the process ofdrilling at January 1 anddetermined as dry during
the yearNew wells in the process
of drilling at December 31 At December 31Gross Net Gross Net Gross Net Gross Net Gross Net
Europe 27 9 (2) (1) (3) (2) 5 2 27 8Asia 105[B] 65[B] (1) (1) (17) (16) 35 15 122 63Oceania 526 182[C] – – (1) – 23 10 548 192Africa 36 19 (9) (6) (4) (2) 4 2 27 13North America – USA 255[D] 220[D] (51) (36) (116) (103) 55 32 143 113North America – Canada 231 211[C] (113) (99) (12) (11) 81 69 187 170South America 20[B] 12[B] (2) (1) (5) (2) 8 5 21 14Total 1,200 718 (178) (144) (158) (136) 211 135 1,075 573
[A] Wells in the process of drilling includes exploratory wells temporarily suspended.[B] Corrected from 103 gross (63 net) for Asia and 16 gross (9 net) for South America.[C] Amended from 186 and 210 for Oceania and Canada respectively to reflect Shell’s working interest effective from January 1, 2014.[D] Gross reduced from 256 due to a correction and net reduced from 221 due to the combined effect of this correction and a change in Shell’s working interest effective from January 1, 2014.
NUMBER OF WELLS IN THE PROCESS OF DEVELOPMENT DRILLING [A] 2014At January 1 At December 31
Gross Net Gross NetEurope 13 3 13 3Asia 56 18 60 18Oceania 27 10 19 9Africa 9 5 10 5North America – USA 175 102 47 37North America – Canada 8 6 11 11South America 8 6 – –Total 296 150 160 83
[A] In addition to the present activities mentioned above, Shell has ongoing activities related to the installation of water flood projects in Europe, Asia and Africa. Activities related to steam floodsare in progress in Europe, Asia and North America, and gas compression is being installed in Europe and Asia.

160 FINANCIAL STATEMENTS AND SUPPLEMENTS
PARENT COMPANY FINANCIAL STATEMENTS SHELL ANNUAL REPORT AND FORM 20-F 2014
INDEPENDENT AUDITORS’REPORT TO THE MEMBERS OFROYAL DUTCH SHELL PLCREPORT ON THE PARENT COMPANY FINANCIALSTATEMENTS
Our opinionIn our opinion the Parent Company Financial Statements of Royal DutchShell plc (the Company):
� give a true and fair view of the state of the Company’s affairs as atDecember 31, 2014, and of its income and cash flows for the yearthen ended;
� have been properly prepared in accordance with InternationalFinancial Reporting Standards (IFRS) as adopted by the EuropeanUnion; and
� have been prepared in accordance with the requirements of theCompanies Act 2006.
Separate opinion in relation to IFRS as issued by theInternational Accounting Standards Board (IASB)As explained in Note 1 to the Parent Company Financial Statements,the Company, in addition to complying with its legal obligation toapply IFRS as adopted by the European Union, has also applied IFRSas issued by IASB.
In our opinion, the Parent Company Financial Statements comply withIFRS as issued by the IASB.
What we have auditedThe Parent Company Financial Statements comprise:
� the Parent Company Statement of Income and Parent CompanyStatement of Comprehensive Income for the year endedDecember 31, 2014;
� the Parent Company Balance Sheet as at December 31, 2014;� the Parent Company Statement of Changes in Equity for the year
ended December 31, 2014;� the Parent Company Statement of Cash Flows for the year ended
December 31, 2014; and� the Notes to the Parent Company Financial Statements, which
include a summary of significant accounting policies and otherexplanatory information.
Certain required disclosures have been presented elsewhere in theAnnual Report and Form 20-F (the Annual Report), rather than in theParent Company Financial Statements. These are cross-referenced fromthe Parent Company Financial Statements and are identified asaudited.
The financial reporting framework that has been applied in thepreparation of the Parent Company Financial Statements is applicablelaw and IFRS as adopted by the European Union.
OTHER REQUIRED REPORTING
Consistency of other information
COMPANIES ACT 2006 OPINIONIn our opinion, the information given in the Strategic Report and theDirectors’ Report for the financial year for which the Parent CompanyFinancial Statements are prepared is consistent with the ParentCompany Financial Statements.
ISAS (UK AND IRELAND) REPORTINGUnder International Standards on Auditing (UK and Ireland) (ISAs(UK and Ireland)) we are required to report to you if, in our opinion,information in the Annual Report is:
� materially inconsistent with the information in the audited ParentCompany Financial Statements; or
� apparently materially incorrect based on, or materially inconsistentwith, our knowledge of the Company acquired in the course ofperforming our audit; or
� otherwise misleading.
We have no exceptions to report arising from this responsibility.
Adequacy of accounting records and information andexplanations receivedUnder the Companies Act 2006 we are required to report to you if, inour opinion:
� we have not received all the information and explanations werequire for our audit; or
� adequate accounting records have not been kept by the Company,or returns adequate for our audit have not been received frombranches not visited by us; or
� the Parent Company Financial Statements and the part of theDirectors’ Remuneration Report to be audited are not in agreementwith the accounting records and returns.
We have no exceptions to report arising from this responsibility.
Directors’ remuneration
DIRECTORS’ REMUNERATION REPORT – COMPANIES ACT 2006 OPINIONIn our opinion, the part of the Directors’ Remuneration Report to beaudited has been properly prepared in accordance with theCompanies Act 2006.
OTHER COMPANIES ACT 2006 REPORTINGUnder the Companies Act 2006 we are required to report to you if, inour opinion, certain disclosures of Directors’ remuneration specified bylaw are not made. We have no exceptions to report arising from thisresponsibility.
RESPONSIBILITIES FOR THE PARENT COMPANYFINANCIAL STATEMENTS AND THE AUDIT
Our responsibilities and those of the DirectorsAs explained more fully in the Directors’ Responsibilities Statement setout on pages 62 and 63, the Directors are responsible for thepreparation of the Parent Company Financial Statements and for beingsatisfied that they give a true and fair view.
Our responsibility is to audit and express an opinion on the ParentCompany Financial Statements in accordance with applicable law andISAs (UK and Ireland). Those standards require us to comply with theAuditing Practices Board’s Ethical Standards for Auditors.

FINANCIAL STATEMENTS AND SUPPLEMENTS 161
SHELL ANNUAL REPORT AND FORM 20-F 2014 PARENT COMPANY FINANCIAL STATEMENTS
This report, including the opinions, has been prepared for and only forthe Company’s members as a body in accordance with Chapter 3 ofPart 16 of the Companies Act 2006 and for no other purpose. We donot, in giving these opinions, accept or assume responsibility for anyother purpose or to any other person to whom this report is shown orinto whose hands it may come save where expressly agreed by ourprior consent in writing.
What an audit of financial statements involvesWe conducted our audit in accordance with ISAs (UK and Ireland). Anaudit involves obtaining evidence about the amounts and disclosures inthe Parent Company Financial Statements sufficient to give reasonableassurance that the Parent Company Financial Statements are free frommaterial misstatement, whether caused by fraud or error. This includesan assessment of:
� whether the accounting policies are appropriate to the Company’scircumstances and have been consistently applied and adequatelydisclosed;
� the reasonableness of significant accounting estimates made by theDirectors; and
� the overall presentation of the Parent Company Financial Statements.
We primarily focus our work in these areas by assessing the Directors’judgements against available evidence, forming our own judgementsand evaluating the disclosures in the Parent Company FinancialStatements.
We test and examine information, using sampling and other auditingtechniques, to the extent we consider necessary to provide areasonable basis for us to draw conclusions. We obtain auditevidence through testing the effectiveness of controls, substantiveprocedures or a combination of both.
In addition, we read all the financial and non-financial information inthe Annual Report to identify material inconsistencies with the auditedParent Company Financial Statements and to identify any informationthat is apparently materially incorrect based on, or materiallyinconsistent with, the knowledge acquired by us in the course ofperforming the audit. If we become aware of any apparent materialmisstatements or inconsistencies we consider the implications for ourreport.
OTHER MATTERWe have reported separately on the Consolidated FinancialStatements of Royal Dutch Shell plc for the year ended December 31,2014.
Ross Hunter (Senior Statutory Auditor)for and on behalf of PricewaterhouseCoopers LLPChartered Accountants and Statutory AuditorsLondon, United KingdomMarch 11, 2015
Note that the report set out above is included for the purposes ofRoyal Dutch Shell plc’s Annual Report and Accounts for 2014 only anddoes not form part of Royal Dutch Shell plc’s Annual Report on Form20-F for 2014.

162 FINANCIAL STATEMENTS AND SUPPLEMENTS
PARENT COMPANY FINANCIAL STATEMENTS SHELL ANNUAL REPORT AND FORM 20-F 2014
PARENT COMPANY FINANCIALSTATEMENTS
The Parent Company Financial Statements have not been audited inaccordance with the standards of the Public Company AccountingOversight Board (United States).
163 Statement of Income163 Statement of Comprehensive Income163 Balance Sheet164 Statement of Changes in Equity164 Statement of Cash Flows165 Notes to the Parent Company Financial Statements165 Note 1 Basis of preparation165 Note 2 Accounting policies166 Note 3 Finance income and expense166 Note 4 Investments in subsidiaries166 Note 5 Accounts receivable166 Note 6 Cash and cash equivalents166 Note 7 Accounts payable and accrued liabilities167 Note 8 Taxation167 Note 9 Financial instruments167 Note 10 Share capital169 Note 11 Other reserves169 Note 12 Dividends169 Note 13 Legal proceedings and other contingencies169 Note 14 Directors and Senior Management169 Note 15 Related parties170 Note 16 Auditor’s remuneration

FINANCIAL STATEMENTS AND SUPPLEMENTS 163
SHELL ANNUAL REPORT AND FORM 20-F 2014 PARENT COMPANY FINANCIAL STATEMENTS
STATEMENT OF INCOME $ MILLIONNOTES 2014 2013
Dividend income 18,031 13,693Finance income 3 49 620Administrative expenses (57) (73)Finance expense 3 (1,956) (19)Income before taxation 16,067 14,221Taxation 8 12 28Income for the period 16,079 14,249
STATEMENT OF COMPREHENSIVE INCOME $ MILLION2014 2013
Income for the period 16,079 14,249Comprehensive income for the period 16,079 14,249
BALANCE SHEET $ MILLIONNOTES Dec 31, 2014 Dec 31, 2013
AssetsNon-current assetsInvestments in subsidiaries 4 202,791 202,458Deferred tax 8 493 565
203,284 203,023Current assetsAccounts receivable 5 20,652 15,032Cash and cash equivalents 6 168 215
20,820 15,247Total assets 224,104 218,270LiabilitiesNon-current liabilitiesAccounts payable and accrued liabilities 7 260 15
260 15Current liabilitiesAccounts payable and accrued liabilities 7 2,856 1,632
2,856 1,632Total liabilities 3,116 1,647EquityShare capital 10 540 542Other reserves 11 201,745 201,898Retained earnings 18,703 14,183Total equity 220,988 216,623Total liabilities and equity 224,104 218,270
Signed on behalf of the Board
/s/ Simon Henry
Simon HenryChief Financial OfficerMarch 11, 2015

164 FINANCIAL STATEMENTS AND SUPPLEMENTS
PARENT COMPANY FINANCIAL STATEMENTS SHELL ANNUAL REPORT AND FORM 20-F 2014
STATEMENT OF CHANGES IN EQUITY $ MILLION
NOTESShare
capitalOther
reservesRetainedearnings
Totalequity
At January 1, 2014 542 201,898 14,183 216,623Comprehensive income for the period – – 16,079 16,079Dividends paid 12 – – (11,843) (11,843)Scrip dividends 12 6 (6) 2,399 2,399Repurchases of shares 11 (8) 8 (2,787) (2,787)Share-based compensation 11 – (155) 672 517At December 31, 2014 540 201,745 18,703 220,988At January 1, 2013 542 202,052 12,254 214,848Comprehensive income for the period – – 14,249 14,249Dividends paid 12 – – (11,338) (11,338)Scrip dividends 12 12 (12) 4,140 4,140Repurchases of shares 11 (12) 12 (5,757) (5,757)Share-based compensation 11 – (154) 635 481At December 31, 2013 542 201,898 14,183 216,623
STATEMENT OF CASH FLOWS $ MILLIONNOTES 2014 2013
Cash flow from operating activitiesIncome for the period 16,079 14,249Adjustment for:
Dividend income (18,031) (13,693)Taxation (12) (28)Interest income (7) (2)Interest expense 14 19Share-based compensation 27 27Increase in working capital (3,771) (2,472)
Net cash used in operating activities (5,701) (1,900)Cash flow from investing activitiesDividends received 18,031 13,693Interest received 7 2Share-based compensation 402 517Net cash from investing activities 18,440 14,212Cash flow from financing activitiesCash dividends paid 12 (9,444) (7,198)Repurchases of shares (3,328) (5,000)Interest paid (14) (19)Net cash used in financing activities (12,786) (12,217)(Decrease)/increase in cash and cash equivalents (47) 95Cash and cash equivalents at January 1 215 120Cash and cash equivalents at December 31 6 168 215

FINANCIAL STATEMENTS AND SUPPLEMENTS 165
SHELL ANNUAL REPORT AND FORM 20-F 2014 PARENT COMPANY FINANCIAL STATEMENTS
NOTES TO THE PARENT COMPANY FINANCIAL STATEMENTS1 BASIS OF PREPARATIONThe Financial Statements of Royal Dutch Shell plc (the Company) have been prepared in accordance with the provisions of the Companies Act2006 and with International Financial Reporting Standards (IFRS) as adopted by the European Union. As applied to the Company, there are nomaterial differences from IFRS as issued by the International Accounting Standards Board (IASB); therefore, the Financial Statements have beenprepared in accordance with IFRS as issued by the IASB.
As described in the accounting policies in Note 2, the Financial Statements have been prepared under the historical cost convention except forcertain items measured at fair value. Those accounting policies have been applied consistently in all periods presented.
The Financial Statements were approved and authorised for issue by the Board of Directors on March 11, 2015.
The preparation of financial statements in conformity with IFRS requires the use of certain accounting estimates. It also requires management toexercise its judgement in the process of applying the Company’s accounting policies. Actual results may differ from these estimates.
The financial results of the Company are included in the Consolidated Financial Statements on pages 106-141. The financial results of theCompany incorporate the results of the Dividend Access Trust (the Trust), the financial statements for which are presented on pages 174-178.
The Company’s principal activity is being the parent company for Shell, as described in Note 1 to the Consolidated Financial Statements.
2 ACCOUNTING POLICIESExcept for the following accounting policies that specifically relate to the Company, the Company’s accounting policies follow those of Shell asset out in Note 2 to the Consolidated Financial Statements.
Presentation currencyThe Company’s presentation and functional currency is US dollars (dollars).
InvestmentsInvestments in subsidiaries are stated at cost, net of any impairment. Key accounting estimates and judgements affecting the assessment andmeasurement of impairment follow those set out in Note 3 to the Consolidated Financial Statements.
The original cost of the Company’s investment in Royal Dutch Petroleum Company (Royal Dutch) was based on the fair value of the sharestransferred to the Company by the former shareholders of Royal Dutch in exchange for A shares in the Company during the public exchange offerin 2005. The original cost of the Company’s investment in The “Shell” Transport and Trading Company, p.l.c., now The Shell Transport andTrading Company Limited (Shell Transport), was the fair value of the shares held by the former shareholders of The “Shell” Transport and TradingCompany, p.l.c. transferred in consideration for the issuance of B shares as part of the Scheme of Arrangement in 2005. The Company’sinvestments in Royal Dutch and Shell Transport now represent an investment in Shell Petroleum N.V. (Shell Petroleum); this change had no impacton the cost of investments in subsidiaries.
Dividend incomeInterim dividends are recognised on a paid basis unless the dividend has been confirmed by a general meeting of Shell Transport or of ShellPetroleum, in which case income is recognised on the date at which receipt is deemed virtually certain.
Share-based compensation plansThe fair value of share-based compensation for equity-settled plans granted to employees of subsidiaries under the Company’s plans is recognisedas an investment in subsidiaries from the date of grant over the vesting period with a corresponding increase in equity. The change in the fairvalue of share-based compensation for cash-settled plans relating to employees of subsidiaries is recognised as an investment in subsidiaries witha corresponding change in liabilities. In the year of vesting of a plan, the costs for the actual deliveries are charged to the relevant employingsubsidiaries. This is recognised as a realisation of the investment originally booked. If the actual vesting costs are higher than the cumulativelyrecognised share-based compensation charge, the difference is recognised in income.
Refer to Note 21 to the Consolidated Financial Statements for information on the Company’s principal plan.
TaxationThe Company is tax-resident in the Netherlands. For the assessment of corporate income tax in the Netherlands, the Company and certain of itssubsidiaries form a fiscal unit, in respect of which the Company recognises any current tax receivable or payable (or deferred tax asset or liability)for the fiscal unit as a whole.
The Company’s tax charge or credit recognised in income is calculated at the statutory tax rate prevailing in the Netherlands.

166 FINANCIAL STATEMENTS AND SUPPLEMENTS
PARENT COMPANY FINANCIAL STATEMENTS SHELL ANNUAL REPORT AND FORM 20-F 2014
3 FINANCE INCOME AND EXPENSE
$ MILLION2014 2013
Finance incomeInterest income 7 2Other income 42 –Foreign exchange gains – 618
Total 49 620Finance expense
Interest expense (14) (19)Foreign exchange losses (1,942) –
Total (1,956) (19)
4 INVESTMENTS IN SUBSIDIARIES
$ MILLION2014 2013
At January 1 202,458 202,490Share-based compensation 753 520Recovery of vested share-based compensation (420) (552)At December 31 202,791 202,458
5 ACCOUNTS RECEIVABLE
$ MILLIONDec 31, 2014 Dec 31, 2013
Amounts due from subsidiaries (see Note 15) 20,652 15,027Other receivables – 5Total 20,652 15,032
6 CASH AND CASH EQUIVALENTSCash and cash equivalents comprise call deposits in euros, sterling and dollars with Shell Treasury Centre Limited, a subsidiary. The Companyearned interest on these balances of less than $1 million in 2014 (2013: less than $1 million).
7 ACCOUNTS PAYABLE AND ACCRUED LIABILITIES
$ MILLIONDec 31, 2014 Dec 31, 2013
Current Non-current Current Non-currentAmounts due to subsidiaries (see Note 15) 2,179 – 497 –Withholding tax payable 249 – 121 –Accruals and other liabilities 426 260 1,012 15Unclaimed dividends 2 – 2 –Total 2,856 260 1,632 15
Accruals and other liabilities principally comprise commitments for share repurchases undertaken on the Company’s behalf under irrevocable, non-discretionary arrangements and liabilities in respect of cash-settled share-based compensation.

FINANCIAL STATEMENTS AND SUPPLEMENTS 167
SHELL ANNUAL REPORT AND FORM 20-F 2014 PARENT COMPANY FINANCIAL STATEMENTS
8 TAXATION
TAXATION CREDIT $ MILLION2014 2013
Current taxationCredit in respect of current period – (13)
Total – (13)Deferred taxation
Relating to the origination and reversal of temporary differencesAdjustment in respect of prior periods
(6)(6)
(19)4
Total (12) (15)Total taxation credit (12) (28)
RECONCILIATION OF APPLICABLE TAX CHARGE AT STATUTORY RATE TO TAXATION CREDIT $ MILLION2014 2013
Income before taxation 16,067 14,221Applicable tax charge at the statutory tax rate of 25.0% (2013: 25.0%) 4,017 3,555Adjustments in respect of prior periods (6) 4Tax effects of:
Income not subject to tax (4,038) (3,582)Expenses not deductible for tax purposes 7 8
Other reconciling items 8 (13)Taxation credit (12) (28)
Taxes payable are reported within accounts payable and accrued liabilities (see Note 7).
DEFERRED TAX ASSETS $ MILLION2014 2013
At January 1 565 351Recognised in income 12 15Other movements (84) 199At December 31 493 565
Deferred tax assets are principally recognised in respect of tax losses, which are available for relief against future taxable profits for up to nineyears from the year in which the losses were incurred.
9 FINANCIAL INSTRUMENTSFinancial assets and liabilities in the Company’s Balance Sheet comprise cash and cash equivalents (see Note 6), accounts receivable (seeNote 5) and certain amounts reported within accounts payable and accrued liabilities (see Note 7).
Foreign currency derivatives are used by the Company to manage foreign exchange risk. Foreign exchange risk arises when certain transactionsare denominated in a currency that is not the Company’s functional currency. There were no derivative financial instruments held at December 31,2014 or 2013.
The fair value of financial assets and liabilities at December 31, 2014 and 2013 approximates their carrying amount.
Information on financial risk management is presented in Note 19 to the Consolidated Financial Statements.
10 SHARE CAPITAL
ISSUED AND FULLY PAID NUMBER OF SHARESOrdinary shares of €0.07 each Sterling deferred
shares of £1 eachA BAt January 1, 2014 3,898,011,213 2,472,839,187 50,000Scrip dividends 64,568,758 – –Repurchases of shares (55,277,578) (32,428,573) –At December 31, 2014 3,907,302,393 2,440,410,614 50,000At January 1, 2013 3,772,388,687 2,617,715,189 50,000Scrip dividends 125,622,526 – –Repurchases of shares – (144,876,002) –At December 31, 2013 3,898,011,213 2,472,839,187 50,000

168 FINANCIAL STATEMENTS AND SUPPLEMENTS
PARENT COMPANY FINANCIAL STATEMENTS SHELL ANNUAL REPORT AND FORM 20-F 2014
[Note 10 continued]
NOMINAL VALUE $ MILLIONOrdinary shares of €0.07 each
A B TotalAt January 1, 2014 333 209 542Scrip dividends 6 – 6Repurchases of shares (5) (3) (8)At December 31, 2014 334 206 540At January 1, 2013 321 221 542Scrip dividends 12 – 12Repurchases of shares – (12) (12)At December 31, 2013 333 209 542
The total nominal value of sterling deferred shares is less than $1 million.
A and B shares repurchased in 2014 and 2013 under the Company’s share buyback programme were all cancelled.
At the Company’s Annual General Meeting (AGM) on May 20, 2014, the Board was authorised to allot ordinary shares in the Company and togrant rights to subscribe for or to convert any security into ordinary shares in the Company, up to an aggregate nominal amount of €147 million(representing 2,100 million ordinary shares of €0.07 each), and to list such shares or rights on any stock exchange. This authority expires at theearlier of the close of business on August 20, 2015, and the end of the AGM to be held in 2015, unless previously renewed, revoked or variedby the Company in a general meeting.
B shares rank pari passu in all respects with A shares except for the dividend access mechanism described below. The Company and ShellTransport can procure the termination of the dividend access mechanism at any time. Upon such termination, B shares will form one class withA shares ranking pari passu in all respects and A and B shares will be known as ordinary shares without further distinction.
The sterling deferred shares are redeemable only at the discretion of the Company for £1 each and carry no voting rights. There are no furtherrights to participate in profits or assets, including the right to receive dividends. Upon winding up or liquidation, the shares carry a right torepayment of paid-up nominal value, ranking ahead of A and B shares.
For information on the number of shares in the Company held by Shell employee share ownership trusts and trust-like entities to meet deliverycommitments under employee share plans, refer to Note 21 to the Consolidated Financial Statements.
Dividend access mechanism for B shares
GENERALDividends paid on A shares have a Dutch source for tax purposes and are subject to Dutch withholding tax.
It is the expectation and the intention, although there can be no certainty, that holders of B shares will receive dividends via the dividend accessmechanism. Any dividends paid on the dividend access share will have a UK source for Dutch and UK tax purposes; there will be no UK or Dutchwithholding tax on such dividends and certain holders (not including US holders) of B shares or B American Depositary Shares (ADSs) will beentitled to a UK tax credit in respect of their proportional share of such dividends.
DESCRIPTION OF DIVIDEND ACCESS MECHANISMA dividend access share has been issued by Shell Transport to Computershare Trustees (Jersey) Limited as dividend access trustee (the Trustee).Pursuant to a declaration of trust, the Trustee will hold any dividends paid in respect of the dividend access share on trust for the holders ofB shares from time to time and will arrange for prompt disbursement of such dividends to holders of B shares. Interest and other income earned onunclaimed dividends will be for the account of Shell Transport and any dividends that are unclaimed after 12 years will revert to Shell Transport.Holders of B shares will not have any interest in the dividend access share and will not have any rights against Shell Transport as issuer of thedividend access share. The only assets held on trust for the benefit of the holders of B shares will be dividends paid to the Trustee in respect of thedividend access share.
The declaration and payment of dividends on the dividend access share will require Board action by Shell Transport and will be subject to anyapplicable legal or articles limitations in effect from time to time. In no event will the aggregate amount of the dividend paid by Shell Transportunder the dividend access mechanism for a particular period exceed the aggregate amount of the dividend declared by the Company’s Board onB shares in respect of the same period.
OPERATION OF THE DIVIDEND ACCESS MECHANISMIf, in connection with the declaration of a dividend by the Company on B shares, the Board of Shell Transport elects to declare and pay adividend on the dividend access share to the Trustee, the holders of B shares will be beneficially entitled to receive their share of that dividendpursuant to the declaration of trust (and arrangements will be made to ensure that the dividend is paid in the same currency in which they wouldhave received a dividend from the Company).

FINANCIAL STATEMENTS AND SUPPLEMENTS 169
SHELL ANNUAL REPORT AND FORM 20-F 2014 PARENT COMPANY FINANCIAL STATEMENTS
If any amount is paid by Shell Transport by way of a dividend on the dividend access share and paid by the Trustee to any holder of B shares,the dividend which the Company would otherwise pay on B shares will be reduced by an amount equal to the amount paid to such holders ofB shares by the Trustee.
The Company will have a full and unconditional obligation, in the event that the Trustee does not pay an amount to holders of B shares on a cashdividend payment date (even if that amount has been paid to the Trustee), to pay immediately the dividend declared on B shares. The right ofholders of B shares to receive distributions from the Trustee will be reduced by an amount equal to the amount of any payment actually made bythe Company on account of any dividend on B shares.
The dividend access mechanism may be suspended or terminated at any time by the Company’s Directors or the Directors of Shell Transport, forany reason and without financial recompense. This might, for instance, occur in response to changes in relevant tax legislation.
11 OTHER RESERVES
$ MILLIONMergerreserve
Share premiumreserve
Capital redemptionreserve
Share planreserve Total
At January 1, 2014 200,344 154 75 1,325 201,898Scrip dividends (6) – – – (6)Repurchases of shares – – 8 – 8Share-based compensation – – – (155) (155)At December 31, 2014 200,338 154 83 1,170 201,745At January 1, 2013 200,356 154 63 1,479 202,052Scrip dividends (12) – – – (12)Repurchases of shares – – 12 – 12Share-based compensation – – – (154) (154)At December 31, 2013 200,344 154 75 1,325 201,898
The merger reserve was established as a consequence of the Company becoming the single parent company of Royal Dutch and Shell Transportand represented the difference between the cost of the investment in those companies and the nominal value of shares issued in exchange forthose investments as required by the prevailing legislation at that time, section 131 of the Companies Act 1985.
On January 6, 2006, loan notes were converted into 4,827,974 A shares. The difference between the carrying value of the loan notes and thenominal value of the new shares issued was credited to the share premium reserve. The capital redemption reserve was established in connectionwith repurchases of shares of the Company. The share plan reserve represents the fair value of share-based compensation granted to employeesof subsidiaries under the Company’s equity-settled plans.
12 DIVIDENDSRefer to Note 23 to the Consolidated Financial Statements.
13 LEGAL PROCEEDINGS AND OTHER CONTINGENCIESRefer to Note 25 to the Consolidated Financial Statements.
14 DIRECTORS AND SENIOR MANAGEMENTRefer to Note 27 to the Consolidated Financial Statements for the remuneration of Directors of the Company. In 2014, the Company recognised$25 million (2013: $30 million) in administrative expenses for the compensation of Directors and Senior Management.
15 RELATED PARTIESInformation about significant subsidiaries at December 31, 2014, is set out in Exhibit 8. The Company has no direct interest in incorporated jointarrangements and associates. A complete list of investments in subsidiaries, incorporated joint arrangements and associates will be attached tothe Company’s annual return made to the Registrar of Companies.
$ MILLIONAmounts due from subsidiaries
(See Note 5)Amounts due to subsidiaries
(See Note 7)2014 2013 2014 2013
Shell Petroleum 20,650 14,800 455 497Shell Treasury Luxembourg Sarl – 227 1,724 –Shell International Finance B.V. 2 – – –Total 20,652 15,027 2,179 497
The amount due from Shell Petroleum, which is denominated in dollars, is repayable on demand. Interest is calculated at US LIBOR less 0.125%and interest income in 2014 was less than $1 million (2013: $1 million).

170 FINANCIAL STATEMENTS AND SUPPLEMENTS
PARENT COMPANY FINANCIAL STATEMENTS SHELL ANNUAL REPORT AND FORM 20-F 2014
[Note 15 continued]
The net amount due to (2013: due from) Shell Treasury Luxembourg Sarl at December 31, 2014, comprises an interest-bearing receivable of€15,537 million (2013: €11,014 million) and an interest-bearing payable of $20,610 million (2013: $14,939 million). Interest on eurobalances is calculated at EONIA less 0.1% (2013: EONIA less 0.125%) and on dollar balances at US LIBOR (2013: US LIBOR). Net interestexpense on these balances in 2014 was $7 million (2013: $18 million).
Other transactions and balancesThe Company enters into forward and spot foreign currency contracts with Treasury companies, which are subsidiaries. There were no openforeign currency contracts at December 31, 2014 or 2013.
The Company settles general and administrative expenses of the Trust, including the auditor’s remuneration.
The Company has guaranteed contractual payments totalling $34,826 million at December 31, 2014 (2013: $35,230 million), and relatedinterest in respect of listed debt issued by Shell International Finance B.V.
16 AUDITOR’S REMUNERATIONRefer to Note 28 to the Consolidated Financial Statements.

FINANCIAL STATEMENTS AND SUPPLEMENTS 171
SHELL ANNUAL REPORT AND FORM 20-F 2014 ROYAL DUTCH SHELL DIVIDEND ACCESS TRUSTFINANCIAL STATEMENTS
INDEPENDENT AUDITORS’REPORT TO COMPUTERSHARETRUSTEES (JERSEY) LIMITED ASTRUSTEE OF THE ROYALDUTCH SHELL DIVIDENDACCESS TRUSTREPORT ON THE FINANCIAL STATEMENTS
Our opinionIn our opinion the Financial Statements of the Royal Dutch ShellDividend Access Trust (the Trust):
� give a true and fair view of the state of the Trust’s affairs as atDecember 31, 2014, and of its income and cash flows for the yearthen ended; and
� have been properly prepared in accordance with InternationalFinancial Reporting Standards (IFRS) as adopted by the EuropeanUnion.
Separate opinion in relation to IFRS as issued by theInternational Accounting Standards Board (IASB)As explained in Note 2 to the Royal Dutch Shell Dividend Access TrustFinancial Statements, the Trust, in addition to complying with its legalobligation to apply IFRS as adopted by the European Union, has alsoapplied IFRS as issued by the IASB.
In our opinion the Royal Dutch Shell Dividend Access Trust FinancialStatements comply with IFRS as issued by the IASB.
What we have auditedThe Royal Dutch Shell Dividend Access Trust Financial Statementscomprise:
� the Royal Dutch Shell Dividend Access Trust Statement of Income andthe Royal Dutch Shell Dividend Access Trust Statement ofComprehensive Income for the year ended December 31, 2014;
� the Royal Dutch Shell Dividend Access Trust Balance Sheet as atDecember 31, 2014;
� the Royal Dutch Shell Dividend Access Trust Statement of Changes inEquity for the year ended December 31, 2014;
� the Royal Dutch Shell Dividend Access Trust Statement of Cash Flowsfor the year ended December 31, 2014; and
� the Notes to the Royal Dutch Shell Dividend Access Trust FinancialStatements, which include a summary of significant accountingpolicies and other explanatory information.
Certain required disclosures have been presented elsewhere in theRoyal Dutch Shell plc Annual Report and Form 20-F (the AnnualReport), rather than in the Royal Dutch Shell Dividend Access TrustFinancial Statements. These are cross-referenced from the Royal DutchShell Dividend Access Trust Financial Statements and are identified asaudited.
The financial reporting framework that has been applied in thepreparation of the Royal Dutch Shell Dividend Access Trust FinancialStatements is applicable law and IFRS as adopted by the EuropeanUnion.
What an audit of financial statements involvesWe conducted our audit in accordance with International Standardson Auditing (UK and Ireland) (ISAs (UK and Ireland)). An audit involvesobtaining evidence about the amounts and disclosures in the RoyalDutch Shell Dividend Access Trust Financial Statements sufficient to givereasonable assurance that the Royal Dutch Shell Dividend Access TrustFinancial Statements are free from material misstatement, whethercaused by fraud or error. This includes an assessment of:
� whether the accounting policies are appropriate to the Trust’scircumstances and have been consistently applied and adequatelydisclosed;
� the reasonableness of significant accounting estimates made by theTrustee; and
� the overall presentation of the Royal Dutch Shell Dividend AccessTrust Financial Statements.
We primarily focus our work in these areas by assessing the Trustee’sjudgements against available evidence, forming our own judgementsand evaluating the disclosures in the Royal Dutch Shell DividendAccess Trust Financial Statements.
We test and examine information, using sampling and other auditingtechniques, to the extent we consider necessary to provide areasonable basis for us to draw conclusions. We obtain auditevidence through testing the effectiveness of controls, substantiveprocedures or a combination of both.
In addition, we read all the financial and non-financial information inthe Annual Report to identify material inconsistencies with the auditedRoyal Dutch Shell Dividend Access Trust Financial Statements and toidentify any information that is apparently materially incorrect basedon, or materially inconsistent with, the knowledge acquired by us in thecourse of performing the audit. If we become aware of any apparentmaterial misstatements or inconsistencies we consider the implicationsfor our report.
OPINION ON OTHER MATTERIn our opinion the information given in the Annual Report for thefinancial year for which the Royal Dutch Shell Dividend Access TrustFinancial Statements are prepared is consistent with the Royal DutchShell Dividend Access Trust Financial Statements.
MATTERS ON WHICH WE HAVE AGREED TO REPORTBY EXCEPTIONWe have agreed to report to you if, in our opinion:
� we have not received all the information and explanations werequire for our audit; or
� adequate accounting records have not been kept; or� the Royal Dutch Shell Dividend Access Trust Financial Statements are
not in agreement with the accounting records.
We have no exceptions to report arising from this responsibility.
RESPONSIBILITIES FOR THE FINANCIAL STATEMENTSAND THE AUDIT
Our responsibilities and those of the TrusteeThe Trustee is responsible for the preparation of the Royal Dutch ShellDividend Access Trust Financial Statements and for being satisfied thatthey give a true and fair view.
Our responsibility is to audit and express an opinion on the RoyalDutch Shell Dividend Access Trust Financial Statements in accordancewith applicable law and ISAs (UK and Ireland). Those standardsrequire us to comply with the Auditing Practices Board’s EthicalStandards for Auditors.
172 FINANCIAL STATEMENTS AND SUPPLEMENTS
ROYAL DUTCH SHELL DIVIDEND ACCESS TRUSTFINANCIAL STATEMENTS
SHELL ANNUAL REPORT AND FORM 20-F 2014
This report, including the opinions, has been prepared for and only forthe Trustee as a body and for no other purpose. We do not, in givingthese opinions, accept or assume responsibility for any other purposeor to any other person to whom this report is shown or into whosehands it may come save where expressly agreed by our prior consentin writing.
PricewaterhouseCoopers CI LLPChartered AccountantsJersey, Channel IslandsMarch 11, 2015
Note that the report set out above is included for the purposes ofRoyal Dutch Shell plc’s Annual Report and Accounts for 2014 only anddoes not form part of Royal Dutch Shell plc’s Annual Report onForm 20-F for 2014.

FINANCIAL STATEMENTS AND SUPPLEMENTS 173
SHELL ANNUAL REPORT AND FORM 20-F 2014 ROYAL DUTCH SHELL DIVIDEND ACCESS TRUSTFINANCIAL STATEMENTS
REPORT OF INDEPENDENTREGISTERED PUBLICACCOUNTING FIRMTO COMPUTERSHARE TRUSTEES (JERSEY) LIMITED ASTRUSTEE OF THE ROYAL DUTCH SHELL DIVIDENDACCESS TRUST AND THE BOARD OF DIRECTORS ANDSHAREHOLDERS OF ROYAL DUTCH SHELL PLC
Our opinionIn our opinion, the accompanying Statement of Income, the Statementof Comprehensive Income, the Balance Sheet, the Statement ofChanges in Equity, the Statement of Cash Flows, and the relatedNotes to the Royal Dutch Shell Dividend Access Trust FinancialStatements present fairly, in all material respects, the financial positionof the Royal Dutch Shell Dividend Access Trust (the Trust) at December31, 2014 and December 31, 2013, and the results of its operationsand its cash flows for each of the three years in the period endedDecember 31, 2014 in conformity with International FinancialReporting Standards as issued by the International AccountingStandards Board and in conformity with International FinancialReporting Standards as adopted by the European Union. Also in ouropinion, the Trust maintained, in all material respects, effective internalcontrol over financial reporting as of December 31, 2014, based oncriteria established in Internal Control – Integrated Framework (2013)issued by the Committee of Sponsoring Organizations of the TreadwayCommission (COSO). The Trustee and the management of Royal DutchShell plc are responsible for these Financial Statements, for maintainingeffective internal control over financial reporting and for its assessmentof the effectiveness of internal control over financial reporting, includedin the Trustee’s and Management’s Report on Internal Control overFinancial Reporting of the Royal Dutch Shell Dividend Access Trust setout on page 71. Our responsibility is to express opinions on theseFinancial Statements and on the Trust’s internal control over financialreporting based on our integrated audits. We conducted our audits inaccordance with the standards of the Public Company AccountingOversight Board (United States). Those standards require that we planand perform the audits to obtain reasonable assurance about whetherthe Financial Statements are free of material misstatement and whethereffective internal control over financial reporting was maintained in allmaterial respects. Our audits of the Financial Statements includedexamining, on a test basis, evidence supporting the amounts anddisclosures in the Financial Statements, assessing the accounting
principles used and significant estimates made by management, andevaluating the overall financial statement presentation. Our audit ofinternal control over financial reporting included obtaining anunderstanding of internal control over financial reporting, assessing therisk that a material weakness exists, and testing and evaluating thedesign and operating effectiveness of internal control based on theassessed risk. Our audits also included performing such otherprocedures as we considered necessary in the circumstances. Webelieve that our audits provide a reasonable basis for our opinions.
A company’s internal control over financial reporting is a processdesigned to provide reasonable assurance regarding the reliability offinancial reporting and the preparation of financial statements forexternal purposes in accordance with generally accepted accountingprinciples. A company’s internal control over financial reportingincludes those policies and procedures that: (i) pertain to themaintenance of records that, in reasonable detail, accurately and fairlyreflect the transactions and dispositions of the assets of the company;(ii) provide reasonable assurance that transactions are recorded asnecessary to permit preparation of financial statements in accordancewith generally accepted accounting principles, and that receipts andexpenditures of the company are being made only in accordance withauthorisations of management and directors of the company; and(iii) provide reasonable assurance regarding prevention or timelydetection of unauthorised acquisition, use, or disposition of thecompany’s assets that could have a material effect on the financialstatements.
Because of its inherent limitations, internal control over financialreporting may not prevent or detect misstatements. Also, projections ofany evaluation of effectiveness to future periods are subject to the riskthat controls may become inadequate because of changes inconditions, or that the degree of compliance with the policies orprocedures may deteriorate.
PricewaterhouseCoopers CI LLPJersey, Channel IslandsMarch 11, 2015
Note that the report set out above is included for the purposes of RoyalDutch Shell plc’s Annual Report on Form 20-F for 2014 only and doesnot form part of Royal Dutch Shell plc’s Annual Report and Accountsfor 2014.

174 FINANCIAL STATEMENTS AND SUPPLEMENTS
ROYAL DUTCH SHELL DIVIDEND ACCESS TRUSTFINANCIAL STATEMENTS
SHELL ANNUAL REPORT AND FORM 20-F 2014
ROYAL DUTCH SHELLDIVIDEND ACCESS TRUSTFINANCIAL STATEMENTS175 Statement of Income175 Statement of Comprehensive Income175 Balance Sheet176 Statement of Changes in Equity176 Statement of Cash Flows177 Notes to the Royal Dutch Shell Dividend Access Trust Financial
Statements177 Note 1 The Trust177 Note 2 Basis of preparation177 Note 3 Accounting policies177 Note 4 Other liabilities177 Note 5 Capital account177 Note 6 Distributions made177 Note 7 Financial instruments178 Note 8 Related parties178 Note 9 Auditor’s remuneration

FINANCIAL STATEMENTS AND SUPPLEMENTS 175
SHELL ANNUAL REPORT AND FORM 20-F 2014 ROYAL DUTCH SHELL DIVIDEND ACCESS TRUSTFINANCIAL STATEMENTS
STATEMENT OF INCOME £ MILLION2014 2013 2012
Dividend income 2,470 2,361 2,383Income before and after taxation and for the period 2,470 2,361 2,383
STATEMENT OF COMPREHENSIVE INCOME £ MILLION2014 2013 2012
Income for the period 2,470 2,361 2,383Comprehensive income for the period 2,470 2,361 2,383
BALANCE SHEET £ MILLIONNOTES Dec 31, 2014 Dec 31, 2013
AssetsCurrent assetsCash and cash equivalents 1 1Total assets 1 1LiabilitiesCurrent liabilitiesOther liabilities 4 1 1Total liabilities 1 1EquityCapital account 5 – –Revenue account – –Total equity – –Total liabilities and equity 1 1
Signed on behalf of Computershare Trustees (Jersey) Limitedas Trustee of the Royal Dutch Shell Dividend Access Trust
/s/ Lisa Knowles /s/ Martin Fish
Lisa Knowles Martin FishMarch 11, 2015

176 FINANCIAL STATEMENTS AND SUPPLEMENTS
ROYAL DUTCH SHELL DIVIDEND ACCESS TRUSTFINANCIAL STATEMENTS
SHELL ANNUAL REPORT AND FORM 20-F 2014
STATEMENT OF CHANGES IN EQUITY £ MILLION
NOTESCapitalaccount
Revenueaccount
Totalequity
At January 1, 2014 – – –Comprehensive income for the period – 2,470 2,470Distributions made 6 – (2,470) (2,470)At December 31, 2014 – – –At January 1, 2013 – – –Comprehensive income for the period – 2,361 2,361Distributions made 6 – (2,361) (2,361)At December 31, 2013 – – –At January 1, 2012 – – –Comprehensive income for the period – 2,383 2,383Distributions made 6 – (2,383) (2,383)At December 31, 2012 – – –
STATEMENT OF CASH FLOWS £ MILLION2014 2013 2012
Cash flow from operating activitiesIncome for the period 2,470 2,361 2,383Adjustment for:
Dividends received (2,470) (2,361) (2,383)Net cash from operating activities – – –Cash flow from investing activitiesDividends received 2,470 2,361 2,383Net cash from investing activities 2,470 2,361 2,383Cash flow from financing activitiesDistributions made (2,470) (2,361) (2,383)Net cash used in financing activities (2,470) (2,361) (2,383)Change in cash and cash equivalents – – –Cash and cash equivalents at January 1 1 1 1Cash and cash equivalents at December 31 1 1 1
FINANCIAL STATEMENTS AND SUPPLEMENTS 177
SHELL ANNUAL REPORT AND FORM 20-F 2014 ROYAL DUTCH SHELL DIVIDEND ACCESS TRUSTFINANCIAL STATEMENTS
NOTES TO THE ROYAL DUTCH SHELL DIVIDEND ACCESSTRUST FINANCIAL STATEMENTS1 THE TRUSTThe Royal Dutch Shell Dividend Access Trust (the Trust) was established on May 19, 2005, by The “Shell” Transport and Trading Company,p.l.c., now The Shell Transport and Trading Company Limited (Shell Transport), and Royal Dutch Shell plc (the Company). The Trust is governedby the applicable laws of England and Wales and is resident and domiciled in Jersey. The Trustee of the Trust is Computershare Trustees (Jersey)Limited, registration number 92182 (the Trustee), Queensway House, Hilgrove Street, St Helier, Jersey, JE1 1ES. The Trust was established as partof a dividend access mechanism.
A dividend access share has been issued by Shell Transport to the Trustee. Following the announcement of a dividend by the Company on theB shares, Shell Transport may declare a dividend on the dividend access share.
The primary purposes of the Trust are to receive, on behalf of the B shareholders of the Company and in accordance with their respectiveholdings of B shares in the Company, any amounts paid by way of dividend on the dividend access share and to pay such amounts to theB shareholders on the same pro-rata basis.
The Trust shall not endure for a period in excess of 80 years from May 19, 2005, being the date on which the Trust Deed was executed.
2 BASIS OF PREPARATIONThe Financial Statements of the Trust have been prepared in accordance with International Financial Reporting Standards (IFRS) as adopted by theEuropean Union. As applied to the Trust, there are no material differences from IFRS as issued by the International Accounting Standards Board(IASB), therefore, the Financial Statements have been prepared in accordance with IFRS as issued by the IASB.
As described in the accounting policies in Note 3, the Financial Statements have been prepared under the historical cost convention. Thoseaccounting policies have been applied consistently in all periods presented.
The Financial Statements were approved and authorised for issue by the Trustee on March 11, 2015.
The preparation of financial statements in conformity with IFRS requires the use of certain accounting estimates. It also requires management toexercise its judgement in the process of applying the Trust’s accounting policies. Actual results may differ from these estimates. The financial resultsof the Trust are included in the Consolidated and Parent Company Financial Statements on pages 106-141 and pages 162-170 respectively.
3 ACCOUNTING POLICIESExcept for the following accounting policies that relate specifically to the Trust, the Trust’s accounting policies follow those of Shell as set out inNote 2 to the Consolidated Financial Statements.
Presentation currencyThe Trust’s presentation and functional currency is sterling. The Trust’s dividend income and dividends paid are principally in sterling.
Dividend incomeInterim dividends on the dividend access share are recognised on a paid basis unless the dividend has been confirmed by a general meeting ofShell Transport, in which case income is recognised on the date on which receipt is deemed virtually certain.
TaxationThe Trust is not subject to taxation.
4 OTHER LIABILITIESOther liabilities consist of £1,497,815 (2013: £1,333,658) relating to unclaimed dividends, including any dividend cheque payments thathave expired or have been returned unpresented.
5 CAPITAL ACCOUNTThe capital account is represented by the dividend access share of 25 pence settled in the Trust by Shell Transport, which also represents an assetin the Trust. This is classified as equity in the balance sheet.
6 DISTRIBUTIONS MADEDistributions are made to the B shareholders of the Company in accordance with the Trust Deed. Refer to Note 23 to the Consolidated FinancialStatements for information about dividends per share. Cumulative unclaimed dividends as at December 31, 2014, amounted to £1,497,815(2013: £1,333,658). Amounts are recorded as distributed once a wire transfer or cheque is issued. All cheques are valid for one year from thedate of issue. Any wire transfers that are not completed are replaced by cheques. To the extent that cheques expire or are returned unpresented,the Trust records a liability for unclaimed dividends and a corresponding amount of cash.
7 FINANCIAL INSTRUMENTSFinancial risk management is carried out by the Trustee and the Company to ensure that relevant policies and procedures are in place tominimise risk.

178 FINANCIAL STATEMENTS AND SUPPLEMENTS
ROYAL DUTCH SHELL DIVIDEND ACCESS TRUSTFINANCIAL STATEMENTS
SHELL ANNUAL REPORT AND FORM 20-F 2014
[Note 7 continued]
The Trust, in its normal course of business, is not subject to significant market risk, credit risk or liquidity risk. The Trustee does not consider that anyforeign exchange exposures will materially affect the operations of the Trust.
The fair value of financial assets and liabilities at December 31, 2014 and 2013 approximates their carrying amount.
8 RELATED PARTIESThe Trust received dividend income of £2,470 million (2013: £2,361 million; 2012: £2,383 million) in respect of the dividend access share.The Trust made distributions of £2,470 million (2013: £2,361 million; 2012: £2,383 million) to the B shareholders of the Company.
The Company pays the general and administrative expenses of the Trust, including the auditor’s remuneration.
9 AUDITOR’S REMUNERATIONAuditor’s remuneration for 2014 audit services was £33,750 (2013: £33,750; 2012: £33,750).
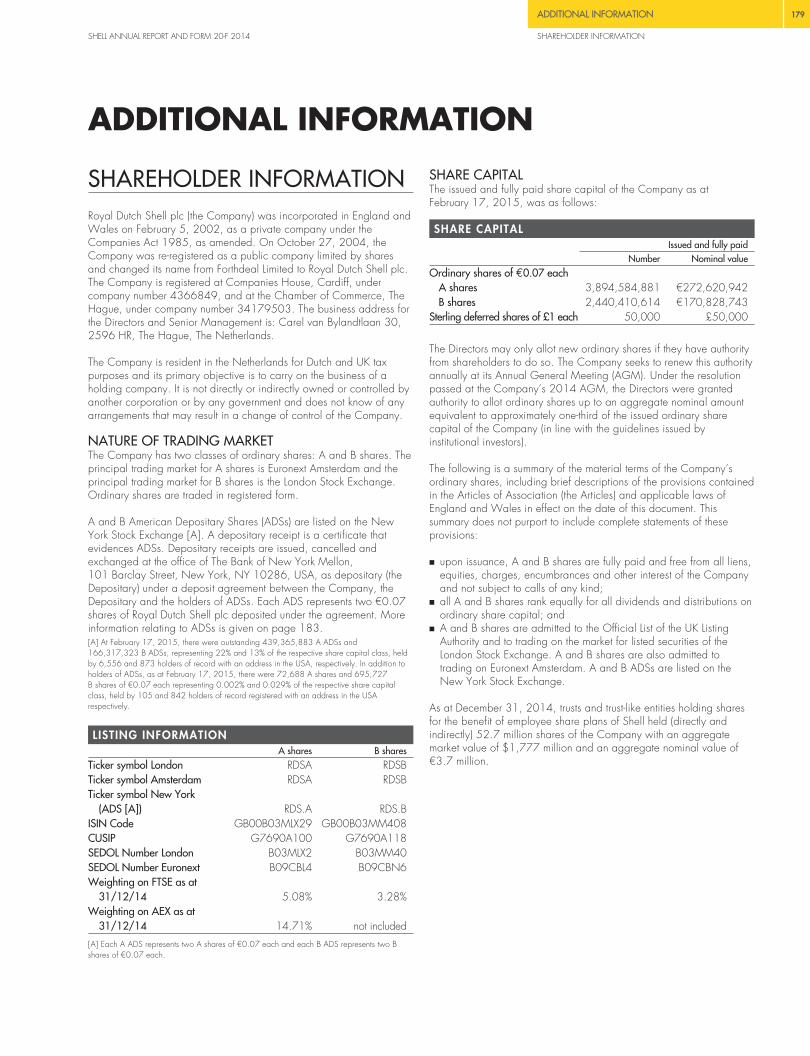
ADDITIONAL INFORMATION 179
SHELL ANNUAL REPORT AND FORM 20-F 2014 SHAREHOLDER INFORMATION
ADDITIONAL INFORMATION
SHAREHOLDER INFORMATIONRoyal Dutch Shell plc (the Company) was incorporated in England andWales on February 5, 2002, as a private company under theCompanies Act 1985, as amended. On October 27, 2004, theCompany was re-registered as a public company limited by sharesand changed its name from Forthdeal Limited to Royal Dutch Shell plc.The Company is registered at Companies House, Cardiff, undercompany number 4366849, and at the Chamber of Commerce, TheHague, under company number 34179503. The business address forthe Directors and Senior Management is: Carel van Bylandtlaan 30,2596 HR, The Hague, The Netherlands.
The Company is resident in the Netherlands for Dutch and UK taxpurposes and its primary objective is to carry on the business of aholding company. It is not directly or indirectly owned or controlled byanother corporation or by any government and does not know of anyarrangements that may result in a change of control of the Company.
NATURE OF TRADING MARKETThe Company has two classes of ordinary shares: A and B shares. Theprincipal trading market for A shares is Euronext Amsterdam and theprincipal trading market for B shares is the London Stock Exchange.Ordinary shares are traded in registered form.
A and B American Depositary Shares (ADSs) are listed on the NewYork Stock Exchange [A]. A depositary receipt is a certificate thatevidences ADSs. Depositary receipts are issued, cancelled andexchanged at the office of The Bank of New York Mellon,101 Barclay Street, New York, NY 10286, USA, as depositary (theDepositary) under a deposit agreement between the Company, theDepositary and the holders of ADSs. Each ADS represents two €0.07shares of Royal Dutch Shell plc deposited under the agreement. Moreinformation relating to ADSs is given on page 183.[A] At February 17, 2015, there were outstanding 439,365,883 A ADSs and166,317,323 B ADSs, representing 22% and 13% of the respective share capital class, heldby 6,556 and 873 holders of record with an address in the USA, respectively. In addition toholders of ADSs, as at February 17, 2015, there were 72,688 A shares and 695,727B shares of €0.07 each representing 0.002% and 0.029% of the respective share capitalclass, held by 105 and 842 holders of record registered with an address in the USArespectively.
LISTING INFORMATIONA shares B shares
Ticker symbol London RDSA RDSBTicker symbol Amsterdam RDSA RDSBTicker symbol New York
(ADS [A]) RDS.A RDS.BISIN Code GB00B03MLX29 GB00B03MM408CUSIP G7690A100 G7690A118SEDOL Number London B03MLX2 B03MM40SEDOL Number Euronext B09CBL4 B09CBN6Weighting on FTSE as at
31/12/14 5.08% 3.28%Weighting on AEX as at
31/12/14 14.71% not included
[A] Each A ADS represents two A shares of €0.07 each and each B ADS represents two Bshares of €0.07 each.
SHARE CAPITALThe issued and fully paid share capital of the Company as atFebruary 17, 2015, was as follows:
SHARE CAPITALIssued and fully paid
Number Nominal valueOrdinary shares of €0.07 each
A shares 3,894,584,881 €272,620,942B shares 2,440,410,614 €170,828,743
Sterling deferred shares of £1 each 50,000 £50,000
The Directors may only allot new ordinary shares if they have authorityfrom shareholders to do so. The Company seeks to renew this authorityannually at its Annual General Meeting (AGM). Under the resolutionpassed at the Company’s 2014 AGM, the Directors were grantedauthority to allot ordinary shares up to an aggregate nominal amountequivalent to approximately one-third of the issued ordinary sharecapital of the Company (in line with the guidelines issued byinstitutional investors).
The following is a summary of the material terms of the Company’sordinary shares, including brief descriptions of the provisions containedin the Articles of Association (the Articles) and applicable laws ofEngland and Wales in effect on the date of this document. Thissummary does not purport to include complete statements of theseprovisions:
� upon issuance, A and B shares are fully paid and free from all liens,equities, charges, encumbrances and other interest of the Companyand not subject to calls of any kind;
� all A and B shares rank equally for all dividends and distributions onordinary share capital; and
� A and B shares are admitted to the Official List of the UK ListingAuthority and to trading on the market for listed securities of theLondon Stock Exchange. A and B shares are also admitted totrading on Euronext Amsterdam. A and B ADSs are listed on theNew York Stock Exchange.
As at December 31, 2014, trusts and trust-like entities holding sharesfor the benefit of employee share plans of Shell held (directly andindirectly) 52.7 million shares of the Company with an aggregatemarket value of $1,777 million and an aggregate nominal value of€3.7 million.

180 ADDITIONAL INFORMATION
SHAREHOLDER INFORMATION SHELL ANNUAL REPORT AND FORM 20-F 2014
SHAREHOLDER INFORMATIONCONTINUED
SIGNIFICANT SHAREHOLDINGSThe Company’s A and B shares have identical voting rights, andaccordingly the Company’s major shareholders do not have differentvoting rights.
Significant direct shareholdingsAs at February 17, 2015, direct holdings of 3% or more of either classof the Company’s shares held by registered members representing theinterests of underlying investors is given below.
DIRECT SHAREHOLDINGSA shares B shares Total
Number % Number % Number %BNY (Nominees) Limited 704,621,530 18.09 320,698,288 13.14 1,025,319,818 16.19Chase Nominees Limited 45,999,727 1.18 159,215,995 6.52 205,215,722 3.24Euroclear Nederland 1,680,524,979 43.15 13,753,435 0.56 1,694,278,414 26.75Lynchwood Nominees Limited(2006420) 34,374,601 0.88 103,730,090 4.25 138,104,691 2.18State Street Nominees Limited(OM02) 95,009,879 2.44 107,174,920 4.39 202,184,799 3.19State Street Nominees Limited(OM04) 59,716,534 1.53 125,815,712 5.16 185,532,246 2.93
Significant indirect shareholdingsAs at February 17, 2015, interests of investors with 3% or more ofeither class of the Company’s shares is given below.
INDIRECT SHAREHOLDINGSA shares B shares Total
Number % Number % Number %BlackRock, Inc. 265,897,706 6.83 194,802,203 7.98 460,699,909 7.27The Capital Group Companies, Inc. 66,318,448 1.70 188,647,986 7.73 254,966,434 4.02
NOTIFICATION OF MAJOR SHAREHOLDINGSDuring the year ended December 31, 2014, the Company wasnotified by the following investor of its interests in the Company’sshares pursuant to Disclosure and Transparency Rule 5.
INVESTOR
Date ofnotification
A shares B shares TotalNumber % Number % Number %
The Capital Group Companies, Inc. August 18, 2014 63,793,188 1.62 191,671,894 7.85 255,465,082 4.00The Capital Group Companies, Inc. October 1, 2014 63,802,898 1.62 188,028,184 7.70 251,831,082 3.95The Capital Group Companies, Inc. November 12, 2014 64,538,348 1.65 189,544,083 7.77 254,082,431 4.00The Capital Group Companies, Inc. November 15, 2014 63,408,815 1.62 189,534,684 7.77 252,943,499 3.98
The Company received the following notification pursuant to Disclosureand Transparency Rule 5 in the period from December 31, 2014, toFebruary 17, 2015 (being a date not more than one month prior tothe date of the Company’s Notice of Annual General Meeting).
INVESTOR
Date ofnotification
A shares B shares TotalNumber % Number % Number %
The Capital Group Companies, Inc. January 13, 2015 66,253,448 1.70 187,698,386 7.69 253,951,834 4.00
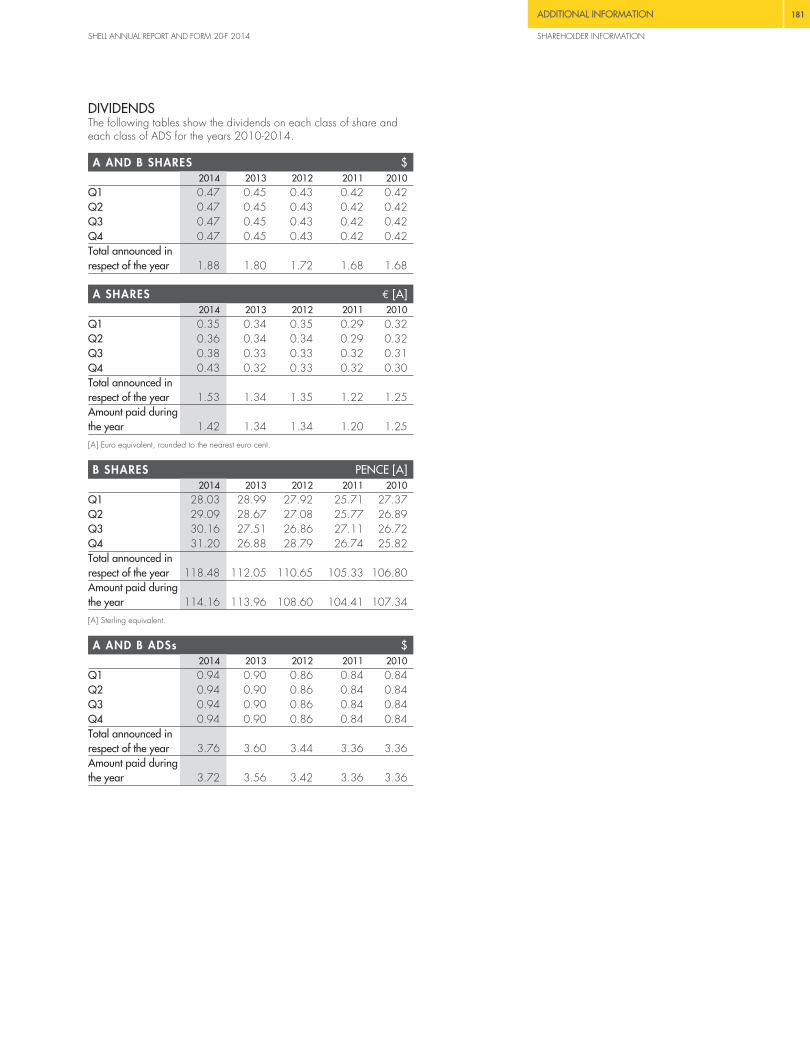
ADDITIONAL INFORMATION 181
SHELL ANNUAL REPORT AND FORM 20-F 2014 SHAREHOLDER INFORMATION
DIVIDENDSThe following tables show the dividends on each class of share andeach class of ADS for the years 2010-2014.
A AND B SHARES $2014 2013 2012 2011 2010
Q1 0.47 0.45 0.43 0.42 0.42Q2 0.47 0.45 0.43 0.42 0.42Q3 0.47 0.45 0.43 0.42 0.42Q4 0.47 0.45 0.43 0.42 0.42Total announced inrespect of the year 1.88 1.80 1.72 1.68 1.68
A SHARES € [A]2014 2013 2012 2011 2010
Q1 0.35 0.34 0.35 0.29 0.32Q2 0.36 0.34 0.34 0.29 0.32Q3 0.38 0.33 0.33 0.32 0.31Q4 0.43 0.32 0.33 0.32 0.30Total announced inrespect of the year 1.53 1.34 1.35 1.22 1.25Amount paid duringthe year 1.42 1.34 1.34 1.20 1.25
[A] Euro equivalent, rounded to the nearest euro cent.
B SHARES PENCE [A]2014 2013 2012 2011 2010
Q1 28.03 28.99 27.92 25.71 27.37Q2 29.09 28.67 27.08 25.77 26.89Q3 30.16 27.51 26.86 27.11 26.72Q4 31.20 26.88 28.79 26.74 25.82Total announced inrespect of the year 118.48 112.05 110.65 105.33 106.80Amount paid duringthe year 114.16 113.96 108.60 104.41 107.34
[A] Sterling equivalent.
A AND B ADSs $2014 2013 2012 2011 2010
Q1 0.94 0.90 0.86 0.84 0.84Q2 0.94 0.90 0.86 0.84 0.84Q3 0.94 0.90 0.86 0.84 0.84Q4 0.94 0.90 0.86 0.84 0.84Total announced inrespect of the year 3.76 3.60 3.44 3.36 3.36Amount paid duringthe year 3.72 3.56 3.42 3.36 3.36

182 ADDITIONAL INFORMATION
SHAREHOLDER INFORMATION SHELL ANNUAL REPORT AND FORM 20-F 2014
SHAREHOLDER INFORMATIONCONTINUED
HIGH, LOW AND YEAR-END SHARE PRICESThe following tables show the high, low and year-end prices, takendirectly from the respective securities exchange, of the Company’sregistered ordinary shares:
� of €0.07 nominal value on the London Stock Exchange;� of €0.07 nominal value on Euronext Amsterdam; and� in the form of ADSs on the New York Stock Exchange (ADSs do not
have a nominal value).
ANNUAL SHARE PRICESEuronext Amsterdam
A sharesNew York Stock Exchange
A ADSsHigh € Low € Year-end € High $ Low $ Year-end $
2010 25.28 19.53 24.73 68.54 49.16 66.782011 28.40 20.12 28.15 77.96 57.97 73.092012 29.18 24.30 25.98 74.51 60.62 68.952013 27.06 23.40 25.91 73.00 62.65 71.272014 31.13 24.30 27.66 83.42 60.84 66.95
London Stock ExchangeB shares
New York Stock ExchangeB ADSs
High pence Low pence Year-end pence High $ Low $ Year-end $2010 2,149 1,550 2,115 68.32 47.12 66.672011 2,476 1,768 2,454 78.75 58.42 76.012012 2,499 2,020 2,175 77.52 63.05 70.892013 2,375 2,070 2,280 75.18 65.02 75.112014 2,614 1,985 2,233 88.13 62.11 69.56
QUARTERLY SHARE PRICESEuronext Amsterdam
A sharesLondon Stock Exchange
B sharesNew York Stock Exchange
A ADSsNew York Stock Exchange
B ADSsHigh € Low € High pence Low pence High $ Low $ High $ Low $
2013Q1 27.06 24.36 2,375 2,143 73.00 64.51 74.95 66.00Q2 26.80 23.94 2,360 2,105 69.94 62.76 72.25 65.02Q3 26.07 23.71 2,350 2,105 68.82 62.65 71.65 65.24Q4 25.99 23.40 2,297 2,070 71.48 63.27 75.18 66.00
2014Q1 26.96 25.01 2,385 2,183 74.17 67.75 80.07 71.42Q2 30.65 26.36 2,614 2,327 82.86 72.94 87.59 77.51Q3 31.13 29.43 2,599 2,407 83.42 75.77 88.13 78.77Q4 30.24 24.30 2,436 1,985 75.77 60.84 78.76 62.11
MONTHLY SHARE PRICESEuronext Amsterdam
A sharesLondon Stock Exchange
B sharesNew York Stock Exchange
A ADSsNew York Stock Exchange
B ADSsHigh € Low € High pence Low pence High $ Low $ High $ Low $
2014September 31.12 29.62 2,581 2,407 80.96 75.77 84.82 78.77October 30.24 25.51 2,436 2,111 75.77 65.68 78.76 68.54November 29.00 26.34 2,409 2,169 72.00 66.29 75.56 69.35December 28.57 24.30 2,309 1,985 69.50 60.84 72.22 62.11
2015January 29.59 25.75 2,315 2,025 67.16 60.67 70.15 62.56February 29.53 27.12 2,283 2,128 67.16 62.06 70.05 65.10
ADDITIONAL INFORMATION 183
SHELL ANNUAL REPORT AND FORM 20-F 2014 SHAREHOLDER INFORMATION
METHOD OF HOLDING SHARES OR AN INTEREST INSHARESThere are several ways in which Royal Dutch Shell plc registeredshares or an interest in these shares can be held, including:
� directly as registered shares either in uncertificated form or incertificated form in a shareholder’s own name;
� indirectly through Euroclear Nederland (in respect of which the DutchSecurities Giro Act (“Wet giraal effectenverkeer”) is applicable);
� through the Royal Dutch Shell Corporate Nominee; and� as a direct or indirect holder of either an A or a B ADS with the
Depositary.
AMERICAN DEPOSITARY SHARESThe Depositary is the registered shareholder of the shares underlyingthe A or B American Depositary Shares (ADSs) and enjoys the rights ofa shareholder under the Articles. Holders of ADSs will not haveshareholder rights. The rights of the holder of an A or a B ADS arespecified in the respective Depositary agreements with the Depositaryand are summarised below.
The Depositary will receive all cash dividends and other cashdistributions made on the deposited shares underlying the ADSs and,where possible and on a reasonable basis, will distribute suchdividends and distributions to holders of ADSs. Rights to purchaseadditional shares will also be made available to the Depositary whomay make such rights available to holders of ADSs. All otherdistributions made on the Company’s shares will be distributed by theDepositary in any means that the Depositary thinks is equitable andpractical. The Depositary may deduct its fees and expenses and theamount of any taxes owed from any payments to holders and it maysell a holder’s deposited shares to pay any taxes owed. TheDepositary is not responsible if it decides that it is unlawful orimpractical to make a distribution available to holders of ADSs.
The Depositary will notify holders of ADSs of shareholders’ meetings ofthe Company and will arrange to deliver voting materials to suchholders of ADSs if requested by the Company. Upon request by aholder, the Depositary will endeavour to appoint such holder as proxyin respect of such holder’s deposited shares entitling such holder toattend and vote at shareholders’ meetings. Holders of ADSs may alsoinstruct the Depositary to vote their deposited securities and theDepositary will try, as far as practical and lawful, to vote depositedshares in accordance with such instructions. The Company cannotensure that holders will receive voting materials or otherwise learn ofan upcoming shareholders’ meeting in time to ensure that holders caninstruct the Depositary to vote their shares.
Upon payment of appropriate fees, expenses and taxes:(i) shareholders may deposit their shares with the Depositary andreceive the corresponding class and amount of ADSs; and (ii) holders
of ADSs may surrender their ADSs to the Depositary and have thecorresponding class and amount of shares credited to their account.
Further, subject to certain limitations, holders may, at any time, cancelADSs and withdraw their underlying shares or have the correspondingclass and amount of shares credited to their account. The Depositarymay also deliver ADSs prior to deposit of the underlying securitiessubject to certain conditions, including, without limitation, that such pre-released ADSs are fully collateralised and that the underlying securitiesare assigned to and held for the account of the Depositary.
Fees paid by holders of ADSsThe Depositary collects its fees for delivery and surrender of ADSsdirectly from investors depositing shares or surrendering ADSs for thepurpose of withdrawal or from intermediaries acting for them. TheDepositary collects fees for making distributions to investors bydeducting those fees from the amounts distributed or by selling aportion of distributable property to pay the fees. The Depositary maygenerally refuse to provide fee-attracting services until its fees for thoseservices are paid. (See page 184.)
Reimbursements to the CompanyThe Bank of New York Mellon, as Depositary, has agreed to reimbursethe Company for expenses it incurs that are related maintenanceexpenses of the ADS programme. The Depositary has agreed toreimburse the Company for its continuing annual stock exchange listingfees. The Depositary has also agreed to pay certain legal expensesand the standard out-of-pocket maintenance costs for the ADSs, whichconsist of the expenses of postage and envelopes for mailing annualand interim financial reports, printing and distributing dividendcheques, electronic filing of US federal tax information, mailingrequired tax forms, stationery, postage, facsimile and telephone calls.It has also agreed to reimburse the Company annually for certain costsassociated with the AGM, investor relationship programmes andspecial investor relations promotional activities. There are limits on theamount of expenses for which the Depositary will reimburse theCompany, but the amount of reimbursement available to the Companyis not necessarily tied to the amount of fees the Depositary collects frominvestors. From January 1, 2014, to February 17, 2015, theCompany received $5,042,860 from the Depositary.
SCRIP DIVIDEND PROGRAMMEThe Company’s Scrip Dividend Programme, which enabledshareholders to increase their shareholding by choosing to receive newshares instead of cash dividends (if approved by the Board), wascancelled with effect from the second quarter 2014 interim dividendonwards. Only new A shares were issued under the programme,including to shareholders who held B shares. The programme is beingreintroduced with effect from the first quarter 2015 interim dividendonwards. More information can be found at www.shell.com/scrip.
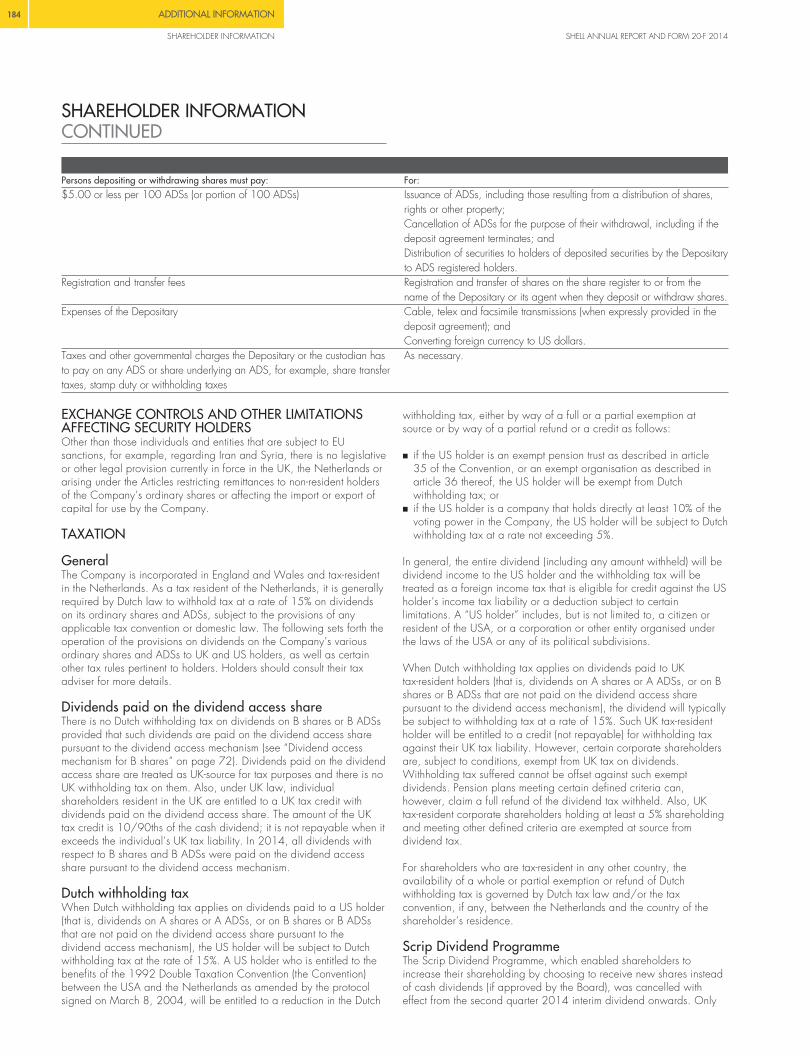
184 ADDITIONAL INFORMATION
SHAREHOLDER INFORMATION SHELL ANNUAL REPORT AND FORM 20-F 2014
SHAREHOLDER INFORMATIONCONTINUED
Persons depositing or withdrawing shares must pay: For:$5.00 or less per 100 ADSs (or portion of 100 ADSs) Issuance of ADSs, including those resulting from a distribution of shares,
rights or other property;Cancellation of ADSs for the purpose of their withdrawal, including if thedeposit agreement terminates; andDistribution of securities to holders of deposited securities by the Depositaryto ADS registered holders.
Registration and transfer fees Registration and transfer of shares on the share register to or from thename of the Depositary or its agent when they deposit or withdraw shares.
Expenses of the Depositary Cable, telex and facsimile transmissions (when expressly provided in thedeposit agreement); andConverting foreign currency to US dollars.
Taxes and other governmental charges the Depositary or the custodian hasto pay on any ADS or share underlying an ADS, for example, share transfertaxes, stamp duty or withholding taxes
As necessary.
EXCHANGE CONTROLS AND OTHER LIMITATIONSAFFECTING SECURITY HOLDERSOther than those individuals and entities that are subject to EUsanctions, for example, regarding Iran and Syria, there is no legislativeor other legal provision currently in force in the UK, the Netherlands orarising under the Articles restricting remittances to non-resident holdersof the Company’s ordinary shares or affecting the import or export ofcapital for use by the Company.
TAXATION
GeneralThe Company is incorporated in England and Wales and tax-residentin the Netherlands. As a tax resident of the Netherlands, it is generallyrequired by Dutch law to withhold tax at a rate of 15% on dividendson its ordinary shares and ADSs, subject to the provisions of anyapplicable tax convention or domestic law. The following sets forth theoperation of the provisions on dividends on the Company’s variousordinary shares and ADSs to UK and US holders, as well as certainother tax rules pertinent to holders. Holders should consult their taxadviser for more details.
Dividends paid on the dividend access shareThere is no Dutch withholding tax on dividends on B shares or B ADSsprovided that such dividends are paid on the dividend access sharepursuant to the dividend access mechanism (see “Dividend accessmechanism for B shares” on page 72). Dividends paid on the dividendaccess share are treated as UK-source for tax purposes and there is noUK withholding tax on them. Also, under UK law, individualshareholders resident in the UK are entitled to a UK tax credit withdividends paid on the dividend access share. The amount of the UKtax credit is 10/90ths of the cash dividend; it is not repayable when itexceeds the individual’s UK tax liability. In 2014, all dividends withrespect to B shares and B ADSs were paid on the dividend accessshare pursuant to the dividend access mechanism.
Dutch withholding taxWhen Dutch withholding tax applies on dividends paid to a US holder(that is, dividends on A shares or A ADSs, or on B shares or B ADSsthat are not paid on the dividend access share pursuant to thedividend access mechanism), the US holder will be subject to Dutchwithholding tax at the rate of 15%. A US holder who is entitled to thebenefits of the 1992 Double Taxation Convention (the Convention)between the USA and the Netherlands as amended by the protocolsigned on March 8, 2004, will be entitled to a reduction in the Dutch
withholding tax, either by way of a full or a partial exemption atsource or by way of a partial refund or a credit as follows:
� if the US holder is an exempt pension trust as described in article35 of the Convention, or an exempt organisation as described inarticle 36 thereof, the US holder will be exempt from Dutchwithholding tax; or
� if the US holder is a company that holds directly at least 10% of thevoting power in the Company, the US holder will be subject to Dutchwithholding tax at a rate not exceeding 5%.
In general, the entire dividend (including any amount withheld) will bedividend income to the US holder and the withholding tax will betreated as a foreign income tax that is eligible for credit against the USholder’s income tax liability or a deduction subject to certainlimitations. A “US holder” includes, but is not limited to, a citizen orresident of the USA, or a corporation or other entity organised underthe laws of the USA or any of its political subdivisions.
When Dutch withholding tax applies on dividends paid to UKtax-resident holders (that is, dividends on A shares or A ADSs, or on Bshares or B ADSs that are not paid on the dividend access sharepursuant to the dividend access mechanism), the dividend will typicallybe subject to withholding tax at a rate of 15%. Such UK tax-residentholder will be entitled to a credit (not repayable) for withholding taxagainst their UK tax liability. However, certain corporate shareholdersare, subject to conditions, exempt from UK tax on dividends.Withholding tax suffered cannot be offset against such exemptdividends. Pension plans meeting certain defined criteria can,however, claim a full refund of the dividend tax withheld. Also, UKtax-resident corporate shareholders holding at least a 5% shareholdingand meeting other defined criteria are exempted at source fromdividend tax.
For shareholders who are tax-resident in any other country, theavailability of a whole or partial exemption or refund of Dutchwithholding tax is governed by Dutch tax law and/or the taxconvention, if any, between the Netherlands and the country of theshareholder’s residence.
Scrip Dividend ProgrammeThe Scrip Dividend Programme, which enabled shareholders toincrease their shareholding by choosing to receive new shares insteadof cash dividends (if approved by the Board), was cancelled witheffect from the second quarter 2014 interim dividend onwards. Only

ADDITIONAL INFORMATION 185
SHELL ANNUAL REPORT AND FORM 20-F 2014 SHAREHOLDER INFORMATION/SECTION 13(r) OF THE US SECURITIESEXCHANGE ACT OF 1934 DISCLOSURE
new A shares were issued under the programme, including toshareholders who held B shares. The programme is being reintroducedwith effect from the first quarter 2015 interim dividend onwards.
The tax consequences of electing to receive new A shares in place ofa cash dividend depended on individual circumstances.
More information about the programme, including the taxationconsequences, can be found at www.shell.com/scrip.
Dutch capital gains taxationCapital gains on the sale of shares of a Dutch tax-resident company bya US holder are generally not subject to taxation by the Netherlandsunless the US shareholder has a permanent establishment therein andthe capital gain is derived from the sale of shares that are part of thebusiness property of the permanent establishment.
Dutch succession duty and gift taxesShares of a Dutch tax-resident company held by an individual who isnot a resident or a deemed resident of the Netherlands will generallynot be subject to succession duty in the Netherlands on the individual’sdeath unless the shares are part of the business property of apermanent establishment situated in the Netherlands.
A gift of shares of a Dutch tax-resident company by an individual, whois not a resident or a deemed resident of the Netherlands, is generallynot subject to Dutch gift tax.
UK stamp duty and stamp duty reserve taxSales or transfers of the Company’s ordinary shares within a clearanceservice (such as Euroclear Nederland) or of the Company’s ADSswithin the ADS depositary receipts system will not give rise to a stampduty reserve tax (SDRT) liability and should not in practice require thepayment of UK stamp duty.
The transfer of the Company’s ordinary shares to a clearance service(such as Euroclear Nederland) or to an issuer of depositary shares(such as ADSs) will generally give rise to a UK stamp duty or SDRTliability at the rate of 1.5% of consideration given or, if none, of thevalue of the shares. A sale of the Company’s ordinary shares that arenot held within a clearance service (for example, settled through theUK’s CREST system of paperless transfers) will generally be subject toUK stamp duty or SDRT at the rate of 0.5% of the amount of theconsideration, normally paid by the purchaser.
Capital gains taxFor the purposes of UK capital gains tax, the market values [A] of theshares of the former public parent companies of the Royal Dutch/ShellGroup at the relevant dates were:
£March 31, 1982 July 20, 2005
Royal Dutch Petroleum Company(N.V. Koninklijke NederlandschePetroleum Maatschappij) whichceased to exist on December 21, 2005 1.1349 17.6625The “Shell” Transport and TradingCompany, p.l.c. which delisted onJuly 19, 2005 1.4502 Not applicable
[A] Restated where applicable to reflect all capitalisation issues since the relevant date. Thisincludes the change in the capital structure in 2005, when Royal Dutch Shell plc became thesingle parent company of Royal Dutch Petroleum Company and of The “Shell” Transport andTrading Company, p.l.c., now The Shell Transport and Trading Company Limited, and oneshare in Royal Dutch Petroleum Company was exchanged for two Royal Dutch Shell plc Ashares and one share in The “Shell” Transport and Trading Company, p.l.c. was exchangedfor 0.287333066 Royal Dutch Shell plc B shares.
SECTION 13(r) OF THE USSECURITIES EXCHANGE ACTOF 1934 DISCLOSUREIn accordance with our General Business Principles and Code ofConduct, Shell seeks to comply with all applicable international tradelaws including applicable sanctions and embargoes.
The activities listed below have been conducted outside the USA bynon-US Shell subsidiaries. None of the payments disclosed belowwere made in US dollars, however, for disclosure purposes, all havebeen converted into US dollars at the appropriate exchange rate. Wedo not believe that any of the transactions or activities listed belowviolated US sanctions.
In 2010, we ceased all of our Upstream commercial activities in Iranand suspended new business development, as a direct consequenceof the international sanctions imposed on the country.
In 2013, we closed our small representative office in Iran. In 2014,we paid $6,140 to the Iranian Ministry of Finance, consisting of afinal settlement of corporate income tax related to the financial yearended December 31, 2007, an income tax penalty payment relatedto the financial year ended December 31, 2011, and stamp duties.These payments were made through cheques guaranteed by BankKarafarin, where we maintain accounts. These transactions did notgenerate gross revenue or net profit. However, our cash deposits inBank Karafarin (balance of $3.1 million at December 31, 2014)generated non-taxable interest income of $0.5 million in 2014. In thefuture, we expect to make additional payments as a result of theongoing liquidation process, including tax payments.
Payments to the Iranian Civil Aviation Authority for the clearance ofoverflight permits for Shell Aircraft over Iranian airspace amounted to$5,960 in 2014. There was no gross revenue or net profit associatedwith these transactions. On occasion, our aircraft may be routed overIran and therefore these payments may continue in the future.
An amount of $202 was paid to the Consulate of Iran in the UK,relating to a British citizen, born in Iran, who was relocating with herShell-employed spouse to the United Arab Emirates. The costs were forduplicates of birth certificates and other documents required to obtaina residence permit in the United Arab Emirates. This transactiongenerated no gross revenue or net profit, and is in accordance withShell’s expatriate policy.
In Downstream, through our subsidiary Deheza S.A.I.C.F.eI., weprovided retail services in August 2014 to the Iranian embassy inArgentina (Embajada de la República Islámica de Irán). Thistransaction generated a gross revenue of $63 and an estimated netprofit of $6. We have no contractual agreement with this embassy.
At December 31, 2014, we have $2,164 million payable to, and$12 million receivable from, the National Iranian Oil Company. Thepayable amount decreased by $265 million during 2014 as a resultof currency movements. There was no change in the principal amount.We are unable to settle the payable position as a result of applicablesanctions.
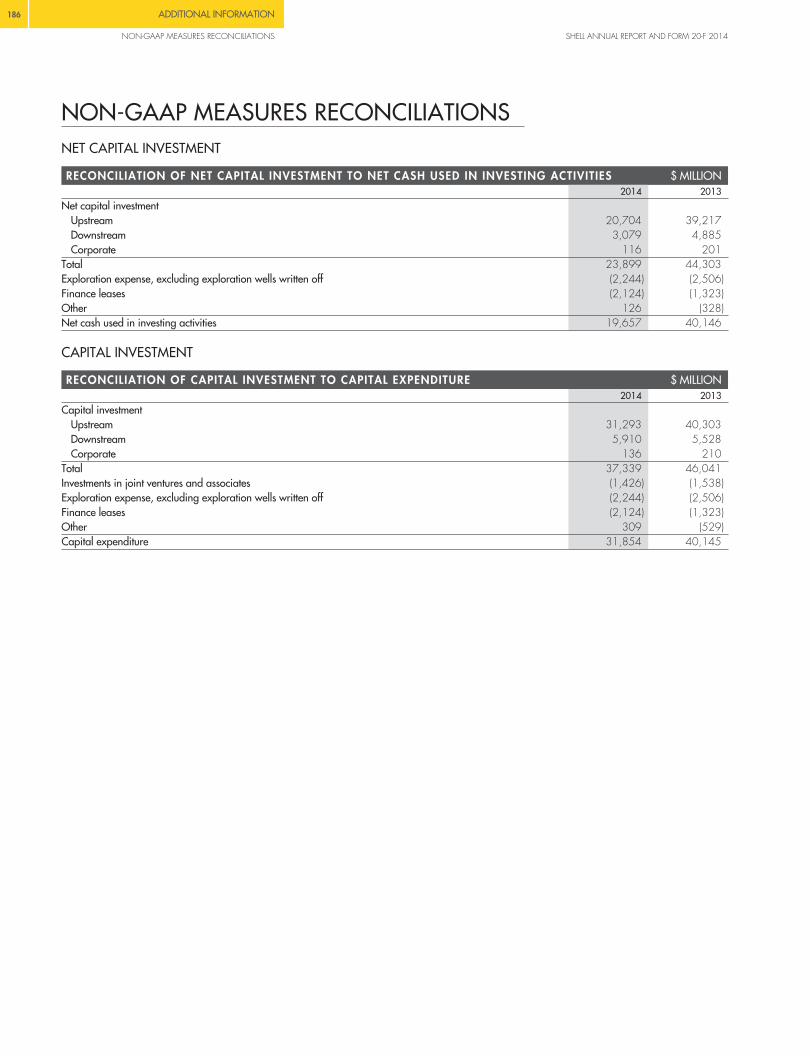
186 ADDITIONAL INFORMATION
NON-GAAP MEASURES RECONCILIATIONS SHELL ANNUAL REPORT AND FORM 20-F 2014
NON-GAAP MEASURES RECONCILIATIONSNET CAPITAL INVESTMENT
RECONCILIATION OF NET CAPITAL INVESTMENT TO NET CASH USED IN INVESTING ACTIVITIES $ MILLION2014 2013
Net capital investmentUpstream 20,704 39,217Downstream 3,079 4,885Corporate 116 201
Total 23,899 44,303Exploration expense, excluding exploration wells written off (2,244) (2,506)Finance leases (2,124) (1,323)Other 126 (328)Net cash used in investing activities 19,657 40,146
CAPITAL INVESTMENT
RECONCILIATION OF CAPITAL INVESTMENT TO CAPITAL EXPENDITURE $ MILLION2014 2013
Capital investmentUpstream 31,293 40,303Downstream 5,910 5,528Corporate 136 210
Total 37,339 46,041Investments in joint ventures and associates (1,426) (1,538)Exploration expense, excluding exploration wells written off (2,244) (2,506)Finance leases (2,124) (1,323)Other 309 (529)Capital expenditure 31,854 40,145

ADDITIONAL INFORMATION 187
SHELL ANNUAL REPORT AND FORM 20-F 2014 INDEX TO THE EXHIBITS
INDEX TO THE EXHIBITSExhibit No. Description Page
1.1 Memorandum of Association of Royal Dutch Shell plc, together with a special resolution of Royal Dutch Shell plc dated May 18,2010, (incorporated by reference to Exhibit 4.12 to the Registration Statement on Form F-3 (No. 333-177588) of Royal DutchShell plc filed with the US Securities and Exchange Commission on October 28, 2011).
1.2 Articles of Association of Royal Dutch Shell plc, together with a special resolution of Royal Dutch Shell plc dated May 18, 2010,(incorporated by reference to Exhibit 4.11 to the Registration Statement on Form F-3 (No. 333-177588) of Royal Dutch Shell plcfiled with the US Securities and Exchange Commission on October 28, 2011).
2 Dividend Access Trust Deed (incorporated by reference to Exhibit 2 to the Annual Report for fiscal year ended December 31,2006, on Form 20-F (File No. 001-32575) of Royal Dutch Shell plc filed with the US Securities and Exchange Commission onMarch 13, 2007).
4.1 Shell Provident Fund Regulations and Trust Agreement (incorporated by reference to Exhibit 4.7 to the Post-Effective Amendmentto Registration Statement on Form S-8 (No. 333-126715) of Royal Dutch Shell plc filed with the US Securities and ExchangeCommission on June 18, 2007).
4.2 Form of Director Indemnity Agreement (incorporated by reference to Exhibit 4.3 to the Annual Report for the fiscal year endedDecember 31, 2005, on Form 20-F (File No. 001-32575) of Royal Dutch Shell plc filed with the US Securities and ExchangeCommission on March 13, 2006).
4.3 Senior Debt Securities Indenture dated June 27, 2006, among Shell International Finance B.V., as issuer, Royal Dutch Shell plc,as guarantor, and Deutsche Bank Trust Company Americas, as trustee (incorporated by reference to Exhibit 4.3 to theRegistration Statement on Form F-3 (No. 333-126726) of Royal Dutch Shell plc filed with the US Securities and ExchangeCommission on July 20, 2005, amended from then to be dated as of June 27, 2006, and with the parties signatures).
4.4 Form of contract of employment for Executive Directors (incorporated by reference to Exhibit 4.5 to the Annual Report for fiscalyear ended December 31, 2013, on Form 20-F (File No. 001-32575) of Royal Dutch Shell plc filed with the US Securities andExchange Commission on March 13, 2014).
4.5 Form of Letter of appointments for Non-executive Directors (incorporated by reference to Exhibit 4.11 to the Annual Report forfiscal year ended December 31, 2006, on Form 20-F (File No. 001-32575) of Royal Dutch Shell plc filed with the US Securitiesand Exchange Commission on March 13, 2007).
7.1 Calculation of Ratio of Earnings to Fixed Charges. E17.2 Calculation of Return on Average Capital Employed (ROACE) (incorporated by reference to page 51 herein).7.3 Calculation of gearing (incorporated by reference to page 21 and Note 14 to the Consolidated Financial Statements on
page 124 herein).8 Significant Shell subsidiaries as at December 31, 2014. E212.1 Section 302 Certification of Royal Dutch Shell plc. E412.2 Section 302 Certification of Royal Dutch Shell plc. E513.1 Section 906 Certification of Royal Dutch Shell plc. E699.1 Consent of PricewaterhouseCoopers LLP, London. E799.2 Consent of PricewaterhouseCoopers CI LLP, Jersey, Channel Islands, relating to the Royal Dutch Shell Dividend Access Trust. E8

188 ADDITIONAL INFORMATION
SIGNATURES SHELL ANNUAL REPORT AND FORM 20-F 2014
SIGNATURESThe registrant hereby certifies that it meets all of the requirements for filing on Form 20-F and that it has duly caused and authorised theundersigned to sign the Annual Report on Form 20-F on its behalf.
Royal Dutch Shell plc
/s/ Ben van Beurden
Ben van BeurdenChief Executive OfficerMarch 11, 2015

ADDITIONAL INFORMATION E1
SHELL ANNUAL REPORT AND FORM 20-F 2014 EXHIBIT 7.1
EXHIBIT 7.1CALCULATION OF RATIO OF EARNINGS TO FIXED CHARGES $ MILLION
2014 2013 2012 2011 2010Pre-tax income from continuing operations
before income from equity investees 22,198 26,317 41,564 46,806 29,391Total fixed charges 2,113 1,710 1,712 1,608 1,684Distributed income from equity investees 6,902 7,117 10,573 9,681 6,519Less: interest capitalised 757 762 567 674 969Total earnings 30,456 34,382 53,282 57,421 36,625Interest expensed and capitalised 1,522 1,412 1,461 1,209 1,218Interest within rental expense 591 298 251 399 466Total fixed charges 2,113 1,710 1,712 1,608 1,684Ratio of earnings to fixed charges 14.41 20.11 31.12 35.71 21.75

E2 ADDITIONAL INFORMATION
EXHIBIT 8 SHELL ANNUAL REPORT AND FORM 20-F 2014
EXHIBIT 8SIGNIFICANT SUBSIDIARIES (AUDITED)Significant subsidiaries at December 31, 2014, and Shell’s percentage of share capital (to the nearest whole number) are set out below. All ofthese subsidiaries have been included in the “Consolidated Financial Statements” on pages 106-141. Those held directly by the Company aremarked with an asterisk (*). A complete list of investments in subsidiaries, incorporated joint arrangements and associates will be attached to theCompany’s annual return made to the Registrar of Companies.
Company name % Country of incorporation Principal activities Class of shares heldShell Australia Pty Ltd 100 Australia Upstream OrdinaryShell Energy Holdings Australia Limited 100 Australia Upstream Ordinary, redeemable [A]Qatar Shell GTL Limited 100 Bermuda Upstream OrdinaryTacoma Company Limited 100 Bermuda Upstream OrdinaryShell Brasil Petroleo Ltda 100 Brazil Upstream Quotas (Voting)Shell Canada Energy 100 Canada Upstream OrdinaryShell Gabon SA 75 Gabon Upstream OrdinaryShell Italia E&P Spa 100 Italy Upstream OrdinarySarawak Shell Berhad 100 Malaysia Upstream OrdinaryShell Kazakhstan Development B.V. 100 Netherlands Upstream Redeemable [A], non-redeemableShell Olie – OG Gasudvinding Danmark B.V. 100 Netherlands Upstream OrdinaryShell Philippines Exploration B.V. 100 Netherlands Upstream Redeemable [A], non-redeemableShell Nigeria Exploration and Production Company Limited 100 Nigeria Upstream OrdinaryThe Shell Petroleum Development Company of Nigeria Limited 100 Nigeria Upstream OrdinaryA/S Norske Shell 100 Norway Upstream OrdinaryEnterprise Oil Limited 100 UK Upstream OrdinaryShell U.K. Limited 100 UK Upstream OrdinaryEnterprise Oil North America Inc. 100 USA Upstream OrdinaryShell Gulf of Mexico Inc. 100 USA Upstream OrdinaryShell Offshore Inc 100 USA Upstream OrdinaryShell US E&P Investments LLC 100 USA Upstream Equity (Voting)SOI Finance Inc. 100 USA Upstream OrdinarySWEPI LP 100 USA Upstream Partnership CapitalShell Compania Argentina De Petroleo S.A. 100 Argentina Downstream NominativeShell Western Supply & Trading Limited 100 Barbados Downstream OrdinaryShell International Trading Middle East Limited 100 Bermuda Downstream OrdinaryShell Canada Limited 100 Canada Downstream Ordinary, redeemable [A]Shell Canada Products 100 Canada Downstream OrdinaryDeutsche Shell GmbH 100 Germany Downstream OrdinaryDeutsche Shell Holding GmbH 100 Germany Downstream OrdinaryShell Deutschland Oil GmbH 100 Germany Downstream OrdinaryShell Luxembourgeoise Sarl 100 Luxembourg Downstream OrdinaryShell Nederland Raffinaderij B.V. 100 Netherlands Downstream OrdinaryShell Trading Rotterdam B.V. 100 Netherlands Downstream OrdinaryShell Eastern Petroleum (Pte) Limited 100 Singapore Downstream Ordinary, redeemableShell Eastern Trading (Pte) Limited 100 Singapore Downstream Ordinary, redeemableShell Energy Europe Limited 100 UK Downstream OrdinaryShell Trading International Limited 100 UK Downstream OrdinaryEquilon Enterprises LLC 100 USA Downstream Membership InterestSCOGI, G.P. 100 USA Downstream EquityShell Chemical LP 100 USA Downstream Partnership CapitalShell Energy North America (US), LP 100 USA Downstream Partnership CapitalShell Trading (US) Company 100 USA Downstream OrdinarySOPC Holdings East LLC 100 USA Downstream Membership InterestSOPC Holdings West LLC 100 USA Downstream OrdinaryTMR Company 100 USA Downstream Ordinary[A] Non-voting class of share.

ADDITIONAL INFORMATION E3
SHELL ANNUAL REPORT AND FORM 20-F 2014 EXHIBIT 8
Company name % Country of incorporation Principal activities Class of shares held
Shell Oman Trading Limited 100 Bermuda Corporate OrdinarySolen Insurance Limited 100 Bermuda Corporate OrdinaryShell Finance Luxembourg Sarl 100 Luxembourg Corporate OrdinaryShell Treasury Luxembourg Sarl 100 Luxembourg Corporate OrdinaryB.V. Dordtsche Petroleum Maatschappij 100 Netherlands Corporate OrdinaryShell Brazil Holding B.V. 100 Netherlands Corporate OrdinaryShell Finance (Netherlands) B.V. 100 Netherlands Corporate OrdinaryShell Gas B.V. 100 Netherlands Corporate OrdinaryShell International Finance B.V.* 100 Netherlands Corporate OrdinaryShell Nederland B.V. 100 Netherlands Corporate OrdinaryShell Overseas Investments B.V. 100 Netherlands Corporate OrdinaryShell Petroleum N.V.* 100 Netherlands Corporate OrdinaryShell Treasury Centre East (Pte) Limited 100 Singapore Corporate OrdinaryShell Finance Switzerland AG 100 Switzerland Corporate OrdinarySolen Versicherungen AG 100 Switzerland Corporate Registered (Voting)Shell Energy Investments Limited 100 UK Corporate OrdinaryShell Holdings (U.K.) Limited 100 UK Corporate OrdinaryShell Overseas Holdings Limited 100 UK Corporate OrdinaryShell Treasury Centre Limited 100 UK Corporate OrdinaryShell Treasury Dollar Company Limited 100 UK Corporate Ordinary, redeemableShell Treasury U.K. Limited 100 UK Corporate OrdinaryThe Shell Petroleum Company Limited 100 UK Corporate OrdinaryThe Shell Transport and Trading Company Limited 100 UK Corporate Ordinary, redeemablePecten Victoria Company 100 USA Corporate OrdinaryShell Oil Company 100 USA Corporate OrdinaryShell Petroleum Inc. 100 USA Corporate Ordinary

E4 ADDITIONAL INFORMATION
EXHIBIT 12.1 SHELL ANNUAL REPORT AND FORM 20-F 2014
EXHIBIT 12.1I, Ben van Beurden, certify that:
1. I have reviewed the Annual Report on Form 20-F of Royal Dutch Shell plc (the Company);
2. Based on my knowledge, the report does not contain any untrue statement of a material fact or omit to state a material fact necessary to makethe statements made, in light of the circumstances under which such statements were made, not misleading with respect to the period covered bythe report;
3. Based on my knowledge, the financial statements, and other financial information included in the report, fairly present in all material respectsthe financial condition, results of operations and cash flows of the Company as of, and for, the periods presented in the report;
4. The Company’s other certifying officer and I are responsible for establishing and maintaining disclosure controls and procedures (as defined inExchange Act Rules 13a-15(e) and 15d-15(e)) and internal control over financial reporting (as defined in Exchange Act Rules 13a-15(f) and15d-15(f)) for the Company and have:
� designed such disclosure controls and procedures, or caused such disclosure controls and procedures to be designed under our supervision, toensure that material information relating to the Company, including its consolidated subsidiaries, is made known to us by others within thoseentities, particularly during the period in which the report is being prepared;
� designed such internal control over financial reporting, or caused such internal control over financial reporting to be designed under oursupervision, to provide reasonable assurance regarding the reliability of financial reporting and the preparation of financial statements forexternal purposes in accordance with generally accepted accounting principles;
� evaluated the effectiveness of the Company’s disclosure controls and procedures and presented in the report our conclusions about theeffectiveness of the disclosure controls and procedures, as of the end of the period covered by the report based on such evaluation; and
� disclosed in the report any change in the Company’s internal control over financial reporting that occurred during the period covered by theannual report that has materially affected, or is reasonably likely to materially affect, the Company’s internal control over financial reporting.
5. The Company’s other certifying officer and I have disclosed, based on our most recent evaluation of internal control over financial reporting, tothe Company’s auditors and the audit committee of the Company’s Board of Directors (or persons performing the equivalent functions):
� all significant deficiencies and material weaknesses in the design or operation of internal control over financial reporting which are reasonablylikely to adversely affect the Company’s ability to record, process, summarise and report financial information; and
� any fraud, whether or not material, that involves management or other employees who have a significant role in the Company’s internal controlover financial reporting.
/s/ Ben van Beurden
Ben van BeurdenChief Executive OfficerMarch 11, 2015

ADDITIONAL INFORMATION E5
SHELL ANNUAL REPORT AND FORM 20-F 2014 EXHIBIT 12.2
EXHIBIT 12.2I, Simon Henry, certify that:
1. I have reviewed the Annual Report on Form 20-F of Royal Dutch Shell plc (the Company);
2. Based on my knowledge, the report does not contain any untrue statement of a material fact or omit to state a material fact necessary to makethe statements made, in light of the circumstances under which such statements were made, not misleading with respect to the period covered bythe report;
3. Based on my knowledge, the financial statements, and other financial information included in the report, fairly present in all material respectsthe financial condition, results of operations and cash flows of the Company as of, and for, the periods presented in the report;
4. The Company’s other certifying officer and I are responsible for establishing and maintaining disclosure controls and procedures (as defined inExchange Act Rules 13a-15(e) and 15d-15(e)) and internal control over financial reporting (as defined in Exchange Act Rules 13a-15(f) and15d-15(f)) for the Company and have:
� designed such disclosure controls and procedures, or caused such disclosure controls and procedures to be designed under our supervision, toensure that material information relating to the Company, including its consolidated subsidiaries, is made known to us by others within thoseentities, particularly during the period in which the report is being prepared;
� designed such internal control over financial reporting, or caused such internal control over financial reporting to be designed under oursupervision, to provide reasonable assurance regarding the reliability of financial reporting and the preparation of financial statements forexternal purposes in accordance with generally accepted accounting principles;
� evaluated the effectiveness of the Company’s disclosure controls and procedures and presented in the report our conclusions about theeffectiveness of the disclosure controls and procedures, as of the end of the period covered by the report based on such evaluation; and
� disclosed in the report any change in the Company’s internal control over financial reporting that occurred during the period covered by theannual report that has materially affected, or is reasonably likely to materially affect, the Company’s internal control over financial reporting.
5. The Company’s other certifying officer and I have disclosed, based on our most recent evaluation of internal control over financial reporting, tothe Company’s auditors and the audit committee of the Company’s Board of Directors (or persons performing the equivalent functions):
� all significant deficiencies and material weaknesses in the design or operation of internal control over financial reporting which are reasonablylikely to adversely affect the Company’s ability to record, process, summarise and report financial information; and
� any fraud, whether or not material, that involves management or other employees who have a significant role in the Company’s internal controlover financial reporting.
/s/ Simon Henry
Simon HenryChief Financial OfficerMarch 11, 2015

E6 ADDITIONAL INFORMATION
EXHIBIT 13.1 SHELL ANNUAL REPORT AND FORM 20-F 2014
EXHIBIT 13.1In connection with the Annual Report on Form 20-F of Royal Dutch Shell plc (the Company) for the year ended December 31, 2014, as filed withthe Securities and Exchange Commission on the date hereof (the Report), each of the undersigned officers of the Company certify pursuant to18 U.S.C. Section 1350, as adopted pursuant to Section 906 of the Sarbanes-Oxley Act of 2002, to such officer’s knowledge, that:
1. The Report fully complies, in all material respects, with the requirements of Section 13(a) or 15(d) of the Securities Exchange Act of 1934; and
2. The information contained in the Report fairly presents, in all material respects, the financial condition and results of operations of the Companyas of, and for, the periods presented in the Report.
The foregoing certification is provided solely for purposes of complying with the provisions of Section 906 of the Sarbanes-Oxley Act of 2002and is not intended to be used or relied upon for any other purpose.
/s/ Ben van Beurden
Ben van BeurdenChief Executive Officer
/s/ Simon Henry
Simon HenryChief Financial OfficerMarch 11, 2015

ADDITIONAL INFORMATION E7
SHELL ANNUAL REPORT AND FORM 20-F 2014 EXHIBIT 99.1
EXHIBIT 99.1CONSENT OF INDEPENDENT REGISTERED PUBLIC ACCOUNTING FIRMWe hereby consent to the incorporation by reference in the Registration Statement on Form F-3 (No. 333-199736) and the RegistrationStatements on Form S-8 (No. 333-126715, 333-141397, 333-171206, 333-192821 and 333-200953) of Royal Dutch Shell plc of ourreport dated March 11, 2015, relating to the Consolidated Financial Statements and the effectiveness of internal control over financial reporting,which appears in this Annual Report on Form 20-F.
/s/ PricewaterhouseCoopers LLP
PricewaterhouseCoopers LLPLondonMarch 11, 2015

E8 ADDITIONAL INFORMATION
EXHIBIT 99.2 SHELL ANNUAL REPORT AND FORM 20-F 2014
EXHIBIT 99.2CONSENT OF INDEPENDENT REGISTERED PUBLIC ACCOUNTING FIRMWe hereby consent to the incorporation by reference in the Registration Statement on Form F-3 (No. 333-199736) and the RegistrationStatements on Form S-8 (No. 333-126715, 333-141397, 333-171206, 333-192821 and 333-200953) of the Royal Dutch Shell DividendAccess Trust of our report dated March 11, 2015, relating to the Royal Dutch Shell Dividend Access Trust Financial Statements, and theeffectiveness of internal control over financial reporting, which appears in this Annual Report on Form 20-F.
/s/ PricewaterhouseCoopers CI LLP
PricewaterhouseCoopers CI LLPJersey, Channel IslandsMarch 11, 2015

REGISTERED OFFICERoyal Dutch Shell plcShell Centre London SE1 7NA United Kingdom
Registered in England and WalesCompany number 4366849Registered with the Dutch Trade Registerunder number 34179503
HEADQUARTERSRoyal Dutch Shell plcCarel van Bylandtlaan 302596 HR The HagueThe Netherlands
SHARE REGISTRATIONEquinitiAspect HouseSpencer Road Lancing West Sussex BN99 6DAUnited Kingdom0800 169 1679 (UK)+44 (0)121 415 7073
For online information about your holding and to change the way you receive your company documents: www.shareview.co.uk
INVESTOR RELATIONSRoyal Dutch Shell plcPO Box 1622501 AN The Hague The Netherlands +31 (0)70 377 4540 orShell Oil Company Investor Relations150 N Dairy AshfordHouston, TX 77079 USA+1 832 337 2034
[email protected]@shell.comwww.shell.com/investor
REPORT [email protected]
Annual Report/20-F service for US residents+1 888 301 0504
SHAREHOLDER RELATIONSRoyal Dutch Shell plcCarel van Bylandtlaan 302596 HR The Hague The Netherlands +31 (0)70 377 1365 +31 (0)70 377 4088+31 (0)70 377 3953 (fax)orRoyal Dutch Shell plcShell Centre London SE1 7NAUnited Kingdom+44 (0)20 7934 3363+44 (0)20 7934 7515 (fax)
[email protected]/shareholder
AMERICAN DEPOSITARY SHARES (ADSs)BNY Mellon Shareowner ServicesPO Box 30170College Station, TX 77842-3170USA
Overnight correspondence to: BNY Mellon Shareowner Services 211 Quality Circle, Suite 210College Station, TX 77845 USA+1 888 737 2377 (USA)+1 201 680 6825 (international)
FINANCIAL CALENDAR IN 2015The Annual General Meeting will be held on May 19, 2015.
2014 Fourth quarter [A]
2015 First quarter [B]
2015 Second quarter [B]
2015 Third quarter [B]
Results announcements January 29 April 30 July 30 October 29Interim dividend timetable
Announcement date January 29 [C] April 30 July 30 October 29Ex-dividend date A and B ADSs [D] February 11 May 13 August 12 November 10Ex-dividend date A and B shares [D] February 12 May 14 August 13 November 12Record date February 13 May 15 August 14 November 13
February 27 June 1 August 28 November 27March 6 June 8 September 4 December 4
Payment date March 20 June 22 September 21 December 18[A] In respect of the financial year ended December 31, 2014.[B] In respect of the financial year ended December 31, 2015.[C] The Directors do not propose to recommend any further distribution in respect of 2014.[D] The London Stock Exchange and Euronext Amsterdam, with effect from October 6, 2014, reduced the standard settlement cycle in accordance with the Regulation of the European Parliament and of the Council on improving securities settlement in the European Union (EU) and on Central Securities Depositories (CSDs) and amending Directive 98/26/EC (the CSD Regulation). The CSD Regulation aims to harmonise EU securities settlement cycles towards a T + 2 cycle. As a result, the ex-dividend dates for A and B shares traded on these markets are one trading day later than A ADSs and B ADSs traded in the USA. Record dates are not affected.[E] A different currency election date may apply to shareholders holding shares in a securities account with a bank or financial institution ultimately holding through Euroclear Nederland. Such shareholders can obtain the applicable deadlines from their broker, financial intermediary, bank or financial institution where they hold their securities account.
Closing date for currency election [E]Euro and sterling equivalents announcement date

Company newsInteractive stories about innovationService-station locations
Download our apps at www.shell.com/mobile_and_apps
All our reports are available at http://reports.shell.com
Comprehensive financial information on our activities throughout 2014Detailed operational information including mapsReport on our progress in contributing to sustainable development
Follow @Shell on Twitter www.facebook.com/shell
Check our latest news