Sheet Erosion Studies on Cecil Clay
54
NOVEMBER 1936 Sheet Erosion Studies on Cecil Clay By E. G. DISEKER and R. E. YODER AGRICULTURAL EXPERIMENT STATION OF THE ALABAMA POLYTECHNIC INSTITUTE M. J. FUNCHESS, Director AUBURN, ALABAMA BULLETIN 245
Transcript of Sheet Erosion Studies on Cecil Clay

NOVEMBER 1936
Sheet Erosion Studieson
Cecil Clay
By
E. G. DISEKER and R. E. YODER
AGRICULTURAL EXPERIMENT STATION
OF THE
ALABAMA POLYTECHNIC INSTITUTE
M. J. FUNCHESS, DirectorAUBURN, ALABAMA
BULLETIN 245
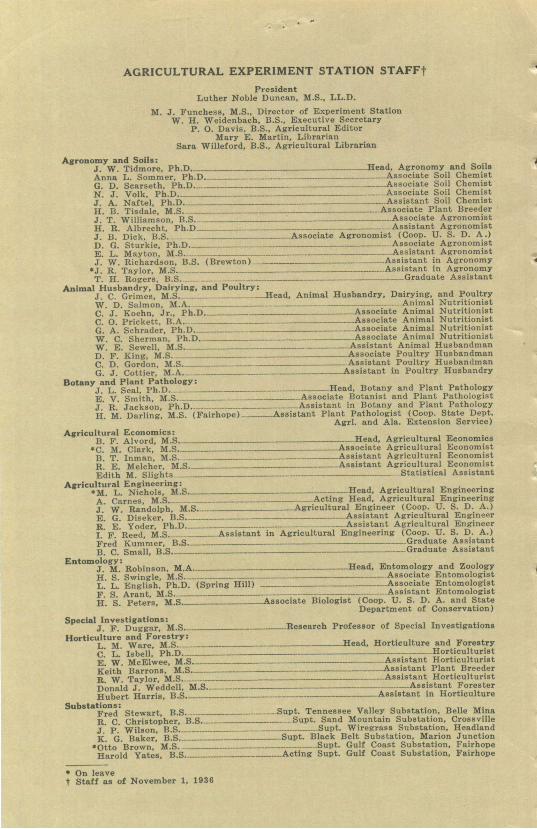
AGRICULTURAL EXPERIMENT STATION STAFFt
PresidentLuther Noble Duncan, M.S., LL.D.
M. J. Funches, M.S., Director of Extieriment StationW. I. Weidenbach, B.S., Executive Secretary
P. 0. Davis. B.S., Agricultural EditorMary E. Martin, Librarian
Sara Willeford, B.S., Agricultural Librarian
Agronomy and Soils:J. W. Tidmore, Ph.D.-Anna I. Sommer, Ph.D.G. D. Scarseth, Ph.D.__N. J. Volk, Ph.D.J. A. Naftel, Ph.D.H. 13. Tisdale, M.S.j. T. Willianson, .IlS.H. R. Albrecht. 'h.DJ. B. Dick, B.S. -------------
. U. Siurkie, l'h.D.E. L. Mayton, M.S.J. W. Richardson, B1.S. (Brewton)
-J. R. Taylor, M.S.T. H. Ro"ers. 11.8.
Animal Husbandry, Dairying, and Poultry:J. C. (rims, M.S. Head,W. D. salinon, 11. .C. J. [Koehn, Jr., Ph.D.C. 0. Prickett, B.. \.__ _ -- _G. A. Schrader, Ih.).W. C. Sherman. I'h .W. E. Sewell, M.S.D. F. King, M.S.C. D. Gordm, M.S.G. . Cotir. M.. X
Botany and Plant Pathology:.1. L. Seal, h. ).F. V. Smith, M.S.J. R. Jackson,, Ph.D.H. M. Darling, M.S. (Foirhope) Assi
Agricultural Economics:I. F. Alvordt, M.S-
-C. M. Clark, MS.ii. T. Inman, M.S -R. E. Melcher, MS.--------_Edith M. Slights
Agricultural Engineering:"M. L. Nichouls, M.S.,_____-------------A. Crnes, M.S.J. W. Randolph, M.S.F. G. Diseker, IS.R. E. Yoler. Ph.D.I. F. Reel, MS. -- Assistant in AgFred [Kummer. l.S. ---B. C. Small, B.S.
Entomology;J. M. Robinson, MA.--H. S. Swingle, MS.L. L. English. I'h.D. (Spring Hill)F. S. Arant. M.S -H. S. Peters, M.S. Associ------------Associ
Special Investigations:J. F. Duggar, M.S. . K.------ ---
Horticulture and Forestry:. M. Ware MS. .-----------
C. L. Ishell, Ph.D.E. W. McElwee, MS.----------------------------Keith Ilarrons, M.S.R. W. Taylor, M.S.Donald J. Weddell, M.S.Hubert Harris, B.S.
Substations;Fred Stesart, Bt.S. SupR. C. Christopher, B.S.J. P. Wilson. B.S.. ._K. G. Baker, I.S. So------------ - -
-Otto Brown, M.S.Harold Yates, B.S. ---------.----- Ac
" On leavef Staff as of November 1, 1936
Head, Agronomy and SoilsAssociate Sail ChenistAssocitate Soil Chemtist
Associate Soil Cheniust_-Assistant Soil Chemist
__Associate Plant BretlerAssociate AgroiomistAssistant Agrinomist
Associate Agronomist (Coop. U. S. B. A.)Associate AgronomistAssistant Agronomist
_. Assistant in Agrotiomy.. Assistant in Agronony
Gratuate Assistant
Animal Husbandry, Dairying, and PoultryAnimal Nutrititnist
Xssociate Animal NutritionistAssociate Animal NutrititnistAssociate Animal NutrittoristAssociate Animal Nutritionist
Assistant Animal HusbailttinAssociate Poultry HusandmanAssistant Poultry Husbanimtn
_-____------- .-Assistant in Poultry Husbatndry
Head. Iotany and Plant PathologyAssociate Ilotnist and Plant PaitholisAssistant in liotany atd Plait Pathology
stant Plant Pathologist (Coop. State I)ett.Agrl. and Ala. Extension Service)
Head, Agricultural Economics______Associate Agricultural Economist
Assistant Agricultural EconomistAssistant Agriculturl Economist
Statistical Assistant
Head, Agricultural EngineeringActing Head, Agricultural Engineering
Agricultural Engineer (Coop. U. S. D. A.)Assistaut Agricultural Enginer
__Assistant Agricultiral Ergitteerricultural Engineering (Coop. U. S. t). A.)
Graduate AssistantGraduate Assistant
________. __-. -Head. Entomology and ZoologyAssociate EnttmologistAssociate EntomologistAssistant Entomologist
ate Biologist (Coop. U. S. D. A. anti StateDepartment of Conservation)
esearch Professor of Special Investigations
----Head, Horticulture and ForestryHorticulturist
-_ _ Assistant Horticulturist_ ----------------Assistant Plant Ireeder
- . Assistant IorticulturistAssistant Forester
_______ __. . Assistant in Horticulture
t. Tennessee Valley Substation, Belle MinaSupt. Sand Muuntain Substation, Crossville
Supt. Wiregrass Substation, Headlandpt. Black Belt Substation. Marion Junction
Supt. Gulf Coast Substatioti, Fairhopeting Supt. Gulf Coast Substation, Fairhupe
Sheet Erosion Studies on Cecil Clay
By
ELLIS G. DISEKERAssistant Agricultural Engineer
and
ROBERT E. YODERAssistant Agricultural Engineer
NOVEMBER 1936BULLETIN 245

Contents
INTRODUCTION 3-----------------------
EXPERIMENTAL METHODS AND PROCEDURE 5
Description of Plots 5Soil Type and Uniformity 5Precipitation Measurements and the Control of
Artificial Rainfall 7Measurement of Runoff and Eroded Materials 8
EXPERIMENTAL RESULTS 10
The Relation of Soil Moisture Content and Ab-sorption to Erosion Losses 10
Influence of Intensity of Rainfall on Erosion 14Influence of Quantity of Rainfall on Erosion 19Influence of Pulverization, Structure and
Shape of Surface on Erosion 20The Physical Nature of Erosion Losses and
Certain Factors Affecting the Nat-ure of Erosion Losses 23
Influence of Vegetative Protection on Erosion 36Influence of Strip Cropping on Erosion 37Erosion Losses from Contour and from Slope-Planted Crops 46Relation of Slope to Erosion 47Effect of Erosion on Yields 49
SUMMARY 50
LITERATURE CITED 51
ACKNWLEDMENT 52

Sheet Erosion Studies on Cecil Clay
ROSION control has become a serious agricultural problem
since the advent of intensive agriculture. Excessive soilerosion has resulted from certain activities of man which
have disturbed the natural equilibrium between the processesof erosion and of soil formation. Since the soil is agriculture'sgreatest natural resource, its conservation is a fundamental prob-lem. Experiments have shown that man-accelerated erosionmay result in an annual loss of plant nutrients several times asgreat as that required to produce a normal crop of cotton orcorn (1)1. The natural productive capacity of an enormousacreage of once fertile land has been depleted by sheet erosionwhich has washed away varying portions of the surface soil (2,3). In addition, gullying, a more apparent type of erosion, hasdamaged extensive areas of once agricultural soil beyond thestage of immediate recovery (3).
The basic agriculture of the Cotton Belt is built around asystem of open-cultivated crops. Even the average farmer isaware that erosion is a serious hazard under such conditions.Terracing has been practiced for more than two generations.This practice is almost universally accepted by Alabama farmersas a necessity. It is an accepted fact that the construction andmaintenance of an adequate system of terraces is the first stepin any sound program of erosion control under the above de-scribed system of agriculture. Likewise, contour planting andcultivation are widely accepted and practiced by nearly all pro-gressive farmers. Further control measures by necessity mustbe modifications of or supplemental practices built into andaround this basic system.
It is apparent that sheet erosion control must be consideredas a "between-terrace" problem since the land between terracesconstitutes the unit areas from which runoff occurs. Threegroups of supplemental practices offer possibilities from whichpractical sheet erosion control measures may be developed. Theyare as follows: (a) increased and improved use of vegetation,(b) improved methods of tillage and mechanical manipulation ofthe soil, and (c) a wiser selection and use of land for the pro-duction of clean-cultivated crops. The last mentioned is beyondthe scope of this publication but results of work of the typeherein reported should be of value in serving as a guide to asound land use program.
Much has been written concerning the erosion process. How-ever, a large portion of these writings are opinions based on
1 Numbers in parentheses refer to literature cited.
3

SEROSION LOSSES
SSOILAN°FERTILITY LOSSES WATER LOSSESDECREASEDPRODUCTIVITY, LANDVALUES AND FLOODS. DROUGHT, WATER SUPPLY ANDFARM INCOME;SEDIMENTATION PROBLEMS NAVIGATION PROBLEMS
PUBLIC WELFAREFIGURE 1. Interrelationship of factors involved in the soil erosion problem.

.5
empirical observation. Notable exceptions are the work of theMissouri Agricultural Experiment Station (6, 10) and that ofthe recently established Federal Erosion Experiment Stations(8, 9).
The extent of erosion losses is dependent on a large numberof complexly related variables which in turn are dependentupon factors of climate, topography, vegetation and soil. Anattempt has been made in Figure 1 to show diagramaticallythe interrelationship of these factors.
Topography influences vegetation, climate, and soil char-acteristics. Climate, vegetation, and soil conditions mutuallyexert pronounced influences on each other. As a result soilswith different physical, chemical, and biological properties havebeen formed. Nature has integrated these environmental forceswith the result that different soils possessing characteristic struc-ture have developed. Structure, along with precipitation, tem-perature, plant growth, and organic residues, determines thetendency of a given soil to erode-the erodibility of the soil.The climatic and vegetative factors as well as the slope factorsof topography are important in determining the nature andamount of runoff.
It is the purpose of this publication to (a) present methodsand procedure by which some of the basic principles involvedin sheet erosion control may be analyzed, and (b) to report theresults of several years experimentation on the measurementand control of sheet erosion on Cecil clay.
EXPERIMENTAL METHODS AND PROCEDURE
Description of Plots.-The experimental area consisted often controlled plots, each enclosed by concrete walls. Eachplot was 1/58 acre; the slope length was 50 feet and the widthwas 15 feet. The slope length was chosen to correspond approx-imately with the horizontal distances between terraces on criticalslopes (4). The areas were sufficiently large to approximatefield conditions and still permit the control of variable factorsinvolved in the sheet erosion process. A concrete cistern 3feet wide, 15 feet long and 5 feet deep, located at the lowerend of each plot, was used to facilitate the measurement of bothrunoff and soil losses. These cisterns were constructed so thatthey might be drained by gravity. A general view of the plotlayout is shown in Figure 2.
Soil Type and Uniformity.-The soil used in these experi-
ments was a Cecil clay. Detailed data concerning the physicaland chemical properties of the Cecil series as represented inAlabama have been reported by Davis (5). In order to insureuniformity of soil on the ten plots, the surface soil and six inches

FIGUREii' 2.-G hi i\ %ie\ of erion~ Plot la 1
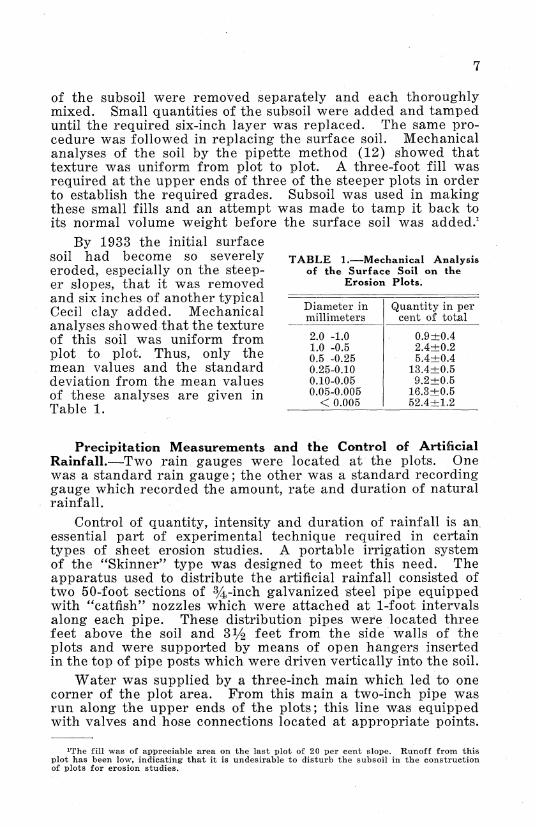
of the subsoil were removed separately and each thoroughlymixed. Small quantities of the subsoil were added and tampeduntil the required six-inch layer was replaced. The same pro-cedure was followed in replacing the surface soil. Mechanicalanalyses of the soil by the pipette method (12) showed thattexture was uniform from plot to plot. A three-foot fill wasrequired at the upper ends of three of the steeper plots in orderto establish the required grades. Subsoil was used in makingthese small fills and an attempt was made to tamp it back toits normal volume weight before the surface soil was added.
By 1933 the initial surfacesoil had become so severely TABLE 1.-Mechanical Analysiseroded, especially on the steep- of the Surface Soil on theer slopes, that it was removed Erosion Plots.
and six inches of another typicalCecil clay added. Mechanical Diameter in Quantity in peranalyses showed that the textureof this soil was uniform from 2.0 -1.0 0.9±0.4
1.0 -0.5 2.4±0.2plot to plot. Thus, only the 0.5 -0.25 5.40.4mean values and the standard 0.25-0.10 13.4+0.5deviation from the mean values 0.10-0.05 9.2±0.5
of these analyses are given in 0.05-0.005 16.30.5
Table 1. < 0.005 52.4±1.2
Precipitation Measurements and the Control of ArtificialRainfall.-Two rain gauges were located at the plots. Onewas a standard rain gauge; the other was a standard recordinggauge which recorded the amount, rate and duration of naturalrainfall.
Control of quantity, intensity and duration of rainfall is anessential part of experimental technique required in certaintypes of sheet erosion studies. A portable irrigation systemof the "Skinner" type was designed to meet this need. Theapparatus used to distribute the artificial rainfall consisted oftwo 50-foot sections of 83/4-inch galvanized steel pipe equippedwith "catfish" nozzles which were attached at 1-foot intervalsalong each pipe. These distribution pipes were located threefeet above the soil and 31/2 feet from the side walls of theplots and were supported by means of open hangers insertedin the top of pipe posts which were driven vertically into the soil.
Water was supplied by a three-inch main which led to onecorner of the plot area. From this main a two-inch pipe wasrun along the upper ends of the plots; this line was equippedwith valves and hose connections located at appropriate points.
'The fill was of appreciable area on the last plot of 20 per cent slope. Runoff from thisplot has been low, indicating that it is undesirable to disturb the subsoil in the constructionof plots for erosion studies.
The distribution pipes were moved from plot to plot and wereattached to the two-inch pipe line with a one-inch rubber hose.A gate valve and water meter were inserted in the three-inchmain; these, together with a stop watch, were used to controlthe rate and quantity of artificial rainfall.
The "catfish" nozzles were selected after testing severaldifferent types. These tests were made by placing a largenumber of small pans at intervals over the plots and measuringthe amount of water caught in each pan. It was found neces-sary to adjust the openings in the nozzles in order to obtain auniform distribution of water.
During artificial rainfall applications, ten-foot portable can-vas walls were used to surround the plots to prevent wind fromblowing the water onto adjacent plots. These walls were sup-ported from cables suspended between steel I-beam tracks lo-cated above and extending along the two sides of the plot area;the ends of the cables were attached to small cars mounted onthe tracks. This equipment facilitated the movement of thecanvas barriers from plot to plot during artificial rainfall ex-periments.
Measurement of Runoff and Eroded Materials.-A troughlocated at the lower edge of each plot was used to divert runoffand eroded material through 6-inch sheet-metal pipes and into32-gallon galvanized cans. These pipes extended to within afew inches of the bottom of the cans. Utilizing the principle ofStoke's law of settling velocity (14), the coarse sediments whichcould not be measured accurately by suspension samples, wereretained in the can. After the can overflowed, the smallersediments which were measured by suspension samples passedinto the pit with the water. The water was slowly decantedand the cans were then lifted from the cisterns by a differentialhoist mounted on a continuous metal track extending over the en-tire length of the cisterns. The coarse, wet material was weighedwhen it was lifted from the pit. This material was thoroughlymixed and a 500- to 600-gram representative sample was takenand its oven-dry weight determined. The amount of coarse,dry sediment was then calculated in pounds lost per acre.
Runoff and the finer eroded materials in the cistern werethoroughly agitated by means of a perforated metal agitator.Three one-half gallon samples were quickly taken after eachagitation from three uniformly spaced locations in the pit. Thesesamples were thoroughly mixed and-a one-half gallon compos-ite sample taken. The suspension solids were flocculated withan aluminum sulfate solution, filtered, oven dried, and weighed.The pits were calibrated and the depth of the runoff water wasmeasured to the nearest one-hundredth of a foot. Calculationsof the pounds of suspended material lost per acre were then

made and the amount added to the dry weight of coarse ma-terial lost per acre, thus giving the total quantity of soil losses.
In event the galvanized can did not hold all the coarseeroded material and some of it passed into the cistern, whichwas frequently the case during extremely heavy rains, a sampleof the suspension was taken without agitation. The water wasthen slowly drained off and the remaining coarse material wasshoveled into a can and weighed as previously described.
A special gauge was designed to measure the rate of runoffproduced by artificial rainfall of known intensity and duration.(See Figure 3.) By means of this gauge, the rise of waterin the cistern was recorded on a calibrated chart at the desired
time intervals. A perm-anent record was madeby marking on thechart at the desiredtime as the pointer mov-
L ... d.- ed down the chart.F = FloatS= ScaleE= FennelB - Wave batle boardB'. Wave beaffle cylinderD. Drain pipevalveT= Sheet metal troughC 3Oallon can for coarse sedimentsW= Counter-weight with scale pointerG
=Gage support with adjustable Clamps
FIGURE 3.-Sketch of a cistern showingequipment for measuring soillosses and rate of runoff.
Runoff and soil lossesdepend upon a num-ber of interrelated fac-tors; these have alreadybeen listed. Under ordi-nary field conditions itis frequently impossibleto evaluate the influ-ence of a single variablebecause of its close as-sociation with or inter-dependence on one ormore other factors. Inorder to isolate andstudy the influence of asingle factor, it is es-sential to have an ex-perimental set-up whichpermits the control ormeasurement of th emaximum number of in-terrelated variableswhile the single factoris allowed to vary.
'The term "soil losses" as used herein refers to the quantity of soil eroded from theplots into the cisterns. Under field conditions with an adequate system of terraces, un-doubtedly an appreciable portion of the "so called" soil losses would be deposited in theterrace channels.

10
The plot layout and methods already described were de-veloped in an attempt to obtain such a set-up. The factorswhich could be controlled or measured were as follows:
Soil conditions Vegetation Climate Topography
Controllable variables
Rate, amountFactors of Type of plants and duration of Length, degreesoil type Planting methods artificial and continuity of
rainfall slope
Measurable variables
Soil moisture Rate, amount andOrganic matter Ground coverage duration of MicrotopographyPulverization Amount of growth natural rainfall (height of beds)
(Dynamic conditions) Temperature
Resulting variables
Erosion losses-rate, amount and nature of runoff, soil movement and soil losses
Natural rainfall is so fortuitous with respect to distributionand intensity that interpretation of resulting data concerningerosion losses is exceedingly difficult. (See Table 2.) Thus,the artificial rainfall system was not only necessary to controlintensity, quantity, and continuity of rainfall, but it also speededup experimental work.
The high rates of rainfall application were chosen so thatmeasurable erosion losses would be produced on all slopes undera wide range of conditions. The rates approach the maximumintensity of natural rainfall of the region as recently reportedby Yarnell (15). The intensity and duration of a large numberof natural rains, as recorded at the erosion plots during thecourse of these experimerits, are given in Table 3.
EXPERIMENTAL RESULTS
The following discussions are based for the most part onexperimental work conducted on Cecil clay. Many of the prin-ciples involved are believed to be of rather general applicationto the sheet erosion process. However, it is realized that themagnitude of erosion losses is quite different from that whichwould be obtained under similar conditions with other soil typesof markedly different physical and chemical properties.
The Relation of Soil Moisture Content and Absorption toErosion Losses.-JIt is obvious that the extent of saturation ofa soil with respect to water determines the rate and extent offurther absorption and hence influences the amount of runoffand soil losses. Both the immediate absorptive capacity and

TABLE 2.-Rainfall by Months at Auburn, Alabama (1929-1936) with the 55 year Average.
Year
1929
Inches
4.289.64
17.475.327.054.191.681.534.554.046.834.71
71.24
1932
Inches
5.614.433.451.922.582.434.794.383.212.126.187.14
48.24
Month
JanuaryFebruaryMarchAprilMayJuneJulyAugustSeptemberOctoberNovemberDecember
Totals
1933
Inches
2.566.587.412.271.332.323.213.493.444.191.10
39.85
1936
Inches
12.097.894.859.341.172.933.687.72
55 yr. average
1881-1935
Inches
4.705.355.774.073.514.075.364.643.082.813.395.11
51.86
TABLE 3.-Duration and Amount of Continuous Portions of Intense Erosive Rains by Months at Auburn, Alabama.
Year
Month 1931 1932 1933 1934 1935 1936
Inches Hours Inches Hours Inches Hours Inches Hours Inches Hours Inches Hours
January 0.50 1.0 1.70 7.3 0.35 1.5 1.00 1.0February 0.40 0.8 1.15 4.7 0.75 4.2 0.70 2.8 0.85 0.1March 0.95 1.7 1.70 9.0 3.00 18.0 0.90 0.1April 1.60 6.0 0.45 0.5 1.05 4.0 0.95 3.0 0.50 0.2May 0.40 1.3 0.55 0.8 1.45 1.8 0.50 0.7 0.60 0.1June 0.40 0.5 0.50 0.2 0.60 1.0 1.10 2.3 0.65 0.3July 2.00 1.5 1.35 1.3 0.55 0.2 0.60 0.2 1.35 5.3 2.15 11.0August 1.35 0.7 0.55 0.7 0.80 0.5 1.50 2.0 0.65 4.3 0.50 0.3September 0.50 0.2 1.20 1.0October 0.50 1.5 0.60 1.2November 1.65 8.5 0.60 1.5 0.40 0.2 0.95 5.0 1.15 3.1December 1.10 3.0 0.50 1.7 0.30 0.8 _________ 2.00 14.7 _________
1930
Inches
4.783.056.363.192.842.094.974.566.172.597.142.12
49.86
1931
Inches
2.913.382.974.952.820.574.636.370.480.951.508.54
40.07
1934
Inches
1.794.253.573.773.635.203.116.281.664.822.522.25
42.85
1935
Inches
1.823.907.173.853.003.785.486.012.441.492.86
46.61

12
Spermeability are influ-enced by the moisture
3 content of the soil pro-. file (11, 13). Moisture
.content also affects the20 dispersion or slaking of
the soil at the time rain-s '- ' fall occurs (16). In
' GFigure 4 is given a com-3n parison of the moisture
content of the surface2soil on a level plot with
that of a 20-per-cent-slope plot over a period
s 10 is 2o as o 5 o 4s of 45 days. The timeTime in Days and amount of rainfall
FIGURE 4.-Relationship between time and are also shown graphi-amount of rainfall and soil cally on the same figure.moisture content on differentslopes; . . 0% slope; The average moisture.-----.- 20% slope, contents of the surface
soil during the 45-dayperiod were 24.6, 23.1, 22.0, 21.2, and 21.0 per cent on the 0, 5,10, 15 and 20 per cent slopes, respectively. Moisture content wasconsistently lower as slope increased. This may be accountedfor by the fact that the rate of runoff increases with increasingslope. Thus for any given rain the time interval during whichthe absorption and infiltration processes could function decreasedwith increased slope. Other data relevant to absorption areshown in Table 4.
The moisture content of the soil profile exerts a pronouncedinfluence on the quantity of erosion losses from a given rain.The influence of soil moisture on erosion losses is revealed bythe following example. A one and one-half-inch artificial rainwas applied in 25 minutes to a 5-per-cent-slope plot when thesurface soil contained 10.8 per cent moisture. The runoff fromthe plot was 26 per cent and the soil eroded was 72 poundsper acre. On the same plot, when the surface soil was satu-rated, the runoff from an artificial rain of the same amountand rate was 69 per cent and the material eroded per acre was3,555 pounds.
Soil moisture content is sufficiently important to make ithighly desirable to duplicate artificial rainfall experiments atlow field moisture with runs immediately following when thesurface horizon is still saturated with water.
During the growing season of clean-cultivated crops and ofwinter cover crops, there are invariably one or more rains whichproduce extreme erosion losses. A large percentage of the sea-sonal losses result from such rains. Three rains were responsiblefor 89 to 100 per cent of the soil losses (depending upon slope)

TABLE 4.-Percentage Runoff from Cecil Clay with Variations of Slope, Vegetative Cover and Rainfall (Naturalrains - 1935).
Amount Duration Estimated Slope of land in per cent
of of coverage 0 5 10 15 20rainfall rainfall vetch F1 2 V1 F V F V F V F I V
Inches Hours Per cent Runoff in per cent of rainfall
0.83 7 4 2 4 37 35 40 34 45 37 43 36
1.28 13 7 1 10 48 50 49 44 50 42 46 420.81 2 10 3 9 62 64 56 49 44 48 52 501.65 14 35 1 3 59 39 51 19 35 21 59 213.93 18 50 25 24 75 63 76 62 80 65 90 561.64 2 75 57 39 87 83 87 75 87 76 89 691.08 1.3 100 37 4 86 6 88 20 95 18 97 24
IF = smooth fallow; V = vetch planted in 18-inch, contour rows.2Plot out of level, hence runoff values are abnormally low.

14
during the growing season of a crop of cotton. The three rainsaccounted for about 30 per cent of the seasonal rainfall. Thisprinciple is in agreement with the findings of Bartel (1).
Erosive rains of this type are usually characterized by highpercentages of runoff. Excessive runoff is caused by (a) thesoil profile being highly saturated with water and hence possess-ing a low rate of infiltration or by, (b) hard rain falling at anintensity that greatly exceeds the rate of infiltration. Excessivesoil losses sometimes occur when the amount of runoff is notextremely excessive. Such results have been found to occurfrom rains falling when the surface soil was extremely suscep-tible to erosion, i.e., a fine pulverized condition immediately fol-lowing cultivation or plowing. (See Tables 5 and 6.)
Influence of Intensity of Rainfall on Erosion.-Studies haveshown that the intensity of rainfall is more important than theamount of rainfall in determining the extent of erosion losses.This is shown by the following example. During February, whenthe plots were partially covered with a small growth of vetch,a 1.0-inch rain occurred over a period of 76 hours and the soillosses varied from zero on the level plots to 4 pounds per acre on
TABLE 5.-Runoff and Soil Losses from Different Amounts of Rainfallunder Saturated and Non-saturated Conditions on Fallow,
Plowed and Vetch Plots of Cecil Clay.
RainfallApplied in
inches
Duration ofrainfall in
minutes
Soilmoisture1
Surfaceconditions
Slope inper cent
1st.increment
1.25
11
F.M.
Freshlyplowed
2nd.increment
1.25
11
Sat'd
Freshlyplowed
1st. 2nd.increment increment
1.25
11
F.M.
Smoothfallow
1.25
11
Sat'd
Smoothfallow
Con- Con-
tinuous tinuous
2.50 2.50
22
F.M.
Smoothfallow
22
Sat'd
Maturevetch
Runoff in per cent of rainfall
0 0 34 27 52 58 405 0 66 70 58 84 51
10 4 62 79 86 87 5115 5 65 81 90 91 5320 10 72 81 86 97 59
Soil losses in pounds per acre
0 0 147 20 53 227 85 0 1,277 5,027 4,541 11,188 6
10 127 3,743 11,238 6,356 30,150 2615 217 19,402 18,778 9,287 34,384 4820 1,794 39,981 25,152 12,377 42,519 521
IF. M. = soil at low field moisture; Sat'd = surface soil saturated from 1st. increment ofrain or by rainfall immediately preceding the run. 2nd. increment applied immediately fol-lowing the 1st. increment.

15
the 20 per cent slope. About five days later a 1.1-inch inter-mittent rain fell in 6 hours. The losses varied from 113 poundsper acre on the level plots to 3,122 pounds on the 20 per centslope.
Excessive soil losses frequently occur before absorption issatisfied, provided the rate of rainfall exceeds the rate of infil-tration. When the plots were planted to cotton, an 0.83-inchrain occurred in 20 minutes. The soil losses varied from zeroon the level plot to 5,452 pounds on the 20 per cent slope. Latera 1.4-inch rain fell in 36 hours and the losses varied from zeroon the level plot to 114 pounds per acre on the 20 per centslope. These results are in accord with the findings at theStatesville Station (1). (See also Tables 7 and 8.)
A comparison was made of the erosion from two artificialrains of constant amounts applied at different rates when thesoil was broken five inches deep. In one case a 1.0-inch rainwas applied in 8 minutes and in the other case 1.0 inch of rainwas applied in 16 minutes. The moisture content of the soil atthe beginning of each test was the same. The erosion resultingfrom the first application of rain ranged from 636 pounds peracre on the level plot to 19,000 pounds on the 20 per cent slope.When one inch of rain was applied in 16 minutes, the soil losses
TABLE 6.-Soil and Water Losses from Cecil Clay withConditions of the Soil.
Different Surface
Soil condition
Freshlycultivated
Compact andcrusted
Freshlycultivated
Compact andcrusted
Freshlycultivated
Compact andcrusted
Freshlycultivated
Compact andcrusted
Freshlycultivated
Compact andcrusted
Soil moisture
Per cent
10
12
9
10
8
11
9
11
10
11
RunoffPer cent
13
37
52
60
62
67
64
70
72
Soil losses1
Pounds per acre
117
83
662
706
21,377
19,151
36,486
20,325
50,358
the sam2
18 minutes; cotton planted in 3-foot,
Slope of land
Per cent
0
5
10
15
20
iLosses from 2 inches of artificial rain applied incontour rows in all cases.2
Values not determined.
VIVI IVI LVIVML I r lLL AV
V
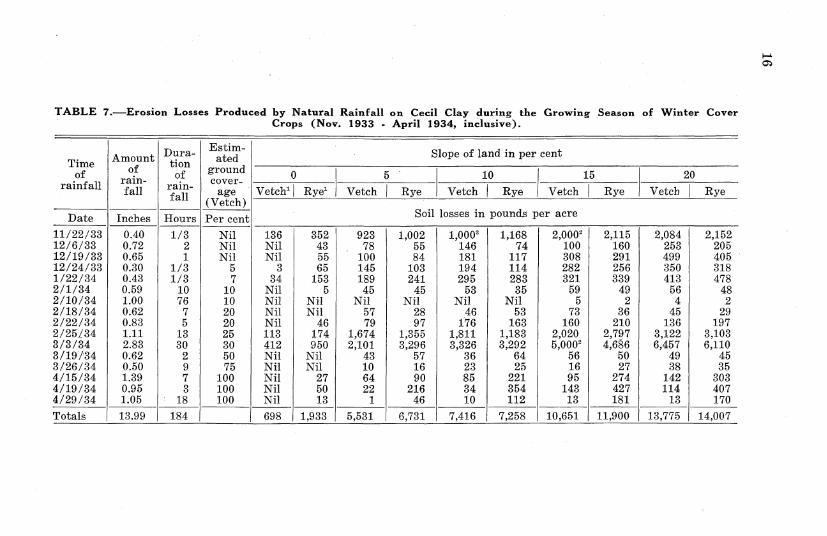
TABLE 7.-Erosion Losses Produ4
-Estim-Time Amount tion- ated
offgroundranal rfall- ran- cover-rain-
rainfall fall age________(Vetch )
Date Inches Hours Per cent
11/22/33 0.40 1/3 Nil12/6/33 0.72 2 Nil12/19/33 0.65 1 Nil12/24/33 0.30 1/3 51/22/34 0.43 1/3 72/1/34 0.59 10 102/10/34 1.00 76 102/18/34 0.62 7 202/22/34 0.83 5 202/25/34 1.11 13 253/3/34 2.83 30 303/19/34 0.62 2 503/26/34 0.50 9 754/15/34 1.39 7 1004/19/34 0.95 3 1004/29/34 1.05 18 100
Totals 13.99 184
ced by Natural Rainfall on Cecil Clay during the Growing Season of Winter CoverCrops (Nov. 1933 - April 1934, inclusive).
Slope of land in per cent
0 5 10 15 20
Vetch' Rye' Vetch I Rye Vetch Rye Vetch Rye Vetch Rye
Soil losses in pounds per acre
136 352 923 1,002 1,0002 1,168 2,0002 2,115 2,084 2,152Nil 43 78 55 146 74 100 160 253 205Nil 55 100 84 181 117 308 291 499 4053 65 145 103 194 114 282 256 350 318
34 153 189 241 295 283 321 339 413 478Nil 5 45 45 53 35 59 49 56 48Nil Nil Nil Nil Nil Nil 5 2 4 2Nil Nil 57 28 46 53 73 36 45 29Nil 46 79 97 176 163 160 210 136 197113 174 1,674 1,355 1,811 1,183 2,020 2,797 3,12.2 3,103412 950 2,101 3,296 3,326 3,292 5,0002 4,686 6,457 6,110Nil Nil 43 57 36 64 56 50 49 45Nil Nil 10 16 23 25 16 27 38 35Nil 27 64 90 85 221 95 274 142 303Nil 50 22 216 34 354 143 427 114 407Nil 13 1 46 10 112 13 181 13 170
698 1,933 5,531 6,731 7,416 7,258 10,651 11,900 13,775 14,007v- Ivv Ivv u II CIVV

TABLE 7.-Erosion Losses Produced by Natural Rainfall on Cecil Clay during the Growing Season of Winter CoverCrops (Nov. 1933 - April 1934, inclusive). (Continued).
Hours Per cent1/3 Nil
2 Nil1 Nil
1/3 51/3 7
10 1076 10
7 205 20
13 2530 30
2 509 757 1003 100
18 100
4275
4038
21269
102293
851,2103,598
2639
1565470
780272357496502
89113292234
1,9925,330
3849
2151,048
255
1,287331440721748400102568
1,4953,4457,120
32550
673635
69
Totals 113.99 1 0184 6,424 (12,0621-18,509
;I Runoff in cubic feet per acre
1,287 1,340378 531610 664644 730819 742378 430112 126500 610
1,861 1,6503,785 2,8007,760 6,120
440 20992 154
920 7201,786 684
839 18218,.211 20,872
1,152335638682633466109470
1,5752,8606,170
449181
1,8501,5751,055
1,482395994875889523165731
1,6222,7766,230
382148856
1,052174
1,293341802779683390119392
1,3342,7945,780
325229
2,0231,7321,023
1,398475
1,168892925616149673
1,4482,8055,725
318299
1,4721,512
341
1,320358881735712384131392
1,1302,7955,435
276283
2,2801,717
59~3120,200 119,394 120,139 120,216 119,425
Date11/22/3312/6/3312/19/3312/24/331/22/342/1/342/10/342/18/342/22/342/25/343/3/343/19/343/26/344/15/344/19/344/29/34
Inches0.400.720.650.300.430.591.000.620.831.112.830.620.501.390.951.05
'Vetch planted in 18-inch drill rows on contour; rye planted in 10-inch drill rows on contour; 20.0 inches total rainfall during the period.2Data incomplete; values estimated to ohtain seasonal totals.
1
-i
iii

TABLE 8.-Soil Losses and Runoff Resulting from Natural Rainfall on Cecil Clay during the Winter Season with andwithout Vetch as a Cover Crop (Nov. 1934-May 1935), Inclusive.
Timeof
rainf all
Date
11/21/3411/29/3412/19/3412/28/341/7/352/14/352/26/353/6/353/12/353/28/354/8/354/11/355/7/35
Totals
Amountof
rain-fall'
Inches
0.95_.0.630.831.280.812.851.653.931.641.251.471.081.63
20.00
Dura-tion
ofrain-fall
Hours
557
132721418231/2
1 /7
14
164
Slope of land in per cent
0 5 10_15_20
FallowI Vetch2 Fallow I Vetch Fallow j Vetch Fallow Vetch Fallow Vetch
Soil losses in pounds per acre
Estim-ated
groundcover--
age(Vetch)
Per cent
2346
10303750657590
100100
242207
92237373
4,7821,5338,2476,5291,478Nil981
2.863
27,564
357197129280509
1,32196
62023724
Nil2
12
3,784
Date Inches Hours Per cent Runoff
11/21/34 0.95 5 2 Nil 765 2,220 2,68311/29/34 0.63 5 3 63 574 1,478 1,55212/19/34 0.83 7 4 73 113 1,096 1,039
12/28/34 1.28 13 6 26 458 2,251 2,3241/7/35 0.81 2 10 76 273 1,831 1,877
2/14/35 2.85 72 30 825 1,625 4,610 3,7402/26/35 1.65 14 37 76 169 3,554 2,332
3/6/35 3.93 18 50 3,550 3,380 10,755 8,915 1
3/12/35 1.64 2 65 3,410 2,330 5,180 4,9603/28/35 1.25 3'/2 75 95 58 2,363 954/8/35 0.47 112 90 Nil Nil Nil Nil4/11/35 1.08 7 100 1,452 156 3,359 2565/7/35 1.63 14 100 412 200 4,490 328
Totals 20.00 164 _ 10,058 10,101 43,187 30,101 4
'Total rainfall for period = 24.5 inches; 20.0 inches as rainfall producing runoff.2Vetch planted in 18-inch drill rows on contour.
327445192413436
21,5344,185
26,35417,5985,7501,3144,2947,376
90,218
465522180529934
2,52954
843265
23Nil
3315
6,392
355509280922863
35,0075,184
42,91525,261
6,6862,4116,7328,054
135,179
in cubic feet per acre
2,8721,3951,1952,29 71,6434,4403,0640,8605,2252,253
1513,4644,217
[3,076
2,5521,5001,0122,0371,4352,9401,1208,8504,500425
Nil772700
27,843
2,3541,5111,3372,3101,2854,8052,098
11,3355,2152,318
6583,7154,261
43,202
884. 448242728676
7,156992
2,574986
28Nil
3320
14,767
2,5871,5831,1231,9641,4143,1401,2849,2204,530
35226722810
28,755
13 8111 58
Nil Nil12 3748 87
106 24714 20167 139369 84
53 11Nil Nil117 117 8
927 773
946694295
1,3201,158
56,1606,682
54,23331,090
8,4563,4878,4759,666
182,662
2,4011,5671,3052,1411,5184,5303,554
12,8755,3402,022757
3,8214,255
46,086
1,844868322641
1,1167,3061,0464,5271,772
106Nil107
20
19,675
2,6101,2971,0701,9381,4652,7351,2848,0654,150718
52939862
27,185
Iiv
,,,,\ I I I A 7) I I~~I ~ I I Ll-/ II II IIIii
- - I -- -

19
varied from 336 pounds per acre on the level plot to 7,520 poundsper acre on the 20 per cent slope. In the above case it is evidentthat the rate of rainfall rather than the amount is the influencingfactor which determines the quantity of losses.
Numerous other examples showing the effect of the rate ofrainfall on erosion may be cited from the erosion experiments.For example, two similar natural rains occurred when the plotscontained a small growth of vetch two inches in height in 18-inch contour rows. The first rain of 0.83 of an inch was dis-tributed over a period of 7 hours; soil losses ranged from zeroon the level plot to 322 pounds per acre on 20 per cent slope.Nineteen days later an 0.81-inch rain fell in 2 hours. Soil lossesvaried from 87 pounds per acre on the level plot to 1,116 poundsper acre on the 20 per cent slope. Similar results were obtainedon compact fallow during natural rains. Detailed data may befound in Table 8.
When the quantity of rainfall is constant, the rate of rainfallis the factor which determines the extent of erosion losses pro-vided other conditions are comparable.
Influence of Quantity of Rainfall on Erosion.-With a givenintensity of rainfall, the quantity of rain has a marked influenceon erosion. In Figure 5 is given a comparison of the losses froma 0.74-inch rain which fell in approximately four hours withthose from a 1.60-inch rain which fell uniformly throughout aten-hour period. The rates were approximately the same but theduration of the first was about one-half that of the second. Inthe case of the 0.74-inch rain, the amount of eroded materialvaried from 30 pounds per acre on the level plot to 765 poundson the plot having a 20 per cent slope. With a rainfall of 1.60inches, the eroded material increased from 706 pounds per acreon the level plot to 8,720 pounds on the 20 per cent slope. Thegreater part of the 0.74-inch rain was consumed in saturatingthe soil. This accounts for the small amount of runoff anderoded material. In the case of the 1.60-inch rain, approximatesaturation was reached and consequently a greater quantity ofrunoff and erosion occurred during the latter part of the rain.This principle has been repeatedly verified under numerousnatural and artificial rainfall conditions.
Continuity or duration without intermission of rain is ofvital importance in erosion control and is so closely related tointensity and quantity of rainfall that it will be discussed in briefat this point. The greater the duration of a rain of a given in-tensity the greater the soil and water losses. During the fallof 1934 when alternate plots were in smooth fallow, an0.83-inch rain occurred in 7 hours. Several days later a1.65-inch rain occurred in 14 hours. The amount of thesecond rain was approximately twice that of the first butthe intensity was the same. The losses from the latter were

20
about 20 times as greatas those from the form-er.
It was found thatwith the same amountof rainfall erosion losseswere greater whenthere were no breaks inthe rainfall than whenthere were breaks orshort lapses during theperiod of rainfall. Thisis clearly shown in Fig-ure 6. The same prin-ciple is likewise sub-stantiated by data re-ported in Table 5. Two1.25-inch increments ofartificial rain were ap-plied during a period of11 minutes per incre-ment, with a slight in-terval between the twoapplications. The soillosses from the last rainwere greater than thosefrom the first. Later,when the soil condi-tions were comparable,2.50 inches of rain wereapplied in 22 minuteswithout interrup-tion. This was twicethe amount of rain ap-plied at the same rate.The losses from the2.50-inch rain were con-siderably greater thanthe combined lossesfrom the two 1.25-inchincrements.
5 10 15 20Slope of Land in Percent
FIGURE 5.-Comparison of the amounts ofsoil eroded from various slopesby different quantities of rainfalling at comparable intensi-ties.
h
a
nti
c
c
a
J'OZ
0
0/0
eLrjliV)
2 4 6 8 /0 12 /4 16Duration of Rainfall in Hours
prn
- s -
s 5in 14 hours
5 J 5 I0
5 1 15 zo
Slope of Land in Percent
FIGURE 6.-Comparison of the amounts ofsoil eroded from differentslones. by continuous and in-
Influence of Pulveri- termittent rains of comparablezation, Structure and quantities.Shape of Surface onErosion.-Runoff and erosion are greatly affected by the shapeof surface and state of pulverization of the soil. Soil andwater losses from freshly plowed and from firm fallow' plots
'The term '"'fallow" is used herein to describe a practice by which the soil was kept smooth,compact and free of weeds; weeds were removed by hoeing them off at the ground surface.

21
are shown in Table 5. In the case of the first 1.25-inch rainwhich was added when the surface soil moisture was low, thegreatest losses in all instances occurred from the fallow plots.The rate of absorption was extremely high on the plowed soil ascompared with that on fallow, hence runoff and soil losses fromthe plowed areas were extremely small.
A second 1.25-inch rain was applied within a few minutesafter the completion of the first application. The surface hori-zon of the soil was still approximately saturated with water.Soil losses from the second increment of rainfall were appre-ciably less on fallow than those from the first increment eventhough runoff from the second rain was greater than that fromthe first rain. This may be attributed to the fact that the firstrain slaked a thin layer of soil loose from the surface of thefallow plots; such material was quickly eroded from the steeperslopes and left the soil in a relatively non-erodible condition.The second 1.25-inch of rainfall on the plowed plots causederosion losses many times greater than those produced by thefirst rain; runoff was likewise greatly increased.
A comparison of losses from fallow and plowed land duringthe second increment of rainfall shows that the soil losses fromthe plowed areas on steep slopes were markedly greater thanthose from fallow even though runoff was greater from thelatter. This was not true on the more gentle slopes. The ap-parent inconsistency may have been due to the fact that thefirst rain did not nearly satisfy absorption on the plowed plotsor to a failure of this first increment of rainfall to wash off allof the loose soil from the fallow plots.
To determine the effect of cultivation on erosion losses whileall plots were in cotton, they were given a 2-inch artificial rainin 18 minutes when the soil was compact and crusted from pre-vious rainfall. The plots were allowed to dry until the moisturewas the same as in the first case after which a shallow culti-vation followed. Two inches of rain were again applied in 18minutes. With the exception of the 5-per-cent-slope plots, soillosses were greater when the plots were freshly cultivated thanthey were when compact and crusted; the differences were mostpronounced on the steeper slopes. (See Table 6.) The increasedlosses on the freshly cultivated plots were caused by absorptionbeing exceeded when the soil was in a very erodible condition.
The influence of cloddy structure and ridged effect is againbrought out quite vividly in Table 9. These data are from inter-planted corn and velvet beans and from firm fallow. Numerousclods were present in the cultivated area and the corn wasplanted flat, but as cultivation progressed ridges were graduallydeveloped and were quite pronounced by the time of the lastcultivation.
Increased obstruction due to clods and ridges increased theamount of absorption and decreased the runoff velocity. Pro-

TABLE 9.-Soil Losses and Runoff Resulting from Natural Rainfall during the Growing Season of an Interplanted Cropof Corn and Velvet Beans Compared to Smooth Fallow on Different Slopes.
Timeof
rainf all
Amountof
rain-fall'
Date Inches
6/5/35 1.326/22/35 .956/29/35 .657/6/35 1.407/11/35 1.157/13/35 1.507/16/35 1.458/6/35 1.018/11/35 .758/15/35 1.208/20/35 2.00
Totals 13.39
Dura-tionof
rain-fall
Hours
64
4831/2
34
412
312
'/2
4836
155
Slope of land in per cent
0 5 10 15 20
F' C. B.' F I C. B. F C. B. F I C. B. F C. B.
Soil losses in pounds per acre
Estim-ated
groundcover-age onC. B.plots
Per cent
58
101520254075858585
10200
230
11000000
235
5,2391,760
5314,3183,7377,0752,378
350'1503522
3,071
29,131
13612
0350300930254272
883538
3,403
7,9105,1691,5577,7058,744
11,5556,449
10,8326,2302,7224,911
73,784
63257
0684431
4,5102.9812,898
70848
198
13,147
7,8935,0471,141
12,94511,23116,868
7,34414,2916,9912,4955,827
92,073
561143
02,914
8713,720
7,1907,0742,235
758240
34,922
10,5086,7931,678
14,51212,39121,45010,71419,703
8,1813,3938,874
118,197
.576380
03,997
24816,3507,174
10,5841,721
713595
43.228Date Inches Hours Per cent Runoff in cubic feet per acre
6/5/35 1.32 6 5 1,688 162 4,620 148 4,431 1,030 3,814 598 4,516 4416/22/35 .95 4 8 777 0 2,480 0 2,442 98 2,559 574 2,400 2606/29/35 .65 48 10 0 0 1,005 0 1,130 0 1,090 0 1,267 07/6/35 1.40 312 15 472 147 3455 760 3,422 1,595 3,241 1,654 3,534 1,6537/11/35 1.15 4/4 20 1,020 0 3,325 0 3,162 185 3,174 321 3,375 3487/13/35 1.50 41/2 25 1,727 202 4,081 2,432 4,078 2,486 3,985 2,648 3,978 2,4917/16/35 1.45 3 40 14 0 2,840 1,735 2,810 1,945 2,400 2,160 2.818 2,1108/6/35 1.01 12 75 1,940 2,765 3,000' 2,225 3,5003 1,912 3,415 2,700 3,5003 2,5208/11/35 .75 1/2 85 0 0 1,0003 507 1,786 612 1,380 905 1,662 7748/15/35 1.20 48 85 0 0 2,347 670 1,975 43 1,386 937 2,033 9638/20/35 2.00 36 85 789 317 5,162 841 4,756 1,653 4,297 2.070 4,862 1,839
Totals 13.39 155 8,427 3,593 33,315 1 9,318 33,492 11,559 30,741 14,567 33,945 13,3994-foot, contour rows which were converted'F= smooth, compact fallow; C. B. - corn and velvet beans interplanted at 18-inch intervals in
through cultivation into rough or cloddy contour beds.'1.45-inch erosive rain falling in 25 hours not reported.'Data incomplete; values estimated to obtain seasonal totals.
I I I122
790
4540
1980
12100
69
674

23
vided that the saturation capacity was not exceeded under suchconditions, the erosion losses were decreased. When the soilwas ridged and the intensity of the rain exceeded the rate ofabsorption to a point where the water "over-topped" the ridges,the soil losses were much greater than those on non-ridgedsoil. These extreme losses were probably due to a hydraulichead being released when the holding capacity of the ridges wasexceeded. Under such conditions runoff started quicker on thenon-ridged soil but was gradual throughout the duration of therain. This resulted in less erosion on the smooth soil. The re-verse was true when the capacity of the ridges was not exceeded.
From the above experiments and others, it was concludedthat tillage practices are effective in controlling erosion untilthe rate and amount of absorption is exceeded. After thesehave been exceeded, greater losses will occur on freshly plowedsoil than on firm soil.
The Physical Nature of Erosion Losses and Certain FactorsAffecting the Nature of Erosion Losses.-Several basic facts con-cerning the sheet erosion process have been revealed by a de-tailed study of the physical nature of the soil material erodedfrom the controlled plots of Cecil clay located on the severalslopes. The size distribution of water stable aggregates wasdetermined on representative samples of the soil material erodedfrom plots under a wide range of soil conditions and vegetativecoverage. The wet screening or sieve method of aggregateanalysis developed by Yoder (16) was employed.
Typical results of this phase of the work are summarizedin Tables 10 to 13 inclusive. In all cases, the mechanical anal-ysis of the soil is given along with the aggregate analyses of theeroded materials. The latter determinations were made on thewet samples immediately following the completion of the rainin question. The aggregate losses are expressed in percentageof total soil losses and also in pounds per acre in order to facil-itate study of these data. Runoff data are likewise included.
A comparison of the mechanical analysis of the soil and theaggregate analyses of eroded materials shows that the unit par-ticles primarily involved in the erosion process, in the case ofstructural soils, are aggregates (compound particles) ratherthan textural separates (sands, silt and clay). Undue emphasishas been given the frequently encountered statement that sheeterosion losses are particularly detrimental because excessiveamounts of the most valuable part of the soil--the colloidalfraction-are lost during the process. As a general statement,the above is not true.
From the results reported in Tables 10, 11, and 12, it maybe seen that hundreds of pounds of aggregates or compoundparticles having diameters greater than those of coarse sandsare frequently eroded from all unprotected (fallow) slopesduring natural rains. This fact alone is sufficient reason for

TABLE 10.-Physical Nature of Erosion Losses from Cecil Clay when Fallow and when Protected by Vetch at 30 percent Ground Coverage.
Mechanical Aggregateanalysis size Slope of land in per cent
of soil class of 0 5 10 15 20(Textural eroded
separates) sediments FallowVetch Fallow Vetch Fallow Vetch Fallow I Vetch
m. m. Per cent m. m. Aggregate losses in per cent of total soil losses 2
>2.0 0.4 0.2 12.9 2.5 9.7 3.6 12.2 5.9 12.5 6.32.0 -1.0 0.9 2.0 -1.0 0.8 0.9 16.5 3.9 11.7 3.7 13.3 8.6 15.9 9.31.0 -0.5 2.4 1.0 -0.5 3.7 2.1 13.9 6.9 18.4 8.6 13.0 10.1 14.8 12.90.5 -0.25 5.4 0.5 -0.25 4.8 2.2 9.4 5.7 15.4 8.0 13.8 8.2 12.7 12.90.25-0.10 13.4 0.25-0.10 8.1 5.2 8.7 6.9 14.4 9.6 15.0 8.8 13.8 15.10.10-0.05 9.2 0.10-0.05 12.8 6.2 7.9 5.9 14.4 7.8 14.2 9.8 13.9 15.9
<0.05 68.7 <0.05 69.4 83.2 30.7 68.2 16.0 58.7 18.5 48.6 16.4 27.60.05-0.005 16.3
<0.005 52.4 Total 100 100 100 100 100 100 100 100 100 100
Aggregate losses in pounds per acre2
>2.0 0.4 0.5 617 33 2,088 91 4,270 422 7,020 4602.0 -1.0 0.8 2.2 779 52 2,520 94 4,655 615 8,930 6781.0 -0.5 3.9 5.2 665 91 3.964 217 4,550 723 8,315 9420.5 -0.25 5.1 5.4 449 75 3,316 202 4,830 587 7,135 9420.25-0.10 8.6 12.7 416 91 3,100 243 5,250 630 7,750 1,1040.10-0.05 13.6 15.3 378 78 3,100 197 4,970 701 7,810 1.162
< 0.05 73.5 205.4 1,468 901 3,446 1,485 6,482 3,478 9.210 2,018Total soil losses in lbs./acre 106 247 4,782 1,321 21,534 2,529 35,007 7,156 56,160 7,306Runoff in cu. ft./acre 825 1,625 4,610 3,740 4,440 2,940 4,805 3,140 4,530 2,735
'Vetch planted in 18-inch drill rows on the contour.2Losses from a 2.85-inch natural rain; 1.5 inches of rain falling in 2 hours producing most of the erosion losses.

TABLE 11.-Physical Nature of Erosion Losses from Cecil Clay when Fallow and when Protected by Vetch at 75 percent Ground Coverage.
Mechanial Aggregate Slope of land in per centanalysis size class
(Tx al of eroded 0 5 10 15 20
separates) sediments Fallow Vetch1 Fallow Vetch Fallow Vetch Fallow Vetch Fallow Vetch
m. m. Per cent m. m. Aggregate losses in per cent of total soil losses2
>2.0 2.2 0.7 4.2 1.3 6.6 2.2 7.7 2.6 10.5 3.82.0 -1.0 0.9 2.0 -1.0 2.3 1.3 8.3 1.2 9.5 2.2 11.9 4.9 12.9 5.71.0 -0.5 2.4 1.0 -0.5 3.0 1.9 11.2 2.2 13.3 4.2 16.0 5.3 13.4 7.30.5 -0.25 5.4 0.5 -0.25 3.3 3.5 14.5 3.2 14.9 3.5 15.6 5.3 13.7 8.50.25-0.10 13.4 0.25-0.10 8.2 4.3 16.4 5.9 23.6 6.0 16.0 12.4 14.2 12.80.10-0.05 9.2 0.10-0.05 5.1 7.5 8.5 3.2 13.3 5.7 14.7 10.4 16.6 11.6
<0.05 68.7 <0.05 75.9 80.8 36.9 83.0 18.8 76.3 18.1 59.1 18.8 50.30.05-0.005 16.3
<0.005 52.4 Totals 100 100 100 100 100 100 100 100 100 100
Aggregate losses in pounds per acre2
>2.0 8.2 0.6 274 3.2 1,172 5.9 1,942 26 3,252 672.0 -1.0 8.6 1.1 542 2.8 1,672 5.8 3,017 48 4,014 1011.0 -0.5 11.1 1.6 732 5.3 2,334 11.2 4,039 52 4,172 1300.5 -0.25 12.1 2.9 947 7.5 2,627 9.2 3,943 52 4,244 1500.25-0.10 30.1 3.6 1,071 14.0 4,152 15.8 4,036 123 4,421 2260.10-0.05 18.8 6.4 554 7.5 2,340 15.1 3,714 103 5,147 206
<0.05 279.9 67.9 2,409 196.8 3,301 202.4 4,570 582 5,840 892
Total soil losses in lbs./acre 369 84 6,529 237 17,598 265 25,261 986 31,090 1,772
Runoff in cu. ft./acre 3,410 2,330 5,180 4,960 5,225 4,500 5,215 4,530 5,340 4,150'Vetch planted in 18-inch drill rows on the contour.2Losses from 1.64-inch natural rain falling in less than 2 hours.

TABLE 12.-Physical Nature of Erosion Losses from Cecil Clay when Fallow and when Protected by Vetch at CompleteGround Coverage.
Mechanical Aggregateanalysis size Slope of land in per cent
of soil class of 0 5 10 15 20(Textural eroded
separates) sediments Fallow Vetch 1 Fallow Vetch Fallow Vetch Fallow Vetch Fallow Vetch
m. m. Per cent m. m. Aggregate losses in per cent of total soil losses 2
>2.0 3.1 Nil 3.0 Nil 10.4 1.1 6.7 1.5 4.5 1.62.0 -1.0 0.9 2.0 -1.0 4.0 Nil 4.3 Nil 11.1 2.7 9.3 3.9 8.4 3.51.0 -0.5 2.4 1.0 -0.5 7.5 Nil 18.0 Nil 16.3 5.0 15.8 6.0 14.0 8.50.5 -0.25 5.4 0.5 -0.25 6.6 Nil 19.1 Nil 14.3 4.2 16.4 5.6 14.2 12.70.25-0.10 13.4 0.25-0.10 19.8 Nil 16.3 Nil 18.0 10.3 19.4 9.7 24.1 11.40.10-0.05 9.2 0.10-0.05 14.1 Nil 13.0 Nil 11.2 6.9 10.4 7.7 12.7 8.8
<0.05 68.7 <0.05 44.9 100.0 26.3 100.0 18.7 69.8 22.0 65.6 22.1 53.50.05-0.005 16.3
<0.005 52.4 Totals 100 100 100 100 100 100 100 100 100 100
Aggregate losses in pounds per acre2
>2.0 7 Nil 331 Nil 3,134 0.3 2,336 0.7 1,925 8.12.0 -1.0 9 Nil 485 Nil 3,350 0.7 3,181 1.9 3,586 18.31.0 -0.5 17 Nil 2,009 Nil 4,915 1.3 5,421 2.9 5,933 44.40.5 -0.25 15 Nil 2,139 Nil 4,303 1.1 5,652 2,7 6,009 66.40.25-0.10 45 Nil 1,828 Nil 5,431 2.7 6,677 4.7 10,248 59.60.10-0.05 32 Nil 1,455 Nil 3,372 1.8 3,576 3.7 5,419 45.6
<0.05 102 8.1 2,941 6.4 5,645 18.2 7,641 31.6 9,399 279.0
Total soil losses in lbs./acre 227 8 11,181 6 30,150 26 34,384 48 42,519 521
Runoff in cu. ft./acre 5,260 3,610 7,600 4,660 7,870 4,610 8,260 4,830 8,770 5,3201Vetch planted in 18-inch drill rows on the contour.2Losses from 2.50 inches of artificial rainfall applied in 22 minutes when surface soil was at low field moisture.

27
concluding that the sheet erosion process, when uncontrolled,bodily removes the top-most part of the soil profile layer bylayer. In addition, field observations also indicate that if theprocess is not controlled, the surface horizon of the soil is finallywashed away. If any part of the surface material is left be-hind, it is only a gravel or rock blanket.
However, there are certain conditions under which the rela-tive loss of colloidal material may be excessive. The relativeloss of colloidal material may be excessive during (a) erosionfrom soil protected by considerable vegetation (land planted insoil conserving crops), (b) erosion produced by soil conditionsresulting in small amounts of runoff, (c) erosion from flat landand possibly from extremely gentle slopes, and (d) erosion pro-duced by intermittent small showers of rain falling at slow rates.
The above conditions are all characterized by small quanti-ties of runoff or by runoff of low forward moving velocity or byboth. Ample supporting data for the first three conditions maybe found in Tables 12, 13, and 14. The resulting effects of thelast mentioned condition have been repeatedly measured on thecontrolled plots. In brief, the relative amount of colloidal ma-terial lost is excessive only when the sheet erosion process is con-trolled, in a practical sense, or when the total quantity of soillost is almost negligible.
The above conclusions have the additional support of fieldobservations. In the Southeast, the only conditions under whichsandy surface horizons have developed on soil profiles havinglarge clay contents are where topography is flat or where athick, permanent, vegetative coverage has been allowed to per-sist on gentle slopes.
During the course of the experiments, considerable informa-tion has been obtained concerning the basic principles involvedin the use of vegetation to control sheet erosion. Aggregateanalyses of eroded materials served as a basis for the analysisof the problem. It has been found that cover crops function inreducing sheet erosion losses by (a) filtering out the larger waterstable aggregates, (b) decreasing the quantity of runoff, (c)decreasing the velocity of runoff, (d) minimizing the turbulenceof runoff and hence lessening the abrasive or dispersive actionof sediment loaded water, and (e) minimizing the mechanicaldispersive action of beating rainfall.
From a study of the data presented in Tables 10, 11, and 12,which permits a comparison of the nature of the materials erodedfrom fallow plots and from plots protected by vetch at differentstages of growth, it may be seen that in every case the plantsfunctioned by filtering out large quantities of the coarser aggre-gates. As the growth of the plants and hence the extent ofground coverage increased, the efficiency of the process in-creased. It was not uncommon to find two to three inches ofsoil piled above the upper side of contour rows of vetch which

TABLE 13.-Physical Nature of Erosion Losses from Cecil Clay under Different Strip Cropping Practices.
Mechanical Aggregate Slope width of Strip2
analysis size 12.5 ft. plowed 25 ft. plowed 37.5 ft. plowed 50 ft. plowed 50 ft. fallow(Tof soil class of d 37.5 ft. vetch 25 ft. vetch 12.5 ft. vetch No vetch No Vetch(Textural eroded
separates) sediments F. M. Sat'd F. M. Sat'd F. M. ISat'd F. M. Sat'd F. M. Sat'd
m. m. Per cent m. m. Aggregate losses in per cent of total soil losses on 5 percent slope
>2.0 Nil Nil Nil 0.2 Nil 0.1 Nil 0.4 2.1 2.62.0 -1.0 1.2 2.0 -1.0 Nil Nil Nil 0.2 Nil 0.1 Nil 0.8 2.4 5.91.0 -0.5 2.9 1.0 -0.5 Nil Nil Nil 0.4 Nil 0.1 Nil 1.7 9.2 15.30.5 -0.25 6.4 0.5 -0.25 Nil Nil Nil 0.3 Nil 0.1 Nil 2.1 12.5 11.10.25-0.10 13.0 0.25-0.10 Nil Nil Nil 0.8 Nil 0.2 Nil 3.3 23.9 19.10.10-0.05 8.5 0.10-0.05 Nil Nil Nil 0.4 Nil 0.3 Nil 3.3 16.1 13.8
<0.05 68.0 <0.05 100.0 100.0 100.0 97.7 100.0 99.3 Nil 88.4 34.0 32.20.05-0.005 15.9
<0.005 52.1 Totals 100 100 100 100 100 100 100 100 100 100
Aggregate losses in pounds per acre on 5 per cent slope
>2.0 Nil Nil Nil 0.3 Nil 0.1 Nil 5 105 1182.0 -1.0 Nil Nil Nil 0.4 Nil 0.1 Nil 10 121 2681.0 -0.5 Nil Nil Nil 0.7 Nil 0.2 Nil 22 463 6960.5 -0.25 Nil Nil Nil 0.6 Nil 0.2 Nil 27 617 5040.25-0.10 Nil Nil Nil 1.6 Nil 0.6 Nil 43 1,202 8690.10-0.05 Nil Nil Nil 0.6 Nil 0.8 Nil 42 810 626
<0.05 12.4 63.8 37.8 172.7 31.3 291.1 Nil 1,128 1,709 1,460
Total soil losses in lbs./acre 12 64 38 177 31 293 Nil 1,277 5,027 4,541
Runoff in cu. ft./acre 960 2,870 1,071 2,839 419 3,358 Nil 3,002 3.195 3,875

TABLE 13.-Physical Nature of Erosion Losses from Cecil Clay under Different Strip Cropping Practices1 . (Continued)
m. m.
2.0 -1.01.0 -0.50.5 -0.250.25-0.100.10-0.05
<0.05 .0.05-0.005
<0.005
Per cent
0.82.45.3
13.59.7
68.316.951.4
m. m.
>2.02.0 -1.01.0 -0.50.5 -0.250.25-0.100.10-0.05
<0.05
Totals
>2.02.0 -1.01.0 -0.50.5 -0.250.25-0.100.10-0.05
<0.05
Total soil losses in lbs./acre
Runoff in cu. ft./acre
NilNilNilNilNilNil
100.0
100
NilNilNilNilNilNil14.2
14
1,535
Aggregate losses in per cent of total soil losses on 10 per cent slope
0.3 Nil 0.1 0.1 0.1 1.3 4.4 2.80.7 Nil 0.1 0.2 0.1 1.3 8.1 6.41.2 Nil 0.3 0.7 0.2 3.9 10.2 17.21.1 Nil 0.6 0.9 0.2 3.2 7.3 12.62.2 Nil 0.6 1.4 0.4 11.5 7.3 23.71.4 Nil 0.5 2.0 1.7 13.5 8.0 9.5
93.1 100.0 97.8 94.7 97.3 65.3 54.7 27.8
100 100 100 100 100 100 100 100
0.20.50.80.71.50.9
61.9
67
3,190
ggregate losses in pounds per acre on 10 per cent slope
Nil 0.4 0.1 0.3 1.6 164Nil 0.4 0.2 0.5 1.7 302Nil 0.9 0.8 0.7 4.9 381Nil 1.5 1.1 0.9 4.1 277Nil 1.6 1.6 1.5 14.6 272Nil 1.2 2.3 6.4 17.2 29827.8 249.4 111.1 366.8 83.1 2,050
28 255 117 377 127 3,743
664 3,110 854 3,410 180 2,811
313724
1,9301,4112,6621,0713,127
11,238
3,572
4.07.0
18.413.718.410.228.3
100
252444
1,173873
1,167646
1,801
6,356
3,8991Losses from 1.25 inches artificial rainfall in 11 minutes with vetch at full ground coverage in all cases.
2Slope width of all plots - 50 feet; strip crop below plowed area; plowing done day previous to test in all cases; F. M. -= soil at low field
moisture; Sat'd. = surface soil saturated from first 1.25-inch rain as second 1.25-inch was applied immediately after the first run in each case.
u v --r v I v v I u v
-°Ii

w
TABLE 13.-Physical Nature of Erosion Losses from Cecil Clay under Different Strip Cropping Practices. (Continued)
Mechanical Aggregateanalysis size
of soil class of(Textural erodedseparates) sediments
m. m. Per cent m. m.
>2.02.0 -1.0 0.9 2.0 -1.01.0 -0.5 2.4 1.0 -0.50.5 -0.25 5.0 0.5 -0.250.25-0.10 13.8 0.25-0.100.10-0.05 9.4 0.10-0.05
<0.05 68.5 <0.050.05-0.005 16.2
<0.005 52.3 Totals
Slope width of strip'12.5 ft. plowed 25 ft. plowed 37.5 ft. plowed 50 ft. plowed 50 ft. fallow37.5 ft. vetch 25 ft. vetch 12.5 ft. vetch No vetch No vetch
F. M. Sat'd F. M. J Sat'd F. M. I Sat'd F. M.I Sat'd F. M J Sat'd
_______ - Aggregate losses in per cent of total soil losses on 15 per cent slope ____
1.52.03.57.99.95.4
69.8
100
0.50.72.12.23.32.8
88.4
100
NilNilNilNilNilNil100
0.10.20.30.20.60.5
98.1
100 100o
0.40.30.70.71.92.4
93.6
100
0.10.10.10.40.62.5
96.3
100
3.84.85.87.0
10.118.649.9
100
8.711.614.313.0
8.712.930.8
100
3.83.4
11.713.120.115.032.9
100
4.87.0
15.513.414.111.134.1
1100_Aggregate losses in pounds per acre on 15 per centslope_>2.0 0.3 0.6 Nil 0.3 0.5 0.6 8.3 1,694 710 442
2.0 -1.0 0.4 0.9 Nil 0.7 0.4 0.7 10.3 2,253 640 6521.0 -0.5 0.7 2.7 Nil 1.1 1.0 0.9 12.6 2,783 2,190 1,4380.5 -0.25 1.6 2.8 Nil 0.9 1.0 2.7 15.1 2,520 2,465 1,2420.25-0.10 2.0 4.2 Nil 2.4 2.7 3.7 21.9 1,678 3,770 13100.10-0.05 1.1 3.6 Nil 1.9 3.4 15.6 40.3 2,502 2,827 1,032
<0.05 14.1 113.1 29.0 411.6 133.3 608.2 108.2 5,972 6,176 3,171
Total soil losses in lbs./acre 20 128 29 419 142 632 217 -19,402 18,778 9,287
Runoff in cu. ft./acreL 1,540 3,500 857 3,359 967 3,468 240 2,951 3,691 4,097

TABLE 13.-Physical Nature of Erosion Losses from Cecil Clay under Different Strip Cropping Practices1 . (Continued)
m. m. Per cent m. m. Aggregate losses in per cent of total soil losses on 20 per cent slope
>2.0 1.1 1.8 0.3 0.2 0.2 0.1 1.9 7.7 8.6 6.82.0 -1.0 0.8 2.0 -1.0 1.6 2.4 0.4 0.4 0.2 0.2 2.0 10.6 13.4 7.81.0 -0.5 2.4 1.0 -0.5 4.9 5.3 1.2 1.2 0.6 0.4 5.9 14.2 15.9 12.00.5 -0.25 5.5 0.5 -0.25 3.5 5.7 1.4 0.8 1.2 0.8 4.8 12.1 11.7 13.30.25-0.10 13.7 0.25-0.10 15.2 9.2 1.8 2.7 2.2 1.9 17.2 17.7 13.0 11.80.10-0.05 9.1 0.10-0.05 11.4 6.4 2.9 2.3 3.6 4.9 20.2 13.8 11.1 10.1
<0.05 68.5 <0.05 62.3 69.2 92.0 92.4 90.0 91.7 48.0 23.9 26.3 38.20.05-0.005 16.1
<0.005 52.4 Totals 100 100 100 100 100 100 100 100 100 100
Aggregate losses in pounds per acre on 20 per cent slope
>2.0 0.4 3.2 0.5 1.5 0.4 1.9 34 3,080 2,154 8412.0 -1.0 0.6 4.4 0.7 2.5 0.4 2.9 36 4,245 3,372 9591.0 -0.5 1.8 9.6 1.9 7.3 1.4 5.4 105 5,680 3,990 1,4880.5 -0.25 1.3 10.4 2.2 5.0 2.8 11.3 87 4,825 2,933 1,6480.25-0.10 5.6 16.6 2.8 17.1 5.2 25.8 308 7,080 3,271 1,4550.10-0.05 4.2 11.5 4.6 14.2 8.4 66.6 362 5,510 2,794 1,253
<0.05 22.9 125.4 143.7 577.4 212.1 1,249.2 862 9,560 6,638 4,733
Total soil losses in lbs./acre 37 181 156 625 231 1,363 1,794 39,980 25,152 12,377
Runoff in cu. ft./acre 1,295 3,360 1,129 2,924 885 3,115 450 3,495 3,684 3,9021Losses from 1.25 inches artificial rainfall in 11 minutes with vetch at full ground coverage in all cases.2Slope width of all plots - 50 feet; strip crop below plowed area; plowing done day previous to test in all cases; F. M. - soil at low field
moisture; Sat'd. - surface soil saturated from first 1.25-inch rain as second 1.25-inch was applied immediately after the first run in each case.
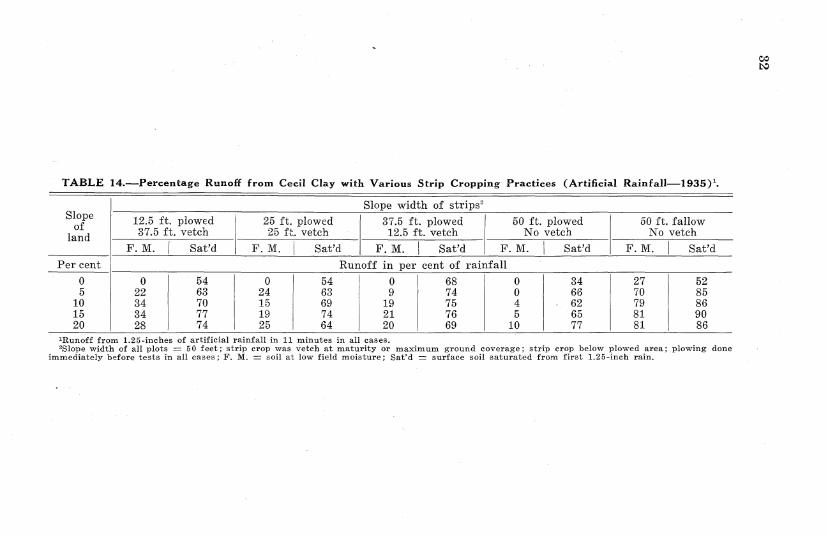
TABLE 14.-Percentage Runoff from Cecil Clay with Various Strip Cropping Practices (Artificial Rainfall-1935).
Slope width of strips2
Slopeof 12.5 ft. plowed 25 ft. plowed 37.5 ft. plowed 50 ft. plowed 50 ft. fallowland 37.5 ft. vetch 25 ft. vetch 12.5 ft. vetch No vetch No vetch
land
F. M. I Sat'd F. M. Sat'd F. M. Sat'd F. M. Sat'd F. M. Sat'd
Per cent Runoff in per cent of rainfall
0 0 54 0 54 0 68 0 34 27 525 22 63 24 63 9 74 0 66 70 85
10 34 70 15 69 19 75 4 62 79 8615 34 77 19 74 21 76 5 65 81 9020 28 74 25 64 20 69 10 77 81 86
'Runoff from 1.25-inches of artificial rainfall in 11 minutes in all cases.2Slope width of all plots= 50 feet; strip crop was vetch at maturity or maximum ground coverage; strip crop helow plowed area; plowing done
immediately before tests in all cases; F. M. - soil at low field moisture; Sat'd= surface soil saturated from first 1.25-inch rain.

had been~ plahnted onl smooth steep slop~es. The stairv-step (effectprodutc ed by the filtering process maY be seen in Figurec 7.
/ y ,~. 911y 'N+sl.Y u.'
. *00i i L -
1 6_ 4 rw
hI G I R lt rr, ii n 1'lo u d r tc lt. w u J- ini.o ebot fie. .r ru h oa u ifr ys o t lp tpn t
in time
juin the! sa epeid
ptrodnlc'eat ote the foilteriooreoil par tice an etgh
grtet rin the a err p l .

34
It is common knowledge that the quantity of runoff is mark-edly decreased by vegetation. This fact is repeatedly verifiedby runoff data presented at various places in this publication.The reduction in quantity of runoff is caused primarily by (a)permitting increased absorption and infiltration of water throughold root channels, and (b) by holding the water on the slopefor a longer period of time during which these processes maycontinue to function. (See Table 12.) In addition, plant resi-dues and resulting organic matter exert a pronounced effect onthe aggregation characteristics of soils. The effects of thesecharacteristics on erosion have been observed in the field buthave not been quantitatively measured. The data in Table 15may serve to illustrate the influence of organic matter on aggre-tion.
TABLE 15.-Aggregate Analysis of Hartsells Fine Sandy Loam and ofPorters Sandy Loam.
Aggregate size classes in millimetersSoil >2.0 2.0-1.0 1.0-0.5 10.5-0.25 10.25-0.100.10-0.05 <0.05type
Aggregate separates in per cent of total
Hartsells finesandy loam 5.9 5.9 8.1 8.7 13.1 35.7 22.6
Porterssandy loam 50.1 10.4 13.1 9.7 11.8 4.0 0.9
The above two soils were found to be very similar in me-chanical analysis but the Porters soil contained 5.6 per centorganic matter while the Hartsells contained only 1.5 per centorganic matter. The Porters soil is strongly aggregated; fieldobservations indicated that this soil possessed extreme resistanceto erosion. The Hartsells soil is structureless (single grained)and is known to be very susceptible to erosion.
The velocity of the film or layer of water during runoff isthe factor which primarily determines the tendency of runoffto produce soil movement. The size of soil particle which watercan transport is a function of its velocity. This velocity is dif-ficult to measure directly. However, rate of runoff curves maybe used to approximate slope velocity. Data from which suchcurves may be constructed have been obtained from a large num-ber of artificial rainfall trials during which water was added atconstant and known rates. A portion of a typical set of suchcurves is shown in Figure 8.
From this figure it may be seen that between two and threeminutes were required, after the addition of water had ceased,for runoff to stop on a 20 per cent fallow slope. With a plotslope-length of 50 feet, this indicates a slope velocity of about20 feet per minute. In a like manner, it may be seen that for-

35
4 8 12 /6 20 24 28 32 36Time in Minutes
FIGURE 8.-Part of a set of typical runoff curves used to approximate slopevelocities of runoff. (Rate of rainfall 412.5 cubic feet peracre per minute.)
ward moving velocities of runoff were reduced to about 5 feetper minute and 7 feet per minute on 5 and 20 per cent slopesrespectively, by a complete ground coverage of vetch. Theapproximate velocities of the runoff from flat plots during thistrial were 21 2 and 5 feet per minute, respectively, for vetch andfallow. These curves may be taken to indicate that on theslopes studied vegetative coverage had more influence thanslope on the velocity of runoff.
The importance of vegetation in reducing the slope velocityof runoff can hardly be over emphasized. It is believed thatthis variable will have to be accurately measured before a quan-titative relationship between runoff and soil losses can be estab-lished'. Nevertheless, it may interest the reader to comparethe above approximated velocities with the magnitude of soillosses occurring during the same trial as reported in Table 5.
'Concurrent measurement of slope velocity of runoff and rate of soil losses are beingmade under vegetative, tilled and fallow conditions on the different slopes. These findingswlll be reported at a later date.

36
It was observed that the flow of runoff frequently becameturbulent on steeper slopes denuded of vegetation. The presenceof thick vegetative coverage tended to promote a non-turbulenttype of flow thus holding the abrasive action of sediment-loaded water to a minimum. At the same time ample soil cover-age by vegetation caused a water blanket to be formed whichprotected the soil from further mechanical dispersion by beatingrainfall. The relative importance of these dispersive processeshas not been evaluated.
Influence of Vegetative Protection on Erosion.-Where na-ture has sufficiently covered the soil with vegetation, the runoffand soil losses due to erosion are not serious. Vegetation andvegetation residues contribute to retaining the soil in place inthe following ways: (a) The vegetative cover breaks the fallingvelocity of rain which results in less soil being brought into sus-pension, (b) vegetative growth retards the forward movingvelocity of runoff and allows coarse materials to be filtered out,(c) plant roots, organic matter, fungi and molds either increaseabsorption or bind the soil in place, and (d) vegetation inter-cepts a portion of the rainfall.
The value of vegetation in controlling erosion is determinedby the growth habits of the plant (7) and methods of plantingrather than the number of pounds of green material per unitarea. Prostrate plants with a wide lateral spread are mosteffective in controlling erosion. Contour row plantings are muchmore effective than slope plantings.
A number of different crops have been tested to determinetheir value as soil saving crops. The winter cover crops groupedin order of their effectiveness in preventing soil losses from Cecilclay are: (a) vetch planted in 18-inch, contour rows, (b) ryeplanted in 10-inch, contour rows, and (c) oats planted in 10-inch,contour rows. The summer crops tested may be listed in orderof their effectiveness in reducing soil losses as follows: (a) Al-ternate 12-foot, contour strips of soybeans planted in 18-inchrows and of cotton planted in 3-foot rows, (b) corn and velvetbeans interplanted at 18-inch intervals in 4-foot, contour rows,(c) unchopped cotton planted in 3-foot, contour rows, and (d)chopped cotton planted in 3-foot contour rows.
During the fall and winter months rye was slightly superiorto vetch in reducing erosion losses. Beyond this period thevetch rapidly outgrew the rye to an extent that it finally coveredthe entire surface of the plots. A maximum coverage of approx-imately two-thirds of the area between the 10-inch rows wasattained by the rye. Thus, the vetch was much more effectivethan the rye during the latter stages of growth. From a studyof the total seasonal losses in Table 7 it was concluded that ryewas practically as effective as vetch for decreasing erosion.
37
However, vetch is a superior crop due to its nitrogenous valueand is the most practical from a soil fertility viewpoint. In thisexperiment both rye and vetch were planted at normal seedingrates.
When the vetch and rye plants were at about one-half ma-turity a 1.25-inch artificial rain was added to each plot in 11minutes. The soil was fairly well saturated from rainfallimmediately preceding the trials. Under these conditions bothrunoff and soil losses were greater from the rye plots than fromthe vetch plots in all instances. The nature of the eroded ma-terial was rather similar when the plants were at half maturity.(See Table 16.) After the plants were mature, erosion waspractically controlled on the vetch plots; the very small quan-tities of soil lost consisted for the most part of material in sus-pension. However, in the case of rye, appreciable quantitiesof both coarse material and suspension solids were eroded.
During the growing season of a crop of cotton, in which timethe erosion producing rainfall was 12.50 inches, normal-spacedcotton plots lost appreciably more soil than plots of unthinnedcotton. (See Table 17.) However, the low yields from un-thinned cotton make it impractical to leave cotton unthinned.
During a period from November to May, vetch was foundto be about ten times more effective for controlling erosion thanwas fallow; the erosion producing rainfall for the season was20 inches. Detailed data for the experiment may be found inTable 8. Summary Table 18 reveals that the combined seasonalerosion losses from vetch and cotton are about one-half as muchas those from cotton and fallow over the same period; the fallowcondition differed from farm practice in that weeds and stalkswere removed.
Influence of Strip Cropping on Erosion.-The practice ofplanting land to soil conserving crops in the form of contourstrips of various widths between similar strips of clean-cultivatedland is being recommended and used to some extent as an erosioncontrol measure in some sections of the United States. A reviewof the literature fails to reveal experiments sufficiently compre-hensive to serve as a basis for recommendation of such practices.
During the summer of 1932 cotton was grown on low contourbeds on one of two plots on each slope; the companion plotswere planted in alternate 12.5-foot, contour strips of cotton andof soybeans. Rainfall during the growing season totaled 22.5inches. Soil losses from the plots in cotton alone ranged from9,455 pounds per acre on 5 per cent slope to 62,121 pounds peracre on 20 per cent slope. Corresponding seasonal soil lossesfrom the strip cropped plots varied from 7,614 pounds per acreon 5 per cent slope to 18,412 pounds per acre on the 20 per centslope. The results of this experiment are summarized in detail

TABLE 16.-Physical Nature of Erosion Losses from Cecil Clay Protected by Vetch and Rye as Winter Cover Crops.
Mechanical Aggregateanalysis size Slope of land in per cent
of soil class of 0 5 10 15 20(Textural eroded
separates) sediments Vetch1 Rye' Vetch Rye Vetch Rye Vetch Rye Vetch Rye
m. m. Per cent m. m. Aggregate losses in per cent of total soil losses2
>2.0 Nil Nil 1.7 0.7 1.0 2.8 2.4 3.1 2.7 5.32.0 -1.0 0.9 2.0 -1.0 7.5 3.6 2.6 1.7 2.6 8.0 4.7 8.3 3.5 7.91.0 -0.5 2.4 1.0 -0.5 6.6 4.1 5.3 4.0 7.3 15.5 10.9 20.6 8.4 12.60.5 -0.25 5.4 0.5 -0.25 5.8 3.4 4.4 2.7 5.9 9.4 9.6 9.6 6.7 8.30.25-0.10 13.4 0.25-0.10 22.6 15.6 20.6 14.5 18.7 15.0 21.4 17.6 22.3 17.40.10-0.05 9.2 0.10-0.05 17.0 15.5 42.4 40.5 37.6 15.9 27.3 17.2 25.9 14.0
<0.05 68.7 <0.05 40.5 57.8 23.0 35.9 26.9 33.4 23.7 23.6 30.5 34.50.05-0.005 16.3
<0.005 52.4 Totals 100 100 100 100 100 100 100 100 100 100
Aggregate losses in pounds per acre2
>2.0 Nil Nil 2.3 3.0 4.2 70 20.6 125 46.0 2712.0 -1.0 2.2 4.0 3.6 7.2 11.0 203 40.6 332 60.5 4041.0 -0.5 1.9 5.0 7.3 16.8 30.7 394 94.1 826 144.8 6440.5 -0.25 1.7 4.0 6.0 11.4 24.8 238 83.5 385 114.8 4270.25-0.10 6.6 19.0 28.3 60.9 78.8 378 185.5 704 383.8 8910.10-0.05 4.9 18.8 58.3 170.5 158.3 401 236.5 692 446.7 717
<0.05 11.8 70.0 31.8 151.1 113.3 843 205.0 947 525.1 1,763
Total soil losses in lbs./acre 29 121 138 421 421 2,527 866 4,011 1,722 5,117
Runoff in cu. ft./acre 1,772 3,305 2,730 2,988 3,046 3,127 2,844 3,037 3,311 3,908
'Vetch planted in 18-inch drill rows on contour at about 50 per cent ground coverage; rye planted in 10-inch drill row on contour at about35 per cent ground coverage.2
Soil losses from 1.25 inches artificial rainfall applied in 11 minutes; surface soil partially saturated from previous rainfall.

TABLE 17.-Erosion Losses from Chopped Cotton and from Unchopped Cotton-1934.
Amount Dura- Slope of land in per centTime of tion 0 5 10 15 20
of ofrainfall ra rai h d Un - Un-Un- Un- Un-
fall fall oppechopped Chopped ch hopped choped Chopped chopped Chopped chopped
Date Inches Hours Soil losses in pounds per acre
6/12/34 1.40 41/2 150 440 3,900 3,700 11,700 11,000 26,400 23,400 31,800 27,3006/18/34 1.94 2 827 1,551 9,959 7,620 19,285 19,970 40,013 39,301 49,106 47,6347/13/34 0.83 1/3 Nil Nil 1,934 1,292 3,794 2,625 4,658 4,151 5,452 4,1008/12/34 2.93 13 199 191 2,118 732 21,145 5,344 29,621 14,308 28,068 15,17410/6/34 4.00 38 Nil Nil 17 20 206 49 238 135 170 11210/13/34 1.40 36 Nil Nil 26 15 84 35 115 85 114 42
Totals 12.50 1,176 2,182 17,954 13,379 56,214 39,023 103,045 81,380 114,710 94,362
Runoff in cubic feet per acre
6/12/34 1.40 41/2 825 1,600 3,888 3,045 3,773 3,298 3,847 3,549 3,941 3,1906/18/34 1.94 2 4,518 5,620 6,518 6,260 6,220 5,972 5,834 5,972 6,084 5,5647/13/34 0.83 1/3 Nil Nil 52 724 1,325 1,273 1,363 1,200 1,252 8878/12/34 2.93 13 4,600 4,640 8,990 7,890 8,780 8,020 9,080 8,285 9,550 7,32010/6/34 4.00 38 502 232 850 270 2,800 1,053 3,025 1,685 1,868 90310/13/34 1.40 36 72 93 371 183 1,018 496 1,056 789 946 371
Totals 12.50 10,517 12,185 20,669 18,372 23,916 20,112 24.205 21,480 23,641 18,235iCotton planted in 3-foot, contour rows; total rainfall for the season - 21.1 inches; 12.5 inches falling as rains which produced erosion losses;
cotton chopped on "chopped" plots between rains of June 18th and July 13th.2Not determined.

TABLE 18.-Yearly Erosion Losses from Continuous Cotton and from Cotton and Vetch Rotation on Cecil Clay1 .
Slope of land in per centPeriod 0 5 10 15 20
of Cotton Cotton Cotton Cotton CottonYear Cotton2 and Cotton and Cotton and Cotton and Cotton andVetch Vetch Vetch Vetch Vetch
Soil losses in pounds per acre
Cotton SeasonJune-October 1,237 2,251 18,883 16,344 62,434 62,419 113,800 110,088 138,465 132,493inclusive
Vetch SeasonNovember-May 927 773 27,564 3,784 90,218 6,392 135,179 14,767 182,662 19,675inclusive
June, 1934to 2,164 3,024 46,447 20,128 152,652 68,813 248,979 124,855 321,127 152,168
June, 1935_____ _________________________ _________ __________
Runoff in acre inches
Cotton SeasonJune-October, 3.53 4.05 6.85inclusive
Vetch SeasonNovember-May, 2.77 2.78 11.89inclusive
June, 1934to 6.30 6.83 18.74
June, 1935
'Total rainfall for the year was 45.4 inches; cotton season,inch drill rows on contour.
2Plot out of level making losses abnormally low.
6.55
8.29
14.84
7.73
11.86
19.59
7.53
7.67
15.20
7.75
11.90
19.65
7.71
7.92
15.63
21.1 inches; vetch season, 24.3 inches; vetch used as a winter
7.83
12.69
20.52
7.48
7.48
14.96
legume planted in 18-I I I I

41
in Table 19. This strip cropping practice was particularly ef-fective in reducing soil movements on the steeper slopes.
TABLE 19.-Seasonal Soil Losses from Cecil Clay Planted to Cotton and toCotton-Soybean Strip Crops1.
Period Rainfall Cropping Slope of land in per cent
inches system 5 10 I 15 I20Soil losses in pounds per acre
Early summer Cotton(growing period 13.95 only 6,975 14,139 51,193 47,348of soybeans) Cotton-soybean
strips 5,517 7,528 11,354 14,473
CottonLate summer 8.52 only 2,480 2,824 12,105 14,773and fall Cotton-soybean
stubble strips 2,097 2,205 3,665 3,939
Entire Cottongrowing 22.47 only 9,455 16,963 63,298 62,121season Cotton-soybean
strips 7,614 9,733 15,019 18,412150-foot slope width of cotton alone; alternate 12.5-foot strips of soybeans and cotton;
soybeans in 18-inch, contour rows planted flat; cotton in 3-foot rows on low contour beds.
Results of other experiments designed to determine the rel-ative effectiveness of different widths of strip crops in controllingsheet erosion are summarized in Tables 20 and 21. Artificialrainfall of constant intensity and duration was applied in allinstances while the ratio of strip crop to cultivated area wasvaried. The quantity of soil losses was greatly reduced by allwidths of strip crops tested. Likewise, runoff as compared tothat from fallow land was consistently reduced. These trialswere made when the cover crops had reached maximum growth.At this stage the vetch in 18-inch rows completely covered thesoil and the rye in 10-inch rows covered about two-thirds of thesoil. A 12.5-foot strip of vetch or rye at maximum ground cov-erage on the lower end of a 50-foot plot practically controlledthe movement of soil from all slopes studied when the upper37.5 feet of each plot was freshly plowed and the soil was atlow field moisture. One and one-fourth inches of water wasapplied to the plots in 11 minutes. When the soil was saturatedand the above conditions held constant, a 12.5-foot strip of vetchor rye controlled erosion on a 5 per cent slope and reasonablycontrolled erosion on a 10 per cent slope. A 6.5-foot strip ofvetch or rye controlled erosion on level plots when the rear partof the plot was freshly plowed. (Erosion was considered con-trolled when not more than 500 or 600 pounds of soil per acrewas moved through the strips under the above conditions.)
The way in which strip cropping functions in reducing sheeterosion losses is plainly revealed by a study of the nature of

TABLE 20.-Soil and Water Losses from Cecil Clay under Different Strip Cropping Practices-1934.
Slope width of strips2
50 ft. 50 ft. 37.5 ft. 25 ft. 12.5 ft. 12.5 ft.Cover crop Cover crop Cover crop Cover crop Cover crop Cover crop No Cover crop
Slope (at 1/2 (at full 12.5 ft. 25 ft. 37.5 ft. 37.5 ft. 50 ft. plowedof coverage) coverage) Plowed Plowed Plowed Plowed
landSat'd F. M. F. M. F. M. F. M. Sat'd Sat'd
Vetch Rye Vetch Rye Vetch Rye Vetch Rye Vetch Rye Vetch Rye Vetch Rye
Per cent Soil losses in pounds per acre
0 29 121 6 35 0 29 0 26 0 4 160 420 1,592 1,5185 137 421 17 169 23 128 45 54 58 35 582 524 2,787 2,183
10 421 2,527 103 1,199 47 832 40 504 71 292 1,243 1,071 20,537 8,03815 866 4,011 223 1,870 88 972 100 643 204 257 1,663 1,507 28,035 18,72920 1,722 5,117 170 1,927 120 585 183 519 201 278 2,261 2,714 37,745 35,150
Runoff in cubic feet per acre
0 1,772 3,305 82 2,632 319 1,461 Nil 818 Nil 163 2,595 3,202 3,952 4,5085 2,730 2,988 1,157 2,759 1,592 2,268 1,022 1,078 667 501 3,387 2,949 4,023 3,709
10 3,046 3,127 1,534 2,702 2,377 2,811 872 1,617 446 637 3,710 3,247 3,912 3,08215 2,844 3,037 2,058 2,680 2,520 2,899 1,433 1,620 1,079 777 3,881 2,598 4,057 3,12920 3,311 3,908 1,646 2,625 2,491 2,191 1,538 1,430 1,103 831 3,767 3,468 3,401 3,754
'Losses from 1.25 inches of artificial rainfall in all cases.2Cover crop at maturity or stage of maximum ground coverage in all cases except as noted; plowing was done a day previous to trial; plowed area
above cover crop strip in all cases; vetch planted in 18-inch drill row on contour; rye planted in 9-inch drill rows on contour; F. M. - soil atlow field moisture. Sat'd = surface soil partially saturated with water from rainfall immediately before trial.

TABLE 21.-Soil and Water Losses from Cecil Clay under Different Strip Cropping Practices-19351.
Slope width of Strip2
Slope 50 Ft. Fallow 50 Ft. Vetch 37.5 Ft. Vetch 25 Ft. Vetch 12.5 Ft. Vetch No Vetch No Vetchof None Plowed None Plowed 12.5 Ft.Plowed 25 Ft. Plowed 37.5 Ft. Plowed 50 Ft. Plowed 50 Ft. Fallow
landF. M. F. M. F. M. Sat'd F. M. Sat'd F. M. Sat'd F. M. Sat'd F. M. Sat'd
Per Soil losses in pounds per acrecent
0 227 8 Nil Nil Nil 26 Nil 101 Nil 147 20 535 11,188 6 12 64 38 177 31 293 Nil 1,277 5,027 4,541
10 30,150 26 14 67 28 255 117 377 127 3,743 11,238 6,35615 34,384 48 20 128 29 419 142 632 217 19,402 18,778 9,28720 42,519 521 37 181 156 625 231 1,363 1,794 39,981 25,152 12,377
Runoff in cubic feet per acre
0 5,260 3,610 Nil 2,470 Nil 2,440 Nil 3,067 Nil 1,542 1,207 2,3765 7,600 4,660 960 2,870 1,071 2,839 419 3,358 Nil 3,002 3,195 3,875
10 7,870 4,610 1,535 3,190 664 3,110 854 3,410 180 2,811 3,572 3,89915 8,260 4,830 1,540 3,500 857 3,359 967 3,468 240 2,951 3,691 4,09720 8,770 5,320 1,295 3,360 1,129 2,924 885 3,115 450 3,495 3,684 3,90211.25 inches artificial rainfall in 11 minutes in all cases except columns 1 and 2 in which 2.50 inches were added in 22 minutes. (The first 1.25
inches failed to produce erosion on the vetch plots.)2Strip crop of vetch at full coverage below plowed areas in all cases; plowing was done a day previous to each test; F. M. = soil at low field
moisture; Sat'd - surface soil saturated from first 1.25-inch rain; second 1.25-inch rain applied immediately.

44
sediments eroded from firm fallow and freshly plowed slopes.Aggregate analyses of sediments eroded under the above con-ditions are presented in Table 13; runoff data are included.Runoff expressed in percentage of rainfall applied is given forthis set of experiments in Table 14.
A study of the data presented in Table 13 shows that, withthe possible exception of the 12.5-foot strips on the steeperslopes, all widths of strip crop used almost completely filteredout the soil particles greater than 0.05 millimeters in diameter.A tremendous decrease of soil movement from the plots hasresulted from the use of this control practice even in the caseof relatively narrow filter strips.
However large quantities of soil were sheet-eroded from thecultivated portions of the plots and deposited in the strip cropareas. The strip crop functioned similarly to a broad-basedterrace in that the velocity of runoff decreased and the coarsersediments were deposited. It was assumed in these studies thatstrip cropping is not a substitute for but rather a supplement toterracing.
A limited amount of field work on strip cropping was startedin 1932 and has been conducted concurrently with the experi-mental work on the controlled plots. A 3.5-acre field whichhad been bench terraced and severely gullied was used for thiswork. Slope varied from 5 per cent to 35 per cent; the soillacked uniformity but was predominantly a sandy loam. Theold terraces were replaced with "Nichols" type terraces (4) andthe area has been continuously strip cropped for nearly fiveyears. Three systems of row direction were tried on the abovefield to determine the limiting slope on which equipmentcould be used efficiently and at what slope excessive erosionwould result from different row directions.
During the first year of the experiment, the key-terrace sys-tem was used (4). Rows were run parallel to the key terrace.All terraces above and below the key terrace were crossed withrows at different angles. The following year a 45 degree systemwas brought into effect; after careful study of a topographicmap of this field it was seen that the majority of rows wouldincidentally be at an angle of 45 degrees to the slope. Equalwidth strips of cotton and soybeans as summer crops and oatsand vetch as winter cover crops were rotated in both of theabove instances. During the third year the contour system wasbrought into use and is still being used. The contoured cottonrows on the terraces were so spaced that the terrace channelwas between two rows of cotton.
The upper 2.2 acres of the field had slopes up to and in-cluding 20 per cent; this area was cropped in the followingmanner. In the fall the area that was in soybean stubble, con-sisting of approximately one-half the area between terraces andjust below each terrace, was planted to either hairy vetch or
45
Austrian winter peas. The area that was in cotton on the ter-races and extending above until joining the bean strip wasplanted to fall oats. Legumes were turned in the Spring and theland was planted to cotton. Oats were followed by soybeansand thus the rotation continued from year to year. On thelower portion of the field having 20 to 35 per cent slopes, thesame rotation was followed except that Spanish runner peanutswere substituted in 2-foot rows for cotton as excessive erosionoccurred when planted to cotton. (Cotton was planted on thetilled areas on all slopes in 1932 and 1933). By this system ofrotation there was never more than approximately one-half thearea between terraces freshly plowed at the same time.
It was found that with any system used the steeper the gradeof the rows the easier it was to control the machinery; however,more erosion occurred. The 45 degree system was the most ef-ficient for the use of machinery and least efficient for erosioncontrol. With an efficient operator, the machinery was operat-ed fairly satisfactorily on contoured rows up to 20 per cent slope.Short rows were eliminated by any of the three systems. Evenwith the contour system the odd shaped areas were always in alegume or feed crop. Observations indicated that erosion losseswere held to a minimum.
Observations in the field and data from the controlled plotsshow that a wide strip crop is not necessary and that strip-widthshould be increased with the slope. Likewise the placement ofthe strip relative to the terrace is of major importance. Thenon-cultivated strip should extend above the terrace channel farenough to prevent the rapid movement of runoff and soil intothe channel.
The cotton belt of the Southeast is characterized to a largeextent by small terraced fields located on rough or broken topog-raphy; climate and soil conditions are rather unfavorable forpermanent pastures and extensive commercial production ofsmall grains and hay.
A consideration of the above conditions and of the limitedexperimental results indicate that there are certain advantagesand disadvantages to strip cropping. The advantages may belisted as follows: (a) decreases the distance of soil movementon the field, (b) reduces the rate and amount of runoff, (c)decreases the amount of eroded material sedimented in terracechannels, thus decreasing terrace maintenance, (d) forces croprotation and promotes the growing of small grains, hays andother roughages for local consumption, and (e) dispenses with"point" rows in the cultivated areas. The disadvantages ofstrip cropping may be listed as follows: (a) makes necessary arotation practice on between-terrace areas, thus breaking thefield into small patches, (b) tends to produce more hay, forageand grain than is necessary for home consumption in a regionwhere low yields prohibit profitable commercial production,

46
(c) makes weed and insect control more difficult, and (d) in-volves the use of a larger variety of adaptable, soil conservingcrops than is available at present for summer use on the vege-tation strips.
It is evident that a considerable amount of experimentationmust be conducted to answer the several practical problemsarising from strip cropping before such an erosion control meas-ure can be logically recommended as a general field practice inthe Southeast.
Erosion Losses from Contour and from Slope-Planted Crops.-In general, the runoff from land planted on the contour is lessthan that from land planted with the slope. Likewise, soil lossesusually increase as the runoff increases. During the growingperiod of a cotton crop, planted in 36-inch rows, seasonal soillosses from contoured and from slope-planted plots were de-termined. The seasonal losses from plots with contour-rowsranged from 4,178 pounds per acre on 5 per cent slope to 67,338pounds on the 20 per cent slope. The losses from plots withslope-planted rows varied from 11,412 pounds per acre on the5 per cent slope to 121,046 pounds on the 20 per cent slope.The rainfall during the period was 13 inches; about 7.5 inchesof the total fell as erosive rains. Data for this experiment arepresented in Table 22. On an average for all slopes, abouttwice as much soil was lost from the slope-planted cotton plotsas was lost from the plots where the cotton was planted on thecontour.
TABLE 22.-Seasonal Soil Losses from Cotton Planted on the Contour andwith the Slope on Cecil Clay1
Direction Slope of land in per cent
of 5 10 I 15 20rows Soil losses in pounds per acre
With slope 11,412 58,580 86,160 121,046On contour 4,178 29,696 47,212 67,338
'Season April 1st to August 1st, 1931; total rainfall for period - 12.97 inches; 7.36 inchesof rainfall producing all of the erosion losses.
Experiments were conducted when vetch was planted in 18-inch, contoured rows on one plot on each slope and when thecompanion plots were planted to vetch in 18-inch rows runningwith the slope. Artificial rains were applied to the vetch whenit reached maturity. After this trial was completed, the vetchwas removed at the soil surface with a hand knife without dis-turbing the soil. Tests were then made to determine the erosioncontrol value of the stubble. Later, all plots were plowed andthe same quantity and rate of rain was applied. Results ofthese experiments are reported in Table 23.

47
TABLE 23.-Soil Losses from Cecil Clay with Rows on the Contour and withthe Slope1.
Surface conditionSlope of land Direction Mature Vetch Freshly
inn f vetch stubble2 plowedper cent rowsSoil losses in pounds per acre
0 Slope 63 458Contour 95 191 611
5 Slope 81 1,093Contour 65 194 2,059
10 Slope 90 1,516Contour 82 239 2,371
15 Slope 569 6,733Contour 268 2,393 7,903
20 Slope 604 9,256Contour 284 5,823 19,150
1Losses from 1 inch of artificial rainfall applied in 8.5 minutes in all cases; surface soil
partially saturated by rainfall immediately preceding the runs.2Vetch removed by cutting near the ground with a knife without disturbing the soil.
The soil losses from mature vetch in both contoured andslope-planted rows were comparatively small in all cases. How-ever, on the steeper slopes soil losses were about twice as muchfrom slope-planted plots as from the contour-planted plots.After the vetch had been removed, the remaining stubble wasmuch more effective on the contoured rows than the stubble onthe slope-planted rows.
Relation of Slope to, Erosion.-Runoff and soil losses, as pre-viously stated, depend upon many interrelated variables. Theseverity of the losses increased with the slope of the land. Thisis in accordance with the findings of Bartel (1). The slope ofland which can be tilled in practice without excessive erosionlosses (the so called critical slope) varies quite widely with soilconditions, rainfall and farming practices.
Seasonal soil losses from different slopes under varyingamounts of vegetative protection and rainfall with variations insurface shape are reported in Table 24. A part of these datais shown in Figure 9. A study of these data reveals the fol-lowing:
(a) The seasonal soil losses from vetch, rye and alternatestrips of cotton and soybeans were comparatively small on allslopes. The critical slope was probably never reached on anyslope studied. This was due to vegetative protection of thecover crops and to the combined effect of surface shape, soilstructure, and plant coverage on the strip-cropped plots.
(b) Losses from interplanted corn and velvet beans and fromcotton were much greater than those from the crops mentionedabove. The rate of soil movement increased rapidly between10 and 15 per cent slopes and the soil losses were excessive in

00
TABLE 24.-Seasonal Soil Losses Produced by Natural Rainfall on Cecil Clay when Fallow and whenPlanted to Various Crops'.
Amount =Amount Duration Slope of land in per cent
Crop Soil erosive of0 5surface rainfall rainfall 0 5 10 15 20
Inches Hours Seasonal soil losses in pounds per acre
Vetch Smooth 13.99 184 698 5,531 7,416 10,651 13,775Rye Smooth 13.99 184 1,933 6,731 7,258 11,900 14,007Vetch Smooth 20.00 164 773 3,784 6,394 14,767 19,675Fallow Smobth 20.00 164 927 27,564 90,218 135,179 182,662Cotton-soybeans 2 Bedded 13.95 5,517 7,528 11,354 14,473Cotton Bedded 13.95 6,975 14,139 51,193 47,348Corn-velvet beans' Bedded 13.39 155 235 3,403 13,147 34,922 43,228Fallow Smooth 13.39 155 674 29,131 73,784 92,073 118,197Cotton4 Bedded 12.50 91 2,182 13,379 39,032 81,380 94,362Cotton Bedded 12.50 91 1,176 17,954 56,214 103,045 114,710Oats Smooth 35.15 307 1,618 9,898 23,075 52,894 60,136
'All crops planted on contour.2Alternate contour strips.
3Interplanted in the same row.4Cotton not chopped.

49
Slope of Land in Percent
FIGURE 9.-Seasonal soil losses from different slopes under different vege-tative coverage during growing seasons with comparable totalrainfall.
all cases above the 10 per cent slope. A study of the data indi-cates that with these cropping practices the critical slope wasbetween 10 and 15 per cent.
(c) Erosion losses from smooth fallow were comparativelyhigh at 5 per cent and the rate of losses increased rather uniform-ly above this point. The critical slope was possiblyreached atabout 5 per cent.
(d) Soil losses are a function of slope under any given setof conditions. However, vegetation, surface shape and state of
soil pulverization frequently exert a masking effect upon theslope factor. These factors are more important than slope in
determining soil and water losses.
Effect of Erosion on Yields.-It is a generally accepted be-lief that yields are materially reduced by erosion. The NorthCarolina Station (1)has reported that the annual loss of plant
food from sheet erosion may be seven times as great as thatremoved by a crop of cotton and four times as great as thatremoved by a crop of corn. Chemical analyses made at theMissouri Station (6) show that the amount of nitrogen, phos-

50
phorus, calcium and sulphur in the eroded material from cornor wheat land may be equal to or exceed the amounts taken offby these crops. Sheet erosion has so depleted large areas thatcrop production can no longer be conducted profitably; largeareas of formerly productive lands have been gullied almostbeyond redemption (3). Little reliance can be placed uponyields on the erosion plots at Auburn due to the fact that theexperiment was not designed to study yields.
SUMMARY
Results of six years' experimentation on the measurementand control of the sheet erosion process on Cecil clay are re-ported. A set of ten controlled plots, each 15 feet by 50 feetwas used; two plots were located on each of a 0, 5, 10, 15, and20 per cent slope. Suitable equipment and methods were usedto (a) measure the amount, rate and nature of soil materialeroded from the plots, (b) measure the rate and amount of run-off, (c) supply uniformly distributed artificial rainfall at anydesired rate and amount, and (d) record the intensity, quantityand duration of natural rainfall. Experiments were conductedunder wide variations of soil condition and vegetative cover.
The moisture content of the soil influenced the rate and ex-tent of absorption and hence influenced runoff and soil move-ment during any given rain. A large portion of seasonal erosionlosses invariably resulted from a few heavy rains which occurredwhen the soil was approximately saturated.
Rainfall intensity was more important than the quantity ofrainfall in determining the amount of erosion when other con-ditions were held constant and when the rate of rainfall ex-ceeded the rate of infiltration to an extent that appreciablerunoff occurred.
With a given intensity of rainfall, the duration had a markedeffect upon erosion-the greater the duration, the greater thesoil losses. Losses from intermittent rains of a given quantitywere decidedly less than those from rains of continued duration,provided the rate of rainfall exceeded the rate of absorption.This was due to the inability of the soil to absorb the quantityof water during a given time. The exception to this was onsmooth fallow, in which case the soil losses per unit of runoffdecreased because the loose or slaked soil was readily carriedoff by the first part of the rain.
Pulverization and tillage practices which increased the rateand amount of absorption were very effective in controlling sheeterosion provided the rate and amount of rainfall did not exceedthe rate and amount of absorption. When the rate of rainfallgreatly exceeded the rate of infiltration, excessive soil lossesusually resulted from such tillage practices.

51
Aggregate analysis of sediments eroded from Cecil clayunder a wide variety of conditions showed that the unit particlesinvolved in the sheet erosion process, in the case of structuralsoils, were aggregates rather than textural separates. In gen-eral, soil material is moved layer by layer in the sheet erosionprocess. The relative loss of colloidal material may be excessiveunder a condition or combination of conditions which results insmall quantities of runoff or in runoff of low velocity or both.
Winter cover crops and other vegetative control measuresfunctioned in reducing sheet erosion losses and soil movementsby (a) filtering out the large soil particles and water stableaggregates, (b) decreasing the quantity of runoff, (c) decreas-ing the velocity of runoff, (d) minimizing the turbulence of run-off and hence lessening the abrasive or dispersive action of sedi-ment-loaded water, and (e) by decreasing the mechanical dis-persive action of beating rainfall.
Annual soil losses from land continuously in cotton were re-duced to about one-half by the use of vetch as a winter covercrop. Rye, used as a winter cover crop, was nearly as effectiveas vetch in reducing erosion losses.
Various width strips of soil conserving crops were effectivein reducing erosion and in decreasing the distance of soil move-ment on between-terrace slopes. It seems that if strip croppingis practiced, it should be used as a supplement to terraces ratherthan as a substitute for terraces.
Contoured, row-crop plantings had a pronounced soil andwater saving ability when compared to slope plantings. Theamount of soil eroded from slope-planted cotton was about twiceas much as that from contour-planted cotton.
Erosion losses increased with increased slope under all con-ditions studied. The so called "critical slope" or point abovewhich a given soil cannot be cropped without excessive erosionlosses is more dependent upon such factors as plant coverageand tillage practices than on topography itself.
LITERATURE CITED
(1) Bartel, F. O. Mimeograph, Progress Report of North Caro-lina Experiment Station, Raleigh, N. C. 1928.
(2) Baver, L. D. Soil erosion in Missouri. Mo. Agri. Expt.Sta. Bul. 349. 1935.
(3) Bennett, H. H., and Champline, W. R. Soil erosion a na-tional menace. U.S.D.A. Cir. 33. 1928.
(4) Carnes, A., and Wilson, J. B. Terracing in Alabama.Ala. Ext. Cir. 148. 1934.
(5) Davis, F. L. A study of the uniformity of soil types andof the fundamental differences between different soilseries. Ala. Expt. Sta. Bul. 244. 1936.

52
(6) Duley, F. L., and Miller, M. F. Erosion and surface run-off under different soil conditions. Mo. Agri. Expt. Sta.Bul. 63. 1923.
(7) Meginnis, H. G. Using soil-binding plants to reclaimgullies in the South. U.S.D.A. Farmers' Bul. 1697. 1933.
(8) Middleton, H. E., Slater, C. S. and Byers, H.G. Physicaland chemical characteristics of the soils from the ErosionExperiment Stations. U.S.D.A. Tech. Bul. 316. 1932.
(9) Physical and chemical characteristics of the soilsfrom the Erosion Experiment Stations; Second report.U.S.D.A. Tech. Bul. 430. 1934.
(10) Miller, M. F., and Krusekopf, H. H. The influence ofsystems of cropping and methods of culture on surfacerunoff and soil erosion. Mo. Agri. Expt. Sta. Res. Bul.177. 1932.
(11) Musgrave, G. W. The infiltration capacity of soils in re-lation to the control of surface runoff and erosion. Jour.Amer. Soc. Agron. 27:336-345. 1935.
(12) Olmstead, L. B., Alexander, Lyle T., and Middleton, H. E.A pipette method of mechanical analysis of soils basedon improved dispersion procedure. U.S.D.A. Tech. Bul.170. 1930.
(13) Slater, C. S., and Byers, H. S. A laboratory study of thefield percolation rates of soils. U.S.D.A. Tech. Bul. 232.1931.
(14) Stokes, G. C. Camb. Phil. Soc. Trans. 8:287. 1845.(15) Yarnell, D. L. Rainfall intensity-frequency data. U.S.
D.A. Misc. Pub. 204. 1935.
(16) Yoder, R. E. A direct method of aggregate analysis ofsoils and a study of the physical nature of erosion losses.Jour. Amer. Soc. Agron. 28:337-351. 1936.
ACKNOWLEDGMENTS
The authors wish to express their sincere appreciation forthe many constructive criticisms and helpful suggestions of Pro-fessor M. L. Nichols, under whose guidance these experimentswere planned and conducted. The writers are also gratefulto Professor A. Carnes for suggestions offered during the courseof the work. Appreciation is also expressed to Messrs. T. N.Jones, Hugh Sexton, R. S. Kimbrough, B. C. Small and W. J. R.Browder who, as graduate students, contributed to the routinework.