Shear wave splitting across the Iceland hot spot: … · Results from the ICEMELT experiment ... G....
12
Shear wave splitting across the Iceland hot spot: Results from the ICEMELT experiment Ingi T. Bjarnason, 1 Paul G. Silver, 2 Georg Ru ¨mpker, 3 and Sean C. Solomon 2 Received 1 August 2001; revised 7 June 2002; accepted 9 July 2002; published 31 December 2002. [1] We report on observations of upper mantle anisotropy from the splitting of teleseismic shear waves (SKS, SKKS, and PKS) recorded by the ICEMELT broadband seismometer network in Iceland. In a ridge-centered hot spot locale, mantle anisotropy may be generated by flow-induced lattice-preferred orientation of olivine grains or the anisotropic distribution of magma. Splitting measurements of teleseismic shear waves may thus provide diagnostic information on upper mantle flow and/or the distribution of retained melt associated with the Iceland mantle plume. In eastern Iceland, fast polarization directions lie between N10°W and N45°W and average N24°W; delay times between the fast and slow shear waves are generally 0.7–1.35 s. In western Iceland, in contrast, the fast polarization directions, while less well constrained, yield an average value of N23°E and delay times are smaller (0.2–0.95 s). We propose that splitting in eastern Iceland is caused by a 100- to 200-km-thick anisotropic layer in the upper mantle. The observed fast directions in eastern Iceland, however, do not correspond either to the plate spreading direction or to a pattern of radial mantle flow from the center of the Iceland hot spot. We suggest that the relatively uniform direction and magnitude of splitting in eastern Iceland, situated on the Eurasian plate, may therefore reflect the large-scale flow field of the North Atlantic upper mantle. We hypothesize that the different pattern of anisotropy beneath western Iceland, part of the North American plate, is due to the different absolute motions of the two plates. By this view, splitting in eastern and western Iceland is the consequence of shear by North American and Eurasian plate motion relative to the background mantle flow. From absolute plate motion models, in which the Eurasian plate is approximately stationary and the North American plate is moving approximately westward, the splitting observations in both eastern and western Iceland can be satisfied by a background upper mantle flow in the direction N34°W and a velocity of 3 cm/yr in a hot spot reference frame. This inference can be used to test mantle flow models. In particular, it is inconsistent with kinematic flow models, which predict southward flow, or models where flow is dominated by subduction-related sources of mantle buoyancy, which predict westward flow. Our observations are more compatible with the flow field predicted from global seismic tomography models, which in particular include the influence of the large-scale lower mantle upwelling beneath southern Africa. While the hypothesized association between our observations and this upwelling is presently speculative, it makes a very specific and testable prediction about the flow field and hence anisotropy beneath the rest of the Atlantic basin. INDEX TERMS: 7218 Seismology: Lithosphere and upper mantle; 8120 Tectonophysics: Dynamics of lithosphere and mantle—general; 8155 Tectonophysics: Plate motions—general; KEYWORDS: Iceland, anisotropy, hot spot, plate motion, shear wave splitting, mantle flow Citation: Bjarnason, I. T., P. G. Silver, G. Ru ¨mpker, and S. C. Solomon, Shear wave splitting across the Iceland hot spot: Results from the ICEMELT experiment, J. Geophys. Res., 107(B12), 2382, doi:10.1029/2001JB000916, 2002. 1. Introduction [2] The interaction between the Iceland plume and Mid- Atlantic Ridge has several manifestations, but even a basic understanding of the form of upper mantle flow at Iceland has yet to be achieved. The Iceland hot spot generates a broad topographic high [Vogt, 1971], thicker than normal crust [Bjarnason et al., 1993; Staples et al., 1997; Menke JOURNAL OF GEOPHYSICAL RESEARCH, VOL. 107, NO. B12, 2382, doi:10.1029/2001JB000916, 2002 1 Science Institute, University of Iceland, Reykjavı ´k, Iceland. 2 Department of Terrestrial Magnetism, Carnegie Institution of Washington, Washington, D. C., USA. 3 GeoForschungsZentrum, Potsdam, Germany. Copyright 2002 by the American Geophysical Union. 0148-0227/02/2001JB000916$09.00 ESE 23 - 1
Transcript of Shear wave splitting across the Iceland hot spot: … · Results from the ICEMELT experiment ... G....

Shear wave splitting across the Iceland hot spot:
Results from the ICEMELT experiment
Ingi T. Bjarnason,1 Paul G. Silver,2 Georg Rumpker,3 and Sean C. Solomon2
Received 1 August 2001; revised 7 June 2002; accepted 9 July 2002; published 31 December 2002.
[1] We report on observations of upper mantle anisotropy from the splitting ofteleseismic shear waves (SKS, SKKS, and PKS) recorded by the ICEMELT broadbandseismometer network in Iceland. In a ridge-centered hot spot locale, mantle anisotropymay be generated by flow-induced lattice-preferred orientation of olivine grains or theanisotropic distribution of magma. Splitting measurements of teleseismic shear wavesmay thus provide diagnostic information on upper mantle flow and/or the distribution ofretained melt associated with the Iceland mantle plume. In eastern Iceland, fastpolarization directions lie between N10�W and N45�W and average N24�W; delaytimes between the fast and slow shear waves are generally 0.7–1.35 s. In westernIceland, in contrast, the fast polarization directions, while less well constrained, yield anaverage value of N23�E and delay times are smaller (0.2–0.95 s). We propose thatsplitting in eastern Iceland is caused by a 100- to 200-km-thick anisotropic layer in theupper mantle. The observed fast directions in eastern Iceland, however, do notcorrespond either to the plate spreading direction or to a pattern of radial mantle flowfrom the center of the Iceland hot spot. We suggest that the relatively uniform directionand magnitude of splitting in eastern Iceland, situated on the Eurasian plate, maytherefore reflect the large-scale flow field of the North Atlantic upper mantle. Wehypothesize that the different pattern of anisotropy beneath western Iceland, part of theNorth American plate, is due to the different absolute motions of the two plates. By thisview, splitting in eastern and western Iceland is the consequence of shear by NorthAmerican and Eurasian plate motion relative to the background mantle flow. Fromabsolute plate motion models, in which the Eurasian plate is approximately stationaryand the North American plate is moving approximately westward, the splittingobservations in both eastern and western Iceland can be satisfied by a backgroundupper mantle flow in the direction N34�W and a velocity of 3 cm/yr in a hot spotreference frame. This inference can be used to test mantle flow models. In particular, itis inconsistent with kinematic flow models, which predict southward flow, or modelswhere flow is dominated by subduction-related sources of mantle buoyancy, whichpredict westward flow. Our observations are more compatible with the flow fieldpredicted from global seismic tomography models, which in particular include theinfluence of the large-scale lower mantle upwelling beneath southern Africa. While thehypothesized association between our observations and this upwelling is presentlyspeculative, it makes a very specific and testable prediction about the flow field andhence anisotropy beneath the rest of the Atlantic basin. INDEX TERMS: 7218 Seismology:
Lithosphere and upper mantle; 8120 Tectonophysics: Dynamics of lithosphere and mantle—general; 8155
Tectonophysics: Plate motions—general; KEYWORDS: Iceland, anisotropy, hot spot, plate motion, shear
wave splitting, mantle flow
Citation: Bjarnason, I. T., P. G. Silver, G. Rumpker, and S. C. Solomon, Shear wave splitting across the Iceland hot spot: Results
from the ICEMELT experiment, J. Geophys. Res., 107(B12), 2382, doi:10.1029/2001JB000916, 2002.
1. Introduction
[2] The interaction between the Iceland plume and Mid-Atlantic Ridge has several manifestations, but even a basicunderstanding of the form of upper mantle flow at Icelandhas yet to be achieved. The Iceland hot spot generates abroad topographic high [Vogt, 1971], thicker than normalcrust [Bjarnason et al., 1993; Staples et al., 1997; Menke
JOURNAL OF GEOPHYSICAL RESEARCH, VOL. 107, NO. B12, 2382, doi:10.1029/2001JB000916, 2002
1Science Institute, University of Iceland, Reykjavık, Iceland.2Department of Terrestrial Magnetism, Carnegie Institution of
Washington, Washington, D. C., USA.3GeoForschungsZentrum, Potsdam, Germany.
Copyright 2002 by the American Geophysical Union.0148-0227/02/2001JB000916$09.00
ESE 23 - 1

et al., 1998; Darbyshire et al., 1998], and a distinctivegeochemical anomaly [Schilling, 1973] that extends south-ward along the Reykjanes Ridge. Neovolcanic zoneswithin Iceland are interpreted as on-land extensions ofthe ridge. Several kinematic and geodynamic models havebeen invoked to explain these characteristics [Vogt, 1971;Schilling, 1991; Ribe et al., 1995; White et al., 1995; Ito etal., 1996, 1999], but further observations are needed totest them. ICEMELT was a regional broadband seismicexperiment, operated by the Department of TerrestrialMagnetism (DTM) of the Carnegie Institution of Wash-ington and the Science Institute of the University of
Iceland, designed to determine the detailed upper mantlestructure beneath a mid-ocean ridge hot spot (Figure 1)and thus provide critical information for constrainingmantle dynamics at Iceland.[3] In this study we report on the pattern of upper mantle
anisotropy implied by the splitting of teleseismic shearphases recorded by the ICEMELT network, and we discussthe implications for mantle flow beneath Iceland. Theanisotropy measured by splitting of SKS phases providesconstraints on the geometry of both upper mantle flow andmantle melting beneath this ridge-centered hot spot.Because olivine, the most abundant mineral in the upper
Figure 1. Tectonic environment of Iceland. The black line shows the approximate location of the Mid-Atlantic Ridge, which passes through Iceland, the red circle indicates the approximate locus of theIceland plume as inferred from upper mantle seismic tomography [Wolfe et al., 1997], the pink areas onIceland denote neovolcanic zones, and black arrows give the absolute velocities of the North Americanand Eurasian plates at Iceland (25 and 0.6 mm/yr, respectively) predicted by the HS2-NUVEL1 platemotion model [Gripp and Gordon, 1990]. Also shown is the inferred mantle flow velocity beneathIceland of 30 mm/yr (gray arrow); see text. Black dots indicate the locations of the broadband seismicstations of the ICEMELT experiment, as well as GSN station BORG and DTM station AKU (cosited withICEMELT station AKUD; see also Figure 6a). Indication of seafloor topography illustrated by thesatellite-derived gravity field of the North Atlantic; yellow-to-red colors indicate more positive gravityvalues (corresponding to shallower seafloor), while green-to-blue colors indicate more negative values(and deeper seafloor).
ESE 23 - 2 BJARNASON ET AL.: SHEAR WAVE SPLITTING ACROSS ICELAND HOT SPOT

mantle, is anisotropic and develops lattice-preferred orien-tation in response to strain, splitting across Iceland mayreflect the flow-induced alignment of the olivine a [100]axes [e.g., Francis, 1969; Christensen, 1984; Blackman etal., 1996]. The presence of melt in vertically aligned crackscan also produce splitting [Kendall, 1994; Blackman andKendall, 1997], although a random distribution of melt incracks or tubules would yield an isotropic bulk structure.While measurements of surface wave azimuthal anisotropy[Nishimura and Forsyth, 1988; Montagner and Tanimoto,1990, 1991], studies of Pn anisotropy [Raitt et al., 1969],and a local study of shear wave splitting [Wolfe and Solo-mon, 1998] all provide strong evidence that olivine a axesalign parallel to the spreading direction at fast spreadingridges such as the East Pacific Rise, the pattern of surfacewave azimuthal anisotropy appears more complex at slowspreading ridges such as the Mid-Atlantic Ridge at Iceland[Montagner and Tanimoto, 1990, 1991; Silveira et al.,1998]. In particular, it is unknown whether the anisotropyat Iceland reflects mantle flow fields dominated by cylin-drical upwelling and radial divergence beneath the Icelandhot spot [e.g., Ito et al., 1999], ridge-related linear upwellingand bilateral divergence [Francis, 1969; Blackman et al.,1996], asthenospheric shear due to absolute plate motion[Vinnik et al., 1989], or the larger-scale background patternof upper mantle flow [Hager and O’Connell, 1979; Chase,1979; Parmentier and Oliver, 1979; Lithgow-Bertelloni andRichards, 1998].[4] The ICEMELT portable network consisted of 15
broadband, three-component STS-2 seismometers distrib-uted throughout Iceland [Bjarnason et al., 1996] (Figure 1).The network was installed in stages during a two-yearperiod from 1993–1995 and recorded data until the autumnof 1996. In addition to these portable stations, we also usedata from two permanent stations: the Global SeismographNetwork (GSN) station BORG, installed in 1994, and theDTM broadband station AKU, in operation since 1972[Evans and Sacks, 1979]. The ICEMELT network providedexcellent coverage of the different tectonic regions in Ice-land. For instance, stations HNJO, MDAL, KLU, ASBS,HOFF, and BIRH were located on older Icelandic crust andsampled off-axis regions on the North American and Eur-asian plates. Stations LJOP, ASKJ, and BRE were sited atthe currently active plate boundary in the Northern andEastern Volcanic Zones. The central station NYD was sitedabove the locus of the Iceland hot spot as imaged by seismictomography [Wolfe et al., 1997]. ICEMELT data have beenpreviously used to identify the isotropic characteristics ofmantle seismic structure beneath Iceland. Body wavetomography constrains the temperature and width of theupper mantle portion of the Iceland plume [Bjarnason et al.,1996; Wolfe et al., 1997], and measurements of the tran-sition zone thickness beneath Iceland suggest that the Ice-land plume arises from the lower mantle [Shen et al., 1996,1998]. The measurements of anisotropy reported here com-plement these earlier studies.
2. Shear Wave Splitting Analysis
[5] A shear wave passing through a homogeneous, aniso-tropic layer splits into two waves with orthogonal polar-izations and different wave speeds. Measurements of shear
wave splitting yield the direction of polarization f of thefast shear wave and the delay time dt between fast and slowshear waves. Splitting parameters obtained from SKS,SKKS, and PKS core phases reflect the path-integratedeffects of upper mantle anisotropy beneath the receivingseismometer [Silver, 1996; Savage, 1999] and provideinformation on the orientation of the anisotropy as well asthe combined effects of the thickness of the anisotropicregion and the degree of anisotropy [Silver and Chan, 1988,1991].[6] At islands such as Iceland, the high level of oceanic
wave-related seismic noise [Wilcock et al., 1999] inevi-tably degrades the quality of waveforms recorded onbroadband arrays, and most SKS phases are unusableunless low-pass filtered at periods greater than �10 s.Individual measurements of the splitting delay time andfast shear direction thus contain large errors. Figure 2shows an example of an individual splitting measurementmade using the method of Silver and Chan [1991] at theICEMELT station ASBS. While there is a clear splittingsignal in the data (Figures 2b and 2c), the 95% con-fidence region shown in Figure 2d is not well con-strained. We therefore apply the modification of Wolfeand Silver [1998], a procedure by which a single set ofsplitting parameters is obtained by stacking misfit surfa-ces from multiple earthquakes, such as displayed inFigure 2d. The solution after stacking 13 misfit surfacesat ASBS, shown in Figure 3, indicates that errors arereduced and the solution is better constrained than forindividual events. Examples of splitting solutions afterstacking at KLU and REYV are shown in Figures 4 and5. In contrast to the 1.2 s delay time at ASBS, splitting atKLU is small in magnitude (dt = 0.65 s) and splitting atREYV is negligible.[7] The splitting parameters for the ICEMELT network
derived by the stacking procedure of Wolfe and Silver[1998] are given in Table 1 (see the electronic supplementfor detailed information about the data set1). Each stackedsolution is based on at least 9 and as many as 15 phaseshaving the best signal-to-noise ratio recorded during theexperiment. We find no indication of a variation of splittingparameters with earthquake back azimuth, as might beproduced by the presence of two homogenous anisotropiclayers having different directions of fast polarization [Silverand Savage, 1994], a dipping symmetry axis, or lateralheterogeneity [Rumpker and Ryberg, 2000].
3. Splitting Results
[8] The splitting parameters observed across Iceland(Figure 6a) can be divided into two groups. The easternhalf of Iceland displays generally strong anisotropy, withdelay times dt of 0.7–1.35 s and fast polarization direc-tions f (measured clockwise from north) between about�10� and �45�. In contrast, the western half of Icelanddisplays weaker anisotropy, with dt = 0.2–0.95 s and f
1Supporting data set is available via Web browser or via AnonymousFTP from ftp://agu.org, directory ‘‘apend’’ (Username = ‘‘anonymous’’,Password = ‘‘guest’’); subdirectories in the ftp site are arranged by papernumber. Information on searching and submitting electronic supplements isfound at http://www.agu.org/pubs/esupp_about.html.
BJARNASON ET AL.: SHEAR WAVE SPLITTING ACROSS ICELAND HOT SPOT ESE 23 - 3

ranging from �4� to +30�. These east-west differences areclearly seen in plots of splitting parameters versus longi-tude (Figures 6b and 6c). The sole exception to thesegeneralizations is station NYD, which although geograph-
ically within the eastern group displays only weak evi-dence for splitting.[9] Since crustal contribution to splitting should be small
(�0.3 s) [e.g., Menke et al., 1993; Savage, 1999], the
Figure 2. An example of the determination of shear wave splitting from a single event recorded atstation ASBS on the eastern coast of Iceland. (a) Three-component seismogram of the SKS phase fromthe Philippine earthquake of 24 May 1995, located at an epicentral distance of 97� and a back azimuth of39�. The scale on the vertical axis and the origin of the time axis are arbitrary. (b) Radial and transverseseismograms before and after correcting for estimated splitting parameters. Correcting for splittingeffectively removes energy on the transverse component. (c) (top) Waveforms in the fast and slow frames(solid and dashed lines, respectively) show �1.5 s of splitting before correction (left) and after (right).(bottom) Horizontal particle motion (fast and slow components on the horizontal and vertical axes,respectively) is elliptical before (left) and rectilinear after (right) correction for splitting. (d) Contours ofconfidence regions for splitting parameters; the 1-contour gives the 95% confidence interval. Themeasured splitting is f = �20�, dt = 1.55 s.
ESE 23 - 4 BJARNASON ET AL.: SHEAR WAVE SPLITTING ACROSS ICELAND HOT SPOT

measurements in Figure 6 dominantly reflect the anisotropyof the upper mantle beneath the ICEMELT seismic network.Splitting parameters lack vertical resolution and thus do notconstrain the depth extent of anisotropy. On the basis of theintrinsic anisotropy observed in naturally occurring perido-tites, the thickness of the anisotropic layer may nonethelessbe estimated from the delay time. This intrinsic anisotropyhas an average value of �4% but can range from �2% to8% [Ben Ismaıl and Mainprice, 1998]. Using a 4% figure asrepresentative, every 1 s of splitting time delay translates to
�100 km of anisotropic material [Silver, 1996]. The split-ting times across eastern Iceland are therefore consistentwith an anisotropic layer 100 to 200 km thick in theuppermost mantle.
4. Evaluation of Simple Models
[10] The shear wave splitting results provide informationfor constraining the form of mantle flow and meltingbeneath Iceland. There are two potential causes for aniso-
Figure 2. (continued)
BJARNASON ET AL.: SHEAR WAVE SPLITTING ACROSS ICELAND HOT SPOT ESE 23 - 5

tropy at Iceland: lattice-preferred orientation (LPO) ofanisotropic mantle minerals and shape-preferred orientation(SPO) of oriented inclusions of fluids, such as melt or othermaterials with contrasting elastic properties. On the basis ofobservations of mantle-derived rocks, laboratory results,
and seismic measurements of shear wave splitting, theanisotropy of the continental mantle is believed to bedominated by olivine LPO (see Silver [1996] and referencestherein). At fast spreading ridges, measurements of aniso-tropy from surface waves [Nishimura and Forsyth, 1988;Montagner and Tanimoto, 1990, 1991] and shear wavesplitting [Wolfe and Solomon, 1998] yield fast directionsthat are parallel to the spreading direction, which has led tothe conclusion that the olivine a axes are aligned parallel tothis direction as well. However, this pattern of surface waveazimuthal anisotropy breaks down at slow spreading ridges[Montagner and Tanimoto, 1990, 1991; Silveira et al.,1998], and it is thus unclear what the splitting patternshould be at a ridge-centered hot spot such as Iceland.
Figure 3. Splitting solution for station ASBS obtained bystacking 13 records: f = �12 ± 3�, dt = 1.20 ± 0.10 s.
Figure 5. Splitting solution for station REYV showingnegligible anisotropy from a stack of 12 stations: dt = 0.20 ±0.20 s.
Figure 4. Splitting solution for station KLU in westernIceland obtained by stacking 15 records: f = 30 ± 4�, dt =0.65 ± 0.10 s.
Table 1. Shear Wave Splitting Parameters for ICEMELT Stationsa
Station f sf dt, s sdt, s Phases
AKU �9� 4� 0.90 0.10 13ASBS �12� 3� 1.20 0.10 13ASKJ �44� 4� 0.90 0.10 11BIRH �19� 4� 1.05 0.15 10BLOL 18� 3� 0.95 0.15 13BORG 20� 5� 0.60 0.10 14BRE �26� 2� 1.35 0.15 14HNJO 25� 11� 0.40 0.15 10HOFF �27� 2� 1.05 0.05 13KAF �40� 2� 1.00 0.15 15KLU 30� 4� 0.65 0.10 15LJOP �41� 3� 0.70 0.15 9MDAL �4� 2� 0.85 0.10 9NYD 22� 11� 0.40 0.15 10REYV 50� 25� 0.20 0.20 12SKOT �23� 4� 0.70 0.10 12
aThe sf and sdt are the standard deviations in f and dt, respectively,given by the stacking method of Wolfe and Silver [1998].
ESE 23 - 6 BJARNASON ET AL.: SHEAR WAVE SPLITTING ACROSS ICELAND HOT SPOT

[11] There are six potential contributions to mantle aniso-tropy beneath Iceland (Figure 7). The single SPO-relatedcontribution is that induced by ridge-parallel, melt-filledcracks. We expect there to be five potential contributions tothe flow field beneath Iceland and therefore five contribu-tions to strain-induced LPO anisotropy. These are flowassociated with the ridge upwelling and spreading process[Francis, 1969; Blackman et al., 1996], flow associatedwith absolute plate motion [Vinnik et al., 1989], ridge-centered, hot spot-related flow [Ribe et al., 1995; Ito etal., 1996, 1999], flow along the Reykjanes Ridge [Vogt,1971; Schilling, 1973; White et al., 1995], and regional orbackground flow of the upper mantle [Hager and O’Con-
nell, 1979; Chase, 1979; Parmentier and Oliver, 1979;Lithgow-Bertelloni and Richards, 1998]. All but the lastof these models has a well-defined flow direction. We makea prediction of the splitting parameters for idealized ver-sions of each of these six models, assuming for the LPO-related cases that the a axes of mantle olivine grains arecontained within the flow plane and parallel to the flow line,an alignment believed to be the dominant form of aniso-tropy at large strains [Zhang and Karato, 1995]. We furtherassume that for near-vertical propagation of shear waves (aswith the core phases of this study) and for a nearlyhorizontal preferred orientation of the olivine a axes, f willbe parallel to the horizontal projection of the a axes. For the
Figure 6. (a) Splitting results in map view. At each station the symbol orientation gives the fastpolarization direction f, and the symbol length is linearly proportional to dt (see legend). Also indicatedare principal faults of the neovolcanic zones (grey). Two major differences between eastern and westernIceland are seen in the data: (b) f varies from about +20� in the west to �20� in the east, and (c) dt variesfrom �0.6 s in the west to �1.0 s in the east.
BJARNASON ET AL.: SHEAR WAVE SPLITTING ACROSS ICELAND HOT SPOT ESE 23 - 7

same propagation paths, splitting should be negligiblewhere the a axes are nearly vertical [Silver, 1996].[12] The predicted splitting pattern for each of these
models is as follows:1. In the spreading model (Figure 7a) for anisotropy
associated with the spreading process, flow is generally inthe direction of relative plate motion (RPM), i.e., parallel tothe orientation of transform faults. Along the neovolcaniczone, the a axes are nearly vertical and splitting should beweak. Away from the neovolcanic zone, the olivine a axesshould be aligned with the spreading direction, and f shouldlikewise indicate this direction.2. In the absolute plate motion model (Figure 7b) for
flow associated with absolute plate motion (APM), weassume that simple asthenospheric flow develops beneaththe plate [Silver, 1996], with a horizontal flow plane and aflow line parallel to the APM direction. The direction fshould be parallel to APM. Because Iceland is centered onthe boundary of the North American and Eurasian plates,the APM direction changes between eastern and westernIceland. For the North American plate in western Iceland,the APM is in a westerly direction [Gripp and Gordon,1990]. For the Eurasian plate in eastern Iceland, thedirection is poorly constrained because the plate velocityis not significantly different from zero. We thus expectnegligible APM splitting on the Eurasian side.3. In the hot spot model (Figure 7c), hot spot (HS) flow
is assumed to be vertical at the center of the plume conduitand to diverge radially from the plume axis at the base of thelithosphere. At the plume axis, the olivine a axes are verticaland splitting of teleseismic shear waves should be weak.Away from the axis, the a axes should be subhorizontal anddirected radially outward from the plume axis. The directionf of fast shear waves should also be radial [Rumpker andSilver, 2000]. This particular pattern is strictly for a plumerising beneath a stationary plate; there may be distortions ofthis pattern due to plate motion [e.g., Sleep, 1990; Savageand Sheehan, 2000]. Because Iceland is a ridge-centered hotspot, there will be some alteration of this radial pattern dueto spreading, although it should be relatively minor for sucha slow spreading ridge [Ito et al., 1996; N. M. Ribe personalcommunication, 2002].4. In the ridge-parallel flow (RPF) model (Figure 7d),
for persistent mantle flow along the ridge, f shouldindicate a direction oriented parallel to the ridge throughoutIceland.5. In the background mantle flow (BMF) model (Figure
7e), the background flow field is expected to vary slowlyover the Iceland region, although its direction is unknown.By the same argument, the contribution of this mechanismto f is also unknown, but its effect should be homogeneousthroughout Iceland. This explanation for the origin ofsplitting in Iceland was offered earlier [Bjarnason et al.,1996], when there were fewer observations and a uniformdirection for fast shear waves was consistent with the datathen available.6. In the melt anisotropy model (Figure 7f), if melt is
present in vertical or steeply dipping cracks aligned parallelto the ridge (perpendicular to the direction of least principalstress), then the direction f for this SPO mechanism shouldbe parallel to the strike of ridge-related faulting in theneovolcanic zone. If melt were the dominant influence, the
Figure 7. Schematic depiction of possible causes ofsplitting beneath Iceland and the predicted values of f. Itis assumed that f follows the flow line where mantle flow ishorizontal. (a) Relative plate motion (RPM). Mantle flow isassumed to be parallel to transform faults. (b) Flow alignedby absolute plate motion (APM). The APM direction isfrom HS2-NUVEL1 [Gripp and Gordon, 1990]. For theEurasian plate, the flow direction is unconstrained becausethe plate is moving slowly. We take the contribution toanisotropy to be negligible on the eastern side of Iceland. (c)Hot spot (HS) flow. Mantle flow is assumed to be radialoutward from the inferred location of the hot spot. Therewill be a central region where flow is vertical and negligiblesplitting is expected. (d) Ridge-parallel flow (RPF). Mantleflow is assumed to be southward from the Icelandicneovolcanic zones toward the Reykjanes Ridge. The modelis motivated by topographic and geochemical evidence forsouthward flow along this ridge system [Vogt, 1971;Schilling, 1973; White et al., 1995]. (e) Background mantleflow (BMF). Anisotropy is assumed to be dominated bygeneral mantle circulation unrelated to surface plateprocesses. The direction is unconstrained, but it should becoherent throughout Iceland. (f) Shape-preferred orientation(SPO). This anisotropy is not produced by flow-inducedLPO but by preferentially oriented, vertical to steeplydipping, melt-filled cracks [Blackman and Kendall, 1997].Such cracks are assumed to strike parallel to the ridge.
ESE 23 - 8 BJARNASON ET AL.: SHEAR WAVE SPLITTING ACROSS ICELAND HOT SPOT
largest splitting values would be found beneath stations inthe neovolcanic zone, and dt would decrease with distancefrom this region as the fraction of melt diminishes.[13] On the basis of comparisons of our observations to
the patterns expected of each of these simple models, weconclude that there is no good match to any of the models.Although splitting at station NYD is small, as expectedunder the hot spot splitting model for a site centered overthe upper mantle plume anomaly imaged tomographically[Wolfe et al., 1997], there is no sign of the radial patternpredicted by this model away from the axis of the plumeconduit. There is also no sign of a generally symmetricpattern of ridge-normal directions for fast shear waves, aswould be expected from spreading processes. Two stations,ASKJ and LJOP, show fast shear directions perpendicular tothe local strike of the spreading boundary, but these stationslie within the neovolcanic zone (where splitting is predictedto be weak from this mechanism) and their fast polarizationdirections are not very different from those of other stationsin eastern Iceland. There is a suggestion of a ridge-parallelcomponent for the western stations, although the delaytimes are small. There is no obvious APM component inwestern Iceland. The observed average direction for fastshear waves on the western side is +23� (or �157�), nearlyorthogonal to the predicted direction for APM [Gripp andGordon, 1990]. If background mantle flow were dominant,we would expect a coherent pattern over all of Iceland,whereas we see two distinct patterns on the two sides of theisland. Finally, the observations do not match the predic-tions for ridge-aligned, vertical to steeply dipping, melt-filled cracks. This last result is consistent with splittingmeasurements from the MELT experiment at the EastPacific Rise, which yielded no evidence for such melt-induced anisotropy, because the dominant trend for splittingparameters is parallel to spreading both on- and off-axis[Wolfe and Solomon, 1998]. It thus appears that no singleprocess in Figure 7 dominates the splitting signal and thatmore complex models need to be considered.
5. Modified APM Model
[14] We next consider a modified APM model, in whichthe North American and Eurasian plates are moving notwith respect to a stationary mantle, but rather to a mantleflowing at a uniform horizontal vector velocity, Vm, in thenorth Atlantic region. We assume that Vm represents a rigidtranslation of the subasthenospheric mantle, so that theanisotropy thus developed is restricted to the asthenosphere.As discussed by Silver and Holt [2002], the direction ofasthenospheric shear will then be parallel to the vectorialdifference between the absolute plate velocity vector, Vp,and Vm. The values of f thus denote directions parallel (orantiparallel) to the orientation of Vp�Vm.[15] We assume further that the APM velocities (azimuth,
magnitude) of the North American (�74�, 25 mm/yr) andEurasian (�129�, 5.6 mm/yr) plates at Iceland are thosegiven by the hot spot reference frame of plate motion modelHS2-NUVEL1 [Gripp and Gordon, 1990]. We take Vp�Vm
for the North American and Eurasian plates to be parallel tothe average directions of fast shear wave propagation inwestern and eastern Iceland, respectively. These averagesare fW = +23� and fE = �24�. It is then possible to solve for
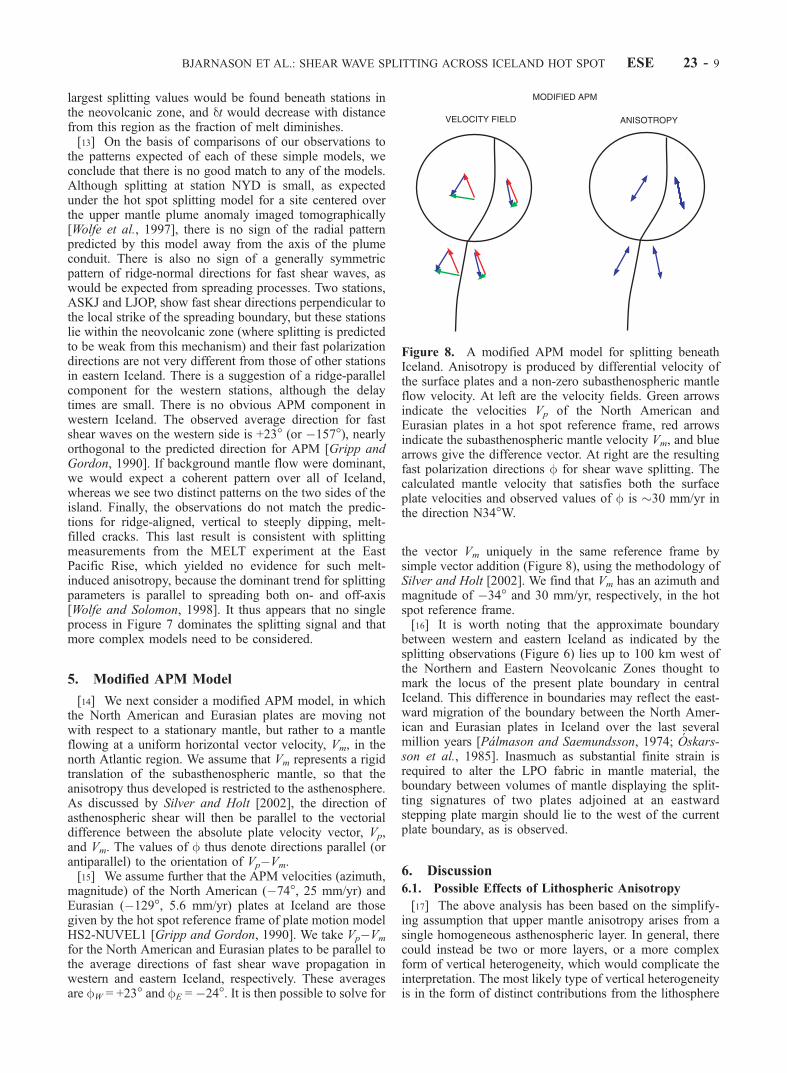
the vector Vm uniquely in the same reference frame bysimple vector addition (Figure 8), using the methodology ofSilver and Holt [2002]. We find that Vm has an azimuth andmagnitude of �34� and 30 mm/yr, respectively, in the hotspot reference frame.[16] It is worth noting that the approximate boundary
between western and eastern Iceland as indicated by thesplitting observations (Figure 6) lies up to 100 km west ofthe Northern and Eastern Neovolcanic Zones thought tomark the locus of the present plate boundary in centralIceland. This difference in boundaries may reflect the east-ward migration of the boundary between the North Amer-ican and Eurasian plates in Iceland over the last severalmillion years [Palmason and Saemundsson, 1974; Oskars-son et al., 1985]. Inasmuch as substantial finite strain isrequired to alter the LPO fabric in mantle material, theboundary between volumes of mantle displaying the split-ting signatures of two plates adjoined at an eastwardstepping plate margin should lie to the west of the currentplate boundary, as is observed.
6. Discussion
6.1. Possible Effects of Lithospheric Anisotropy
[17] The above analysis has been based on the simplify-ing assumption that upper mantle anisotropy arises from asingle homogeneous asthenospheric layer. In general, therecould instead be two or more layers, or a more complexform of vertical heterogeneity, which would complicate theinterpretation. The most likely type of vertical heterogeneityis in the form of distinct contributions from the lithosphere
Figure 8. A modified APM model for splitting beneathIceland. Anisotropy is produced by differential velocity ofthe surface plates and a non-zero subasthenospheric mantleflow velocity. At left are the velocity fields. Green arrowsindicate the velocities Vp of the North American andEurasian plates in a hot spot reference frame, red arrowsindicate the subasthenospheric mantle velocity Vm, and bluearrows give the difference vector. At right are the resultingfast polarization directions f for shear wave splitting. Thecalculated mantle velocity that satisfies both the surfaceplate velocities and observed values of f is �30 mm/yr inthe direction N34�W.
BJARNASON ET AL.: SHEAR WAVE SPLITTING ACROSS ICELAND HOT SPOT ESE 23 - 9

and asthenosphere. Each of the models in Figures 7 and 8is based implicitly on the assumption of negligible con-tribution from the lithosphere. We use the methods ofSilver and Savage [1994] and Rumpker and Silver [1998]to assess the effect of a possible lithospheric contributionto splitting.[18] As a first approximation, we fix the anisotropy in the
lithosphere and solve for anisotropy in the asthenosphericmantle. Surface wave dispersion data indicate that theIcelandic lithosphere far from the neovolcanic zones is�75 km thick [Bjarnason, 1999]. We assume that aniso-tropy within the lithosphere can be described by a simpletwo-layer model (35-km-thick crust, 40-km-thick mantle).The top crustal layer is assumed to be dominated by crack-induced anisotropy, where the fast-axis fLC is parallel to thestrike of the Iceland neovolcanic zones and dtLC = 0.2 s[Menke et al., 1993]. In the lithosphere beneath the crust,mantle flow results in a fast-axis fLM perpendicular to thestrike of the ridge. If the intrinsic anisotropy in the mantle is4%, the mantle delay time is estimated to be dtLM = 0.35 s.Because the fast directions for the two layers are orthogonal,this two-layer model can be described as a single aniso-tropic layer with fL = fLM and dtL = dtLM � dtLC. Theoverall effect of the lithospheric anisotropy on the splittingis thus predicted to be small, since dtL is only 0.15 s, a valuethat is less than 25% of the observed delay times. Never-theless, for such a lithospheric model, we may solve for anasthenospheric component and compare this estimate to theobserved values. Splitting parameters fA and dtA for theasthenosphere can be determined by a grid search under theconstraint that the two-layer apparent splitting parametersclosely match the averages determined from the observa-tions (Figure 6). These averages are fW = 23� and dtW =0.60 s for the western stations and fE = �24� and dtE = 1.0 sfor the eastern stations. Because there is a frequencydependence to apparent splitting for multiple layers, wefix the frequency at 0.1 Hz to correspond to the centralfrequency of the ICEMELT SKS data. Some two-layermodels generate strong p/2-periodic variations of apparentsplitting parameters as a function of back azimuth. Becausesuch variations are not evident in the ICEMELT observa-tions, we search for values of fA and dtA that result inminimal variations with back azimuth.[19] The strike of the neovolcanic zones across Iceland
varies from approximately N15�E in the north to N45�E inthe south. We therefore consider two cases: (1) fL = 105�and (2) fL = 135�, both cases with dtL = 0.15 s. For the west,using fW = 23� and dtW = 0.60 s as a reference, a grid searchyields (1) fA = 19� and dtA = 0.75 s and (2) fA = 32� and dtA= 0.70 s. Anisotropy in the lithosphere thus leads to areduction in apparent delay time by less than 0.2 s and achange in the fast shear wave direction by not more than12�. A similar analysis for eastern Iceland, using fE = �24�and dtE = 1.0 s as a reference, yields (1) fA = �19� and dtA =1.10 s and (2) fA = �19� and dtA = 0.90 s. The apparentdelay time is affected by 0.1 s or less and the direction offast shear waves by <10�.[20] On the basis of the above analysis, we conclude that
the most likely source of vertical heterogeneity, the presenceof an anisotropic lithosphere, is expected to have only aminor effect on the inferred splitting parameters of aniso-tropy within the underlying asthenosphere. The observed
values may thus be interpreted as reflecting this deepercomponent of anisotropy with little error.
6.2. Tests and Consequences of the ModifiedAPM Model
[21] The modified APM model of Figure 8 makes specificpredictions for mantle anisotropic properties away fromIceland. In particular, because the model is unrelated tothe presence of a plume, it predicts the same pattern ofanisotropy to the west and east of the northern Mid-AtlanticRidge that is found in western and eastern Iceland, respec-tively. There are limited data on the anisotropy of the NorthAtlantic mantle with which to compare the Iceland obser-vations. Kuo et al. [1987] examined the differential traveltimes of paired SS and S waves for which the surfacereflection point of the SS phase fell in the North Atlantic(15�–50�N latitude). The distribution of differential timeversus path azimuth they obtained suggested a region-widepattern of anisotropy in which the olivine a axes areoriented approximately 13�/�167�. Two later examinationsof larger data sets of SS-S differential times having SSreflection points distributed over larger areas in the NorthAtlantic [Woodward and Masters, 1991; Sheehan and Solo-mon, 1991], however, failed to corroborate this result,possibly because the anisotropy pattern varies significantlyover such a large region. Observations of SS and S particlemotions for three paths with SS reflection points in theNorth Atlantic (35�–50�N) led Yang and Fischer [1994] toinfer fast mantle shear directions of 18�/�162�, 24�/�156�,and 28�/�152� near SS reflection points on the NorthAmerican and Eurasian plates and at the ridge axis, respec-tively. These observations have large uncertainties, how-ever, because of poorly constrained contributions fromsource and receiver regions and because splitting operatorsfor different portions of the S and SS wave paths do notcommute [Wolfe and Silver, 1998]. Inversions of surfacewave phase velocities for azimuthally anisotropic Earthmodels yield fast directions generally parallel to absoluteplate motions in the oceans [Montagner and Tanimoto,1990, 1991]. However, a regional study of the NorthAtlantic [Silveira et al., 1998] yielded instead an approx-imately north-south fast direction, although the model hasgood resolution only to the south of Iceland. Finally, Shen etal. [2002] showed that the area of anomalously thin tran-sition zone beneath Iceland, attributed to the effect ofelevated temperatures within the Iceland plume, lies at least100 km southward of the upper mantle low-velocity zoneimaged by body wave tomography [Wolfe et al., 1997]. Oneexplanation for this tilt is northward upper mantle flow at avelocity compatible with our estimate of 3 cm/yr. Weconclude that the limited independent seismic data on thepattern of anisotropy of the North Atlantic upper mantle arenot inconsistent with the model of Figure 8, but additionaldata are needed to test the generality of the model morethoroughly.[22] An inference on mantle flow velocity beneath this
part of the North Atlantic provides a particularly strongconstraint on models for three-dimensional convective flowin the mantle, because the most commonly assumed candi-date driving forces for mantle flow predict distinct flowdirections in this region. For instance, kinematic models, inwhich the motions and geometries of the plates are imposed
ESE 23 - 10 BJARNASON ET AL.: SHEAR WAVE SPLITTING ACROSS ICELAND HOT SPOT

as boundary conditions, involve an upper region of flowdominated by plate shear and a lower region dominated byreturn flow [e.g., Hager and O’Connell, 1979; Chase, 1979;Parmentier and Oliver, 1979]. The return flow beneathIceland in such models is southward. If the return flow isshallow [e.g., Chase, 1979], Vm is predicted to be south-ward. If the return flow is deep [e.g., Hager and O’Connell,1979], then Vm should be approximately zero in a hot spotreference frame. Neither of these cases provides an adequateexplanation for our observations.[23] Another potentially significant driving force for the
mantle flow field is mantle buoyancy heterogeneity. Awidely used methodology for predicting this flow field isthrough instantaneous flow calculations for a specifieddensity heterogeneity model and viscosity profile [Hagerand Clayton, 1989; Ricard et al., 1993; Lithgow-Bertelloniand Richards, 1998]. Two types of density models arecommonly used, one based on the history of subduction,[e.g., Lithgow-Bertelloni and Richards, 1998], the otherinferred from global seismic tomography models. The lattertype, while they include the contributions of subductedslabs, also include regions of low seismic velocity that areequated with large-scale upwelling. Differences in thepredictions from these two density fields thus provide, inprinciple, a means for evaluating the relative importance ofsubduction and upwelling in driving the mantle flow field.[24] In the one other location where mantle flow velocity
has been inferred, density heterogeneity appears to be thedominant force driving mantle flow. Silver and Holt [2002]found that the subasthenospheric mantle flow velocitybeneath western North America is directed eastward at�5.5 cm/yr in a hot spot frame. While inconsistent withthe kinematic return flow models noted above (which alsopredict southward flow beneath western North America),both subduction- and tomography-based models of densityheterogeneity predict a flow field that is compatible withthis result. The dominant source of this heterogeneity is thesubduction of the former Farallon plate, which is prominentin both types of density fields.[25] In contrast, for the north Atlantic these two types of
density models predict different flow directions. The sub-duction-based density model predicts westward flowbeneath Iceland, a region which, as with western flowbeneath North America, is dominated by the sinking ofthe Farallon slab [Steinberger, 2000]. Tomography-basedmodels predict more northward flow, because of the addedinfluence of the large low-velocity region in the lowermantle beneath southern Africa (B. Steinberger, personalcommunication, 2002). This more northward mantle flow isconsistent with the modified APM model of Figure 8. It isalso consistent with the hypothesis that the ‘‘African super-plume’’ has a significant influence on mantle flow as farnorth as the northern Atlantic [Lithgow-Bertelloni andSilver, 1998].
7. Conclusions
[26] New shear wave splitting observations constrain thenature and causative mechanisms of anisotropy of the uppermantle beneath Iceland. This work constitutes the mostcomprehensive examination to date of anisotropy in anoceanic plume environment. While we see a systematic
east-west pattern of splitting across Iceland, the observa-tions are not easily related to simple models for the flowfield expected for a mantle plume nor to any other singlemechanism expected in this plume-ridge environment.[27] The splitting observations can be matched if the
dominant contribution to anisotropy is the shear inducedby the absolute motion of the North American and Eurasianplates relative to a north-northwestward subasthenosphericmantle flow beneath the North Atlantic at a horizontalvelocity of 3 cm/yr. We are unable to answer the questionof why there is not a stronger signature of mantle flowdiverging from the Iceland plume. At the same time, weacknowledge that there are more complicated hybrid mod-els, involving two or more processes, including plume-driven flow, which we have not examined in detail. Oneof the virtues of the hypothesis that the splitting observa-tions in Iceland arise from the vector difference betweenabsolute plate motion and subasthenospheric mantle flow isthat this idea is testable by observations that can be made inother areas of the north Atlantic. If the splitting parameterson the North American and Eurasian plate sides of thenorthern Mid-Atlantic Ridge are similar to those seen inwestern and eastern Iceland, respectively, then our proposedexplanation for the Iceland observations is significantlystrengthened. If, to the contrary, new observations reveal adifferent pattern for the north Atlantic upper mantle distantfrom Iceland, then additional explanations particular to hotspot proximity should be sought for the data of this paper.
[28] Acknowledgments. We thank Cecily Wolfe for the provision ofsoftware and for encouragement and constructive advice. We are alsograteful to a number of individuals for assistance with ICEMELT fieldoperations, including Adriana and Randy Kuehnel, Bjorn Bjarnason,Bryndıs Brandsdottir, Haukur Brynjolfsson, Kristinn Egilsson, GunnarGudmundsson, Eythor Hannesson, Tryggvi Hardarson, Larus Helgason,Bogi Ingimundarson, Haraldur Jonsson, Einar Kjartansson, Palmi Sigurds-son, Ragnar Thrudmarsson, and the staff of the National Electric Companyof Iceland (Landsvirkjun). We further thank Thorsten Becker, CarolinaLithgow-Bertelloni, Neil Ribe, and Bernhard Steinberger for stimulatingdiscussions on the geodynamic implications of our observations, and EdGarnero and Martha Savage for constructive reviews. This work wassupported by the National Science Foundation under grants EAR-9316137, OCE-9402991, and EAR-9707193.
ReferencesBen Ismaıl, W., and D. Mainprice, An olivine fabric database: An overviewof upper mantle fabrics and seismic anisotropy, Tectonophysics, 296,145–157, 1998.
Bjarnason, I. T., How thick is the lithosphere in Iceland? How large is thevelocity inversion in the asthenosphere and what does it mean? (abstract),Eos Trans. AGU, 80(46), Fall Meet. Suppl., F645, 1999.
Bjarnason, I. T., W. Menke, O. G. Flovenz, and D. Caress, Tomographicimage of the Mid-Atlantic plate boundary in southwestern Iceland,J. Geophys. Res., 98, 6607–6622, 1993.
Bjarnason, I. T., C. J. Wolfe, S. C. Solomon, and G. Gudmundson, Initialresults from the ICEMELT experiment: Body-wave delay times andshear-wave splitting across Iceland, Geophys. Res. Lett., 23, 459–462,1996. (Correction, Geophys. Res. Lett., 23, 903, 1996.)
Blackman, D. K., and J.-M. Kendall, Sensitivity of teleseismic body wavesto mineral texture and melt in the mantle beneath a mid-ocean ridge,Philos. Trans. R. Soc. London, Ser. A, 355, 217–231, 1997.
Blackman, D. K., J.-M. Kendall, P. R. Dawson, H.-R. Wenk, D. Boyce, andJ. Phipps Morgan, Teleseismic imaging of subaxial flow at mid-oceanridges: Traveltime effects of anisotropic mineral texture in the mantle,Geophys. J. Int., 127, 415–426, 1996.
Chase, C. G., Asthenospheric counterflow: A kinematic model, Geophys.J. R. Astron. Soc., 56, 1–18, 1979.
Christensen, N. I., The magnitude, symmetry and origin of upper mantleanisotropy based on fabric analyses of ultramafic tectonites, Geophys.J. R. Astron. Soc., 76, 89–111, 1984.
BJARNASON ET AL.: SHEAR WAVE SPLITTING ACROSS ICELAND HOT SPOT ESE 23 - 11

Darbyshire, F. A., I. T. Bjarnason, R. S. White, and O. G. Flovenz, Crustalstructure above the Iceland mantle plume imaged by the ICEMELTrefraction profile, Geophys. J. Int., 135, 1131–1149, 1998.
Evans, J. R., and I. S. Sacks, Deep structure of the Iceland plateau,J. Geophys. Res., 84, 6859–6866, 1979.
Francis, T. J. G., Generation of seismic anisotropy in the upper mantlealong the mid-oceanic ridges, Nature, 221, 162–165, 1969.
Gripp, A. G., and R. G. Gordon, Current plate velocities relative to thehotspots incorporating the NUVEL-1 global plate motion model, Geo-phys. Res. Lett., 17, 1109–1112, 1990.
Hager, B. H., and R. W. Clayton, Constraints on the structure of mantleconvection using seismic observations, flow models, and the geoid, inMantle Convection: Plate Tectonics and Global Dynamics, edited byW. R. Peltier, pp. 657–763, Gordon and Breach, New York, 1989.
Hager, B. H., and R. J. O’Connell, Kinematic models of large-scale flow inthe Earth’s mantle, J. Geophys. Res., 84, 1031–1048, 1979.
Ito, G., J. Lin, and C. W. Gable, Dynamics of mantle flow and melting at aridge-centered hotspot: Iceland and the Mid-Atlantic Ridge, Earth Planet.Sci. Lett., 144, 53–74, 1996.
Ito, G., Y. Shen, G. Hirth, and C. J. Wolfe, Mantle flow, melting, anddehydration of the Iceland mantle plume, Earth Planet. Sci. Lett., 165,81–96, 1999.
Kendall, J.-M., Teleseismic arrivals at a mid-ocean ridge: Effects of mantlemelt and anisotropy, Geophys. Res. Lett., 21, 301–304, 1994.
Kuo, B.-Y., D. W. Forsyth, and M. Wysession, Lateral heterogeneity andazimuthal anisotropy in the North Atlantic determined from SS-S differ-ential travel times, J. Geophys. Res., 92, 6421–6436, 1987.
Lithgow-Bertelloni, C., and M. A. Richards, The dynamics of Cenozoic andMesozoic plate motions, Rev. Geophys., 36, 27–78, 1998.
Lithgow-Bertelloni, C., and P. G. Silver, Dynamic topography, plate drivingforces and the African superswell, Nature, 395, 269–272, 1998.
Menke, W., B. Bransdottir, S. Jokobsdottir, and R. Stefansson, Seismicanisotropy in the crust at the mid-Atlantic plate boundary in south-westIceland, Geophys. J. Int., 119, 783–790, 1993.
Menke, W., M. West, B. Bransdottir, and D. Sparks, Compressional andshear velocity structure of the lithosphere in northern Iceland, Bull. Seis-mol. Soc. Am., 88, 1561–1571, 1998.
Montagner, J.-P., and T. Tanimoto, Global anisotropy in the upper mantleinferred from the regionalization of phase velocities, J. Geophys. Res.,95, 4797–4819, 1990.
Montagner, J.-P., and T. Tanimoto, Global upper mantle tomography ofseismic velocities and anisotropies, J. Geophys. Res., 96, 20,337 –20,351, 1991.
Nishimura, C. E., and D. W. Forsyth, Rayleigh wave phase velocities in thePacific with implications for azimuthal anisotropy and lateral heteroge-neities, Geophys. J., 94, 479–501, 1988.
Oskarsson, N., S. Steinthorsson, and G. E. Sigvaldason, Iceland geochem-ical anomaly: Origin, volcanotectonics, chemical fractionation and iso-tope evolution of the crust, J. Geophys. Res., 90, 10,011–10,025, 1985.
Palmason, G., and K. Saemundsson, Iceland in relation to the Mid-AtlanticRidge, Annu. Rev. Earth Planet. Sci., 2, 25–50, 1974.
Parmentier, E. M., and J. E. Oliver, A study of shallow mantle flow due tothe accretion and subduction of lithospheric plates, Geophys. J. R. Astron.Soc., 57, 1–22, 1979.
Raitt, R. W., G. G. Shor, T. J. G. Francis, and G. B. Morris, Anisotropy ofthe Pacific upper mantle, J. Geophys. Res., 74, 3095–3109, 1969.
Ribe, N. M., U. R. Christensen, and J. Theissing, The dynamics of plume-ridge interaction, 1, Ridge-centered plumes, Earth Planet. Sci. Lett., 134,155–168, 1995.
Ricard, Y., M. Richards, C. Lithgow-Bertelloni, and Y. Le Stunff, A geo-dynamic model of mantle density heterogeneity, J. Geophys. Res., 98,21,895–21,909, 1993.
Rumpker, G., and T. Ryberg, New ‘‘Fresnel-zone’’ estimates for shear-wavesplitting observations from finite-difference modeling, Geophys. Res.Lett., 27, 2005–2008, 2000.
Rumpker, G., and P. G. Silver, Apparent shear-wave splitting parameters inthe presence of vertically-varying anisotropy, Geophys J. Int., 135, 790–800, 1998.
Rumpker, G., and P. G. Silver, Calculating splitting parameters for plume-type anisotropic structures of the upper mantle, Geophys. J. Int., 143,507–520, 2000.
Savage, M. K., Seismic anisotropy and mantle deformation: What have welearned from shear wave splitting?, Rev. Geophys., 37, 65–106, 1999.
Savage, M. K., and A. F. Sheehan, Seismic anisotropy and mantle flowfrom the Great Basin to the Great Plains, western United States, J. Geo-phys. Res., 105, 13,715–13,734, 2000.
Schilling, J.-G., Iceland mantle plume: Geochemical study of ReykjanesRidge, Nature, 242, 565–571, 1973.
Schilling, J.-G., Fluxes and excess temperatures of mantle plumes inferredfrom their interaction with migrating mid-ocean ridges, Nature, 352,397–403, 1991.
Sheehan, A. F., and S. C. Solomon, Joint inversion of shear wave traveltime residuals and geoid and depth anomalies for long-wavelength varia-tions in upper mantle temperature and composition along the Mid-Atlan-tic Ridge, J. Geophys. Res., 96, 19,821–20,009, 1991.
Shen, Y., S. C. Solomon, I. T. Bjarnason, and G. M. Purdy, Hot mantletransition zone beneath Iceland and the adjacent Mid-Atlantic Ridge in-ferred from P-to-S conversions at the 410- and 660-km discontinuities,Geophys. Res. Lett., 23, 3527–3530, 1996.
Shen, Y., S. C. Solomon, I. T. Bjarnason, and C. J. Wolfe, Seismic evidencefor a lower-mantle origin of the Iceland plume, Nature, 395, 62–65,1998.
Shen, Y., S. C. Solomon, I. Th. Bjarnason, G. Nolet, W. J. Morgan, R. M.Allen, K. Vogfjord, S. Jakobsdottir, R. Stefansson, B. R. Julian, and G. R.Foulger, Seismic evidence for a tilted mantle plume and north-southmantle flow beneath Iceland, Earth Planet. Sci. Lett., 197, 261–272,2002.
Silveira, G., E. Stutzmann, D.-A. Griot, J.-P. Montagner, and L. MendesVictor, Anisotropic tomography of the Atlantic Ocean from Rayleighsurface waves, Phys. Earth Planet. Inter., 106, 257–273, 1998.
Silver, P. G., Seismic anisotropy beneath the continents: Probing the depthsof geology, Annu. Rev. Earth Planet. Sci., 24, 385–432, 1996.
Silver, P. G., and W. W. Chan, Implications for continental structure andevolution from seismic anisotropy, Nature, 335, 34–39, 1988.
Silver, P. G., and W. W. Chan, Shear-wave splitting and subcontinentalmantle deformation, J. Geophys. Res., 96, 16,429–16,454, 1991.
Silver, P. G., and W. E. Holt, The mantle flow field beneath western NorthAmerica, Science, 295, 1054–1057, 2002.
Silver, P. G., and M. K. Savage, The interpretation of shear-wave splittingparameters in the presence of two anisotropic layers, Geophys. J. Int.,119, 949–963, 1994.
Sleep, N. H., Hotspots and mantle plumes: Some phenomenology, J. Geo-phys. Res., 95, 6715–6736, 1990.
Staples, R. K., R. S. White, B. Brandsdottir, W. Menke, P. K. H. Maguire,and J. H. McBride, Faroe-Iceland Ridge Experiment, 1, Crustal structureof northeastern Iceland, J. Geophys. Res., 102, 7849–7866, 1997.
Steinberger, B., Slabs in the lower mantle—Results of dynamic modelingcompared with tomographic images and the geoid, Phys. Earth Planet.Inter., 118, 241–257, 2000.
Vinnik, L. P., V. Farra, and B. Romanowicz, Azimuthal anisotropy in theEarth from observations of SKS at GEOSCOPE and NARS broadbandstations, Bull. Seismol. Soc. Am., 79, 1542–1558, 1989.
Vogt, P. R., Asthenosphere motion recorded by the ocean floor south ofIceland, Earth Planet. Sci. Lett., 13, 153–160, 1971.
White, R. S., J. W. Bown, and J. R. Smallwood, The temperature of theIceland plume and origin of outward propagating V-shaped ridges,J. Geol. Soc. London, 152, 1039–1045, 1995.
Wilcock, W. S. D., S. C. Webb, and I. T. Bjarnason, The effect of local windon seismic noise near 1 Hz at the MELT site and in Iceland, Bull. Seismol.Soc. Am., 89, 1543–1557, 1999.
Wolfe, C. J., and P. G. Silver, Seismic anisotropy of oceanic upper mantle:Shear wave splitting methodologies and observations, J. Geophys. Res.,103, 749–771, 1998. (Correction, J. Geophys. Res., 103, 2791, 1998.)
Wolfe, C. J., and S. C. Solomon, Shear-wave splitting and implications formantle flow beneath the MELT region of the East Pacific Rise, Science,280, 1230–1232, 1998.
Wolfe, C. J., I. T. Bjarnason, J. C. VanDecar, and S. C. Solomon, Seismicstructure of the Iceland mantle plume, Nature, 385, 245–247, 1997.
Woodward, R. L., and G. Masters, Global upper mantle structure for long-period differential travel times, J. Geophys. Res., 96, 6351–6377, 1991.
Yang, X., and K. M. Fischer, Constraints on North Atlantic upper mantleanisotropy from S and SS phases, Geophys. Res. Lett., 21, 309–312,1994.
Zhang, S., and S. Karato, Lattice preferred orientation of olivine aggregatesdeformed in simple shear, Nature, 375, 774–777, 1995.
�����������������������I. T. Bjarnason, Science Institute, University of Iceland, Hofsvallagata 53,
Reykjavık IS107, Iceland. ([email protected])G. Rumpker, Seismische Tiefensondierung, GeoForschungsZentrum
Potsdam, Telegrafenberg, D-14473 Potsdam, Germany. ([email protected])P. G. Silver and S. C. Solomon, Department of Terrestrial Magnetism,
5241 Broad Branch Road, N. W., Washington, D. C. 20015, USA.([email protected]; [email protected])
ESE 23 - 12 BJARNASON ET AL.: SHEAR WAVE SPLITTING ACROSS ICELAND HOT SPOT