
Share Pledging and Corporate Risk-Taking: Insights from ...
63
Share Pledging and Corporate Risk-Taking: Insights from the Chinese Stock Market Qingbin Meng, Xiaoran Ni, and Jinfan Zhang Abstract This paper documents that share pledging can discourage corporate risk-taking. We find that during the years 2005 through 2015, the level of share pledging is associated with less volatile earnings and tightened R&D expenditures. The effect is more pronounced for firms with more severe ex-ante risk-shifting problems (i.e. higher financial distress risk and longer debt maturity). In addition, we find that share pledging is associated with enhanced innovation efficiency. Overall, our results highlight that share pledging constrains excessive risk-taking and improves the investment efficiency of risky projects through facilitating creditor monitoring. Keywords: Share pledging; Risk-Taking; Monitor; Creditor; Emerging Market Meng, Business School, Renmin University, Beijing 100872, China; Ni, Department of Finance, School of Economics and Wang Yanan Institute for Studies in Economics (WISE), Xiamen University, Fujian 361005, China; and Zhang, Chinese University of Hong Kong, Shenzhen 518172, China, Shenzhen Advanced Institute of Finance, International Monetary Institute, Renmin University.
Transcript of Share Pledging and Corporate Risk-Taking: Insights from ...
Share Pledging and Corporate Risk-Taking: Insights from the Chinese
Stock Market
Qingbin Meng, Xiaoran Ni, and Jinfan Zhang
Abstract
This paper documents that share pledging can discourage corporate risk-taking. We find that
during the years 2005 through 2015, the level of share pledging is associated with less
volatile earnings and tightened R&D expenditures. The effect is more pronounced for firms
with more severe ex-ante risk-shifting problems (i.e. higher financial distress risk and longer
debt maturity). In addition, we find that share pledging is associated with enhanced
innovation efficiency. Overall, our results highlight that share pledging constrains excessive
risk-taking and improves the investment efficiency of risky projects through facilitating
creditor monitoring.
Keywords: Share pledging; Risk-Taking; Monitor; Creditor; Emerging Market
Meng, Business School, Renmin University, Beijing 100872, China; Ni, Department of Finance, School of Economics and Wang Yanan
Institute for Studies in Economics (WISE), Xiamen University, Fujian 361005, China; and Zhang, Chinese University of Hong Kong,
Shenzhen 518172, China, Shenzhen Advanced Institute of Finance, International Monetary Institute, Renmin University.
1
I. Introduction
The issue of share pledging (i.e., the practice whereby corporate insiders use their shares
as collateral to secure loans from banks, trust firms, or security companies) is pervasive
around the world.1 In this paper, we ask the fundamental question of whether, and if so how,
share pledging affects corporate risk-taking. This question is important because risk shifting
sits at the heart of shareholder-creditor conflicts (Galai and Masulis (1976), Jensen and
Meckling (1976), Myers (1977), Parrino et al. (2005), Chava et al. (2008), Eisdorfer (2008),
Acharya et al. (2011)) and corporate risk-taking directly affects economic growth (Acemoglu
and Zilibotti (1997)).
We conjecture that share pledging may impede corporate risk-taking. Due to asymmetric
payoffs, creditors are more concerned about downside risk whereas shareholders are more
concerned about upside potential. This risk-shifting (i.e., asset substitution) problem is
especially noteworthy in emerging markets where controlling shareholders possess exclusive
control rights and tend to undertake excessive risk, diverting the upside gains for private
benefits while leaving the costs of failure to creditors (Shleifer and Vishny (1997), Lin et al.
(2011)). Collaterals with high-liquidation value release additional information about
borrowers, enabling creditors to discipline borrowers and protect themselves in the case of
default (Picker (1992), Shleifer and Vishny (1992), Rajan and Winton (1995), Campello and
1 In the United States, U.S. corporate executives and directors had, by the end of 2015, pledged at least US$15 billion of
their own company stock holdings to secure personal loans.
(https://www.reuters.com/article/us-usa-executives-loans-idUSKCN0T61Y620151117).
In India, on April 30, 2016, the Minister of State for Finance Jayant Sinha informed the Lok Sabha that on the country’s top
two stock exchanges (i.e., the Bombay Stock Exchange (BSE) and the National Stock Exchange (NSE)) promoters of 798 of
the total 4,268 firms listed on the BSE, and 570 of the 1,633 NSE-listed companies had pledged their shares
(https://economictimes.indiatimes.com/over-1368-promoters-of-listed-companies-pledge-shares/articleshow/52159656.cms).
2
Giambona (2013), Cerqueiro et al. (2016), Keil and Müller (2016)).2 Serving as additional
collaterals, pledged shares may help creditors learn about firms’ performance and constrain
corporate insiders’ risk-shifting incentives. Also, as large price declines in a stock will trigger
margin calls, forcing borrowers to sell other shares to raise funds and lose control of the
company, or pledge additional shares as surety, risk-averse corporate insiders who value the
control rights may forgo risky projects to prevent potential margin calls (Dou et al. (2017),
Chan et al. (2018)).3
Alternatively, share pledging can also encourage risk-taking. As the practice of using
stocks as collateral can limit insiders’ liability to the shares pledged while retaining the upside
potential of the cash flow rights, share pledging can create an option-like incentive for
corporate insiders (Margrabe (1978), Ekström and Wanntorp (2008), Chen and Hu (2017)).
Therefore, the option-like feature encourages shareholders to engage in more risk-taking
activities.
Based on our above analysis, whether share pledging encourages or impedes corporate
risk-taking is an empirical question. The Chinese stock market facilitates the ability to tackle
this question for at least two reasons. First, China is the second largest economy in the world
and the practice of share pledging is pervasive. In the data sample that we use for our
2 Rajan and Winton (1995) theoretically analyze how collateral can improve lenders’ incentives to monitor. In particular,
they argue that in the presence of other claimants, monitoring is valuable because it allows a lender to demand additional
collateral if the borrower is at an increased risk of distress. Consequently, other public investors and creditors can take
increased collateralization as a sign that the borrower is in difficulty, the signal of which is stronger when the collateral either
depreciates quickly or is quite risky in the short-run. Cerqueiro et al. (2016) provide empirical evidence on how collateral
may complement monitoring. 3 For example, Jerry Moyes, the chief executive of Swift Transportation Co., which is one of the largest trucking firms in the
United States, has pledged more than US$600 million of his holdings in Swift as collateral for loans. The tremendous decline
(i.e., 52%) of stock prices in 2015 triggered margin calls that Moyes dealt with by pledging more Swift shares. In addition,
Michael Pearson, the CEO of Valeant Pharmaceuticals International VRX.TO, has pledged the stock as collateral to secure
loans about US$100 million. Shares of this company fell 14% during a single trading session after 1.3 million shares of the
company’s stock was dumped on the market in a margin call.
(https://www.wsj.com/articles/a-board-struggles-with-its-ceos-borrowing-1454031068,
https://www.reuters.com/article/us-usa-executives-loans-idUSKCN0T61Y620151117).
3
research, there are 1,581 companies involved in share pledging at the end of 2015, which
accounts for 61.1% of the total number of firms listed on China’s A-share stock market.4
Second, the disclosure is compulsive under the supervision of the China Securities
Regulatory Commission (henceforth CSRC), which is the counterpart of the Securities and
Exchange Commission in the US, making shareholder-level and firm-level statistics available
for researchers. In comparison, the reporting issues on pledged shares are still under heated
debate in other large economies like the United States (Hwang et al. (2016), Chen and Hu
(2017)). In Section II, we will discuss institutional details on share pledging in China.
We begin our research by conducting a regression analysis to examine the association
between share pledging and corporate risk-taking. We find that a higher level of share
pledging is associated with a lower tendency of risk-taking: on average, one standard
deviation increase in share pledging lowers earnings volatility by 5.1% of the sample mean,
and reduces research and development (R&D) expenditures by 35.8%, respectively.5
Although our primary findings imply that the amount of share pledging probably
determines corporate risk-taking behavior, we take steps to validate this assumption. It is
noteworthy that causality can run from corporate risk-taking to the decision of pledging
shares, and omitted factors can determine both the level of share pledging and the degree of
risk-taking. As such, we find that the negative relationship can be endogenous. To mitigate
this concern, we resort to four identification strategies: the propensity-score matching method,
4 According to the report of Sinolink
(https://www.scmp.com/business/markets/article/2095530/sell-chinas-pledged-stocks-may-be-double-hong-kongs-gdp), in
mid-2017 Chinese listed firms have had 14% of their shares pledged as collateral, accounting for about 11% of the total
market capitalization of yuan-traded equities in Shanghai and Shenzhen, which outweighed Hong Kong’s gross economic
output of HK$2.5 trillion (US$320 billion) in 2016. 5 The dependent variable is in logarithmic form when estimating the relation between share pledging and R&D expenditures,
which enables us to use the current level of R&D expenditures as the benchmark when interpreting the economic
significance.
4
the Heckman two-stage approach, differences-in-differences (DiD) analysis, and instrumental
variable (IV) analysis.
We first use the propensity-score matching method to address the concern that as firms’
decisions are not random, firms with and without pledged shares can be fundamentally
different across several cross-sectional and time-series factors.6 We select comparable
counterparties (i.e., control firms) from firms with a zero amount of share pledging within the
same year and the same industry for firms that engage in share pledging (i.e., treated firms).
After successfully constructing the control group, our estimation results are quantitatively
similar to the OLS results, providing further support for our premise that an increase in share
pledging dampens corporate risk-taking incentives.
We also employ Heckman’s (1979) two stage model to address the self-selection issue of
pledging shares. The estimation results provide little support for the notion that the observed
negative relationship is due to a self-selection problem, which provides additional support
that share pledging discourages corporate risk-taking.
To further deal with potential endogeneity concerns, we employ two alternative
identification strategies. First, we explore a regulatory change in 2013 that permits security
companies to provide finance based on pledged shares from borrowers as a quasi-exogenous
shock to share pledging.7 As security companies require lower interest rates, have fewer
restrictions on the usage of the loans, and approve transactions in a quicker manner, this
regulatory change serves as a quasi-exogenous positive shock to share pledging. Our
6 As indicated by Shipman et al. (2017), the propensity-score matching method can alleviate one sort of special endogeneity
problem called “functional form misspecification”, which is typically associated with the traditional solution to endogeneity
problems using multiple-regression based methods. 7 We discuss this regulatory change in detail in Section II.
5
empirical setting resembles that of Fang et al. (2014) and Brogaard et al. (2017) who use
decimalization as an exogenous positive shock to stock market liquidity, i.e. the treatment
group consists of firms whose amount of pledged shares increases the most (in the top three
deciles of the sample) due to the regulatory change, and the control group consists of
propensity-score matched firms whose amount of pledge shares increases less but with
comparable firm characteristics. Using a differences-in-differences approach, we show that
following the regulatory change, treatment firms, relative to control firms, experience a
decrease in earnings volatilities corresponding to approximately 15.4% of the sample mean,
and a 52.0% decrease in R&D expenditures, which further suggest a negative causal effect of
share pledging on corporate risk-taking.
Second, we conduct IV analysis by using a two-stage least squares (2SLS) method. We
identify two instrumental variables by using the average amount of pledged shares of other
firms in the same industry (province) to capture the industry-level (province-level) factors to
instrument for share pledging. Our results indicate that the 2SLS estimations still yield a
negative and significant effect on share pledging, suggesting that share pledging deters
corporate risk-taking.
In the following section, we seek to distinguish between two possible welfare
implications of our main findings. On the one hand, the reduction on risk-taking indicates that
the ex-ante level of risk-taking is excessive and share pledging curtails over-investment in
risky investments. On the other hand, corporate insiders may under-invest in risky projects
after pledging shares. Using both the baseline settling and the DiD framework above, we
reveal that share pledging helps reduce redundant innovation inputs and improves the
6
successful rate of patenting: Although share pledging is negatively associated with R&D
expenditures, it contributes to an increased number of eventually granted invention patents.
Also, consistent with Li et al. (2018), we document that firms with pledged shares have a
higher market value. Therefore, it seems that share pledging alleviates shareholder-creditor
conflicts and improves the efficiency of risky investments.
In the next section, we address the concern that earnings smoothing may drive our main
findings. Since borrowers are concerned about sudden price declines, they may smooth their
earnings by falsifying the firm’s financial statements. Therefore, the observed decreases in
earnings volatility may result from increased earnings smoothing. We find that share pledging
is associated with higher earnings quality (i.e. reduced absolute discretionary accruals) and
less bad news hoarding (reduced likelihood of stock price crashes), which are inconsistent
with the earnings smoothing view but support the view that pledged shares provide additional
information about the borrower, which facilitates creditor monitoring.
We also explore the cross-sectional effects of share pledging. We predict that the risk
reduction effect of share pledging will be more pronounced for financially distressed firms
whose risk-shifting problems are severer. We partition the sample based on the degree of
ex-ante financial distress risk, and the estimation results confirm our conjectures. We further
split the sample according to firms’ ex-ante debt maturities and find that the effect of share
pledging is weaker for those with a higher ratio of short-term debt, implying that short-term
debt enables frequent negotiations and constrains risk-taking incentives ex-ante. In addition,
we document that the decrease in risk-taking holds for both state-owned enterprises
(henceforth SOEs) and non-state-owned enterprises (henceforth non-SOEs). These results
7
further indicate that share pledging impedes corporate risk-taking through curtailing
risk-shifting problems.
Last, we conduct a series of robustness checks. We include a series of additional control
variables as well as province-times-year fixed effects in the baseline regressions to control for
time-variant determinants of corporate risk-taking. We also use alternative measures of
pledging and corporate risk-taking. These results buttress our main findings.
This paper mainly contributes to two strands of the literature. Our paper adds to a
growing literature on the economic consequences of share pledging. Several previous studies
build their settings on the Taiwan Stock Exchange, and document that share pledges destroy
shareholder value (Chen and Hu (2007), Dou et al. (2017), Chan et al. (2018), Wang and
Chou (2018)). Based on evidence from India, Singh (2017) finds that share pledges for
personal loans destroy firm value, while share pledges for firm loans can increase firm value.
They generally base their argument on that corporate insiders try to consolidate their control
rights and prevent margin calls, which enhance their ability to extract private benefits of
control. By focusing on the practice of share pledging in China, we demonstrate that in an
environment where creditor protection is weak and investment is less efficient, in addition to
the channel mentioned above, share pledging can facilitate creditor monitoring and help
curtail excessive risk-taking. Therefore, our paper sheds some light on the recent policy
debate regarding the costs and benefits of share pledging.8
8 In March 2018, a new rule on pledged-stock loans came into effect in China, arguing that reckless borrowing by
controlling shareholders destabilizes the market. According to the new rule, a single pledge can’t exceed 50% of the stock’s
total traded volume on a public exchange. However, the Paper, a large state-backed news site, cites several brokers as saying
that the risks of pledging are not that high. In August 2018, in a forum organized by Premier Keqiang Li, Xipei Jiang, the
founder and Chairman of the Board of the Far East Holding Group Co., Ltd. (600869.SH), advised that the upper limit of the
stock pledge rate would be abolished, stating that such requirements dampen the confidence of entrepreneurs and market
participants.(https://www.caixinglobal.com/2018-01-15/regulators-limit-pledged-stock-loans-101197973.html,
http://news.sina.com.cn/c/2018-08-13/doc-ihhqtawy2708224.shtml (in Chinese)).
8
Our paper also adds to the literature on the determinants of corporate risk-taking. More
specifically, this paper is related to studies on how corporate insiders’ characteristics (Faccio
et al. (2011, 2016), Cassell et al. (2012), Cronqvist et al. (2012)) and the exposure to
idiosyncratic risk (Gormley and Matsa (2011), Panousi and Papanikolaou (2012),
Jagannathan et al. (2016)) affect corporate risk-taking. These studies largely examine the
effects of managerial risk aversion while our paper focuses on shareholders’ decisions on
pledging shares. Our study also relates to Acharya et al. (2011) and Favara et al. (2017) by
providing empirical evidence on the importance of creditors in shaping corporate insiders’
risk-taking incentives.
The remainder of this paper is organized as follows: Section II provides general back
ground information; Section III reports data and the empirical methodology used in this paper;
Section IV reports the estimation results of our main empirical tests; and Section V
concludes.
II. Background
In China, most listed firms have controlling shareholders, with highly concentrated
ownership structures (Jiang and Kim, 2015). To cope with difficulties in obtaining external
financing, controlling shareholders pervasively use their owned shares as collateral to borrow
money from brokerages, banks, or trust firms. In this way, they can secure credit without
altering their control rights (Singh, 2017). However, there are risks associated with pledged
shares, as regulators and analysts often warn that share-pledging can amplify a market
downturn. When a stock falls in the secondary market and reduces the value of the pledged
9
shares, borrowers have to take out more shares as collateral. Otherwise, they will have to sell
shares to pay back the principal.9
Both non-SOEs and SOEs can participate in share pledging. As the Chinse credit market
is tight, many small and medium-sized non-SOEs have scarce recourse to banks or other
sources of financing, and they commonly turn to pledge shares to finance companies as a way
of raising cash.10
For SOEs, they can pledge shares after getting approved by the
State-owned Assets Supervision and Administration Commission (henceforth SASAC).
Although possessing advantages in acquiring external financing, SOEs, especially those in
capital-intensive industries (i.g. mining, real estate, steel, etc.), also pervasively pledge their
shares. In June 2018, among the total 1,024 listed SOEs on the A-share market, 1,020 of them
have pledged their shares, which accounts for 12% of the total value of shares under pledging
for the whole market.11
The share-pledging loan business on the Chinese stock market has grown quickly.
Before 2013, only banks and trust firms can participate in share-pledging activities. On May
24, 2013, the Shanghai Stock Exchange and the China Securities Depository and Clearing
Co., Ltd. publish a rule (“The Guidance on Stock Pledge Repurchase Transactions,
Registration, and Settlement”) to guide the development of share pledging, permitting
security companies to provide finance to borrowers based on pledge shares.12
Compared with
banks and trust firms, security companies require lower interest rates, have fewer restrictions
9 https://www.scmp.com/business/markets/article/2095530/sell-chinas-pledged-stocks-may-be-double-hong-kongs-gdp. 10
https://www.reuters.com/article/us-china-markets-stocks-pledged-analysis/slump-persists-china-fails-to-stimulate-markets-h
obbled-by-pledged-shares-idUSKCN1MY0K8. 11 http://finance.sina.com.cn/roll/2018-06-27/doc-iheqpwqx7418663.shtml (in Chinese). 12 http://www.sse.com.cn/lawandrules/sserules/trading/stock/c/c_20150906_3976433.shtml (in Chinese).
10
on the usage of the loans, and approve transactions in a quicker manner.13
This regulatory
change has prominent real effects on share pledging activities. Since then, the share-pledging
loan business has grown even faster. The value of shares pledged has expanded by more than
Rmb200bn annually since 2014, according to S&P, taking the total to Rmb5tn ($720bn).14
The volume of pledged-stock loans surpasses 1 trillion RMB (US$ 146 billion) in August
2016 and 1.28 trillion RMB (US$ 188 billion) at the end of 2016, an 81% increase from
2015.15
According to a CSRC requirement, firms should make announcements when their large
shareholders (i.e., persons with more than 5% shareholdings) pledge their shareholdings for
loans, making our setting well-suited for a study on the economic impacts of share
pledging.16
Accordingly, we construct the primary measure of share pledging, Pledge, as the
amount of shares pledged by controlling shareholders as a percentage of total shares. We also
construct an indicator variable, Pledge_Dummy, which measures whether the firm id
involved in share pledging.
Table 1 shows our basic summary statistics on the share pledging of sample firms across
years and industries, respectively. Panel A reports the chronological distribution of our
sample firms. The ratio of firms involved in share pledging increased from 23.2% in 2010 to
61.1% in 2015, and the sample mean of Pledge doubled from 0.045 to 0.114 over this same
time period. Conditional on firms involved in share pledging (Pledge_Dummy=1), an average
firm pledges 19.7% of its total shares, and this ratio is rather stable over time. In Panel B, we
13 http://www.infzm.com/content/137459 (in Chinese). 14 https://www.ft.com/content/a342e01a-d758-11e8-a854-33d6f82e62f8. 15 https://www.caixinglobal.com/2018-01-15/regulators-limit-pledged-stock-loans-101197973.html. 16 http://www.csrc.gov.cn/pub/newsite/flb/flfg/bmgz/ssl/201012/t20101231_189729.html (in Chinese).
11
show that the majority of our sample firms are in the manufacturing sector, which is
consistent with the industrial structure of the Chinese stock market (Li et al. (2017)). Some
typical industries (e.g., Information technology, Real estate, Health, etc.) have an above
average fraction of firms involved in share pledging. More specifically and consistent with
some anecdotal evidence, among those involved in share pledging, real estate firms have the
highest pledging ratio (0.270).17
[Insert Table 1 here]
III. Data and Methodology
3.1 Data Description
We adopt annual data of Chinese A-share listed firms spanning from 2005 to 2015. The
financial variables and stock data are from the CSMAR Database, which discloses
information on share pledging by the top 10 largest shareholders. Then, we select
observations used in the empirical analysis according to the following procedures. First, we
exclude observations from the financial industry according to the classification standard of
the CSRC because these firms are fundamentally different from non-financial firms. In
addition, all of the continuous main variables are winsorized at the 1% and 99% percentiles in
order to alleviate the impact of outliers.
3.2 Construction of the Dependent Variable: Corporate Risk-Taking
Based on previous literature (e.g., Faccio et al. (2011), Boubakri et al. (2013)), our
17 In mid-2014, among the firms listed on the Chinese stock market with a share pledging ratio larger than 50%, nearly one
fourth of them belonged to the real estate industry. A fund manager indicates that this is because real estate firms are capital
intensive and have a larger demand for external financing (http://money.163.com/14/0626/07/9VL8IO1900253B0H.html (in
Chinese)).
12
primary measure of risk-taking is earnings volatility. Following Ljungqvist et al. (2017), we
construct the main measure of earnings volatility in the main context, Roa_Vol, based on
quarterly return on assets (ROA), which is calculated as the standard deviation of a firm's
ROA over the following four quarters. For robustness, we further construct various
alternative measures of earnings volatility based on quarter-level or year-level earnings as
well as several measures of stock return volatility.
We also consider risky investments that can contribute to increases in earnings volatility.
A large strand of the recent literature examines how various firm-level factors affect firms’
innovative activities, which are idiosyncratic and risky. We consider different stages of
innovative investments. Investment in R&D tends to be more discretionary with greater
uncertain outcomes rather than regular capital investments (Kim and Lu (2011)). Therefore,
we use R&D expenditures as a proxy for risky investment. More specifically, due to the right
skewness of R&D expenditures and patent counts, and following previous literature on
corporate innovation (e.g., He and Tian (2013)), we use the natural logarithm of R&D
expenditures in year t+1 (LogRd) in our analysis.18
3.3 Model Specification
To examine the impact of share pledging on corporate risk-taking, we estimate the
following equation:
𝑅𝑖𝑠𝑘𝑖,𝑡 = 𝛼 + 𝛽𝑃𝑙𝑒𝑑𝑔𝑒𝑖,𝑡
+ 𝛾𝐶𝑜𝑛𝑡𝑟𝑜𝑙𝑖,𝑡 + 𝜇𝑖(𝜑𝑗) + 𝜏𝑡 + 𝜀𝑖,𝑡 (1)
where i indexes the firm and t indexes the year. The coefficient on Pledge, 𝛽, captures the
18 When calculating LogRd, we add one before taking the log transformation so that we can keep those observations with
zero R&D expenditures and patent applications. Our results still hold if we only include observations with non-zero R&D
expenditures or non-zero patent applications in the regressions.

13
sensitivity of corporate risk-taking to share pledging, which is the variable of our main
interest. As a benchmark, we include both industry- (𝜑𝑗) and year- (𝜏𝑡) fixed effects in the
regression to account for systematic variations in corporate risk-taking across each year and
industry. In the majority of this paper, we further control for time-invariant firm-level factors
by including firm-fixed effects (𝜇𝑖) in our model. To account for the within-firm correlation
among different observations, we cluster the robust standard errors at the firm level.
Following previous studies, we include a vector of control variables as follows: firm size
(Size), leverage (Leverage), age (Age), market-to-book ratio (MB), operating cash flows
(Opcf), sales growth (Gsale), long-term investments (Capex), and ownership concentration
(Top1). Table A.1 in the Appendix provides detailed definitions of all of the variables we use
in this paper.
Table 2 reports the summary statistics of the main variables. Our final sample consists of
a maximum of 20,708 firm-year observations covering the years 2005 to 2015. The
distribution of Pledge is right-skewed. The mean of Pledge_Dummy is 0.388, indicating that
share pledging occurs in one-third of the firm-year observations. The mean and median of
Roa_Vol are 0.013 and 0.007, respectively. The distribution of LogRd has a wider range, with
a mean and median of 8.900 and 13.999, respectively.
[Insert Table 2 here]
IV. Estimates of Share Pledging on Corporate Risk-Taking
4.1 Basic Approach
We begin by estimating the effect of share pledging on corporate risk-taking. Our
14
estimation results are reported in Table 3. In Columns (1) and (2), we control for year- and
industry-fixed effects. In Column (1), we examine whether increases in share pledging leads
to more or less volatile earnings. The dependent variable ROA_Vol measures the degree of
earnings volatility. The coefficient on Pledge is negative and significant at the 5% level,
indicating that the pledging of stocks lowers firm risk measured by both earnings volatility
and stock return volatility.
In Column (2), we consider another aspect of corporate risk-taking, specifically firm
spending on innovative activities. The dependent variable is LogRd, the main measure of the
scale of R&D expenditures.19
The coefficient on Pledge is also negative and significant at the
1% level, which implies that share pledging hinders R&D investments. In Columns (3) and
(4), to control for time-invariant determinants of corporate risk-taking, we control for both the
year- and firm-fixed effects. The coefficients on Pledge are still negative and significant
throughout the three columns, which further confirm a deterioration effect of share pledging
on corporate risk-taking.
The negative effects of share pledging on the various measures of corporate risk-taking
are not only statistically significant but also economically significant. Column (3) shows that
on average, a one standard deviation increase in share pledging corresponds to a 5.1%
(=0.005*0.132/0.013) decrease in the earnings volatility of the sample mean. In Column (4),
as the dependent variable is in logarithmic form, we can calculate that compared with the
current level, a one standard deviation increase in share pledging leads to around a 35.8%
(=1-e-2.321*0.132
) decrease in R&D expenditures. The economic significance of these effects
19 As the disclosure of R&D expenditures was not compulsory in China prior to 2007 when the new accounting standard
came into effect, the sample period is 2006-2015 when LogRd in year t+1 is the dependent variable.
15
calls for further analysis on the causality issues of the negative relationship between share
pledging and corporate risk-taking.
[Insert Table 3 here]
4.2 Addressing Endogeneity Concerns
Our primary tests indicate that share pledging is associated with less volatile earnings
and decreased R&D expenditures. Although we argue that an increase in share pledging
causes a decline in corporate risk-taking, we notice that the endogeneity concerns may exist
because: (1) the causality can run from corporate risk-taking to the decision of pledging (e.g.,
shareholders of firms with a higher tendency of risk-taking may have a higher demand for
pledging shares as collateral for external financing), or (2) omitted factors can determine both
the level of share pledging and the degree of risk-taking (e.g., adverse shocks on the economy
may restrain the ability of corporate insiders to pledge their shares thereby discouraging
risk-taking).
In particular, the endogeneity bias could go in either direction, depending on how the
perceived economic consequences of corporate risk-taking affect the decision of shareholders
to pledge shares. On the one hand, if risk-taking is anticipated to increase the likelihood of
adverse events, then shareholders may be better off reducing the number of pledged shares to
reduce the risk of losing control. This line of reasoning implies that OLS estimates are biased
toward more pronounced negative results. On the other hand, if shareholders with high risk
preferences are eager to pledge shares in exchange for valuable external resources that are
necessary to the continuation of risky projects and avoiding default, the OLS estimates will
16
underestimate the causal decrease in corporate risk-taking that stems from share pledging.
In the previous section, the inclusion of firm-fixed effects in our regression models
removes any purely cross-sectional correlation between share pledging and risk-taking,
enabling us to compare periods with different levels of pledged shares within the same firm.
However, such a practice may not be sufficient to address endogeneity concerns. Therefore, in
the following sections, we employ propensity-score matching analysis, the Heckman
two-stage approach, differences-in-differences analysis, and instrumental variable analysis to
address the endogeneity concerns.20
4.2.1 Propensity-Score Matching Analysis
The choice of pledging shares is not random. Therefore, there could be systematic
differences between firms with and without pledged shares. To mitigate the concern that the
observed negative relationship between share pledging and corporate risk-taking are caused
by cross-sectional or time-series factors that affect both the decision of pledging and the
tendency of undertaking risk, we employ the propensity-score matching strategy (Rosenbaum
and Rubin (1983)). The treatment group consists of firms with a non-zero number of pledged
shares in a given year (Pld_Dummy=1). In an attempt to select “similar” firms to each firm
that pledges shares in a given year, we construct a control sample of firms that are matched to
the treated firms along a set of relevant firm characteristics where, to the extent possible, the
members of the control group differ only in their involvement in share pledging. The pool of
candidates to be chosen consists of firms with zero pledged shares (Pld_Dummy=0) that have
valid matching variables.
20 In the following sections, we will focus mainly on those regressions controlling for firm- and year-fixed effects in our
model.
17
We construct the control sample through the following procedures. First, we estimate a
logit model where the dependent variable equals one if a firm belongs to the treatment group
in a given year, and zero otherwise, controlling for all of the control variables in the baseline
regression as well as the year- and industry-fixed effects. Second, we use the estimated
coefficients to predict the propensity score of entering into the treatment group. Third, we use
the calculated propensity scores to perform a nearest-neighbor approach and select one or two
control firms for each observation in the treatment group and retain all pairs in the case of
multiple matching, with a propensity score match within 0.01.
In Table A.2 in the Appendix, we report the summary statistics for the examination of the
post-match differences between the treatment group and the control group. The balance test
shows that the treatment firms and the control firms are similar across all of the matching
variables, ensuring that the change in corporate risk-taking is caused only by the increase in
share pledging.
After we finish these procedures, in Table 4 we report our estimation results based on the
propensity-score-matched sample. The coefficients on Pledge are quantitatively in line with
the OLS results, further suggesting that compared to otherwise similar firms, firms with
pledged shares will have fewer tendencies to undertake risk.
[Insert Table 4 here]
4.2.2 Heckman Two-Stage Approach
In Table 5, we further address the self-selection issue of share pledging by employing a
Heckman (1979) two-stage approach. The first stage of this model is a Probit model with
18
Pledge_Dummy as the dependent variable, which estimates the choice of engaging in share
pledging. In the second stage, we include the inverse Mills ratio derived from the first stage
as an additional control variable. In Panel A, we observe that several firm characteristics are
significantly correlated with the tendency of pledging shares. In Panel B, the inverse Mills
ratio is statistically significant only in Column (2). More importantly, the coefficients on the
Pledge_Dummy are negative and significant, indicating that our main results still hold after
addressing potential self-selection issues.
[Insert Table 5 here]
4.2.3 Differences-in-Differences Approach
In the previous section, we show that there is a negative relation between share pledging
and corporate risk-taking. In this section, we use the differences-in-differences (DiD)
approach to determine the effect of a change in share pledging on corporate risk-taking. This
methodology compares the level of risk-taking of a sample of treatment firms whose amount
of pledge shares increases the most to that of control firms whose amount of pledge shares
increases less but that are otherwise comparable, before and after the regulatory change that
cause a quasi-exogenous shock to share pledging.
Specifically, we identify a regulatory change in 2013, namely the publication of a
guidance rule of share pledging (“The Guidance on Stock Pledge Repurchase Transactions,
Registration, and Settlement”), as a quasi-exogenous positive shock to share pledging. As
indicated in Section II, prior to 2013, only banks and trust firms can participate in
share-pledging activities. The rule permits security companies to provide finance based on
19
pledged shares from borrowers. This regulatory change appears to be a good candidate to
generate plausibly exogenous variation in share pledging for at least two reasons. First, it
directly affects share pledging while unlikely to directly affect corporate risk-taking. As
indicated by the general provision of the rule, the primary goal of the rule is “to regulate
share pledging activities, maintain the market order, and protect the legitimate rights and
interests of all parties involved in the transaction”, which has no direct relation with listed
firms’ decisions. Second, changes in share pledging surrounding this regulatory change
exhibit variation in the cross-section of firms. Hence, examining the change in risk-taking
following the change in share pledging due to the publication of the rule provides a
quasi-exogenous shock for our tests.
Our empirical setting resembles that of Fang et al. (2014) and Brogaard et al. (2017)
who use decimalization as an exogenous positive shock to stock market liquidity. To begin
with, we construct a treatment group and a control group of firms using propensity score
matching. Specifically, we measure the change in Pledge from the pre-regulation year (2012)
to the post-regulation year (2014), and construct a variable ΔPledge-1 to +1 for each firm.
Based onΔPledge-1 to +1, we then sort the sample firms into deciles and regard the top three
deciles of the distribution representing the firms experiencing the largest increase in share
pledging. Finally, we employ a propensity score matching algorithm to identify matches
between firms in the top three deciles and other firms.
When applying propensity score matching, we estimate a Probit model based on firm
characteristics by the end of 2012, the pre-regulation year, including all control variables
from Equation (1) as well as industry-fixed effects. The dependent variable is equal to one if

20
the firm-year belongs to the treatment deciles (top three deciles) and zero otherwise. We then
use the estimated propensity scores to perform nearest-neighbor propensity score matching,
with a propensity score match within 0.01. In particular, each firm in the top three deciles
(treatment firms) is matched to a firm from the rest deciles with the closest propensity score
(control firms).21
We end up with 306 unique pairs of matched firms.
The validity of the DiD estimator critically depends on the parallel trend assumption, i.e.
the underlying trends in the outcome variable should the same for both groups. Following
Fang et al. (2014) and and Brogaard et al. (2017), we perform several diagnostic tests to
verify that the assumption holds in our setting. We summarize the results of three-fold tests in
Table A.3 in the Appendix.
In Panel A, we re-run the Probit model used to estimate propensity scores restricted to
the matched sample, and report estimation results in Column (2). Compared to the estimation
results on the baseline Probit model in Column (1), the coefficients on all the explanatory
variables have smaller magnitude and are not statistically significant, suggesting that there
are no observable different characteristics exist between the treatment and control groups
before the regulatory change. Panel B reports the distribution of the propensity scores for
both groups and their differences. We can see that the difference between the propensity
scores of the treatment firms and those of the control firms is trivial, indicating that the two
groups’ propensity scores line up closely. In Panel C, we report the univariate comparisons
between the treatment and control firms’ pre-regulation characteristics. As shown, none of the
observed differences between the treatment and control firms’ characteristics is statistically
21 If a firm from the pool of control firms is matched to more than one treatment firm, we retain the pair for which the
distance between the two firms’ propensity scores is the smallest.
21
significant, suggesting that the propensity score matching process removes meaningful
observable differences. Therefore, it is more likely that the observed changes in corporate
risk-taking (if any) are caused only by the exogenous change in share pledging due to the
regulation.
We then define Treat as an indicator variable of the treatment group. The variable Post13
is an indicator variable of the regulatory change, which equals to one if it is year 2013 or after,
and zero otherwise. The coefficient on Treat*Post13 is the one with main interest, which
captures the change in dependent variables for firms with highest increases in share pledging
relative to other firms subsequent to the regulatory change.22
We report estimation results in Table 6. In Columns (1)-(2), we observe negative and
significant coefficients on Treat*Post13, indicating that the positive shock to share pledging
discourages corporate risk-taking. On average, following the regulatory change, treatment
firms, relative to control firms, experience a decrease in earnings volatilities corresponding to
approximately 15.4% (=0.002/0.013) of the sample mean, and a 52.0% (=1-e-0.734
) decrease in
R&D expenditures, which further suggest a negative causal effect of share pledging on
corporate risk-taking.
To further confirm that the parallel trend assumption holds, we conduct a timing test in
order to observe the dynamics of corporate risk-taking surrounding the regulatory change.
Specifically, we estimate the following model:
𝑅𝑖𝑠𝑘𝑖,𝑡 = 𝛼 + 𝛽0𝑇𝑟𝑒𝑎𝑡𝑖 ∗ 𝐷12𝑡 + 𝛽1𝑇𝑟𝑒𝑎𝑡𝑖 ∗ 𝐷13𝑡 + 𝛽2𝑇𝑟𝑒𝑎𝑡𝑖 ∗ 𝐷14𝑡 + 𝛽3𝑇𝑟𝑒𝑎𝑡𝑖 ∗
𝐷15𝑡 + 𝛾𝐶𝑜𝑛𝑡𝑟𝑜𝑙𝑖,𝑡 + 𝜇𝑖 + 𝜏𝑡 + 𝜀𝑖,𝑡 (2)
22 One concern regarding our DiD setting is changes in economic conditions contemporaneous with the regulatory change
may differently affect the treatment and control groups and are correlated with corporate risk-taking. Therefore, we include
province-times-year fixed effects to control for time-variant macro-level omitted variables when estimating the model.
22
As the regulatory change occurs in 2013, we introduce four dummy variables, D_12, D_13,
D_14, and D_15, which equal to one if it is year 2012/2013/2014/2015, respectively.23
In
Columns (3)-(4), we observe statistically insignificant coefficients on Treat*D_12, suggesting
that the parallel trend assumption of the DiD approach is not violated. We generally observe
significant coefficients only after the regulatory change, implying that consistent with our
main findings, the plausibly exogenous increase in share pledging triggers the decrease in
corporate risk-taking. Overall, these findings are consistent with previous sections.
[Insert Table 6 here]
4.2.4 Instrumental-Variable Approach
To further mitigate concerns on the potential endogeneity problem, we construct
instruments for share pledging and use the 2SLS approach to correct for the potential bias due
to endogeneity in the decision of pledging shares. Following Bernile et al. (2018), we
construct two instrument variables, Pledge_IV_Ind (i.e., the average Pledge in the same
CSRC 2-digit industry) and Pledge_IV_Prov (i.e., the average Pledge in the same province),
excluding firm i’s own level of Pledge. This sort of IV approach has also been adopted in
other studies including Laeven and Levine (2009), Faccio et al. (2011), among others. The
logic of the construction of these IVs rests on the idea that the average number of pledged
shares of other firms in the same industry (i.e., province) captures the industry (i.e., province)
-level factors explaining share pledging, while the decision of pledging shares of one firm
does not influence the degree of share pledging of other firms. Therefore, Pledge_IV_Ind and
23 As we control for year- and firm-fixed effects in the model, the effects of Treat and individual items of
D_12/D_13/D_14/D_15 are absorbed by the fixed effects.

23
Pledge_IV_Prov isolate the more enduring and more exogenous component of share pledging.
However, as indicated by Bernile et al. (2018), while it seems reasonable that these IVs satisfy
the relevance condition, it is less clear whether it is safe to assume that they satisfy the
exclusion restriction, as the similarities in risk preferences of comparable firms may induce
them to pledge a like proportion of shares. Therefore, we use the IV regressions only to
further validate the broad inferences we draw from our baseline analysis and interpret the
results with caution.
Table 7 shows our estimation results of the 2SLS analysis.24
More specifically, Columns
(1) and (3) show our estimation results for the first-stage regression. The coefficients on both
Pledge_IV_Ind and Pledge_IV_Prov are positive and significant. The F-statistic is greater than
10, indicating that our instruments are empirically relevant with share pledging according to
the criteria suggested by Stock and Yogo (2005). In addition, the Hansen J-tests in Columns (2)
and (4) fail to reject the orthogonality condition at the 10% level.
After confirming the validity of the instrumental variables, the second-stage IV estimates
the relationship between share pledging and corporate risk-taking by instrumenting the main
explanatory variable with these two instruments. For the second-stage regressions, the
coefficients on Pledge are significant at better than the 5% level, suggesting that share
pledging has a negative causal effect on corporate risk-taking.
It is noteworthy that the negative impact of the instrumented share pledging is an order of
magnitude larger than the OLS estimates, suggesting that the latter are positively biased. In
turn, this suggests that some firms with higher risk preferences may have a stronger demand
24 During 2015, the Chinese stock market experienced a tremendous crash, and many financial institutions voluntarily halted
stock shorting activities in response to pressures from the CSRC. Therefore, we do not include observations in 2015 for this
test.
24
for pledging shares as collateral to facilitate external financing, which potentially biases the
estimated negative effect of share pledging on corporate risk-taking toward zero.
[Insert Table 7 here]
In summary, despite all of the tools employed (i.e., firm fixed effects, propensity-score
matching, the Heckman two-stage model, the DiD estimation, and the IV approach), we find
little evidence that the issue of endogeneity explains the negative relationship between share
pledging and corporate risk-taking. While these tests do not perfectly eliminate endogeneity
concerns, they strongly indicate that our results are unlikely driven by reverse causality and
unobserved firm heterogeneity. We will further check for the robustness of our results in the
following sections.
4.3 The Effects on Innovation Output
Although we document a strong negative relationship between share pledging and firm
risk-taking, the economic implications of such findings are unclear. In this section, we seek to
distinguish between two competing interpretations: (1) share pledging curtails ex-ante
excessive risk-taking thereby increasing firm value; and (2) increased downside risk
accompanied with share pledging induces firms to undertake suboptimal risk, thereby
negatively affecting firm value. Specifically, we measure the output of firms’ risk-taking by
focusing on their patent applications. Compared with R&D expenditures, a patent is a
superior measure because it captures the combined effect of all of the innovation inputs
including R&D, human capital, and other intangibles (Agarwal et al. (2017)). We report

25
estimation results in Table 9.
There are three types of patents in China: invention, utility model, and design patents.
Among the three types of patents, the invention patent, which is granted for new technical
solutions relating to a product, a process, or an improvement, is the patent type with the
highest innovation value (He et al. (2018)). According to the requirement of amended
Chinese Patent Law in 2008, invention patents need to “have prominent substantive features
and represent notable progress”.25
Specifically, invention patent applications undergo
substantive examination, which can last for two to four years before an invention patent is
granted. By comparison, design and utility model patents, which are subject only to
preliminary examinations, are more quickly granted (i.e., six months to one year grant lags)
and are generally viewed as representing minor innovations (He et al. (2018)). The existing
literature largely uses the number of citations a patent receives as a proxy for patent quality.
However, there is no sufficient and reliable source on citations for Chinese patents. Therefore,
we use the number of ultimately successful invention patent applications (i.e., those that are
filed and eventually granted), Patent1_Grant, to measure innovation quality. We therefore
construct LogPatent1_Grant as the dependent variable by taking the natural logarithm of one
plus Patent1_Grant.
In Columns (1)-(2), Panel A, estimation results show that share pledging has a
significant positive effect on patent quality in year t+1 and year t+2. In sum, we find that
share pledging improves the successful rate of innovative projects, as firms obtain more
granted invention patents with tightened R&D expenditures. That is, the effectiveness of
25 Source: http://www.djrd.gov.cn/html/flfg/fl/18/03/4815.html (in Chinese).
26
risk-taking improves after firms pledge their shares.
Due to the lag between the application date and the grant date, some patents may not
have been granted but only applied for, or filed. This truncation problem can be more severe
for the last several years of our database coverage. We find that the applications for invention
patents are usually granted in two years and in no more than five years. Therefore, we use a
truncated sample from 1990 to 2010 to compute the application-grant time of invention
patents. Then, we use the following formula to correct the truncation bias of patent counts
from 2011 through 2016:
𝑃𝑎𝑡𝑒𝑛𝑡1−𝐺𝑟𝑎𝑛𝑡𝑎𝑑𝑗 =𝑃𝑎𝑡𝑒𝑛𝑡1−𝐺𝑟𝑎𝑛𝑡
∑ 𝑊𝑠 2016−𝑡𝑠=0 | 2011 ≤ 𝑡 ≤ 2016⁄ (3)
where Patent1_Grantadj refers to the quantity of truncation-adjusted patents, and Ws is the
percentage of patents applied for in a given year that are granted in s years according to our
calculation. In Columns (3) and (4), Panel A, based on the truncation-adjusted patent count,
we calculate the dependent variable LogPatent1_Grantadj, which is the natural logarithm of
one plus Patent1_Grantadj. We obtain similar results as in Columns (1) and (2). In Panel B,
we employ the PSM-DID approach used in Section 4.2.3 to address potential endogeneity
concerns between share pledging and innovation output, and the above findings still hold.
In Panel C, to further assess whether the increase in innovation output is beneficial to
shareholders, we directly examine the relationship between share pledging and firm value. In
Columns (1)-(2), estimation results indicate that share pledging is positively associated with
Tobin’s Q in the current year and the next year. This result tends to be causal, as we obtain
positive and significant coefficients on Treat*Post13 based on a PSM-DID approach in
Columns (3)-(4). These findings are consistent with Li et al. (2018) who document that share
27
pledging is positively associated with firm value in China. Our evidence indicates that
improved investment efficiency in risky projects can be a possible channel through which
share pledging improves firm value, and we illustrate this point through more rigorous
empirical tests.
In summary, our findings indicate that share pledging curtails corporate insiders’ ex-ante
tendencies of overinvestment in risky projects and improves firm value. Although prior
literature has shown that shareholder pledges are associated with lower firm value in other
institutional contexts such as the Taiwanese and Indian capital markets (Chen and Hu (2007),
Dou et al. (2017), Singh (2017), Chan et al. (2018), Wang and Chou (2018)), we argue that
opaque information environment and weak creditor protection in our setting may exaggerate
risk-shifting problems, which can enhance the marginal benefits of pledged shares as
collaterals with high-liquidation value to release updated information about borrowers and
facilitate creditor monitoring.
[Insert Table 8 here]
4.4 Earnings Smoothing: An Alternative Explanation
In the main context of the paper, we employ earnings volatility as one of the main
measures of risk-taking. An alternative explanation regarding less volatile earnings is that the
increased downside risk associated with share pledging induces corporate insiders to smooth
earnings (e.g., conceal negative information). Therefore, earnings manipulation motives may
drive our results. To address this issue, we conduct additional tests and report our estimation
results in Table 10.
28
In Columns (1) and (2), we examine whether share pledging is associated with worsened
earnings quality. We employ two measures of earnings quality, AbsDac_Jones and
AbsDac_DD, as the dependent variables, constructed based on the existing accounting
literature of Jones (1991), Dechow and Diche (2002), and Cornett (2008). In contrast to the
conjecture of this alternative explanation, we obtain negative and significant coefficients on
Pledge, indicating that share pledging actually implies a lower degree of absolute
discretionary accruals, i.e. improved earnings quality.
Previous research also shows that a lack of information transparency increases future
crash risk by enabling corporate insiders to hide and accumulate bad news (Jin and Myers
(2006), Hutton et al. (2009), Kim et al. (2011)). Therefore, to further assess whether share
pledging induces corporate insiders to avoid downside risk through hiding bad news, we
follow Chen et al. (2001) to construct two positive measures of stock price crash risk, Ncskew
and Duvol, respectively.26
In Columns (3) and (4), we obtain negative and significant
coefficients on Pledge, suggesting that share pledging constrains corporate insiders to conceal
adverse operating outcomes and reduces the likelihood of stock price crashes. These findings
indicate that share pledging conveys additional information to creditors, which helps us pin
26 In this paper, Ncskew indicates a negative coefficient of skewness, which is calculated by taking the negative of the third
moment of daily returns, and dividing it by the standard deviation of daily returns raised to the third power. Duvol indicates
down-to-up volatility. To calculate this measure, we separate all of the days with returns below the period mean (i.e., ‘‘down’’
days) from those with returns above the period mean (i.e., ‘‘up’’ days), and compute the standard deviation for each of these
subsamples separately. We then take the log of the ratio of the standard deviation on the ‘‘down’’ days to the standard
deviation on the ‘‘up’’ days. Following the crash risk literature on the Chinese stock market (e.g., Xu et al. (2014), Li et al.
(2017)) we include several additional control variables in our model. Definitions of these variables are presented in Table
A.1 in the Appendix.

29
down the alternative hypothesis and buttress our main findings.27
These findings are also in
line with the research of Asija et al. (2014) who find that as the ready availability of daily
collateral values increases the intensity of monitoring by lenders, share pledging reduces the
likelihood of accruals-based earnings management in Indian listed firms.
[Insert Table 9 here]
4.5 Cross-Sectional Analysis
In Table 10, we conduct cross-sectional tests to further identify the effect of share
pledging on corporate risk-taking. To mitigate the concern that the variables used to split the
sample themselves can be affected by increased share pledging, we use the values in the
previous year. Our main argument assumes that share pledging impedes corporate risk-taking
through informing creditors of information about borrowers and curtailing risk-shifting
problems. Therefore, we expect that the baseline findings will be more pronounced for firms
in which ex-ante risk-shifting problems are more severe.
Our tests are fourfold. In Panel A, we re-estimate our results by partitioning the whole
sample into subsamples of low or high ex-ante financial distress risk measured by Altman’s Z
score in the previous year. We regard firms with below and above median Altman’s Z scores
as having higher or lower financial distress risk and hence more or less severe risk-shifting
27 In an influential paper in Chinese, Xie et al. (2016) also find that share pledging in China is negatively associated with the
likelihood of stock price crashes. We notice that a concurrent paper by DeJong et al. (2018) argue that Chinese firms with
controlling shareholders pledging their shares engage in more positive discretionary accruals. We emphasize that our setting
is different from theirs in several aspects. First, they focus on positive discretionary accruals, while we focus on the absolute
value of discretionary accruals, since both positive and negative discretionary accruals can reduce earnings quality and
increase stock price crash risk (Hutton et al., (2009); Zhu, (2016)). Second, we control for firm-level omitted variables
through including firm- and year-fixed effects in the model, while they only control for industry- and year-fixed effects in the
model. Third, our main measure of share pledging is a percentage of shares measure while they focus on a dummy variable
indicating whether a firm has pledged shares in a given year. In un-tabulated tests, we confirm that the negative relation
between share pledging and earnings quality also survives in the PSM-DID setting used in Section 4.2.3.
30
problems. Our estimation results indicate that the negative effects of share pledging are
significant for firms with a below median Altman’s Z score. We document no significant
effect of shareholder pledging for firms with an above median Altman’s Z score.
In Panel B, we use a firm’s leverage ratio in the previous year as an indicator of ex-ante
financial distress risk (Gormley and Matsa (2016)). Here, above and below median leverage
ratio values indicate higher or lower financial distress risk. Our estimation results imply that
the coefficient on Pledge loads negative and significant for firms with an above median
leverage ratio, but are statistically insignificant for firms with a below median leverage ratio.
In Panel C, we examine whether share pledging has heterogeneous effects with respect to
ex-ante debt maturities. Barnea et al. (1980) suggest that firms’ risk-shifting can be minimized
by issuing shorter maturity debt as short-term debt requires more frequent renegotiations and
hence allows for more scrutiny from creditors. Therefore, we predict that the effect of share
pledging will be less pronounced for firms with ex-ante shorter debt maturities (i.e., those
firms with a higher ratio of short-term debt). We find that the decrease in corporate risk-taking
concentrates in firms with a below median ratio of short-term debt. By comparison, the effect
is statistically insignificant for firms with an above median ratio of short-term debt.
In Panel D, we split the sample into SOEs and non-SOEs according to the ultimate
shareholder of firms. It shows that the coefficients on Pledge are negative and significant for
both SOEs and non-SOEs. It is noteworthy that the effect is marginally more significant for
SOEs, which tends to reflect the fact that Chinese SOEs have lower investment efficiency
because of government intervention (Chen et al., 2011; Hao and Lu, 2018). Our results
indicate that although SOEs receive political favors from the government that are helpful in
31
mitigating the impact of negative events (Yu et al., 2015), under the monitoring from the
SASAC, SOEs managers also undertake less risk to prevent potential margin calls in order to
preserve their career prospects.
Combining the findings above, the evidence suggests that the decrease in corporate
risk-taking induced by increased share pledging is more pronounced for firms with more
severe ex-ante risk-shifting problems (lower Altman’s Z score, higher debt ratio, and longer
debt maturities), i.e. a higher likelihood of firm insiders to undertake excessive risk at the
expense of creditors, and SOEs and non-SOEs behave similarly in risk-taking decisions after
pledging shares.
[Insert Table 10 here]
4.6 Robustness Checks
4.6.1 Alternative Specifications
In this section, to check for the robustness of our main findings, we alter our baseline
regression through changing the continuous main explanatory variable to a dummy variable,
including additional control variables and controlling for high-degree fixed effects. We report
our estimation results in Table 11.
(1) Using a dummy variable to measure the presence of share pledging. In Columns (1)
and (2), we perform tests by changing the main explanatory variable to a dummy,
Pld_Dummy, which equals to one if the number of stocks pledged by shareholders is larger
than zero. The negative and significant coefficients on Pld_Dummy are consistent with our
main findings.
32
(2) Including additional control variables. Corporate governance is an important
determinant of corporate risk-taking (John et al. (2008)). Therefore, in Columns (3) and (4),
we include a series of internal and external governance measures applied to Chinese firms in
the baseline model, including board independence (Indratio), institutional ownership (Inst),
analyst coverage (Coverage), control wedge (Separation), auditor quality (Audit), and
industry concentration (HHI).28
We obtain quantitatively similar results in these two columns.
(3) Including province*year-fixed effects. Although we use firm-fixed effects in most of
our regressions to capture the effects of time-invariant and unobservable omitted variables,
the time-varying effects may also cause our main findings to be spurious. For example, the
fluctuation of the macro-economy may determine the decision of pledging shares and
undertaking risk simultaneously. Also, several prior studies indicate that regional-level factors
such as religion (Hilary and Hui (2009)), culture (Li et al. (2013)), and the strength of debt
enforcement (Favara et al. (2017)) can affect firms’ attitudes toward risk-taking. In addition,
it is noticeable that in China, market development is largely segmented at the provincial level.
Therefore, in Columns (5) and (6), we introduce province-times-year-fixed effects when
estimating the baseline regressions to control for the time-variant regional omitted variables.
Our baseline results are largely unchanged.
[Insert Table 11 here]
4.6.2 Additional Robustness Checks
Thus far, we have documented a negative relationship between share pledging and
28 For detailed definitions on these variables, please refer to Table A.1 in the Appendix.
33
corporate risk-taking. We interpret our primary findings as shareholders prefer lower risk. In
this section, we conduct a series of robustness checks to further buttress our main findings.
We re-estimate the baseline regressions by using various alternative measures of earnings
volatility, stock return volatility, and R&D expenditures to replace the ones investigated in the
previous sections. Our estimation results are reported in Table 12.
(1) Other model specifications. In line with the above section, we estimate the baseline
model using other specifications in Panel A. In Columns (1)-(2), we exclude the sample
period corresponding to the global financial crisis (2008-2009). These macro shocks result in
a large portion of individual firms have declining stock prices, and firms may adjust the
decision of pledging shares and investment in risky projects simultaneously during that time.
In Columns (3)-(4), we adopt the two-way cluster strategy. Our baseline findings still hold.
(2) Alternative quarter-level measures of earnings volatility. In Panel B, we construct
several alternative measures of earnings’ volatility based on quarter-level earnings. In
Column (1), we first calculate industry-adjusted ROA (i.e., the difference between a firm’s
ROA and the average ROA across all firms in the same CSRC 2-digit industry) and then
calculate ROA_Vol_Adj (i.e., the standard deviation of a firm's industry-adjusted ROA over
the following four quarters). In this way, we can remove the industry-level economic cycle
influence and obtain a cleaner measure of the level of risk resulting from corporate operating
decisions (Faccio et al. (2011)). In Column (2), we alter the calculation process of ROA_Vol
by using a longer time span, where the dependent variable ROA_Vol_8q is calculated as the
standard deviation of a firm's ROA over the following eight quarters. In Columns (3) and (4),
we use return on equity (ROE) as the measure of earnings and calculate ROE_Vol, the
34
standard deviation of the ROE over the following four quarters, and ROE_Vol_8q, the
standard deviation of the ROE over the following eight quarters, respectively. The negative
effect of share pledging is robust to these changes.
(3) Alternative year-level measures of earnings volatility. In Panel C, following the
research of Faccio et al. (2011) and Boubakri et al. (2013), we construct a measure of
earnings volatility based on yearly ROA, ROA_Vol_3y, which is calculated as the standard
deviation of a firm's industry-adjusted ROA over the following three years. We also employ
ROA_Mm_3y measured by the difference between the maximum and minimum of a firm's
industry-adjusted ROA over a three-year interval as the dependent variable. The coefficients
on Pledge are negative and significant in both of the columns. In Columns (3) and (4), we
calculate the dependent variables corresponding to Columns (1) and (2), ROA_Vol_4y and
ROA_Mm_4y, based on four-year intervals.
(4) Measures of stock return volatility. In Panel D, following several previous studies
(e.g., Gormley and Matsa (2016), Shue and Townsend (2017)), we use measures of stock
return volatility to proxy for the degree of risk-taking. For each firm in a given year, we
calculate the standard deviation of weekly returns (Ret_Vol) and daily returns (Ret_Vol_d),
and use them as dependent variables in Columns (1) and (2), respectively. In Columns (3) and
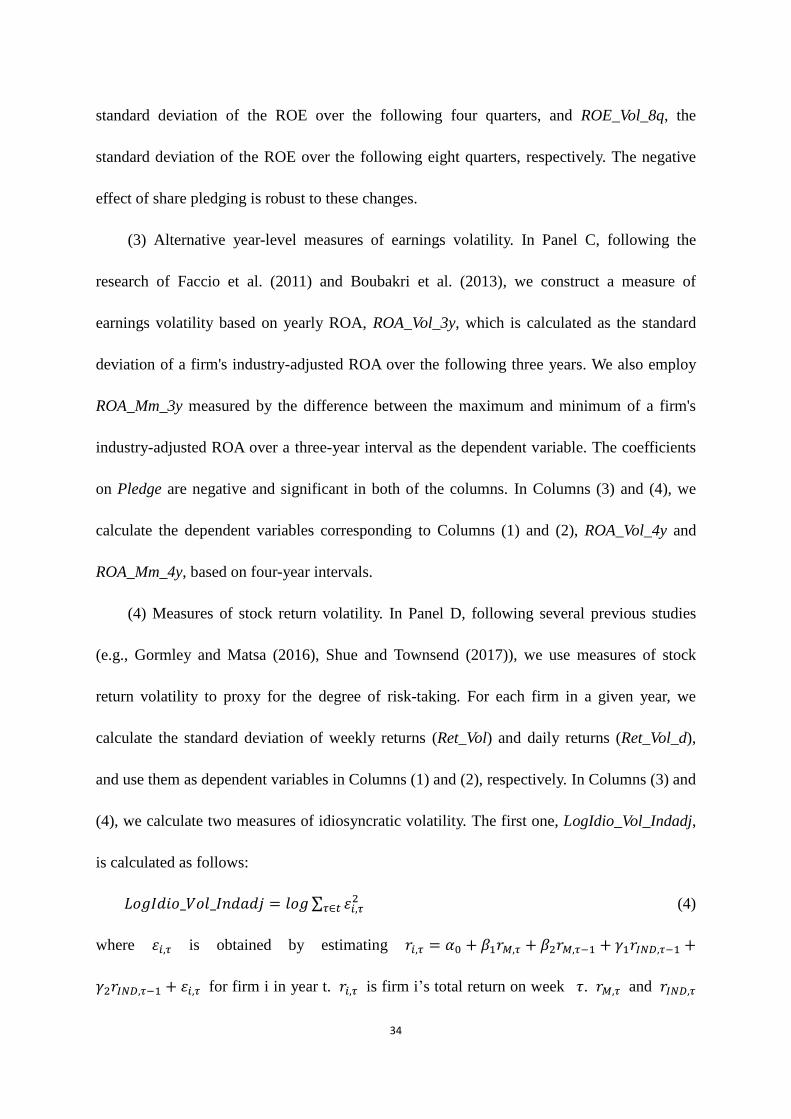
(4), we calculate two measures of idiosyncratic volatility. The first one, LogIdio_Vol_Indadj,
is calculated as follows:
𝐿𝑜𝑔𝐼𝑑𝑖𝑜_𝑉𝑜𝑙_𝐼𝑛𝑑𝑎𝑑𝑗 = 𝑙𝑜𝑔 ∑ 𝜀𝑖,𝜏2
𝜏∈𝑡 (4)
where 𝜀𝑖,𝜏 is obtained by estimating 𝑟𝑖,𝜏 = 𝛼0 + 𝛽1𝑟𝑀,𝜏 + 𝛽2𝑟𝑀,𝜏−1 + 𝛾1𝑟𝐼𝑁𝐷,𝜏−1 +
𝛾2𝑟𝐼𝑁𝐷,𝜏−1 + 𝜀𝑖,𝜏 for firm i in year t. 𝑟𝑖,𝜏 is firm i’s total return on week 𝜏. 𝑟𝑀,𝜏 and 𝑟𝐼𝑁𝐷,𝜏
35
are the market-value-weighted market returns and industry returns on week 𝜏, respectively.
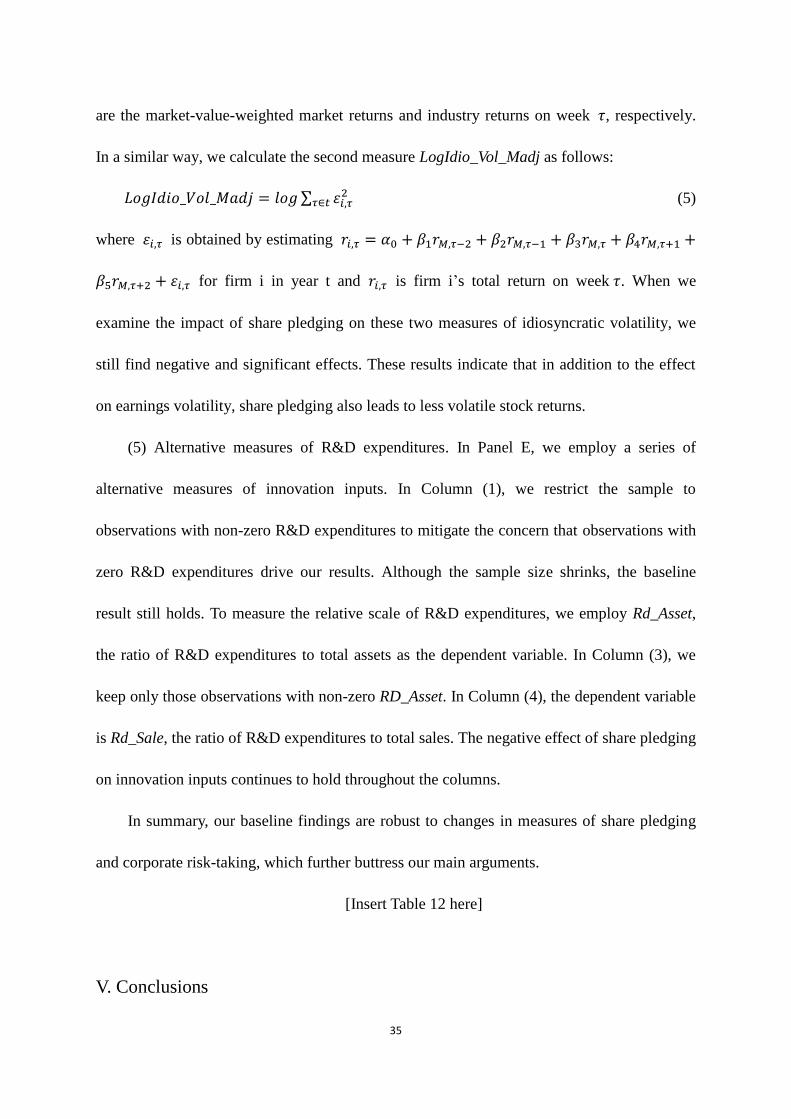
In a similar way, we calculate the second measure LogIdio_Vol_Madj as follows:
𝐿𝑜𝑔𝐼𝑑𝑖𝑜_𝑉𝑜𝑙_𝑀𝑎𝑑𝑗 = 𝑙𝑜𝑔 ∑ 𝜀𝑖,𝜏2
𝜏∈𝑡 (5)
where 𝜀𝑖,𝜏 is obtained by estimating 𝑟𝑖,𝜏 = 𝛼0 + 𝛽1𝑟𝑀,𝜏−2 + 𝛽2𝑟𝑀,𝜏−1 + 𝛽3𝑟𝑀,𝜏 + 𝛽4𝑟𝑀,𝜏+1 +
𝛽5𝑟𝑀,𝜏+2 + 𝜀𝑖,𝜏 for firm i in year t and 𝑟𝑖,𝜏 is firm i’s total return on week 𝜏. When we
examine the impact of share pledging on these two measures of idiosyncratic volatility, we
still find negative and significant effects. These results indicate that in addition to the effect
on earnings volatility, share pledging also leads to less volatile stock returns.
(5) Alternative measures of R&D expenditures. In Panel E, we employ a series of
alternative measures of innovation inputs. In Column (1), we restrict the sample to
observations with non-zero R&D expenditures to mitigate the concern that observations with
zero R&D expenditures drive our results. Although the sample size shrinks, the baseline
result still holds. To measure the relative scale of R&D expenditures, we employ Rd_Asset,
the ratio of R&D expenditures to total assets as the dependent variable. In Column (3), we
keep only those observations with non-zero RD_Asset. In Column (4), the dependent variable
is Rd_Sale, the ratio of R&D expenditures to total sales. The negative effect of share pledging
on innovation inputs continues to hold throughout the columns.
In summary, our baseline findings are robust to changes in measures of share pledging
and corporate risk-taking, which further buttress our main arguments.
[Insert Table 12 here]
V. Conclusions
36
In this paper, we examine the effect of share pledging on corporate risk-taking. We
employ a multivariable regression analysis and find that an increase in share pledging leads to
less volatile earnings and tightened R&D expenditures. We use a propensity-score matched
sample to address the systematic differences between firms that engage in pledging shares
with firms that do not, and employ the Heckman two-stage approach to address self-selection
issues. We then employ a regulatory change on share pledging in 2013 as a quasi-exogenous
shock and conduct a differences-in-differences analysis. We also perform a 2SLS analysis to
further address possible endogeneity concerns. Additional analysis indicates that firms with
higher levels of share pledging obtain more granted invention patents with tightened R&D
expenditures and have higher market values, indicating that share pledging improves the
investment efficiency of risky projects. Overall, our evidence suggests that share pledging
releases valuable information about borrowers, enabling creditors to constrain corporate
insiders’ incentives of excessive risk-taking by improving the efficiency of risky investments.
37
References
Acemoglu D, Zilibotti F. Was Prometheus unbound by chance? Risk, diversification, and growth[J]. Journal
of Political Economy, 1997, 105(4): 709-751.
Acharya V V, Amihud Y, Litov L. Creditor rights and corporate risk-taking[J]. Journal of Financial
Economics, 2011, 102(1): 150-166.
Agarwal V, Vashishtha R, Venkatachalam M. Mutual fund transparency and corporate myopia[J]. Review of
Financial Studies, 2017.
Allen F, Qian J, Qian M. Law, finance, and economic growth in China[J]. Journal of Financial Economics,
2005, 77(1): 57-116.
Altman E I. Financial ratios, discriminant analysis and the prediction of corporate bankruptcy[J]. Journal of
Finance, 1968, 23(4): 589-609.
Asija A, Marisetty V B, Rangan S. Do insiders who pledge their shares manipulate reported earnings?[J].
2014, working paper.
Barnea A, Haugen R A, Senbet L W. A rationale for debt maturity structure and call provisions in the
agency theoretic framework[J]. Journal of Finance, 1980, 35(5): 1223-1234.
Bernile G, Bhagwat V, Yonker S. Board diversity, firm risk, and corporate policies[J]. Journal of Financial
Economics, 2018(127): 588-612.
Boubakri N, Cosset J C, Saffar W. The role of state and foreign owners in corporate risk-taking: Evidence
from privatization[J]. Journal of Financial Economics, 2013, 108(3): 641-658.
Brogaard J, Li D, Xia Y. Stock liquidity and default risk[J]. Journal of Financial Economics, 2017, 124(3):
486-502.
Campello M, Giambona E. Real assets and capital structure[J]. Journal of Financial and Quantitative
Analysis, 2013, 48(5): 1333-1370.
Cassell C A, Huang S X, Sanchez J M, et al. Seeking safety: The relation between CEO inside debt
holdings and the riskiness of firm investment and financial policies[J]. Journal of Financial Economics,
2012, 103(3): 588-610.
Cerqueiro G, Ongena S, Roszbach K. Collateralization, bank loan rates, and monitoring[J]. Journal of
Finance, 2016, 71(3): 1295-1322.
Chan K, Chen H K, Hu S Y, et al. Share pledges and margin call pressure[J]. Journal of Corporate Finance,
2018, 52: 96-117.
Chava S, Livdan D, Purnanandam A. Do shareholder rights affect the cost of bank loans?[J]. Review of
Financial Studies, 2008, 22(8): 2973-3004.
Chen H K, Hu S. The information content of insider pledging[J]. 2017, working paper.
Chen J, Hong H, Stein J C. Forecasting crashes: Trading volume, past returns, and conditional skewness in
stock prices[J]. Journal of financial Economics, 2001, 61(3): 345-381.
Chen Y, Hu S Y. The controlling shareholder's personal leverage and firm performance[J]. Applied
Economics, 2007, 39(8): 1059-1075.
Chen S, Sun Z, Tang S, et al. Government intervention and investment efficiency: Evidence from China[J].
Journal of Corporate Finance, 2011, 17(2): 259-271.
Coles J L, Daniel N D, Naveen L. Managerial incentives and risk-taking[J]. Journal of Financial Economics,
2006, 79(2): 431-468.
Cornett M M, Marcus A J, Tehranian H. Corporate governance and pay-for-performance: The impact of
38
earnings management[J]. Journal of Financial Economics, 2008, 87(2): 357-373.
Cronqvist H, Makhija A K, Yonker S E. Behavioral consistency in corporate finance: CEO personal and
corporate leverage[J]. Journal of Financial Economics, 2012, 103(1): 20-40.
Dechow P M, Dichev I D. The quality of accruals and earnings: The role of accrual estimation errors[J].
The Accounting Review, 2002, 77(s-1): 35-59.
Dou Y, Masulis R W, Zein J. Shareholder wealth consequence of insider pledging of company stock as
collateral for personal loans[J]. 2017, working paper.
Eisdorfer A. Empirical evidence of risk shifting in financially distressed firms[J]. Journal of Finance, 2008,
63(2): 609-637.
Ekström E, Wanntorp H. Margin call stock loans[J]. 2008, working paper.
Faccio M, Marchica M T, Mura R. Large shareholder diversification and corporate risk-taking[J]. Review
of Financial Studies, 2011, 24(11): 3601-3641.
Faccio M, Marchica M T, Mura R. CEO gender, corporate risk-taking, and the efficiency of capital
allocation[J]. Journal of Corporate Finance, 2016, 39: 193-209.
Fang V W, Tian X, Tice S. Does stock liquidity enhance or impede firm innovation?[J]. Journal of Finance,
2014, 69(5): 2085-2125.
Favara G, Morellec E, Schroth E, et al. Debt enforcement, investment, and risk taking across countries[J].
Journal of Financial Economics, 2017, 123(1): 22-41.
Galai D, Masulis R W. The option pricing model and the risk factor of stock[J]. Journal of Financial
Economics, 1976, 3(1-2): 53-81.
Gopalan R, Jayaraman S. Private control benefits and earnings management: evidence from insider
controlled firms[J]. Journal of Accounting Research, 2012, 50(1): 117-157.
Gormley T A, Matsa D A. Growing out of trouble? Corporate responses to liability risk[J]. Review of
Financial Studies, 2011, 24(8): 2781-2821.
Gormley T A, Matsa D A. Playing it safe? Managerial preferences, risk, and agency conflicts[J]. Journal of
Financial Economics, 2016, 122(3): 431-455.
Hao Y, Lu J. The impact of government intervention on corporate investment allocations and efficiency:
Evidence from China[J]. Financial Management, 2018, 47(2): 383-419.
Hayes R M, Lemmon M, Qiu M. Stock options and managerial incentives for risk taking: Evidence from
FAS 123R[J]. Journal of Financial Economics, 2012, 105(1):174-190.
He J J, Tian X. The dark side of analyst coverage: The case of innovation[J]. Journal of Financial
Economics, 2013, 109(3): 856-878.
He Z L, Tong T W, Zhang Y, et al. Constructing a Chinese patent database of listed firms in China:
Descriptions, lessons, and insights[J]. Journal of Economics & Management Strategy, 2018, 27(3):
579-606.
Hilary G, Hui K W. Does religion matter in corporate decision making in America?[J]. Journal of Financial
Economics, 2009, 93(3): 455-473.
Hutton A P, Marcus A J, Tehranian H. Opaque financial reports, R2, and crash risk[J]. Journal of Financial
Economics, 2009, 94(1):67-86.
Hwang A L J, Qiao Y, Ku C. Pledge or not pledge? Shares owned by insiders pledged for collateral[J]. 2016,
working paper.
Imbens G W, Angrist J D. Identification and estimation of local average treatment effects[J]. Econometrica,
1994, 62(2):467-475.
Jagannathan R, Matsa D A, Meier I, et al. Why do firms use high discount rates?[J]. Journal of Financial
39
Economics, 2016, 120(3): 445-463.
Jensen M C, Meckling W H. Theory of the firm: Managerial behavior, agency costs and ownership
structure[J]. Journal of Financial Economics, 1976, 3(4): 305-360.
Jiang F, Jiang Z, Kim K A, et al. Family-firm risk-taking: does religion matter?[J]. Journal of Corporate
Finance, 2015, 33: 260-278.
Jiang F, Kim K A. Corporate governance in China: A modern perspective[J]. Journal of Corporate Finance,
2015 (32): 190-216.
Jiang W. Have instrumental variables brought us closer to the truth[J]. Review of Corporate Finance Studies,
2017, 6(2): 127-140.
Jin L, Myers S C. R2 around the world: New theory and new tests[J]. Journal of Financial Economics, 2006,
79(2):257-292.
John K, Litov L, Yeung B. Corporate governance and risk-taking[J]. Journal of Finance, 2008, 63(4):
1679-1728.
Jones J J. Earnings management during import relief investigations[J]. Journal of Accounting Research,
1991: 193-228.
Keil J, Müller K. Do firms pledge their pledgeable assets?[J]. 2016, working paper.
Kim J B, Li Y, Zhang L. Corporate tax avoidance and stock price crash risk: Firm-level analysis[J]. Journal
of Financial Economics, 2011, 100(3): 639-662.
Kim E H, Lu Y. CEO ownership, external governance, and risk-taking[J]. Journal of Financial Economics,
2011, 102(2): 272-292.
Laeven L, Levine R. Bank governance, regulation and risk taking[J]. Journal of Financial Economics, 2009,
93(2): 259-275.
Li K, Prabhala N. Self-selection models in corporate finance[J]. Handbook of corporate finance: Empirical
corporate finance, 2007, 1: 37.
Li K, Griffin D, Yue H, et al. How does culture influence corporate risk-taking?[J]. Journal of Corporate
Finance, 2013, 23: 1-22.
Li M, Liu C, Scott T. Share pledges and firm value. 2018, working paper.
Li X, Wang S S, Wang X. Trust and stock price crash risk: Evidence from China[J]. Journal of Banking &
Finance, 2017, 76: 74-91.
Lin C, Ma Y, Malatesta P, et al. Ownership structure and the cost of corporate borrowing[J]. Journal of
Financial Economics, 2011, 100(1): 1-23.
Ljungqvist A, Zhang L, Zuo L. Sharing risk with the government: How taxes affect corporate risk taking[J].
Journal of Accounting Research, 2017, 55(3): 669-707.
Margrabe W. The value of an option to exchange one asset for another[J]. Journal of Finance, 1978, 33(1):
177-186.
Myers S C. Determinants of corporate borrowing[J]. Journal of Financial Economics, 1977, 5(2): 147-175.
Panousi V, Papanikolaou D. Investment, idiosyncratic risk, and ownership[J]. Journal of Finance, 2012,
67(3): 1113-1148.
Parrino R, Poteshman A M, Weisbach M S. Measuring investment distortions when risk-averse managers
decide whether to undertake risky projects[J]. Financial Management, 2005, 34(1): 21-60.
Picker R C. Security interests, misbehavior, and common pools[J]. University of Chicago Law Review,
1992, 59(2): 645-679.
Rajan R, Winton A. Covenants and collateral as incentives to monitor[J]. Journal of Finance, 1995, 50(4):
1113-1146.
40
Rosenbaum P R, Rubin D B. The central role of the propensity score in observational studies for causal
effects[J]. Biometrika, 1983, 70(1): 41-55.
Shipman J E, Swanquist Q T, Whited R L. Propensity score matching in accounting research[J]. The
Accounting Review, 2017, 92(1): 213-244.
Shleifer A, Vishny R W. Liquidation values and debt capacity: A market equilibrium approach[J]. Journal of
Finance, 1992, 47(4): 1343-1366.
Shleifer A, Vishny R W. A survey of corporate governance[J]. Journal of Finance, 1997, 52(2): 737-783.
Shue K, Townsend R. How do quasi-random option grants affect CEO risk-taking?[J]. Journal of Finance,
2017.
Singh P P. Does pledging of shares by controlling shareholders always destroy firm value?[J]. 2017,
working paper.
Stock J H, Yogo M. Testing for weak instruments in linear IV regression[J]. Identification and Inference for
Econometric Models: Essays in Honor of Thomas Rothenberg, 2005: 80.
Wang Y C, Chou R K. The impact of share pledging regulations on stock trading and firm valuation[J].
Journal of Banking & Finance, 2018, 89: 1-13.
Xie D, Zheng D, Cui C. Is controlling shareholder’s share pledge a potential “mine’’[J]. Management
World, 2016, 5: 128-140. (In Chinese)
Xu N, Li X, Yuan Q, et al. Excess perks and stock price crash risk: Evidence from China[J]. Journal of
Corporate Finance, 2014, 25: 419-434.
Yu X, Zhang P, Zheng Y. Corporate governance, political connections, and intra-industry effects: Evidence
from corporate scandals in China[J]. Financial Management, 2015, 44(1): 49-80.
Zhu W. Accruals and price crashes[J]. Review of Accounting Studies, 2016, 21(2): 349-399.
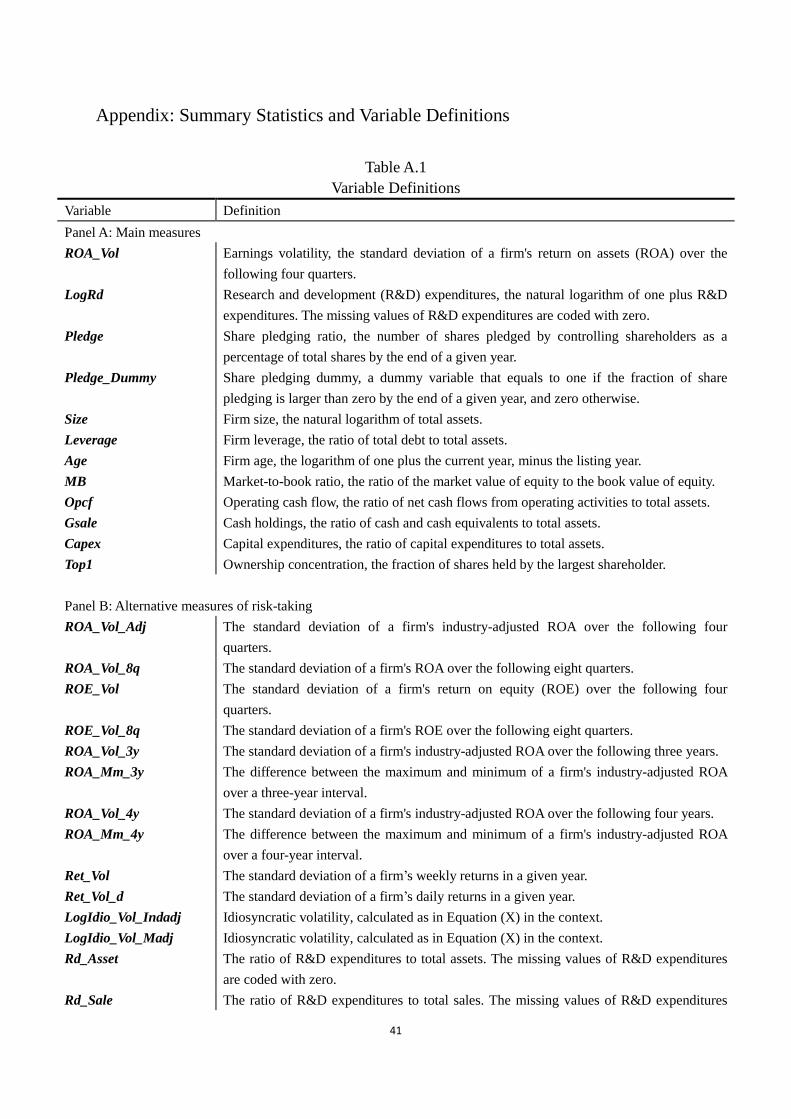
41
Appendix: Summary Statistics and Variable Definitions
Table A.1
Variable Definitions
Variable Definition
Panel A: Main measures
ROA_Vol Earnings volatility, the standard deviation of a firm's return on assets (ROA) over the
following four quarters.
LogRd Research and development (R&D) expenditures, the natural logarithm of one plus R&D
expenditures. The missing values of R&D expenditures are coded with zero.
Pledge Share pledging ratio, the number of shares pledged by controlling shareholders as a
percentage of total shares by the end of a given year.
Pledge_Dummy Share pledging dummy, a dummy variable that equals to one if the fraction of share
pledging is larger than zero by the end of a given year, and zero otherwise.
Size Firm size, the natural logarithm of total assets.
Leverage Firm leverage, the ratio of total debt to total assets.
Age Firm age, the logarithm of one plus the current year, minus the listing year.
MB Market-to-book ratio, the ratio of the market value of equity to the book value of equity.
Opcf Operating cash flow, the ratio of net cash flows from operating activities to total assets.
Gsale Cash holdings, the ratio of cash and cash equivalents to total assets.
Capex Capital expenditures, the ratio of capital expenditures to total assets.
Top1 Ownership concentration, the fraction of shares held by the largest shareholder.
Panel B: Alternative measures of risk-taking
ROA_Vol_Adj The standard deviation of a firm's industry-adjusted ROA over the following four
quarters.
ROA_Vol_8q The standard deviation of a firm's ROA over the following eight quarters.
ROE_Vol The standard deviation of a firm's return on equity (ROE) over the following four
quarters.
ROE_Vol_8q The standard deviation of a firm's ROE over the following eight quarters.
ROA_Vol_3y The standard deviation of a firm's industry-adjusted ROA over the following three years.
ROA_Mm_3y The difference between the maximum and minimum of a firm's industry-adjusted ROA
over a three-year interval.
ROA_Vol_4y The standard deviation of a firm's industry-adjusted ROA over the following four years.
ROA_Mm_4y The difference between the maximum and minimum of a firm's industry-adjusted ROA
over a four-year interval.
Ret_Vol The standard deviation of a firm’s weekly returns in a given year.
Ret_Vol_d The standard deviation of a firm’s daily returns in a given year.
LogIdio_Vol_Indadj Idiosyncratic volatility, calculated as in Equation (X) in the context.
LogIdio_Vol_Madj Idiosyncratic volatility, calculated as in Equation (X) in the context.
Rd_Asset The ratio of R&D expenditures to total assets. The missing values of R&D expenditures
are coded with zero.
Rd_Sale The ratio of R&D expenditures to total sales. The missing values of R&D expenditures
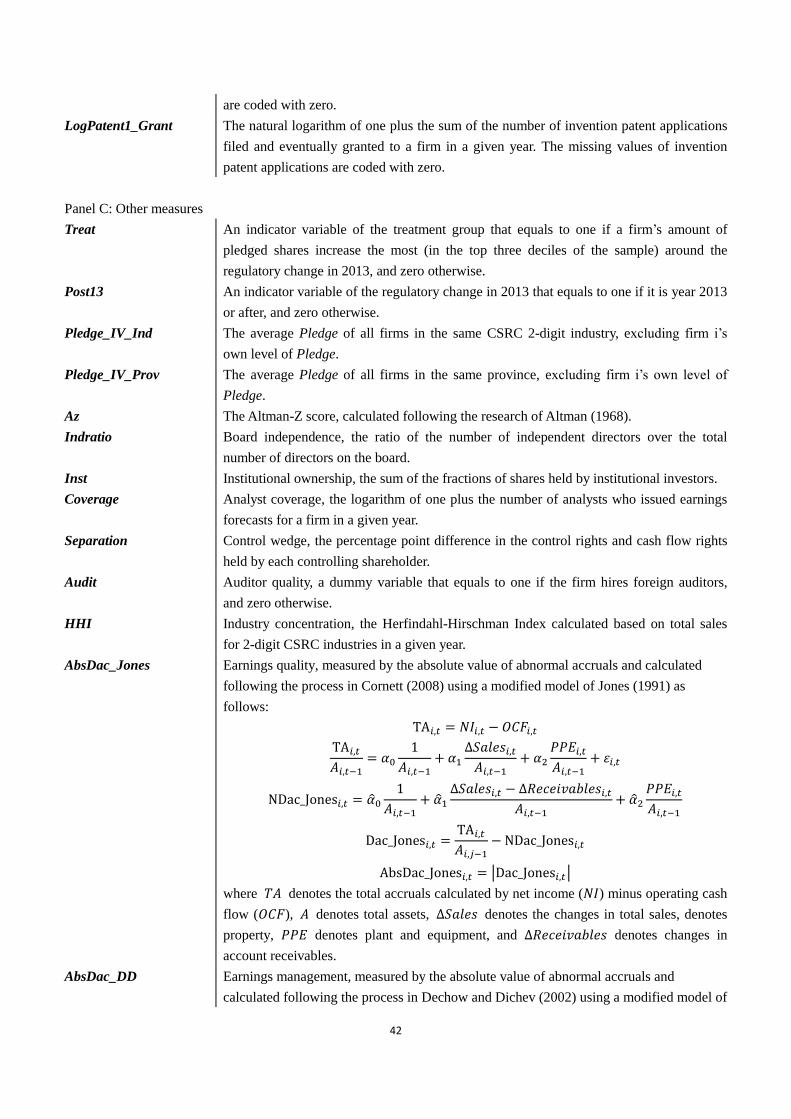
42
are coded with zero.
LogPatent1_Grant The natural logarithm of one plus the sum of the number of invention patent applications
filed and eventually granted to a firm in a given year. The missing values of invention
patent applications are coded with zero.
Panel C: Other measures
Treat An indicator variable of the treatment group that equals to one if a firm’s amount of
pledged shares increase the most (in the top three deciles of the sample) around the
regulatory change in 2013, and zero otherwise.
Post13 An indicator variable of the regulatory change in 2013 that equals to one if it is year 2013
or after, and zero otherwise.
Pledge_IV_Ind The average Pledge of all firms in the same CSRC 2-digit industry, excluding firm i’s
own level of Pledge.
Pledge_IV_Prov The average Pledge of all firms in the same province, excluding firm i’s own level of
Pledge.
Az The Altman-Z score, calculated following the research of Altman (1968).
Indratio Board independence, the ratio of the number of independent directors over the total
number of directors on the board.
Inst Institutional ownership, the sum of the fractions of shares held by institutional investors.
Coverage Analyst coverage, the logarithm of one plus the number of analysts who issued earnings
forecasts for a firm in a given year.
Separation Control wedge, the percentage point difference in the control rights and cash flow rights
held by each controlling shareholder.
Audit Auditor quality, a dummy variable that equals to one if the firm hires foreign auditors,
and zero otherwise.
HHI Industry concentration, the Herfindahl-Hirschman Index calculated based on total sales
for 2-digit CSRC industries in a given year.
AbsDac_Jones Earnings quality, measured by the absolute value of abnormal accruals and calculated
following the process in Cornett (2008) using a modified model of Jones (1991) as
follows:
TA𝑖,𝑡 = 𝑁𝐼𝑖,𝑡 − 𝑂𝐶𝐹𝑖,𝑡
TA𝑖,𝑡
𝐴𝑖,𝑡−1= 𝛼0
1
𝐴𝑖,𝑡−1+ 𝛼1
∆𝑆𝑎𝑙𝑒𝑠𝑖,𝑡
𝐴𝑖,𝑡−1+ 𝛼2
𝑃𝑃𝐸𝑖,𝑡
𝐴𝑖,𝑡−1+ 𝜀𝑖,𝑡
NDac_Jones𝑖,𝑡 = �̂�0
1
𝐴𝑖,𝑡−1+ �̂�1
∆𝑆𝑎𝑙𝑒𝑠𝑖,𝑡 − ∆𝑅𝑒𝑐𝑒𝑖𝑣𝑎𝑏𝑙𝑒𝑠𝑖,𝑡
𝐴𝑖,𝑡−1+ �̂�2
𝑃𝑃𝐸𝑖,𝑡
𝐴𝑖,𝑡−1
Dac_Jones𝑖,𝑡 =TA𝑖,𝑡
𝐴𝑖,𝑗−1− NDac_Jones𝑖,𝑡
AbsDac_Jones𝑖,𝑡 = |Dac_Jones𝑖,𝑡|
where 𝑇𝐴 denotes the total accruals calculated by net income (𝑁𝐼) minus operating cash
flow (𝑂𝐶𝐹), 𝐴 denotes total assets, ∆𝑆𝑎𝑙𝑒𝑠 denotes the changes in total sales, denotes
property, 𝑃𝑃𝐸 denotes plant and equipment, and ∆𝑅𝑒𝑐𝑒𝑖𝑣𝑎𝑏𝑙𝑒𝑠 denotes changes in
account receivables.
AbsDac_DD Earnings management, measured by the absolute value of abnormal accruals and
calculated following the process in Dechow and Dichev (2002) using a modified model of

43
Jones (1991) as follows:
TA𝑖,𝑡
𝐴𝑖,𝑡−1= 𝜆0 + 𝜆1
𝐶𝐹𝑂𝑡−1
𝐴𝑖,𝑡−2+ 𝜆2
𝐶𝐹𝑂𝑡
𝐴𝑖,𝑡−1+ 𝜆3
𝐶𝐹𝑂𝑡+1
𝐴𝑖,𝑡+ 𝜆4
∆𝑆𝑎𝑙𝑒𝑠𝑖,𝑡
𝐴𝑖,𝑡−1+ 𝜆5
𝑃𝑃𝐸𝑖,𝑡
𝐴𝑖,𝑡−1+ 𝜀𝑖,𝑡
NDac_DD𝑖,𝑡 = �̂�1
𝐶𝐹𝑂𝑡−1
𝐴𝑖,𝑡−2+ �̂�2
𝐶𝐹𝑂𝑡
𝐴𝑖,𝑡−1+ �̂�3
𝐶𝐹𝑂𝑡+1
𝐴𝑖,𝑡+ �̂�4
∆𝑆𝑎𝑙𝑒𝑠𝑖,𝑡
𝐴𝑖,𝑡−1+ �̂�5
𝑃𝑃𝐸𝑖,𝑡
𝐴𝑖,𝑡−1
Dac_DD𝑖,𝑡 =TA𝑖,𝑡
𝐴𝑖,𝑗−1− NDac_DD𝑖,𝑡
AbsDac_DD𝑖,𝑡 = |Dac_DD𝑖,𝑡|
where 𝐶𝐹𝑂 denotes net operating cash flows.
Ncskew Stock price crash risk, measured as in Kim et al. (2011):
𝑟𝑖,𝑗 = 𝛽0 + 𝛽1𝑟𝑚,𝑗−2 + 𝛽2𝑟𝑚,𝑗−1 + 𝛽3𝑟𝑚,𝑗 + 𝛽4𝑟𝑚,𝑗+1 + 𝛽5𝑟𝑚,𝑗+2 + 𝜀𝑖,𝑗
𝑊𝑖,𝑗 = 𝐿𝑜𝑔(1 + 𝜀𝑖,𝑗)
𝑁𝑐𝑠𝑘𝑒𝑤𝑖,𝑡 = −[𝑛(𝑛 − 1)32 ∑ 𝑊𝑖,𝑗
3 ]/[(𝑛 − 1)(𝑛 − 2)(∑ 𝑊𝑖,𝑗2 )3/2]
where 𝑟𝑖,𝑗 denotes the return on stock i in week j, 𝑟𝑚,𝑗 denotes the value-weighted
A-share market return in week j, and n denotes the number of trading weeks.
Duvol Stock price crash risk, measured as in Kim et al. (2011):
𝐷𝑢𝑣𝑜𝑙𝑖,𝑡 = log {[(𝑛𝑢 − 1) ∑ 𝑤𝑖,𝑗2
𝐷𝑜𝑤𝑛
]/[(𝑛𝑑 − 1) ∑ 𝑤𝑖,𝑗2
𝑈𝑝
]}
where nu and nd denote the number of weeks with firm-specific weekly returns above or
below the annual mean, respectively.
Turnover Stock turnover rate, the average daily stock turnover rate in a given year.
Ret Stock return, the average of firm-specific weekly returns in a given year.
Sigma Stock return volatility, the standard deviation of firm-specific weekly returns in a given
year.
Accm The average of the absolute value of discretionary accruals in year t, t-1, and t-2.
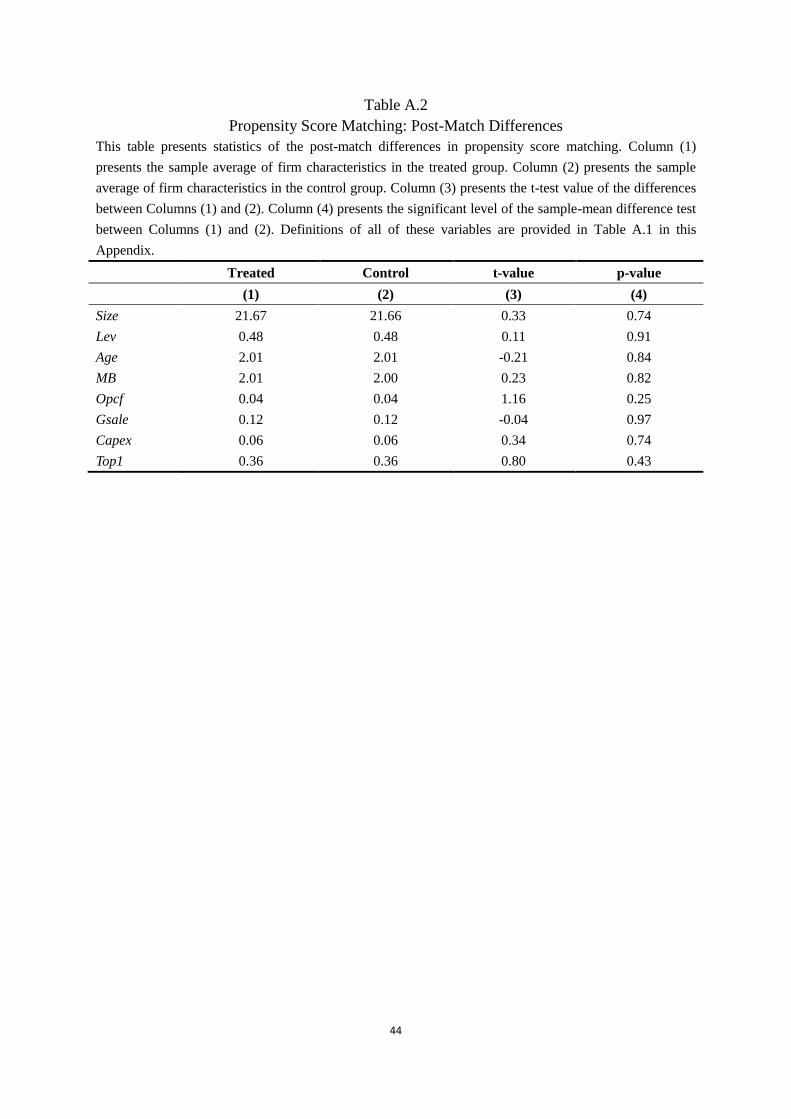
44
Table A.2
Propensity Score Matching: Post-Match Differences
This table presents statistics of the post-match differences in propensity score matching. Column (1)
presents the sample average of firm characteristics in the treated group. Column (2) presents the sample
average of firm characteristics in the control group. Column (3) presents the t-test value of the differences
between Columns (1) and (2). Column (4) presents the significant level of the sample-mean difference test
between Columns (1) and (2). Definitions of all of these variables are provided in Table A.1 in this
Appendix.
Treated Control t-value p-value
(1) (2) (3) (4)
Size 21.67 21.66 0.33 0.74
Lev 0.48 0.48 0.11 0.91
Age 2.01 2.01 -0.21 0.84
MB 2.01 2.00 0.23 0.82
Opcf 0.04 0.04 1.16 0.25
Gsale 0.12 0.12 -0.04 0.97
Capex 0.06 0.06 0.34 0.74
Top1 0.36 0.36 0.80 0.43
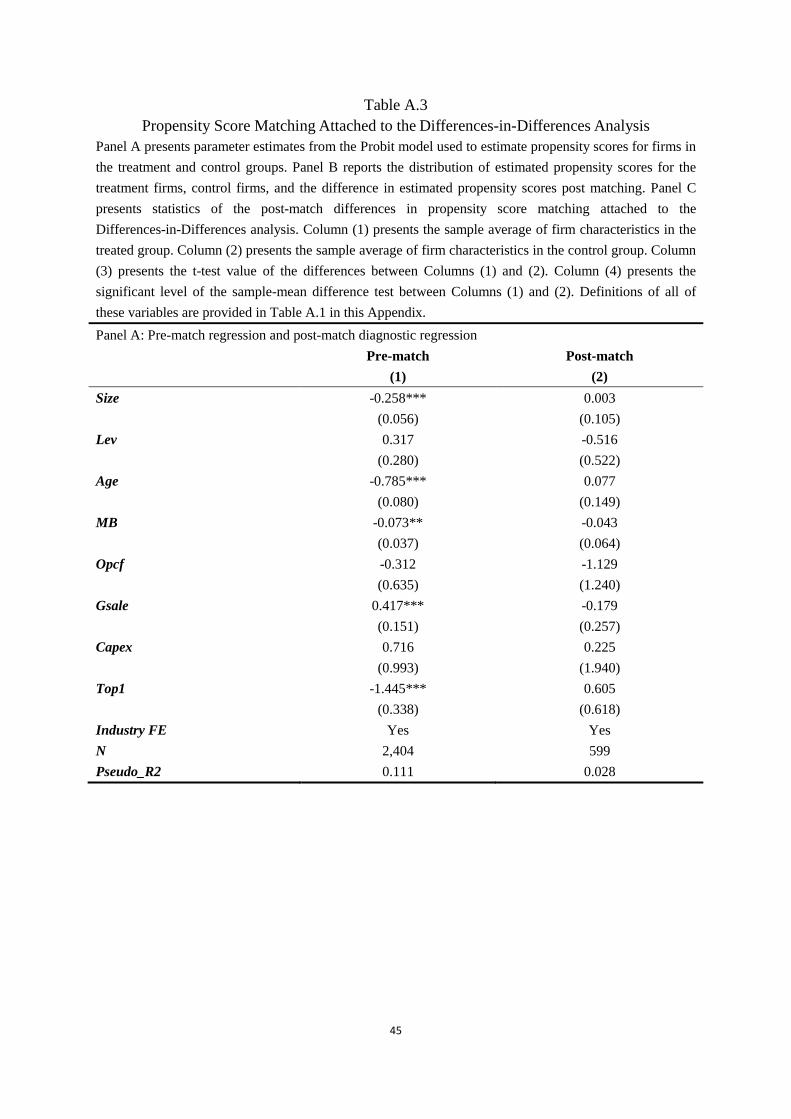
45
Table A.3
Propensity Score Matching Attached to the Differences-in-Differences Analysis
Panel A presents parameter estimates from the Probit model used to estimate propensity scores for firms in
the treatment and control groups. Panel B reports the distribution of estimated propensity scores for the
treatment firms, control firms, and the difference in estimated propensity scores post matching. Panel C
presents statistics of the post-match differences in propensity score matching attached to the
Differences-in-Differences analysis. Column (1) presents the sample average of firm characteristics in the
treated group. Column (2) presents the sample average of firm characteristics in the control group. Column
(3) presents the t-test value of the differences between Columns (1) and (2). Column (4) presents the
significant level of the sample-mean difference test between Columns (1) and (2). Definitions of all of
these variables are provided in Table A.1 in this Appendix.
Panel A: Pre-match regression and post-match diagnostic regression
Pre-match Post-match
(1) (2)
Size -0.258*** 0.003
(0.056) (0.105)
Lev 0.317 -0.516
(0.280) (0.522)
Age -0.785*** 0.077
(0.080) (0.149)
MB -0.073** -0.043
(0.037) (0.064)
Opcf -0.312 -1.129
(0.635) (1.240)
Gsale 0.417*** -0.179
(0.151) (0.257)
Capex 0.716 0.225
(0.993) (1.940)
Top1 -1.445*** 0.605
(0.338) (0.618)
Industry FE Yes Yes
N 2,404 599
Pseudo_R2 0.111 0.028

46
Table A.3 (Continued)
Panel B: Estimated propensity score distributions
Num Mean Sd. Min P25 Median P75 Max
(1) (2) (3) (4) (5) (6) (7) (8)
Treatment 306 0.335 0.147 0.031 0.215 0.320 0.451 0.671
Control 306 0.335 0.147 0.031 0.215 0.320 0.452 0.671
Difference - 0.000 0.000 0.000 0.000 0.000 -0.001 0.000
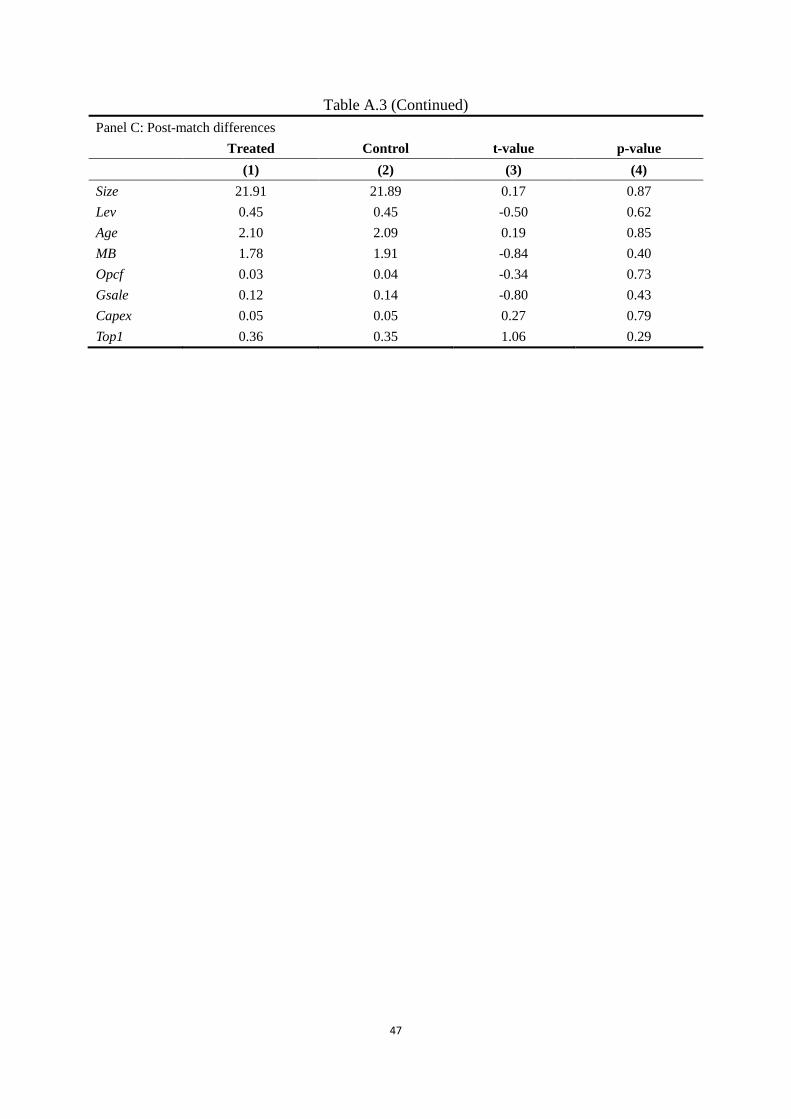
47
Table A.3 (Continued)
Panel C: Post-match differences
Treated Control t-value p-value
(1) (2) (3) (4)
Size 21.91 21.89 0.17 0.87
Lev 0.45 0.45 -0.50 0.62
Age 2.10 2.09 0.19 0.85
MB 1.78 1.91 -0.84 0.40
Opcf 0.03 0.04 -0.34 0.73
Gsale 0.12 0.14 -0.80 0.43
Capex 0.05 0.05 0.27 0.79
Top1 0.36 0.35 1.06 0.29
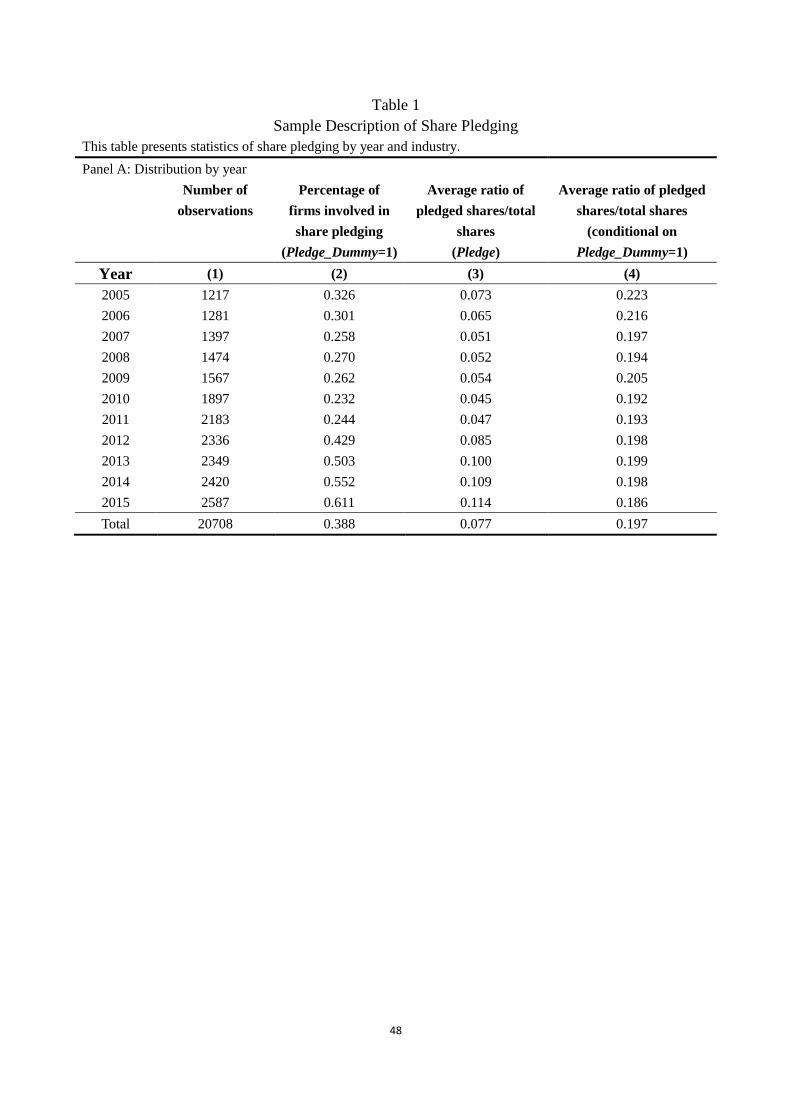
48
Table 1
Sample Description of Share Pledging
This table presents statistics of share pledging by year and industry.
Panel A: Distribution by year
Number of
observations
Percentage of
firms involved in
share pledging
(Pledge_Dummy=1)
Average ratio of
pledged shares/total
shares
(Pledge)
Average ratio of pledged
shares/total shares
(conditional on
Pledge_Dummy=1)
Year (1) (2) (3) (4)
2005 1217 0.326 0.073 0.223
2006 1281 0.301 0.065 0.216
2007 1397 0.258 0.051 0.197
2008 1474 0.270 0.052 0.194
2009 1567 0.262 0.054 0.205
2010 1897 0.232 0.045 0.192
2011 2183 0.244 0.047 0.193
2012 2336 0.429 0.085 0.198
2013 2349 0.503 0.100 0.199
2014 2420 0.552 0.109 0.198
2015 2587 0.611 0.114 0.186
Total 20708 0.388 0.077 0.197
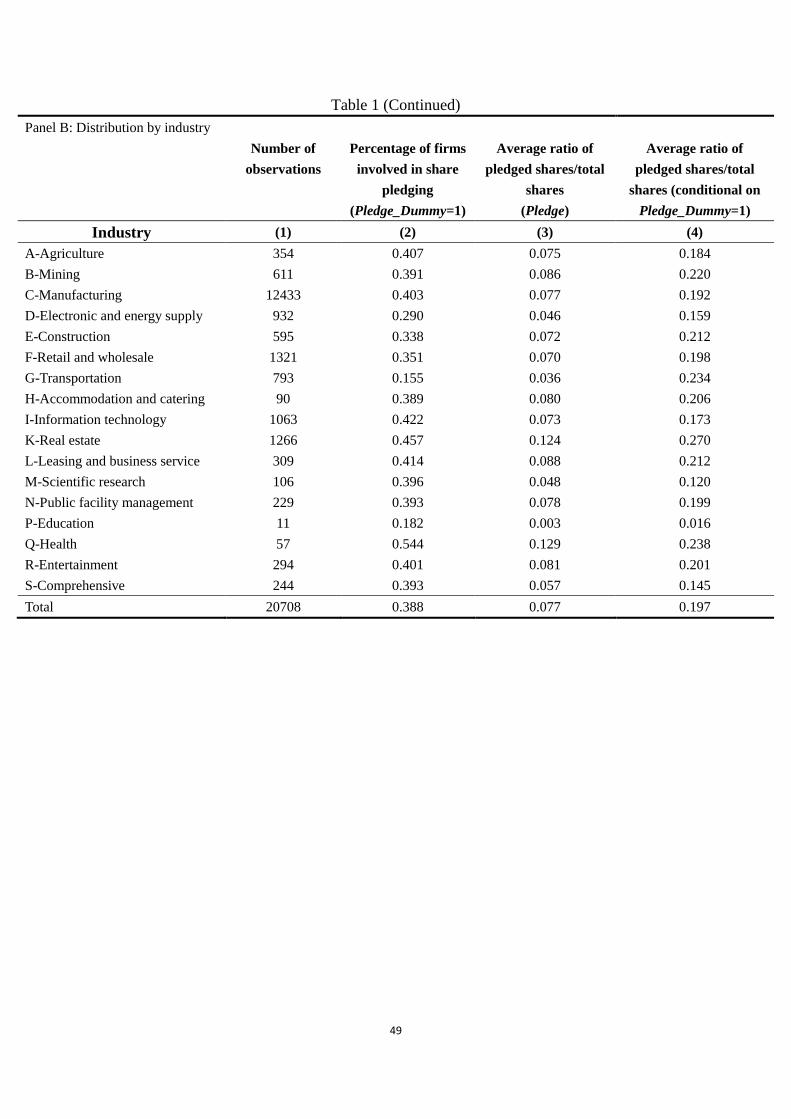
49
Table 1 (Continued)
Panel B: Distribution by industry
Number of
observations
Percentage of firms
involved in share
pledging
(Pledge_Dummy=1)
Average ratio of
pledged shares/total
shares
(Pledge)
Average ratio of
pledged shares/total
shares (conditional on
Pledge_Dummy=1)
Industry (1) (2) (3) (4)
A-Agriculture 354 0.407 0.075 0.184
B-Mining 611 0.391 0.086 0.220
C-Manufacturing 12433 0.403 0.077 0.192
D-Electronic and energy supply 932 0.290 0.046 0.159
E-Construction 595 0.338 0.072 0.212
F-Retail and wholesale 1321 0.351 0.070 0.198
G-Transportation 793 0.155 0.036 0.234
H-Accommodation and catering 90 0.389 0.080 0.206
I-Information technology 1063 0.422 0.073 0.173
K-Real estate 1266 0.457 0.124 0.270
L-Leasing and business service 309 0.414 0.088 0.212
M-Scientific research 106 0.396 0.048 0.120
N-Public facility management 229 0.393 0.078 0.199
P-Education 11 0.182 0.003 0.016
Q-Health 57 0.544 0.129 0.238
R-Entertainment 294 0.401 0.081 0.201
S-Comprehensive 244 0.393 0.057 0.145
Total 20708 0.388 0.077 0.197
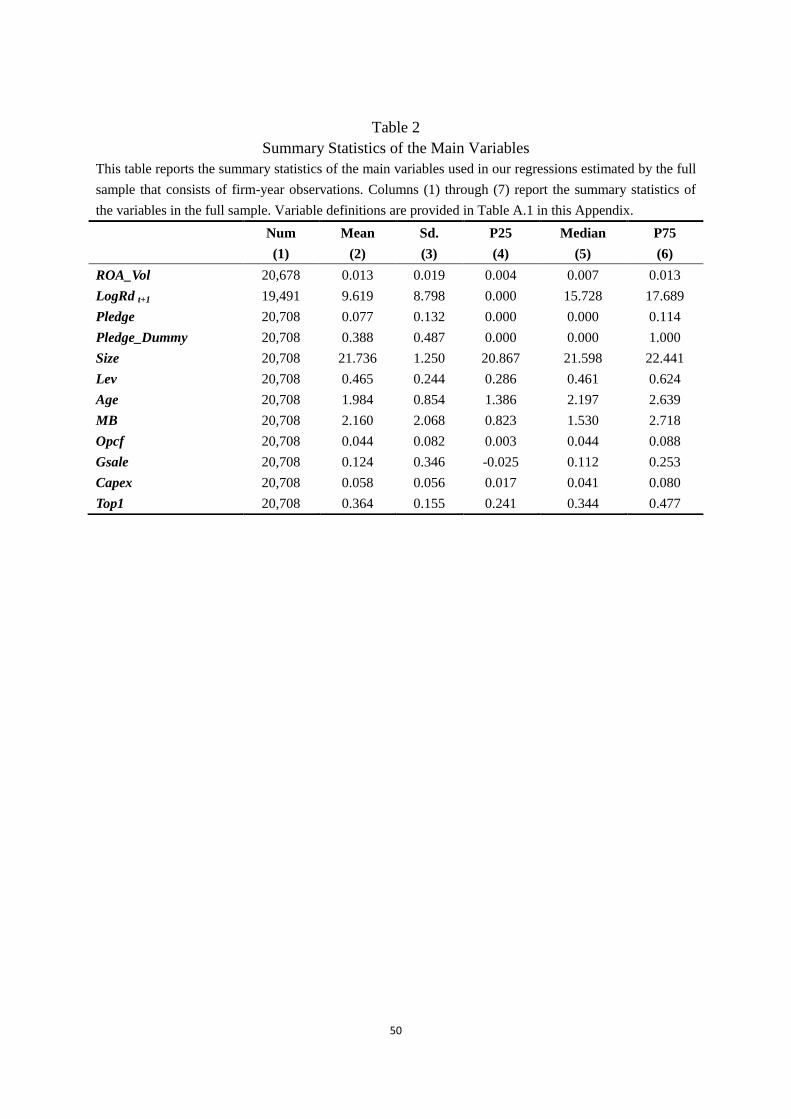
50
Table 2
Summary Statistics of the Main Variables
This table reports the summary statistics of the main variables used in our regressions estimated by the full
sample that consists of firm-year observations. Columns (1) through (7) report the summary statistics of
the variables in the full sample. Variable definitions are provided in Table A.1 in this Appendix.
Num Mean Sd. P25 Median P75
(1) (2) (3) (4) (5) (6)
ROA_Vol 20,678 0.013 0.019 0.004 0.007 0.013
LogRd t+1 19,491 9.619 8.798 0.000 15.728 17.689
Pledge 20,708 0.077 0.132 0.000 0.000 0.114
Pledge_Dummy 20,708 0.388 0.487 0.000 0.000 1.000
Size 20,708 21.736 1.250 20.867 21.598 22.441
Lev 20,708 0.465 0.244 0.286 0.461 0.624
Age 20,708 1.984 0.854 1.386 2.197 2.639
MB 20,708 2.160 2.068 0.823 1.530 2.718
Opcf 20,708 0.044 0.082 0.003 0.044 0.088
Gsale 20,708 0.124 0.346 -0.025 0.112 0.253
Capex 20,708 0.058 0.056 0.017 0.041 0.080
Top1 20,708 0.364 0.155 0.241 0.344 0.477
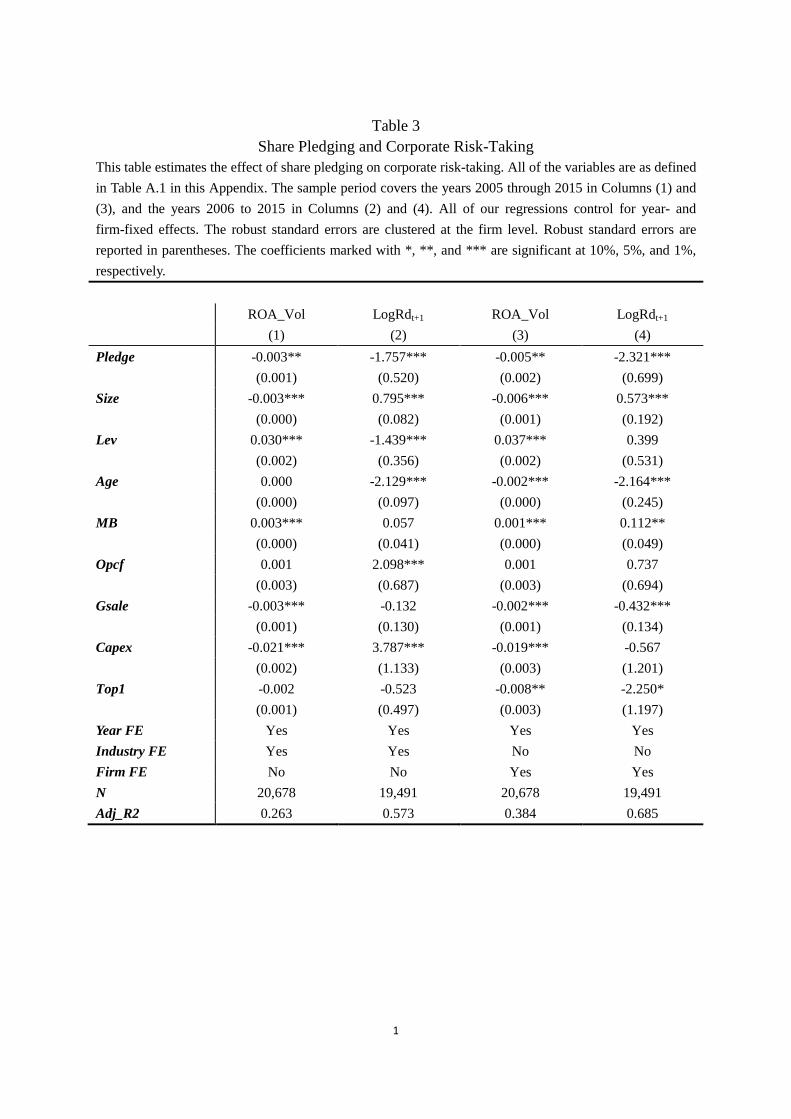
1
Table 3
Share Pledging and Corporate Risk-Taking
This table estimates the effect of share pledging on corporate risk-taking. All of the variables are as defined
in Table A.1 in this Appendix. The sample period covers the years 2005 through 2015 in Columns (1) and
(3), and the years 2006 to 2015 in Columns (2) and (4). All of our regressions control for year- and
firm-fixed effects. The robust standard errors are clustered at the firm level. Robust standard errors are
reported in parentheses. The coefficients marked with *, **, and *** are significant at 10%, 5%, and 1%,
respectively.
ROA_Vol LogRdt+1 ROA_Vol LogRdt+1
(1) (2) (3) (4)
Pledge -0.003** -1.757*** -0.005** -2.321***
(0.001) (0.520) (0.002) (0.699)
Size -0.003*** 0.795*** -0.006*** 0.573***
(0.000) (0.082) (0.001) (0.192)
Lev 0.030*** -1.439*** 0.037*** 0.399
(0.002) (0.356) (0.002) (0.531)
Age 0.000 -2.129*** -0.002*** -2.164***
(0.000) (0.097) (0.000) (0.245)
MB 0.003*** 0.057 0.001*** 0.112**
(0.000) (0.041) (0.000) (0.049)
Opcf 0.001 2.098*** 0.001 0.737
(0.003) (0.687) (0.003) (0.694)
Gsale -0.003*** -0.132 -0.002*** -0.432***
(0.001) (0.130) (0.001) (0.134)
Capex -0.021*** 3.787*** -0.019*** -0.567
(0.002) (1.133) (0.003) (1.201)
Top1 -0.002 -0.523 -0.008** -2.250*
(0.001) (0.497) (0.003) (1.197)
Year FE Yes Yes Yes Yes
Industry FE Yes Yes No No
Firm FE No No Yes Yes
N 20,678 19,491 20,678 19,491
Adj_R2 0.263 0.573 0.384 0.685
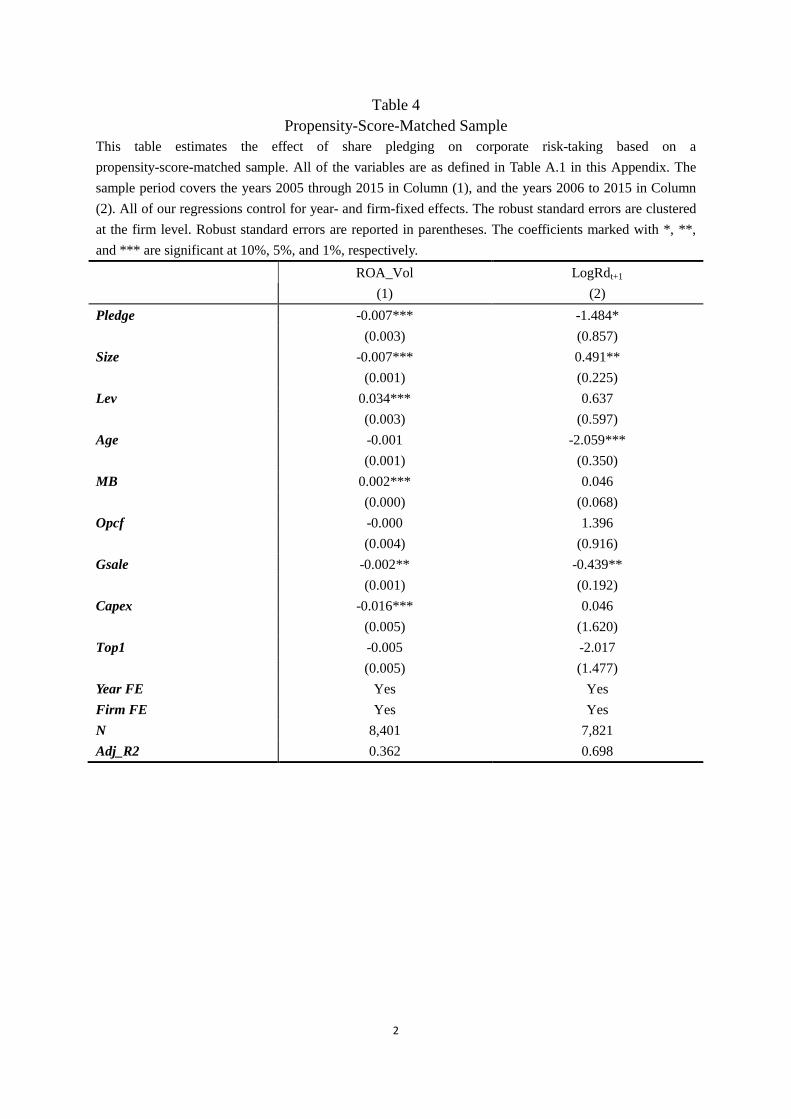
2
Table 4
Propensity-Score-Matched Sample
This table estimates the effect of share pledging on corporate risk-taking based on a
propensity-score-matched sample. All of the variables are as defined in Table A.1 in this Appendix. The
sample period covers the years 2005 through 2015 in Column (1), and the years 2006 to 2015 in Column
(2). All of our regressions control for year- and firm-fixed effects. The robust standard errors are clustered
at the firm level. Robust standard errors are reported in parentheses. The coefficients marked with *, **,
and *** are significant at 10%, 5%, and 1%, respectively.
ROA_Vol LogRdt+1
(1) (2)
Pledge -0.007*** -1.484*
(0.003) (0.857)
Size -0.007*** 0.491**
(0.001) (0.225)
Lev 0.034*** 0.637
(0.003) (0.597)
Age -0.001 -2.059***
(0.001) (0.350)
MB 0.002*** 0.046
(0.000) (0.068)
Opcf -0.000 1.396
(0.004) (0.916)
Gsale -0.002** -0.439**
(0.001) (0.192)
Capex -0.016*** 0.046
(0.005) (1.620)
Top1 -0.005 -2.017
(0.005) (1.477)
Year FE Yes Yes
Firm FE Yes Yes
N 8,401 7,821
Adj_R2 0.362 0.698
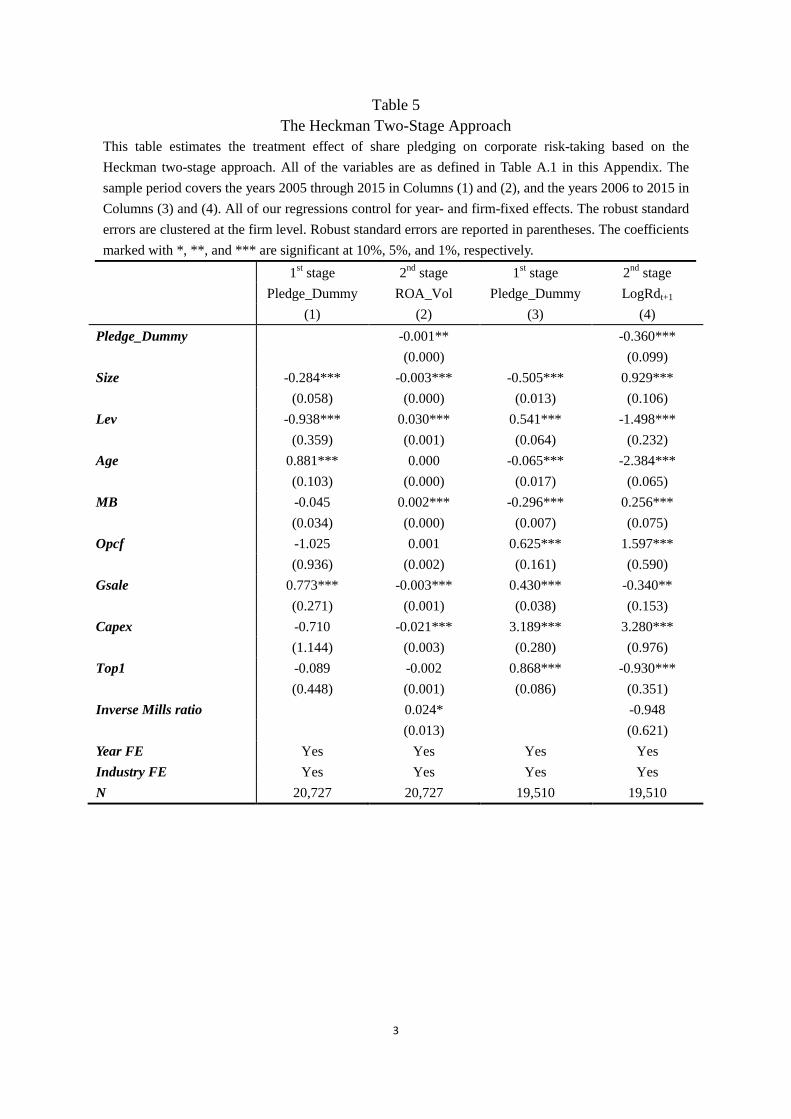
3
Table 5
The Heckman Two-Stage Approach
This table estimates the treatment effect of share pledging on corporate risk-taking based on the
Heckman two-stage approach. All of the variables are as defined in Table A.1 in this Appendix. The
sample period covers the years 2005 through 2015 in Columns (1) and (2), and the years 2006 to 2015 in
Columns (3) and (4). All of our regressions control for year- and firm-fixed effects. The robust standard
errors are clustered at the firm level. Robust standard errors are reported in parentheses. The coefficients
marked with *, **, and *** are significant at 10%, 5%, and 1%, respectively.
1st stage 2
nd stage 1
st stage 2
nd stage
Pledge_Dummy ROA_Vol Pledge_Dummy LogRdt+1
(1) (2) (3) (4)
Pledge_Dummy -0.001** -0.360***
(0.000) (0.099)
Size -0.284*** -0.003*** -0.505*** 0.929***
(0.058) (0.000) (0.013) (0.106)
Lev -0.938*** 0.030*** 0.541*** -1.498***
(0.359) (0.001) (0.064) (0.232)
Age 0.881*** 0.000 -0.065*** -2.384***
(0.103) (0.000) (0.017) (0.065)
MB -0.045 0.002*** -0.296*** 0.256***
(0.034) (0.000) (0.007) (0.075)
Opcf -1.025 0.001 0.625*** 1.597***
(0.936) (0.002) (0.161) (0.590)
Gsale 0.773*** -0.003*** 0.430*** -0.340**
(0.271) (0.001) (0.038) (0.153)
Capex -0.710 -0.021*** 3.189*** 3.280***
(1.144) (0.003) (0.280) (0.976)
Top1 -0.089 -0.002 0.868*** -0.930***
(0.448) (0.001) (0.086) (0.351)
Inverse Mills ratio 0.024* -0.948
(0.013) (0.621)
Year FE Yes Yes Yes Yes
Industry FE Yes Yes Yes Yes
N 20,727 20,727 19,510 19,510
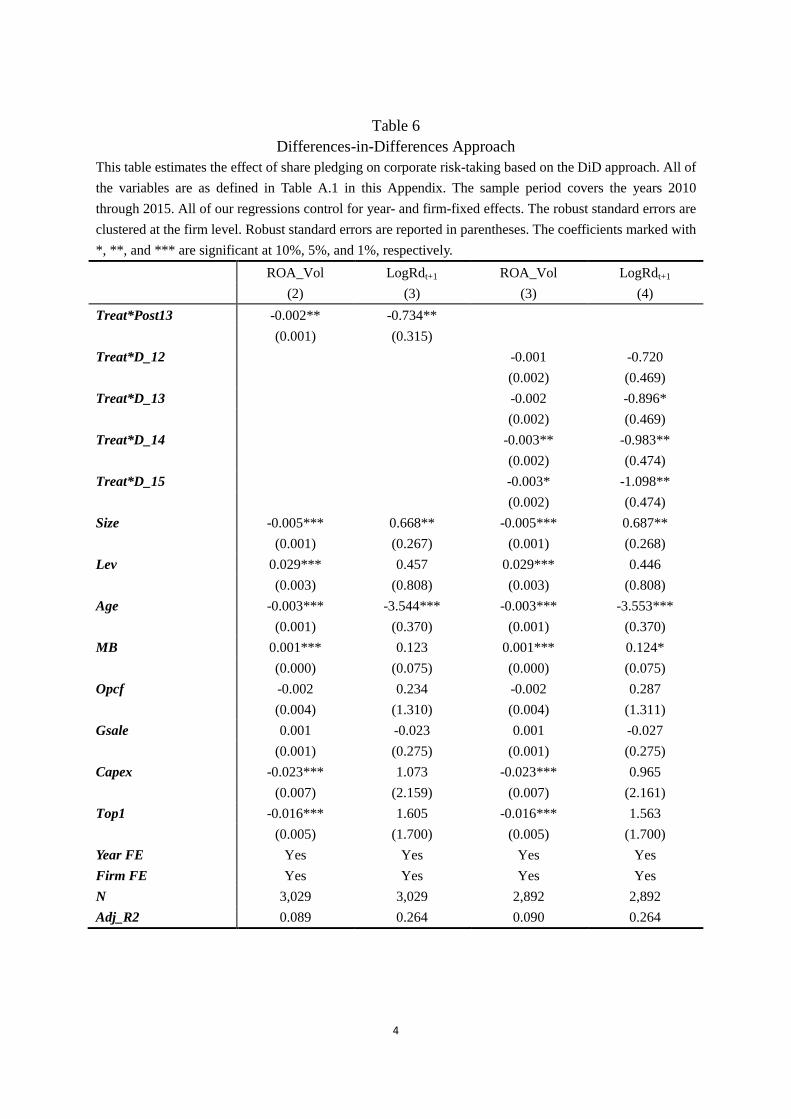
4
Table 6
Differences-in-Differences Approach
This table estimates the effect of share pledging on corporate risk-taking based on the DiD approach. All of
the variables are as defined in Table A.1 in this Appendix. The sample period covers the years 2010
through 2015. All of our regressions control for year- and firm-fixed effects. The robust standard errors are
clustered at the firm level. Robust standard errors are reported in parentheses. The coefficients marked with
*, **, and *** are significant at 10%, 5%, and 1%, respectively.
ROA_Vol LogRdt+1 ROA_Vol LogRdt+1
(2) (3) (3) (4)
Treat*Post13 -0.002** -0.734**
(0.001) (0.315)
Treat*D_12 -0.001 -0.720
(0.002) (0.469)
Treat*D_13 -0.002 -0.896*
(0.002) (0.469)
Treat*D_14 -0.003** -0.983**
(0.002) (0.474)
Treat*D_15 -0.003* -1.098**
(0.002) (0.474)
Size -0.005*** 0.668** -0.005*** 0.687**
(0.001) (0.267) (0.001) (0.268)
Lev 0.029*** 0.457 0.029*** 0.446
(0.003) (0.808) (0.003) (0.808)
Age -0.003*** -3.544*** -0.003*** -3.553***
(0.001) (0.370) (0.001) (0.370)
MB 0.001*** 0.123 0.001*** 0.124*
(0.000) (0.075) (0.000) (0.075)
Opcf -0.002 0.234 -0.002 0.287
(0.004) (1.310) (0.004) (1.311)
Gsale 0.001 -0.023 0.001 -0.027
(0.001) (0.275) (0.001) (0.275)
Capex -0.023*** 1.073 -0.023*** 0.965
(0.007) (2.159) (0.007) (2.161)
Top1 -0.016*** 1.605 -0.016*** 1.563
(0.005) (1.700) (0.005) (1.700)
Year FE Yes Yes Yes Yes
Firm FE Yes Yes Yes Yes
N 3,029 3,029 2,892 2,892
Adj_R2 0.089 0.264 0.090 0.264
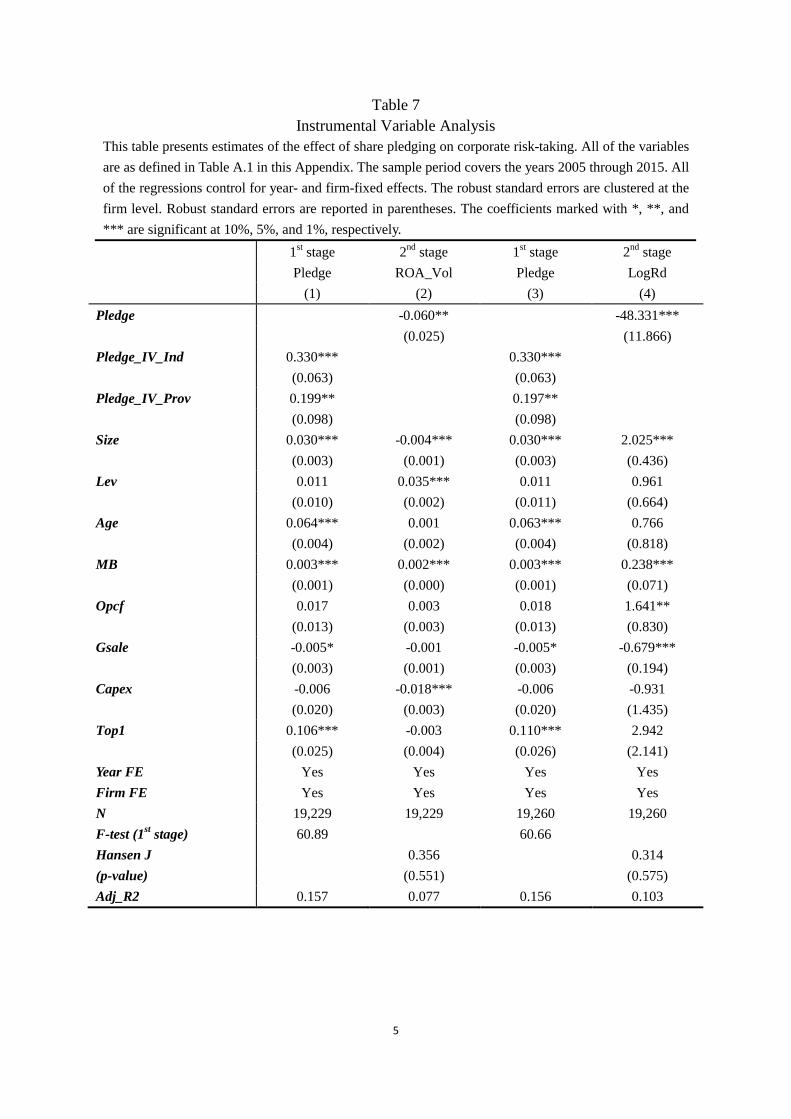
5
Table 7
Instrumental Variable Analysis
This table presents estimates of the effect of share pledging on corporate risk-taking. All of the variables
are as defined in Table A.1 in this Appendix. The sample period covers the years 2005 through 2015. All
of the regressions control for year- and firm-fixed effects. The robust standard errors are clustered at the
firm level. Robust standard errors are reported in parentheses. The coefficients marked with *, **, and
*** are significant at 10%, 5%, and 1%, respectively.
1st stage 2
nd stage 1
st stage 2
nd stage
Pledge ROA_Vol Pledge LogRd
(1) (2) (3) (4)
Pledge -0.060** -48.331***
(0.025) (11.866)
Pledge_IV_Ind 0.330*** 0.330***
(0.063) (0.063)
Pledge_IV_Prov 0.199** 0.197**
(0.098) (0.098)
Size 0.030*** -0.004*** 0.030*** 2.025***
(0.003) (0.001) (0.003) (0.436)
Lev 0.011 0.035*** 0.011 0.961
(0.010) (0.002) (0.011) (0.664)
Age 0.064*** 0.001 0.063*** 0.766
(0.004) (0.002) (0.004) (0.818)
MB 0.003*** 0.002*** 0.003*** 0.238***
(0.001) (0.000) (0.001) (0.071)
Opcf 0.017 0.003 0.018 1.641**
(0.013) (0.003) (0.013) (0.830)
Gsale -0.005* -0.001 -0.005* -0.679***
(0.003) (0.001) (0.003) (0.194)
Capex -0.006 -0.018*** -0.006 -0.931
(0.020) (0.003) (0.020) (1.435)
Top1 0.106*** -0.003 0.110*** 2.942
(0.025) (0.004) (0.026) (2.141)
Year FE Yes Yes Yes Yes
Firm FE Yes Yes Yes Yes
N 19,229 19,229 19,260 19,260
F-test (1st stage) 60.89 60.66
Hansen J 0.356 0.314
(p-value) (0.551) (0.575)
Adj_R2 0.157 0.077 0.156 0.103
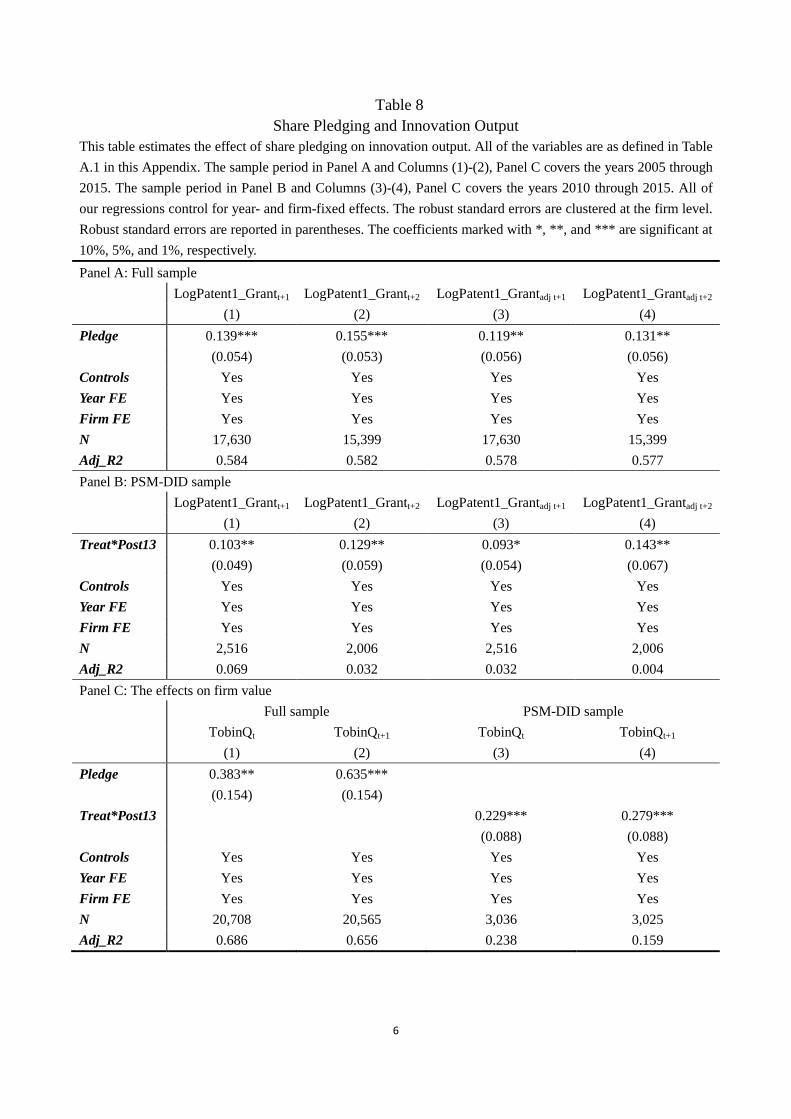
6
Table 8
Share Pledging and Innovation Output
This table estimates the effect of share pledging on innovation output. All of the variables are as defined in Table
A.1 in this Appendix. The sample period in Panel A and Columns (1)-(2), Panel C covers the years 2005 through
2015. The sample period in Panel B and Columns (3)-(4), Panel C covers the years 2010 through 2015. All of
our regressions control for year- and firm-fixed effects. The robust standard errors are clustered at the firm level.
Robust standard errors are reported in parentheses. The coefficients marked with *, **, and *** are significant at
10%, 5%, and 1%, respectively.
Panel A: Full sample
LogPatent1_Grantt+1 LogPatent1_Grantt+2 LogPatent1_Grantadj t+1 LogPatent1_Grantadj t+2
(1) (2) (3) (4)
Pledge 0.139*** 0.155*** 0.119** 0.131**
(0.054) (0.053) (0.056) (0.056)
Controls Yes Yes Yes Yes
Year FE Yes Yes Yes Yes
Firm FE Yes Yes Yes Yes
N 17,630 15,399 17,630 15,399
Adj_R2 0.584 0.582 0.578 0.577
Panel B: PSM-DID sample
LogPatent1_Grantt+1 LogPatent1_Grantt+2 LogPatent1_Grantadj t+1 LogPatent1_Grantadj t+2
(1) (2) (3) (4)
Treat*Post13 0.103** 0.129** 0.093* 0.143**
(0.049) (0.059) (0.054) (0.067)
Controls Yes Yes Yes Yes
Year FE Yes Yes Yes Yes
Firm FE Yes Yes Yes Yes
N 2,516 2,006 2,516 2,006
Adj_R2 0.069 0.032 0.032 0.004
Panel C: The effects on firm value
Full sample PSM-DID sample
TobinQt TobinQt+1 TobinQt TobinQt+1
(1) (2) (3) (4)
Pledge 0.383** 0.635***
(0.154) (0.154)
Treat*Post13 0.229*** 0.279***
(0.088) (0.088)
Controls Yes Yes Yes Yes
Year FE Yes Yes Yes Yes
Firm FE Yes Yes Yes Yes
N 20,708 20,565 3,036 3,025
Adj_R2 0.686 0.656 0.238 0.159
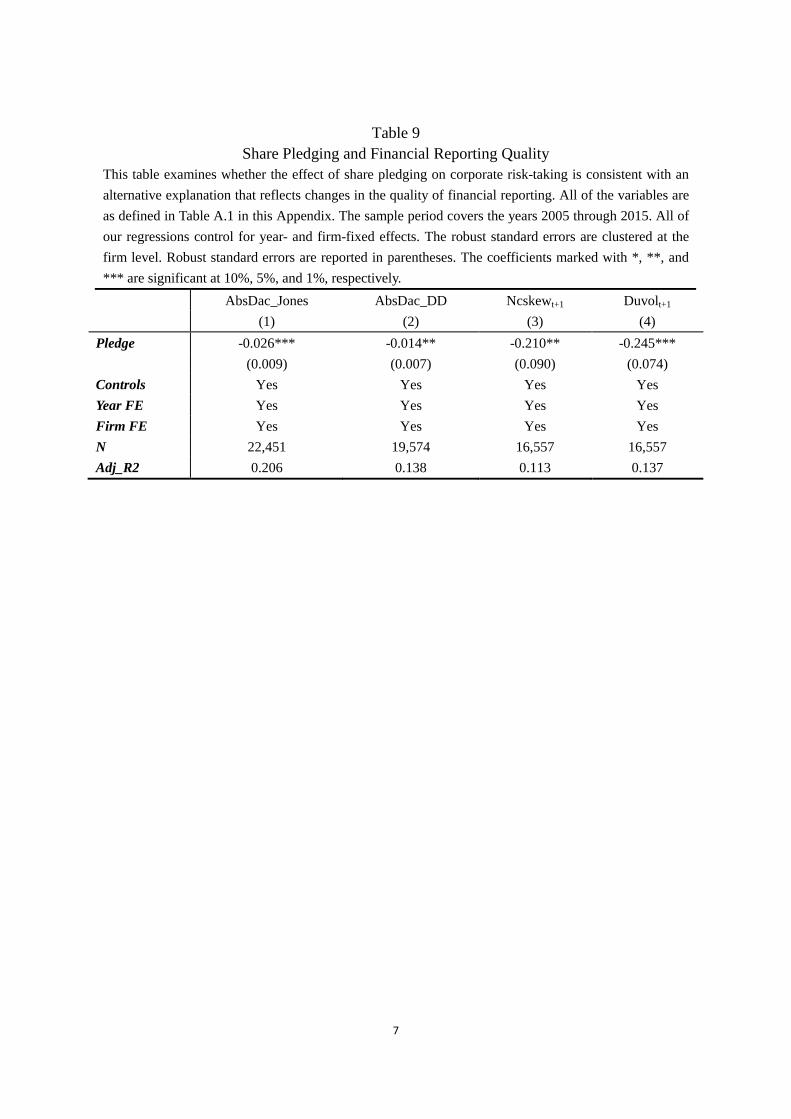
7
Table 9
Share Pledging and Financial Reporting Quality
This table examines whether the effect of share pledging on corporate risk-taking is consistent with an
alternative explanation that reflects changes in the quality of financial reporting. All of the variables are
as defined in Table A.1 in this Appendix. The sample period covers the years 2005 through 2015. All of
our regressions control for year- and firm-fixed effects. The robust standard errors are clustered at the
firm level. Robust standard errors are reported in parentheses. The coefficients marked with *, **, and
*** are significant at 10%, 5%, and 1%, respectively.
AbsDac_Jones AbsDac_DD Ncskewt+1 Duvolt+1
(1) (2) (3) (4)
Pledge -0.026*** -0.014** -0.210** -0.245***
(0.009) (0.007) (0.090) (0.074)
Controls Yes Yes Yes Yes
Year FE Yes Yes Yes Yes
Firm FE Yes Yes Yes Yes
N 22,451 19,574 16,557 16,557
Adj_R2 0.206 0.138 0.113 0.137
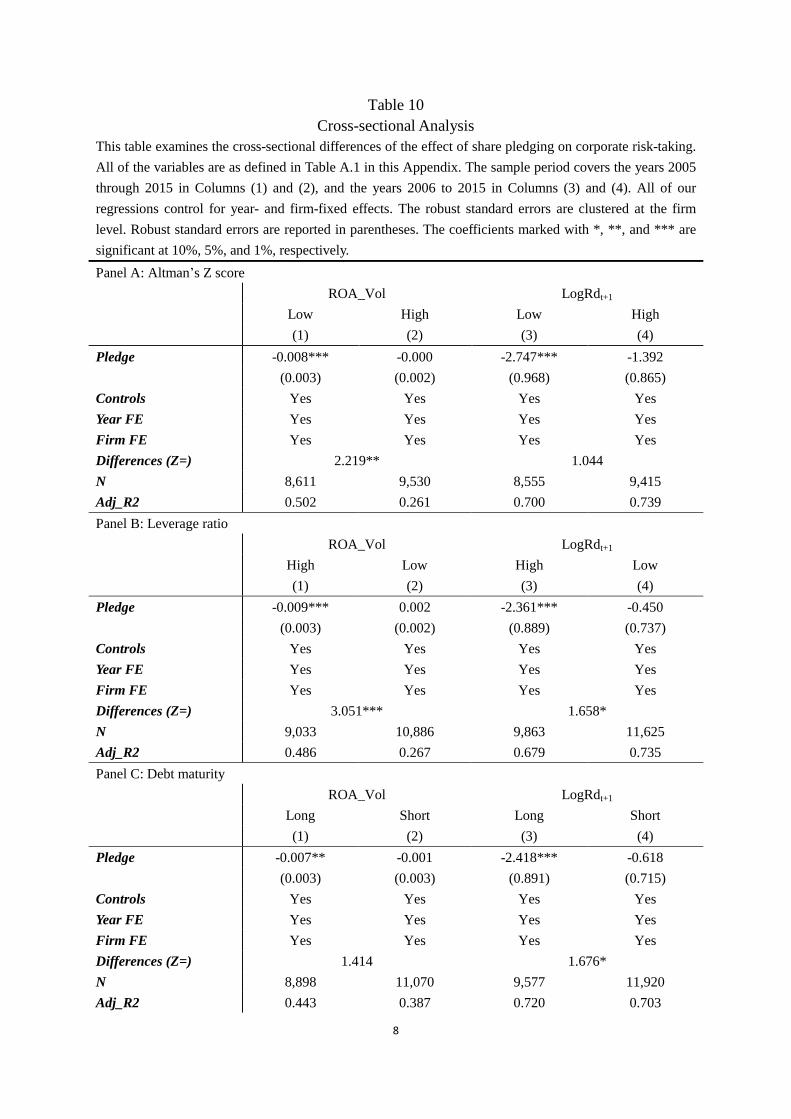
8
Table 10
Cross-sectional Analysis
This table examines the cross-sectional differences of the effect of share pledging on corporate risk-taking.
All of the variables are as defined in Table A.1 in this Appendix. The sample period covers the years 2005
through 2015 in Columns (1) and (2), and the years 2006 to 2015 in Columns (3) and (4). All of our
regressions control for year- and firm-fixed effects. The robust standard errors are clustered at the firm
level. Robust standard errors are reported in parentheses. The coefficients marked with *, **, and *** are
significant at 10%, 5%, and 1%, respectively.
Panel A: Altman’s Z score
ROA_Vol LogRdt+1
Low High Low High
(1) (2) (3) (4)
Pledge -0.008*** -0.000 -2.747*** -1.392
(0.003) (0.002) (0.968) (0.865)
Controls Yes Yes Yes Yes
Year FE Yes Yes Yes Yes
Firm FE Yes Yes Yes Yes
Differences (Z=) 2.219** 1.044
N 8,611 9,530 8,555 9,415
Adj_R2 0.502 0.261 0.700 0.739
Panel B: Leverage ratio
ROA_Vol LogRdt+1
High Low High Low
(1) (2) (3) (4)
Pledge -0.009*** 0.002 -2.361*** -0.450
(0.003) (0.002) (0.889) (0.737)
Controls Yes Yes Yes Yes
Year FE Yes Yes Yes Yes
Firm FE Yes Yes Yes Yes
Differences (Z=) 3.051*** 1.658*
N 9,033 10,886 9,863 11,625
Adj_R2 0.486 0.267 0.679 0.735
Panel C: Debt maturity
ROA_Vol LogRdt+1
Long Short Long Short
(1) (2) (3) (4)
Pledge -0.007** -0.001 -2.418*** -0.618
(0.003) (0.003) (0.891) (0.715)
Controls Yes Yes Yes Yes
Year FE Yes Yes Yes Yes
Firm FE Yes Yes Yes Yes
Differences (Z=) 1.414 1.676*
N 8,898 11,070 9,577 11,920
Adj_R2 0.443 0.387 0.720 0.703
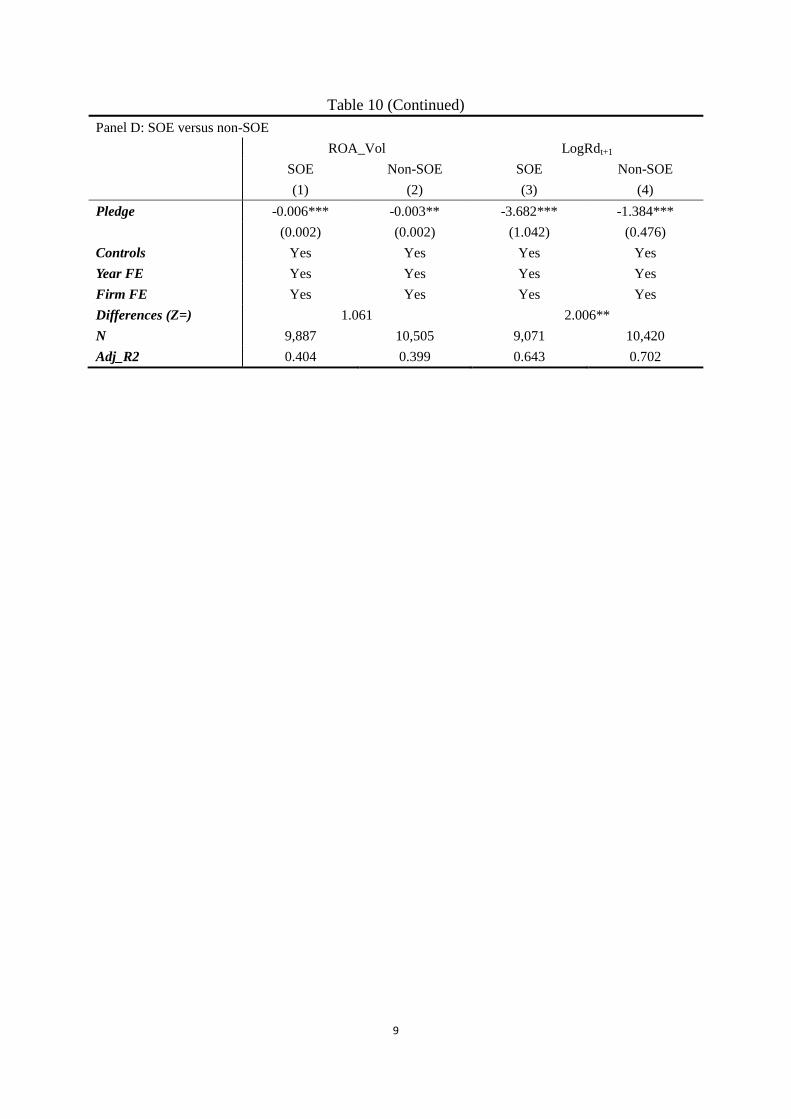
9
Table 10 (Continued)
Panel D: SOE versus non-SOE
ROA_Vol LogRdt+1
SOE Non-SOE SOE Non-SOE
(1) (2) (3) (4)
Pledge -0.006*** -0.003** -3.682*** -1.384***
(0.002) (0.002) (1.042) (0.476)
Controls Yes Yes Yes Yes
Year FE Yes Yes Yes Yes
Firm FE Yes Yes Yes Yes
Differences (Z=) 1.061 2.006**
N 9,887 10,505 9,071 10,420
Adj_R2 0.404 0.399 0.643 0.702
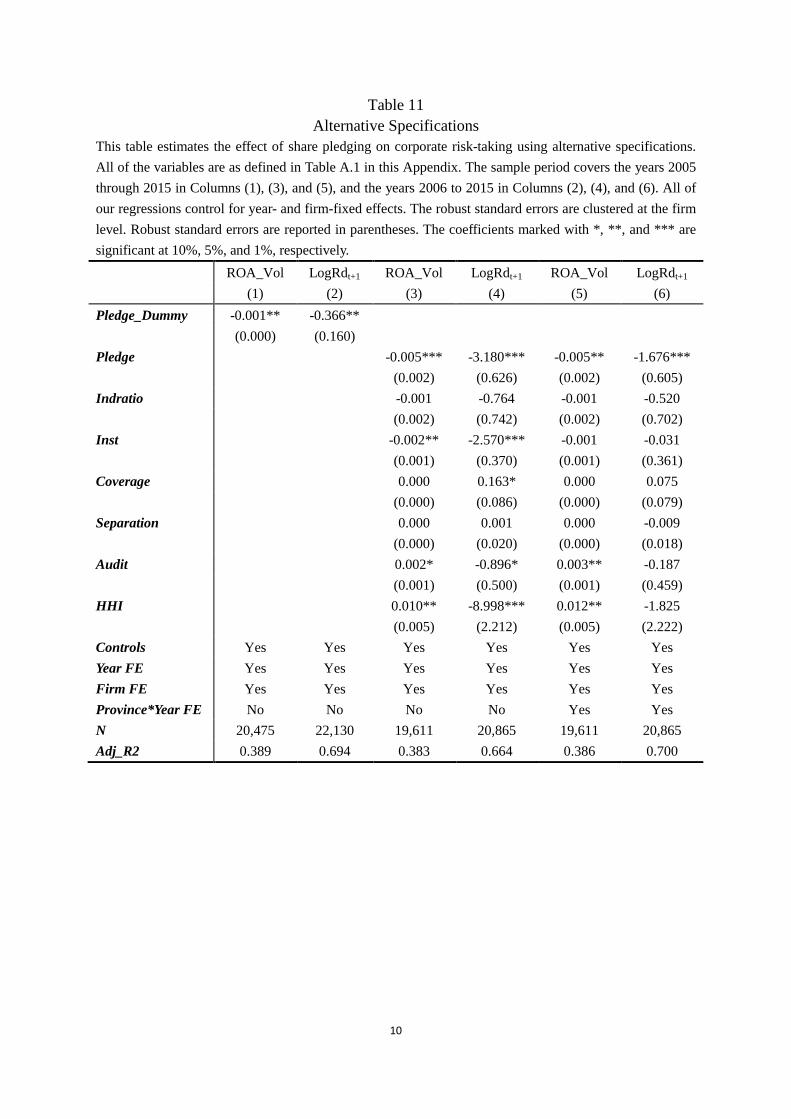
10
Table 11
Alternative Specifications
This table estimates the effect of share pledging on corporate risk-taking using alternative specifications.
All of the variables are as defined in Table A.1 in this Appendix. The sample period covers the years 2005
through 2015 in Columns (1), (3), and (5), and the years 2006 to 2015 in Columns (2), (4), and (6). All of
our regressions control for year- and firm-fixed effects. The robust standard errors are clustered at the firm
level. Robust standard errors are reported in parentheses. The coefficients marked with *, **, and *** are
significant at 10%, 5%, and 1%, respectively.
ROA_Vol LogRdt+1 ROA_Vol LogRdt+1 ROA_Vol LogRdt+1
(1) (2) (3) (4) (5) (6)
Pledge_Dummy -0.001** -0.366**
(0.000) (0.160)
Pledge -0.005*** -3.180*** -0.005** -1.676***
(0.002) (0.626) (0.002) (0.605)
Indratio -0.001 -0.764 -0.001 -0.520
(0.002) (0.742) (0.002) (0.702)
Inst -0.002** -2.570*** -0.001 -0.031
(0.001) (0.370) (0.001) (0.361)
Coverage 0.000 0.163* 0.000 0.075
(0.000) (0.086) (0.000) (0.079)
Separation 0.000 0.001 0.000 -0.009
(0.000) (0.020) (0.000) (0.018)
Audit 0.002* -0.896* 0.003** -0.187
(0.001) (0.500) (0.001) (0.459)
HHI 0.010** -8.998*** 0.012** -1.825
(0.005) (2.212) (0.005) (2.222)
Controls Yes Yes Yes Yes Yes Yes
Year FE Yes Yes Yes Yes Yes Yes
Firm FE Yes Yes Yes Yes Yes Yes
Province*Year FE No No No No Yes Yes
N 20,475 22,130 19,611 20,865 19,611 20,865
Adj_R2 0.389 0.694 0.383 0.664 0.386 0.700
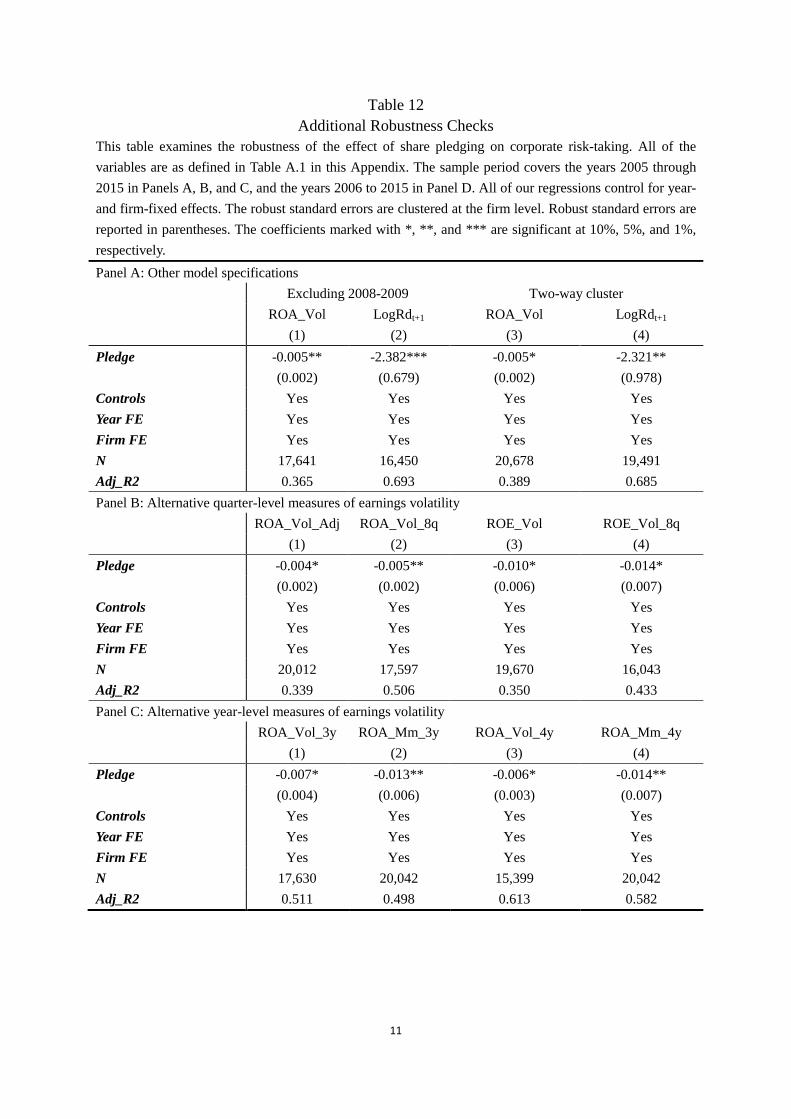
11
Table 12
Additional Robustness Checks
This table examines the robustness of the effect of share pledging on corporate risk-taking. All of the
variables are as defined in Table A.1 in this Appendix. The sample period covers the years 2005 through
2015 in Panels A, B, and C, and the years 2006 to 2015 in Panel D. All of our regressions control for year-
and firm-fixed effects. The robust standard errors are clustered at the firm level. Robust standard errors are
reported in parentheses. The coefficients marked with *, **, and *** are significant at 10%, 5%, and 1%,
respectively.
Panel A: Other model specifications
Excluding 2008-2009 Two-way cluster
ROA_Vol LogRdt+1 ROA_Vol LogRdt+1
(1) (2) (3) (4)
Pledge -0.005** -2.382*** -0.005* -2.321**
(0.002) (0.679) (0.002) (0.978)
Controls Yes Yes Yes Yes
Year FE Yes Yes Yes Yes
Firm FE Yes Yes Yes Yes
N 17,641 16,450 20,678 19,491
Adj_R2 0.365 0.693 0.389 0.685
Panel B: Alternative quarter-level measures of earnings volatility
ROA_Vol_Adj ROA_Vol_8q ROE_Vol ROE_Vol_8q
(1) (2) (3) (4)
Pledge -0.004* -0.005** -0.010* -0.014*
(0.002) (0.002) (0.006) (0.007)
Controls Yes Yes Yes Yes
Year FE Yes Yes Yes Yes
Firm FE Yes Yes Yes Yes
N 20,012 17,597 19,670 16,043
Adj_R2 0.339 0.506 0.350 0.433
Panel C: Alternative year-level measures of earnings volatility
ROA_Vol_3y ROA_Mm_3y ROA_Vol_4y ROA_Mm_4y
(1) (2) (3) (4)
Pledge -0.007* -0.013** -0.006* -0.014**
(0.004) (0.006) (0.003) (0.007)
Controls Yes Yes Yes Yes
Year FE Yes Yes Yes Yes
Firm FE Yes Yes Yes Yes
N 17,630 20,042 15,399 20,042
Adj_R2 0.511 0.498 0.613 0.582
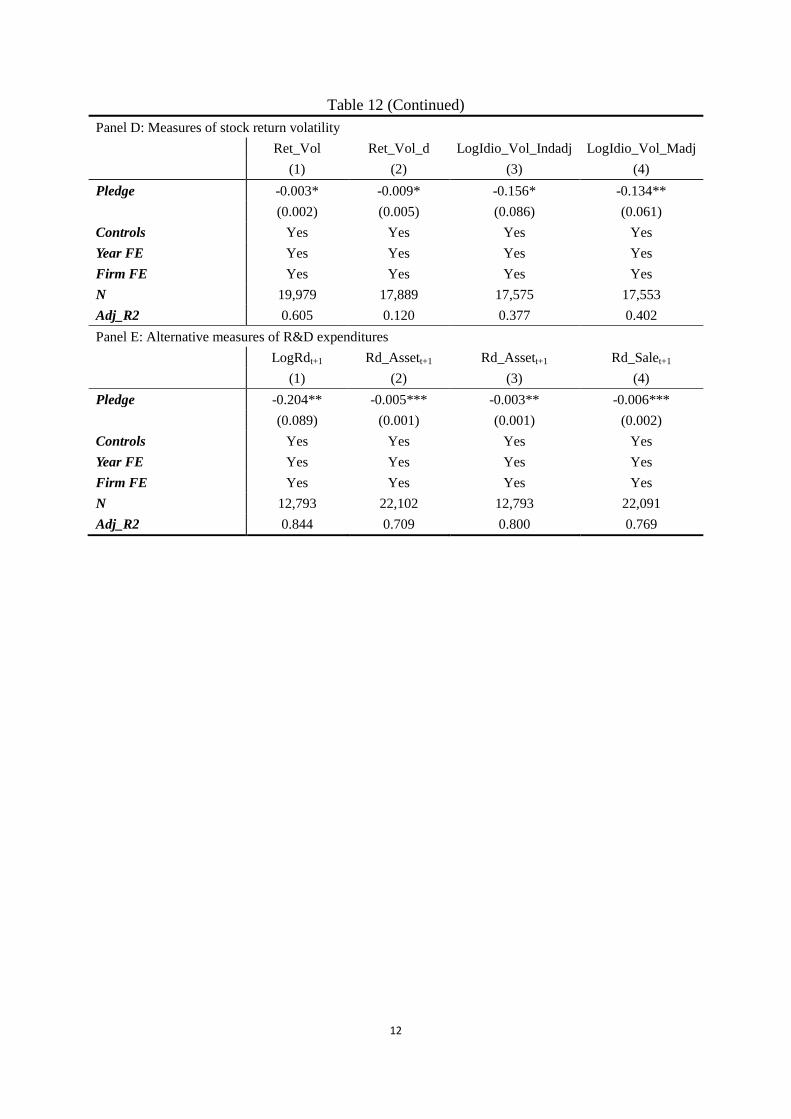
12
Table 12 (Continued)
Panel D: Measures of stock return volatility
Ret_Vol Ret_Vol_d LogIdio_Vol_Indadj LogIdio_Vol_Madj
(1) (2) (3) (4)
Pledge -0.003* -0.009* -0.156* -0.134**
(0.002) (0.005) (0.086) (0.061)
Controls Yes Yes Yes Yes
Year FE Yes Yes Yes Yes
Firm FE Yes Yes Yes Yes
N 19,979 17,889 17,575 17,553
Adj_R2 0.605 0.120 0.377 0.402
Panel E: Alternative measures of R&D expenditures
LogRdt+1 Rd_Assett+1 Rd_Assett+1 Rd_Salet+1
(1) (2) (3) (4)
Pledge -0.204** -0.005*** -0.003** -0.006***
(0.089) (0.001) (0.001) (0.002)
Controls Yes Yes Yes Yes
Year FE Yes Yes Yes Yes
Firm FE Yes Yes Yes Yes
N 12,793 22,102 12,793 22,091
Adj_R2 0.844 0.709 0.800 0.769