Shanks Group plc - Renewi/media/Files/R/.../shanks-reports-presentations/... · ‘Volumes expected...
44
Shanks Group plc Preliminary Results 2014/15 21 May 2015
Transcript of Shanks Group plc - Renewi/media/Files/R/.../shanks-reports-presentations/... · ‘Volumes expected...

Shanks Group plc
Preliminary Results 2014/15
21 May 2015

Disclaimer
2
This presentation contains certain forward-looking statements with respect to the
operations, performance and financial condition of the Group. These forward-looking
statements are subject to risks, uncertainties and other factors which as a result could
cause Shanks Group’s actual future financial condition, performance and results to
differ materially from the plans, goals and expectations set out in the forward-looking
statements. Such statements are made only as at the date of this presentation and,
except to the extent legally required, Shanks Group undertakes no obligation to revise
or update such forward-looking statements.

Agenda
Introduction
Operating Review
Future Growth
Peter Dilnot Group Chief Executive
Toby Woolrych Group Finance Director
Peter Dilnot Group Chief Executive
3

To format the body text,
simply highlight the specific
line(s) of text and click ‘tab’ or
press ‘increase/decrease list
level’ button. If you continue
to click the ‘Tab’ button and
the text turns red you have
tabbed too far and should use
the ‘decrease level’ button to
return to compliant text.
Do not use the bullet point
button to format your text.
Key Messages
Challenging FY15 but stronger second half delivered as committed
Core Dutch solid waste markets improving as predicted and we are now well
positioned for recovery
Ongoing investment plan in new infrastructure on track to deliver high
quality earnings growth
Refined strategy and new organisation implemented to accelerate growth
Shanks has positive momentum and clear plan to deliver sustained profitable
growth
1
2
3
4
5
4

2014/15 Preliminary Results
Revenue & Profits • Revenue up 1% at constant currency
• Underlying PBT down 22% at constant currency
Benelux Solid
Waste
• On-going competitive pressure and lower recyclate values
• Improvement initiatives are on track, delivering impact
Growth Divisions • Hazardous Waste capacity investments on track, 11% decline in
trading profit due to ramp-up
• UK Municipal trading profit increased by 9%
Cash Flow &
Financing
• Tight cash management debt lower than expectations at £155m
• Net Debt: EBITDA at 2.3x
EPS & Dividend • EPS down 7% at constant currency
• Final dividend maintained at 2.35p per share, reflecting confidence
5

H1 One-off items Seasonality ATM volumes Benelux Solid Waste
Canada H2
Delivered Stronger Second Half
Adjustments H2 Improvements
Active management delivered committed H2 performance
6

‘Volumes expected to increase’
‘Incinerator gate fees increasing’
‘Increasingly supportive legislation’
‘Potential market consolidation’
NL SW Market Improving as Predicted
● C&D
Improving construction stats and confidence
Still at historic lows, so recovery expected
● I&C
NL GDP growth: +0.3% in Q3 14; +0.8% in Q4 14
Higher recycling rates expected
● New taxes driving need for more recycling
Domestic incinerator tax implemented from 1 Jan 15
Export tax proposed from 1 Jul 15
● Further Government intentions to increase
recycling
• NL excess capacity now taken-up by imports
and outlook similar
• Capacity ‘balance’ is leading to increased
gate fees (spot market)
• Incinerator prices have second order effect
on recycling gate fees
• Indaver recently sold, VGG restructuring
• Medium-sized players streamlining and
considering options
• Smaller players under pressure and in some
cases ceasing to trade
7

Agenda
Introduction
Operating Review
Future Growth
Peter Dilnot Group Chief Executive
Toby Woolrych Group Finance Director
Peter Dilnot Group Chief Executive
8

To edit the table simply over
type the sample text
Alternatively…
If you have created a table in
Excel delete the example
table and the table
placeholder on the slide, then
go to Excel
select the data…
>Right click on the table
>’Copy’
(Go to your PowerPoint file)
>’Paste’ table into relevant
slide and format the style
accordingly
Note: Any figures to be
focussed on should be
highlighted in Light Green
Revenue 601.4 633.4 (32.0) -5% 1%
Trading Profit 34.3 45.6 (11.3) -25% -19%
Net Interest (13.4) (15.8)
Income from associates and JVs 0.8 0.3
Underlying profit before tax 21.7 30.1 (8.4) -28% -22%
Non-trading and exceptional items (42.2) (22.5) (19.7)
(Loss) profit before tax (20.5) 7.6 (28.1)
Taxation 2.3 (5.8)
(Loss) profit after tax (18.2) 1.8 (20.0)
Discontinued operations 1.3 (30.0)
Loss after tax (16.9) (28.2) 11.3
Continuing operations:
Basic earnings per share (p) (4.6) 0.4 (5.0)
Underlying earnings per share (p) 5.0 5.7 (0.7) -12% -7%
Dividend (pence per share)* 3.45p 3.45p -
Income Statement - Year ended March 2015
*March 2015 proposed dividend
Comparatives for 2014 have been restated following the adoption of IFRS 11 and the requirement to equity account for joint ventures
Mar 15
£m
Mar 14
£m
Change
£m %
Excluding
currency
change %
9

To edit the table simply over
type the sample text
Alternatively…
If you have created a table in
Excel delete the example
table and the table
placeholder on the slide, then
go to Excel
select the data…
>Right click on the table
>’Copy’
(Go to your PowerPoint file)
>’Paste’ table into relevant
slide and format the style
accordingly
Note: Any figures to be
focussed on should be
highlighted in Light Green
To format the body text,
simply highlight the specific
line(s) of text and click ‘tab’ or
press ‘increase/decrease list
level’ button. If you continue
to click the ‘Tab’ button and
the text turns red you have
tabbed too far and should use
the ‘decrease level’ button to
return to compliant text.
Do not use the bullet point
button to format your text.
Revenue
Netherlands Solid Waste 224.8 223.3 1.5 1%
Belgium Solid Waste 105.6 108.7 (3.1) -3%
Belgium Others 64.9 69.7 (4.8) -7%
Intra-segment (16.0) (18.3) 2.3
Total Revenue 379.3 383.4 (4.1) -1%
Total Revenue (£m) 297.2 323.2 (26.0) -8%
Trading Profit
Netherlands Solid Waste 12.0 14.2 (2.2) -15%
Belgium Solid Waste 5.0 6.7 (1.7) -25%
Belgium Others 9.9 11.5 (1.6) -14%
Divisional central services (11.7) (9.1) (2.6)
Total Trading Profit 15.2 23.3 (8.1) -35%
Total Trading Profit (£m) 11.9 19.7 (7.8) -40%
Trading Margin
Netherlands Solid Waste 5.3% 6.4%
Belgium Solid Waste 4.7% 6.2%
Belgium Others 15.3% 16.5%
Total Trading Margin 4.0% 6.1%
Netherlands Solid Waste 5.0% 6.5%
Belgium 38.3% 47.3%
Total Return on
operating assets
Return on operating assets
11.3%8.3%
Solid Waste Benelux
Netherlands Solid Waste
• Weakness in core markets, particularly H1
• Volumes flat despite fall in landfill
• Stronger H2 due to incinerator tax and actions
Belgium Solid Waste
• Margins impacted by Gent & SRF
• Stabilising end markets
• Successful key contract renewals for FY16, at lower
prices
Belgium Others
• Landfill declining as expected
• Industrial Cleaning Wallonia weak
Cost/Price actions deliver stronger H2
• Commercial effectiveness
• Structural cost programme €1.6m per annum
• Continuous improvement programme €1m per annum
Mar 15
€m
Mar 14
€m
Change
€m %
Comparatives adjusted for adoption of IFRS 11
10

To edit the table simply over
type the sample text
Alternatively…
If you have created a table in
Excel delete the example
table and the table
placeholder on the slide, then
go to Excel
select the data…
>Right click on the table
>’Copy’
(Go to your PowerPoint file)
>’Paste’ table into relevant
slide and format the style
accordingly
Note: Any figures to be
focussed on should be
highlighted in Light Green
To format the body text,
simply highlight the specific
line(s) of text and click ‘tab’ or
press ‘increase/decrease list
level’ button. If you continue
to click the ‘Tab’ button and
the text turns red you have
tabbed too far and should use
the ‘decrease level’ button to
return to compliant text.
Do not use the bullet point
button to format your text.
Hazardous Waste
Stronger H2 as new equipment came on
line
Soil performance
• Thermal soil intake strong
• H1 impacted by old flue gas cleaner, now replaced
• Soil washing closed during period
Water treatment
• Intake overall broadly flat
• Some volatility in volumes
Pyro & packed chemical waste
• Intake reduced to manage contamination risk
Industrial Cleaning markets tighten
• Record revenue exceeds €100m
• Low oil price causing market weakness
Mar 15
€m
Mar 14
€m
Change
€m %
Revenue 176.2 175.8 0.4 0%
Total Revenue (£m) 138.0 148.2 (10.2) -7%
Trading Profit
Hazardous Waste 22.6 25.7 (3.1) -12%
Divisional central services (1.6) (2.2) 0.6
Total Trading Profit 21.0 23.5 (2.5) -11%
Total Trading Profit (£m) 16.4 19.9 (3.5) -18%
Trading Margin 11.9% 13.4%
Total Return on
operating assets34.7%25.7%
11

To edit the table simply over
type the sample text
Alternatively…
If you have created a table in
Excel delete the example
table and the table
placeholder on the slide, then
go to Excel
select the data…
>Right click on the table
>’Copy’
(Go to your PowerPoint file)
>’Paste’ table into relevant
slide and format the style
accordingly
Note: Any figures to be
focussed on should be
highlighted in Light Green
To format the body text,
simply highlight the specific
line(s) of text and click ‘tab’ or
press ‘increase/decrease list
level’ button. If you continue
to click the ‘Tab’ button and
the text turns red you have
tabbed too far and should use
the ‘decrease level’ button to
return to compliant text.
Do not use the bullet point
button to format your text.
Revenue
Netherlands 18.7 18.9 (0.2) -1%
Canada 15.6 16.0 (0.4) -3%
Other Organics 4.3 5.7 (1.4) -25%
Total Revenue 38.6 40.6 (2.0) -5%
Total Revenue (£m) 30.0 34.2 (4.2) -12%
Trading Profit
Netherlands 1.6 2.9 (1.3) -45%
Canada 3.7 3.3 0.4 12%
Other Organics 0.8 (0.1) 0.9 n/a
Divisional central services (1.7) (1.2) (0.5)
Total Trading Profit 4.4 4.9 (0.5) -8%
Total Trading Profit (£m) 3.4 4.1 (0.7) -17%
Trading Margin
Netherlands 8.6% 15.3%
Canada 23.7% 20.6%
Other Organics 18.6% -1.8%
Total Trading Margin 11.4% 12.1%
Return on operating assets
Netherlands -0.1% 5.1%
Canada 10.1% 8.3%
Other Organics 2.2% -0.3%
Total Return on
operating assets
UK Joint Venture (£m) Mar 15 Mar 14 Change %
Revenue 2.6 2.0 0.6 30%
Trading Profit 0.7 0.3 0.4 124%
4.2% 5.0%
Organics
Solid performance, offsetting known
headwinds
Netherlands
• Composting volumes flat
• Renewal of long term contracts for Biocel at lower margins, as forecast
• Canada bid costs, as forecast
Canada
• London volumes down due to Toronto
• Improving operational performance
• York contract extended and increased
• Surrey 25-year contract awarded
Other & Joint Ventures
• Improved returns from Belgian AD
• Record performance from Cumbernauld AD
Mar 15
€m
Mar 14
€m
Change
€m %
Results for Canada shown at constant currency; comparatives adjusted for adoption of IFRS 11
12

To edit the table simply over
type the sample text
Alternatively…
If you have created a table in
Excel delete the example
table and the table
placeholder on the slide, then
go to Excel
select the data…
>Right click on the table
>’Copy’
(Go to your PowerPoint file)
>’Paste’ table into relevant
slide and format the style
accordingly
Note: Any figures to be
focussed on should be
highlighted in Light Green
To format the body text,
simply highlight the specific
line(s) of text and click ‘tab’ or
press ‘increase/decrease list
level’ button. If you continue
to click the ‘Tab’ button and
the text turns red you have
tabbed too far and should use
the ‘decrease level’ button to
return to compliant text.
Do not use the bullet point
button to format your text.
UK Municipal
Existing Contracts
• Good overall performance
• Record diversion increases profit
• Continuous Improvement and procurement initiatives
launched
• ELWA fire damage under repair
Construction
• BDR in commissioning and shipping fuel to
Ferrybridge
• Wakefield approaching commissioning on schedule
• Derby Financial Close in August & construction
started
Directors’ valuation of the PFI portfolio
maintained at £110m
Mar 14
£m
Change
£m %
Revenue 144.6 137.5 7.1 5%
Trading Profit
UK Municipal 15.0 13.1 1.9 15%
Divisional central services (5.0) (3.9) (1.1)
Total Trading Profit 10.0 9.2 0.8 9%
Trading Margin 6.9% 6.7%
Mar 15
£m
13

To edit the table simply over
type the sample text
Alternatively…
If you have created a table in
Excel delete the example
table and the table
placeholder on the slide, then
go to Excel
select the data…
>Right click on the table
>’Copy’
(Go to your PowerPoint file)
>’Paste’ table into relevant
slide and format the style
accordingly
Note: Any figures to be
focussed on should be
highlighted in Light Green
To format the body text,
simply highlight the specific
line(s) of text and click ‘tab’ or
press ‘increase/decrease list
level’ button. If you continue
to click the ‘Tab’ button and
the text turns red you have
tabbed too far and should use
the ‘decrease level’ button to
return to compliant text.
Do not use the bullet point
button to format your text.
Impairment of assets (12.4) (3.1)
Impairment of goodwill and acquisition intangibles (11.1) (15.3)
Reassessment of discount rate for long-term provisions (7.1) -
Restructuring charges (6.5) (8.7)
Canadian contract issues (3.0) -
UK Municipal lifecycle (2.3) -
Onerous contract provisions (2.1) 5.5
Amortisation of acquisition intangibles (1.9) (2.3)
Cost relating to fires at Gent and a UK Municipal site (1.0) -
Portfolio activities (1.0) -
Acquisition costs (0.6) -
Belgium waste disposal costs 0.1 (1.7)
Reassessment of contingent consideration 0.8 1.0
Exit from loss making Hygea contract 1.4 2.2
UK Associates income 4.4 -
Change in fair value of derivatives 0.1 0.3
Insurance settlement net of impairment of assets in
relation to a fire in the Netherlands - 2.3
Aborted bid costs - (2.9)
Belgium litigation provision - (0.9)
Hazardous Waste net litigation recovery - 1.4
Exceptional interest charge in relation to Belgium litigation - (0.3)
Total non-trading and exceptional items (42.2) (22.5)
Non-trading and Exceptional Items
• Impairments of £23.5m all non cash
• Cash costs of £7.8m
• Market driven non-cash impairments to
NL goodwill and assets in Belgium &
UK
• Macro-economy driven impact on
discount rate and hence carrying value
of long term provisions
• Restructuring in line with expectations
and driving core repositioning
Mar 15
£m
Mar 14
£m
Continuing operations only
14
Significant reduction in non-trading & exceptional costs expected next year

To edit the table simply over
type the sample text
Alternatively…
If you have created a table in
Excel delete the example
table and the table
placeholder on the slide, then
go to Excel
select the data…
>Right click on the table
>’Copy’
(Go to your PowerPoint file)
>’Paste’ table into relevant
slide and format the style
accordingly
Note: Any figures to be
focussed on should be
highlighted in Light Green
To format the body text,
simply highlight the specific
line(s) of text and click ‘tab’ or
press ‘increase/decrease list
level’ button. If you continue
to click the ‘Tab’ button and
the text turns red you have
tabbed too far and should use
the ‘decrease level’ button to
return to compliant text.
Do not use the bullet point
button to format your text.
Cash Flow Performance
• Core EBITDA decline due to trading and
currency
• Ratio of replacement capital expenditure to
depreciation of 75% (2014: 48%) due to ESP
flue gas cleaner at ATM and Belgium truck
replacement
• Interest and tax payments phasing
• Growth capital mostly in Hazardous Waste
• Positive timing on PFI investments, some
reversing next year
• Other includes pension deficit payment, prior
year includes NL asset sales
Mar 14
£m
Free cash flow conversion is defined as underlying free cash flow
divided by trading profit
Cash flow includes both continuing and discontinued operations
EBITDA 72.8 82.9
Working capital movement and other (1.7) 9.3
Net replacement capital expenditure (29.3) (20.9)
Interest and tax (18.4) (14.8)
Underlying free cash flow 23.4 56.5
Growth capital expenditure (12.8) (18.6)
Acquisitions and disposals (1.5) 12.1
Restructuring spend (7.6) (9.3)
Dividends paid (13.7) (13.7)
PFI funding (7.3) (19.3)
Other (5.2) 2.5
Net core cash flow (24.7) 10.2
Free cash flow conversion 69% 137%
Mar 15
£m
Tight cash management in a challenging market
15

To format the body text,
simply highlight the specific
line(s) of text and click ‘tab’ or
press ‘increase/decrease list
level’ button. If you continue
to click the ‘Tab’ button and
the text turns red you have
tabbed too far and should use
the ‘decrease level’ button to
return to compliant text.
Do not use the bullet point
button to format your text.
Impact of FX
Majority of EBITDA and borrowings are in Euros : naturally hedged
Euro has weakened by 14% vs GBP in the last 24 months
• reduced GBP borrowing capacity by £30m
• reduced Total Net Worth by £30m
Covenant amendment obtained to de-risk currency impact
• Net debt : EBITDA now 3.5x for 18 months
• Total Net Worth reduced to £200m
FY16 currency impact per cent of movement: Revenue £3m, Trading Profit £250k,
EBITDA £500k, PBT £150k, Total Net Worth £1m
1
2
3
4
16
Proactive management of FX exposure

To edit the table simply over
type the sample text
Alternatively…
If you have created a table in
Excel delete the example
table and the table
placeholder on the slide, then
go to Excel
select the data…
>Right click on the table
>’Copy’
(Go to your PowerPoint file)
>’Paste’ table into relevant
slide and format the style
accordingly
Note: Any figures to be
focussed on should be
highlighted in Light Green
To format the body text,
simply highlight the specific
line(s) of text and click ‘tab’ or
press ‘increase/decrease list
level’ button. If you continue
to click the ‘Tab’ button and
the text turns red you have
tabbed too far and should use
the ‘decrease level’ button to
return to compliant text.
Do not use the bullet point
button to format your text.
0
50
100
150
200
250
300
350
400
Mar 13 Mar 14 Sep 14 Mar 15
Net Debt Facilities EBITDA Covenant
Movement in Core Net Debt
Sep 14 Mar 14
Careful debt management in volatile currency markets
17
Mar 15 Mar 13
Headroom (facilities plus cash) £157m £201m £188m £154m
Headroom (leverage) £77m £98m £74m £97m
Net debt / EBITDA 2.0x 1.9x 2.1x 2.3x
Interest cover 3.7x 3.7x 3.1x 3.6x
Total net worth headroom £119m £66m £34m £42m

Agenda
Introduction
Operating Review
Future Growth
Peter Dilnot Group Chief Executive
Toby Woolrych Group Finance Director
Peter Dilnot Group Chief Executive
18

Strong Long-term Growth Drivers
Clear Macro Drivers Legislation and Regulation
Reduce greenhouse gases
Move to renewable energy
Save valuable virgin resources
Improve air quality
• Landfill Directive
• Revised Waste Framework
• Landfill and incinerator taxes
• PFI/PPP credits
• Segregated collections
• Municipal recycling targets
EU
National
Regional
Shanks Unique Position
Glo
ba
l T
ren
d
19
1
2
3
4
1 Percentage of total waste sent to landfill
Waste hierarchy NL BE UK CA

TO BE THE MOST RESPECTED
COMPANY
WASTE-TO-PRODUCT
Refined Vision
CUSTOMERS EMPLOYEES INVESTORS COMMUNITIES
Reflects our unique position and future direction
20

Corporate Responsibility
21
2010 - 2015 Objectives 2015 - 2020 Objectives
Leading industry performance today; targeting further differentiation
2015
Target
2015
Performance
RIDDOR
accident
reduction
Recycling &
recovery rate
Carbon
avoidance
(tonnes)
25% 39%
1.3M 1.41M
80% 82%
Primary
Metric
2020
Target
RIDDOR
accidents
Recycling &
recovery rate
Community
Feedback
Engagement
scores
25%
reduction
85%
+25%
+10%
Safety
Sustainability
Environment
Employees

Image>
HAZARDOUS WASTE
Defensible scale and technology leadership in attractive symbiotic niche markets
Image> COMMERCIAL
SOLID WASTE
Market leadership and integrated growth platform in recovering markets
Image>
ORGANICS .
Image>
UK MUNICIPAL
Clear UK and Canadian market leadership in sustainable municipal waste treatment(1)
THE PAST
HAZARDOUS
MUNICIPAL
New Divisional Structure
NOW
22 (1) Sustainable municipal waste treatment = MBT in the UK and Organics in Canada
NL
Canada
MARKET POSITION

Refined Strategy
INCREASED
RETURNS
PROFITABLE
GROWTH
GR
OU
P S
TR
AT
EG
IC P
RIO
RIT
IES
Driving Margin Expansion
Investing in Infrastructure
Managing the Portfolio
Hazardous Commercial Municipal
Vision
TO BE THE MOST
RESPECTED
WASTE-TO-PRODUCT
COMPANY
23

Divisional Strategies
Position Strategy
2
3
1
Position Strategy
Position Strategy
• EU market leadership in thermal soil
treatment
• Advantaged water technology and harbour
location
• Proven excellence in NL industrial services
• Integrated and synergistic operations
Hazardous
Commercial
Municipal
• Market leader in Dutch C&D collection and
treatment
• I&C scale and advantage route density in
selected Benelux regions
• Strong local presence and respected brands
• Excellent product quality and certifications(1)
• Market leader in UK MBT (mechanical,
biological treatment)
• Deep experience of long-term contracts
• Leading quality producer of SRF
• Established provider of robust organics
treatment in North America
Invest in environmental excellence
Ramp-up new capacity
Broaden scope of inputs and
treatments
Expand geographic footprint 4
Sustain current contracts
Ramp-up new assets (UK & Canada)
Secure incremental volumes to
maximise utilisation
Win new long-term contracts in
target growth areas
2
3
1
4
Growth while
maintaining
attractive
returns
Delivering
previous
profitability
and returns
Growth from
new assets
and further
wins
Ensure lowest cost position
Focus commercial activity on
profitable segments
Gain share through cycle
Create quality products for target
markets
2
3
1
4
24 (1) Includes high-CV SRF and ICOPOWER pellets (registered trade mark)

Margin Expansion
Strategy Execution
Target 12.15% post-tax returns
Strong preference for secure inputs,
often under long-term contract
Rigorous structured process to filter,
test, implement and post mortem
Develop capabilities where excellence creates
advantage and has direct profit impact
Embed capabilities with new processes and
training to ensure sustained ongoing
improvement
Run pilot improvement projects in key
businesses using Shanks expertise and input
from other industries
Roll-out “piloted” capabilities across Group with
PMO support and training
Track and drive profit impact
2
1
2
3
1
Commercial Effectiveness Continuous Improvement
Target 12.15% post-tax returns
Strong preference for secure inputs, often under
long-term contract
Rigorous structured process to filter, test,
implement and post mortem
• Segment customer base according to needs
• Analyse Shanks offering, competition and
profitability
• Direct and track sales activities
Increased share in target
segments, improved price and
margin
• Identify barriers to productivity and utilisation
• Use “lean tools” to improve performance
• Manage improvements through “shop floor”
daily management
Improved productivity and asset
utilisation
Expected
impact
Expected
impact
Example Initiatives
25

Strategy Execution
Target 12.15% post-tax returns
Strong preference for secure inputs,
often under long-term contract
Rigorous structured process to filter,
test, implement and post mortem Deploy capital where Shanks advantaged and
can generate attractive returns
Reinforce market leadership positions to ensure
sustained advantage
Use non-recourse debt to maximise growth
potential where appropriate
Target 15-20% pre-tax returns(1)
Strong preference for secure inputs, often
under long-term contract
Rigorous structured process to filter, test,
implement and review
2
3
1
2
3
1
Infrastructure Investment
Strong pipeline of attractive projects targeted to yield 15-20% pre-tax returns
26
Project Outline Current Status Spend/ Date Earnings Potential Options
BDR/ Wakefield (UK) Large-scale treatment assets
under 25 yr contract In commissioning £35M / FY16 H2 16 on
Retain interest or
redeploy
Harbourside
Expansion (HW)
Increased waterside capacity at
ATM and Rotterdam Build underway £11M / FY15/16 H2 16 on -
Commercial Depot
(NL)
New high-productivity depot in
industrial core Civil work underway £4M / FY16 FY17 on -
Surrey Bio-Fuels
(Canada)
Integrated organics treatment
asset under 25 yr contract Build due to start
£26M / FY16/17
FY18 on Retain interest or
redeploy
Derby
(UK)
Large scale integrated treatment
assets under 25 yr contract Build underway £17M / FY17 FY18 on
Retain interest or
redeploy
(1) Equates to 12-15% post-tax returns

To edit the table simply over
type the sample text
Alternatively…
If you have created a table in
Excel delete the example
table and the table
placeholder on the slide, then
go to Excel
select the data…
>Right click on the table
>’Copy’
(Go to your PowerPoint file)
>’Paste’ table into relevant
slide and format the style
accordingly
Note: Any figures to be
focussed on should be
highlighted in Light Green
To format the body text,
simply highlight the specific
line(s) of text and click ‘tab’ or
press ‘increase/decrease list
level’ button. If you continue
to click the ‘Tab’ button and
the text turns red you have
tabbed too far and should use
the ‘decrease level’ button to
return to compliant text.
Do not use the bullet point
button to format your text.
Division Div’n
ROA
Investment
Return Spent Allocated Comment
Solid
8.3% 12.9% £29m £5m
• Investment returns well above Division
average
• Commercial depot civils underway
Hazardous
25.7% 39.0% £22m £14m
• Investment returns strong due to
impact of soil and water storage
• Focus for further investment
Organics
4.2% 12.0% £84m £28m
• Returns still ramping, diluted by
central and bid costs
• Surrey Bio-fuels facility build due to
start
Total 12.2% 18.1% £135m £47m
Infrastructure Investment Returns
Additional £300m investment in BDR, Wakefield and Derby underway to add growth to UK Municipal
Focused, market based investment programme delivering favourable returns
27

Portfolio Management
Strategy Execution
Target 12.15% post-tax returns
Strong preference for secure inputs,
often under long-term contract
Rigorous structured process to filter,
test, implement and post mortem
2
1
2
3
1
Moves in last 2 years Potential and future plays
Actively manage business portfolio to build
focused Group with improved returns
Dispose of assets where unclear path to
generating target returns
Acquire businesses that reinforce Shanks and
deliver accretive returns
Develop register of non-core assets, sweat and
then sell when value realised
Cultivate funnel of acquisition targets based on
strategic fit and synergies
Acquire assets while maintaining strong capital
discipline
• Sale of sub-scale loss-making UK Solid Waste
business to Biffa
• Sale of non-core assets and unprofitable
contract exits in Belgium
• Acquisition of small Dutch recycling business
and new HW site in North NL
• Possible sales of non-core standalone plants
and PFI sub-debt
• Acquisition of Dutch SW business where strong
synergies exist
• Acquisition of adjacent business and/or expand
footprint of profitable activities
28
3

To format the body text,
simply highlight the specific
line(s) of text and click ‘tab’ or
press ‘increase/decrease list
level’ button. If you continue
to click the ‘Tab’ button and
the text turns red you have
tabbed too far and should use
the ‘decrease level’ button to
return to compliant text.
Do not use the bullet point
button to format your text.
Growth Strategy Summary
Position Strategy Target
Revenue
Target
Margin
Target
Returns
Defensible scale and
technology leadership in
attractive linked niche
markets
Expand business while
maintaining favourable
returns
Current market leadership
and growth platform in
recovering markets
Leverage market position
to deliver previous
profitability and returns
Clear UK and Canadian
market leadership in
sustainable municipal waste
treatment
Deliver growth from assets
under construction and
new contract wins
Strong legacy local
businesses with identified
levers for margin expansion
Drive margin expansion
through commercial and
operational excellence
Significant investments in
infrastructure through the
cycle
Ramping-up assets in
build and deploy further
capital where advantaged
Assets now mostly focused
in areas with attractive target
returns
Dispose of non-core
assets and acquire
businesses that will
deliver accretive returns
Hazardous
Commercial
Municipal
Margins
Investment
Portfolio
Div
isio
ns
L
eve
rs
29

To format the body text,
simply highlight the specific
line(s) of text and click ‘tab’ or
press ‘increase/decrease list
level’ button. If you continue
to click the ‘Tab’ button and
the text turns red you have
tabbed too far and should use
the ‘decrease level’ button to
return to compliant text.
Do not use the bullet point
button to format your text.
Outlook
Outlook for FY16 unchanged
Entering period of significant investment in high-quality projects
Potential for incremental mid-term upside
Accelerated NL market recovery
Synergistic and accretive acquisitions
Expansion of HW footprint, including Farmsum
Further municipal contract wins in Canada
Higher incineration and landfill taxes
30
1
2
3
Platform for Transformation
Market recovery
Infrastructure investment
Portfolio management
CURRENT
STATUS
•Clear strategy
for growth
•Advanced
investment plans
•Positive
momentum
EXPECTED
OUTCOMES
• Increased profit
and returns
•Larger portfolio
of valuable
assets
•De-leveraged
balance sheet
31
Margin expansion

Appendices – Group Introduction
32

To format the body text,
simply highlight the specific
line(s) of text and click ‘tab’ or
press ‘increase/decrease list
level’ button. If you continue
to click the ‘Tab’ button and
the text turns red you have
tabbed too far and should use
the ‘decrease level’ button to
return to compliant text.
Do not use the bullet point
button to format your text.
Our new divisional structure
● Hazardous Industrial cleaning and treatment of hazardous waste.
● Municipal Operation of waste management facilities under
long-term municipal contracts.
● Commercial Collection and treatment of commercial waste.
Group strategic priorities
● Driving margin expansion Developing world-class capabilities such as Continuous Improvement and Commercial Effectiveness.
● Investing in infrastructure Expanding the footprint and capability with selective investment in new infrastructure.
● Managing the portfolio Continuing to actively manage the portfolio to improve the quality of our earnings.
Our Refined Strategy OUR DIVISIONS
MUNICIPAL COMMERCIAL HAZARDOUS
DRIVING MARGIN EXPANSION
INVESTING IN INFRASTRUCTURE
MANAGING THE PORTFOLIO
INCREASED
RETURNS
PROFITABLE
GROWTH
GR
OU
P S
TR
AT
EG
IC P
RIO
RIT
IES
Vision
TO BE THE MOST
RESPECTED WASTE-
TO-PRODUCT
COMPANY
33

To format the body text,
simply highlight the specific
line(s) of text and click ‘tab’ or
press ‘increase/decrease list
level’ button. If you continue
to click the ‘Tab’ button and
the text turns red you have
tabbed too far and should use
the ‘decrease level’ button to
return to compliant text.
Do not use the bullet point
button to format your text.
Hazardous: Growth Strategy
• Contaminated soil remediation
• Waste water and industrial sludge
treatment
• Industrial ship cleaning and
degassing
• Industrial cleaning and services
Increasingly stringent legislation
plus macro recovery
• EU market leadership in thermal
soil treatment
• Advantaged water technology and
harbour location
• Proven excellence in Dutch
industrial services
• Integrated and synergistic
operations
Market leadership and scale in
attractive linked niches
Invest in environmental excellence
Ramp-up new capacity
Broaden scope of inputs and
treatments
Expand geographic footprint
Grow business while maintaining
attractive returns
1
2
4
3
34
Markets Position Strategy
To format the body text,
simply highlight the specific
line(s) of text and click ‘tab’ or
press ‘increase/decrease list
level’ button. If you continue
to click the ‘Tab’ button and
the text turns red you have
tabbed too far and should use
the ‘decrease level’ button to
return to compliant text.
Do not use the bullet point
button to format your text.
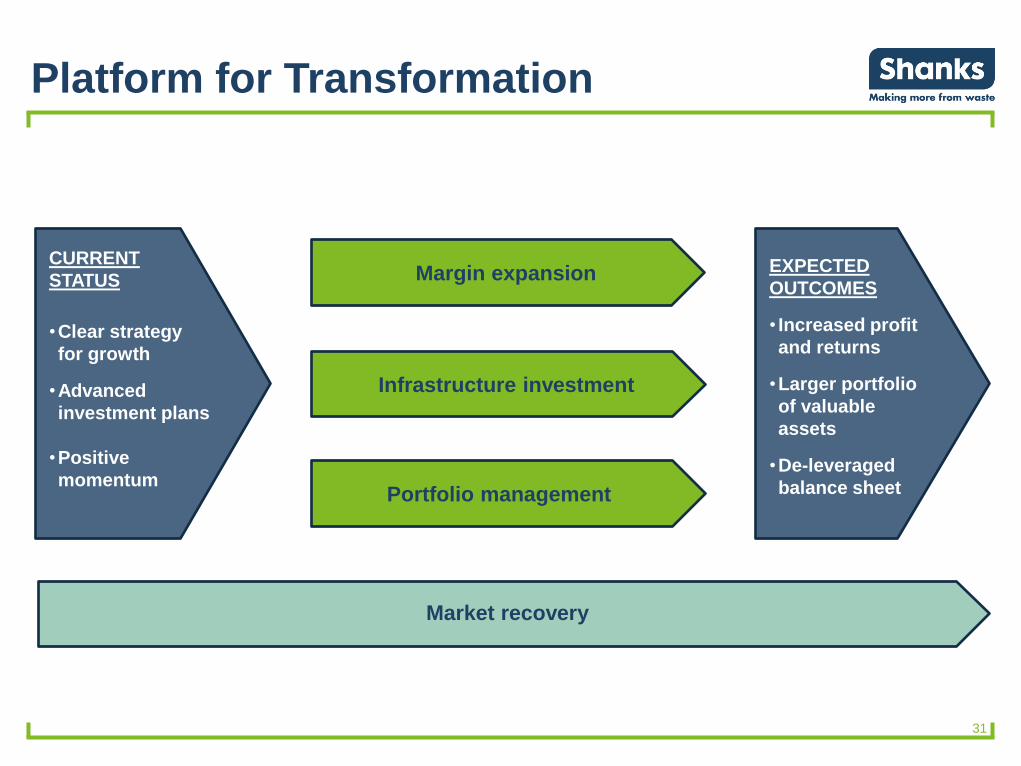
Commercial: Growth Strategy
• Dutch construction and demolition
(C&D)
• Benelux industrial & commercial
(I&C waste)
• Selective municipal Benelux
contracts
• Recycling monostreams (glass &
wood)
Macro recovery plus increased
demand due to legislation
• Market leader in Dutch C&D
collection and treatment
• I&C scale and advantage route
density in selected Benelux regions
• Strong local presence and
respected brands
• Excellent product quality and
certifications(1)
Current market leadership and
growth platform in recovering
markets
Ensure lowest cost position
through productivity & scale
Focus commercial activity on
profitable segments
Gain share through consolidation
and winning business from
distressed competitors
Create high quality products for
target markets
Leverage market position to deliver
previous profitability and returns
1
2
4
3
(1) Icopellets, SRF, wood pellets + 35
Markets Position Strategy

To format the body text,
simply highlight the specific
line(s) of text and click ‘tab’ or
press ‘increase/decrease list
level’ button. If you continue
to click the ‘Tab’ button and
the text turns red you have
tabbed too far and should use
the ‘decrease level’ button to
return to compliant text.
Do not use the bullet point
button to format your text.
Municipal: Growth Strategy
• UK PFI/PPP waste treatment
contracts
• EU waste-derived fuel for industrial
applications(1)
• Organics waste treatment for
Canadian cities
• Integrated municipal waste
treatment contracts in NA
Long-term growth markets as North
America and UK increasingly divert
waste from landfill
• Market leader in UK MBT
(mechanical biological treatment)
• Deep experience (over 15 years) of
long-term contracts
• Leading quality and volume
producer of SRF
• Established provider of robust
organics treatment in NA
Clear UK and Canadian leadership in
sustainable waste solutions(2) for
municipalities
Sustain current contracts in
partnership with local authorities
Ramp-up new assets under
construction In UK and Canada
Secure incremental volumes to
maximise utilisation
Win new long-term contracts in
target growth areas
Deliver growth from assets under
construction and new contract wins
1
2
4
3
(1) Includes RDF and SRF for use in EfW and cement production (2) Sustainable municipal waste treatment = MBT in the UK and Organics in Canada
36
Markets Position Strategy

Group Strategic Levers
Strategy Deploy capital where Shanks advantaged and can
generate attractive returns
Reinforce market leadership positions to ensure
sustained advantage
Use non-recourse debt to maximise growth
potential where appropriate
Target 12-15% post-tax returns
Strong preference for secure inputs, often under
long-term contract
Rigorous structured process to filter, test,
implement and review
2
3
1
Strategy
Embed capabilities with new
processes and training to
ensure sustained ongoing
improvement Strategy
2
3
1
Execution
Execution
2
3
1
Execution
2
3
1
Develop capabilities where excellence creates
advantage and has direct profit impact – examples:
• Commercial effectiveness
• Continuous improvement
Embed capabilities with new processes and training
to ensure sustained ongoing improvement
2
1 Run pilot improvement projects in key businesses
using Shanks expertise and input from other
industries
Roll-out “piloted” capabilities across Group with PMO
support and training
Track and drive profit impact
2
3
1
Actively manage business portfolio to build
focused Group with improved returns
Dispose of assets where unclear path to
generating target returns
Acquire businesses that reinforce Shanks
and deliver accretive returns
Develop register of non-core assets, sweat, and then
sell when value can be realised
Cultivate funnel of acquisition targets based on
strategic fit and synergies
Acquire assets while maintaining strong capital
discipline
Investment in
Infrastructure
Deliver Margin
Improvement
Manage
Portfolio
37

M
>3 DAY
ACCIDENT RATE
-25%
New CR Objectives
M MAJOR/FATAL
ACCIDENTS
ZERO
A CARBON AVOIDANCE
+10%
A MAJOR
ENVIRONMENTAL AND
PERMIT BREACHES
ZERO
A EMPLOYEE TRAINING
AND DEVELOPMENT
NEW*
M LOST TIME
ACCIDENT RATE
-25%
A GREEN ENERGY
PRODUCTION
+60%
A COMMUNITY
ENGAGEMENT SCHEMES
AND INITIATIVES
NEW*
M SHORT-TERM
SICKNESS RATE
NEW*
M NEAR-MISSES &
RATE CLOSED-OUT
75% CLOSE-OUT
A % OPERATING
CENTRES WITH
ISO14001
100%
A EMPLOYEE
COMMUNICATION
SCORE
+20%
Q SENIOR LEADERSHIP
HEALTH & SAFETY
VISITS CONDUCTED
2 PER 1/4
Q
REDUCE COMMUNITY
COMPLAINTS
+25%
A
EMPLOYEE
ENGAGEMENT SCORE
+10%
A
RECYCLE AND
RECOVER RATE
85%
* New – measures and objectives to be developed and set during 2015
Note: in the graphic above the capitals in smaller hexagons indicates internal reporting cycles:
A Annual Q Quarterly M Monthly
38

Appendices – Financial Information
39

To edit the table simply over
type the sample text
Alternatively…
If you have created a table in
Excel delete the example
table and the table
placeholder on the slide, then
go to Excel
select the data…
>Right click on the table
>’Copy’
(Go to your PowerPoint file)
>’Paste’ table into relevant
slide and format the style
accordingly
Note: Any figures to be
focussed on should be
highlighted in Light Green
To format the body text,
simply highlight the specific
line(s) of text and click ‘tab’ or
press ‘increase/decrease list
level’ button. If you continue
to click the ‘Tab’ button and
the text turns red you have
tabbed too far and should use
the ‘decrease level’ button to
return to compliant text.
Do not use the bullet point
button to format your text.
Solid Waste Benelux 297.2 323.2 (8) (1) 11.9 19.7 (40) (35)
Hazardous Waste 138.0 148.2 (7) 0 16.4 19.9 (18) (11)
Organics 30.0 34.2 (12) (5) 3.4 4.1 (17) (8)
UK Municipal 144.6 137.5 5 5 10.0 9.2 9 9
Group central services - - (7.4) (7.3) (1) (1)
Inter-segment revenue (8.4) (9.7) - -
601.4 633.4 (5) 1 34.3 45.6 (25) (19)
Trading ProfitRevenue
Excluding
currency
change %
Segmental Analysis
Mar 15
£m
Mar 14
£m
Change
%
Change
%
Mar 14
£m
Mar 15
£m
Trading profit = operating profit before amortisation of acquisition intangibles and exceptional items
Comparatives for 2014 have been restated following the adoption of IFRS 11 and the requirement to equity account for joint ventures 40
Excluding
currency
change %

To edit the table simply over
type the sample text
Alternatively…
If you have created a table in
Excel delete the example
table and the table
placeholder on the slide, then
go to Excel
select the data…
>Right click on the table
>’Copy’
(Go to your PowerPoint file)
>’Paste’ table into relevant
slide and format the style
accordingly
Note: Any figures to be
focussed on should be
highlighted in Light Green
To format the body text,
simply highlight the specific
line(s) of text and click ‘tab’ or
press ‘increase/decrease list
level’ button. If you continue
to click the ‘Tab’ button and
the text turns red you have
tabbed too far and should use
the ‘decrease level’ button to
return to compliant text.
Do not use the bullet point
button to format your text.
Tangible fixed assets 282.9 322.7
Goodwill & other intangibles 173.8 211.1
Non current PFI/PPP financial assets 246.6 187.4
Trade and other receivables 2.2 2.5
Investments 10.1 8.4
Non current assets 715.6 732.1
Working capital (59.1) (55.5)
Current PFI/PPP financial assets 31.6 8.2
Assets classified as held for sale 3.5 3.2
Pension deficit (16.4) (13.1)
Taxation (14.7) (35.2)
Provisions and other liabilities (49.8) (46.1)
Net core debt (155.0) (152.9)
PFI non recourse net debt (222.6) (151.2)
Derivative financial liabilities (44.0) (16.0)
Net Assets 189.1 273.5
Balance Sheet
Mar 14
£m
Mar 15
£m
41
-150
-100
-50
0
50
100
150
200
250
300
Mar 14 Sep 14 Mar 15
Finance Leases
Bank
Bond
PP
Cash
Net debt
Analysis of Core Net Debt
To format the body text,
simply highlight the specific
line(s) of text and click ‘tab’ or
press ‘increase/decrease list
level’ button. If you continue
to click the ‘Tab’ button and
the text turns red you have
tabbed too far and should use
the ‘decrease level’ button to
return to compliant text.
Do not use the bullet point
button to format your text. To edit the table simply over
type the sample text
Alternatively…
If you have created a table in
Excel delete the example
table and the table
placeholder on the slide, then
go to Excel
select the data…
>Right click on the table
>’Copy’
(Go to your PowerPoint file)
>’Paste’ table into relevant
slide and format the style
accordingly
Note: Any figures to be
focussed on should be
highlighted in Light Green
To edit the chart simply right
click over the graph and click
‘Edit Data’
If you have created a graph in
Excel simply highlight the
relevant data from Excel and
copy / paste the data to
replace the sample data on
the graph provided in the
PowerPoint file.
Alternatively…
Select the graph from Excel…
>Right click on the graph
>’Copy’ (Go to your PowerPoint file)
>’Paste’ graph into relevant
slide and format the style
accordingly
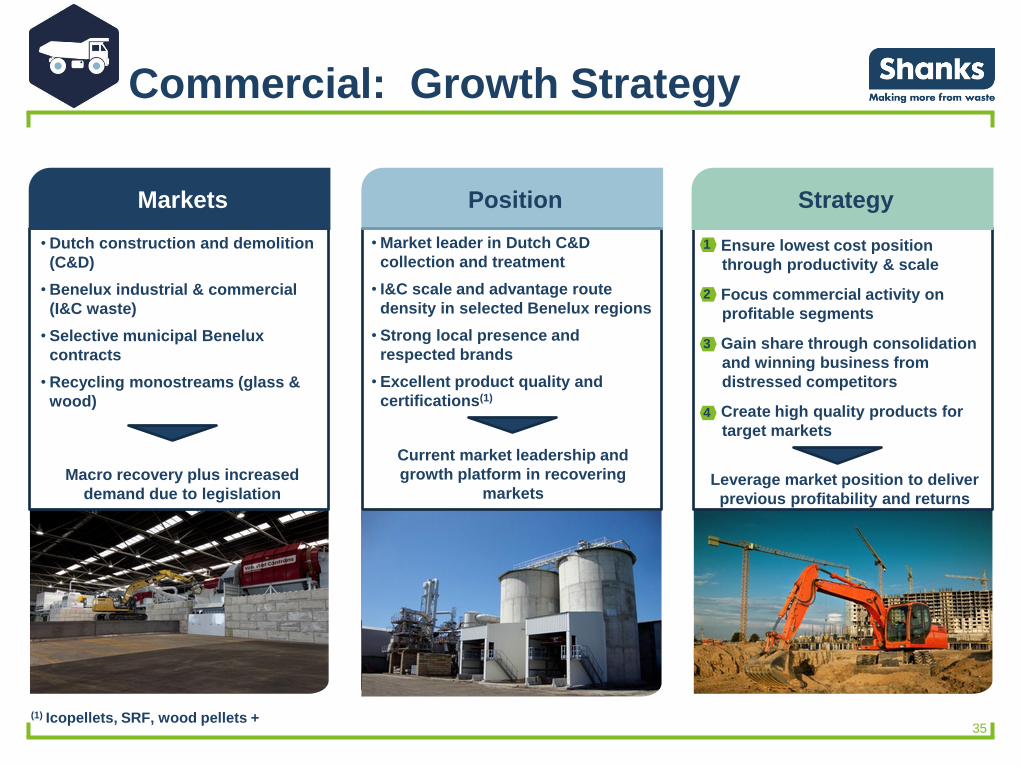
PFI Directors’ Valuation
• Portfolio valuation includes the four fully operational contracts, plus BDR, Wakefield and
Derby under construction
• Valuation based on the cash flows of the financing vehicles and the operating contracts -
discounted at 8% and risk adjusted
• Valuation maintained at £110m
42%
23%
6%
15%
14%
Operating contract -fully operational
Operating contract -not yet full services
Operating contract -initial services
SPV - fullyoperational
SPV - not yet fullservices
Operating contract - fully
operational 47
Operating contract - initial
services 6
Operating contract - not yet
full services 25
SPV - fully operational 17
SPV - not yet full services 15
110
Portfolio split £m Mar-15
Split of value of
the PFI portfolio
at Mar-15
42

To edit the table simply over
type the sample text
Alternatively…
If you have created a table in
Excel delete the example
table and the table
placeholder on the slide, then
go to Excel
select the data…
>Right click on the table
>’Copy’
(Go to your PowerPoint file)
>’Paste’ table into relevant
slide and format the style
accordingly
Note: Any figures to be
focussed on should be
highlighted in Light Green
To format the body text,
simply highlight the specific
line(s) of text and click ‘tab’ or
press ‘increase/decrease list
level’ button. If you continue
to click the ‘Tab’ button and
the text turns red you have
tabbed too far and should use
the ‘decrease level’ button to
return to compliant text.
Do not use the bullet point
button to format your text.
Post tax ROIC 6.0% 5.8% 6.0%
(on depreciated capital base including goodwill)
Return on operating assets – continuing operations 12.2% 13.2% 15.1%
(trading profit on depreciated operating assets
excluding debt, tax and goodwill)
Pre-tax project returns – fully operational projects 18.1% 18.4% 18.6%
(on the original invested capital)
Return on Capital
Mar 14 Mar 15 Sep 14
43
To format the body text,
simply highlight the specific
line(s) of text and click ‘tab’ or
press ‘increase/decrease list
level’ button. If you continue
to click the ‘Tab’ button and
the text turns red you have
tabbed too far and should use
the ‘decrease level’ button to
return to compliant text.
Do not use the bullet point
button to format your text.
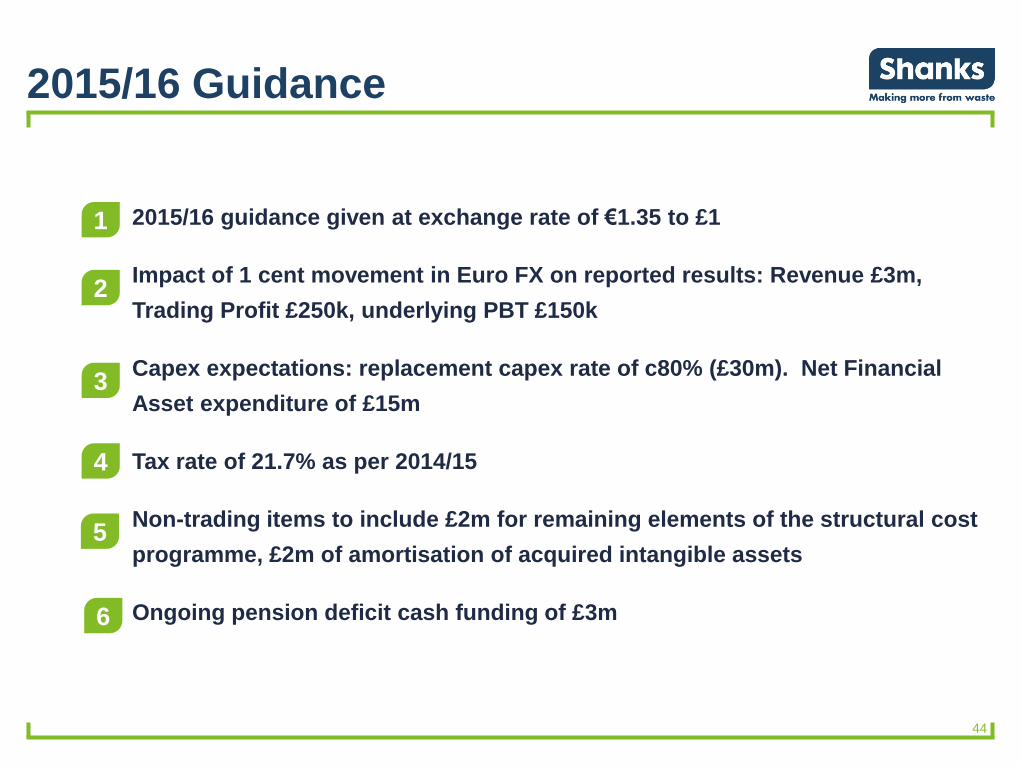
2015/16 Guidance
2015/16 guidance given at exchange rate of €1.35 to £1
Impact of 1 cent movement in Euro FX on reported results: Revenue £3m,
Trading Profit £250k, underlying PBT £150k
Capex expectations: replacement capex rate of c80% (£30m). Net Financial
Asset expenditure of £15m
Tax rate of 21.7% as per 2014/15
Non-trading items to include £2m for remaining elements of the structural cost
programme, £2m of amortisation of acquired intangible assets
Ongoing pension deficit cash funding of £3m
1
2
3
4
44
5
6


![1737 - micromatic.com · 1737-l long shanks 1737-s short shanks 1738-l long shanks 1738-s short shanks 1066.8 [42.0] 76.2 [3.0] 990.6 [39.0] (13) spaces 76.2 [3.0] apart ref. 38.1](https://static.fdocuments.in/doc/165x107/5f8352f9a944be5a795c3526/1737-1737-l-long-shanks-1737-s-short-shanks-1738-l-long-shanks-1738-s-short-shanks.jpg)