Shanks Group plc - Renewi · 2019-04-11 · 15 May 2014 Shanks Group plc Shanks Group plc (LSE:...
41
15 May 2014 Shanks Group plc Shanks Group plc (LSE: SKS), a leading international sustainable waste management business, today issued its results for the year ended 31 March 2014. Commenting on the results, Peter Dilnot, Group Chief Executive of Shanks Group plc, said: “In the last year we have made good progress with our strategic goals and have delivered a robust performance, outperforming the sector in very challenging markets. “We have increased profit before tax by 14% compared to that reported in 2012/13, driven by our successful exit from UK Solid Waste. On a like-for-like basis, we delivered a broadly flat profit before tax due to resilient performances from most of our divisions. “Highlights include investing where we have the clear advantage, actively managing our business portfolio and delivering structural cost reductions. With this platform in place, we have laid the foundations for sustained profitable growth.” Unless stated otherwise, all financial information in this announcement relates to the Group‟s continuing operations. Discontinued operations comprise the UK Solid Waste business which, with the exception of the Elstow facility, was either sold or exited from during the year. 2014 2013 Change % Change % Constant Currency 2013 as reported* Change % Reported Revenue £636.4m £614.6m 4% 1% £670.0m -5% EBITDA £87.7m £87.1m 1% -3% £84.8m 3% Trading profit £45.9m £44.9m 2% -1% £41.3m 11% Underlying free cash flow (total) £56.5m £48.8m 16% 11% £48.8m 16% Underlying profit before tax £30.2m £30.2m 0% -4% £26.5m 14% Exceptional and non-trading items £(22.5)m £(40.3)m 44% 46% £(61.8)m 63% Loss after tax (statutory basis) £(28.2)m £(35.2)m 20% 20% £(35.2)m 20% Underlying EPS 5.7p 5.7p 0% -3% 5.0p 14% Basic EPS (statutory basis) (7.1)p (8.9)p 20% (8.9)p 20% Dividend per share 3.45p 3.45p 0% 3.45p 0% * including discontinued operations Underlying measures exclude exceptional items, financing fair value measurements and amortisation of acquisition intangibles. Trading profit is operating profit before amortisation of acquisition intangibles and exceptional items. EBITDA comprises trading profit before depreciation, amortisation and profit or loss on disposal of plant, property and equipment. Underlying free cash flow is before dividends, growth capex, acquisitions and disposals.
Transcript of Shanks Group plc - Renewi · 2019-04-11 · 15 May 2014 Shanks Group plc Shanks Group plc (LSE:...

15 May 2014
Shanks Group plc Shanks Group plc (LSE: SKS), a leading international sustainable waste management business, today issued its results for the year ended 31 March 2014.
Commenting on the results, Peter Dilnot, Group Chief Executive of Shanks Group plc, said:
“In the last year we have made good progress with our strategic goals and have delivered a robust performance, outperforming the sector in very challenging markets. “We have increased profit before tax by 14% compared to that reported in 2012/13, driven by our successful exit from UK Solid Waste. On a like-for-like basis, we delivered a broadly flat profit before tax due to resilient performances from most of our divisions. “Highlights include investing where we have the clear advantage, actively managing our business portfolio and delivering structural cost reductions. With this platform in place, we have laid the foundations for sustained profitable growth.” Unless stated otherwise, all financial information in this announcement relates to the Group‟s continuing operations. Discontinued operations comprise the UK Solid Waste business which, with the exception of the Elstow facility, was either sold or exited from during the year.
2014
2013
Change %
Change %
Constant Currency
2013 as reported*
Change % Reported
Revenue £636.4m £614.6m 4% 1% £670.0m -5%
EBITDA £87.7m £87.1m 1% -3% £84.8m 3%
Trading profit £45.9m £44.9m 2% -1% £41.3m 11%
Underlying free cash flow (total)
£56.5m £48.8m 16% 11% £48.8m 16%
Underlying profit before tax
£30.2m £30.2m 0% -4% £26.5m 14%
Exceptional and non-trading items
£(22.5)m £(40.3)m 44% 46% £(61.8)m 63%
Loss after tax (statutory basis)
£(28.2)m £(35.2)m 20% 20% £(35.2)m 20%
Underlying EPS 5.7p 5.7p 0% -3% 5.0p 14%
Basic EPS (statutory basis)
(7.1)p (8.9)p 20% (8.9)p 20%
Dividend per share 3.45p 3.45p 0% 3.45p 0% * including discontinued operations Underlying measures exclude exceptional items, financing fair value measurements and amortisation of acquisition intangibles. Trading profit is operating profit before amortisation of acquisition intangibles and exceptional items. EBITDA comprises trading profit before depreciation, amortisation and profit or loss on disposal of plant, property and equipment. Underlying free cash flow is before dividends, growth capex, acquisitions and disposals.

2
Financial Summary
Revenue growth of 4% (1% at constant currency), driven by the Hazardous Waste Division and UK Municipal.
Underlying profit before tax up by 14% from that reported last year to £30.2m, due to exit from UK Solid Waste, with profit before tax on continuing businesses broadly flat.
Ongoing investment in Cumbria and good progress in construction at BDR and Wakefield has led to 25% increase in Directors‟ valuation of PFI portfolio to £110m.
Ongoing focus on capital discipline delivered strong cash performance with lower than expected core net debt at £156m and net debt to EBITDA reduced to 1.9x. Final dividend maintained at 2.35p per share, reflecting confidence in medium term growth.
Total Group exceptional and non-trading charges of £22.5m, principally reflecting non-cash goodwill impairment, and a loss on discontinued operations of £30.0m, being the cash generative exit from UK Solid Waste, partially offset by provision releases.
Business Overview
Outperformed the industry in markets that remain very challenging.
Successfully achieved exit from loss-making UK Solid Waste business generating cash and refocusing the Group.
Delivered profit growth in Solid Waste Benelux, our biggest division by revenue, for the first time in five years and ahead of any market recovery.
Delivered underlying growth in Hazardous Waste, while generating high returns and actively investing for further growth.
UK Municipal Division performing well, with key build programmes and Derby project making good progress.
Organics municipal pipeline progressing in Canada, with promising long-term contract opportunities, while Organics in Europe increasingly challenged by market over-capacity.
Repositioned Group with leadership in core markets and are executing our clear growth strategies for each division.
Outlook Notwithstanding markets which are expected to continue to be challenging in the year ahead, the Board‟s expectations for 2014/15 remain unchanged. In the coming year we expect to deliver growth in our Hazardous Waste and UK Municipal divisions. Our Solid Waste Benelux division is likely to deliver a broadly similar performance as the benefits of cost reduction will be offset by continued market headwinds. In the Organics division the outlook is impacted by price pressure and our investment in bidding costs for Canadian expansion. Longer term, the growth drivers in our business remain attractive. There is a clear and growing need for cost-effective and sustainable waste management which Shanks is uniquely placed to meet. As a result of our active portfolio management, we now have leadership positions in all our core markets with a clear strategy to deliver profitable growth and attractive returns in each division. Furthermore, by building a focused and lean business, we are well positioned to benefit from operational gearing when markets recover.

3
Notes:
1. The final dividend of 2.35p per share will be paid on 1 August 2014 to shareholders on the register at close of business on 4 July 2014.
2. Management will be holding an analyst presentation at 9:30 a.m. today, 15 May at the offices of Investec, at 2 Gresham Street, London EC2V 7QP.
3. Webcast details for the presentation at 9.30 a.m. – Webcast: www.shanksplc.com – Telephone conference:
United Kingdom 020 3059 8125 Belgium 0800 39 247
Netherlands 0800 024 9942 – Confirmation password: Shanks Group
4. A copy of this announcement is available on the Company‟s website, (www.shanksplc.com), as will be the presentation being made today to financial institutions.
For further information contact:
Shanks Group plc
Peter Dilnot – Group Chief Executive Toby Woolrych – Group Finance Director
+44 (0)1908 650580
Brunswick Group
Mike Smith +44 (0)20 7404 5959 Justine McIlroy FORWARD-LOOKING STATEMENTS
Certain statements in this announcement constitute “forward-looking statements“. Forward-looking statements may sometimes, but not always, be identified by words such as “will”, “may”, “should”, “continue”, “believes”, “expects”, “intends” or similar expressions. These forward-looking statements are subject to risks, uncertainties and other factors which, as a result, could cause Shanks Group‟s actual future financial condition, performance and results to differ materially from the plans, goals and expectations set out in the forward-looking statements. Such statements are made only as at the date of this announcement and, except to the extent legally required, Shanks Group undertakes no obligation to revise or update such forward-looking statements.

4
CEO Statement
Introduction We have made good progress with our strategic goals over the last twelve months and have delivered a robust performance in markets that remain very challenging. Our active portfolio management has enabled Shanks to outperform the market in 2013/14. We have further repositioned the Group to generate increasing returns in current market conditions and strong profit growth as normal market conditions return in the years ahead. In the year ended 31 March 2014, we generated an underlying profit before tax of £30.2m, 14% higher than the £26.5m that we reported last year. This increase was primarily due to the successful exit from our loss-making UK Solid Waste business. On a like-for-like basis of continuing businesses, we have delivered a broadly similar profit before tax to last year, reflecting resilient performances from most of our divisions. The good progress with our strategic goals includes: delivering targeted structural cost reductions; actively managing our business portfolio; selectively investing for growth where we are advantaged; building new infrastructure backed by long-term contracts; and maintaining strong capital discipline. We will continue to execute on our plans and I am confident that we have laid the foundations for sustained profitable growth and increasing returns in the future. Decisive Action in Tough Markets Underlying market conditions have remained very challenging throughout the last year. During 2013, the Netherlands remained in recession while Belgium GDP increased by just 0.2%. More specifically, Dutch construction, our largest single end market, contracted by a further 5% in 2013, following a 7% fall in 2012. Against this backdrop, many of our competitors have struggled to maintain profitability due to lower volumes. This has resulted in sustained price pressure as waste operators compete to fill their processing capacity, most acutely in Flanders, Belgium, and in the Amsterdam area of the Netherlands. We have also seen increasing over-capacity in organic waste treatment across Europe lead to a reduction in gate fees for all organic waste streams, but especially those that yield a high gas stream when processed by anaerobic digestion. Recyclate income is another important profit driver for our Solid Waste business. We have seen greater stability in the last year in pricing for recycled paper and plastics, albeit at a low level, but metal volumes and prices have continued to fall, directly impacting our profitability by £3m year on year. The competitive environment has remained intense. In the Netherlands many of our competitors have reported margin reduction and we have seen further mid-size waste companies go bankrupt in the last twelve months. It is clear that capacity continues to come out of the market, either through reduced investment, restructuring or insolvency. However, any significant price increases are only likely to come with a macro recovery. Our response to these short-term conditions has been decisive, allowing us both to outperform the market and position ourselves for sustained future growth. During this financial year we have:
Taken significant cost action that has increased the profitability of our Solid Waste Benelux business despite reducing revenues
Exited underperforming assets, including UK Solid Waste, raising cash while increasing profits and underlying returns

5
Increased investment for growth in segments, such as Hazardous Waste, where we are competitively advantaged
Focused bidding activities on new long-term municipal contracts in Canada in order to deliver top-line growth and reduce the volatility of our income streams
Increased the value of our UK Municipal business by making good progress with the construction of £200m of new infrastructure and progressing the Derby contract
Exercised strong capital discipline and generated cash for future deployment in areas of sustained high future returns
Robust Group Performance The Group delivered a robust performance given the challenging market conditions. Our revenues from continuing businesses increased by 1% at constant currency (4% at actual currency) to £636m (2013: £615m). Our trading profit before non-trading and exceptional items was £45.9m (2013: £44.9m), a decrease of 1% at constant currency (2% increase at actual currency). Underlying earnings per share remained constant at 5.7p (2013: 5.7p). At a divisional level, we were pleased with the performance of the Solid Waste Benelux Division, which grew trading profit by 16% at constant currency to £19.7m despite a revenue contraction of 5% to £324m. This represented the first profit growth by the Solid Waste business in five years and is a direct result of successful execution of our cost reduction and portfolio management plans. Hazardous Waste also exceeded our expectations by offsetting the end of a highly profitable contract last year. At constant currency the division maintained trading profit of £19.9m on revenue growth of 3% to £148m. Excluding the impact of that contract in 2012/13, the division delivered underlying double digit trading profit growth. As previously indicated, the Organics Division had a challenging year, with market over-capacity impacting anaerobic digestion (AD) facilities in the Benelux and operational challenges in Canada. Our Netherlands composting assets performed well and supported revenue growth of 1% to £36m, but overall divisional trading profit declined 16% to £4.4m. The UK Municipal Division performed strongly, with 19% revenue growth to £137m driven by the first full year of the Wakefield contract. Reported divisional profit declined slightly to £9.2m, however excluding the success fee income last year, underlying divisional profit improved significantly. Group central services costs were up on last year in line with expectations, mainly due to credits in the prior period. We are pleased to report that our strong cash management and capital discipline continues to control our net debt effectively. Our net debt at 31 March 2014 was £156m, representing a multiple of 1.9 times EBITDA and comfortably within our covenant level of 3.0 times. This strong cash performance reflects a strict control of capital expenditure coupled with the generation of significant funds through the sale of underperforming assets as well as a positive FX effect. In total we generated cash of £10m, while funding both our growth programme and the injection of subordinated debt into Cumbria. In addition to our financial performance, we have continued to make good progress with ensuring the health and safety of our employees and all other stakeholders. In particular, during the last 12 months we delivered a 19% reduction in reported accidents (based on RIDDOR data) and, in doing so, achieved our ambitious Group five year safety target one year early. This performance is the direct result of prioritising safety management and our efforts will continue in this important aspect of our business.

6
Successful Portfolio Management One of our core strategies is to actively manage our portfolio. Our goal is to create a focused Group with businesses that have sustainable competitive advantages and can generate attractive returns in their respective markets. The last year has seen significant portfolio management action, including the important exit from the UK solid waste market. In late 2012 we conducted a strategic review which confirmed that our UK Solid Waste business was loss making, sub-scale and lacked the ability to generate appropriate returns in an increasingly challenged sector. In October 2013, we announced the sale of the majority of our UK Solid Waste assets to Biffa in a transaction which subsequently completed on schedule in late December 2013. At the same time, we closed our Blochairn material recycling facility (MRF) and sold it to Glasgow City Council in March 2014. Our Kettering MRF has also been closed. The plant and equipment has been sold and the site is on the market for general industrial purposes. This co-ordinated range of exit activities resulted in an increase in profit before tax of around £3.6m per annum and will generate a total cash inflow of £15m. Following this transaction, the UK management team is now focused predominantly on delivering strong growth from our municipal contract business. Other portfolio management activity has taken place in the Benelux, including the sale of the Foronex wood trading business, the Kluivers metal trading business and two sites in Wateringen and Mont St Guibert. A fuller report on the financial impact of all these disposals is included in the Financial Review. Long Term Growth Drivers Remain Despite the current market challenges, there have been some important legislative developments in the last 12 months that support our long-term growth prospects. Governments have continued to promote and stimulate efficient resource and energy management, including increased recycling and power generation from renewable sources such as waste. As an example, in the past year the Dutch government has reiterated its intention to increase recycling rates by halving the amount of waste going to landfill and mass burn incineration. It has introduced a landfill tax of €17 per ton from April 2014 and is exploring further options for levying taxes on less sustainable forms of waste disposal. In the UK, the Zero Waste Scotland initiative has also demonstrated the impact of government action in promoting waste diversion, with an increase in organic waste tonnages delivered to our Cumbernauld AD facility. In Canada, we are also now seeing an increase in municipal procurement activity as a result of national and regional policies to divert organic waste from landfill. Shanks is uniquely placed to meet the increasing need for sustainable waste management solutions, so will benefit from legislative and other long-term drivers that will phase out landfill over time. Our sustainable solutions reduce greenhouse gas emissions, recycle natural resources and limit fossil fuel dependency – and critically they do so in a cost-effective and less capital intensive way than other waste management alternatives. Sustainability is at our core. In early 2014, we were proud to be shortlisted again in the Sustainability category at the PLC Awards (which we won in 2013), and we are listed again in the FTSE for Good Index. Our business centres on enabling customers to meet their sustainability objectives in a way that makes good financial sense. We do this by using our recycling and product technology to deliver value for customers and attractive returns to our shareholders. We were very pleased to achieve a record recycling rate of 82%, reaching our five year target one year early.

7
We are focusing our efforts increasingly in selected target markets that have strong sustainable growth drivers and characteristics that enable Shanks to gain competitive advantage. This aspiration reflects opportunities in our growth markets, such as European industrial waste water treatment, UK long-term municipal contracts, and North American Organics. This focus is also consistent with our commitment to be highly selective about where we will deploy further capital in the future. Consistent Strategy for Growth Our over-arching strategy of “making more from waste” remains consistent. The core pillars of this strategy are focused on generating profitable growth in each of our four distinct markets. 1. Improve the profitability of Solid Waste Benelux. Our Solid Waste business is now
focused in the Benelux region where it is a clear market leader with the scale and position to win. Our strategy is focused on returning this business to previous profitability levels. We continue to improve efficiency through the structural cost programme, increasing route density, and delivering new procurement and continuous improvement initiatives. We are investing in optimising our commercial effectiveness to take advantage of market opportunities and have also streamlined the portfolio to increase returns.
2. Broaden the scope of our Hazardous Waste business. Our Hazardous Waste business delivers superior returns through its symbiotic range of treatments and operational excellence. We are building on this profitable base by investing in more treatment capacity. In parallel, we will expand the range of waste inputs that we treat with our existing assets and will broaden our commercial coverage in international markets.
3. Expand the Organics footprint in target geographies. Our strong market position
and experience in the Netherlands, combined with our unique business model (design, build, own and operate), provides us with distinct competitive edge which we will leverage to expand in target markets. We plan to expand our North American footprint selectively by delivering proven solutions that meet the emerging diversion requirements of that market. We will also ramp-up new UK assets and develop co-processing with Dutch A-brand customers.
4. Grow the UK Municipal long-term contract business. We are well-placed to grow in
the UK PFI/PPP market with established contracts, together with over £200m of capital committed to projects in construction. We will deliver continued improvements with our operational contracts and will profitably ramp-up newly commissioned assets. Our medium-term growth will be underpinned by the successful construction of significant new sustainable waste management infrastructure.
While we are increasingly clear about the actions needed to deliver growth in each division, we will continue to deliver value by leveraging our Group capabilities and scale. Our four divisional strategies therefore remain underpinned by two key Group strategies that span all our businesses. 5. Develop world-class capabilities in a cohesive Group culture. This strategy
comprises the introduction of enhanced capabilities of commercial effectiveness, continuous improvement and talent development. It also includes leveraging of our many deep skills between divisions. For example, we are combining the skills of our Netherlands Organics and UK Municipal businesses to bid for contracts in Canada,

8
while our Shanks Total Care initiative creates a unique commercial proposition in the Netherlands.
6. Actively manage the Group’s portfolio. We are actively managing our portfolio of assets to improve the quality of our earnings and the return on capital employed. In particular, we have sold underperforming assets that lack the long-term capability to generate attractive returns. Overall, we are committed to deploying capital to deliver growth in areas where we are confident of sustainable advantage, attractive returns and higher growth.
Future Outlook Notwithstanding markets which are expected to continue to be challenging in the year ahead, the Board‟s expectations for 2014/15 remain unchanged. In the coming year we expect to deliver growth in our Hazardous Waste and UK Municipal Divisions. Our Solid Waste Benelux Division is likely to deliver a broadly similar performance as the benefits of cost reduction will be offset by continued market headwinds. In the Organics Division the outlook is impacted by price pressure and our investment in bidding costs for Canadian expansion. Longer term, the growth drivers in our business remain attractive. There is a clear and growing need for cost-effective and sustainable waste management which Shanks is uniquely placed to meet. Following our active portfolio management, we now have leadership positions in all our core markets with a clear strategy to deliver profitable growth and attractive returns in each division. Furthermore, by building a focused and lean business, we are well positioned to benefit from operational gearing when markets recover. Peter Dilnot Group Chief Executive
9
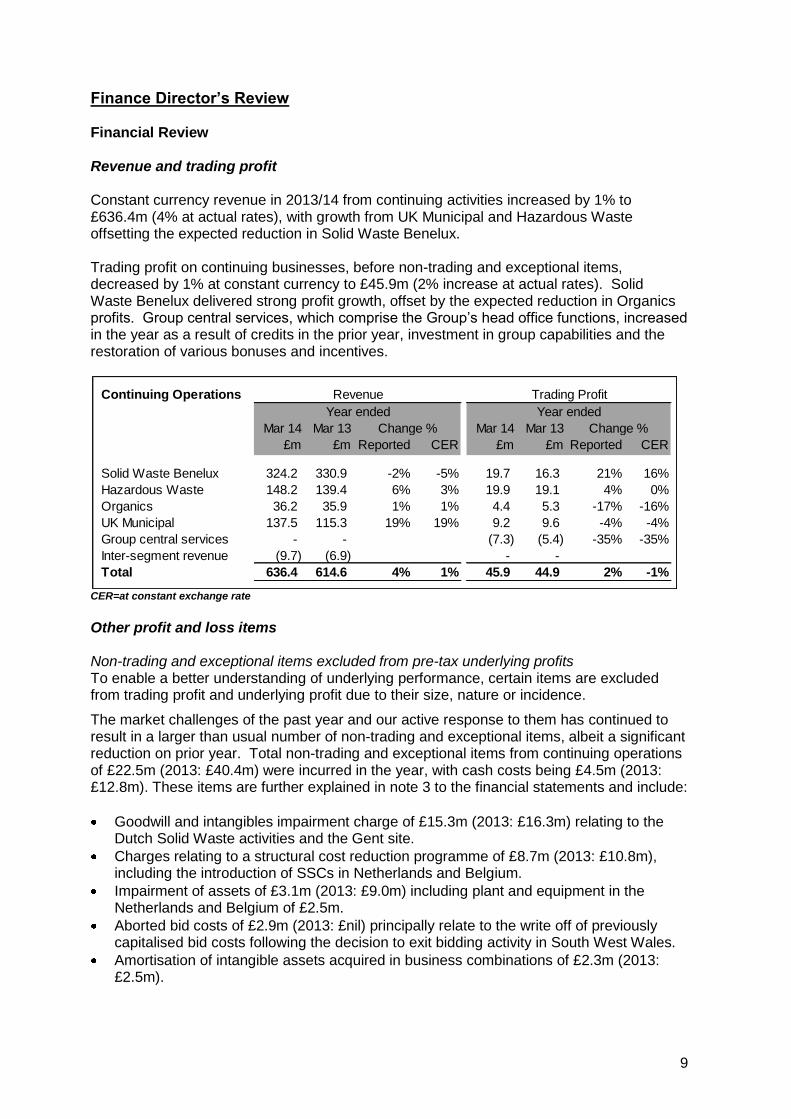
Finance Director’s Review Financial Review Revenue and trading profit Constant currency revenue in 2013/14 from continuing activities increased by 1% to £636.4m (4% at actual rates), with growth from UK Municipal and Hazardous Waste offsetting the expected reduction in Solid Waste Benelux. Trading profit on continuing businesses, before non-trading and exceptional items, decreased by 1% at constant currency to £45.9m (2% increase at actual rates). Solid Waste Benelux delivered strong profit growth, offset by the expected reduction in Organics profits. Group central services, which comprise the Group‟s head office functions, increased in the year as a result of credits in the prior year, investment in group capabilities and the restoration of various bonuses and incentives.
CER=at constant exchange rate
Other profit and loss items Non-trading and exceptional items excluded from pre-tax underlying profits To enable a better understanding of underlying performance, certain items are excluded from trading profit and underlying profit due to their size, nature or incidence.
The market challenges of the past year and our active response to them has continued to result in a larger than usual number of non-trading and exceptional items, albeit a significant reduction on prior year. Total non-trading and exceptional items from continuing operations of £22.5m (2013: £40.4m) were incurred in the year, with cash costs being £4.5m (2013: £12.8m). These items are further explained in note 3 to the financial statements and include:
Goodwill and intangibles impairment charge of £15.3m (2013: £16.3m) relating to the Dutch Solid Waste activities and the Gent site.
Charges relating to a structural cost reduction programme of £8.7m (2013: £10.8m), including the introduction of SSCs in Netherlands and Belgium.
Impairment of assets of £3.1m (2013: £9.0m) including plant and equipment in the Netherlands and Belgium of £2.5m.
Aborted bid costs of £2.9m (2013: £nil) principally relate to the write off of previously capitalised bid costs following the decision to exit bidding activity in South West Wales.
Amortisation of intangible assets acquired in business combinations of £2.3m (2013: £2.5m).
Continuing Operations
Mar 14 Mar 13 Mar 14 Mar 13
£m £m Reported CER £m £m Reported CER
Solid Waste Benelux 324.2 330.9 -2% -5% 19.7 16.3 21% 16%
Hazardous Waste 148.2 139.4 6% 3% 19.9 19.1 4% 0%
Organics 36.2 35.9 1% 1% 4.4 5.3 -17% -16%
UK Municipal 137.5 115.3 19% 19% 9.2 9.6 -4% -4%
Group central services - - (7.3) (5.4) -35% -35%
Inter-segment revenue (9.7) (6.9) - -
Total 636.4 614.6 4% 1% 45.9 44.9 2% -1%
Change % Change %
Revenue Trading Profit
Year ended Year ended

10
During the year the cost for treatment of a large quantity of old unprocessed waste at the Gent site in Belgium was found to be under accrued and this resulted in a current year charge of £1.7m.
A litigation provision of £1.2m for an ongoing legal issue in Belgium.
Financing fair value measurements credit of £0.3m (2013: credit of £0.1m).
A release of £1.0m (2013: £nil) following the reassessment of the contingent consideration payable on a previous acquisition.
Recovery from a legacy litigation case in Hazardous Waste of £1.4m (2013: £6.0m).
Net gain of £2.3m (2013: £nil) representing the impairment of assets in the Netherlands of £3.4m following a fire in August 2013 which has been offset by the insurance recovery relating to these assets of £5.7m.
A credit of £7.7m (2013: charge of £5.8m) in relation to onerous contract provisions in Belgium and the UK where performance has improved in the last 12 months.
The operating profit on a statutory basis, after taking account of all non-trading and exceptional items, was £23.4m (2013: £4.5m). Net finance costs Net finance costs, excluding the change in the fair value of derivatives, increased by £1.0m in the year. On core borrowings there were increases in interest rates and loan amortisation costs on refinancing. For PFI/PPP funding, finance income was £4.3m higher due to an increase in interest receivable on financial assets as the build programme continues for the BDR and Wakefield contracts partially offset by lower interest payable due to the repayment of the Cumbria equity bridge loan. Profit before tax from continuing operations on a statutory basis including the impact of non-trading and exceptional items turned around from a loss of £10.1m last year to a profit of £7.7m this year. Taxation The taxation charge for the year on continuing operations was a charge of £5.9m (2013: £1.0m). The underlying tax charge of £7.3m equated to an effective rate of 24.2%, down from 25.5% last year. There is a tax credit of £1.4m on the non-trading and exceptional items of £22.5m as a significant proportion are non taxable. The prior year included a credit of £2.0m related to a favourable judgement issued with regard to certain tax liabilities in Belgium. Discontinued items On 15 October 2013, the Group announced the exit from its UK Solid Waste activities. In accordance with IFRS 5, Non-current Assets Held for Sale and Discontinued Operations, the net results of these operations being sold are presented within discontinued operations in the income statement and the assets of the discontinued operations are presented separately in the balance sheet. The loss after tax on discontinued operations was £30.0m (2013: £24.1m) which included a trading loss of £4.4m (2013: £3.6m), finance charges of £0.1m (2013: £0.1m) and exceptional and non trading items of £24.5m (2013: £21.5m). Further details are set out in note 6 in the financial statements. The Group statutory loss after tax and including all discontinued and exceptional items was therefore £28.2m (2013: £35.2m). Earnings per Share (EPS) Underlying EPS from continuing operations, which excludes the effect of non-trading and exceptional items, remained constant at 5.7p per share (2013: 5.7p). Basic EPS from continuing operations increased from a loss of 2.8p per share to a profit of 0.4p per share.

11
Dividend The Board is recommending a final dividend per share of 2.35p (2013: 2.35p). The final dividend will be paid on 1 August 2014 to shareholders on the register on 4 July 2014. Total dividend cover, based on earnings before non-trading and exceptional items from continuing operations, is 1.7 times (2013: 1.6 times). Cash flow performance A summary of the total cash flows in relation to core funding is shown in the table below.
The strong focus on cash management and tight control of capital expenditure has continued and resulted in a free cash flow conversion of 136% (2013: 118%) which has been boosted by the £3.1m unwind of working capital following the exit from UK Solid Waste. The ratio of replacement capital spend to depreciation was 48%, slightly lower than last year‟s 54% and this is planned to increase next year to 80%. The increase in cash interest and tax spend in the year was due to net tax receipts last year in the Netherlands which have not been repeated. Following the refinancing activity in the year arrangement and adviser fees of £2.4m have been paid. Growth capital spend of £18.6m included a number of improvements at ATM, further investments in the Amsterdam AD facility and the completion of the UK AD facility at Westcott Park. The acquisitions and disposals income of £12.1m included the proceeds net of costs from the sale and closure of UK Solid Waste activities. The spend in the prior year represents the final earn out payment in relation to the acquisition of Orgaworld net of proceeds from the exit of the transport activities in Foronex in Belgium. The PFI funding line has a net outflow of £19.3m as it includes the subordinated debt investment made in April 2013 in relation to the Cumbria PPP contract following full service delivery.
Impact of portfolio actions in the year As discussed in the Chief Executive‟s report above, we exited from the UK solid waste market in a series of linked transactions. The principal transaction was the sale of the bulk of our solid waste collection activities to Biffa on 31 December 2013 for £9.5m. We simultaneously closed our Kettering and Blochairn MRFs and expect to receive a further £7.5m in cash for these assets, of which £3m has already been received. We retained our Elstow site as it is profitable and serves UK municipal customers and rationalised our central costs to save £2m per annum.
Mar 14 Mar 13
£m £m
EBITDA 83.6 84.8
Working capital movement and other 8.8 (1.8)
Net replacement capital expenditure (20.9) (24.6)
Interest and tax (15.0) (9.6)
Underlying free cash flow 56.5 48.8
Growth capital expenditure (18.6) (28.3)
Acquisitions and disposals 12.1 (7.0)
Restructuring spend (9.3) (7.0)
Dividends paid (13.7) (13.7)
PFI funding (19.3) 1.9
Other 2.5 (7.4)
Net core cash flow 10.2 (12.7)
Free cash flow conversion 136% 118%

12
Further portfolio actions in Solid Waste Benelux, described in more detail in the operating review, raised a further €10m in 2013/14. The impact of all these actions on profit and cash is shown in the table below:
Structural cost reduction programme The Solid Waste Benelux cost reduction programme is on track to deliver €19m of savings in 2015/16 and the expected timing of the savings and the charges is set out in the table below. Savings totalling €10m were realised in 2013/14, in line with our original forecasts. A further €4m is to be realised in 2014/15. The total cash cost of the Solid Waste Benelux programme has increased slightly to €23m, although some €6m of the cost has passed from last year to the current year due to the timing of the SSC projects.
The projected cash out for the total programme including all other divisions is now £26m versus the £28m originally expected, of which £20m has been spent. Investment activities and performance Investment programme Since 2008, the Group has had a stated strategy of investing up to £250m in sustainable waste management infrastructure, with a target post tax return of 12-15% on fully operational assets. Following the exit from Solid Waste activities in the UK, the associated assets of £20m have been removed from the reporting of the investment portfolio. As at 31 March 2014, £142m has been invested. The divisional split of the investment to date has been: Organics £79m (56%), Hazardous Waste £34m (24%) and Solid Waste Benelux £29m (20%). At 31 March 2014, £90m (2013: £65m) of the investment portfolio was considered fully operational and it delivered a post-tax return of 13.5% (2013: 12.1%). The portfolio as a
£m Biffa Other UK UK Solid Benelux
transaction SW sites Waste exit actions Total
Anticipated sale proceeds 9.5 7.8 17.3 9.1 26.4
Working capital movements 3.1 - 3.1 - 3.1
Restructuring charges (2.9) - (2.9) - (2.9)
Transaction costs (1.9) (0.3) (2.2) (0.4) (2.6)
Cash inflow on sale 7.8 7.5 15.3 8.7 24.0
Expected (loss) profit on sale (12.3) (13.6) (25.9) 0.7 (25.2)
Solid Waste Benelux Structural Cost Programme
Non
€m Cash Cash Total 12/13 13/14 14/15 12/13 13/14 14/15 15/16
Restructuring 14 3 17 11 2 4 4 8 9 10
Portfolio Management 1 7 8 8 - - - 2 2 2
Solid Waste shared services 8 - 8 - 5 3 - - 1 3
Procurement - - - - - - - - 2 4
23 10 33 19 7 7 4 10 14 19
Expected benefitTiming of charge
P&L charge

13
whole delivered a post-tax return of 11.0% (2013: 12.4%). As previously identified, the post-tax return has varied according to division, with strong returns from the Hazardous Waste investments, reduced returns from the Organics portfolio as assets ramp up and are affected by market volatility, and good returns from the Solid Waste Benelux investments, which currently has no new growth assets under construction. In 2014/15, we will transition £15m of assets from the “in construction” category as a number of the Hazardous Waste projects become operational. UK Municipal programme To support growth of the UK Municipal division‟s PFI and PPP contracts, the Group is currently undertaking a large investment programme. In the year ended 31 March 2014 our PFI financial assets increased by £70.1m to £195.6m as a result of construction at BDR and Wakefield. The asset increases are broadly matched by increases in non-recourse debt that is lent directly to the PFI funding entities with no recourse to the Group as a whole. In the next twelve months, we expect our PFI financial assets to increase further to around £320m as the construction on these projects is finalised ready to enter full service delivery and the Derby contract reaches financial close and construction starts. Group return on assets The Group return on operating assets (excluding debt, tax and goodwill) from continuing operations has increased from 14.2% at 31 March 2013 to 15.1% at 31 March 2014 with significant improvements from the Benelux Solid Waste division. The total Group post-tax return on capital employed was 6.0% compared with 5.4% at 31 March 2013.
Treasury and cash management Core net debt and gearing ratios The net core cash inflow of £10.2m, together with a positive exchange effect on the translation into Sterling of the Group‟s Euro and Canadian Dollar denominated debt, has decreased core debt by £21.3m to £156.0m. This represents a covenant ratio of 1.9 times EBITDA which is well within the banking limits of 3.0 times. The value of non-recourse debt lent directly to the PFI funding entities was £151.2m (2013: £100.1m). Debt structure and strategy Core borrowings, excluding PFI/PPP non-recourse borrowings, are almost all long term following successful refinancing of our main bank facilities and the issuance of a second Belgian retail bond. At 31 March 2014, the Group‟s bank financing comprised a €180m multicurrency revolving credit facility with seven major banks entered into on 31 January 2014 and expiring in January 2019. At 31 March 2014, €62.5m equivalent of the facility was drawn. The margin varies on a ratchet fixed by the Net Debt:EBITDA ratio. The financial covenants of this facility are principally the ratio of Net Debt:EBITDA of less than 3.0:1, interest cover of not less than 3.0:1 and a minimum net worth of £225m. The five year retail bonds of €100m, issued in October 2010 to investors in Belgium and Luxembourg have an annual coupon of 5.0% and are quoted on the London Stock Exchange. On 30 July 2013 the Group issued a further €100m of six year bonds to retail investors in Belgium and Luxembourg at an annual coupon of 4.23%. The remaining senior notes issued under the Group‟s Pricoa private placement at 31 March were €40m of seven year senior notes issued in April 2011 at a fixed interest rate of 5.025% following the repayment of €18m at their maturity on 13 September 2013. The Group also has access to £27.3m of undrawn uncommitted working capital facilities with various banks. Cash flows are pooled at a country level and each operation is tasked

14
with operating within the limits of the locally available working capital facilities. Each of the Group‟s PFI/PPP projects has separate senior debt facilities which contribute approximately 85% of the capital funding required. These facilities are secured on the future cash flows of the PFI/PPP companies with no recourse to the Group as a whole. Repayment of these facilities, and any equity bridge facility in respect of the remaining capital funding, commences when construction is complete and concludes one to two years prior to the expiry of the PFI/PPP contract period. The maximum which could be drawn down under these facilities at 31 March 2014 was £103.0m. Interest rates are fixed by means of interest rate swaps at the time of contract inception. While PFI assets are under construction, there are periods when the timing of draw downs from the non recourse debt differs from the outflows required and the Group may temporarily fund any difference. Directors’ valuation of PFI portfolio The Directors‟ valuation of the PFI portfolio is based on the net present value of the future cash flows of the PFI contracts and it has increased by £22m from £88m to £110m on updated conservative projections. This is primarily a result of the £11m investment in subordinated debt in Cumbria along with good progress in construction at BDR and Wakefield. The Directors‟ valuation is not recorded in the Group‟s balance sheet. Retirement benefits The Group operates a defined benefit pension scheme for certain UK employees which was closed to new entrants in September 2002. At 31 March 2014, the net retirement benefit deficit relating to the UK scheme was £10.5m compared with £6.8m at 31 March 2013. The increase in the deficit was due to a decrease in the discount rate being used to value the liabilities. The exit from the UK Solid Waste business has resulted in a 40% reduction in the active membership of the scheme. Under IAS 19 this event is classified as a curtailment and the corresponding loss on activities must be recognised in the year. This charge has been calculated at £0.7m and has been classified as part of the loss from discontinued operations. The latest actuarial valuation of the scheme was at 5 April 2012 and a funding plan of £3.1m per annum over seven years has been agreed with the trustees. This payment profile will be reconsidered at the next actuarial valuation which is due at 5 April 2015.
15
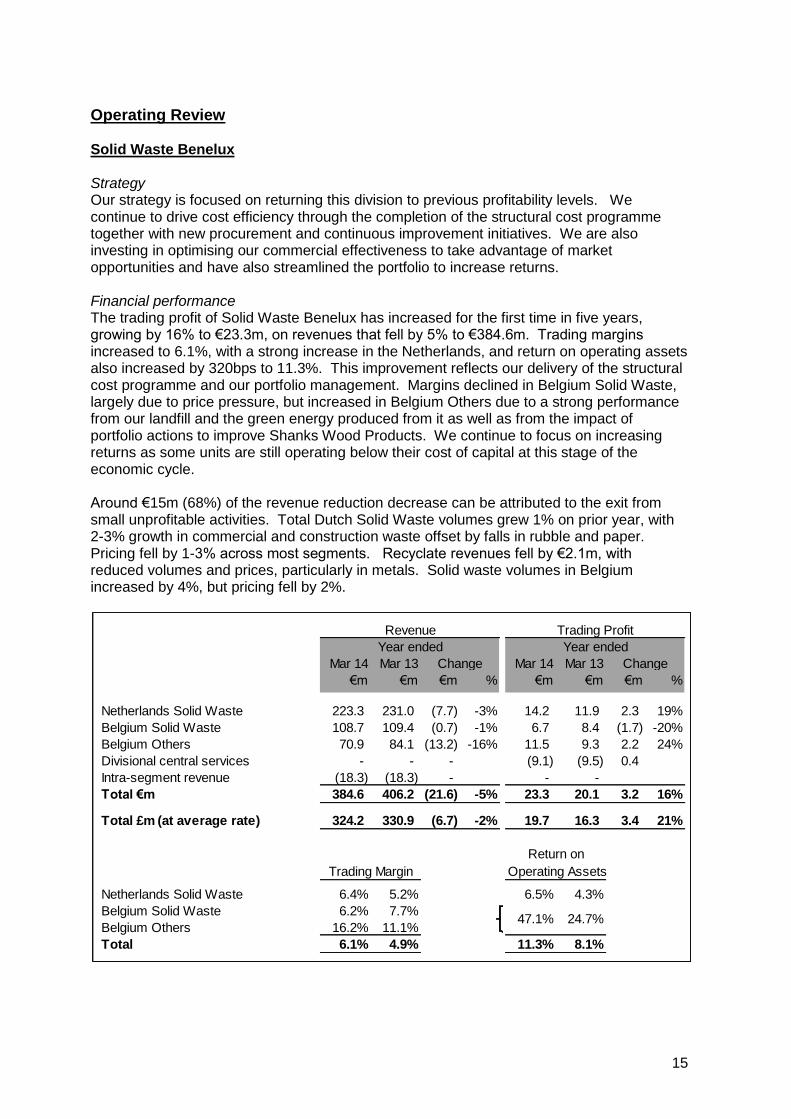
Operating Review Solid Waste Benelux Strategy Our strategy is focused on returning this division to previous profitability levels. We continue to drive cost efficiency through the completion of the structural cost programme together with new procurement and continuous improvement initiatives. We are also investing in optimising our commercial effectiveness to take advantage of market opportunities and have also streamlined the portfolio to increase returns. Financial performance The trading profit of Solid Waste Benelux has increased for the first time in five years, growing by 16% to €23.3m, on revenues that fell by 5% to €384.6m. Trading margins increased to 6.1%, with a strong increase in the Netherlands, and return on operating assets also increased by 320bps to 11.3%. This improvement reflects our delivery of the structural cost programme and our portfolio management. Margins declined in Belgium Solid Waste, largely due to price pressure, but increased in Belgium Others due to a strong performance from our landfill and the green energy produced from it as well as from the impact of portfolio actions to improve Shanks Wood Products. We continue to focus on increasing returns as some units are still operating below their cost of capital at this stage of the economic cycle. Around €15m (68%) of the revenue reduction decrease can be attributed to the exit from small unprofitable activities. Total Dutch Solid Waste volumes grew 1% on prior year, with 2-3% growth in commercial and construction waste offset by falls in rubble and paper. Pricing fell by 1-3% across most segments. Recyclate revenues fell by €2.1m, with reduced volumes and prices, particularly in metals. Solid waste volumes in Belgium increased by 4%, but pricing fell by 2%.
Mar 14 Mar 13 Mar 14 Mar 13
€m €m €m % €m €m €m %
Netherlands Solid Waste 223.3 231.0 (7.7) -3% 14.2 11.9 2.3 19%
Belgium Solid Waste 108.7 109.4 (0.7) -1% 6.7 8.4 (1.7) -20%
Belgium Others 70.9 84.1 (13.2) -16% 11.5 9.3 2.2 24%
Divisional central services - - - (9.1) (9.5) 0.4
Intra-segment revenue (18.3) (18.3) - - -
Total €m 384.6 406.2 (21.6) -5% 23.3 20.1 3.2 16%
Total £m (at average rate) 324.2 330.9 (6.7) -2% 19.7 16.3 3.4 21%
Operating Assets
Netherlands Solid Waste 6.4% 5.2% 6.5% 4.3%
Belgium Solid Waste 6.2% 7.7%
Belgium Others 16.2% 11.1%
Total 6.1% 4.9% 11.3% 8.1%
Trading Margin
Return on
47.1% 24.7%
Change
Revenue
Change
Trading Profit
Year ended Year ended

16
Operational review During the year our focus in the Solid Waste Benelux division remained on commercial and operational delivery, combined with portfolio management to increase returns. At the heart of the profit improvement was the €6m of further cost reduction delivered, as planned, through the structural cost programme. Around half of this benefit was the full year effect of savings delivered in the prior year. Additional savings came as a result of reduced disposal costs, enhanced logistics, lower maintenance spend and reductions at Icova, Contrans and Smink. The key remaining savings from the structural cost programme will come from the introduction of Shared Service Centres (SSCs) for each of the Netherlands and Belgium and the associated procurement savings that can be generated from a more centralised approach. Both of the new SSCs went live just before year end with the first processes and sites transferring. The process of transitioning all remaining accounting activities into the SSCs will continue through 2014/15, with full savings to be realised from 2015/16. We have also created a new procurement function at a divisional level that has identified material savings that we intend to secure in the coming two years. As our cost reduction programme progresses, we will be focusing increasingly on continuous improvement initiatives to reduce cost sustainably through resolution of points of failure or other inefficiency. For example, we have been running an initiative in Flanders to improve the operational performance of our SRF line that is expected to reduce costs by up to €1m per annum, and our carefully planned upgrade to the Belgian truck fleet is expected to have a similar impact on EBITDA as a result of reduced fuel and maintenance costs. We have experienced operational challenges at our glass recycling business, van Tuijl, resulting in impairment of some of the acquired assets and goodwill. Remedial actions are well in hand. Our commercial activities have also been a major contributor to the strong performance in the current market conditions. We believe that the volume increases described in the financial performance review reflect market share gains. Contract wins have included Ado Den Haag, V&D, Zublin, NL ZorgserviceXL, Baxter, Vivaqua and SPGE. We have in the last quarter been running a commercial effectiveness programme to drive consistent use of best practice across all our sites in the Netherlands. The portfolio management actions to increase focus and to generate cash from underperforming areas have been reported on in the Chief Executive‟s review (page 6). The cash generated of €22m over the last two years is sufficient to build three sorting lines or to replace around 150 trucks. Outlook We do not expect the nascent economic recovery in the Benelux to result in materially higher waste volumes or prices in 2014/15. Our focus on commercial success, combined with the delivery of our cost programmes, is expected to offset the continuing challenging market conditions to deliver a broadly similar performance to last year. Over the medium term we believe that we are increasingly well positioned to take advantage of a recovery in market conditions particularly in the Dutch construction market, as and when it may arise. Hazardous Waste Strategy The strategy of the Hazardous Waste Division is to continue to grow in target markets through capacity expansion, particularly in water treatment. Specifically, the strategy is to:
17
Invest in increasing treatment capacity;
Expand the range of inputs requiring thermal treatment;
Broaden commercial coverage; and
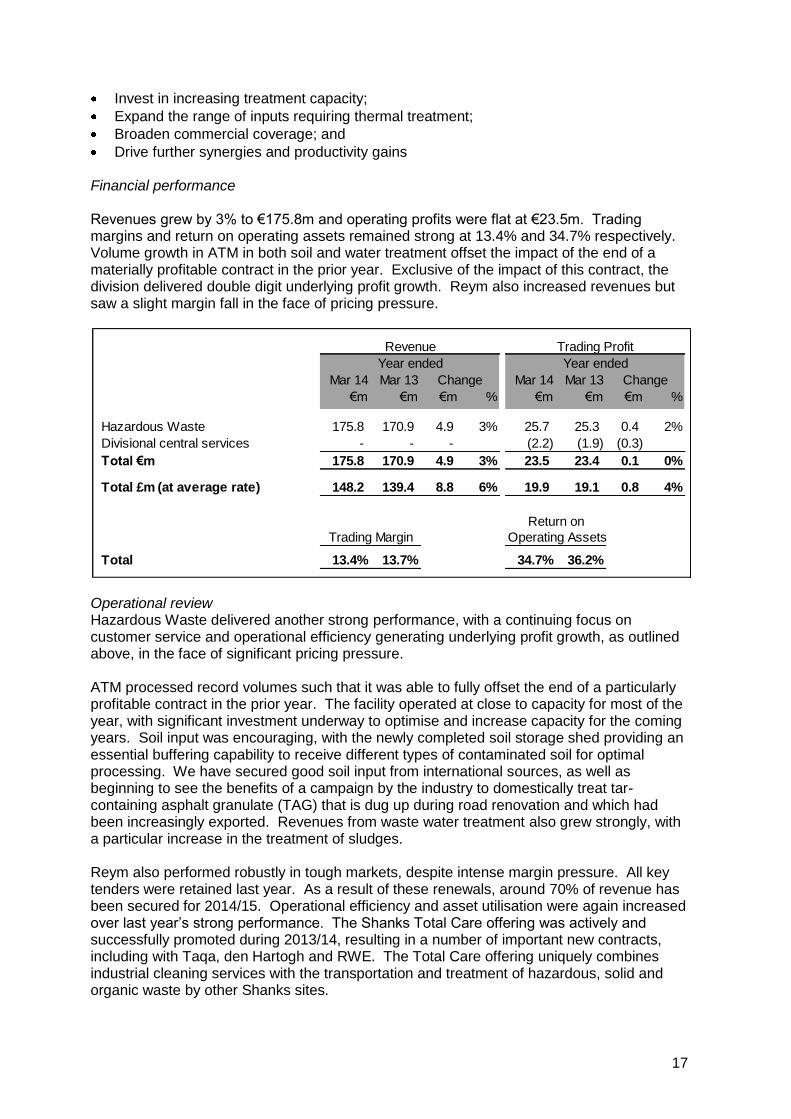
Drive further synergies and productivity gains Financial performance Revenues grew by 3% to €175.8m and operating profits were flat at €23.5m. Trading margins and return on operating assets remained strong at 13.4% and 34.7% respectively. Volume growth in ATM in both soil and water treatment offset the impact of the end of a materially profitable contract in the prior year. Exclusive of the impact of this contract, the division delivered double digit underlying profit growth. Reym also increased revenues but saw a slight margin fall in the face of pricing pressure.
Operational review Hazardous Waste delivered another strong performance, with a continuing focus on customer service and operational efficiency generating underlying profit growth, as outlined above, in the face of significant pricing pressure. ATM processed record volumes such that it was able to fully offset the end of a particularly profitable contract in the prior year. The facility operated at close to capacity for most of the year, with significant investment underway to optimise and increase capacity for the coming years. Soil input was encouraging, with the newly completed soil storage shed providing an essential buffering capability to receive different types of contaminated soil for optimal processing. We have secured good soil input from international sources, as well as beginning to see the benefits of a campaign by the industry to domestically treat tar-containing asphalt granulate (TAG) that is dug up during road renovation and which had been increasingly exported. Revenues from waste water treatment also grew strongly, with a particular increase in the treatment of sludges. Reym also performed robustly in tough markets, despite intense margin pressure. All key tenders were retained last year. As a result of these renewals, around 70% of revenue has been secured for 2014/15. Operational efficiency and asset utilisation were again increased over last year‟s strong performance. The Shanks Total Care offering was actively and successfully promoted during 2013/14, resulting in a number of important new contracts, including with Taqa, den Hartogh and RWE. The Total Care offering uniquely combines industrial cleaning services with the transportation and treatment of hazardous, solid and organic waste by other Shanks sites.
Mar 14 Mar 13 Mar 14 Mar 13
€m €m €m % €m €m €m %
Hazardous Waste 175.8 170.9 4.9 3% 25.7 25.3 0.4 2%
Divisional central services - - - (2.2) (1.9) (0.3)
Total €m 175.8 170.9 4.9 3% 23.5 23.4 0.1 0%
Total £m (at average rate) 148.2 139.4 8.8 6% 19.9 19.1 0.8 4%
Operating Assets
Total 13.4% 13.7% 34.7% 36.2%
Return on
Trading Margin
Change Change
Revenue Trading Profit
Year ended Year ended

18
The long term growth of our Hazardous Waste Division will be supported by selective investment in increased capabilities and capacity. A number of projects were completed in 2013/14 and others are underway that will complete in 2014/15 and 2015/16. Projects completed in the year included:
A soil shed, which allows large soil contracts to be received, stored and processed in an efficient manner. At the year end we had significant stocks on site to support business performance in 2014/15. The shed can store up to 500,000 tons of soil (six month‟s capacity) to await treatment
A waterside boiler so that ship cleaning can continue even if the main soil treatment kiln, from which surplus heat is normally taken, is off line for maintenance
A ship degassing unit to remove and destroy waste gasses from ships that are cleaned. New legislation in the Netherlands will from July 2015 require all inland ships to be degassed into such units rather than venting fumes into the open air
An iron sludge processing system to manage the increasing volumes of iron sludge for treatment
We have the following further expansion projects in construction that will complete over the next twelve months:
Waste water and sludge collection depot at Theemsweg, in the heart of the Europoort of Rotterdam
Sevenfold expansion of our waste water storage capacity with three new 10,000m3 tanks
Expansion of our thermal soil treatment emissions equipment to allow optimised throughput
Introduction of an ultrasonic cleaning unit to add a new capability to our Reym business
Extension of the jetty at ATM to increase capacity for ship cleaning These projects will in aggregate cost around €16m in 2014/15. Outlook Good volumes are expected at Reym, but at reduced prices, while the volume outlook for ATM‟s soil and water treatment also remains positive. The timely completion of our expansion projects is expected to underpin continued growth in the Hazardous Waste Division while sustaining attractive returns. Organics Strategy The core strategy of the Organics Division is to:
Maximise returns from existing assets by delivering excellent operating performance and securing long term contracts;
Develop the Canadian and North American opportunity;
Maintain a leading position with ongoing organic treatment technology developments; and
Develop co-processing with key A-brand customers. Financial performance Revenues grew by 1% to €44.4m but trading profit fell by 16% to €5.5m. The Netherlands decreased as a result of pricing pressure from over-capacity in the Dutch AD market not being offset by increased volumes processed, and Canada contracted due to operational restrictions at London, costs of processing additional waste volumes at Ottawa, an unusually cold winter and the initiation of bidding costs on a number of opportunities. In Other Organics, Cumbernauld delivered a good performance, increasing revenues and trading profit, while Westcott Park remained in commissioning through the year.

19
Results for Canada shown at constant currency
Operational review The Organics Division had a disappointing year, with increasing pressure on input gate fees combining with operational challenges to reduce profits on slightly increased revenues. In the Netherlands, the composting plants delivered a strong performance, with increased throughput and tight operational cost control. The third Combined Heat and Power (CHP) engine was commissioned at our Amsterdam AD facility, alongside a dryer to reduce the cost of digestate disposal. However, the initial benefits of these were more than offset by falling input prices for waste, especially waste with a high gas yield. Good progress was made in our collaborations with A-brand customers. The Canadian sites performed well through the year, although they were impacted both commercially and operationally by the exceptionally cold winter. The London site continues to operate under volume restrictions from the Ministry of the Environment due to historic odour issues. However, we have commissioned new emissions control equipment that is resulting in record low odour scores, so we are hopeful that volumes can increase later in the year. The long-running arbitration process concerning contractual issues with the Ottawa municipality is expected to resolve in 2014/15. Operating costs increased in Ottawa during the year as a result of increased volumes processed for the same revenue under the contract. We have been working for a number of years to develop a further pipeline of potential municipal organic treatment opportunities in Canada. We are therefore pleased that a number of these procurement programmes are now moving forward and that we are on the tender shortlist for three opportunities, two of which may be awarded in 2014/15. Initial bid fees of £0.2m were expensed in relation to these in 2013/14 and these are expected to increase next year. In the UK, the Cumbernauld AD facility delivered a good performance with improved profitability. As discussed in the Chief Executive‟s review, the Zero Waste Scotland policy initiative is boosting volumes of organic waste available such that we are investing further to optimise performance. Westcott Park, our new AD facility in Buckinghamshire, was in a commissioning phase through the year, running around six months late due to the
Mar 14 Mar 13 Mar 14 Mar 13
€m €m €m % €m €m €m %
Netherlands 18.9 17.8 1.1 6% 2.9 3.3 (0.4) -12%
Canada 17.3 18.4 (1.1) -6% 3.5 4.4 (0.9) -20%
Other Organics 8.2 7.8 0.4 5% 0.3 - 0.3 n/a
Divisional central services - - - (1.2) (1.2) -
Total €m 44.4 44.0 0.4 1% 5.5 6.5 (1.0) -16%
Total £m (at average rate) 36.2 35.9 0.3 1% 4.4 5.3 (0.9) -17%
Operating Assets
Netherlands 15.3% 18.5% 5.1% 6.4%
Canada 20.2% 23.9% 8.3% 10.3%
Other Organics 3.7% 0.0% 0.9% 0.2%
Total 12.4% 14.8% 5.2% 6.7%
Change
Revenue Trading Profit
Year ended Year ended
Trading Margin
Return on
Change
20
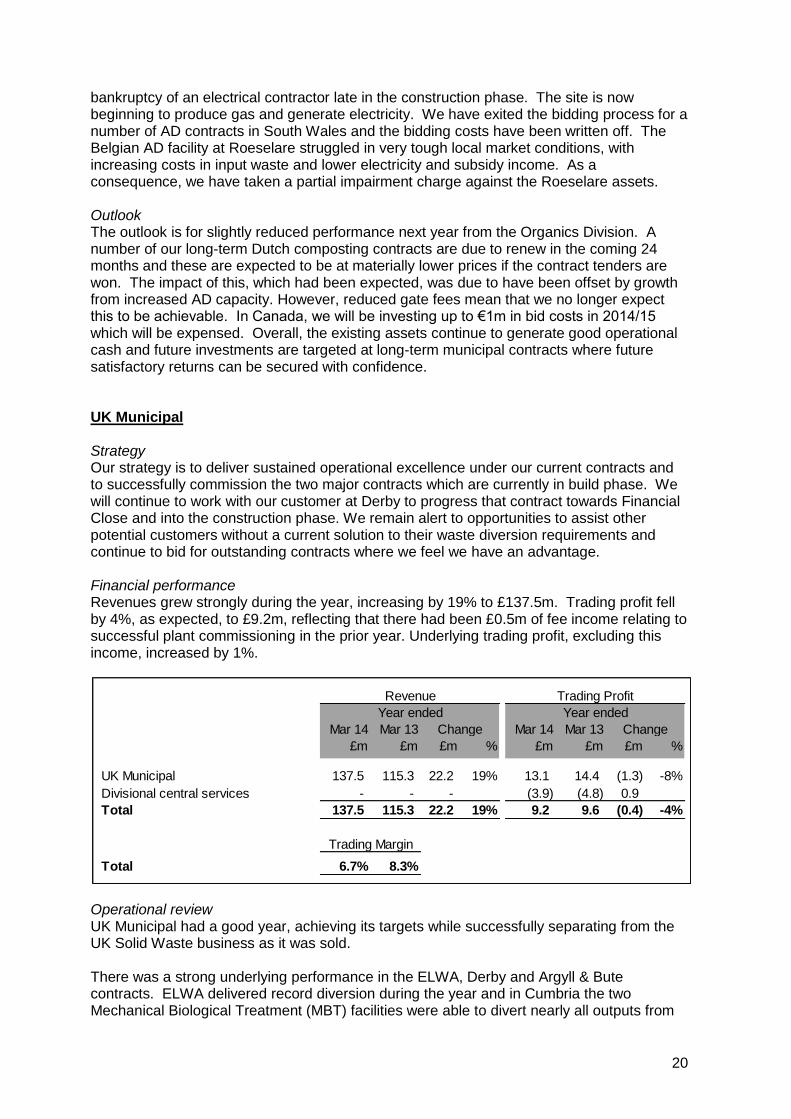
bankruptcy of an electrical contractor late in the construction phase. The site is now beginning to produce gas and generate electricity. We have exited the bidding process for a number of AD contracts in South Wales and the bidding costs have been written off. The Belgian AD facility at Roeselare struggled in very tough local market conditions, with increasing costs in input waste and lower electricity and subsidy income. As a consequence, we have taken a partial impairment charge against the Roeselare assets. Outlook The outlook is for slightly reduced performance next year from the Organics Division. A number of our long-term Dutch composting contracts are due to renew in the coming 24 months and these are expected to be at materially lower prices if the contract tenders are won. The impact of this, which had been expected, was due to have been offset by growth from increased AD capacity. However, reduced gate fees mean that we no longer expect this to be achievable. In Canada, we will be investing up to €1m in bid costs in 2014/15 which will be expensed. Overall, the existing assets continue to generate good operational cash and future investments are targeted at long-term municipal contracts where future satisfactory returns can be secured with confidence. UK Municipal Strategy Our strategy is to deliver sustained operational excellence under our current contracts and to successfully commission the two major contracts which are currently in build phase. We will continue to work with our customer at Derby to progress that contract towards Financial Close and into the construction phase. We remain alert to opportunities to assist other potential customers without a current solution to their waste diversion requirements and continue to bid for outstanding contracts where we feel we have an advantage. Financial performance Revenues grew strongly during the year, increasing by 19% to £137.5m. Trading profit fell by 4%, as expected, to £9.2m, reflecting that there had been £0.5m of fee income relating to successful plant commissioning in the prior year. Underlying trading profit, excluding this income, increased by 1%.
Operational review UK Municipal had a good year, achieving its targets while successfully separating from the UK Solid Waste business as it was sold. There was a strong underlying performance in the ELWA, Derby and Argyll & Bute contracts. ELWA delivered record diversion during the year and in Cumbria the two Mechanical Biological Treatment (MBT) facilities were able to divert nearly all outputs from
Mar 14 Mar 13 Mar 14 Mar 13
£m £m £m % £m £m £m %
UK Municipal 137.5 115.3 22.2 19% 13.1 14.4 (1.3) -8%
Divisional central services - - - (3.9) (4.8) 0.9
Total 137.5 115.3 22.2 19% 9.2 9.6 (0.4) -4%
Total 6.7% 8.3%
Trading Margin
Change Change
Revenue Trading Profit
Year ended Year ended

21
landfill. Operating margins in the division fell as expected due to the first full year operating the Household Waste Recycling Centres (HWRCs) at Wakefield under an interim contract while the main treatment facility is constructed. The Cumbria contract saw a strong performance from the Hespin Wood MBT plant, with excellent diversion rates, but operational challenges in the first full operational year at the Barrow MBT impacted performance and trading profit. Losses continue to reduce in the Dumfries and Galloway contract, and a contract amendment agreed in January will significantly reduce future losses. As a result, we have released £5.0m (39%) of the onerous contract provision as an exceptional credit to reflect the improved future prospects of this contract. We are currently working with the client to address the opportunities and challenges of the Zero Waste Scotland initiative. Off-take markets for our residual fuels remain dynamic and at times challenging. We are exploring opportunities to increase further profitability and also security in these markets. The exit from UK Solid Waste presented significant separation challenges along with the opportunity to reduce the divisional overhead and refocus it on the needs of the UK Municipal customers and operations. This project was largely completed by year end, with total overhead being reduced by an annualised £2m, including the consolidation of divisional finance into the Milton Keynes divisional headquarters and the closure of the shared service centre at Nursling, Southampton. The £200m build programmes at Barnsley Doncaster and Rotherham (BDR) and Wakefield are progressing well and to plan. At BDR the main civil construction works are nearing completion and the installation of the waste processing equipment has commenced, with the plant expected to be commissioned and to process the first trial waste around March 2015. The construction of the new waste facilities at Wakefield is also progressing well and the site is expected to be commissioned in the summer of 2015. Good progress was also made with the important Derby PFI contract. Final planning permission was secured for our client to build a gasification facility at the Sinfin Lane site in Derby, following a successful appeal at the High Court. We are now in negotiations to secure Financial Close on the project later in the year. We have also extended our interim contract to provide services to Derby City and Derbyshire County Councils until 31 March 2017. The income for the last two years will be at a lower rate, to reflect changing circumstances, and this will reduce the annual profit on the interim contract from April 2015. Outlook The outlook for the UK Municipal Division is positive. Our operational contracts are expected to continue to perform robustly. Growth is expected to come primarily from the new assets to be commissioned from 2015 to 2017.

22
Consolidated Income Statement For the year ended 31 March 2014
2014
2013 Restated*
Note
Trading
£m
Non trading & exceptional
items £m
Total
£m
Trading
£m
Non trading & exceptional
items £m
Total
£m
Revenue 2 636.4 - 636.4 614.6 - 614.6
Cost of sales (530.6) (5.1) (535.7) (511.6) (11.7) (523.3)
Gross profit (loss) 105.8 (5.1) 100.7 103.0 (11.7) 91.3
Administrative expenses (59.9) (17.4) (77.3) (58.1) (28.7) (86.8)
Operating profit (loss) 2,3 45.9 (22.5) 23.4 44.9 (40.4) 4.5
Finance income 2 10.1 0.3 10.4 6.2 0.1 6.3
Finance charges 2 (26.1) (0.3) (26.4) (21.2) - (21.2)
Income from associates 0.3 - 0.3 0.3 - 0.3
Profit (loss) before taxation 2 30.2 (22.5) 7.7 30.2 (40.3) (10.1)
Taxation 3,5 (7.3) 1.4 (5.9) (7.7) 6.7 (1.0)
Profit (loss) for the year from continuing operations 22.9 (21.1) 1.8 22.5 (33.6) (11.1)
Discontinued operations
Loss for the year from discontinued operations 6 (3.6) (26.4) (30.0) (2.8) (21.3) (24.1)
Profit (loss) for the year 19.3 (47.5) (28.2) 19.7 (54.9) (35.2)
Attributable to:
Owners of the parent 19.2 (47.5) (28.3) 19.6 (54.9) (35.3)
Non-controlling interest 0.1 - 0.1 0.1 - 0.1
19.3 (47.5) (28.2) 19.7 (54.9) (35.2)
Basic earnings (loss) per share attributable to owners of the parent (pence per share)
Continuing operations 7 5.7 (5.3) 0.4 5.7 (8.5) (2.8)
Discontinued operations 7 (0.9) (6.6) (7.5) (0.7) (5.4) (6.1)
4.8 (11.9) (7.1) 5.0 (13.9) (8.9)
Diluted earnings (loss) per share attributable to owners of the parent (pence per share)
Continuing operations 7 5.7 (5.3) 0.4 5.7 (8.5) (2.8)
Discontinued operations 7 (0.9) (6.6) (7.5) (0.7) (5.4) (6.1)
4.8 (11.9) (7.1) 5.0 (13.9) (8.9)
*The comparatives have been restated to classify the UK Solid Waste segment as a discontinued operation.

23
Consolidated Statement of Comprehensive Income For the year ended 31 March 2014
2014
£m
Restated* 2013
£m
Items that may be reclassified subsequently to profit or loss:
Exchange differences on translation of foreign subsidiaries (4.8) 5.4
Fair value movement on cash flow hedges 14.5 (13.8)
Deferred tax on fair value movement of cash flow hedges (3.8) 3.0
5.9 (5.4)
Items that will not be reclassified to profit or loss:
Actuarial loss on defined benefit pension scheme (6.4) (4.2)
Deferred tax on actuarial loss on defined benefit pension scheme 1.0 0.9
(5.4) (3.3)
Other comprehensive income (loss) for the year, net of tax 0.5 (8.7)
Loss for the year (28.2) (35.2)
Total comprehensive loss for the year (27.7) (43.9)
Attributable to:
Owners of the parent (27.4) (44.0)
Non-controlling interest (0.3) 0.1
Total comprehensive loss for the year (27.7) (43.9)
Total comprehensive income (loss) attributable to owners of the parent arising from:
Continuing operations 2.6 (19.9)
Discontinued operations (30.0) (24.1)
(27.4) (44.0)
*The comparatives have been restated to classify the UK Solid Waste segment as a discontinued operation.

24
Consolidated Balance Sheet As at 31 March 2014
Note
31 March 2014
£m
31 March 2013
£m
Assets
Non-current assets
Intangible assets 212.7 251.8
Property, plant and equipment 327.1 375.3
Investments 5.9 5.6
Financial assets relating to PFI/PPP contracts 187.4 117.5
Trade and other receivables 2.5 5.9
Deferred tax assets 12.7 16.0
748.3 772.1
Current assets
Inventories 9.4 11.0
Financial assets relating to PFI/PPP contracts 8.2 8.0
Trade and other receivables 139.4 147.8
Current tax receivable 1.9 1.8
Cash and cash equivalents 104.6 75.4
263.5 244.0
Assets classified as held for sale 6 3.2 3.3
266.7 247.3
Total assets 1,015.0 1,019.4
Liabilities
Non-current liabilities
Borrowings - PFI/PPP non-recourse net debt (149.5) (87.5)
Borrowings - Other (256.9) (234.5)
Derivative financial instruments 12 (15.0) (30.8)
Other non-current liabilities (1.2) (2.3)
Deferred tax liabilities (38.8) (41.6)
Provisions 10 (34.0) (38.7)
Defined benefit pension scheme deficit 11 (13.1) (8.8)
(508.5) (444.2)
Current liabilities
Borrowings - PFI/PPP non-recourse net debt (1.7) (12.6)
Borrowings - Other (3.7) (18.2)
Derivative financial instruments 12 (1.0) -
Trade and other payables (204.3) (202.2)
Current tax payable (10.7) (6.8)
Provisions 10 (11.6) (18.4)
(233.0) (258.2)
Liabilities directly associated with assets classified as held for sale 6 - (3.3)
(233.0) (261.5)
Total liabilities (741.5) (705.7)
Net assets 273.5 313.7
Equity
Share capital 39.8 39.7
Share premium 99.9 99.8
Exchange reserve 36.6 41.4
Retained earnings 97.4 132.7
Equity attributable to owners of the parent 273.7 313.6
Non-controlling interest (0.2) 0.1
Total equity 273.5 313.7

25
Consolidated Statement of Changes in Equity For the year ended 31 March 2014
Note
Share capital
£m
Share premium
£m
Exchange reserve
£m
Retained earnings
£m
Non-controlling
interest £m
Total equity
£m
Balance at 1 April 2013 39.7 99.8 41.4 132.7 0.1 313.7
(Loss) profit for the year - - - (28.3) 0.1 (28.2)
Other comprehensive income (loss):
Exchange loss on translation of foreign subsidiaries - - (4.8) - - (4.8)
Fair value movement on cash flow hedges - - - 15.0 (0.5) 14.5
Actuarial loss on defined benefit pension scheme - - - (6.4) - (6.4)
Tax in respect of other comprehensive income items - - - (2.9) 0.1 (2.8)
Total comprehensive loss for the year - - (4.8) (22.6) (0.3) (27.7)
Share-based compensation - - - 0.7 - 0.7
Movement on tax arising on share-based compensation
- - - 0.3 - 0.3
Proceeds from exercise of employee options 0.1 0.1 - - - 0.2
Dividends 8 - - - (13.7) - (13.7)
Balance at 31 March 2014 39.8 99.9 36.6 97.4 (0.2) 273.5
Balance at 1 April 2012 39.7 99.4 36.0 195.5 - 370.6
(Loss) profit for the year - - - (35.3) 0.1 (35.2)
Other comprehensive income (loss):
Exchange gain on translation of foreign subsidiaries - - 5.4 - - 5.4
Fair value movement on cash flow hedges - - - (13.8) - (13.8)
Actuarial loss on defined benefit pension scheme - - - (4.2) - (4.2)
Tax in respect of other comprehensive income items - - - 3.9 - 3.9
Total comprehensive income (loss) for the year - - 5.4 (49.4) 0.1 (43.9)
Share-based compensation - - - 0.5 - 0.5
Movement on tax arising on share-based compensation - - - (0.2) - (0.2)
Proceeds from exercise of employee options - 0.4 - - - 0.4
Dividends 8 - - - (13.7) - (13.7)
Balance at 31 March 2013 39.7 99.8 41.4 132.7 0.1 313.7
The exchange reserve comprises all foreign exchange differences arising since 1 April 2005 from the translation of the financial statements of foreign operations as well as from the translation of liabilities that hedge the Group‟s net investment in foreign operations.

26
Consolidated Statement of Cash Flows For the year ended 31 March 2014
Note 2014
£m 2013
£m
Cash flows from operating activities 13 73.2 67.7
Income tax (paid) received (1.6) 1.9
Net cash generated from operating activities 71.6 69.6
Investing activities
Purchases of intangible assets (1.3) (1.7)
Purchases of property, plant and equipment (36.6) (53.1)
Proceeds from exiting transport activities in Foronex in Belgium - 6.2
Proceeds from exiting UK Solid Waste 10.4 -
Insurance proceeds in relation to fire in the Netherlands 5.7 -
Disposals of property, plant and equipment 10.7 4.7
Outflows in respect of PFI/PPP arrangements under the financial asset model (70.6) (57.2)
Capital received in respect of PFI/PPP financial assets 4.2 4.2
Finance income 4.9 6.1
Payment of deferred consideration - (13.2)
Receipt of deferred consideration 0.4 -
Other unlisted investment purchase - (1.7)
Proceeds from disposal of joint venture and other assets 1.3 -
Repayment of loans granted to joint ventures - 2.5
Net cash used in from investing activities (70.9) (103.2)
Financing activities
Finance charges and loan fees paid (18.3) (17.6)
Return of restricted funds - 5.6
Proceeds from issuance of ordinary shares 0.2 0.4
Dividends paid (13.7) (13.7)
Proceeds from the issuance of retail bonds 86.1 -
Repayment of senior notes (15.2) -
(Repayment of)/proceeds from bank borrowings (52.4) 27.6
Proceeds from PFI/PPP net debt 60.2 55.6
Repayment of PFI/PPP net debt (13.1) (0.9)
Repayments of obligations under finance leases (3.4) (2.8)
Net cash generated from financing activities 30.4 54.2
Net increase in cash and cash equivalents 31.1 20.6
Effect of foreign exchange rate changes (1.9) 0.6
Cash and cash equivalents at the beginning of the year 75.4 54.2
Cash and cash equivalents at the end of the year 104.6 75.4

27
Notes to the Consolidated Financial Statements
1. Basis of Preparation Shanks Group plc is a public limited company incorporated and domiciled in Scotland under the Companies Act 2006, registered number SC077438. The figures and financial information for the year ended 31 March 2014 are extracted from but do not constitute the statutory financial statements for that year. The figures and financial information are audited. The income statement, statement of comprehensive income, statement of changes in equity and statement of cash flows for the year ended 31 March 2013 and the balance sheet as at 31 March 2013 have been derived from the full Group accounts published in the Annual Report and Accounts 2013 which have been delivered to the Registrar of Companies and on which the report of the independent auditors was unqualified and did not contain a statement under section 498 of the Companies Act 2006. The statutory accounts for the year ended 31 March 2014 will be filed with the Registrar of Companies in due course. The consolidated financial statements are prepared in accordance with International Financial Reporting Standards (IFRS) and related interpretations adopted by the European Union (EU) and therefore comply with Article 4 of the EU IAS Regulation and with those parts of the Companies Act 2006 applicable to companies reporting under IFRS. The Group has applied all accounting standards and interpretations issued relevant to its operations and effective for accounting periods beginning on 1 April 2013. The IFRS accounting policies have been applied consistently to all periods presented and throughout the Group for the purpose of the consolidated financial statements. IFRS 13 Fair Value Measurement is applicable for the March 2014 year end. The financial instruments disclosures have been included in note 12. Amendment to IAS 1 Presentation of financial statements is effective for annual periods beginning on or after 1 July 2012 and requires items presented in the statement of other comprehensive income to be separated into two groups based on whether or not these items may be reclassified to the Income Statement in the future. This amendment has been applied in the preparation of these consolidated financial statements. Changes in presentation On 15 October 2013 the Group announced that it had signed a binding agreement to sell the majority of its UK Solid Waste business to Biffa Waste Services Limited and the transaction completed on schedule on 31 December 2013. It was also announced in October 2013 that the decision had been taken to sell the remaining UK Solid Waste facilities except for the Elstow facility which serves municipal customers in Bedfordshire. In accordance with IFRS 5, Non-current Assets Held for Sale and Discontinued Operations, the net results of these operations being sold are presented within discontinued operations in the Income Statement and the assets held for sale of the discontinued operations are presented separately in the Balance Sheet. See note 6 for further details. Exchange Rates The assets and liabilities of foreign operations, including goodwill arising on acquisition, are translated to sterling at foreign exchange rates ruling at the reporting date. The income and expenses of foreign operations are translated into sterling at the average rate of exchange during the period. The most significant currencies for the Group were translated at the following exchange rates: Closing Rates
Value of £1
31 March 2014
31 March 2013
Change
Euro 1.21 1.18 2.3%
Canadian dollar 1.84 1.54 19.3 %
Average Rates
Value of £1
31 March 2014
31 March 2013
Change
Euro 1.18 1.23 (3.9)% Canadian dollar 1.65 1.59 4.3%

28
Notes to the Consolidated Financial Statements
1. Basis of Preparation – continued Underlying business performance The Group believes that trading profit, underlying profit before tax, underlying profit after tax, underlying free cash flow, underlying earnings per share and EBITDA (earnings before interest, tax, depreciation and amortisation) provide useful information on underlying trends to shareholders. These measures are used by the Group for internal performance analysis and incentive compensation arrangements for employees. The terms „trading profit‟, „exceptional items‟ and „underlying‟ are not defined terms under IFRS and may therefore not be comparable with similarly titled profit measures reported by other companies. It is not intended to be a substitute for, or superior to, GAAP measurements of profit. The term „underlying‟ refers to the relevant measure being reported for continuing operations excluding exceptional items, financing fair value remeasurements and amortisation of acquisition intangibles, excluding landfill void and computer software. „Trading profit‟ is defined as continuing operating prof it before amortisation of acquisition intangibles and exceptional items. EBITDA comprises trading profit before depreciation, amortisation and profit or loss on disposal of plant, property and equipment. Reconciliations are set out in note 3.

29
Notes to the Consolidated Financial Statements
2. Segmental reporting
The Group‟s chief operating decision maker is considered to be the Board of Directors. The Group‟s operating segments are determined with reference to the information provided to the Board of Directors in order for it to allocate the Group‟s resources and to monitor the performance of the Group. The Group‟s UK Solid Waste operation has been treated as discontinued as described in more detail in note 1 and note 6. The segment measures do not include any amounts for this discontinued operation. The operating segments are aligned with the core activities of the Group, as follows: Solid Waste Benelux The collection, recycling and treatment of non-hazardous waste in the Netherlands and
Belgium. The other activities in Belgium include landfill disposal and power generation from landfill gas, industrial cleaning activities, biomass processing and the operation of a sand quarry.
Hazardous Waste The reprocessing and recycling of contaminated soil, water and other contaminated materials. Industrial cleaning of heavily contaminated industrial plant. Organics The collection and treatment of food waste, garden waste and other organic materials.
UK Municipal Long-term PFI/PPP contracts providing recycling and waste management services to local authorities in the UK.
The profit measure the Board of Directors uses to evaluate performance is trading profit. Trading profit is operating profit before the amortisation of acquisition intangibles (excluding landfill void and computer software) and exceptional items. The Group accounts for inter-segment trading on an arm‟s length basis.
The segmental results, which do not include any amounts for discontinued operations, are as follows:
Revenue
2014
£m
Restated* 2013
£m
Netherlands Solid Waste 188.2 188.3
Belgium Solid Waste 91.7 89.0
Belgium Other 59.7 68.5
Intra-segment revenue (15.4) (14.9)
Solid Waste Benelux 324.2 330.9
Hazardous Waste 148.2 139.4
Netherlands 15.9 14.5
Canada 13.5 15.0
Other Organics 6.8 6.4
Organics 36.2 35.9
UK Municipal 137.5 115.3
Inter-segment revenue (9.7) (6.9)
Total revenue from continuing operations 636.4 614.6
*The comparatives have been restated to classify the UK Solid Waste segment as a discontinued operation.

30
Notes to the Consolidated Financial Statements
2. Segmental reporting - continued
Results
2014 £m
Restated* 2013
£m
Netherlands Solid Waste 12.0 9.7
Belgium Solid Waste 5.6 6.9
Belgium Other 9.7 7.5
Divisional central services (7.6) (7.8)
Solid Waste Benelux 19.7 16.3
Hazardous Waste 21.8 20.6
Divisional central services (1.9) (1.5)
Hazardous Waste 19.9 19.1
Netherlands 2.5 2.6
Canada 2.7 3.7
Other Organics 0.2 -
Divisional central services (1.0) (1.0)
Organics 4.4 5.3
UK Municipal 13.1 14.4
Divisional central services (3.9) (4.8)
UK Municipal 9.2 9.6
Group central services (7.3) (5.4)
Total trading profit 45.9 44.9
Non trading and exceptional items (22.5) (40.4)
Total operating profit from continuing operations 23.4 4.5
Finance income 10.4 6.3
Finance charges (26.4) (21.2)
Income from associates 0.3 0.3
Profit (loss) before taxation and discontinued operations 7.7 (10.1)
*The comparatives have been restated to classify the UK Solid Waste segment as a discontinued operation.

31
Notes to the Consolidated Financial Statements
3. Reconciliation of non-trading and exceptional items To improve the understanding of the Group‟s financial performance, items which do not reflect the underlying performance are presented in non-trading and exceptional items.
2014
£m
Restated* 2013
£m
Continuing operations
Impairment of goodwill and acquisition intangibles 15.3 16.3
Restructuring charge 8.7 10.8
Impairment of assets 3.1 9.0
Aborted bid costs 2.9 -
Amortisation of acquisition intangibles 2.3 2.5
Belgium waste disposal costs 1.7 -
Belgium litigation provision 0.9 -
Reassessment of contingent consideration (1.0) -
Hazardous Waste net litigation recovery (1.4) (6.0)
Insurance settlement net of impairment of assets in relation to a fire in the Netherlands (2.3) -
Net onerous contract provisions (7.7) 5.8
Aborted project costs - 2.0
Gain from exiting transport activities in Foronex in Belgium - (1.4)
UK Municipal unprocessed waste disposal costs - 1.4
Total non-trading and exceptional items in operating profit 22.5 40.4
Change in fair value of derivatives (0.3) (0.1)
Exceptional interest charge in relation to the Belgium litigation 0.3 -
Tax on non-trading and exceptional items (1.4) (4.7)
Exceptional tax - (2.0)
Continuing non-trading and exceptional items in profit after tax 21.1 33.6
Discontinued operations
Discontinued operations (further details in note 6) 24.4 21.3
Credit issues with regard to deferred consideration 2.0 -
Total non-trading and exceptional items in profit after tax 47.5 54.9
*The comparatives have been restated to classify the UK Solid Waste segment as a discontinued operation.
The above non-trading and exceptional items include the following:
Goodwill and intangibles impairment charge of £15.3m (2013: £16.3m) relating principally to the Dutch Solid Waste activities and the Gent facility in Belgium.
Charges relating to a structural cost reduction programme of £8.7m (2013: £10.8m), including the introduction of shared service centres in the Netherlands and Belgium.
Impairment of assets £3.1m (2013: £9.0m) including plant and equipment impairment in the Netherlands and Belgium of £2.5m.
Aborted bid costs of £2.9m (2013: £nil) principally relating to the write off of previously capitalised bid costs following the decision to exit bidding activity in South West Wales.
During the year the cost for treatment of a large quantity of old and unprocessed waste at the Gent site in Belgium was found to be under accrued and this resulted in a current year charge of £1.7m.
A total litigation provision of £1.2m (including interest payable of £0.3m) has been reflected for an ongoing legal issue in Belgium.
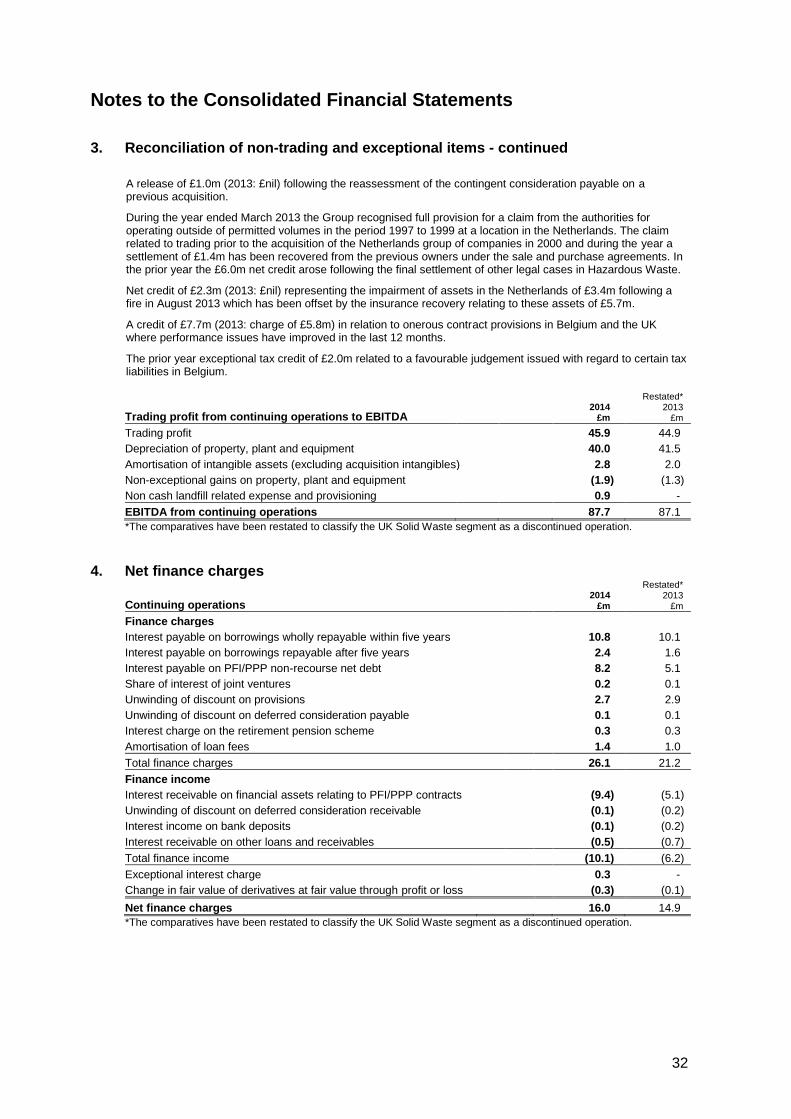
32
Notes to the Consolidated Financial Statements
3. Reconciliation of non-trading and exceptional items - continued
A release of £1.0m (2013: £nil) following the reassessment of the contingent consideration payable on a previous acquisition.
During the year ended March 2013 the Group recognised full provision for a claim from the authorities for operating outside of permitted volumes in the period 1997 to 1999 at a location in the Netherlands. The claim related to trading prior to the acquisition of the Netherlands group of companies in 2000 and during the year a settlement of £1.4m has been recovered from the previous owners under the sale and purchase agreements. In the prior year the £6.0m net credit arose following the final settlement of other legal cases in Hazardous Waste.
Net credit of £2.3m (2013: £nil) representing the impairment of assets in the Netherlands of £3.4m following a fire in August 2013 which has been offset by the insurance recovery relating to these assets of £5.7m.
A credit of £7.7m (2013: charge of £5.8m) in relation to onerous contract provisions in Belgium and the UK where performance issues have improved in the last 12 months.
The prior year exceptional tax credit of £2.0m related to a favourable judgement issued with regard to certain tax liabilities in Belgium.
Trading profit from continuing operations to EBITDA
2014
£m
Restated* 2013
£m
Trading profit 45.9 44.9
Depreciation of property, plant and equipment 40.0 41.5
Amortisation of intangible assets (excluding acquisition intangibles) 2.8 2.0
Non-exceptional gains on property, plant and equipment (1.9) (1.3)
Non cash landfill related expense and provisioning 0.9 -
EBITDA from continuing operations 87.7 87.1
*The comparatives have been restated to classify the UK Solid Waste segment as a discontinued operation.
4. Net finance charges
Continuing operations
2014
£m
Restated* 2013
£m
Finance charges
Interest payable on borrowings wholly repayable within five years 10.8 10.1
Interest payable on borrowings repayable after five years 2.4 1.6
Interest payable on PFI/PPP non-recourse net debt 8.2 5.1
Share of interest of joint ventures 0.2 0.1
Unwinding of discount on provisions 2.7 2.9
Unwinding of discount on deferred consideration payable 0.1 0.1
Interest charge on the retirement pension scheme 0.3 0.3
Amortisation of loan fees 1.4 1.0
Total finance charges 26.1 21.2
Finance income
Interest receivable on financial assets relating to PFI/PPP contracts (9.4) (5.1)
Unwinding of discount on deferred consideration receivable (0.1) (0.2)
Interest income on bank deposits (0.1) (0.2)
Interest receivable on other loans and receivables (0.5) (0.7)
Total finance income (10.1) (6.2)
Exceptional interest charge 0.3 -
Change in fair value of derivatives at fair value through profit or loss (0.3) (0.1)
Net finance charges 16.0 14.9
*The comparatives have been restated to classify the UK Solid Waste segment as a discontinued operation.

33
Notes to the Consolidated Financial Statements
5. Tax The tax charge based on the profit (loss) for the year for continuing operations is made up as follows:
2014
£m
Restated* 2013
£m
Current tax
UK Corporation tax
- Prior year (0.2) -
Overseas tax
- Current year 5.7 1.9
- Prior year 0.1 (2.3)
Exceptional - (2.0)
Total current tax 5.6 (2.4)
Deferred tax
- Origination and reversal of temporary differences in the current year 1.6 4.8
- Adjustment in respect of prior year (1.3) (1.4)
Total deferred tax 0.3 3.4
Total tax charge for the year 5.9 1.0
*The comparatives have been restated to classify the UK Solid Waste segment as a discontinued operation.
The exceptional tax credit for the year ended March 2013 of £2.0m related to a favourable judgement issued with regard to certain tax liabilities in Belgium. The Finance Act 2012 included legislation to reduce the main rate of UK corporation tax from 24% to 23% from 1 April 2013. The March 2013 budget statement announced that the rate would be further reduced to 21% from 1 April 2014 and then 20% by 1 April 2015. These further reductions were substantially enacted in the Finance Act 2013 on 2 July 2013 and as a result the UK deferred tax at 31 March 2014 has been calculated based on the rate of 20% (2013: 23%).

34
Notes to the Consolidated Financial Statements
6. Discontinued operations and assets classified as held for sale
2014
£m 2013
£m
Assets classified as held for sale 3.2 3.3
Liabilities directly associated with assets classified as held for sale - (3.3)
3.2 -
The assets classified as held for sale at 31 March 2014 relate to the exit from UK Solid Waste as further described below. The assets and liabilities held for sale at 31 March 2013 related to the joint venture, Caird Bardon Limited and the sale of this investment was completed on 21 April 2013. Discontinued operations
On 15 October 2013 the Group signed a binding agreement to sell the majority of its UK Solid Waste business to Biffa Waste Services Limited and that transaction was completed on 31 December 2013. It also announced that the decision had been taken to sell the remaining UK Solid Waste facilities except for Elstow which serves municipal customers. In accordance with IFRS 5, Non-current Assets Held for Sale and Discontinued Operations, the net results of these operations which have been sold and discontinued are presented within discontinued operations in the Income Statement and the assets which are still to be sold are presented separately in the Balance Sheet. Assets held for sale at 31 March 2014 were principally the material recycling facility at Kettering. The tables below show the results of the discontinued operations which are included in the Group Income Statement, Group Balance Sheet and Group Cash Flow Statement respectively.
Income Statement
2014
£m 2013
£m
Revenue 40.0 55.4
Cost of sales (39.0) (54.5)
Administrative expenses (5.4) (4.5)
Trading loss before exceptional and non-trading items (4.4) (3.6)
Exceptional and non-trading items (24.5) (21.5)
Operating loss before finance costs and tax on discontinued operations (28.9) (25.1)
Finance charges (0.1) (0.1)
Loss before tax on discontinued operations (29.0) (25.2)
Taxation 1.0 1.1
Loss after tax on discontinued operations (28.0) (24.1)
The exceptional and non-trading items include a loss of £20.4m to recognise the loss on sale of assets to Biffa and the remeasurement of the disposal assets to their fair value less costs to sell. The taxation credit of £1.0m includes £0.1m in relation to the remeasurement to fair value less costs to sell. The prior year exceptional and non-trading charge included £3.0m impairment of property, plant and equipment, £8.3m impairment of goodwill and intangibles, £3.9m write down of the investment in Caird Bardon Limited and £1.9m restructuring charge.
In addition to the £28.0m, a £2.0m charge has been reflected in the year for credit issues with regard to deferred consideration.
Balance Sheet
2014
£m
Property, plant and equipment 3.2
Total assets classified as held for sale 3.2
At 31 March 2014 £3.2m of property, plant and equipment was classified as held for sale, following a remeasurement to their fair value less costs to sell. This is the non-recurring fair value measurement which has been measured using observable inputs, being the prices for recent sales of similar assets, and is therefore classified within level 2 of the fair value hierarchy.
Cash Flow Statement
2014
£m 2013
£m
Net cash flows used in operating activities (4.9) (4.2)
Net cash flows from (used in) investing activities 9.4 (1.5)
Net cash flows used in financing activities (0.1) (0.1)
Net cash flows from (used in) discontinued operations 4.4 (5.8)

35
Notes to the Consolidated Financial Statements
7. Earnings per share
2014
Restated*
2013
Number of shares
Weighted average number of ordinary shares for basic earnings per share 397.6m 397.1m
Effect of share options in issue 0.3m 0.1m
Weighted average number of ordinary shares for diluted earnings per share 397.9m 397.2m
Continuing operations
Profit (loss) attributable to owners of the parent used to determine basic and diluted earnings per share (£m) 1.7 (11.2)
Non-trading and exceptional items (net of tax) (£m) (see note 3) 21.1 33.6
Earnings attributable to owners of the parent for underlying basic and underlying diluted earnings per share (£m) 22.8 22.4
Basic and diluted earnings (loss) per share 0.4p (2.8)p
Underlying and underlying diluted earnings per share (see note below) 5.7p 5.7p
Discontinued operations
Loss attributable to owners of the parent used to determine basic and diluted earnings per share (£m) (30.0) (24.1)
Non-trading and exceptional items (net of tax) (£m) (see note 3) 26.4 21.3
Loss attributable to owners of the parent for underlying basic and underlying diluted earnings per share (£m) (3.6) (2.8)
Basic and diluted loss per share (7.5)p (6.1)p
Underlying and underlying diluted loss per share (see note below) (0.9)p (0.7)p
Total operations
Loss attributable to owners of the parent used to determine basic and diluted earnings per share (£m) (28.3) (35.3)
Non-trading and exceptional items (net of tax) (£m) (see note 3) 47.5 54.9
Earnings attributable to owners of the parent for underlying basic and underlying diluted earnings per share (£m) 19.2 19.6
Basic and diluted loss per share (7.1)p (8.9)p
Underlying and underlying diluted earnings per share (see note below) 4.8p 5.0p
*The comparatives have been restated to classify the UK Solid Waste segment as a discontinued operation.
The Directors believe that adjusting earnings per share for the effect of the amortisation of acquisition intangibles (excluding landfill void and computer software), the change in fair value of derivatives and exceptional items enables comparison with historical data calculated on the same basis. Exceptional items are those items that need to be disclosed separately on the face of the Income Statement, because of their size or incidence, to enable a better understanding of performance.
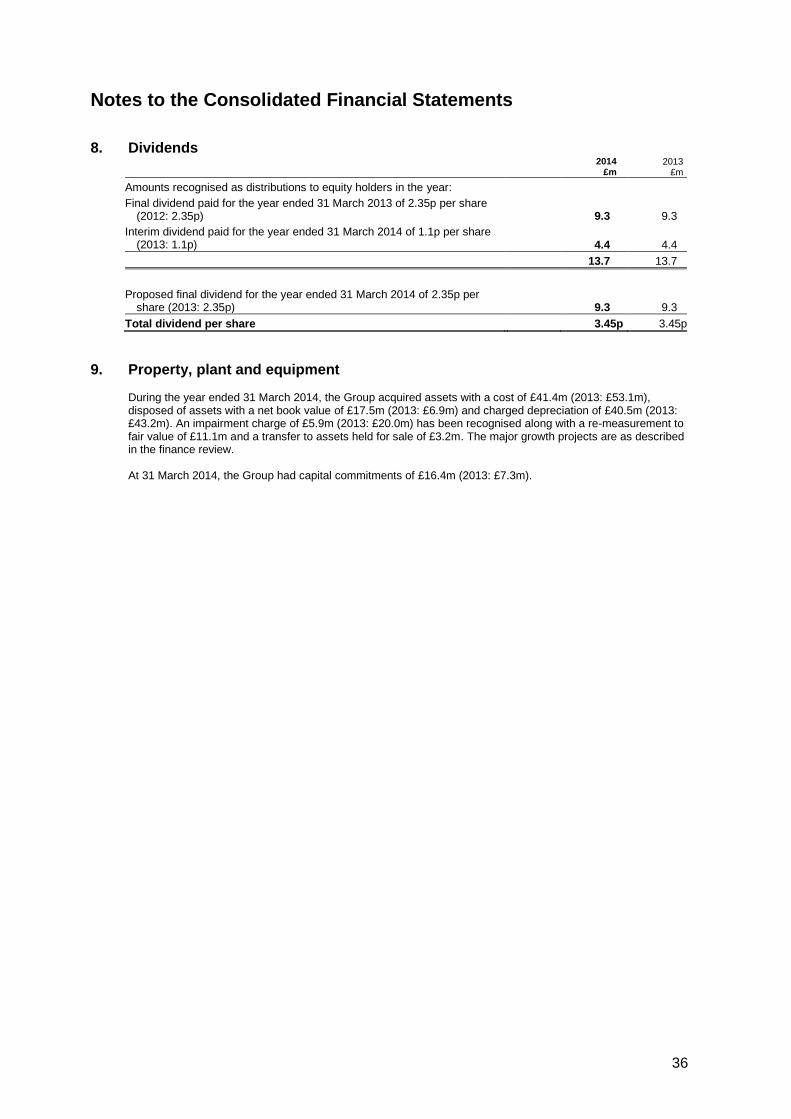
36
Notes to the Consolidated Financial Statements
8. Dividends
2014 £m
2013 £m
Amounts recognised as distributions to equity holders in the year:
Final dividend paid for the year ended 31 March 2013 of 2.35p per share (2012: 2.35p)
9.3 9.3
Interim dividend paid for the year ended 31 March 2014 of 1.1p per share (2013: 1.1p)
4.4 4.4
13.7 13.7
Proposed final dividend for the year ended 31 March 2014 of 2.35p per share (2013: 2.35p) 9.3 9.3
Total dividend per share 3.45p 3.45p
9. Property, plant and equipment
During the year ended 31 March 2014, the Group acquired assets with a cost of £41.4m (2013: £53.1m), disposed of assets with a net book value of £17.5m (2013: £6.9m) and charged depreciation of £40.5m (2013: £43.2m). An impairment charge of £5.9m (2013: £20.0m) has been recognised along with a re-measurement to fair value of £11.1m and a transfer to assets held for sale of £3.2m. The major growth projects are as described in the finance review. At 31 March 2014, the Group had capital commitments of £16.4m (2013: £7.3m).

37
Notes to the Consolidated Financial Statements
10. Provisions
Site restoration
and aftercare £m
Restructuring £m
Other £m
Total £m
At 1 April 2013 29.5 4.5 23.1 57.1
Provided in the year 1.1 3.0 4.1 8.2
Released in the year - (0.4) (8.0) (8.4)
Finance charges – unwinding of discount 1.3 - 1.4 2.7
Utilised in the year (0.2) (3.8) (9.2) (13.2)
Exchange (0.7) - (0.1) (0.8)
At 31 March 2014 31.0 3.3 11.3 45.6
Current 1.7 2.8 7.1 11.6
Non-current 29.3 0.5 4.2 34.0
At 31 March 2014 31.0 3.3 11.3 45.6
Current 0.1 4.2 14.1 18.4
Non-current 29.4 0.3 9.0 38.7
At 31 March 2013 29.5 4.5 23.1 57.1
Site restoration
The site restoration provision as at 31 March 2014 related to the cost of final capping and covering of the landfill sites. The Group‟s minimum unavoidable costs have been reassessed at the year end and the net present value fully provided for. These costs are expected to be paid over a period of up to 25 years from the balance sheet date and may be impacted by a number of factors including changes in legislation and technology. Aftercare
Post-closure costs of landfill sites, including such items as monitoring, gas and leachate management and licensing, have been estimated by management based on current best practice and technology available. These costs may be impacted by a number of factors including changes in legislation and technology. The dates of payments of these aftercare costs are uncertain but are anticipated to be over a period of approximately 30 years from closure of the relevant landfill site. Restructuring
The restructuring provision relates to redundancy and related costs incurred in the structural cost reduction programme. Costs, net of releases, of £2.6m (2013: £10.6m) have been reflected and £3.8m (2013: £6.2m) has been utilised during the year. As at 31 March 2014 the majority of the affected employees had left the group‟s employment with the remainder due to depart during the following year. Other
Other provisions principally cover onerous contracts, onerous leases, warranties and indemnities. Onerous contracts are provided at the net present value of the operating losses of the onerous contracts and note 3 explains the releases in the year. The provision is to be utilised over the period of the contracts to which they relate with the latest date being 2029. Under the terms of the agreements for the disposal of the UK landfill and power and other UK operations, the Group has given a number of warranties and indemnities to the purchasers which may give rise to payments.

38
Notes to the Consolidated Financial Statements
11. Defined benefit pension scheme The Group‟s principal pension scheme is the Shanks group Pension Scheme which covers eligible UK employees and has both funded defined benefit and defined contribution sections. The amounts recognised in the Income Statement were as follows:
2014
£m 2013
£m
Current service cost 0.5 0.5
Interest expense on scheme net liabilities 0.3 0.3
Curtailment cost 0.7 -
Net retirement benefit charge before tax 1.5 0.8
The amounts recognised in the balance sheet were as follows:
2014
£m 2013
£m
Present value of funded obligations (148.0) (142.4)
Fair value of plan assets 134.9 133.6
Pension scheme deficit (13.1) (8.8)
Related deferred tax asset 2.6 2.0
Net pension liability (10.5) (6.8)
There have been no significant changes in the pension assumptions from those presented in the annual financial statements for the year ended 31 March 2013. The net pension liability has increased due to a reduction in the discount rate reflecting a lower yield in AA-rated corporate bonds.
12. Financial instruments at fair value The Group holds derivative financial instruments used for hedging which are measured at fair value. The Group uses the following hierarchy of valuation techniques to determine the fair value of financial instruments:
Level 1: quoted (unadjusted) prices in active markets for identical assets or liabilities;
Level 2: other techniques for which inputs which have a significant effect on the recorded fair value are observable, either directly or indirectly;
Level 3: techniques which use inputs which have a significant effect on the recorded fair value that are not based on observable market data.
The Group does not hold any financial instruments at fair value which are valued using Level 1 or Level 3 techniques and there have been no transfers between categories in the current or preceding period. Valuation techniques used to derive Level 2 fair values
The fair values of interest rate swaps, forward foreign exchange contracts and fuel derivatives are determined by discounting the future cash flows using the applicable period-end yield curve. None of the changes in the fair value of interest rate swaps is attributable to changes in the Group‟s credit risk. Financial instruments at fair value
2014
£m 2013
£m
Liabilities
Derivative financial instruments 16.0 30.8
Carrying amounts versus fair values
The fair value of the retail bonds was £168.6m (2013: £87.5m) compared to a carrying value of £164.3m (2013: £83.8m) and the fair value of the senior notes was £36.3m (2013: £53.3m) compared to a carrying value of £32.9m (2013: £48.9m). The fair value of all other financial assets and financial liabilities in the consolidated balance sheet were not materially different to their carrying value.
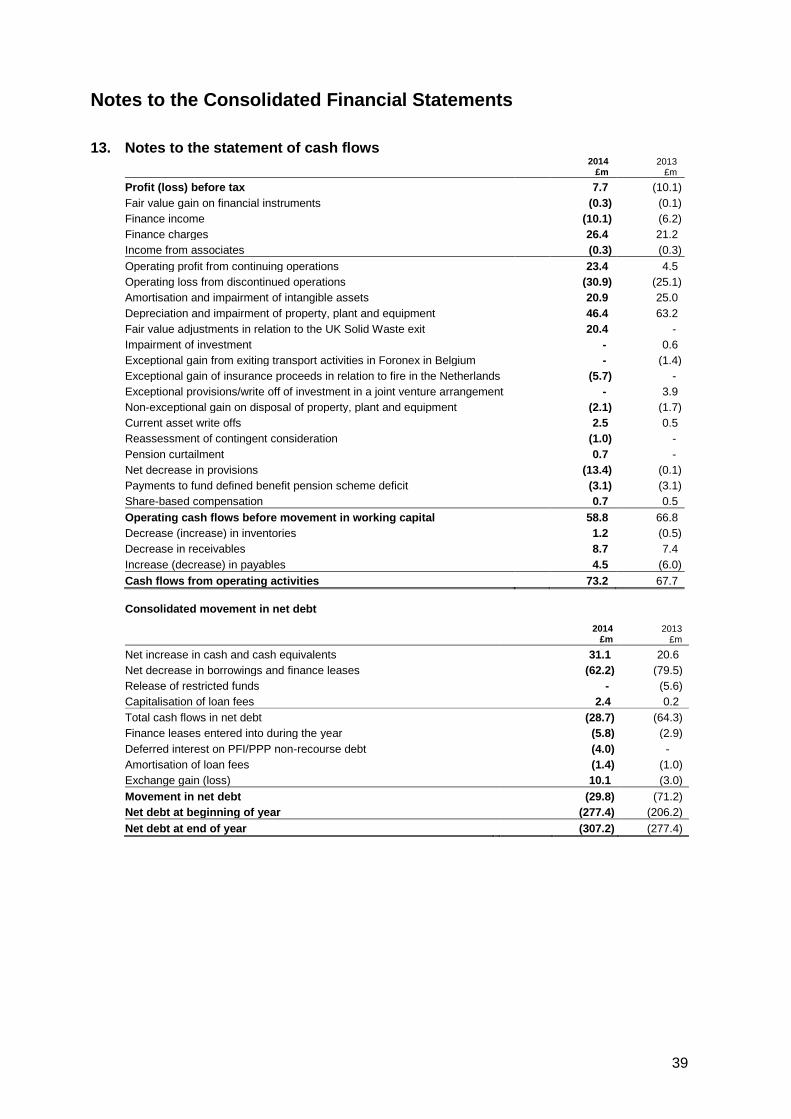
39
Notes to the Consolidated Financial Statements
13. Notes to the statement of cash flows
2014
£m 2013
£m
Profit (loss) before tax 7.7 (10.1)
Fair value gain on financial instruments (0.3) (0.1)
Finance income (10.1) (6.2)
Finance charges 26.4 21.2
Income from associates (0.3) (0.3)
Operating profit from continuing operations 23.4 4.5
Operating loss from discontinued operations (30.9) (25.1)
Amortisation and impairment of intangible assets 20.9 25.0
Depreciation and impairment of property, plant and equipment 46.4 63.2
Fair value adjustments in relation to the UK Solid Waste exit 20.4 -
Impairment of investment - 0.6
Exceptional gain from exiting transport activities in Foronex in Belgium - (1.4)
Exceptional gain of insurance proceeds in relation to fire in the Netherlands (5.7) -
Exceptional provisions/write off of investment in a joint venture arrangement - 3.9
Non-exceptional gain on disposal of property, plant and equipment (2.1) (1.7)
Current asset write offs 2.5 0.5
Reassessment of contingent consideration (1.0) -
Pension curtailment 0.7 -
Net decrease in provisions (13.4) (0.1)
Payments to fund defined benefit pension scheme deficit (3.1) (3.1)
Share-based compensation 0.7 0.5
Operating cash flows before movement in working capital 58.8 66.8
Decrease (increase) in inventories 1.2 (0.5)
Decrease in receivables 8.7 7.4
Increase (decrease) in payables 4.5 (6.0)
Cash flows from operating activities 73.2 67.7
Consolidated movement in net debt
2014 £m
2013 £m
Net increase in cash and cash equivalents 31.1 20.6
Net decrease in borrowings and finance leases (62.2) (79.5)
Release of restricted funds - (5.6)
Capitalisation of loan fees 2.4 0.2
Total cash flows in net debt (28.7) (64.3)
Finance leases entered into during the year (5.8) (2.9)
Deferred interest on PFI/PPP non-recourse debt (4.0) -
Amortisation of loan fees (1.4) (1.0)
Exchange gain (loss) 10.1 (3.0)
Movement in net debt (29.8) (71.2)
Net debt at beginning of year (277.4) (206.2)
Net debt at end of year (307.2) (277.4)

40
Notes to the Consolidated Financial Statements
13. Notes to the statement of cash flows - continued
At 1 April 2013
£m
Cash flows
£m
Other non-cash changes
£m
Exchange movements
£m
At 31 March 2014
£m
Cash and cash equivalents 75.4 31.1 - (1.9) 104.6 Bank loans (112.3) 54.1 (1.0) 5.6 (53.6) Senior notes (48.9) 15.2 - 0.8 (32.9) Retail bonds (83.8) (85.4) (0.4) 5.3 (164.3) Finance leases (7.7) 3.4 (5.8) 0.3 (9.8)
Total core net debt (177.3) 18.4 (7.2) 10.1 (156.0)
PFI/PPP non-recourse net debt (100.1) (47.1) (4.0) - (151.2)
Total net debt (277.4) (28.7) (11.2) 10.1 (307.2)
On 30 July 2013 the Group issued €100m of six year bonds listed to investors in Belgium and Luxembourg at an annual coupon of 4.23% and on 13 September 2013 the Group repaid €18m of senior notes at their maturity.
14. Contingent assets and liabilities
Provision is made for the Directors‟ best estimate of all known claims and all legal actions in progress. The Group takes legal advice as to the likelihood of success of claims and actions and no provision is made where the Directors consider, based on that advice that the action is unlikely to succeed or a sufficiently reliable estimate of the potential obligation cannot be made. Under the terms of sale agreements, the Group gave a number of indemnities and warranties relating to the disposed operations for which appropriate provisions are held.

41
APPENDIX The following additional information, summarised from the Shanks Group plc Annual Report and Accounts 2014, is disclosed in accordance with Disclosure and Transparency Rule 6.3.5.
1. Principal Risks and Uncertainties affecting the Group Liquidity risk - that the Group may generate insufficient cash to invest and grow.
Waste volumes - that incoming waste arising in the market may fall.
Pricing competition - that market pricing may put pressure on our margins.
Talent development/leadership - that we may lack the required management capabilities.
Long-term contracts - that we enter into long-term contracts on disadvantageous terms.
Credit risk - that we are unable to refinance our debt effectively.
Safety, health and environmental compliance - that we incur reputational damage, cost or business interruption through failure to comply.
Recyclate pricing - that the value we receive for recycled products falls.
Fire and business continuity - business interruption costs arising from a physical disaster.
Project execution - that we fail to deliver our investment and cost reduction programmes.
ICT failure - that ICT failure causes business interruption or loss.
Operational failure – a material failure at one of our core facilities, particularly ATM
2. Directors' Responsibility, financial information and posting of accounts
The 2014 Annual Report which will be published in June 2014 contains a responsibility statement in compliance with DTR 4.1.12. This states that on 15 May 2014, the date of the approval of the Annual Report, the Directors confirm that to the best of their knowledge:
the Group financial statements, which have been prepared in accordance with IFRSs as adopted by the EU, give a true and fair view of the assets, liabilities, financial position and profit of the Group: and
the Strategic Report in the Annual Report includes a fair review of the development and performance of the business and the position of the Group, together with a description of the principal risks and uncertainties that it faces.
The financial information set out above does not constitute the Company's full statutory accounts for the year ended 31 March 2013 or 2014, but is derived from those accounts. Statutory accounts for 2012/13 have been delivered to the Registrar of Companies and those for 2013/14 will be delivered following the Company's Annual General Meeting on 25 July 2014. The auditors have reported on those accounts; their reports were unqualified and did not contain statements under Section 498(2) or (3) of the Companies Act 2006. The following changes to the Board of Directors of Shanks Group plc since the 2013 Annual Report are noted; Ms Marina Wyatt was appointed to the Board on 2 April 2013. On 25 July 2013 Mr Peter Johnson resigned from the Board. A list of current directors is shown on the Company website.