SHAKING TABLE TESTS FOR INTERACTION OF SOIL ‘01 XV Congresso AIMETA di Meccanica Teorica e...
15
AIMETA ‘01 XV Congresso AIMETA di Meccanica Teorica e Applicata 15 th AIMETA Congress of Theoretical and Applied Mechanics SHAKING TABLE TESTS FOR INTERACTION OF SOIL AND STRUCTURE ON SHORT-STIFF-PILES AND LONG-FLEXIBLE-PILES A. WADA 1 , S. YAMADA 2 , K. KOBAYASHI 3 , H. INAGAKI 4 1 Professor, Tokyo Institute of Technology, Yokohama, Japan 2 Associate Professor, Tokyo Institute of Technology, Yokohama, Japan 3 Chief Engineer, Fujita Corporation, Atsugi, Japan 4 Engineer, Nippon Kokan, Tokyo, Japan ABSTRACT In Japan, we started to study soil-pile-structure interaction problems about 30 years ago, but very few structural engineers considered lateral forces to design piles supporting building structures at that time. During the Niigata Earthquake (1964), Miyagiken-oki Earthquake (1978), Hyogoken-nanbu Earthquake (1995) and other large earthquakes, many piles were damaged severely and many buildings on these piles were inclined after the earthquake. In the last 20 years, many engineers have come to consider the behaviour of soil-pile-structure interaction. The piles have to support the gravity weight of the building and will be subject to the lateral force caused by the earthquake. Very strong piles are needed for these two large forces. In this study, we use two groups of piles supporting the building. The first group has long-flexible-piles for the building gravity weight, and the second group has short-stiff-piles resisting the lateral forces due to earthquake ground motion. We will present the basic idea and the results of a small shaking table test of soil-pile-structure interaction problems for our new idea. 1. INTRODUCTION 1.1. Background Structural design methods for building superstructures have recently been changing to take into account seismic input accelerations ranging from small to very large. However, these methods are not being widely applied to the pile foundations that support the building superstructures. In past large earthquakes such as the Niigata Earthquake, Miyagiken-oki Earthquake, Hyogoken-nanbu Earthquake, pile foundations have experienced very severe damage, particularly differential settlement. It has thus become necessary to design pile foundations on the same basis as for the superstructures they support. The Northridge Earthquake (1994) and the Hyogoken-nanbu Earthquake (1995) focused attention on the “damage control design method” for building superstructures. This method separates a structure into a main structural system that supports the vertical load, and an
Transcript of SHAKING TABLE TESTS FOR INTERACTION OF SOIL ‘01 XV Congresso AIMETA di Meccanica Teorica e...

AIMETA ‘01
XV Congresso AIMETA di Meccanica Teorica e Applicata 15th AIMETA Congress of Theoretical and Applied Mechanics
SHAKING TABLE TESTS FOR INTERACTION OF SOIL
AND STRUCTURE ON SHORT-STIFF-PILES AND LONG-FLEXIBLE-PILES
A. WADA1, S. YAMADA2, K. KOBAYASHI3, H. INAGAKI4
1 Professor, Tokyo Institute of Technology, Yokohama, Japan 2 Associate Professor, Tokyo Institute of Technology, Yokohama, Japan 3 Chief Engineer, Fujita Corporation, Atsugi, Japan 4 Engineer, Nippon Kokan, Tokyo, Japan
ABSTRACT In Japan, we started to study soil-pile-structure interaction problems about 30 years ago, but very few structural engineers considered lateral forces to design piles supporting building structures at that time. During the Niigata Earthquake (1964), Miyagiken-oki Earthquake (1978), Hyogoken-nanbu Earthquake (1995) and other large earthquakes, many piles were damaged severely and many buildings on these piles were inclined after the earthquake. In the last 20 years, many engineers have come to consider the behaviour of soil-pile-structure interaction. The piles have to support the gravity weight of the building and will be subject to the lateral force caused by the earthquake. Very strong piles are needed for these two large forces. In this study, we use two groups of piles supporting the building. The first group has long-flexible-piles for the building gravity weight, and the second group has short-stiff-piles resisting the lateral forces due to earthquake ground motion.
We will present the basic idea and the results of a small shaking table test of soil-pile-structure interaction problems for our new idea. 1. INTRODUCTION 1.1. Background Structural design methods for building superstructures have recently been changing to take into account seismic input accelerations ranging from small to very large. However, these methods are not being widely applied to the pile foundations that support the building superstructures. In past large earthquakes such as the Niigata Earthquake, Miyagiken-oki Earthquake, Hyogoken-nanbu Earthquake, pile foundations have experienced very severe damage, particularly differential settlement. It has thus become necessary to design pile foundations on the same basis as for the superstructures they support.
The Northridge Earthquake (1994) and the Hyogoken-nanbu Earthquake (1995) focused attention on the “damage control design method” for building superstructures. This method separates a structure into a main structural system that supports the vertical load, and an

energy absorbing system that resists the seismic excitation. This method maintains the main structure within the elastic behaviour range even when a severe earthquake occurs.
This paper proposes a new pile foundation structural system that is achieved by applying the concept of the damage control design method to the design of pile foundations and verifies its effectiveness. It also describes shaking table tests using scale models of a coupled system comprising soil, piles and structure. 1.2. Concept of damage-controlled pile foundation Figure1 shows the concept of this foundation system. In conventional pile foundation structures, the piles resist both vertical loads and horizontal seismic loads. However, in the proposed structural system, long slender piles support the vertical load (hereafter called support piles) and short squat piles resist the horizontal seismic load (hereafter called earthquake-resisting piles). The roles of each set of piles are thus clearly separated.
1.3. VThe timereal timbehavioudeforma
The ssystem w
EarthquakeResisting Pile
Support Pile
Conventional Pile Foundationisualization of shaking table tests using sca ratio for the law of similarity is set at 1/1 fo
e. The soil, piles and structure are uncover of the overall coupled system. The s
tions. cale model was based on the mass model shas divided into mass points.
Fig.1 Conceptual Figure of Pi
New Idea
le model r the dynamic scale experiment based on red to enable visual clarification of the cale model is designed to enlarge the
own in Figure2, i.e., the overall coupled
le Foundation

2. SCALE MODEL 2.1. Coupled system for soil-piles-structure The coupled system of soil-piles-structure comprised a uniform clay soil (Table1) and a building foundation (Table2) as shown in Figure3. Parameters such as pile type, etc., were based on this system.
Table1 Outline of Assumed Ground Condition Property of Subsurface Layers Clay Layer
Period of Ground : T 0.9[sec] Thickness of Subsurface Layers : H 30[m]
Shear Wave Velocity :VS 133[m/sec] 1) Uniaxial Compressive Strength : qu 9.8[N/cm2] 2) 1) VS=4H/T 2) VS=134qu
0.443
Table2 Outline of Superstructure and Foundation Structure Reinforced Concrete Structure
Unit Area Weight 9.8[kN/m2] Number of Layers 8[layer] Height of Building 29[m]
Plan 24.0[m]×24.0[m] Primary Period 0.6[sec]
Pile Type Cast-in-site Mortar Pile, End Bearing Pile Pile Diameter 1600φ×16 pieces Length of Pile 3000[cm]
E 2.1×10⁶[N/cm2]
Fig.2 Mass and Spring Model

Fig.3 Assumed Model of Soil-Pile-Structure
2.2. Law of similarity in scale model experiments Figure3 shows the laws of similarity used in these scale model experiments. The length ratio, the time ratio and the mass ratio are specified. In previous shaking table tests using scale models, the time scale has usually been reduced to satisfy the law of similarity. However, this study employed the time ratio of 1/1 as stated above. As a result, the acceleration ratio became 1/40 (Table3). However, the vertical acceleration ratio could not be satisfied since the experiment was conducted in a 1G-gravity field. To overcome this problem, the scale model was designed so that the gravitational acceleration had no influence during the vibration tests. The scale model incorporated the coupled system of soil-pile-structure.
2.3. Design and construction of scale models Photograph1 and Figure4 provide an overall view of the scale model. A 15-layered shear model was constructed as the soil model. It comprised steel plates weighing about 24 kg and small laminated rubbers to maintain elastic motion under shear force. Its primary natural period was 0.88 sec. Sixteen foundation piles were represented by four piles in the scale model, as shown in Figure3. This was designed to ensure that the foundation slab generated only horizontal motion and that the foundation piles showed simultaneously the same deformation pattern. The piles were made of acrylic bar. Attempts were made to achieve a rigid joint or a pin joint so that the foundation slab was rigid compared to the piles (Figure5). The soil model and the support piles were integrated with the help of an intensive soil column model simulating the soil in the vicinity of the piles.
Vs=133[m/sec]
8[m]8[m]
29[m
]8[
m]
8[m
]
8[m]
8[m
]30
[m]
Bearing Foundation Bed
Subsurface Layers

Photograph1 Soil-Pile-Structure Testing Model
Table3 Law of Similitude Physical Quantity Dimension Law of Similitude
Displacement, Length* L 1/40 Time* T 1/1 Mass* M 1/(1.15×106)
Velocity LT-1 1/40 Acceleration LT-2 1/40 Frequency T-1 1/1
Density ML-3 403/(1.15×106) Force, Weight MLT-2 1/(1.15×106×40)
Moment ML2T-2 1/(1.15×106×402) Stress ML-1T-2 40/(1.15×106)
Spring Constant MT-2 1/(1.15×106) Poisson Ratio - 1/1
Damping Constant - 1/1 * : Setting Similar Ratio

Fig.5 Detail of Pile Head
Rigid Connection Pin Connection
Foundation BeamEnd Bearing Pile
Fig.4 Soil-Pile-Structure Testing Model [mm]
94074
336
032
0
Acrylic Column
Small Isolator
Accelerometer
Y
X
210
94020074
3
743
360
360
Bearing Pile Model Foundation Beam
Plan ofFoundation Beam
Plan ofGround Model
Horizontal Soil SpringAcrylic End Bearing Pile ModelMass of
Intensive Soil Column
Acrylic End Bearing Pile Model
AccelerometerHorizontalSoil Spring
Mass ofSuper Structure (39[N])
Disp. Gage
FoundationBeam Earthquake
Resisting Pile

The integration was accomplished by a spring having a stiffness equivalent to that of the horizontal soil spring obtained from the coefficient of horizontal ground reaction, as shown below. Thus, piles were designed with their outer sides exposed so that the pile deformations could be visually confirmed. In the intensive soil columns, the ratio of the cross-sectional area of the soil column to the plan area of the building was assumed to be 0.31, and the ratio of the intensive mass to the building mass was assumed to be 1.0. This set the scale. Shear stiffness of the intensive soil column was set to the same as that of the soil model.
The superstructure was modeled as a single mass system comprising a steel mass and an acrylic column to maintain horizontal stiffness. Its natural period was 0.6 sec. 3. SHAKING TABLE TESTS USING SCALE MODELS 3.1. Plan of tests Table4 shows the parameters of the test specimens. The configurations of the earthquake resistant piles (5m-long cast-in-place piles with 1.6m-diameter) were made identical, but the number of piles was varied. First, a static loading experiment was carried out to measure the foundation’s horizontal stiffness for each case and the shear force distribution factors by pile type as support piles and earthquake resistant piles. Thereafter, shaking table tests were carried out using a small shaking table. The horizontal displacement and the acceleration were measured at five and four points, respectively. Furthermore, 10 strain gauges for plastics were attached to one of four piles to measure the strain distributions in the piles for calculating bending moment distribution.
Table4 Parameters of Testing Model
Cast-in-site Mortar Pile (Normal) Type of Pile Steel Pipe Pile (Slender) Rigid Junction (Rigid) Method of Pile Head Pin junction (Pin)
0 (ER0) 5 (ER5)
10 (ER10) Earthquake Resisting Pile
[pieces] 26 (ER26)
Without (without Oil Damper) Oil Damper With (with Oil Damper) 3.2. Static loading tests A 20N horizontal loading was statically applied to the foundation slab with all the soil layers fixed. The horizontal stiffness of the foundation piles was thus obtained for each case, as shown in Photograph2 (Table5). The deformation conditions under the static loading at the pile head rigid connection and the pin connection can be visually confirmed from Photograph3. If the pile head is assumed to act like a pin, the horizontal stiffness of the foundation becomes about 1/3 that of the rigid connection. Figure6 shows the distribution of bending moment of the pile, as shown in the hatched part of Table5. It is thus confirmed that,
Photograph2 Pile Head Connection
Fig.6 Bending Moment at Static Test
if the horizontal rigidities of the foundations are almost identical, the bending moment of the pile decreases as the burden factor of the support piles decreases.
Pile Head : Rigid, Pin
End Bearing Pile : Normal, Slender
Earthquake-resisting Pile
Horizontal Soil Spring for Earthquake-resisting Pile
:0,5,10,26 pieces,total:4type
-100
-80
-60
-40
-20
0 20 40 60 80 100
bending moment [N・cm]
Normal,Rigid,ER0Slender,Pin, ER10
49[N・cm] 18[N・cm]

Normal Pile, Pile Head : Rigid Normal Pile, Pile Head : Pin
Photograph3 Deformation Condition of End Bearing Pile (Static Test)
3.3. Shaking table tests The earthquake ground motion on the ground surface or foundation slab is often employed as input motion for designing the superstructure. This input ground motion for the superstructure can thus be decreased, if the earthquake input energy can be absorbed around the pile foundation. Furthermore, if the stress of the support piles can be decreased at the same time, a safer and more efficient pile foundation design can be achieved. This paper defines the following two objectives.
Table5 Results of Static Test (Horizontal Force=20[N]) Type of Pile Cast-in-site Mortar Pile (Normal) Pile of Steel Pipe (Slender) Pile Head Rigid Pin Rigid Pin
Earthquake Resisting Pile [pieces]
0 5 10 26 0 5 10 26 0 5 10 26 0 5 10 26
Max. Bending Moment [N/cm]
48.7
38.7
24.9
14.8
69.1
38.2
23.9
11.5
37.2
26.5
18.6
11.8
59.8
30.5
18.3
7.55
Horizontal Stiffness [N/cm]
20.4
25.8
41.7
70.0
7.35
14.9
24.1
51.5
18.1
26.9
38.4
65.4
6.17
13.3
21.8
56.0
Burden Rate of Horizontal Stiffness by End Bearing Pile [%]
100 79.1
48.8
29.1 100 49.
3 30.5
14.3 100 67.
5 47.2
27.7 100 46.
3 28.4
11.0

Fig.7 Period Characteristics of Input Wave and Response Magnification of Model (Superstructure and Ground)
(1) Decrease the acceleration at the foundation slab during earthquake. (2) Decrease the bending moment of the support piles
a) Tests for the elastic models The shaking table tests have been performed for 16 cases (pile head: rigid or pin, support pile: normal or slender, number of seismic resistant piles: 0, 5, 10, 26), subjected to 3 input earthquake ground motions of Table6. Figure7 shows the relationships of vibrations at the shaking table and top of the soil by the Fourier spectrums.
The maximum bending moment distributions of two cases are compared in Figure8.
Table6 Input Wave
El_Centro, NS, 6kine (El Centro) Hachinohe, EW, 6kine (Hachinohe) JMA_KOBE, NS, 6kine (KOBE)
0
50
100
150
200
0 0.5 1 1.5 2period[sec]
Four
ier s
pect
rum
[cm
/sec
]
O n the shakingtableTop of theground model
020406080
100
120140160180200
0 0.5 1 1.5 2period[sec ]
Four
ier
spec
trum
[cm
/sec
]
O n the shakingtableTop of theground model
El Centro
0
50
100
150
200
0 0.5 1 1.5 2period[sec]
Four
ier s
pect
rum
[cm
/sec
]
O n the shakingtableTop of theground model
Hachinohe
0
2
4
6
8
10
0 0.5 1 1.5 2period[sec]
Res
pons
e m
agni
ficat
ion
Model ofsuperstructureModel of ground
0.7[sec] 0.9[sec]
KOBE

Fig.8 Max. Bending Moment (KOBE)
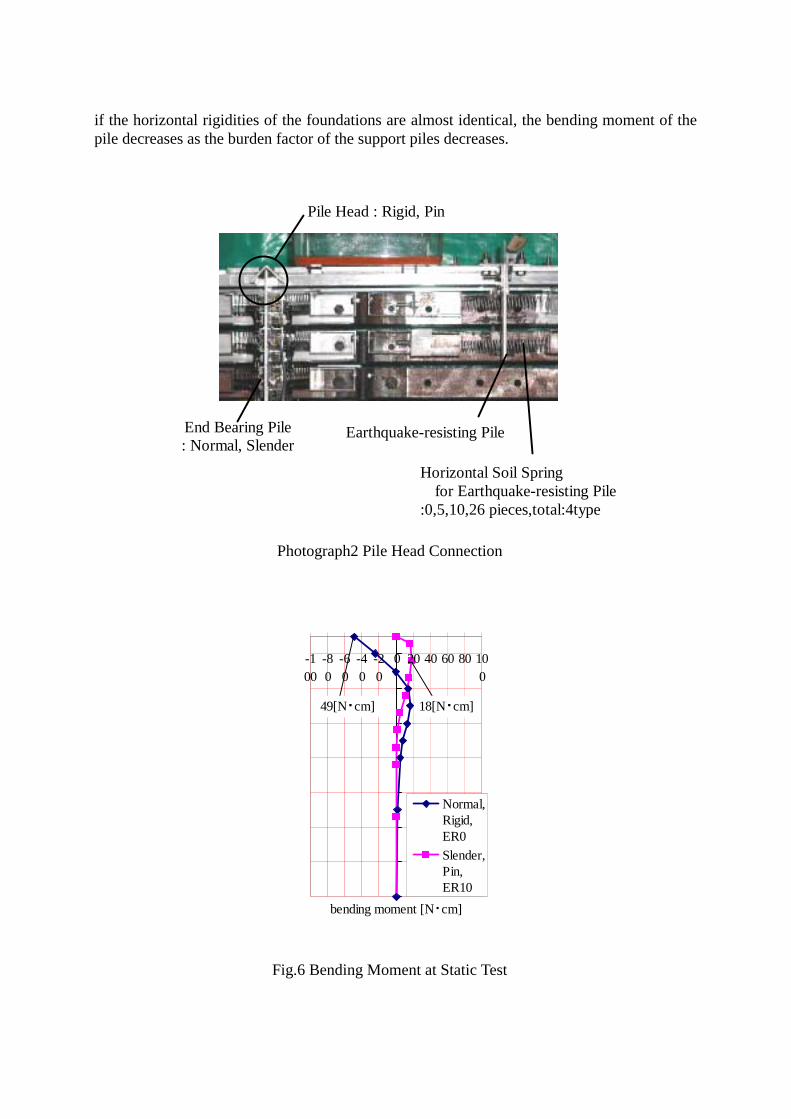
Figure9 shows the horizontal stiffness distribution factors of the support piles, the plots of maximum bending moment of the support piles and the curve-fitted linear line for each case. This reveals that the bending moment in the support piles can be decreased by installing earthquake resistant piles and by reducing the horizontal stiffness distribution factor for the support piles. Furthermore, the effect has a linear relationship, which is more pronounced in the pin connection at pile head. Figure10 shows the plots of horizontal stiffness of the foundation and input energy to the superstructure. Except where the foundation’s horizontal stiffness is extremely small, it had no significant effect on the input energy to the superstructure. All of the input energies for KOBE were shown to be large, since the seismic ground motions were dominant in the vicinity of the natural period in KOBE while they are not in the other two cases (Figure7). To achieve a decreasing input, a mechanism would be necessary that would absorb the input energy from the ground near the earthquake resistant piles. However, such a decrease in support pile stress would not be simple to achieve, since the subject vibration is elastic, taking into account the effect of plasticizing the ground and rapid decrease in the foundation’s horizontal stiffness during an earthquake. b) Tests for the model having supplementary damping devices To determine the effect of energy absorption in the vicinity of the earthquake resistant piles as discussed in relation to the elastic tests, the supplementary damping device shown in Figure4 (oil damper) was installed and shaking tests were performed as for the elastic experiment. Figures 11 and 12 compare the bending moments and the displacements of the superstructure with and without the oil damper, for the same pile type and pile head connection. It was found that both the bending moment and displacement of the superstructure decreased. A similar trend is found for a pin connection at the pile head. It is thus confirmed that the
-100
-80
-60
-40
-20
0 20 40 60 80 100
bending moment [N・cm]
Normal,Rigid,ER0Slender,P in, ER10
24[N・cm]63[N・cm]
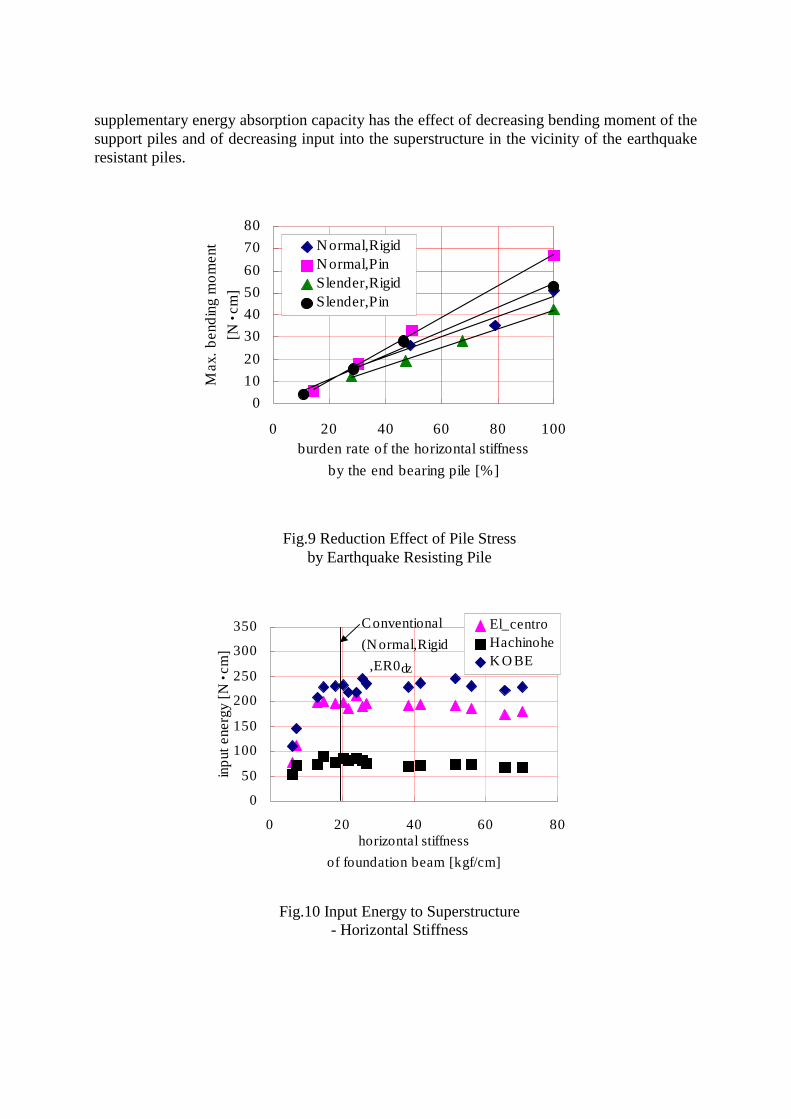
Fig.9 Reduction Effect of Pile Stress by Earthquake Resisting Pile
supplementary energy absorption capacity has the effect of decreasing bending moment of the support piles and of decreasing input into the superstructure in the vicinity of the earthquake resistant piles.
01020304050607080
0 20 40 60 80 100burden rate of the horizontal stiffness
by the end bearing pile [%]
Max
. ben
ding
mom
ent
[N・
cm]
N ormal,RigidN ormal,PinSlender,RigidSlender,Pin
0
50
100
150
200
250
300
350
0 20 40 60 80horizontal stiffness
of foundation beam [kgf/cm]
inpu
t ene
rgy
[N・
cm]
El_centroHachinoheK O BE
Conventional(N ormal,Rigid ,ER0)
Fig.10 Input Energy to Superstructure - Horizontal Stiffness

Fig.11 Max. Bending Moment Distribution (KOBE)
Fig.12 Time History Response of Displacement of the Superstructure (Oil Damper : with or without) (KOBE)
4. PERFORMANCE OF DAMAGE CONTROLLED PILE FOUNDATION SYSTEM Shaking table tests were carried out to quantitatively verify the effect of earthquake resistant piles. In the tests, the model was replaced with a slip-type elastic-plastic model, which made the horizontal ground springs of the earthquake resistant piles based on the plastic theory of Broms. Taking into account the enlargement factor of the input in the actual experiment
-100
-80
-60
-40
-20
0 20 40 60 80 100
bending moment [N・c m ]
Slender ,Rigid,w ithoutODSlender ,Rigid,w ithOD
53[N・c m ]
27[N・c m ]
-8-6-4-202468
0 2 4 6 8 10 12 14 16 18 20
time [sec ]
disp
lace
men
t [cm
]
S lender,Rigid,w ithout OilDamper,Max.Disp.=7.4[c m]Slender,Rigid,w ith OilDamper,Max.Disp.=5.5[c m]
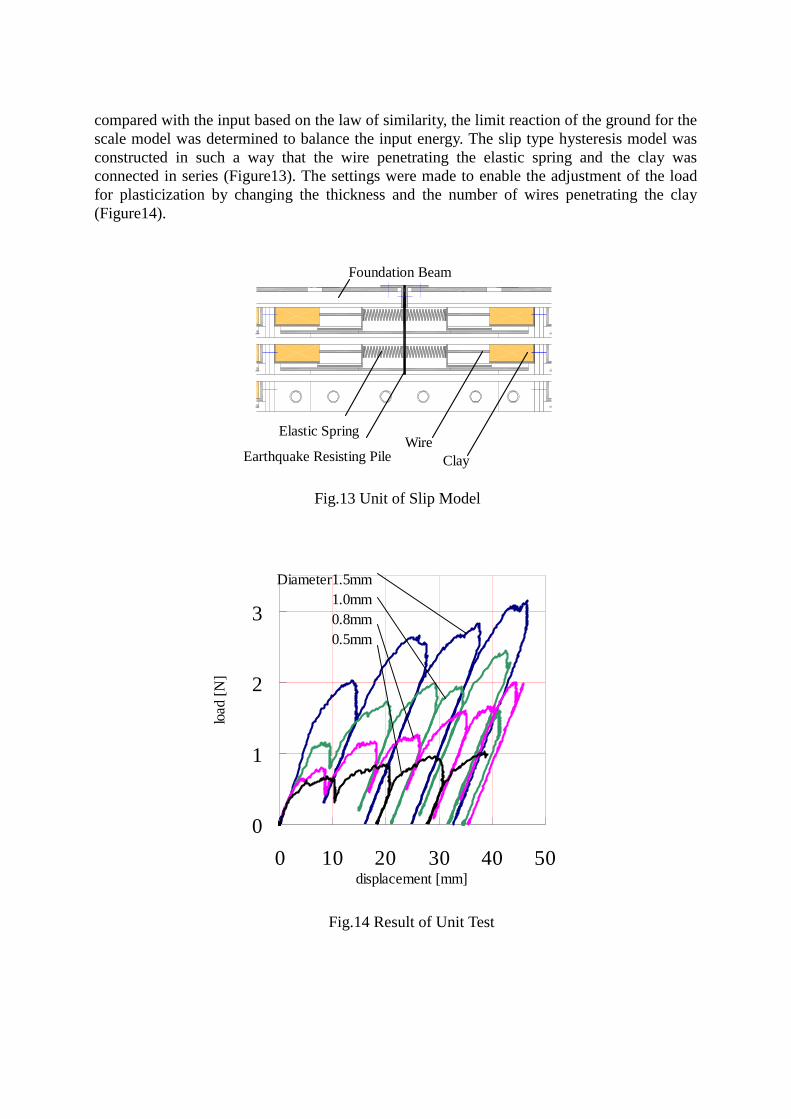
Fig.14 Result of Unit Test
compared with the input based on the law of similarity, the limit reaction of the ground for the scale model was determined to balance the input energy. The slip type hysteresis model was constructed in such a way that the wire penetrating the elastic spring and the clay was connected in series (Figure13). The settings were made to enable the adjustment of the load for plasticization by changing the thickness and the number of wires penetrating the clay (Figure14).
Clay Earthquake Resisting Pile Wire
Elastic Spring
Foundation Beam
Fig.13 Unit of Slip Model
0
1
2
3
0 10 20 30 40 50displacement [mm]
load
[N]
Diameter1.5mm 1.0mm 0.8mm 0.5mm

Table7 Result of Input to Slip Model (KOBE)
case *1 *2 Elastic*2-Slip*2 Normal,Rigid,ER26 (Elastic) - 229 1 Normal,Rigid,ER26 (Slip) 21.6 214 229-214=15
Normal,Pin,ER26 (Elastic) - 246 2 Normal,Pin,ER26 (Slip) 34.3 212 246-212=34
Slender,Pin,ER26 (Elastic) - 230 3 Slender,Pin,ER26 (Slip) 100 158 230-158=72
*1 Absorbed energy quantity calculated from residual deformation of the slip model
unit [N/cm] *2 The input energy quantity to superstructure calculated from the acceleration on the
foundation beam [N/cm]
Table7 compares the slip type hysteresis experiment with the elastic experiment carried out for the identical case. The values are shown at the second line of each case. To see quantitatively how much the energy absorption (*1) is reflected in the decreasing input into the superstructures, the two experiments were compared using the records of acceleration of the foundation slab (hatched part of Table7). It is thus confirmed that there is some correlation between the energy absorbed in the vicinity of the earthquake resistant piles and the decrease in energy input to the superstructure. Thus, if a composition law for the ground can be assumed, the effect of plasticizing the ground on input to the superstructure by can be predicted fairly accurately. 5. CONCLUSIONS The following findings were obtained from this study. a) The decrease in shear force distribution factor obtained from the horizontal stiffness of the support piles and the capacity of the earthquake resistant piles to absorb additive energy in their vicinity decreases the bending moment in the support piles and decreases the input power of earthquake to the superstructure. These effects were quantitatively evaluated and their effectiveness was confirmed. b) Visualization of the model shaking table tests was achieved and is proposed as a verification method.