Severn Trent Water Limited · Severn Trent Water Accounting Separation Methodology Statement...
42
Severn Trent Water Limited Accounting Separation Methodology Statement Year ended 31 March 2018
Transcript of Severn Trent Water Limited · Severn Trent Water Accounting Separation Methodology Statement...

Severn Trent Water Limited
Accounting Separation Methodology Statement Year ended 31 March 2018
Severn Trent Water Accounting Separation Methodology Statement
Contents
1. Business structure, systems and sources of information used to populate tables ........................................... 1
2. Internal governance and consistency procedures .......................................................................................... 2
3. Cost allocation principles and changes in allocation methodology…………………………………………………………………6
4. Wholesale variance analysis to the prior year................................................................................................ 8
5. Retail variance analysis to the prior year ..................................................................................................... 14
6. APR Section 2 Methodology – Price review and other segmental reporting ................................................. 15
2A Segmental income statement............................................................................................................. 15 2B Totex analysis – wholesale ................................................................................................................. 16 2C Operating cost analysis – Retail .......................................................................................................... 21 2D Historical cost analysis of fixed assets - Wholesale and Retail ............................................................. 27 2E Analysis of capital contributions and land sales – wholesale ............................................................... 29 2F Household - revenues by customer type ............................................................................................ 30 2G/H Non-household water and waste water - revenues by customer type ................................................. 30 2I Revenue analysis and wholesale control reconciliation ....................................................................... 30 2J Infrastructure network reinforcement costs ....................................................................................... 30
7. Upstream services ...................................................................................................................................... 32
8. General and support allocation methodology.............................................................................................. 35
9. Capital expenditure process ........................................................................................................................ 39
1
Introduction
The purpose of this statement is to explain the systems and processes used to populate tables in the Annual
Performance Report (APR). We explain the methodology used in the allocation of revenue and expenditure
between price controls, customer types and upstream services.
The Annual Performance Report tables can be found on our website (stwater.co.uk).
1. Business structure, systems and sources of information used to populate
tables
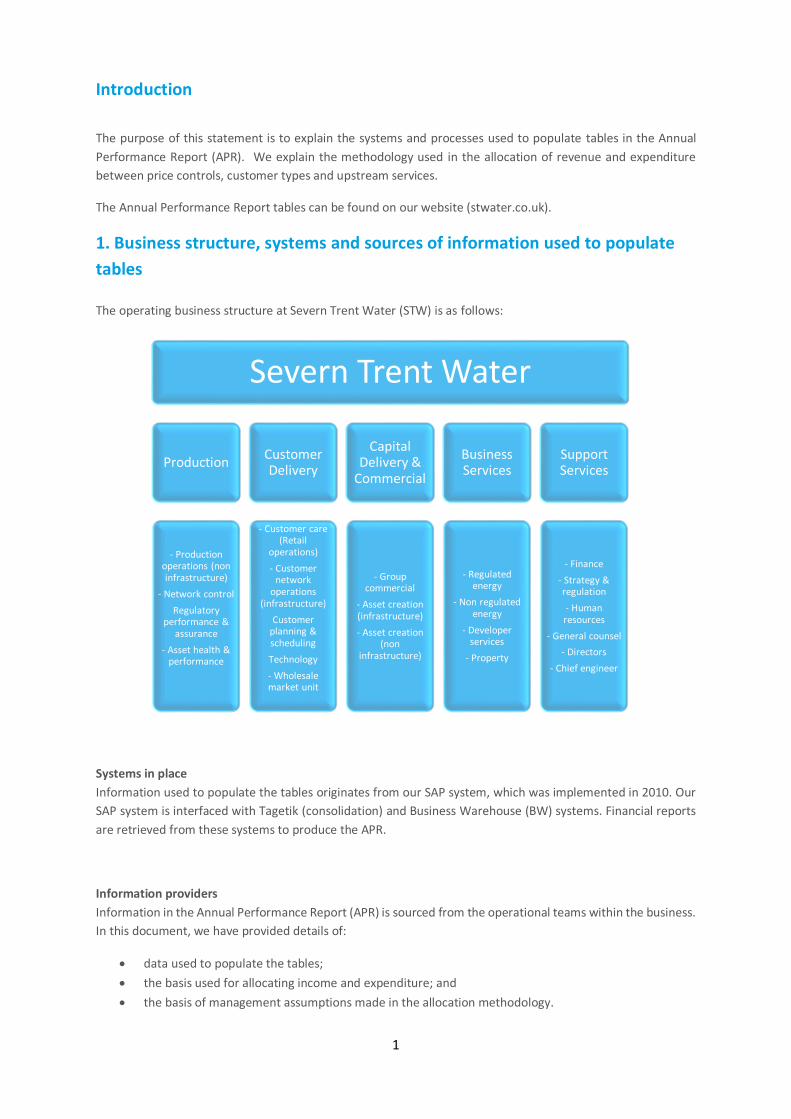
The operating business structure at Severn Trent Water (STW) is as follows:
Systems in place
Information used to populate the tables originates from our SAP system, which was implemented in 2010. Our
SAP system is interfaced with Tagetik (consolidation) and Business Warehouse (BW) systems. Financial reports
are retrieved from these systems to produce the APR.
Information providers
Information in the Annual Performance Report (APR) is sourced from the operational teams within the business.
In this document, we have provided details of:
data used to populate the tables;
the basis used for allocating income and expenditure; and
the basis of management assumptions made in the allocation methodology.
Severn Trent Water
Production
- Production operations (non infrastructure)
- Network control
Regulatory performance &
assurance
- Asset health & performance
Customer Delivery
- Customer care (Retail
operations)
- Customer network
operations (infrastructure)
Customer planning & scheduling
Technology
- Wholesale market unit
Capital Delivery &
Commercial
- Group commercial
- Asset creation (infrastructure)
- Asset creation (non
infrastructure)
Business Services
- Regulated energy
- Non regulated energy
- Developer services
- Property
Support Services
- Finance
- Strategy & regulation
- Human resources
- General counsel
- Directors
- Chief engineer

2
2. Internal governance and consistency procedures
Table of responsibilities
Area Owner Process / activity
All financial tables
Group Finance – Regulatory Accounting & Reporting
Communicate regulatory reporting requirements and guidance to finance and non-finance stakeholders involved in the APR process. Co-ordinate delivery of APR tables and complete reconciliations between the statutory position and related tables. Co-ordinate external assurance for the regulatory tables.
Operational expenditure
Finance business partners – Production, Customer Delivery, Business Services
Determine cost allocation methodologies for price control and upstream services. Determine cost allocation methodology for third party and non appointed activities.
Management Accounting team Apply above cost allocation methodologies to year end financials and produce opex tables.
Finance business partners – Production, Customer Delivery, Business Services
Undertake variance analysis against prior year and final determination.
Capital expenditure
Strategic Asset Planning team Review source data capital expenditure assignments to capex regulatory categories for accuracy and provide cost allocation methodologies where applicable.
Financial business partners - Capital Delivery & Commercial
Apply cost allocation methodologies to year-end financial and produce capex tables. Undertake variance analysis against prior year and final determination.
Fixed assets Capital Accounting team Prepare fixed asset tables by business unit and perform reconciliation between the statutory and regulatory position. Provide retail depreciation numbers for retail tables.
Revenue Income and debt team Analysis of revenue between regulatory categories.
Finance business partners - Wholesale & Retail Revenue
Undertake variance analysis against prior year and final determination.

3
Recharges to associated companies
The process to allocate costs between price controls begins after services supplied by/to the appointee have
been recharged.
The recharges can vary from ad-hoc costs to recurring charges. Ad-hoc or one off expenses are recharged via
an intercompany process usually within the month they are incurred. There is an established management
recharge process which is undertaken on a quarterly basis to transfer recurring expenses to/from associated
companies. This process involves returns being completed which disclose time spent and expenditure incurred
on activities which relate to associated companies. An overhead charge is added to this to account for the
indirect costs associated with the activity. This is a percentage calculation which takes the expenditure on
support functions over the total expenditure (excluding financing costs) undertaken within the business. The
calculation is reviewed on an annual basis. The total direct and indirect cost is recharged to the relevant
associated company.
The information is completed by the relevant support teams within the business and collated within Finance.
The returns are reviewed by the Performance and Planning teams to ensure that recharges are accurate and
complete. Any new activities within the company are raised by the analysts on an ongoing basis to ensure these
are incorporated within the recharge process.
The price control allocation process therefore begins after recharges to/from associated has been completed.
A summary of the recharges can be found in the supplementary disclosures within the Annual Performance
Report.
Recharges to Associated Companies
Sta
rt
Qu
art
erly In
terc
o
Re
ch
arg
e (
MA
/
FP
&A
)
Su
pp
ort
Te
am
s
Mo
nth
ly In
terc
o
Re
ch
arg
e (
RP
A
& E
ne
rgy
Ma
np
ow
er)
Ad-hoc
charge?
Service is
provided to/from
appointee
Consider if
charge is ad-hoc
or recurring
Monthly
intercompany
recharge
process applies
Complete
returns to show
time spent or
expense
incurred
Apply overhead
charge for
associated
indirect costs
Calculate total
direct
expenditure
Recharge direct
+indirect cost to
associated
company
Price control
allocation
begins
YES
NO

4
The OPEX accounting separation process
An accounting separation spreadsheet model is used to populate the operating expenditure section of Wholesale Totex analysis and Retail operating cost analysis (Tables 2B, 2C, 4D, 4E and 4F). Inputs into the account separation model undergo a review process:
first stage review is performed in the relevant business area
second stage review is performed by the regulatory accounting team and other regulatory stakeholders
third stage review is performed by external assurance providers to confirm the cost allocation principles
comply with the regulatory requirements.
The table outputs of the model are reviewed and signed off by the senior finance management team for each
respective area.
The OPEX accounting separation process is further detailed below:
Owner(s) Process / activity
Finance business partners – Production, Customer Delivery, Business Services
PRICE CONTROL AND BUSINESS UNIT/ACTIVITY ASSIGNMENT
Identify direct cost centres for each respective area and assign to business units within price controls.
Identify cost centres containing management costs, operational support costs and general and support costs which are utilised across price controls and determine appropriate cost driver to allocate the costs between price controls.
Complete a process documentation template (PDT) for each cost driver. The PDT gives an overview of the business area, nature of activity (including non-appointed activities).
The PDT also provides information on the cost driver applied, compliance to RAGs, and justification for assumptions made. The process for calculating the allocation percentages is documented.
Finance business partners – Production, Customer Delivery, Business Services
NON-APPOINTED AND THIRD PARTY COSTS
Identify non-appointed and third party costs by referring to the guidance in the income categorisation table in RAG 4 to ensure completeness.
Complete a PDT for each activity. The PDT gives a description of the non appointed activities and the type of costs incurred. The PDT also outlines the transfer price basis for the activity (market/cost) including recharge of overheads. A use of asset recharge methodology is included to reflect the use of appointed assets in the non-appointed operations if applicable.
A financing charge methodology is included to cover the cost of capital associated with financing the assets where applicable.
The transfers to non-appointed and third party costs are made before further price control allocations are applied. .

5
Management Accounting APPLICATION OF ALLOCATIONS TO YEAR END FINANCIAL VALUES
Run a download of all STW company cost centres using a SAP BW report which reports costs net of amounts which have been capitalised against projects. The costs are grouped by expense type e.g. costs of employment, materials and consumables etc.
Adjust the total costs from the SAP report to account for items which are not captured in the report e.g. revenue reclassifications and exceptional items.
Perform year end cost allocation calculations following the process outlined in each PDT appointed and non-appointed PDT and update model with calculated percentages/values.
Management Accounting UPSTREAM SERVICES ALLOCATIONS
Determine upstream allocation principles by the use of financial/non-financial information or management estimate where management information is unavailable.
Calculate and apply allocation percentages based on methodology provided above.
Management Accounting RECONCILIATION
A reconciliation is performed within the model which checks that the total operating expenditure has been allocated to a price control or classified as non-appointed and that all cost centres identified as having shared costs are zero post allocation.
Finance business partner leads and senior finance managers for respective table owners Regulatory Accounting team Strategy & Regulation team
REVIEW PROCESS
Review the final accounting separation tables.
6
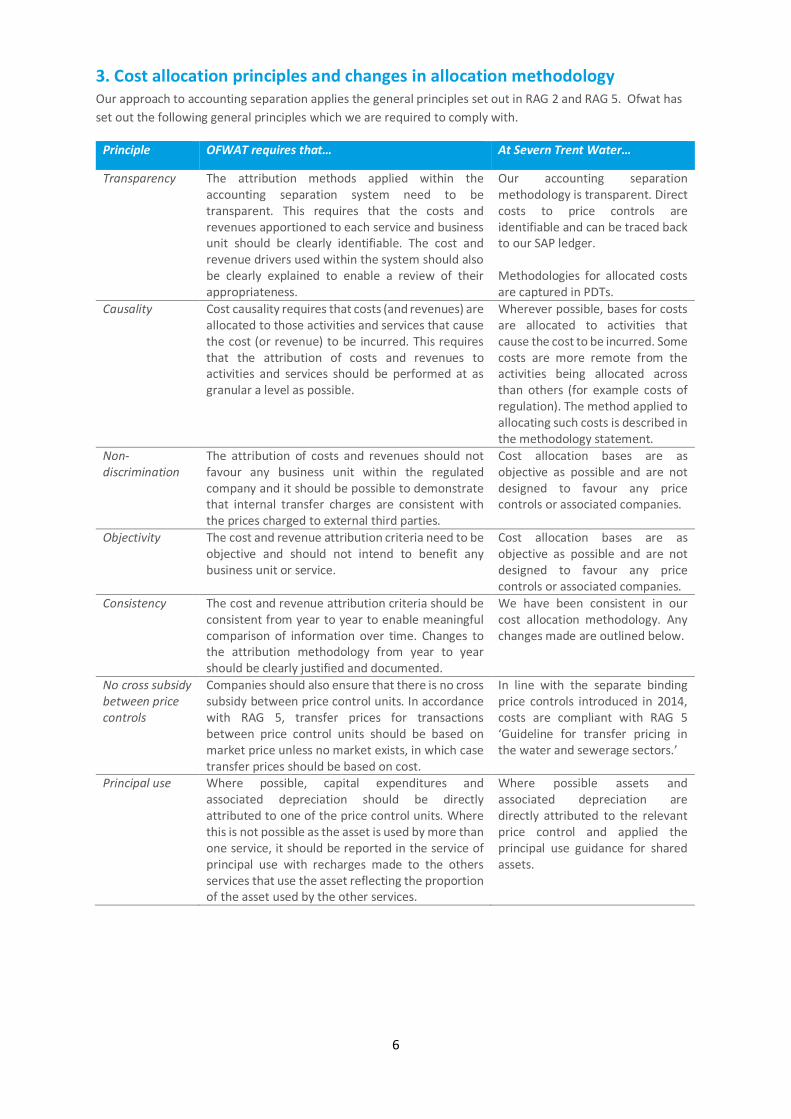
3. Cost allocation principles and changes in allocation methodology Our approach to accounting separation applies the general principles set out in RAG 2 and RAG 5. Ofwat has
set out the following general principles which we are required to comply with.
Principle OFWAT requires that… At Severn Trent Water…
Transparency The attribution methods applied within the accounting separation system need to be transparent. This requires that the costs and revenues apportioned to each service and business unit should be clearly identifiable. The cost and revenue drivers used within the system should also be clearly explained to enable a review of their appropriateness.
Our accounting separation methodology is transparent. Direct costs to price controls are identifiable and can be traced back to our SAP ledger. Methodologies for allocated costs are captured in PDTs.
Causality Cost causality requires that costs (and revenues) are allocated to those activities and services that cause the cost (or revenue) to be incurred. This requires that the attribution of costs and revenues to activities and services should be performed at as granular a level as possible.
Wherever possible, bases for costs are allocated to activities that cause the cost to be incurred. Some costs are more remote from the activities being allocated across than others (for example costs of regulation). The method applied to allocating such costs is described in the methodology statement.
Non-discrimination
The attribution of costs and revenues should not favour any business unit within the regulated company and it should be possible to demonstrate that internal transfer charges are consistent with the prices charged to external third parties.
Cost allocation bases are as objective as possible and are not designed to favour any price controls or associated companies.
Objectivity The cost and revenue attribution criteria need to be objective and should not intend to benefit any business unit or service.
Cost allocation bases are as objective as possible and are not designed to favour any price controls or associated companies.
Consistency The cost and revenue attribution criteria should be consistent from year to year to enable meaningful comparison of information over time. Changes to the attribution methodology from year to year should be clearly justified and documented.
We have been consistent in our cost allocation methodology. Any changes made are outlined below.
No cross subsidy between price controls
Companies should also ensure that there is no cross subsidy between price control units. In accordance with RAG 5, transfer prices for transactions between price control units should be based on market price unless no market exists, in which case transfer prices should be based on cost.
In line with the separate binding price controls introduced in 2014, costs are compliant with RAG 5 ‘Guideline for transfer pricing in the water and sewerage sectors.’
Principal use Where possible, capital expenditures and associated depreciation should be directly attributed to one of the price control units. Where this is not possible as the asset is used by more than one service, it should be reported in the service of principal use with recharges made to the others services that use the asset reflecting the proportion of the asset used by the other services.
Where possible assets and associated depreciation are directly attributed to the relevant price control and applied the principal use guidance for shared assets.
7
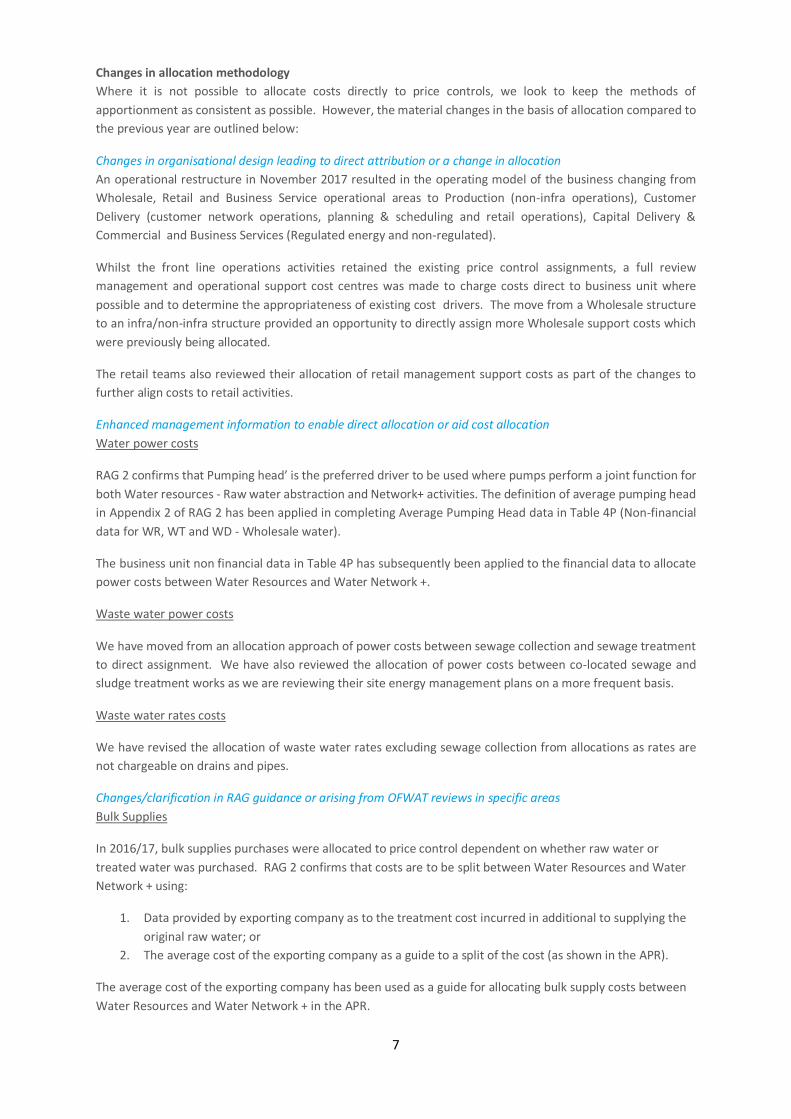
Changes in allocation methodology
Where it is not possible to allocate costs directly to price controls, we look to keep the methods of
apportionment as consistent as possible. However, the material changes in the basis of allocation compared to
the previous year are outlined below:
Changes in organisational design leading to direct attribution or a change in allocation
An operational restructure in November 2017 resulted in the operating model of the business changing from
Wholesale, Retail and Business Service operational areas to Production (non-infra operations), Customer
Delivery (customer network operations, planning & scheduling and retail operations), Capital Delivery &
Commercial and Business Services (Regulated energy and non-regulated).
Whilst the front line operations activities retained the existing price control assignments, a full review
management and operational support cost centres was made to charge costs direct to business unit where
possible and to determine the appropriateness of existing cost drivers. The move from a Wholesale structure
to an infra/non-infra structure provided an opportunity to directly assign more Wholesale support costs which
were previously being allocated.
The retail teams also reviewed their allocation of retail management support costs as part of the changes to
further align costs to retail activities.
Enhanced management information to enable direct allocation or aid cost allocation
Water power costs
RAG 2 confirms that Pumping head’ is the preferred driver to be used where pumps perform a joint function for
both Water resources - Raw water abstraction and Network+ activities. The definition of average pumping head
in Appendix 2 of RAG 2 has been applied in completing Average Pumping Head data in Table 4P (Non-financial
data for WR, WT and WD - Wholesale water).
The business unit non financial data in Table 4P has subsequently been applied to the financial data to allocate
power costs between Water Resources and Water Network +.
Waste water power costs
We have moved from an allocation approach of power costs between sewage collection and sewage treatment
to direct assignment. We have also reviewed the allocation of power costs between co-located sewage and
sludge treatment works as we are reviewing their site energy management plans on a more frequent basis.
Waste water rates costs
We have revised the allocation of waste water rates excluding sewage collection from allocations as rates are
not chargeable on drains and pipes.
Changes/clarification in RAG guidance or arising from OFWAT reviews in specific areas
Bulk Supplies
In 2016/17, bulk supplies purchases were allocated to price control dependent on whether raw water or
treated water was purchased. RAG 2 confirms that costs are to be split between Water Resources and Water
Network + using:
1. Data provided by exporting company as to the treatment cost incurred in additional to supplying the
original raw water; or
2. The average cost of the exporting company as a guide to a split of the cost (as shown in the APR).
The average cost of the exporting company has been used as a guide for allocating bulk supply costs between
Water Resources and Water Network + in the APR.

8
4. Wholesale variance analysis to the prior year
Wholesale Water
OPEX analysis
Operating expenditure
Current year figures (£m)
Prior year figures (£m)
Variance (£m)
Variance (%) Commentary
Water Resources
Power (4.2) (9.1) 4.9 53.8% The favourable variance is predominantly driven by a change in the cost allocation methodology between business units (see section 3). This saving is offset by an adverse variance in Raw Water Distribution. In addition, there has been a 6% inflationary increase in power prices; and a 2% increase in water usage compared to prior year.
Abstraction charges (11.3) (11.4) 0.1 0.9% Abstraction charges are in line with prior year.
Bulk Supply (9.0) (8.0) (1.0) (12.5%) The adverse variance is largely due to the freeze-thaw incident in February 2018.
Other operating expenditure (excluding atypicals)
(15.0) (15.2) 0.2 1.3% Employee capital cost allocation increased as a result of increased activity on groundwater and distribution reservoirs in line with the NEP Programme.
Raw Water Distribution
Power (10.8) (2.4) (8.4) (350.0%) The negative variance is predominantly driven by a change in the allocation methodology between business units. The increased power spend in Raw Water Distribution, is offset by the positive variance in Water Resources.

9
Operating expenditure
Current year figures (£m)
Prior year figures (£m)
Variance (£m)
Variance (%) Commentary
Other operating expenditure (excluding atypicals)
(6.6) (6.2) (0.4) (6.5%) The adverse variance is due to increased incidents relating to the freeze-thaw in February 2018.
Infrastructure renewals expenditure (IRE)
(0.8) (1.6) 0.8 50.0% Spend remains in line with plan on Pro-active Dams and Reservoirs maintenance.
Water Treatment
Power (4.4) (25.3) 20.9 82.6% The favourable variance is predominantly driven by a change in the allocation methodology between business units. The increase in Treated Water Distribution power costs is offset in the Water Resources business unit. In addition, there has been a 6% inflationary increase in power prices; and a 1% increase in water usage compared to prior year.
Other operating expenditure (excluding atypicals)
(49.0) (55.8) 6.8 12.2% Employee capital cost allocation decreased compared to prior year. This is partially due to strategic efforts to improve productivity and bring more capital work in-house. The favourable variance is also driven by increased direct assignment of costs following the infra/non-infra reorganisation of the business. Insurance and compensation expenses allocations are now based on claims (largely burst/flooding related). Hence, the decreased spend in Water Treatment is offset by an increase in Treated Water Distribution.
10
Treated Water Distribution
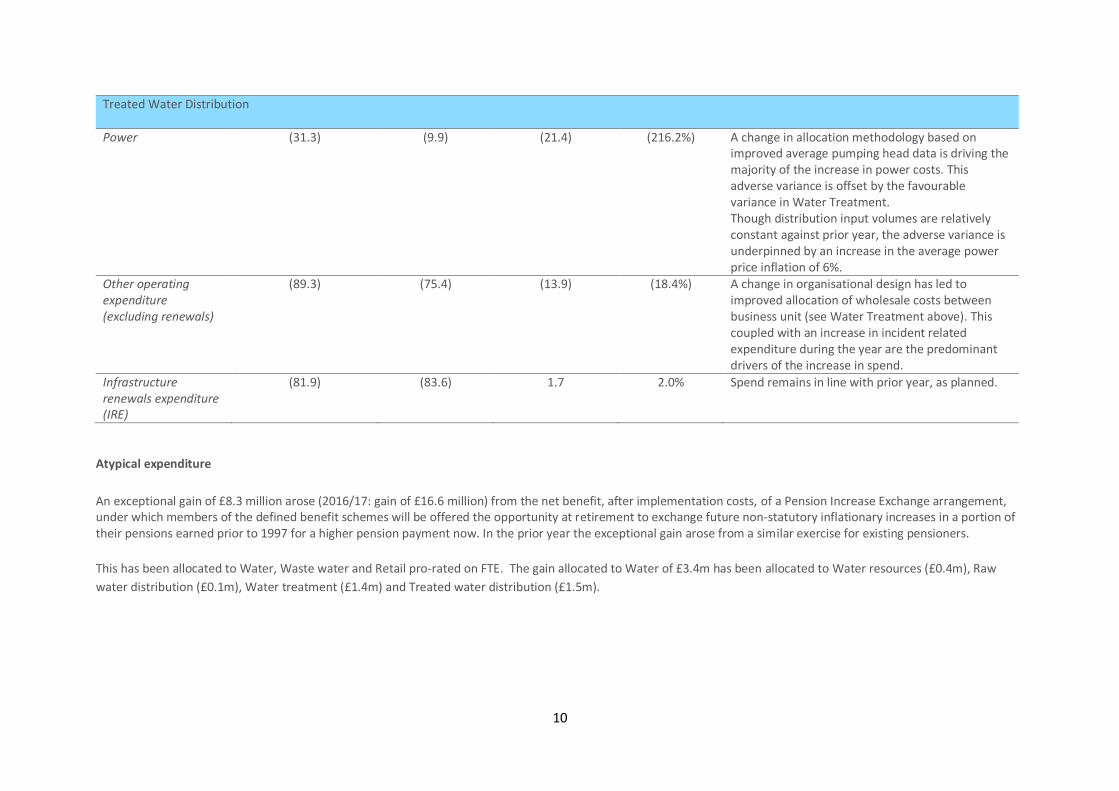
Power (31.3) (9.9) (21.4) (216.2%) A change in allocation methodology based on improved average pumping head data is driving the majority of the increase in power costs. This adverse variance is offset by the favourable variance in Water Treatment. Though distribution input volumes are relatively constant against prior year, the adverse variance is underpinned by an increase in the average power price inflation of 6%.
Other operating expenditure (excluding renewals)
(89.3) (75.4) (13.9) (18.4%) A change in organisational design has led to improved allocation of wholesale costs between business unit (see Water Treatment above). This coupled with an increase in incident related expenditure during the year are the predominant drivers of the increase in spend.
Infrastructure renewals expenditure (IRE)
(81.9) (83.6) 1.7 2.0% Spend remains in line with prior year, as planned.
Atypical expenditure
An exceptional gain of £8.3 million arose (2016/17: gain of £16.6 million) from the net benefit, after implementation costs, of a Pension Increase Exchange arrangement, under which members of the defined benefit schemes will be offered the opportunity at retirement to exchange future non-statutory inflationary increases in a portion of their pensions earned prior to 1997 for a higher pension payment now. In the prior year the exceptional gain arose from a similar exercise for existing pensioners.
This has been allocated to Water, Waste water and Retail pro-rated on FTE. The gain allocated to Water of £3.4m has been allocated to Water resources (£0.4m), Raw
water distribution (£0.1m), Water treatment (£1.4m) and Treated water distribution (£1.5m).

11
CAPEX analysis
Overall the Water CAPEX net investment in 2017/18 was £297.7m. This is £69.8m (30.6%) higher than the full year investment in 2016/17 and is in line with our delivery
programme which reflects investment to support delivery of our performance commitments and statutory requirements.
Business unit Current year figures (£m)
Prior year figures (£m)
Variance (£m)
Variance (%) Commentary
Water Resources 39.1 15.7 23.4 149.0% Variance reflects the increased spend on Birmingham Resilience Project as the project enters its delivery phase.
Raw Water Distribution
42.1 33.9 8.2 24.2% Variance reflects the increased spend on Birmingham Resilience Project as the project enters its delivery phase.
Water Treatment 106.0 72.5 33.5 46.2% Variance reflects the increased spend on various projects in line with the capital plan.
Treated Water Distribution
110.5 105.8 4.7 4.4% Variance reflects the spend on projects such as distribution reservoirs per capital plan.

12
Wholesale Waste Water
OPEX analysis
Operating expenditure
Current year figures (£m)
Prior year figures (£m)
Variance (£m)
Variance (%) Commentary
Sewage Collection
Power (7.6) (13.3) 5.7 42.9% We have moved from an allocation approach of power costs between sewage collection and sewage treatment to direct assignment.
Local authority rates and Cumulo rates
(0.1) (4.8) 4.7 97.9% We have revised the allocation of waste water rates excluding sewage collection from allocations as rates are not chargeable on drains and pipes.
Sewage Treatment
Power (33.6) (27.3) (6.3) (23.1%) The adverse variance is predominantly driven by a change in the allocation methodology between business units. In addition, there has been a 6% inflationary increase in power prices.
Discharge consents (5.5) 5.5 0.0 0.0% Spend is in line with prior year.
Local authority rates and Cumulo rates
(23.1) (19.5) (3.6) (18.5)% See Sewage collection above.
Sludge
Power 10.7 12.0 (1.3) (10.8%) Higher power consumption in sludge treatment sites as well as updated methodology on allocated power sharing on co-located sites where allocation to sewage collection has been updated. This is offset by in year increases in generation.
Income treated as negative expenditure
18.7 17.6 1.1 6.2% Increased generation has driven increased renewable incentives.
13
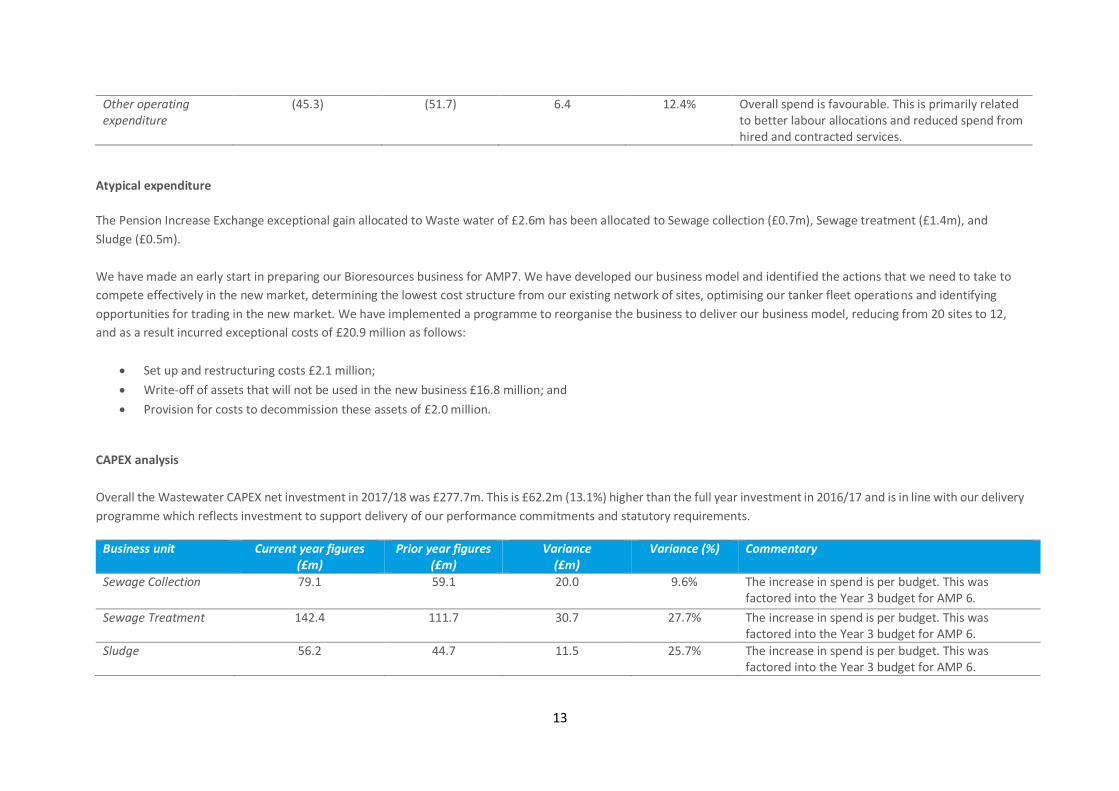
Other operating expenditure
(45.3) (51.7) 6.4 12.4% Overall spend is favourable. This is primarily related to better labour allocations and reduced spend from hired and contracted services.
Atypical expenditure
The Pension Increase Exchange exceptional gain allocated to Waste water of £2.6m has been allocated to Sewage collection (£0.7m), Sewage treatment (£1.4m), and
Sludge (£0.5m).
We have made an early start in preparing our Bioresources business for AMP7. We have developed our business model and identified the actions that we need to take to
compete effectively in the new market, determining the lowest cost structure from our existing network of sites, optimising our tanker fleet operations and identifying
opportunities for trading in the new market. We have implemented a programme to reorganise the business to deliver our business model, reducing from 20 sites to 12,
and as a result incurred exceptional costs of £20.9 million as follows:
Set up and restructuring costs £2.1 million;
Write-off of assets that will not be used in the new business £16.8 million; and
Provision for costs to decommission these assets of £2.0 million.
CAPEX analysis
Overall the Wastewater CAPEX net investment in 2017/18 was £277.7m. This is £62.2m (13.1%) higher than the full year investment in 2016/17 and is in line with our delivery
programme which reflects investment to support delivery of our performance commitments and statutory requirements.
Business unit Current year figures (£m)
Prior year figures (£m)
Variance (£m)
Variance (%) Commentary
Sewage Collection 79.1 59.1 20.0 9.6% The increase in spend is per budget. This was factored into the Year 3 budget for AMP 6.
Sewage Treatment 142.4 111.7 30.7 27.7% The increase in spend is per budget. This was factored into the Year 3 budget for AMP 6.
Sludge 56.2 44.7 11.5 25.7% The increase in spend is per budget. This was factored into the Year 3 budget for AMP 6.
14
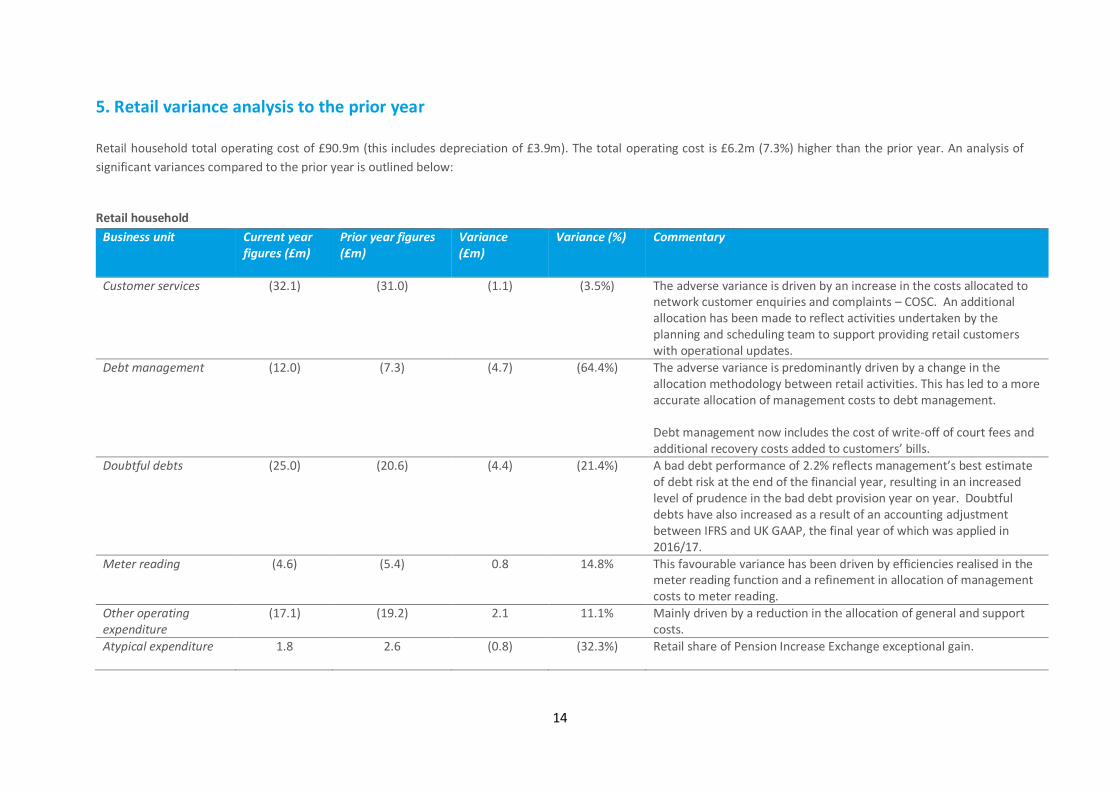
5. Retail variance analysis to the prior year
Retail household total operating cost of £90.9m (this includes depreciation of £3.9m). The total operating cost is £6.2m (7.3%) higher than the prior year. An analysis of
significant variances compared to the prior year is outlined below:
Retail household
Business unit Current year figures (£m)
Prior year figures (£m)
Variance (£m)
Variance (%) Commentary
Customer services (32.1) (31.0) (1.1) (3.5%) The adverse variance is driven by an increase in the costs allocated to network customer enquiries and complaints – COSC. An additional allocation has been made to reflect activities undertaken by the planning and scheduling team to support providing retail customers with operational updates.
Debt management (12.0) (7.3) (4.7) (64.4%) The adverse variance is predominantly driven by a change in the allocation methodology between retail activities. This has led to a more accurate allocation of management costs to debt management. Debt management now includes the cost of write-off of court fees and additional recovery costs added to customers’ bills.
Doubtful debts (25.0) (20.6) (4.4) (21.4%) A bad debt performance of 2.2% reflects management’s best estimate of debt risk at the end of the financial year, resulting in an increased level of prudence in the bad debt provision year on year. Doubtful debts have also increased as a result of an accounting adjustment between IFRS and UK GAAP, the final year of which was applied in 2016/17.
Meter reading (4.6) (5.4) 0.8 14.8% This favourable variance has been driven by efficiencies realised in the meter reading function and a refinement in allocation of management costs to meter reading.
Other operating expenditure
(17.1) (19.2) 2.1 11.1% Mainly driven by a reduction in the allocation of general and support costs.
Atypical expenditure 1.8 2.6 (0.8) (32.3%) Retail share of Pension Increase Exchange exceptional gain.

15
6. APR Section 2 Methodology – Price review and other segmental reporting
2A Segmental income statement
The segmental income statement analyses the appointed activities’ operating profit between price controls and
summarises the recharges made to/from other segments for the use of fixed assets.
2A line item Price controls Data source Process
Revenue price control
All SAP general ledger codes which captures the financial values for wholesale and retail charges via an interface from the main billing system (Target).
Assign each revenue code to wholesale water and waste water charges and retail revenue to Retail household. Refer to table 2I for further detail.
Revenue non price control
All SAP general ledger codes which captures the financial values for all non price control revenue via the receivables billing ledger.
Separate general ledger codes are created for each non price control revenue stream. Each revenue stream is assigned to an income category using the guidance in the Income categorisation table included in RAG 4. Price control assignment takes place when the transaction is posted in SAP, against profit centres which are assigned to price controls. Specific items that are netted off against operating costs within the statutory accounts are grossed up and shown as revenue for regulatory reporting. Such examples are developer contributions for administration costs which are incurred in relation to new connections and recharges for repair of damages costs. A review is performed at the end of the year to ensure that the correct price control assignment has been made and adjusted where necessary.
Operating costs
Retail Table 2C Operating costs analysis – retail
Operating costs from table 2C. Refer to table 2C for further detail.
Wholesale water and waste water
Table 2B Totex analysis – wholesale.
Operating costs from table 2B. Refer to table 2B for further detail.
Depreciation and amortisation
All Table 2D – Historic cost analysis of fixed assets SAP fixed asset register
Depreciation and amortisation charges are charged to the principal user price control. Refer to table 2D for further detail.
16
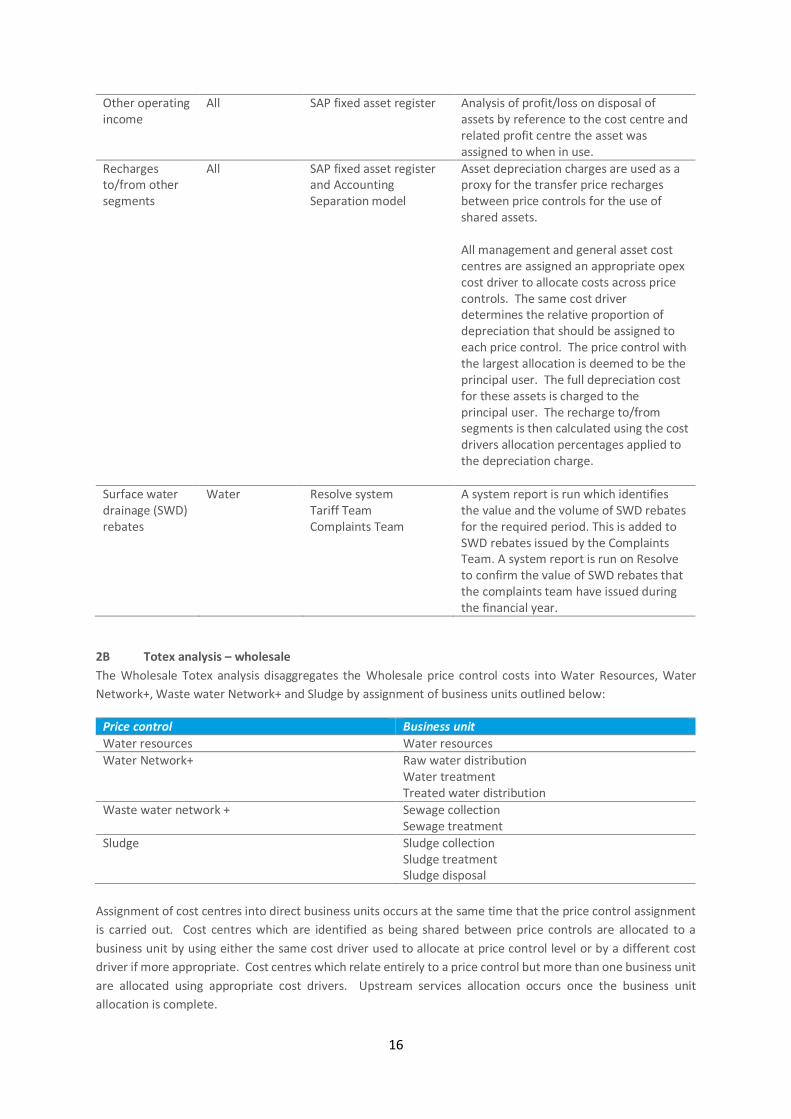
Other operating income
All SAP fixed asset register Analysis of profit/loss on disposal of assets by reference to the cost centre and related profit centre the asset was assigned to when in use.
Recharges to/from other segments
All SAP fixed asset register and Accounting Separation model
Asset depreciation charges are used as a proxy for the transfer price recharges between price controls for the use of shared assets. All management and general asset cost centres are assigned an appropriate opex cost driver to allocate costs across price controls. The same cost driver determines the relative proportion of depreciation that should be assigned to each price control. The price control with the largest allocation is deemed to be the principal user. The full depreciation cost for these assets is charged to the principal user. The recharge to/from segments is then calculated using the cost drivers allocation percentages applied to the depreciation charge.
Surface water drainage (SWD) rebates
Water Resolve system Tariff Team Complaints Team
A system report is run which identifies the value and the volume of SWD rebates for the required period. This is added to SWD rebates issued by the Complaints Team. A system report is run on Resolve to confirm the value of SWD rebates that the complaints team have issued during the financial year.
2B Totex analysis – wholesale
The Wholesale Totex analysis disaggregates the Wholesale price control costs into Water Resources, Water
Network+, Waste water Network+ and Sludge by assignment of business units outlined below:
Price control Business unit
Water resources Water resources
Water Network+ Raw water distribution Water treatment Treated water distribution
Waste water network + Sewage collection Sewage treatment
Sludge Sludge collection Sludge treatment Sludge disposal
Assignment of cost centres into direct business units occurs at the same time that the price control assignment
is carried out. Cost centres which are identified as being shared between price controls are allocated to a
business unit by using either the same cost driver used to allocate at price control level or by a different cost
driver if more appropriate. Cost centres which relate entirely to a price control but more than one business unit
are allocated using appropriate cost drivers. Upstream services allocation occurs once the business unit
allocation is complete.

17
Business unit allocations are explained below:
Operating Expenditure - water and wastewater
Operating expenditure Expense type Price control Business unit allocation
Power Power Water Average pumping head allocation based on non-financial data in Table 4P.
Waste water Direct assignment to cost centre which is assigned to business unit based on cost centre activities. For co-located sites, in the absence of a sub-meter, the electricity bill is allocated between Sewage Treatment and Sludge Treatment based on the Site Energy Management Plan (SEMP).
Shared Carbon Reduction Commitment payments
Water and Waste water
Allocated based on direct costs of power charged to water and waste water.
Internally generated electricity
Water and Waste water
Cost credit – direct to price control where it was generated (Sludge). Cost expense – direct to price control where electricity was utilised at market rates.
Income treated as negative operating expenditure
ROCs Water and Waste water
Allocation based on Gwh generated - Water - 100% Raw water abstraction (hydro generation). Waste water – 100% sludge treatment.
Bio methane sales & RHI Waste water 100% Sludge treatment.
Sludge sales Waste water 100% Sludge disposal.
Service charges
Abstraction charges Water 100% Water resources.
Discharge consents (water treatment)
Water 100% Water treatment.
Surface water network Waste water 100% Sewage collection.
Discharge consents Waste water 100% Sewage treatment.
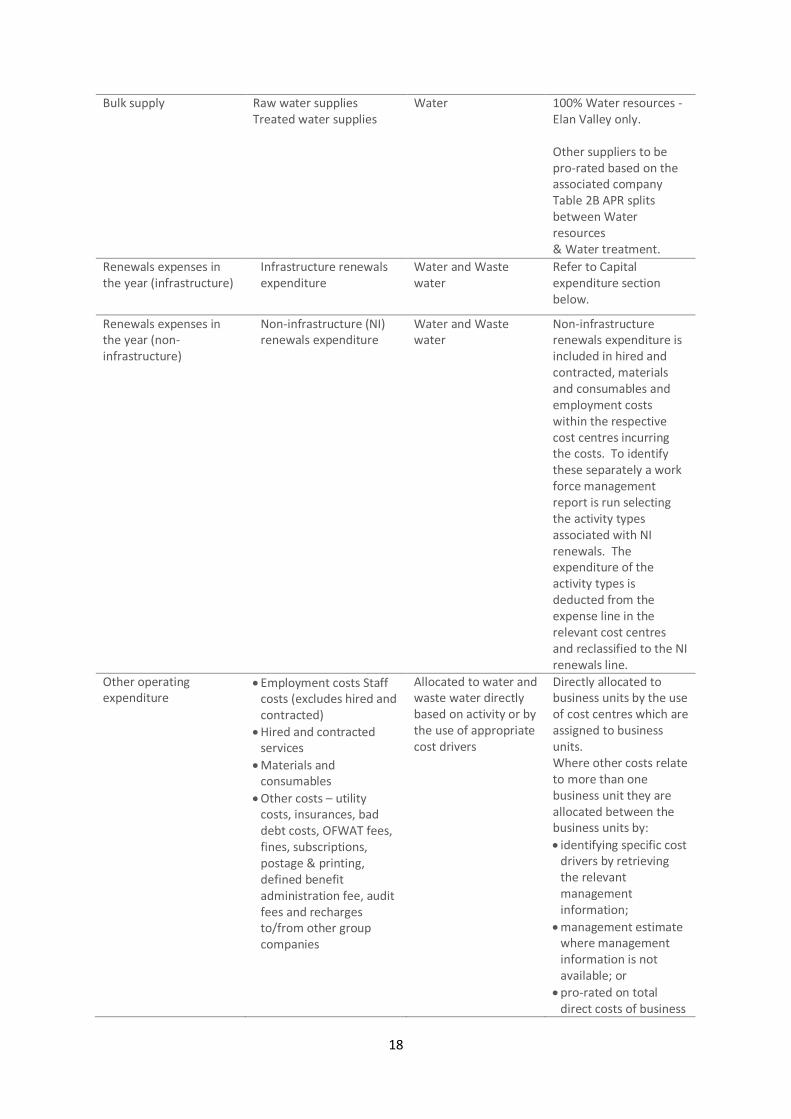
18
Bulk supply Raw water supplies Treated water supplies
Water 100% Water resources -Elan Valley only. Other suppliers to be pro-rated based on the associated company Table 2B APR splits between Water resources & Water treatment.
Renewals expenses in the year (infrastructure)
Infrastructure renewals expenditure
Water and Waste water
Refer to Capital expenditure section below.
Renewals expenses in the year (non-infrastructure)
Non-infrastructure (NI) renewals expenditure
Water and Waste water
Non-infrastructure renewals expenditure is included in hired and contracted, materials and consumables and employment costs within the respective cost centres incurring the costs. To identify these separately a work force management report is run selecting the activity types associated with NI renewals. The expenditure of the activity types is deducted from the expense line in the relevant cost centres and reclassified to the NI renewals line.
Other operating expenditure
Employment costs Staff costs (excludes hired and contracted)
Hired and contracted services
Materials and consumables
Other costs – utility costs, insurances, bad debt costs, OFWAT fees, fines, subscriptions, postage & printing, defined benefit administration fee, audit fees and recharges to/from other group companies
Allocated to water and waste water directly based on activity or by the use of appropriate cost drivers
Directly allocated to business units by the use of cost centres which are assigned to business units. Where other costs relate to more than one business unit they are allocated between the business units by:
identifying specific cost drivers by retrieving the relevant management information;
management estimate where management information is not available; or
pro-rated on total direct costs of business
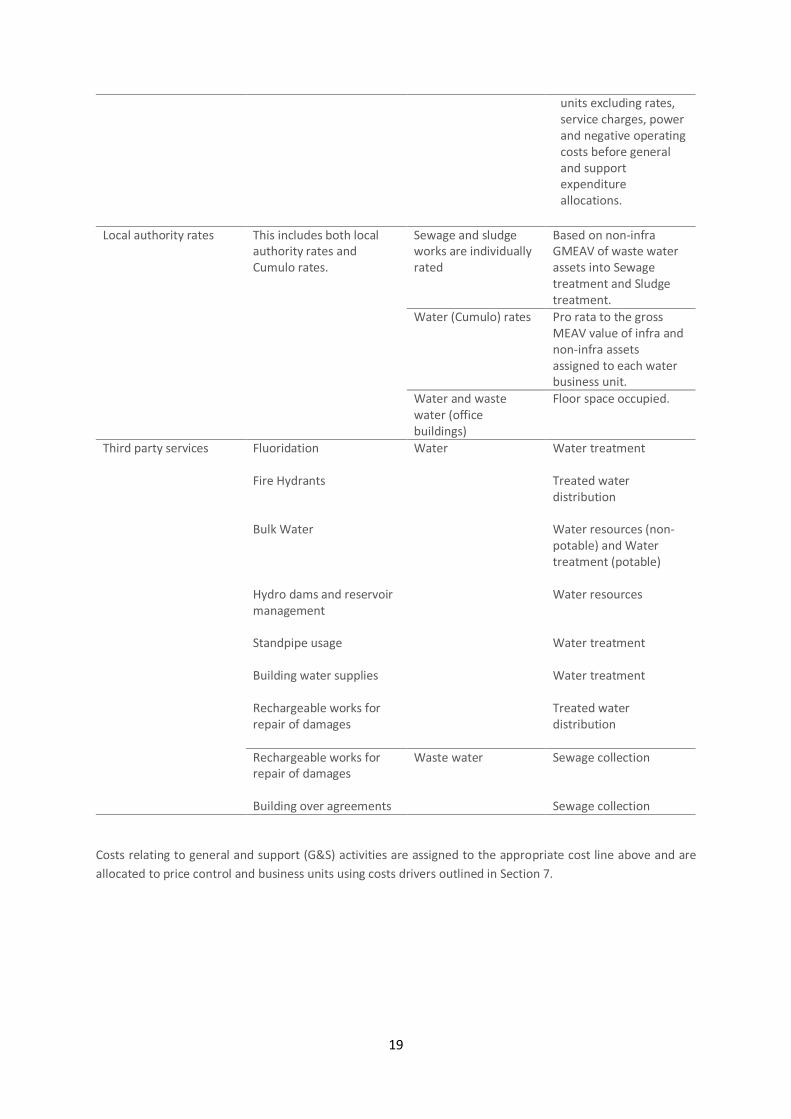
19
units excluding rates, service charges, power and negative operating costs before general and support expenditure allocations.
Local authority rates
This includes both local authority rates and Cumulo rates.
Sewage and sludge works are individually rated
Based on non-infra GMEAV of waste water assets into Sewage treatment and Sludge treatment.
Water (Cumulo) rates Pro rata to the gross MEAV value of infra and non-infra assets assigned to each water business unit.
Water and waste water (office buildings)
Floor space occupied.
Third party services
Fluoridation Fire Hydrants Bulk Water Hydro dams and reservoir management Standpipe usage Building water supplies Rechargeable works for repair of damages
Water Water treatment Treated water distribution Water resources (non-potable) and Water treatment (potable) Water resources Water treatment Water treatment Treated water distribution
Rechargeable works for repair of damages Building over agreements
Waste water
Sewage collection Sewage collection
Costs relating to general and support (G&S) activities are assigned to the appropriate cost line above and are
allocated to price control and business units using costs drivers outlined in Section 7.

20
Capital expenditure
A SAP business warehouse report produces a detailed view of infrastructure renewals expenditure and
capital expenditure and income by business plan line (BPL). Each BPL consists of a series of individual
projects, with the total of c.5000 projects over the capital programme.
Each BPL is aligned to a regulatory driver and can have a one-to-one or one-to-many relationship. The drivers
are listed below and recorded in the below lines of the Totex table:
Regulatory driver Table line Infra/non infra allocation
Infrastructure renewals expenditure (IRE) 4D/E.5 100% infra
Maintenance non-infra (MNI) 4D/E.13 100% non-infra
Enhance levels of service Quality Supply/demand balance
4D/E.14-15 Infra/non-infra allocation determined by the purpose code mapping which is assigned at source in SAP
The regulatory mapping is assigned at source level in SAP with each project being assigned to a business plan
line attributed to Water Resources, Water Network +, Waste Network +, Bio-resources or Management &
General.
The price control BPL assignment is determined by reference to the nature of the spend in the BPL against
the regulatory assets, activities and boundaries outlined in RAG 4.
An annual review of mappings is performed for the current year end. Where it is deemed that the mapping
requires updating due to a change to the delivery of the project since the initial mapping (due to change in
scope or solution), the regulatory assignments are updated.
A download of the capital programme is reviewed at the year end by the Strategic asset planning team to
identify any expenditure which may have been coded incorrectly at source so this can be corrected.
The exercise also includes assigning the expenditure to business unit level to complete tables 4D and 4E.
Assignment can be at the BPL in total or by analysis within BPL if appropriate. The business unit BPL
assignment is determined by reference to the nature of the spend in the BPL/project against the regulatory
assets, activities and boundaries outlined in RAG 4.
The assignment of material schemes/projects are also reviewed by Strategic Asset Planning (in S&R).
The total income and expenditure is reconciled to the year end schedules produced by the Capital Accounting
team, the net IRE expenditure including IRE income is then recorded in to the operating expenditure section
of the Totex tables.
M&G expenditure is allocated as below:
Capex spend Price control/business unit allocation
IT projects – Retail IT spend Allocated entirely to retail. IT projects – Wholesale IT spend Based on management estimate.
Transport projects
Based on the portion of transport recharges in the year to each price control/business unit.
Property projects
Based on the nature of spend, the area of the business it benefits and the property/site it relates to.
Cash Expenditure
Cash expenditure Price control allocation Business Unit allocation
Pension deficit recovery payments
Pro-rate cost against the number of employees in each price control who are members of the scheme.
Same as direct business unit cost percentages used in operating cost allocation.
21
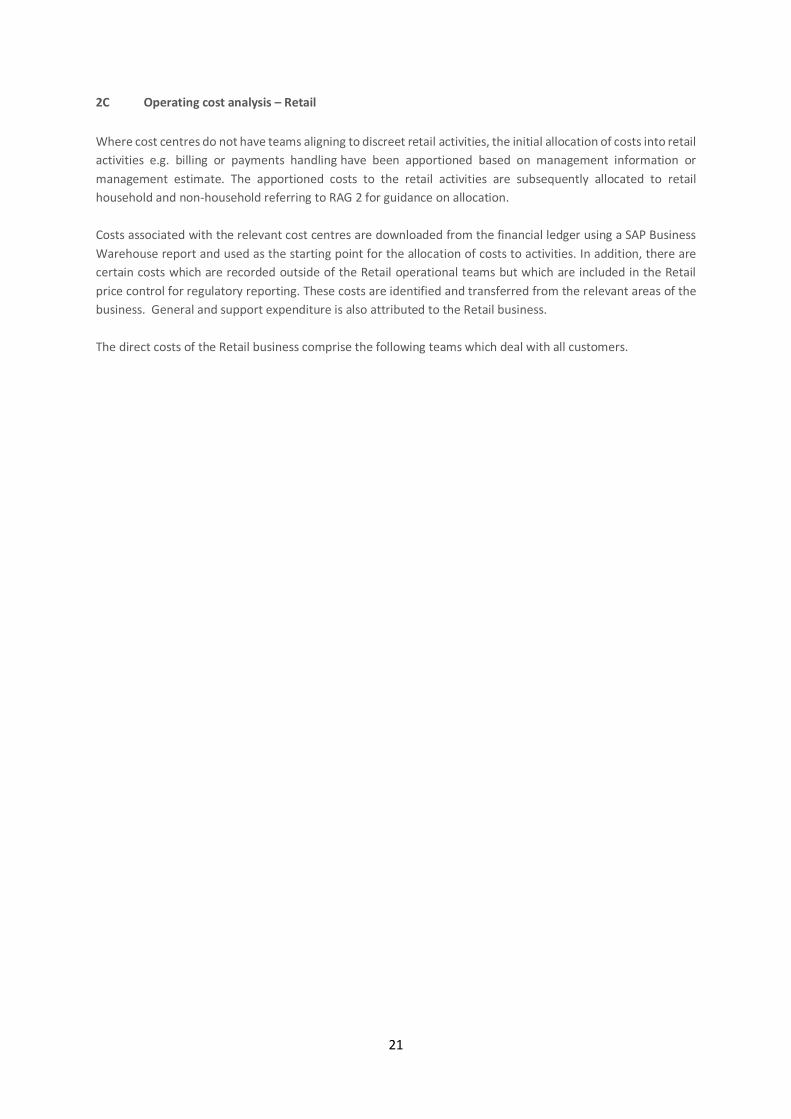
2C Operating cost analysis – Retail
Where cost centres do not have teams aligning to discreet retail activities, the initial allocation of costs into retail
activities e.g. billing or payments handling have been apportioned based on management information or
management estimate. The apportioned costs to the retail activities are subsequently allocated to retail
household and non-household referring to RAG 2 for guidance on allocation.
Costs associated with the relevant cost centres are downloaded from the financial ledger using a SAP Business
Warehouse report and used as the starting point for the allocation of costs to activities. In addition, there are
certain costs which are recorded outside of the Retail operational teams but which are included in the Retail
price control for regulatory reporting. These costs are identified and transferred from the relevant areas of the
business. General and support expenditure is also attributed to the Retail business.
The direct costs of the Retail business comprise the following teams which deal with all customers.

22
Team responsibilities and allocation to activities
Business Area Team(s) / activity Retail activity types Cost allocation/driver
Chief Customer Officer
Customer Delivery Strategic Management Team.
Cost is apportioned between: Billing, payments handling, debt management, vulnerable customer schemes, non-network customer enquiries and complaints, meter reading and maintenance, network customer enquiries and complaints, other direct costs; and wholesale price controls. Some of these costs are also apportioned out to G&S.
Business activity allocations of the cost centres which the management team support (excluding specific costs such as bad debts and charitable Trust Donations).
Performance & Planning Analyst
Performance & Planning teams align closely with key business areas to provide financial and operational support.
Cost is apportioned between: billing, payments handling, debt management, vulnerable customer schemes, non-network customer enquiries and complaints, meter reading and maintenance, network customer enquiries and complaints, other direct costs; and wholesale price controls.
Business activity allocations of the cost centres which the management team support (excluding specific costs such as bad debts and charitable trust donations).
Resource planning
Provides support to internal call centre teams in all aspects relating to Resource Planning; using data for forecast call volumes etc. to ensure we have the right people, in the right place, at the right time, to provide the right levels of customer service. Costs within these cost centres are predominantly people costs relating to the resource planning and scheduling teams.
The costs are split between billing, payments handling, non-network customer enquiries and complaints, meter reading, meter maintenance and network customer enquiries and complaints and NHH.
The resource planning cost centres are allocated to activities based on the overall allocations of the other cost centres (excluding costs such as bad debts and charitable trust).

23
Business Area Team(s) / activity Retail activity types Cost allocation/driver
Customer Strategy
The bad debt expense is also recorded in this area and directly allocated to doubtful debts. Teams consist of: External relationships – deal with vulnerable customers Debt strategy team – activity based debt management CARMS team - debt collection system admin team Partner accounts team - management of third party contracts for customer service and debt management agencies
An apportionment of the costs of the management team based on the consolidated total cost allocations of the other Customer cost centres.
Doubtful debt provision - 100% to doubtful debts. Annual contribution to the Severn Trent Trust Fund - directly allocated to the Charitable Trust Donations retail activity within Customer Services. The cost of paying third parties to administer our social tariff schemes, the Citizen's Advice Bureau, Auriga (Severn Trent Trust Fund) - directly allocated to the Vulnerable Customer Schemes retail activity within Customer Services The balance remaining in the Head of Strategy cost centre after removing the above costs, is a management overhead of the Customer Strategy function and needs be allocated to retail activities across the cost centres within Customer Strategy based on the value of each of the cost centres. The Partner Account Manager is a single cost centre. The activities within this cost centre relate to billing, payments handling, debt management, non-network enquiries and complaints. The split of the costs is based on a management analysis of costs and their relation to business units.
Group Transformation These cost centres deliver process improvements and produce management information for the Customer management team.
Cost is apportioned between: billing, payments handling, debt management, vulnerable customer schemes, non-network customer enquiries and complaints, meter reading and maintenance, network customer enquiries and complaints, other direct costs; and wholesale price controls.
Retail activity allocations of the cost centres which the management team support.

24
Business Area Team(s) / activity Retail activity types Cost allocation/driver
Customer Contact
This department comprises our customer contact centres and associated back office teams which have responsibilities in respect of billing, payment handling, debt management (inbound/outbound contact), meter reading and non-network enquires and complaints and, network enquires and complaints.
The costs of our customer contact cost centres are apportioned between billing, payment handling, meter reading and non-network enquiries based on volumetric call data, where the system identifies the reasoning behind the calls. An analysis of these call volumes has produced the spilt across the business units.
The COSC and Customer Services costs comprise two cost centres. The activities within these cost centres relate to customer contact regarding enquiries and complaints around our network, billing and payment handling. The split of the costs is based on a management analysis of costs and their relation to business units.
COSC is a contact centre for any calls relating to the network. Costs predominantly relate to manpower and are allocated to business activity Network Enquiries & Complaints. There are also Back office teams responsible for and liaising with customers administering applications for Help When You Need It schemes (Social Tariff, Watersure, Water Health Check, Proactive Metering). The costs are directly allocated to Vulnerable Customer Schemes.
Customer Experience Ensures that dealing with Severn Trent is an experience that meets and exceeds expectations for all customers whatever their individual needs. This includes mapping and detailing quality processes, and management of customer complaints.
The costs are apportioned based on an average of all other retail cost centres excluding Chief Customer Officer and Performance & Planning.
Costs and activity volumes within this cost centre is driven by volumes of customer complaints. The costs are predominantly relating to people who are handling complaints plus amounts of compensation and gestures of goodwill paid to customers as a result of operational or billing issues.
The cost of the team is apportioned between billing, payments handling, debt management, vulnerable customer schemes, non-network customer enquiries and complaints, meter reading and maintenance, network customer enquiries and complaints, other direct costs and wholesale price controls.
Allocation is based on the business activity allocations of the cost centres which the team support (excluding specific costs such as bad debts and charitable trust).
25
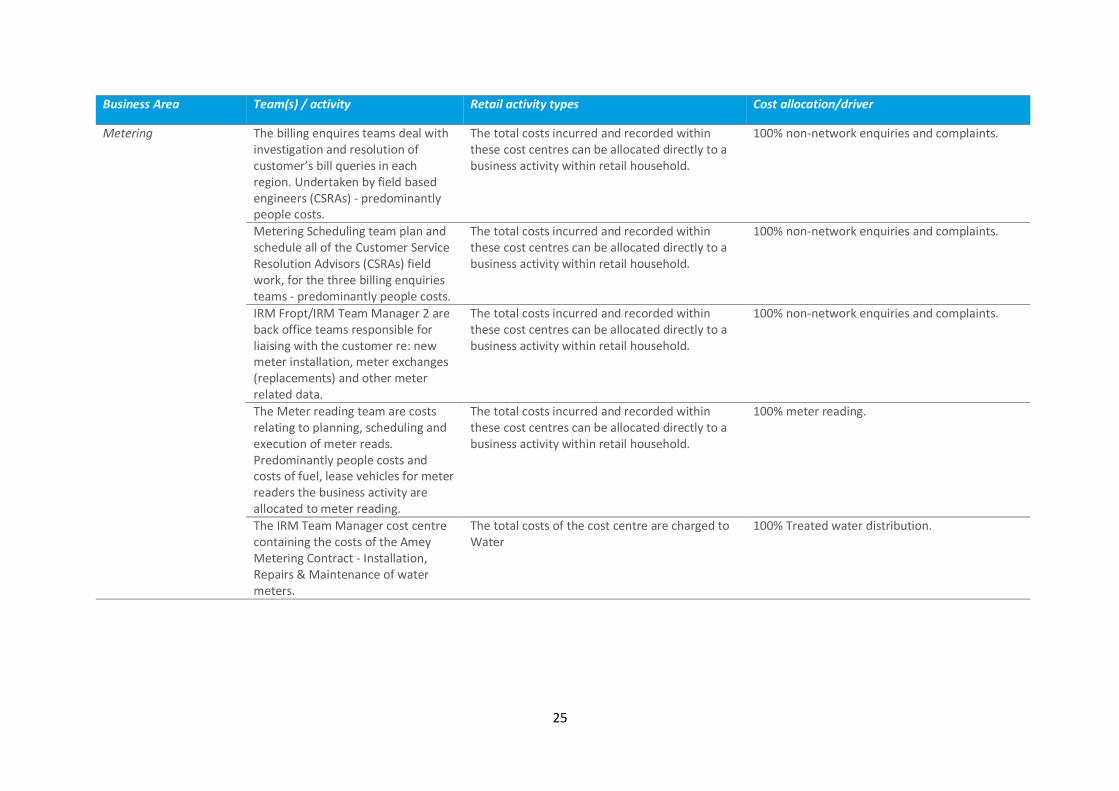
Business Area Team(s) / activity Retail activity types Cost allocation/driver
Metering The billing enquires teams deal with investigation and resolution of customer’s bill queries in each region. Undertaken by field based engineers (CSRAs) - predominantly people costs.
The total costs incurred and recorded within these cost centres can be allocated directly to a business activity within retail household.
100% non-network enquiries and complaints.
Metering Scheduling team plan and schedule all of the Customer Service Resolution Advisors (CSRAs) field work, for the three billing enquiries teams - predominantly people costs.
The total costs incurred and recorded within these cost centres can be allocated directly to a business activity within retail household.
100% non-network enquiries and complaints.
IRM Fropt/IRM Team Manager 2 are back office teams responsible for liaising with the customer re: new meter installation, meter exchanges (replacements) and other meter related data.
The total costs incurred and recorded within these cost centres can be allocated directly to a business activity within retail household.
100% non-network enquiries and complaints.
The Meter reading team are costs relating to planning, scheduling and execution of meter reads. Predominantly people costs and costs of fuel, lease vehicles for meter readers the business activity are allocated to meter reading.
The total costs incurred and recorded within these cost centres can be allocated directly to a business activity within retail household.
100% meter reading.
The IRM Team Manager cost centre containing the costs of the Amey Metering Contract - Installation, Repairs & Maintenance of water meters.
The total costs of the cost centre are charged to Water
100% Treated water distribution.

Retail transfers to and from other business areas
Distribution Services Technicians (DSTs) – The activities associated with investigatory visits in relation to water
incidents sit within the Wholesale water teams. However, first time visits for issues that are on a customer
property (where no further work is undertaken) and where there was no network issue found are considered
retail activities. The cost of initial inspections has been taken from time and materials recording in SAP for these
jobs. Direct overhead costs are then attributed to the jobs. The costs relating to these jobs are transferred to
Retail within the Customer Services activity.
Water Efficiency Team – The majority of the demand side water efficiency initiatives are performed in a
wholesale operational cost centre within Severn Trent Water. The total expenditure of the Water Efficiency cost
centre is transferred to Retail and allocated 100% to Demand side water efficiency initiatives. The total of the
expenditure transferred from Wholesale together with the efficiency expenditure incurred within Retail is
compared to the Retail water efficiency baseline for costs (calculated at AMP5 average costs). Any expenditure
above the baseline is considered to be Wholesale expenditure in relation to meeting Wholesale outcomes. This
element is therefore transferred back to Wholesale and assigned 100% to Treated Water Distribution.
Customer Side Leaks – The activities in relation to fixing customer side leaks are undertaken by the Wholesale
water teams. They are identifiable and are captured in Workforce Management. The costs of the initial visit and
follow up visit along with the associated FTE are transferred to Retail and allocated 100% to Customer Side Leaks.
General and Support Expenditure – General and support expenditure is allocated to Retail using appropriate
cost drivers determined for each support function. Please refer to the section 7 for the general and support
allocation methodology.
Allocation to Household (HH) / Non-household (NHH)
Severn Trent Water disposed its non-household retail business to Water Plus. All costs are recorded in HH and
relate to HH. There is some activity which relates to NHH but these are recharged to Water Plus and recovered
by a TSA which is netted off in the costs.
There is also an allocation charge into Retail NHH from Wholesale Developer Services. These are for services to:
provide developer information – deal with questions from developers where physical aspects of
infrastructure are required to change, investigate and advise on implications;
provide connections for developers – including project management, contracting with third parties; and
administer new connections.
The overheads in relation to the above activities are also allocated to Retail NHH.

27
2D Historical cost analysis of fixed assets - Wholesale and Retail
The tangible fixed asset table is calculated allocating assets in the SAP fixed asset register to price control via use
of cost centres and profit centres and allocating the work in progress (WIP) to price control via analysis of
projects.
FIXED ASSET REGISTER
The full historic cost fixed asset register is downloaded into excel. Each asset has a cost centre assigned to it.
Additional attributes are added to the data to enable the completion of the fixed asset table:
Infra/non infra classification - this classification is based on the asset class code given to the asset
Income/expenditure classification - as the fixed asset table excludes capital income (which is reclassed to
deferred income in the balance sheet), all income asset class codes are excluded from the table
Intangible/Tangible classification - Table 2D is only applicable for Tangible assets, therefore intangible assets
are excluded
The profit centre that the cost centre is assigned to is added to the register by looking up to a SAP cost centre
download provided by Management Accounting. This is used to determine the price control and the relevant
business unit and support area for Management & General (M&G) assets
An adjustment is made to change the profit centre where the profit centre assigned to the cost centre was
set up incorrectly in SAP
M&G principal user assignments
The percentages from the G&S opex allocations are applied to determine the principal user to be identified. This
is the business unit with the highest percentage allocation. Where the finance business partner believes that
the asset principal user is different from the opex percentages or where there is no opex activity in the cost
centre, the principal user identified by the finance business partner is used instead.
Principal user cannot change year on year so once it has been assigned this is permanent. Recharges to/from
calculations for Table 2A are then determined by multiplying the relevant depreciation by the opex cost drivers
Management and general assets are assigned to a principal user using the following bases:
Business area Basis of assignment
Information systems Assignment using IS business area costings
Transport Assignment on the basis of vehicle recharges
Property services Assignment on the basis of floor space used
Business Planning Assignment based on price control FTE
COSC Assignment based on Network control cost driver Visitor sites Assignment to water resources
Reclassifications
Other adjustments are made to record changes required to the underlying fixed asset register. This may be
because assets have been posted to the incorrect cost centre at source or to include late adjustments at year
end posted in Tagetik once SAP has closed.
Meter reclassifications - Water meter consumer boxes (infrastructure assets) which are recorded in Retail cost
centres which are reclassified to Wholesale treated water distribution for regulatory purposes.

28
Reservoir reclassification – this arises as a result of the specific RAG 4 guidance on the classification of reservoirs
(See Section 2. Disaggregation of wholesale activities – upstream services - raw water abstraction and raw water
storage asset definitions).
Water resources (Raw water abstraction) reservoirs are those that have:
(1) their own abstraction licence or
(2) natural catchment or
(3) support downstream abstraction or
(4) None of the attributes of (1) to (3) above but have 15 days or more usable storage
Water Network + (Raw water storage) reservoirs are those that are:
Storage reservoirs and other storage assets that are not captured by the definitions in raw water abstraction
and have less than 15 days usable storage
Water cost centres are set up at an area level whereby multiple sites are assigned to a cost centre. We therefore
use the finance location which is assigned to each reservoir site to identify which cost centre and therefore which
profit centre and price control business unit the asset has been assigned to in the fixed asset register. This is
reviewed against the RAG 4 guidance and those requiring reclassification are identified. The respective values
are then transferred from Water Resources to Water Network +.
The above adjustments have taken place in the fixed asset table in the current year, hence a reclassification of
the opening balance position has been recorded in the adjustments line in 2D.
Other adjustments
All entries in the fixed asset register are posted to the SAP general ledger in specific GL codes which only allow
auto-postings from the fixed asset register and WIP listing. There is sometimes a requirement to enter journals
in addition to the auto postings, these are posted into manual GL codes.
Year on year journals to manual codes include the gross depreciation accrual, abandonment depreciation accrual
and WIP abortives accrual. The price control assignment is determined from the site the accrual relates to.
The other manual adjustments primarily relate to legacy adjustments arising when the company moved from
Oracle to SAP. These are allocated to price control on an estimated % base allocation. These will be permanent
journals which roll forward every year.
Other one-off adjustments relate to journals arising during the year end process but are posted directly into
Tagetik rather than SAP as the ledgers have closed. The price control assignment is determined from the site the
adjustment relates to.
As a result of detailed activities in preparation for PR19, additional review activities have been performed in
relation to accuracy of assets assigned to cost centres and price controls. This has led to transfers in the
adjustments line in the cost and depreciation sections of the fixed asset table which related to resetting the
opening position of the adjustments outlined above.
WORK IN PROGRESS
The WIP ledger is extracted from SAP with line by line detail of project. Each project includes water/waste/bio
resources descriptor. Water resources/Networks split has been determined by comparison of the projects
against their assigned business plan line which are Water Resources or Water Network + BPLs. The ledger

29
outlines the closing allocation in WIP. The movement in WIP across price controls is determined by subtracting
against the opening WIP balance by price control.
A final true up exercise is performed comparing the tangible capital expenditure additions to the tangible fixed
asset additions. Differences arise between the two where a project has been assigned to a particular price
control and capitalised in a cost centre which is not assigned to the same price control. The capital expenditure
position is identified as the final position and differences are accounted for in WIP additions movement.
A final reconciliation is performed between the net book value of the tangible assets in the statutory accounts
to the regulatory accounts, the only difference expected being capitalised interest.
2E Analysis of capital contributions and land sales – wholesale
Grants and contributions have been allocated between water and waste water in accordance with the nature of
the income. Grants and contributions fully recognised in the income statement relate to IRE income. All other
grants and contributions received are capitalised and amortised against depreciation.
Connection charges are contributions received from developers for service connection charges for installing a
new service pipe and meter. (Water Industry Act s45).
Infrastructure charge receipts are contributions received in the year for new connections. This reflects a
contribution to the costs of enhancing the local water or sewerage network. (Water Industry Act s146).
Requisitioned mains are contributions received from developers to requisition a new water main or sewer.
(Water Industry Act s43, 55, 56 & 100).
Diversions are contributions received from local authorities, highway authorities and private companies to divert
water mains or sewers. (Water Industry Act s185).
Other contributions are received from organisations towards the construction of specific capital projects, e.g. health authorities for fluoridation or government departments for environmental schemes. Value of adopted assets is taken from our monthly adoptions reconciliation which represents postings to the ledger and are from the project manager in developer services. Capitalised grants and contributions balance sheet
The opening value of capitalised grants and contributions (excluding adopted assets) has been brought forward as at 1 April. The total value of grants and contributions capitalised in the year agrees to the total value of grants and contributions recorded in the column ‘capitalised and amortised against depreciation’. The total value of amortisation of the income assets agrees to the value released to the income statement in the year. Proceeds from disposal of protected land
These are the net proceeds, after the deduction of all offsetting costs from disposals of protected land.

30
2F Household - revenues by customer type
The Target MI system reports on customer types. For regulatory accounting purposes, a different customer field
(Property Usage Code (PUC)) is used to split revenues into customer types.
Properties categorised as voids (properties which have not received a water or waste water service during the
year ending 2017-18) are excluded from the above customer categories, these make up an insignificant
proportion of the total balance (less than 0.4%).
Customer numbers are provided from STW corporate source systems for all categories with the exception of
line two (unmeasured waste water only) and line five (measured waste water only), which is provided by other
water companies (OWCs), who bill on our behalf.
The customer numbers data has been subject to assurance in accordance with our Company Assurance
Framework.
2G/H Non-household water and waste water - revenues by customer type
These tables are longer required following the disposal of our retail non-household activities to Water Plus in 2016.
2I Revenue analysis and wholesale control reconciliation
The wholesale/retail charges are determined as part of the Charges Submission process. Agreed tariffs are
assigned a unique code which maps them to a customer type. Each code is mapped to a GL account and a cost
centre. This enables the interface from Target to SAP so transactions can be posted into SAP.
All non-tariff general ledger income codes have been assigned to the below categories using guidance within
the RAG 4 income categorisation table:
Bulk supplies – water
Bulk supplies – waste water
Other third party revenue
Other appointed revenue
2J Infrastructure network reinforcement costs
A SAP business warehouse report produces a detailed view of infrastructure renewals expenditure
and capital expenditure and income by project.
Each project is assigned to a business plan line (BPL) which aligns to regulatory reporting and internal
categories to allow reporting of capital expenditure against planned activity.
Specific business plan lines relate to infrastructure network re-inforcement costs where the
investment driver relates to managing supply demand balance specifically in relation to growth.
Expenditure on low pressure improvements related to growth is included but expenditure on low
pressure improvements related to enhanced service levels is excluded from the table.
Expenditure on other non growth related supply demand balance projects are excluded e.g. hot
weather action plans
The projects in the infrastructure network re-inforcement BPLs are reviewed by a subject matter
expert on completion of the table to ensure that expenditure has been correctly coded at source with
adjustments made where required.
31
Water
BPLs identified as water infrastructure network reinforcement growth lines are:
- Network re-inforcement off-site capex - local reinforcements, hydraulic capacity (undersized
assets) and strategic growth re-inforcements
- On-site capex – new development and new connections expenditure
A further categorisation of the expenditure is made into distribution and trunk mains and pumping
and storage facilities where the former is all infrastructure expenditure and the latter is non-
infrastructure. This categorisation is derived from the purpose mapping for each project which
identifies if the spend is infrastructure (below ground) or non-infrastructure (above ground) related.
Waste
Our existing Waste structure only has one network reinforcement growth BPL, therefore an analysis
of projects to identify the on-site and off-site expenditure is conducted by a subject matter expert.
- Network re-inforcement off-site capex - local reinforcements and strategic growth re-
inforcements
- On-site capex – requisitions and on-site adoptions expenditure
A further categorisation of the expenditure is made into sewage collection (foul, combined and
surface water only systems) and pumping and storage facilities where the former is all infrastructure
expenditure and the latter is non-infrastructure. This categorisation is derived from the purpose
mapping for each project which identifies if the spend is infrastructure (below ground) or non-
infrastructure (above ground) related.
Sewage collection expenditure is allocated 95% foul and combined systems and 5% surface water only
systems. This is a management estimate based on analysis of projects which indicate that the
majority of growth is as a result of foul flows and occasionally relate to upgrading the surface water
systems.

32
7. Upstream services The wholesale water operating and capital expenditure is allocated to upstream service once the business unit
allocation is complete by applying the below approach:
(1) direct where appropriate;
(2) by identifying specific cost drivers by retrieving the relevant management information;
(3) management estimate where management information is not available;
Capital expenditure allocated to upstream services is at the same point as business unit allocation by business
plan line and purpose code analysis or once business unit allocation has occurred (if business plan line and
purpose code cannot determine this) by use of appropriate cost driver based on management information or
management estimate.
The table definitions in RAG 4 are used to identify the boundary points and assets in each upstream service to
aid cost allocation.
Upstream Services - Water
Business Unit Cost type Upstream allocation
Water resources
Abstraction charges 100% Abstraction licences
All other costs 100% Raw water abstraction
Raw water distribution
Power 100% Raw water transport. Raw water storage uses negligible power
Local authority rates Allocated to raw water transport and raw water storage on the basis of the current cost gross book value of the assets attributed to each service.
All other costs 100% Raw water transport
Water treatment No disaggregation of water treatment to upstream services is required
Treated water distribution No disaggregation of water treatment to upstream services is required
Water - Derivation of the quantities used to calculate the unit cost information Licenced volume available - The total volumes available from Severn Trent licenced abstractions are recorded centrally in mega litres (Ml) in the ‘Licence Budget’ spreadsheet. The spreadsheet is based upon the invoices STW receive for all of our abstraction licences from the Environment Agency (EA) and Natural Resources Wales (NRW). The spreadsheet captures the abstraction cost along with the amount of water STW are licenced to abstract in any one year by area. The annual volume data is then reconciled with an internal database that holds all STW’s abstraction licences. Volume abstracted/transported - The total daily volume data from Operator readings and telemetry data is collected from all Severn Trent treatment sites outputs. These numbers are then totalled for all sites for the year, giving total abstractions. It is assumed that the total volume transported into the network is the same as the volume abstracted.

33
Average volume stored – The average volume stored is the average of the recorded daily stored volumes for the year. Distribution input volume - Water distributed into supply is calculated monthly and is based on meter readings recorded from across the Severn Trent estate. It is assumed that the distribution input volume for water treatment and treated water distribution is the same. Upstream Services - Wastewater
Business Unit Cost type Upstream allocation
Sewage collection All cost types Allocated on the basis of volume information collated during a 2017/18 project to raise visibility of sewerage charges for customers for a) foul water (including trade effluent), b) surface water draining from eligible premises and c) surface water draining from highways. Definitions of each category are as follows: Foul water is Dry Weather Flow (DWF) with trade effluent at Sewage Treatment Works (STW); Surface drainage are surfaces types associated with residential and commercial premises that drain to our systems, e.g. Paved (Non Road), Domestic Drives & Patios; Highway is any public road or other public way on land. It is used for major roads, but also includes other public roads and public tracks.
Sewage treatment Chemical costs Imported sludge liquor treatment allocation - based on the costs of the specific chemicals or management level at a site level
Employments costs
Imported sludge liquor treatment allocation - an allowance has been made for this by estimating the costs for one site and applying to the number of dewatering centres.
Rates Imported sludge liquor treatment allocation - pro-rated on the proportion of sewage treatment load represented by liquor treatment activity.
Sludge
All cost types Disaggregation between sludge transport, sludge treatment and sludge disposal occurs at the cost centre assignment stage in the accounting separation process applying the definitions in RAG 4, therefore no further disaggregation is required.
Waste water - derivation of the quantities used to calculate the unit cost information Volume collected (foul, surface water drainage, highway drainage) – The reporting requirements for this line requires the calculation of collected volumes entering the sewerage system from foul connections (toilets, showers etc.), surface water drainage (roofs and paved areas appertaining to property) and highway drainage. This includes flow arriving at the sewage treatment works (measured using data from MCERT flow meters) plus unmeasured flow discharged to watercourses from surface water sewers and combined sewer overflow spills. Verified hydraulic sewer models are used to calculate the unmeasured (non-MCERT) flows to derive the additional collected volumes not included within the MCERT measured flows. This analysis is also used to calculate the split between foul, surface water drainage and highway drainage to take account of rainfall volumes during the reporting year.

34
Biochemical Oxygen Demand (BOD) (sewage treatment and disposal) - This figure is firstly taken directly from the reported BOD/d load figure from ‘Table 4S - Non-financial data - sewage treatment – Wholesale’, line 4S.7 - Total load received. The number is then multiplied by 365 (days) and divided by 1000 to give tonnes BOD/annum. Biochemical Oxygen Demand (BOD) (sludge liquor treatment) - The starting point for the calculation is the reported total feed to digestion data which is extracted in tonnes of dry solids/annum by site (extracted from JRP loggers). In order to calculate the amount of digestate, it is assumed that: 50% destruction of solids takes place across APD plants; and 36% across MAD plants. Digested cake volume is calculated by dividing the digestate tds by the average % dry solids of cake sent to land from that site. Where digested sludge is sent to another site for dewatering, the %dry solids from the receiving site is used. Liquor volume is calculated by subtracting the cake volume from the digester feed volume and adding 36% for polymer and washwater. BOD concentration is assumed to be 340mg/l (based on sampling of centrate from Barnhurst, Spernal, Roundhill, Strongford and Wanlip in 2016- 18). The following sites have liquor treatment plants (these are bioresources assets): Alfreton, Derby, Minworth, Newthorpe, Stoke Bardolph, Wanlip and Worksop. BOD removal of 90% is assumed for these sites (based on sampling at Worksop LTP in 2015). Where digested
sludge is sent to a site with an LTP for dewatering, the same % BOD removal has been assumed. The total BOD
load from liquor for all sites is calculated as kg/annum. This figure is divided by 1,000 to give a value in tonnes.
Volume transported - sludge transport - The volume of sludge transported is the sum of the volume
transported by tanker and the amount transported by pipeline.
To obtain the volume of sludge transported by tanker, the data set used to calculate line 4R.31 - Total measure
of intersiting 'work' done by tanker is used. This identifies all of the tanker journeys from satellite sites to
sludge treatment centres. Sludge discharged to the head of the works is not included.
To obtain the volume of sludge transported by pipeline, the data set used to calculate line 4R.30 - Total
measure of intersiting 'work' done by pipeline is used.
The volume of sludge transported from Cannock to Four Ashes is assumed to be the same as the Four Ashes
digester feed – this is obtained from the JRP loggers.
The volume of primary sludge transported from Coleshill to Minworth is not measured. An estimate of tds is
obtained by multiplying the Coleshill population equivalent by 40 g/hd/day. The volume of sludge transported
by this pipeline has been calculated by multiplying this value by 1.04% dry solids (measured value from
October 2015).
The total volume transported by tanker and pipeline for Severn Trent is then calculated and produced in the
summary tab of the “Data Return 2017 18 4E 25 calcs” spreadsheet.
Dried solid mass treated - sludge treatment – This figure is taken directly from the reported Total sewage
sludge produced figure from Table ‘4R - Non-financial data - Wastewater network and sludge - Wholesale
wastewater’, line 4R.25.
Dried solid mass disposed - sludge disposal - This figure is taken directly from the reported Total sewage sludge
disposed figure from Table ‘4R - Non-financial data - Wastewater network and sludge - Wholesale
wastewater’, line 4R.29.
35
8. General and support allocation methodology
General and support costs are identified in the ledger by cost centre. These are apportioned between water,
waste and retail following the rules detailed in the table below.
For some central functions where the tasks do not specifically relate to water, waste or retail, costs are allocated
based on a FTE allocation percentage.
Employee FTE percentages have been used for allocation of general and support costs for specific functions
across price controls and for a number of shared cost centres whose activity straddles more than one price
control.
In SAP, FTE’s are assigned to individual cost centres. A SAP business warehouse report identifies the number of
FTE’s in each cost centre on a monthly basis. This captures the below employees:
Direct – employees on the payroll, including fixed term contractors
Indirect – employees hired via our recruitment agency partner as contractors/agency
The average number of FTE’s over the 12 month period is calculated for each cost centre.
Where FTE costs have been capitalised, we have removed a proportion of FTEs to reflect the costs removed from
operating expenditure. For costs identified as non-appointed, FTE’s related to this activity have been removed
based on the material costs associated with these activities.
Allocation of general and support expenditure between business areas.
Type of cost Basis of Allocation Process
Group Commercial – Stores
Stores Issues Costs are allocated directly to water, waste water, and retail based on where stores issues that have been charged to a cost centre.
Group Commercial – Transport
Vehicle and plant recharges are downloaded from SAP.
FTE
Transport is allocated directly to water, waste water and retail based on the internal vehicle and plant recharged throughout the year.
Where the recharges have been posted against general and support business areas, the costs are allocated between water, waste water and retail using FTE.
Group Commercial – Procurement
Timesheets Employees have estimated the proportion of their time spent in each price control and business unit via timesheets. Roles within Capital delivery and Commercial teams and Business Services team support specific contracts, such as Water Distribution, Water Treatment etc. An overall weighted average is calculated and applied to the overall Procurement costs that need to be allocated.
Group Commercial – Value Transformation & Support
Timesheets The Commercial Support team consists of the Value Transformation and Performance & Governance teams: the former also complete

36
timesheets, the latter support the main Procurement team so are allocated on the same basis.
Directors Manpower – Timesheets
Non manpower – Transactional Analysis (Management Information)
Manpower costs are allocated based on completion of time sheets splitting out time spent working in water, waste water and retail and relevant business units. A transactional analysis is carried out on non-manpower to allocate any costs directly to price controls/business units.
General Counsel Price control FTE (including 3rd party contractors).
The costs are allocated on a basis of FTE (including 3rd party contractors) between water, waste water and retail.
Human Resources Price control FTE (excluding 3rd party contractors).
The costs are allocated on a basis of FTE (excluding 3rd party contractors) between water, waste water and retail as the contractors do not utilise the services of the HR team.
Strategy & Regulation – Regulation
Manpower - A summary of costs are downloaded from SAP and split between manpower costs (1/9th Retail & 8/9th water & waste water allocation); and
Non manpower – Transactional Analysis (Management Information)
Manpower costs are allocated on the basis of 1/9th to retail and remaining 8/9th are allocated to water and waste water based on a 50:50 split for each price control so as not to favour one wholesale price control over another.
A transactional review is carried out for non-manpower costs to identify any costs that can be directly allocated to price controls. The balance is then also split 1/9th Retail and 8/9th water and waste water. Water and waste water are allocated equally to avoid bias between price controls.
Strategy & Regulation – Strategy
Manpower - A summary of costs are downloaded from SAP and split between manpower costs (1/9th Retail & 8/9th water & waste water allocation); and
Non manpower – Transactional Analysis (Management Information)
Manpower costs are allocated on the basis of 1/9th to retail and remaining 8/9th are allocated to water and waste water based on a 50:50 split for each price control so as not to favour one wholesale price control over another.
A transactional review is carried out for non-manpower costs to identify any costs that can be directly allocated to price controls. The balance is then also split 1/9th Retail and 8/9th water and waste water. Water and waste water are allocated equally to avoid bias between price controls.
Strategy & Regulation – Communications
Price control FTE (including 3rd party contractors).
Non manpower – Transactional Analysis (Management Information)
Manpower costs are allocated on a basis of FTE (including 3rd party contractors) between water, waste water and retail.
A transactional review of non-manpower is carried out on the transactions for items that relate specifically to water, waste water and retail; the remaining costs are allocated to price controls based on company FTE.

37
Finance, Assurance & Business Intelligence
Price control FTE (including 3rd party contractors).
The costs are allocated on a basis of FTE between water, waste water and retail.
Insurance Price control FTE (including 3rd party contractors).
Direct insurance costs are allocated direct to price control. Remaining insurance costs are allocated on basis of FTE between water, waste water and retail.
Miscellaneous Reporting
Various allocation methods used depending on the cost to allocate between price controls unless there are any directly attributable costs in Miscellaneous Reporting which are removed from the G&S allocation.
Costs are allocated to price controls based on a line by line basis, depending on the nature of the costs and an assessment of the most appropriate cost driver.
The material items are listed below:
LTIP costs are allocated on the same basis as Directors;
DB pension Admin costs/SAYE costs are allocated on the basis of FTE (excluding 3rd party contractors).
Costs which are Finance related in nature e.g. FX and Leases are allocated on the basis of FTE (including 3rd party contractors) in line allocation of Finance G&S costs
Technology Wholesale and Retail FTE (including 3rd party contractors).
As Severn Trent Water operates a hot-desking policy, it is considered that FTE is an appropriate driver to use as the allocation materially relates to number of computers. IS support costs are attributed to specific IS systems which are then allocated to business areas, wholesale, retail or general and support using FTE numbers.
Wholesale is further allocated between Water and Waste water based on Wholesale FTE.
IS costs which are across the whole business e.g. SAP costs are General and support IS costs are allocated across water, waste water and retail in proportion to the value of costs that are already assigned to these areas.
Property – Facility Managed (FM) sites
Occupation of FM sites is based on HR site occupation split by the Price Control business unit they work in or are allocated to.
SAP HR report with employee location and cost centre coding provides the data source.
Costs are allocated based the occupation of the sites as a proxy for the floor space share, with the exception of the Monkspath site and Pride Park site.

38
The Monkspath site contains IS servers and is allocated using the general and support IS allocations. The manpower costs is pro-rata allocated on the price control business unit cost of the combined FM and wholesale operational cost centres, whereas the central Opex FM costs is allocated based on the pro-rata proportional price control business unit cost of the FM sites only.
Property – Wholesale Operational sites & Compliance
Transactional spend analysis from SAP download reports and supporting invoice documentation.
A transactional analysis of the operational site costs cost centre is performed to identify spend by site and therefore the price control business unit.
Property – Portfolio Management
Allocated on the Property estate portfolio numbers by price control / business unit. SAP Reports are downloaded for Portfolio Manager Cost centres cost.
Allocate the portfolio management cost by the price control business number of properties. This is after recharging the cost of collecting and managing rental income
Property Visitor Experience Team (VET) sites
Allocate the VET costs based on the work undertaken by the Rangers (Manpower) and the costs incurred in catchment management of the reservoir sites and the management of public access visiting the site.
SAP reports are downloaded for Portfolio Manager Cost centres cost.
Property Services Manager
Allocated pro-rata against the weighted average price control allocation of all other cost centres (above).
SAP report of Cost centre spend and price control allocation of above property services allocation.
Property - Facility Management (FM) Sites
The spend is allocated based on the weighted average allocation of “Wholesale sites” (Ops) and FM sites)
These costs relate to the central operational management of running both FM & operational sites. SAP reports are downloaded for FM Cost centre cost.
An allocation of the above support costs is made to retail non-household to cover the retail developer services
administration activities.
A summary of the G&S allocation by support function is outlined below:
Support area Water resources
Water Network
+
Waste Network
+
Sludge Retail household
Retail non household
Total appointed
Group commercial (including Transformation)
0.8% 50.0% 39.6% 7.0% 1.1% 1.5% 100.0%
Transport 2.2% 16.0% 42.6% 28.4% 8.3% 2.5% 100.0%
Directors 13.9% 43.1% 30.8% 12.2% 0.0% 0.0% 100.0%
General counsel 5.2% 35.5% 30.8% 10.4% 16.0% 2.1% 100.0%
Human resources 7.7% 50.5% 31.9% 9.9% 0.0% 0.0% 100.0%
Strategy & regulation (incl. Communications) 11.0% 37.1% 32.9% 15.4% 3.2% 0.4% 100.0%
Finance, Assurance & BI (incl. Insurance & Misc. Reporting)
10.4% 35.8% 30.9% 11.7% 9.9% 1.3% 100.0%
Information Systems 4.6% 31.1% 28.5% 9.6% 25.1% 1.1% 100.0%
Property 13.5% 28.2% 44.8% 2.1% 11.2% 0.2% 100.0%

39
9. Capital expenditure process
Capital investment framework (CIF)
The company’s capital investment framework (CIF) manages large capital programmes. Capital projects go
through a formal approval process as follows:
Owner(s) Process / activity
Project Manager Submit a business case template (project/ application) outlining the operating and capital expenditure.
Programme Board
Discuss and review project with the Finance Analyst teams.
Investment Governance Analyst
Scrutinise project applications and assess whether operating costs and capital expenditure have been allocated correctly. In the event that they disagree with the proposed accounting treatment the project manager is advised accordingly. In certain circumstances, the guidance issued by the Analyst Team may be contested by the project team. In such cases the proposal is referred to Group Finance who after referring to the appropriate International Financial Reporting Standard or Regulatory Accounting Guidance, provide a defining judgement on the issue.
Group Finance Issue a guidance note to aid business users in the preparation of their capital investment proposals. This tends to occur for more complex areas where the applicable accounting principles, as defined in the capital expenditure accounting policy, are less easily understood by non-finance professionals.
Labour, pensions and overhead absorption rates (“Burdening”)
This is a process that enables the recovery of costs from departments (primarily Support) whose activities are
indirectly linked to the capital programme. The burdening process calculates these costs and allocates them to
capital accordingly.
The overhead burden rate is calculated as follows:
Total allowable staff and support function costs to be recovered divided by the gross annual investment
programme expressed as a percentage.
The burden rate is refreshed at half year and then finalised at the year end.

40