
Session Three - ICEweb Safety/Evaluation of Arc... · Session Three: Evaluation of Arc Flash...
28
Session Three: Evaluation of Arc Flash Hazards Using Computer Based Simulation 2013 Electrical Arc Flash Conference - IDC Technologies Session Three: Evaluation of Arc Flash Hazards Using Computer Based Simulation Hilton Bennie Senior Electrical Engineer, Applied Energy Solutions (Pty) Ltd 1. Introduction Arc Flash Hazard Analysis is essentially the quantification of the thermal energy that personnel might be exposed to during an arcing fault. The thermal energy released during an arcing fault is proportional to current flowing during the fault as well as the duration for which that current is sustained. The duration for which an arcing fault is sustained is determined by the response of the protective devices in the system – fuses, relays, etc. These are current responsive devices, responding to a current flowing through an Arc Plasma – by itself a complex phenomenon, dependent on many factors including the available short circuit current, the pre-fault voltage, the gap between the conductors, system pre-fault loading and configuration, etc. Not only are the Arcing Current and Fault Clearing Times (FCT) complex to determine, and dependant on many variables (some of which are out of our control or difficult to predict), but the equations governing the incident energy are similarly complex, based on statistical and empirical data. As a result, determining the Arcing Current and FCT accurately can be challenging. Even once these values are determined it is still difficult to intuitively gauge whether one particular current/time combination is more or less hazardous than another, without performing the full analysis. As engineers are responsible for the safety of personnel, it is our responsibility to perform the Arc Flash Hazard Analysis as accurately, yet conservatively, as possible. Being overly conservative may yield unnecessarily strict PPE requirements, which may be cumbersome and ultimately counter-productive. Engineers need to have tools and systems in place to ensure a high level of confidence in the results of the Arc Flash Analysis. We need the ability to perform our analyses on various scenarios, making sure that we account for the worst reasonable case.
Transcript of Session Three - ICEweb Safety/Evaluation of Arc... · Session Three: Evaluation of Arc Flash...

Session Three: Evaluation of Arc Flash Hazards Using Computer Based Simulation
2013 Electrical Arc Flash Conference - IDC Technologies
Session Three:
Evaluation of Arc Flash Hazards Using Computer Based
Simulation
Hilton Bennie
Senior Electrical Engineer, Applied Energy Solutions (Pty) Ltd
1. Introduction
Arc Flash Hazard Analysis is essentially the quantification of the thermal energy that
personnel might be exposed to during an arcing fault. The thermal energy released
during an arcing fault is proportional to current flowing during the fault as well as the
duration for which that current is sustained.
The duration for which an arcing fault is sustained is determined by the response of
the protective devices in the system – fuses, relays, etc. These are current
responsive devices, responding to a current flowing through an Arc Plasma – by
itself a complex phenomenon, dependent on many factors including the available
short circuit current, the pre-fault voltage, the gap between the conductors, system
pre-fault loading and configuration, etc.
Not only are the Arcing Current and Fault Clearing Times (FCT) complex to
determine, and dependant on many variables (some of which are out of our control
or difficult to predict), but the equations governing the incident energy are similarly
complex, based on statistical and empirical data.
As a result, determining the Arcing Current and FCT accurately can be challenging.
Even once these values are determined it is still difficult to intuitively gauge whether
one particular current/time combination is more or less hazardous than another,
without performing the full analysis.
As engineers are responsible for the safety of personnel, it is our responsibility to
perform the Arc Flash Hazard Analysis as accurately, yet conservatively, as
possible. Being overly conservative may yield unnecessarily strict PPE requirements,
which may be cumbersome and ultimately counter-productive.
Engineers need to have tools and systems in place to ensure a high level of
confidence in the results of the Arc Flash Analysis. We need the ability to perform
our analyses on various scenarios, making sure that we account for the worst
reasonable case.

Session Three: Evaluation of Arc Flash Hazards Using Computer Based Simulation
2013 Electrical Arc Flash Conference - IDC Technologies
2. Arc Flash – Is there really a threat?
All of my switchgear is Arc Proof, Metal Clad switchgear – is there still an Arc Flash
Hazard?
Although Arc Proof switchgear is designed to minimise the probability of internal
faults occurring (assuming that the manufacturer’s installation, operation and
maintenance guidelines were strictly adhered to), the possibility cannot be ruled out
entirely.
Assuming an internal fault does occur, however unlikely, the arc-venting capability of
the switchgear then comes into question. Some of the arc-venting capabilities
depend on the switchgear operation and maintenance. To determine whether or not
Arc Proof switchgear will provide adequate protection when required, many factors
need to be taken into account, for example:
1. Are the doors and front panels closed and secured correctly? Are
compartment doors open because work is being performed?
2. Are the pressure relief flaps in good working order and adequately secured?
3. Are the air ventilation closing flaps in good working order?
4. Was the switchgear originally specified correctly for the potential arcing fault
current? Has the arcing fault changed due to network changes?
There are many variables, and as engineers we cannot afford to be complacent. We
need to protect personnel against feasible threats.
3. IEEE 1584 – Arc Flash Hazard Analysis
A brief overview of the steps involved in performing Arc Flash Hazard calculations in
accordance with the IEEE 1584 standards is provided below.
3.1. Calculate the Arcing Current
The IEEE 1584 equations provide estimates for the Arcing current as follows:
System Voltage < 1000V:
System Voltage >= 1000V:
3.2. Calculate the Incident Energy
Once the Arcing current has been determined, the Incident Energy is calculated.
Incident Energy is the amount of energy impressed on a surface, at a certain
distance from the energy source. This energy is calculated in two steps – first the

Session Three: Evaluation of Arc Flash Hazards Using Computer Based Simulation
2013 Electrical Arc Flash Conference - IDC Technologies
normalised incident energy (En) is calculated, and then the actual incident energy
(E) is calculated from En. These equations are provided below.
Empirical Method – 1-15 kV
En is the energy incident on a surface at 24 inches (610 mm) with a fault clearing
time of 0.2 s.
E is the adjustment of En based on specific conditions.
Lee Method – 15+ kV

Session Three: Evaluation of Arc Flash Hazards Using Computer Based Simulation
2013 Electrical Arc Flash Conference - IDC Technologies
The incident energy is calculated using two different values of Arcing Current –
100% and 85%. The 15% reduction factor is in place to account for unknowns and
variations within the system. Since most of the current responsive devices in a
network would exhibit non-linear inverse-time characteristic responses, the FCT
would be increased. For each Arcing Current and corresponding FCT, the incident
energy is calculated, and the Arc Flash Hazard is assessed based on the highest
energy.
ETAP provides the user with the ability to override the default 15% arc current
variation with any value between 0-30%. As an illustration of the sensitivity of the
Incident Energy to this variation, please see the case study provided at the end.
In ETAP, the Empirical Method is used for voltage ranges between 0.208-15kV and
bolted fault currents in the range of 0.7-106kA. If the voltage and/or fault current
does not fall within this range, then the Lee Method is used.
3.3. Determine the Arc Flash Boundary
The flash boundary is defined as the distance from the arcing fault at which the
incident energy is equal to 1.2 cal/cm2.
Empirical Method – 1-15 kV
Lee Method – 15+ kV

Session Three: Evaluation of Arc Flash Hazards Using Computer Based Simulation
2013 Electrical Arc Flash Conference - IDC Technologies
3.4. IEEE 1584-2002 vs. NFPA 70E-2000
The NFPA and IEEE standards for Arc Flash Analysis provide very different results
under certain circumstances. The table below highlights some of the key differences
between capabilities of each standard.
Examining the difference between the calculated open-air Incident Energies at
various voltage levels and various Fault Clearing Times at a fixed working distance
of 18” (457mm), we see that the NFPA results are more conservative below 480V,
and less conservative above 480V. At 480V, both studies produce very similar
results. This is illustrated in the graphs below.

Session Three: Evaluation of Arc Flash Hazards Using Computer Based Simulation
2013 Electrical Arc Flash Conference - IDC Technologies
The graph above illustrates the more conservative results of the NFPA calculations
at 208V.
The graph above illustrates the more conservative results from the IEEE 1584
calculations at 600V.

Session Three: Evaluation of Arc Flash Hazards Using Computer Based Simulation
2013 Electrical Arc Flash Conference - IDC Technologies
Both the IEEE and NFPA calculation methods produce similar results for a 480V
system, as shown in the graph above.
There are various Arc Flash Calculation standards and methodologies available
beyond the IEEE 1584 and NFPA standards, and even the published standards
evolve over time. It is therefore important for engineers to remain informed of the
latest industry trends, and to really understand the standards that they are applying.
In particular, care should be taken to understand the limitations of the published
standards, and to carefully examine the applicability of a standard to a given
scenario.

Session Three: Evaluation of Arc Flash Hazards Using Computer Based Simulation
2013 Electrical Arc Flash Conference - IDC Technologies
4. Arc Flash Calculation Examples
To illustrate some of the key factors that influence the outcome of an Arc Flash
Hazard analysis, several examples are presented as case studies. Various sections
of an actual ETAP model developed for a local petroleum refinery will be used as the
basis for the case studies.
Some of the original data has been modified and/or simplified for purposes of
illustration.
4.1. Example 1
4.1.1. Introduction
The image below shows the section of the network used for this demonstration – it is
the left hand side bus of the LV MCC called SUB A. The bus is fed via a 750kVA
3.3/0.415 kV transformer and a 20m long 3 core 300mm2 copper XLPE cable.
The purpose of this example is to illustrate various influences on the Arc Flash
Hazard. Firstly, the difference between the arcing current and the bolted three phase
fault level is discussed. This is followed by an Arc Flash Hazard analysis of the
network under three Scenarios – with bus zone protection, without bus zone
protection and without protective device isolation.

Session Three: Evaluation of Arc Flash Hazards Using Computer Based Simulation
2013 Electrical Arc Flash Conference - IDC Technologies
4.1.2. Arcing current vs. Bolted fault current
The image below shows the results of a basic 3-phase short circuit calculation for a
fault on SUB A L bus. This value is calculated from the IEC 60909 standard.
The total 3-phase Bolted Fault Current on the SUB A L is 19.6kA, with 14.7kA
coming from the T-4 branch. These values correspond to the initial symmetrical RMS
short circuit current, or , as per the IEC 60909 standard.
The accuracy of an Arc Flash Analysis is heavily dependent on the accuracy of the
Arcing Current available, which is derived from the 3-phase bolted fault current.
Therefore, the Arc Flash accuracy depends on the accuracy of the fault calculation.
The fault current on the secondary side of a transformer depends on the fault level
on the primary side. If the primary is connected to a utility bus, the strength of the
network becomes the dominant factor in the available fault current (the fault current
is limited by the short circuit impedance of the network). The impact of the utility
impedance is illustrated in the graph below.

Session Three: Evaluation of Arc Flash Hazards Using Computer Based Simulation
2013 Electrical Arc Flash Conference - IDC Technologies
As the available primary side short circuit current increases (i.e. utility impedance
decreases), the available secondary side short circuit current approaches the
theoretical maximum.
If the network information is unknown, the maximum potential bolted fault current
(the magenta line on the graph above) is often used. While this assumption may be
adequate for component rating, it can be highly inaccurate (the weaker the network
the poorer the assumption). This is particularly noticeable during protection
coordination studies and arc flash analyses.
When no fault current information is available from the utility, the arc-flash hazard
analysis should include multiple scenarios, such as 50%, 75% and 90% of the
maximum 3-phase bolted fault current, and the worst-case scenario for the arc flash
hazard considered.
When calculating the arcing current, ETAP uses the total value and the formulae
from the IEEE 1584 standard to calculate the total arcing current ( ). As shown
below, this value is 10.31kA.

Session Three: Evaluation of Arc Flash Hazards Using Computer Based Simulation
2013 Electrical Arc Flash Conference - IDC Technologies
In order to calculate the contributions to the arcing current from each branch, the
ratio of each branch’s contribution to the total value is maintained. Therefore, the
contribution from the T4 branch is:
The Arcing Current contributions are significantly lower than the 3-phase bolted fault
currents. As an illustration of the effect that this reduced current magnitude may
have on the operation of a protective device, the image below shows the response of
the upstream relay, OC S1-SA FP1, to a phase current of 7.73kA vs. 14.7kA.

Session Three: Evaluation of Arc Flash Hazards Using Computer Based Simulation
2013 Electrical Arc Flash Conference - IDC Technologies
There is an additional 300ms delay in the response to the reduced current. This can
have a significant impact on the magnitude of energy available during the Arcing
fault.
4.1.3. Arc Flash Hazard Analysis
4.1.3.1. Scenario 1 – Bus Zone Protection
In this scenario, there is a Bus Zone protection scheme in place (provided by
DIFF_RELAY), and the main protective device (S1-SA IB2) is sufficiently isolated
from the Arc Flash such that the device is able to clear the fault.
From the results below, we see the total FCT is found to be 0.05s – this is 0.02s for
the differential relay to operate and 0.03s for the circuit breaker to trip. The working
distance is set to 18 inches (45.72cm).

Session Three: Evaluation of Arc Flash Hazards Using Computer Based Simulation
2013 Electrical Arc Flash Conference - IDC Technologies
The Arc Flash Hazard is identified as a Level 1 in this scenario.
This example illustrates the capability of a bus differential system to provide fast fault
clearing, potentially reducing the Arc Flash Hazard. The advantage of such a system
is that it is relatively easy to integrate into existing installations, but it can be
expensive due to the large number of CTs required.
4.1.3.2. Scenario 2 – Overcurrent Protection
In this scenario, the Bus Zone protection scheme is not in place, and the main
protective device (S1-SA IB2) is sufficiently isolated from the Arc Flash such that the
device is able to clear the fault.
Session Three: Evaluation of Arc Flash Hazards Using Computer Based Simulation
2013 Electrical Arc Flash Conference - IDC Technologies
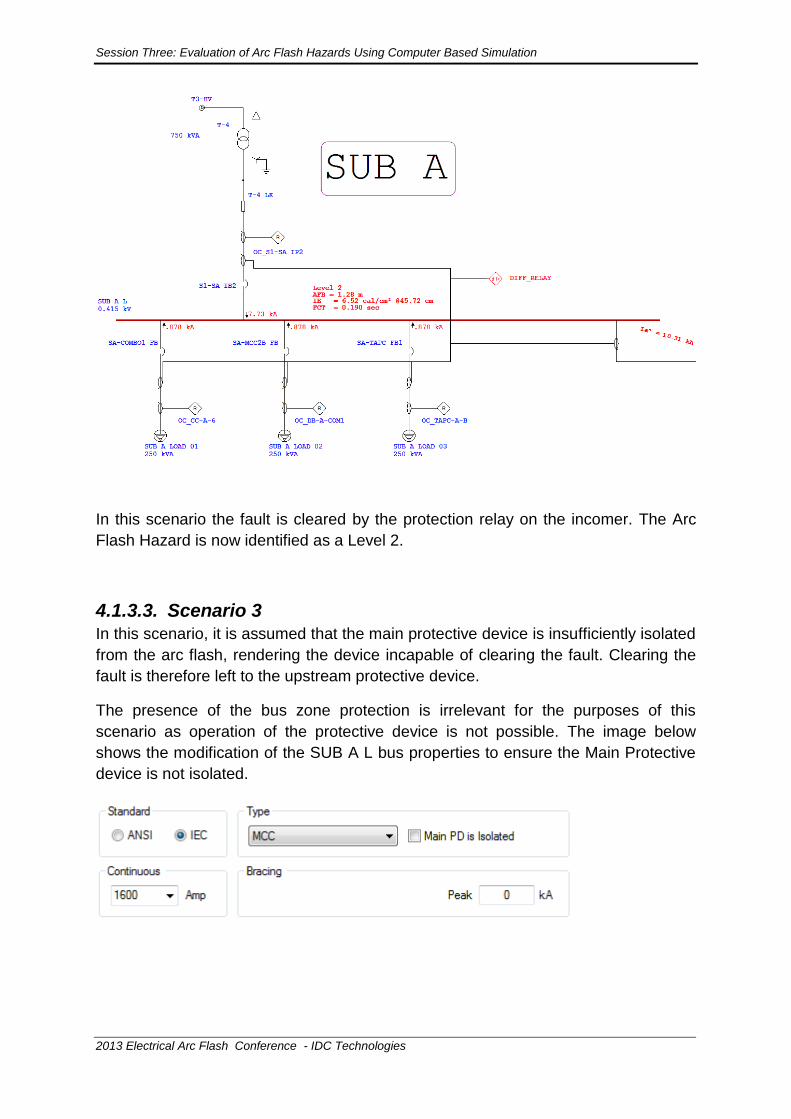
In this scenario the fault is cleared by the protection relay on the incomer. The Arc
Flash Hazard is now identified as a Level 2.
4.1.3.3. Scenario 3
In this scenario, it is assumed that the main protective device is insufficiently isolated
from the arc flash, rendering the device incapable of clearing the fault. Clearing the
fault is therefore left to the upstream protective device.
The presence of the bus zone protection is irrelevant for the purposes of this
scenario as operation of the protective device is not possible. The image below
shows the modification of the SUB A L bus properties to ensure the Main Protective
device is not isolated.

Session Three: Evaluation of Arc Flash Hazards Using Computer Based Simulation
2013 Electrical Arc Flash Conference - IDC Technologies
Two important factors play a role in determining the FCT reported in this scenario.
Firstly, since the Source Protective Device is not sufficiently isolated from the fault, it
is assumed that S1-SA IB2 is unable to clear the fault. The fault is cleared by the
upstream breaker. Secondly, the Arcing Current used in this calculation is 85% of the
calculated arcing current, since this provides the worst-case incident energy. The Arc
Flash Hazard is now identified as a Level 4.
4.1.3.4. Load Protective Device vs. Source Protective Device
ETAP allows us to view the Arc Flash results for a fault located on the line side of
either a load or a source protective device simultaneously. Source protective devices
are determined automatically, and a fault on a source protective device implies that
the device is incapable of clearing the fault.
As an illustration, we repeat Scenario 02, but we adjust the Display Options to show
both Load and Source Protective devices (as shown in the image below).
The results are now displayed as follows.

Session Three: Evaluation of Arc Flash Hazards Using Computer Based Simulation
2013 Electrical Arc Flash Conference - IDC Technologies
We see that a fault on one of the Load PDs produces a Level 2 Hazard (fault is
cleared by the incoming breaker), whereas a fault on the line side of the incoming
breaker is cleared by the upstream breaker, producing a Level 4 Hazard.
4.2. Example 2 – LV Arcing Current Variation
This example illustrates the sensitivity of the incident energy to the arcing current
variation. As discussed previously, this variation is typically taken as 15% according
to IEEE 1584. In ETAP, this is user-definable between 0-30%, with 15% as the
default value. This variation only applies to LV systems.
This example uses the left hand side bus of a low voltage (415V) substation called
SUB O. This bus is fed via a 1.5MVA 6.6/0.415 kV transformer, and feeds two
MCCs.
4.2.1. Scenario 1
In this scenario, the Arcing current variation is set to 15% as shown below. This is
the default value, and the value suggested by the IEE 1584 standard.
ETAP will simulate an Arcing current of 100% and 85% of the calculated arcing
current, evaluate the worst-case scenario and report this.

Session Three: Evaluation of Arc Flash Hazards Using Computer Based Simulation
2013 Electrical Arc Flash Conference - IDC Technologies
The image above shows a section of the ETAP study case editor where the Arc
Current Variation is set for LV systems.
The image above clearly indicates that the 85% Arcing Current provides the worst-
case incident energy, and the Arc Flash Hazard is identified as Level 3.
4.2.2. Scenario 2
In this scenario, the Arcing current variation is set to 30%, meaning that ETAP will
simulate with 100% and 70% of the calculated Arcing current and report the worst-
case incident energy.
Session Three: Evaluation of Arc Flash Hazards Using Computer Based Simulation
2013 Electrical Arc Flash Conference - IDC Technologies
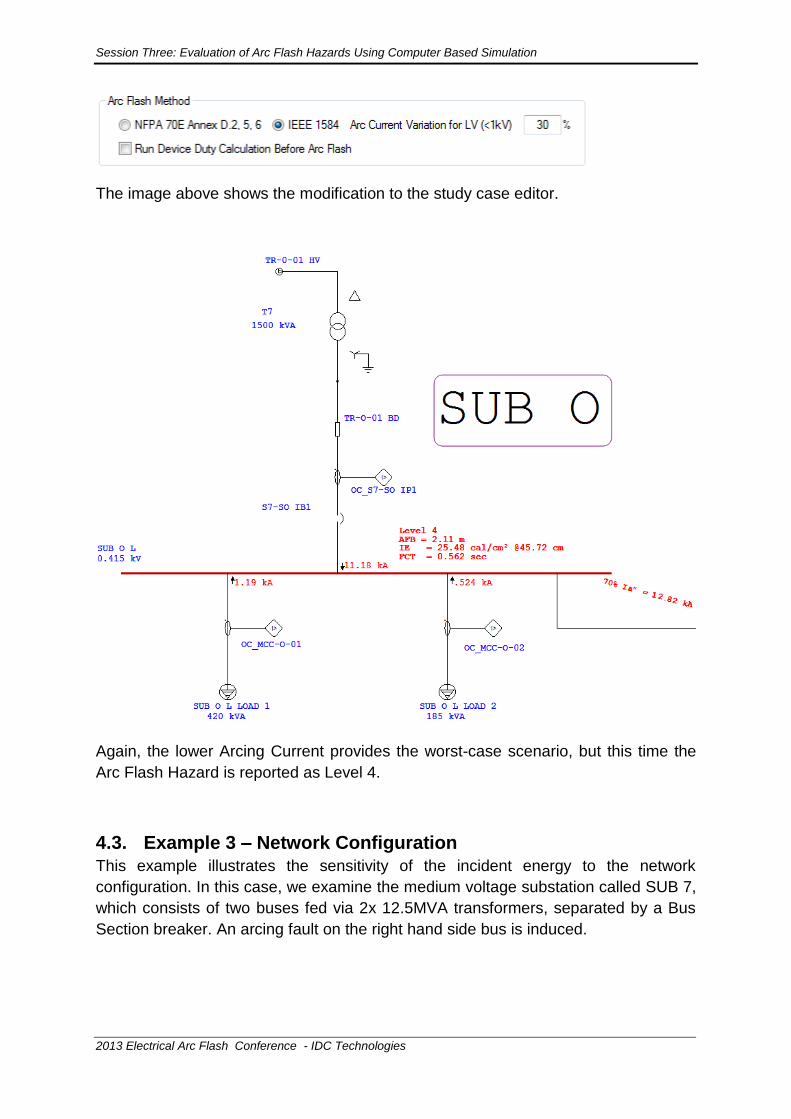
The image above shows the modification to the study case editor.
Again, the lower Arcing Current provides the worst-case scenario, but this time the
Arc Flash Hazard is reported as Level 4.
4.3. Example 3 – Network Configuration
This example illustrates the sensitivity of the incident energy to the network
configuration. In this case, we examine the medium voltage substation called SUB 7,
which consists of two buses fed via 2x 12.5MVA transformers, separated by a Bus
Section breaker. An arcing fault on the right hand side bus is induced.

Session Three: Evaluation of Arc Flash Hazards Using Computer Based Simulation
2013 Electrical Arc Flash Conference - IDC Technologies
4.3.1. Scenario 1 – Normal Configuration
This scenario represents the normal operating conditions of the network. Both
transformers are in service and the Bus Section breaker is open. An Arc Flash on
one of the busses produces the following results.
The Arc Flash Hazard on SUB 7 R is indicated as Level 1 for this network
configuration.
4.3.2. Scenario 2 – Expected Worst-Case
This scenario represents the expected worst-case operating conditions. One of the
incoming transformers is out of service, and therefore the Bus Section breaker is
closed. An Arc Flash on one of the busses now produces the following results.

Session Three: Evaluation of Arc Flash Hazards Using Computer Based Simulation
2013 Electrical Arc Flash Conference - IDC Technologies
The Arc Flash Hazard is now identified as Level 2. This is indeed worse than
Scenario 1, as anticipated.
4.3.3. Scenario 3 – Unexpected Worst-Case
This scenario represents the actual worst-case operating conditions. Both incoming
transformers are in service, however the Bus Section breaker has been closed.
Although this is an undesired network configuration, it is not impossible that this can
occur. A lack of respect for operating procedures, inadequate training of personnel,
and failure/tampering with safety interlocks could lead to such a scenario occurring.
An Arc Flash on one of the busses now produces the following results.

Session Three: Evaluation of Arc Flash Hazards Using Computer Based Simulation
2013 Electrical Arc Flash Conference - IDC Technologies
We now have a Level 3 hazard. Unless adequate measures are in place to prevent
such a condition from occurring, the feeder panels from this substation would need
to be rated as Level 3.

Session Three: Evaluation of Arc Flash Hazards Using Computer Based Simulation
2013 Electrical Arc Flash Conference - IDC Technologies
4.4. Example 4 – Maintenance Mode
4.4.1. Introduction
ETAP gives you the ability to simulate the operation of maintenance mode switches.
Newer solid state trip units are being equipped by the manufacturer with special
maintenance mode switches which allow the override of the normal settings to use
instead very fast operation settings with very low pickup values. The purpose of
these trip units is to override normal coordination settings while energized work is
being performed in order to minimize the fault clearing time.
An example would be the Eaton ARMS (Arc Reduction Maintenance System). The
ARMS provides an accelerated instantaneous trip to reduce arc flash hazards – trip
times as low as 18ms are claimed. This feature is available on certain devices within
the Magnum and NRX range.
There are 5 levels of protection to facilitate the maximum arc flash reduction while
avoiding nuisance tripping during planned start-up and maintenance operations
without disturbing the normal operational trip unit settings.
The results of testing the ARMS system are illustrated in the graph below. Using the
ARMS Maintenance Mode, the Incident Energy is kept below a Category 1 for fault
currents between 10kA and 100kA.

Session Three: Evaluation of Arc Flash Hazards Using Computer Based Simulation
2013 Electrical Arc Flash Conference - IDC Technologies
4.4.2. ETAP Simulation
We illustrate the possibility of using ETAP to simulate the operation of the same
protective device operating in either normal mode or maintenance mode using a
small section of the LV substation called SUB M.
We utilise a feature of ETAP’s 3-Dimensional database, called Revisions, to create
two versions of the engineering data.
In the Base revision (indicated by the 3-D Database Toolbar on the right of the image
below), we have the trip device operating normally. The Arc Flash Hazard analysis is
shown below.

Session Three: Evaluation of Arc Flash Hazards Using Computer Based Simulation
2013 Electrical Arc Flash Conference - IDC Technologies
We are sitting with a Level 3 hazard on the feeder panels. However when energised
work is going to be performed, the solid state trip device associated with the
incoming breaker (S4-SM IB2) may be switched over into Maintenance Mode.
To simulate this, we create a new ETAP revision, called Maint Mode, and set the LV
breaker trip device to maintenance mode within this revision, as shown below.

Session Three: Evaluation of Arc Flash Hazards Using Computer Based Simulation
2013 Electrical Arc Flash Conference - IDC Technologies
A new Arc Flash Analysis calculation is run, yielding the following results.

Session Three: Evaluation of Arc Flash Hazards Using Computer Based Simulation
2013 Electrical Arc Flash Conference - IDC Technologies
We see that the Hazard has been reduced from Level 3 to Level 1 by reducing the
FCT from 0.21s to 0.04s. The difference between the Maintenance Mode and normal
operation is demonstrated clearly by the TCC curve below.

Session Three: Evaluation of Arc Flash Hazards Using Computer Based Simulation
2013 Electrical Arc Flash Conference - IDC Technologies
5. Summary and Conclusion
Calculation of Arcing Current, Fault Clearing Time and Incident Energy is complex
and is best performed using computer-based simulation of multiple different
scenarios to allow engineers to make accurate, informed decisions regarding Arc
Flash Hazards.
It is the responsibility of engineers to specify switchgear correctly, to set protective
devices appropriately, to provide adequate warnings of potential hazards and to
ensure that personnel are provided the correct PPE for the tasks they are expected
to perform.
Arc Flash Hazards change over time as a result of several factors, including internal
network evolution (loads, generation assets, configuration changes, protection
coordination changes, etc.) as well as external (utility) network evolution. Anything
that alters the available fault current and the protection coordination can potentially
affect the Arc Flash Hazard.
Correct Arc Flash Analysis requires complete, accurate, up-to-date information, a
thorough understanding of the network under investigation, and a suitable
appreciation of the applicable standards and their limitations. It is important for
engineers to have the best tools at their disposal for performing the arc flash
analyses – tools that easily allow the engineer to perform calculations across
multiple scenarios quickly and compare the results easily. One such tool is ETAP.
6. Bibliography
1. UniGear ZVC - Internal Arc Containment, Resistance And Arc Flash Mitigation
- Supplement brief to 1VGA672001 – Rev F
ABB Australia Pty Ltd, January 2010.
2. Design of a New Generation of Internal Arc Resistant Switchgear
AREVA Technology Centre
Nirmal Deb, Patrick Bailly, Thierry Tricot, Leslie T Falkingham.
3. OPTIONS FOR MANAGING SAFETY WITH ELDERLY SWITCHGEAR
RPS Switchgear Limited
Richard Blakeley, 2010
4. What is the comparison of NFPA 70E-2000 an IEEE 1584-2002 standards for
Arc Flash Analysis?
ETAP FAQ # 15
Operation Technology, Inc., June 2003
5. ETAP 12.0 User Guide
Operation Technology, Inc., January 2013
6. ARC FLASH HAZARD ANALYSIS AND MITIGATION
Christopher Inshaw, Robert A. Wilson

Session Three: Evaluation of Arc Flash Hazards Using Computer Based Simulation
2013 Electrical Arc Flash Conference - IDC Technologies
Western Protective Relay Conference, October 2004
7. Evaluating the Hazards of Low-Voltage Arcs
Albert Marroquin, Operation Technology Inc
Published in Electrical Products & Solutions, June 2007
8. IMPACT OF AVAILABLE FAULT CURRENT VARIATIONS ON ARC-FLASH
CALCULATIONS
IEEE Paper No. PCIC-2009-16
Ilanchezhian Balasubramanian, Aidan M. Graham