Session 2 Marketing Research Forecasting Developing the research plan Data Sources Primary ...
40
-
Upload
patricia-harrell -
Category
Documents
-
view
215 -
download
0
Transcript of Session 2 Marketing Research Forecasting Developing the research plan Data Sources Primary ...


Session 2
Marketing Research Forecasting


Developing the research plan Data Sources
Primary Secondary

Developing the research plan Approaches
Observational Focus group Survey Behavioral Data Experimental Technological Questionnaire

Question types – importance scale
Airline food service is _____ to me.
Extremely important
Very important
Somewhat important
Not very important
Not at all important
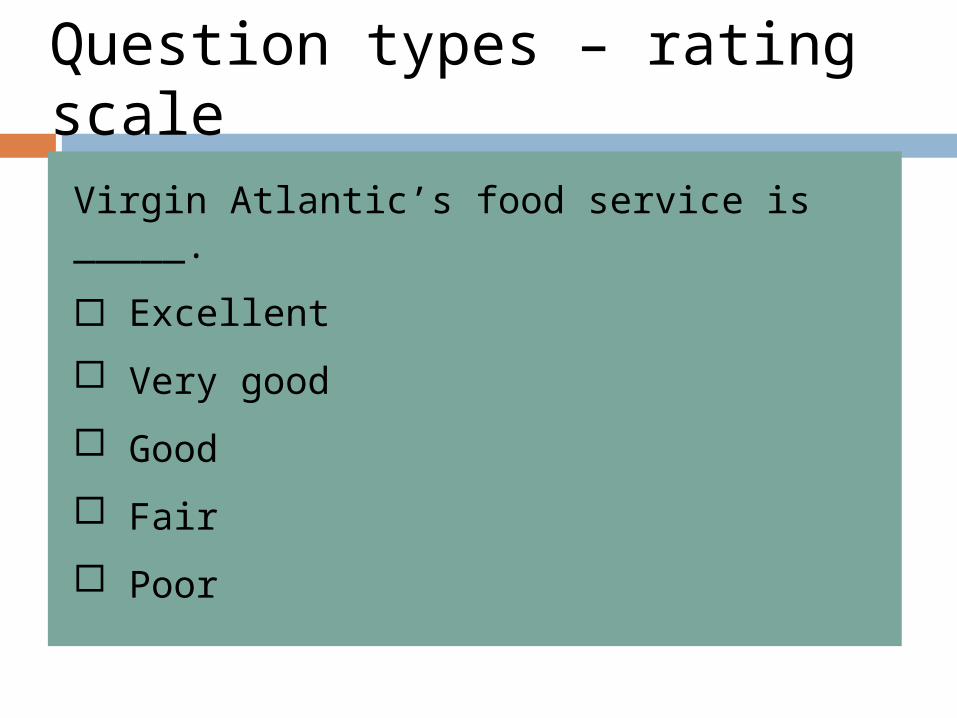
Question types – rating scale
Virgin Atlantic’s food service is _____.
Excellent
Very good
Good
Fair
Poor
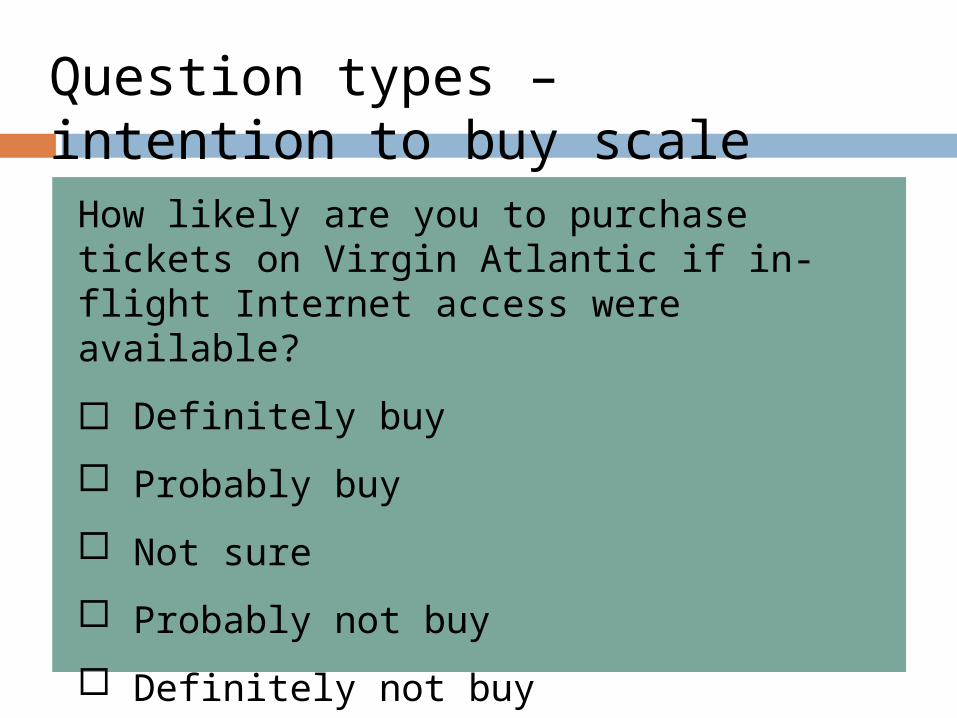
Question types –intention to buy scale
How likely are you to purchase tickets on Virgin Atlantic if in-flight Internet access were available?
Definitely buy
Probably buy
Not sure
Probably not buy
Definitely not buy

Question types –completely unstructured
What is your opinion of Virgin Atlantic?
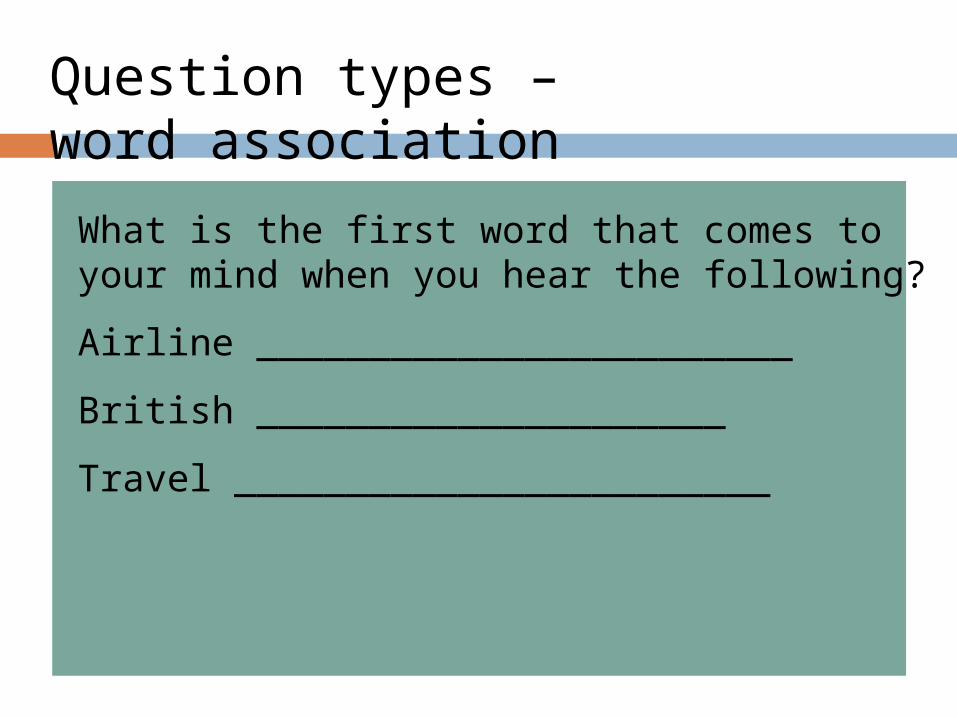
Question types –word association
What is the first word that comes to your mind when you hear the following?
Airline ________________________
British _____________________
Travel ________________________

Question types –sentence completion
When I choose an airline, the most important consideration in my decision is: ________________________________________________________________________________________________________________________________________________________________________________________________________________________________________________.

Question types –story completion
‘I flew Virgin a few days ago. I noticed that the exterior and interior of the plane had very bright colors. This aroused in me the following thoughts and feelings’. Now complete the story. __________________________________________________________________________________________________________________________________________________________________________________________________________________________________________

Question types –picture (empty balloons)

Qualitative measures
Word associationWord association
Projective techniquesProjective techniques
VisualizationVisualization
Brand personificationBrand personification
LadderingLaddering

Technological devices
Galvanometers
Tachistoscope
Eye cameras
Audiometers
GPS
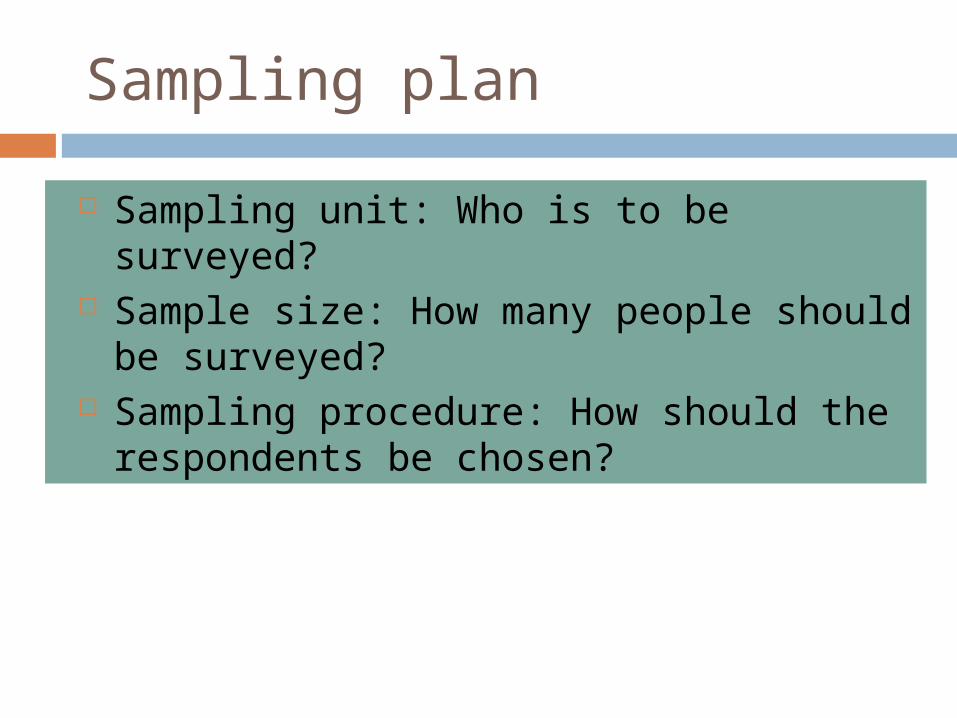
Sampling plan
Sampling unit: Who is to be surveyed? Sample size: How many people should
be surveyed? Sampling procedure: How should the
respondents be chosen?

Types of samples
Table 6.2 Probability and non-probability samples

Contact methods
Mail questionnaire
Telephoneinterview
Personalinterview
Onlineinterview
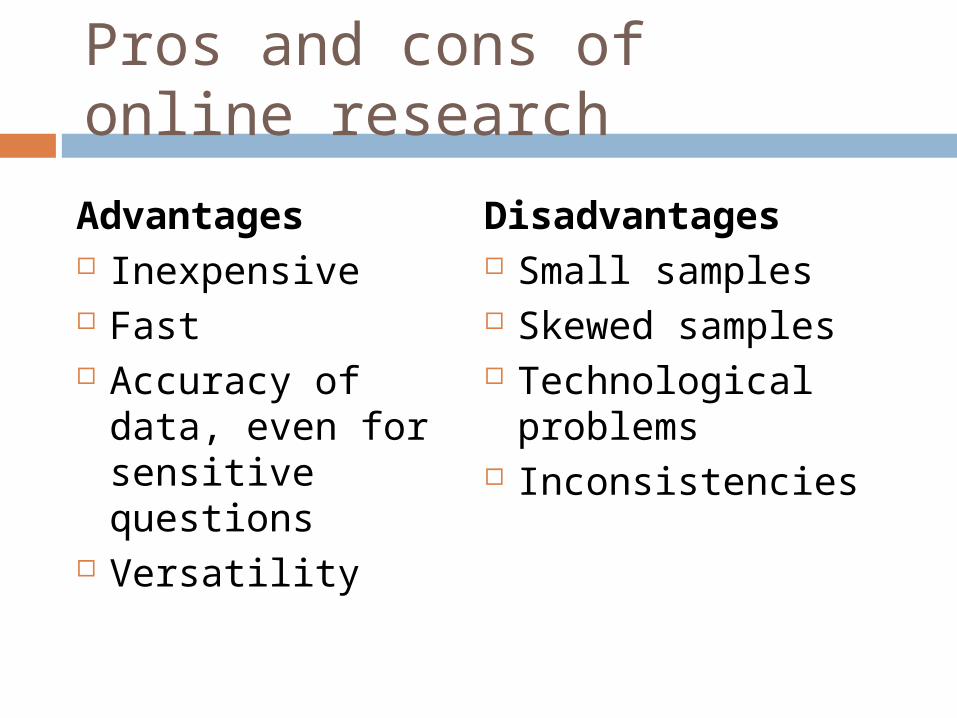
Pros and cons of online research
Advantages Inexpensive Fast Accuracy of data,
even for sensitive questions
Versatility
Disadvantages Small samples Skewed samples Technological
problems Inconsistencies
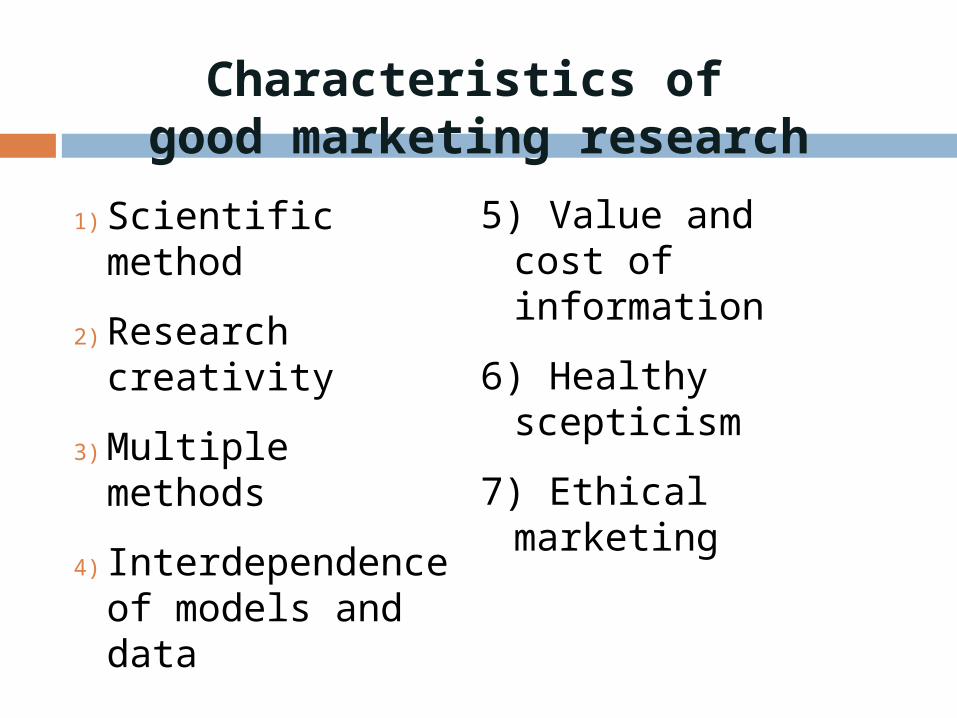
1) Scientific method
2) Research creativity
3) Multiple methods
4) Interdependence of models and data
5) Value and cost of information
6) Healthy scepticism
7) Ethical marketing
Characteristics of good marketing research

Barriers to the use of marketing research
Narrow conception of research
Uneven calibre of researchers
Poor framing of the problem
Late and occasionally erroneous findings
Personality and presentational differences


Slide 15.23
Kotler, Keller, Brady, Goodman and Hansen, Marketing Management, 1st Edition © Pearson Education Limited 2009
The measures of market demand

Slide 15.24
Kotler, Keller, Brady, Goodman and Hansen, Marketing Management, 1st Edition © Pearson Education Limited 2009
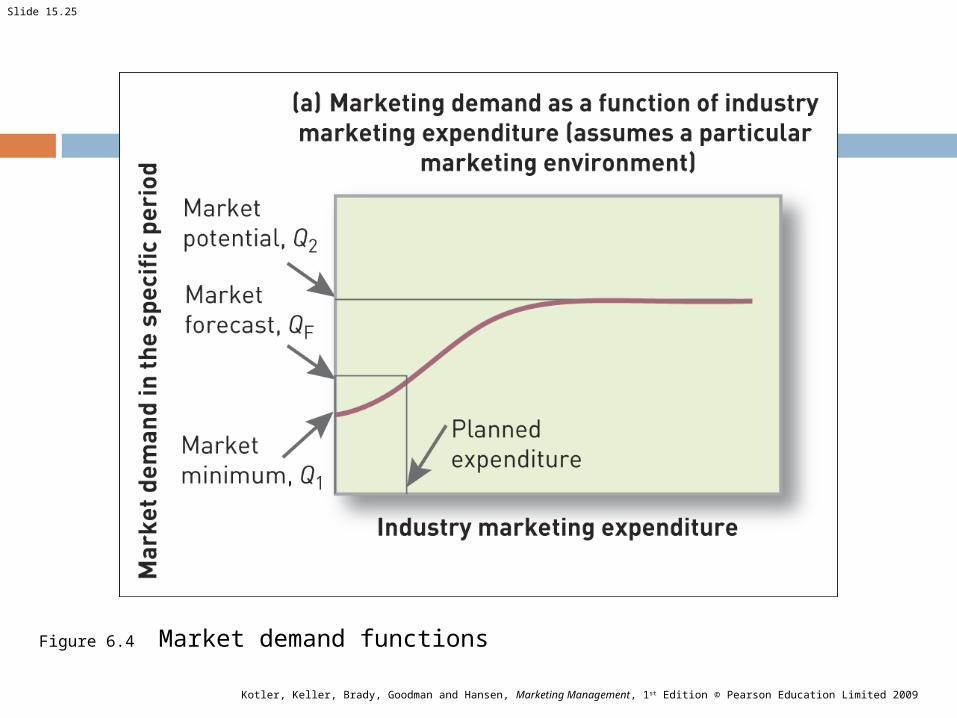
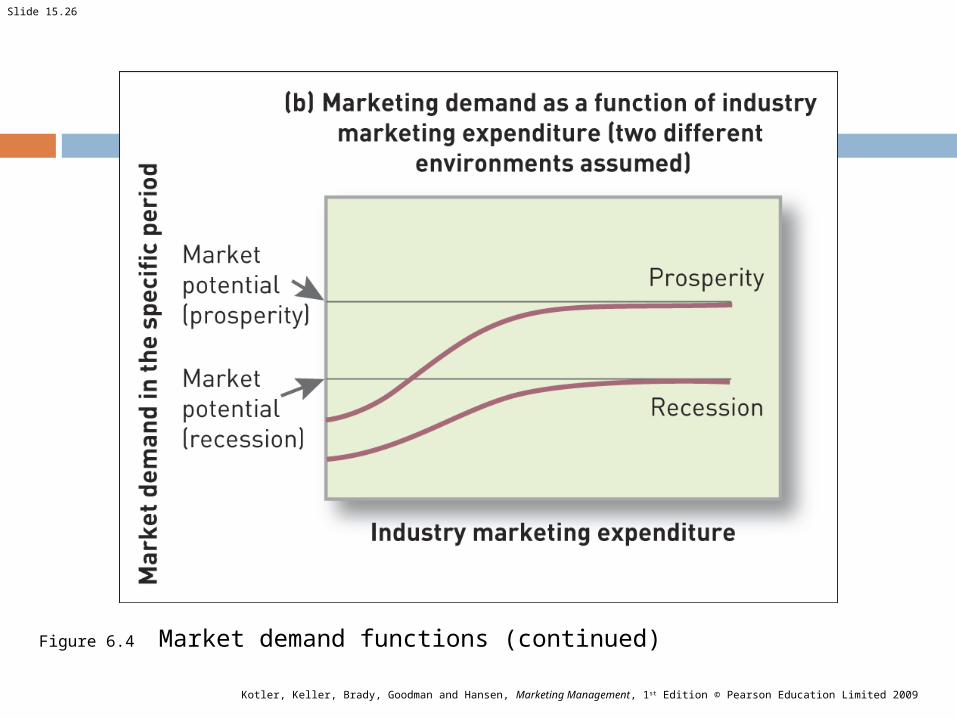
Market demand = total volume that would be bought by a customer group, in a particular time period, in a marketing environment, under marketing program
Market forecast = market demand corresponding to a certain level of marketing expenditure
Primary demand = total volume demanded by customers for a product category
Secondary demand = total volume demanded by customers for a specific brand or product
Slide 15.25
Kotler, Keller, Brady, Goodman and Hansen, Marketing Management, 1st Edition © Pearson Education Limited 2009
Figure 6.4 Market demand functions
Slide 15.26
Kotler, Keller, Brady, Goodman and Hansen, Marketing Management, 1st Edition © Pearson Education Limited 2009
Figure 6.4 Market demand functions (continued)

Slide 15.27
Kotler, Keller, Brady, Goodman and Hansen, Marketing Management, 1st Edition © Pearson Education Limited 2009
Unit vs. Dollar Share in USRazor Blades

Slide 15.28
Kotler, Keller, Brady, Goodman and Hansen, Marketing Management, 1st Edition © Pearson Education Limited 2009
How can we estimate current demand?
Total market potential
Area market potential Market buildup method
Potential buyers x potential purchases Multiple-factor index method
Population, Income, Physicians, Retail sales
Slide 15.29
Kotler, Keller, Brady, Goodman and Hansen, Marketing Management, 1st Edition © Pearson Education Limited 2009
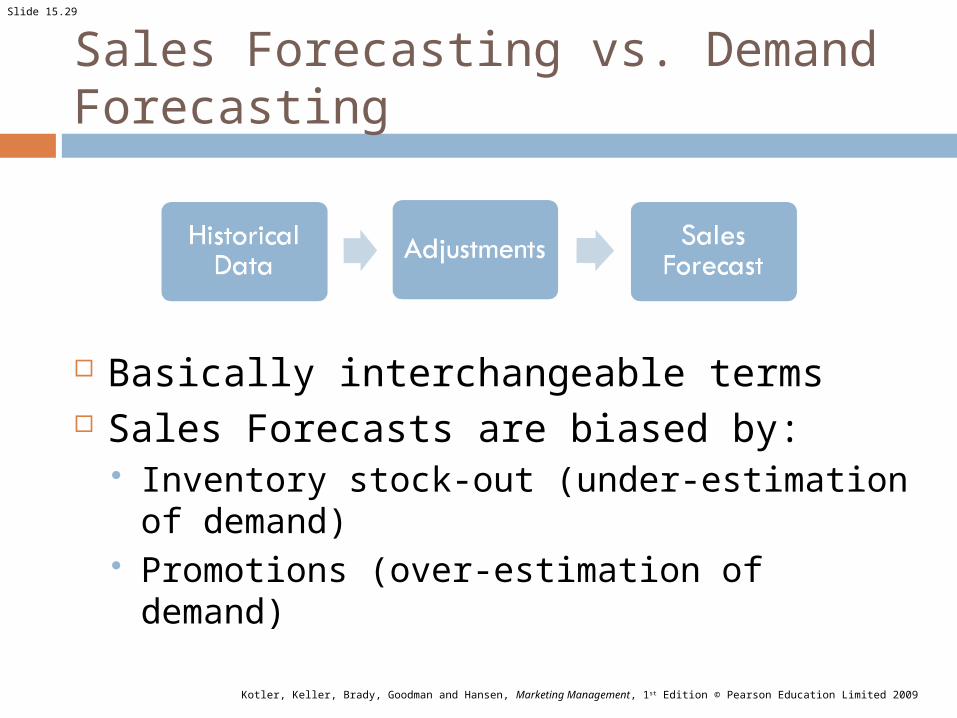
Sales Forecasting vs. Demand Forecasting
Basically interchangeable terms Sales Forecasts are biased by:
Inventory stock-out (under-estimation of demand)
Promotions (over-estimation of demand)
Slide 15.30
Kotler, Keller, Brady, Goodman and Hansen, Marketing Management, 1st Edition © Pearson Education Limited 2009
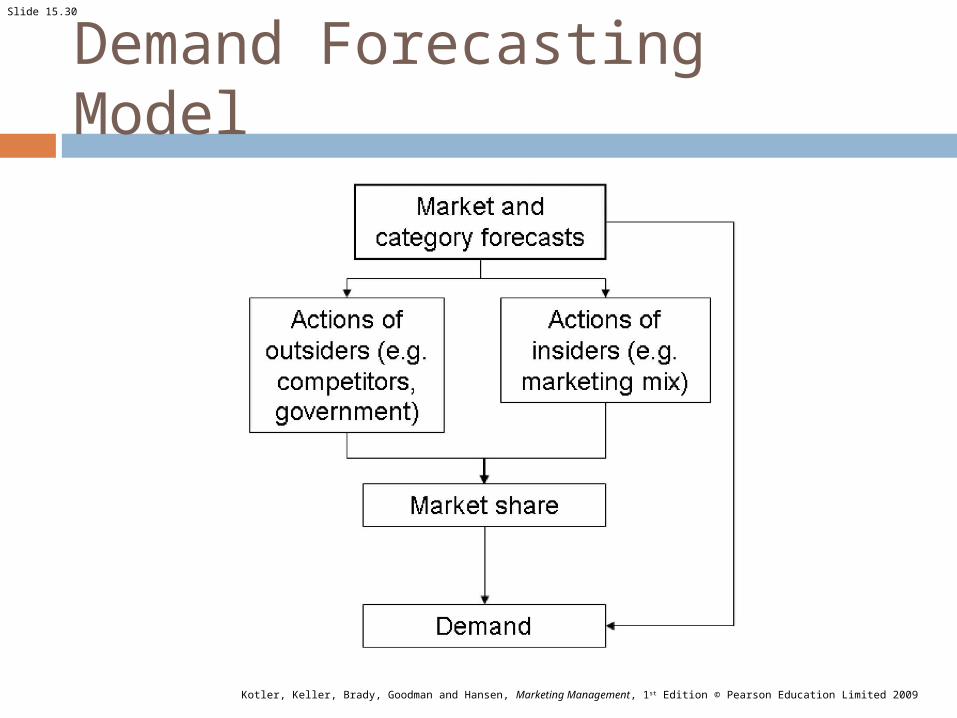
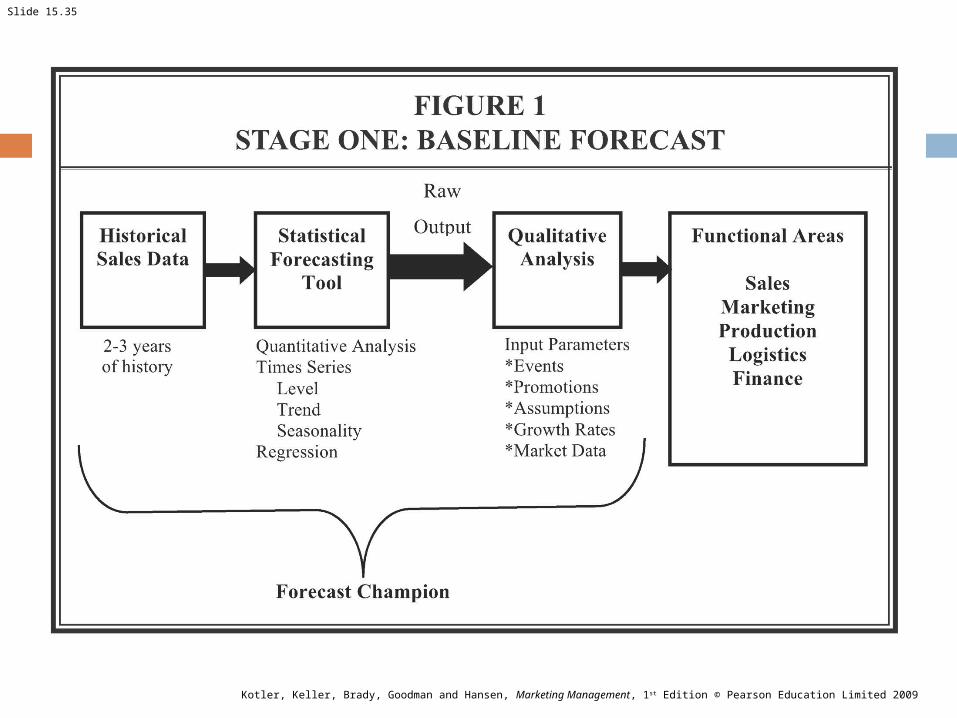
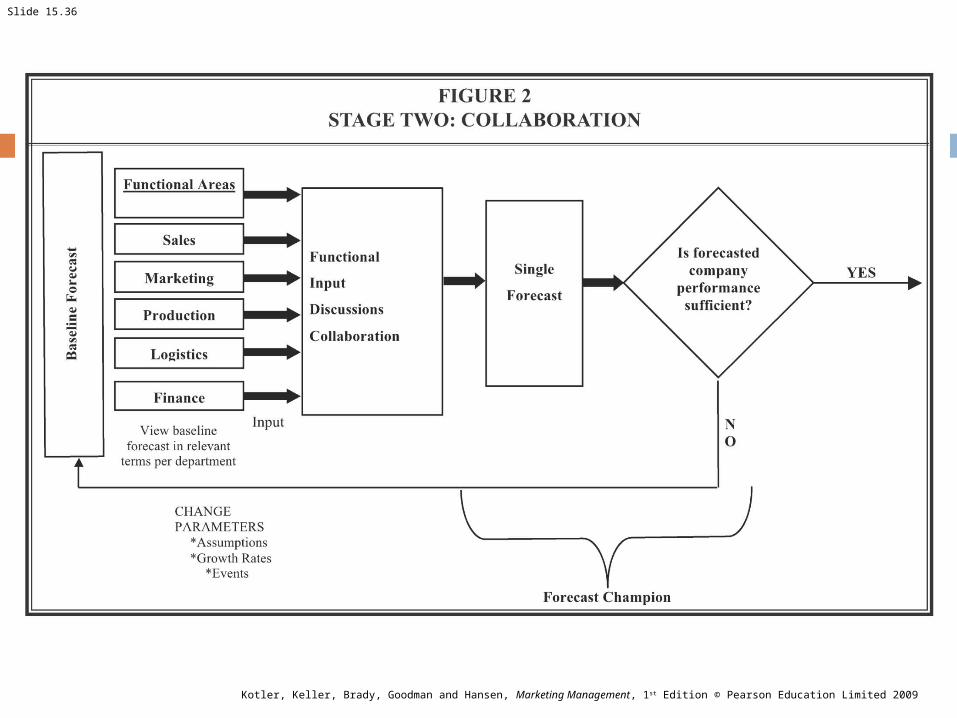
Demand Forecasting Model

Slide 15.31
Kotler, Keller, Brady, Goodman and Hansen, Marketing Management, 1st Edition © Pearson Education Limited 2009

Slide 15.32
Kotler, Keller, Brady, Goodman and Hansen, Marketing Management, 1st Edition © Pearson Education Limited 2009
Mathematical
Time Series Exponential Smoothing Statistical Demand Analysis Econometric Analysis
Slide 15.33
Kotler, Keller, Brady, Goodman and Hansen, Marketing Management, 1st Edition © Pearson Education Limited 2009
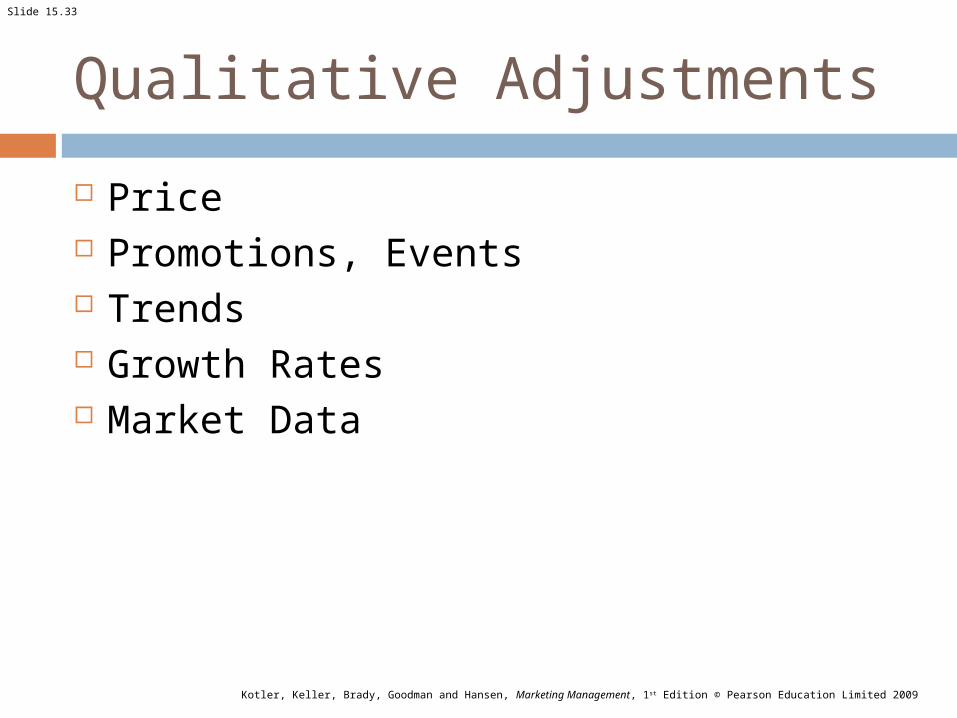
Qualitative Adjustments
Price Promotions, Events Trends Growth Rates Market Data

Slide 15.34
Kotler, Keller, Brady, Goodman and Hansen, Marketing Management, 1st Edition © Pearson Education Limited 2009
Non-mathmatical
Group discussion (Consensus) Pooled individual estimates Delphi technique Jury of executive opinion Composite of sales force opinion
(Rollup) Analogy
Customer surveys Test marketing
Slide 15.35
Kotler, Keller, Brady, Goodman and Hansen, Marketing Management, 1st Edition © Pearson Education Limited 2009
Slide 15.36
Kotler, Keller, Brady, Goodman and Hansen, Marketing Management, 1st Edition © Pearson Education Limited 2009

Slide 15.37
Kotler, Keller, Brady, Goodman and Hansen, Marketing Management, 1st Edition © Pearson Education Limited 2009

Slide 15.38
Kotler, Keller, Brady, Goodman and Hansen, Marketing Management, 1st Edition © Pearson Education Limited 2009
Look for S Curves Inflection points 20 years: “Never mistake a clear
view for a short distance” Look for indicators
“The future’s already arrived. It’s just not evenly distributed yet.” William Gibson
Black Swans What do we really know? Turkey example. Open Minded, Skeptical, History Jumps
Slide 15.39
Kotler, Keller, Brady, Goodman and Hansen, Marketing Management, 1st Edition © Pearson Education Limited 2009
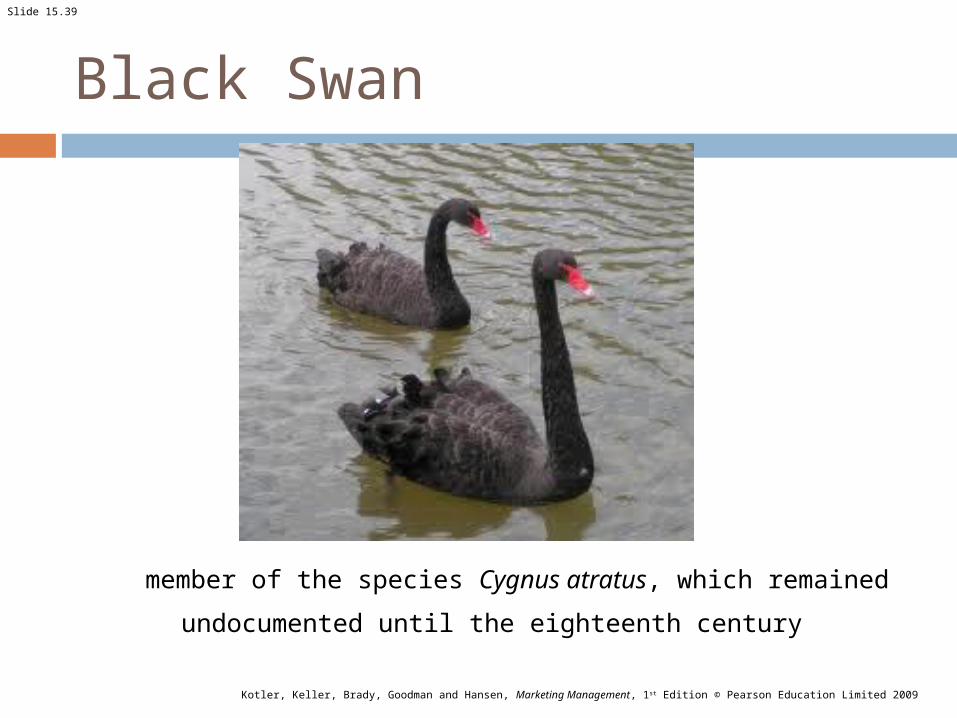
Black Swan
member of the species Cygnus atratus, which remained
undocumented until the eighteenth century

Slide 15.40
Kotler, Keller, Brady, Goodman and Hansen, Marketing Management, 1st Edition © Pearson Education Limited 2009
Taleb – The Black Swan
Mediorcistan vs. Extermistan Average (weight vs. income) of 1000 ppl.
Mistake map for territory Platonification – overvaluation of factual
information and creation of categories “absence of evidence vs. evidence of
absence” Precisely wrong (narrow model with
precise assumptions) or broadly right (across broad set of eventualities)