SERS studies of explosive molecules with diverse copper … · 2015-12-23 · Research Article Adv....
8
Research Article Adv. Mater. Lett. 2015, 6(12), 1073-1080 Advanced Materials Letters Adv. Mater. Lett. 2015, 6(12), 1073-1080 Copyright © 2015 VBRI Press www.amlett.com, www.vbripress.com/aml, DOI: 10.5185/amlett.2015.6007 Published online by the VBRI Press in 2015 SERS studies of explosive molecules with diverse copper nanostructures fabricated using ultrafast laser ablation Hamad Syed 1,2 , G. Krishna Podagatlapalli 2 , M. A. Mohiddon 3 , Venugopal Rao Soma 2* 1 School of Physics, University of Hyderabad, Prof. C.R. Rao Road, Gachibowli, Hyderabad 500046, India 2 Advanced Center of Research in High Energy Materials (ACRHEM), University of Hyderabad, Prof. C.R. Rao Road, Gachibowli, Hyderabad 500046, India 3 National Institute of Technology Andhra Pradesh, Tadepalligudem, Andhra Pradesh 534101, India * Corresponding author. Tel: (+91) 040-23138811; E-mail: [email protected] Received: 13 June 2015, Revised: 25 October 2015 and Accepted: 04 November 2015 ABSTRACT We report the fabrication and application of ultra-short pulse laser induced nanostructures (NSs) on copper surface accomplished with different pulse energies and number of pulses. The shapes and sizes of NSs have been evaluated from the field emission scanning electron microscopy (FESEM) data which illustrated different ablation mechanisms in picosecond (ps) and femtosecond (fs) domains. The Cu NSs generated with ps pulses demonstrated Raman enhancements upto ~10 5 -10 8 in the case of the explosive molecules of 1,1-diamino-2,2-dinitroethene (FOX-7), 5 Amino, 3-nitro,1,3,5-nitrozole (ANTA) and 2,4,6,8,10,12-Hexanitro-2,4,6,8,10,12-hexaazaisowurtzitane (CL-20). The SERS studies were repeated two more times on the same substrate following a simple cleaning procedure. We achieved considerable enhancement factors (of >10 5 ) for the Raman modes of an explosive molecule of FOX-7 on fs laser fabricated Cu NSs. Copyright © 2015 VBRI Press. Keywords: Laser ablation; picosecond; femtosecond; explosives detection; SERS. Introduction The inherent weak Raman scattering cross-section of any molecule can be comprehensively enhanced by introducing surface effects resulting from plasmonic nanomaterials (NMs) placed in their vicinity. This effect is called as surface enhanced Raman scattering (SERS) [1-5]. SERS has been proved to be one of the most proficient techniques for detection of trace level organic [6], biological [7, 8], explosive molecules such as RDX (1, 3, 6-trinitroperhydro- 1, 3, 5-triazine) and TNT (trinitrotoluene) [6, 7-13], Rhodamine 6G, crystal violet, and bacteria etc. Detection of explosive molecules in trace amounts is a challenging task in present times with no single technique capable of unambiguous and rapid detection. Fox-7 a derivative of DADNE (1,1-diamino-2,2-dinitroethene; a high explosive), ANTA (5-amino-3-nitro-l,2,4-triazole, an insensitive high explosive), and CL-20 (2,4,6,8,10,12-Hexanitro- 2,4,6,8,10,12- hexaazaisowurtzitane; a nitramine explosive) are some of the explosive molecules with potential use in propellant and military applications. It is important to contrive techniques which can rapidly detect such molecules (and similar ones) and in very low concentrations (nanomolar or even lower). Over the last few years SERS has been successfully utilized to detect even attomolar concentration of analyte molecules (including a few explosive molecules) with fairly high reproducibility. This was possible with development of novel SERS substrates using a variety of physical and chemical methods. However, there are several main challenges that need to be addressed before this technique is used for routine analysis like other spectroscopic techniques. Specifically the scientific community should address the challenges of (a) preparation of large area substrates using low-cost procedures (b) uniformity and reproducibility of the nanostructures resulting in uniform enhancements (c) recyclable nanostructures for number of analyte detection (d) demonstrate large enhancements for most of the analyte molecules on single substrate etc. Though this technique is not capable of stand-off detection, it is advantageous for the samples with extremely low concentration can be analyzed rapidly. Such techniques find applications where sufficient time is available for analysis of the samples of interest. Plasmonic metals such as Ag, Au and Cu in the form of colloids, dried colloids on plain substrates and nanostructures have been utilized for SERS measurements since they can support different types of surface plasmons [14-17]. For example, Mishra et al. [15] studied Au as plasmonic metal along with ZnO and achieved significant enhancement in the Raman signal for C 70 molecules.
Transcript of SERS studies of explosive molecules with diverse copper … · 2015-12-23 · Research Article Adv....

Research Article Adv. Mater. Lett. 2015, 6(12), 1073-1080 Advanced Materials Letters
Adv. Mater. Lett. 2015, 6(12), 1073-1080 Copyright © 2015 VBRI Press
www.amlett.com, www.vbripress.com/aml, DOI: 10.5185/amlett.2015.6007 Published online by the VBRI Press in 2015
SERS studies of explosive molecules with diverse copper nanostructures fabricated using ultrafast laser ablation
Hamad Syed1,2 , G. Krishna Podagatlapalli2, M. A. Mohiddon3, Venugopal Rao Soma2*
1School of Physics, University of Hyderabad, Prof. C.R. Rao Road, Gachibowli, Hyderabad 500046, India
2Advanced Center of Research in High Energy Materials (ACRHEM), University of Hyderabad, Prof. C.R. Rao Road,
Gachibowli, Hyderabad 500046, India 3National Institute of Technology Andhra Pradesh, Tadepalligudem, Andhra Pradesh 534101, India
*Corresponding author. Tel: (+91) 040-23138811; E-mail: [email protected]
Received: 13 June 2015, Revised: 25 October 2015 and Accepted: 04 November 2015
ABSTRACT
We report the fabrication and application of ultra-short pulse laser induced nanostructures (NSs) on copper surface
accomplished with different pulse energies and number of pulses. The shapes and sizes of NSs have been evaluated from the
field emission scanning electron microscopy (FESEM) data which illustrated different ablation mechanisms in picosecond (ps)
and femtosecond (fs) domains. The Cu NSs generated with ps pulses demonstrated Raman enhancements upto ~105-10
8 in the
case of the explosive molecules of 1,1-diamino-2,2-dinitroethene (FOX-7), 5 Amino, 3-nitro,1,3,5-nitrozole (ANTA) and
2,4,6,8,10,12-Hexanitro-2,4,6,8,10,12-hexaazaisowurtzitane (CL-20). The SERS studies were repeated two more times on the
same substrate following a simple cleaning procedure. We achieved considerable enhancement factors (of >105) for the Raman
modes of an explosive molecule of FOX-7 on fs laser fabricated Cu NSs. Copyright © 2015 VBRI Press.
Keywords: Laser ablation; picosecond; femtosecond; explosives detection; SERS.
Introduction
The inherent weak Raman scattering cross-section of any
molecule can be comprehensively enhanced by introducing
surface effects resulting from plasmonic nanomaterials
(NMs) placed in their vicinity. This effect is called as
surface enhanced Raman scattering (SERS) [1-5]. SERS
has been proved to be one of the most proficient techniques
for detection of trace level organic [6], biological [7, 8],
explosive molecules such as RDX (1, 3, 6-trinitroperhydro-
1, 3, 5-triazine) and TNT (trinitrotoluene) [6, 7-13],
Rhodamine 6G, crystal violet, and bacteria etc. Detection
of explosive molecules in trace amounts is a challenging
task in present times with no single technique capable of
unambiguous and rapid detection. Fox-7 a derivative of
DADNE (1,1-diamino-2,2-dinitroethene; a high explosive),
ANTA (5-amino-3-nitro-l,2,4-triazole, an insensitive high
explosive), and CL-20 (2,4,6,8,10,12-Hexanitro-
2,4,6,8,10,12- hexaazaisowurtzitane; a nitramine explosive)
are some of the explosive molecules with potential use in
propellant and military applications. It is important to
contrive techniques which can rapidly detect such
molecules (and similar ones) and in very low
concentrations (nanomolar or even lower). Over the last
few years SERS has been successfully utilized to detect
even attomolar concentration of analyte molecules
(including a few explosive molecules) with fairly high
reproducibility. This was possible with development of
novel SERS substrates using a variety of physical and
chemical methods. However, there are several main
challenges that need to be addressed before this technique
is used for routine analysis like other spectroscopic
techniques. Specifically the scientific community should
address the challenges of (a) preparation of large area
substrates using low-cost procedures (b) uniformity and
reproducibility of the nanostructures resulting in uniform
enhancements (c) recyclable nanostructures for number of
analyte detection (d) demonstrate large enhancements for
most of the analyte molecules on single substrate etc.
Though this technique is not capable of stand-off detection,
it is advantageous for the samples with extremely low
concentration can be analyzed rapidly. Such techniques
find applications where sufficient time is available for
analysis of the samples of interest.
Plasmonic metals such as Ag, Au and Cu in the form of
colloids, dried colloids on plain substrates and
nanostructures have been utilized for SERS measurements
since they can support different types of surface plasmons
[14-17]. For example, Mishra et al. [15] studied Au as
plasmonic metal along with ZnO and achieved significant
enhancement in the Raman signal for C70 molecules.
Syed et al.
Adv. Mater. Lett. 2015, 6(12), 1073-1080 Copyright © 2015 VBRI Press 1074
Mishra et al. [17] again used silver nanocup-type structures
for SERS studies of C70 molecules. In SERS, any analyte
molecule in the neighborhood of NMs experiences the
enhanced local field through the excitation of surface
plasmons resulting in a large Raman scattering signal from
the molecule. This is termed as electromagnetic
enhancement and the enhancement factor is dependent on
fourth power of local electromagnetic field [18] produced
by oscillations of electric dipole at resonance condition.
The enhancement is mediated through complex dielectric
function with negative real part (provides induced
polarization under the effect of incident electromagnetic
field) and very less but significant positive imaginary part
(provides the absorption of the light by material). Different
plasmonic material nanoparticles (NPs) architectures,
roughened nanostructures (NSs), laser induced periodic
surface structures (LIPSS) have been demonstrated to
contribute towards Raman enhancements [6, 11-13].
Ultrafast laser ablation in liquid media (ULAL) is a
unique processing technique to efficiently fabricate the
plasmonic NMs [19-22] supporting localized surface
plasmons (LSPs), propagating surface plasmons or both.
Yang’s group [23-25] had pioneered the technique of
nanosecond laser ablation in liquids. Some of the previous
works [26-32] projected a few feasible mechanisms for the
fabrication of random NSs and LIPSS (with period of
nearly half the laser wavelength) in metals achieved
through ps/fs laser ablation. Skolski et al. [33] reported the
experimental and theoretical investigation on the formation
of high/low spatial frequency LIPSS (HSFL/LSFL) on
metals using ultrafast lasers. Huang et al. [34] investigated
the mechanisms on the formation of sub-wavelength
nanoripples on solid surfaces and demonstrated that target
surface ablated by ultrashort laser pulses at damage
threshold fluence should act as metal. Derrien et al. [35]
explored the mechanisms of ripple formation on Si
achieved using fs pulses and evaluated the role of excited
free carriers density. Recently, our group [36] had observed
that complex refractive index and conduction band electron
density played a crucial role in determining the periodicity
of HSFL. Several authors [30, 37] have investigated the
intrinsic mechanisms of laser induced periodic surface
nanostructure formation in Au, Ag and Cu, demonstrating
that the Cu is a suitable metal permitting the formation of
LIPSS compared to Ag and Au. The following reasons
could be envisaged for the efficient formation of LIPSS on
Cu surface (a) the probability of interference between
surface polariton wave (ksp) and incident wave (kin) is
higher for Cu [ksp/kin ~1] (b) Cu demonstrated a large
electron-phonon coupling constant (γ) value (1×10¹⁷
) in
comparison with Ag (0.36×10¹⁷
) and Au (0.21×10¹⁷
) since
the electron-phonon sub system is compatible for
generating a non-uniform heat or energy distribution
spatially, resulting in the production of LIPSS [37]. In
previous reports the phenomena were discussed for
ablation performed in air/vacuum whereas in the present
work we carried out ablation in liquid media. In one of our
earlier works [11] we had reported the fabrication of Cu
NSs in diverse liquid media using picosecond (ps) pulses
and achieved significant Raman enhancements from the
substrates thus prepared. The ablation phenomena,
especially in the presence of a liquid medium, is an
extremely complicated process depending extensively on
various parameters such as (i) input pulse duration (ii)
input pulse energy (iii) wavelength of excitation (iv) the
number of input pulses (v) surrounding liquid (refractive
index, viscosity, etc.) (vi) focusing conditions
(Gaussian/Bessel; normal focusing versus cylindrical
focusing) (vii) beam quality (Gaussian, top-hat etc.) (viii)
static/scanning ablation etc. Some of these parameters have
been investigated in our earlier works [6, 12, 13, 19-21]. It
is imperative to investigate the effect of all these
parameters on the ablation products and their application in
SERS studies to arrive at optimized and efficient substrates
for trace molecule detection. In the present work we
present results from our detailed studies of (a) the effect of
input pulse energy on the morphology of Cu targets ablated
in acetonitrile (ACN) using picosecond (ps) pulses (b)
SERS studies of an explosive molecule FOX-7 using
different Cu NSs prepared using ultra short laser pulses (c)
re-utilization of substrates to detect different explosive
molecules such as ANTA and CL-20 subsequent to the
SERS studies performed on ANTA (d) investigation of the
influence of number of pulses (incubation effects) on
fabrication of Cu NSs in acetone using femtosecond (fs)
pulses (e) demonstration of recyclable nature of the Cu NSs
prepared by fs pulses through the SERS studies of FOX-7
and Rhodamine 6G (Rh6G) molecules.
Experimental
The ps/fs ablation studies were performed using a 1 kHz
chirped pulse amplified Ti: sapphire laser system
(Coherent) delivering nearly bandwidth limited laser pulses
(~2 ps/~40 fs) at 800 nm. The amplifier was seeded with
~15 fs (typically 50-55 nm FWHM) pulses from an
oscillator (MICRA, Coherent, 1 W, 80 MHz, 800 nm).
Complete details of the experiments were reported in our
earlier articles [6, 38, 39]. The initial laser beam diameter
in the ps case was ~8 mm and was focused with 25 cm
focal length lens on the surface of Cu substrate placed in
ACN. Typical pulse energies of 25–400 μJ were utilized.
Input energy was controlled by the combination of
Brewster angle polarizer and a half wave plate. The target
was placed normal to the laser beam on a three dimensional
motorized stage [Nano-direct] with resolution of ~25 nm
and was controlled by a controller interfaced to a PC.
Duration of each scan was fixed to ~30 minutes and line to
line spacing was ~50 µm. To avoid ambiguity fabricated
Cu substrates in ACN were designated as CuS-25, CuS-50,
CuS-100, CuS-200, CuS-300 and CuS-400 for structures
created using pulse energies of ~25, ~50, ~100, ~200, ~300
and ~400 μJ, respectively. Additionally, we have
investigated the development of laser induced surface
nanostructures on the metal target by varying the speeds
(400, 300, 200, 100 and 50 µm/s) in the fs case. The beam
diameter (20) estimated on the target in acetone was ~90
μm. The typical level of liquid above the target surface was
~5 mm. The laser beam was focused perpendicularly on Cu
plate which was immersed in acetone and Cu plate was
positioned on a motorized Nano direct X-Y stage, which
was operated through a controller (NTS-25). Typical

Research Article Adv. Mater. Lett. 2015, 6(12), 1073-1080 Advanced Materials Letters
Adv. Mater. Lett. 2015, 6(12), 1073-1080 Copyright © 2015 VBRI Press
fluence used was ~2.5 J/cm2. The number of pulses
incident on the target was controlled by varying the speeds
of X-Y stages and line-line spacing was ~25 µm. The
estimated number of pulses per spot in the focal region
[w(z)/d] w.r.t. scanning speeds were ~253, ~300, ~500,
~1000 and ~2000 (threshold fluences of ~0.98, ~0.95,
~0.89, ~0.81 and 0.74 J/cm2) for the scanning speeds of
400, 300, 200, 100 and 50 µm/s, respectively. The surface
morphology of ablated targets was characterized by
FESEM. The surface roughness was measured using a
surface profilometer.
Results and discussion
Effects of pulse energy on Cu NSs in ACN prepared by ps
pulses and SERS studies
The surface morphology of Cu substrates was characterized
by FESEM [Ultra 55 from Carl ZEISS instrument]
technique. Fig. 1 illustrates the FESEM images of formed
surface nanostructures obtained by ps laser ablation of Cu
targets with different energies (a) CuS-25 (b) CuS-50 (c)
CuS-100 (d) CuS-200 (e) CuS-300 and (f) CuS-400. We
observed random structures at lower input energies (25-100
μJ) whereas LIPSS with different periodicity were
observed at higher input energies (200-400 μJ) and was
confirmed from the FESEM images.
Fig. 1. FESEM images of surface nanostructures were fabricated on Cu
substrate by ps ablation of bulk Cu in ACN (a) CuS-25 (b) CuS-50 (c)
CuS-100 (d) CuS-200 (e) CuS-300 and (f) CuS-400. The scale bar is 200
nm in all the pictures.
To understand and explain the formation of LIPSS on
Cu we considered the dynamics in processes of laser
interaction with metals which are related to the electron-
lattice system. When the ps pulses interact with Cu free
electrons in the metal surface absorb laser pulse energy
through inverse Bremsstrahlung and generate surface
electromagnetic field. Due to the interaction of incident
laser pulse with the generated surface electro-magnetic
field, energy can be distributed non-uniformly along the
metal surface. This non-uniformly distributed energy can
be coupled to electrons and allowed to form electron
temperature distribution with a periodic nature.
Consequently, the hot electrons couple to lattice and get
relax (~1 ps) while transferring the energy to lattice system.
The lattice reorganizes itself at the melting state and is
followed by re-solidification. Due to the electron–phonon
interactions this ephemeral, two different temperature
systems will have a tendency to attain equilibrium
temperature within few ps. These electron–phonon
interactions can be defined by electron-phonon coupling
constant. Therefore, two-temperature model is generally
utilized to demonstrate thermal phenomena in the case of
ultrafast laser matter attraction. The growth of LIPSS can
be demonstrated on the basis of electron-phonon coupling
constant (γ) [37]. It was confirmed that the electron-phonon
coupling constant is directly related the electron and lattice
temperatures, and these temperatures in turn depend on the
fluence incident on the target surface. The input laser
fluence should be more than the ablation threshold fluence
that could melt the sample surface to generate periodic
structures and the earlier reported ablation threshold
fluence for Cu was 1.7±0.2 J/cm2 [40]. Following some of
the previous reports we understand that the shape of the
periodic surface structures change with respect to laser
fluence and number of pulses. To explore the fluence effect
on the development of the LIPSS on Cu target surface, the
evaluation of effective spot size on the Cu target surface for
various input laser energies was performed. Laser
machined single lines were drawn on Cu target surface and
the width of the lines were taken as effective beam
diameters of laser beam as suggested by Barcikowski et al.
[41]. The FESEM characterization validated the differences
observed in the estimated spot sizes of ~65, ~87, ~112,
~130, ~170, ~190 µm for input energies of ~25, ~50, ~100,
~200, ~300, ~400 µJ. From the measured spot diameters on
the targets, effective number of pulses overlapping within a
spot and separation between the lines we could confirm
that single line ablation transpired in the case of CuS-25,
CuS-50 since the line separation was 60 µm and double
line ablation ensued on CuS-100, CuS-200, where the line
separation was almost half compared to the spot on target.
We could confirm from our experimental results that
periodic patterns were not observed on the Cu surface in
the cases of Cu-25, Cu-50 and Cu-100 (Fig. 1(a-c)) since
the estimated effective input fluences were less than the
ablation threshold fluence of (1.7±0.3 J/cm2) and the
surface r.m.s. roughness (measured separately using a
surface profilometer) was found to be ~0.8 µm, ~2.7 µm
and ~3.6 µm, respectively. Comparatively, the periodic
pattern, spread over a small area and less evident, in the
case of Cu-200 (Fig. 1(d)) was formed due to a pulse train
of ~866 shots at a fluence of ~3 J/cm2. In the cases of Cu-
300 and Cu-400 (Fig. 1(e, f)), LIPSS on Cu surfaces were
expanded and more pronounced at fluences of ~2.67 J/cm2
(~1700 shots), ~2.82 J/cm2 (~1900 shots), respectively. The

Syed et al.
Adv. Mater. Lett. 2015, 6(12), 1073-1080 Copyright © 2015 VBRI Press 1076
measured periodicity of LIPSS for Cu-200, Cu-300 and
Cu-400 were ~430 nm, ~420 nm and ~470 nm, and surface
r.m.s. roughness was measured to be ~2.6 µm, ~2.4 µm and
~ 1.8 µm, respectively. From the observed data of surface
r.m.s. roughness it was concluded that at low input fluence
ablation was good and at higher fluences ablation
efficiency was decreased. From our knowledge and
previous reports we believe that electrons might not
transfer the energy to lattice before the expiration of the
periodic distribution of electron temperature with a pulse
train of fewer shots (input fluence ≤ threshold fluence) due
to the active participation of the electron diffusion
phenomenon. Therefore, less coupling could have taken
place between the electron and lattice, and consequently,
resulting in a lower γ value [37]. However, non-uniform
surface heat distribution cannot occur at this position which
may not produce periodic surface structures on the surface.
In the case of more effective number of pulses (input
fluence >threshold fluence), electrons can couple to the
neighbour lattice easily to transfer the energy and
thermalization will take place between electrons and lattice
resulting in a higher γ value (~1017
) [37]. At this position,
lattice will also attain temperature profile with periodic
behaviour. Nonetheless, non-uniform heat distribution can
occur on the metal surface and, therefore, LIPSS could
have formed on the metal surface.
The fabricated structures on Cu substrates fabricated
with different pulse energies (25–400 µJ) in ACN were
utilized for SERS studies of explosive molecules at low
concentrations. Fig. 2(a) illustrates the enhanced Raman
spectra of FOX-7 molecules [13] which were adsorbed on
Cu substrates and they were allowed to dry for ~1 hour. All
the Raman spectra were recorded using a WITec Alpha 300
spectrometer and an excitation source with a wavelength of
532 nm (cw laser). The sample on the Cu NSs could be
recognized through the in-built optical microscope (with an
objective lens of 100X) and the spectra were collected by
the in-built spectrometer in the WITec instrument
simultaneously. The acquisition time used for recording
was 5 s and all spectra were calibrated using the Raman
peak of Silicon wafer at 520 cm-1
. Typically, a little drop
(~10 μl) of FOX-7 (concentration of 25 µM) was placed on
substrates to achieve a monolayer of the molecules. The
Raman spectra revealed that C-NO2 symmetrical stretch
mode corresponding to 1342 cm-1
was predominantly
elevated along with other modes. The other observed
modes were (a) symmetric NO and NH wagging mode (b)
out of layer symmetric NH wagging mode (c) C-NO2
rocking mode (d) NO and NH rocking mode (e) In-layer
asymmetric NH wagging (f) In-layer symmetric NH
wagging mode (g) C-C stretch and NH wagging (h)
Asymmetric C-NO2 stretching and NH wagging (i) Out of
layer symmetric NH wagging, NO and NH rocking, (j) C-C
symmetric +NH stretching modes and (k) NH2 bending
corresponding to 481 cm-1
, 620 cm-1
, 794 cm-1
, 858 cm-1
,
1024 cm-1
, 1065 cm-1
, 1169 cm-1
, 1205 cm-1
, 1483 cm-1
,
1520 cm-1
and 1596 cm-1
, respectively. We considered that
typically 45% of moleculeswere adsorbed on to
these Cu NS substrates. The procedure for estimating the
enhancement factors (E.F.s) was already reported in our
earlier work [11]. The estimated E.F.s for the predominant
mode of 1342 cm-1
were of 3×10⁵, 2.8×10
5, 1.9×10
5,
4.1×10⁵, 1.3×10
5 and 2.3×10
5 for CuS-25, CuS-50, CuS-
100, CuS-200, CuS-300 and CuS-400, respectively. The
obtained E.F.s was ~105 for all the 6 type of Cu NSs since
they might have produced identical local fields through the
excitation of different types of surface plasmons.
Fig. 2. SERS spectra of (a) Fox-7 adsorbed on Cu NSs fabricated through
ULAL of Cu in ACN at different pulses energies, (b) ANTA (1×10⁻⁶ M) and (c) CL-20 (5×10⁻⁶ M) adsorbed on CuS-200. Normal Raman spectrum
recorded on silicon substrate is also included in all the figures. The Raman intensity is expressed in arbitrary units (a.u.). N.R. represents normal
Raman spectrum.
We had chosen only one SERS active substrate (CuS-
200) among the 6 substrates for second measurement of
different analyte molecule since all of them demonstrated
similar performance in terms of enhancement factors.
Secondly, we had chosen ANTA molecule as our second
Research Article Adv. Mater. Lett. 2015, 6(12), 1073-1080 Advanced Materials Letters
Adv. Mater. Lett. 2015, 6(12), 1073-1080 Copyright © 2015 VBRI Press
testing sample to probe the Cu NSs after proper cleaning
within a week. Fig. 2(b) depicts the SERS spectra of
ANTA molecule [11] with a concentration of 1×10⁻⁶
M
adsorbed on Cu surface r.m.s. roughness of ~2.6 µm +
LIPSS with ~430 nm periodicity (CuS-200). The
enhancement was notable even at the concentration of
1×10⁻⁶
M and the Raman peak at 1340 cm-1
, corresponding
to the C-NO2 symmetric stretch, which is the characteristic
peak of ANTA molecule, was elevated. Along with
characteristic modes, other modes observed were near
955 cm-1
and 1130 cm-1
and those corresponding to
N4-C5-N1 bending mode and N-N symmetric stretching
mode, respectively. The other Raman modes were not
detected at these concentrations which were elevated at
higher concentrations (500 M) reported in our earlier
work [11]. It is believed that ~40 % molecules
were adsorbed on Cu NS substrate. The performance of
SERS active substrate has been evaluated by calculating
E.F.s. For achieving this, the normal Raman spectrum
intensity of ANTA (0.2 M) was compared with enhanced
Raman spectrum. The estimated E.F for the characteristic
peak of ANTA molecule at 1340 cm-1
was ~1.2×10⁸. The
large enhancement in the case of ANTA molecule could be
accredited due to huge local field attained through the
excitation of strong localized surface plasmons provided by
Cu surface with r.m.s. roughness of ~2.6 µm. Furthermore,
the substrate could have supported additional field through
the propagating surface plasmons due to LIPSS. A week
later we chose another explosive molecule (CL-20) with a
concentration of 1×10⁻⁶
M as our third analyte for
recording the SERS spectra on the same substrate (CuS-
200) following an appropriate cleaning procedure. Fig. 2(c)
depicts the enhanced Raman spectrum of CL-20 which
illustrates the most significant Raman modes [42] at 1331
cm-1
and 1372 cm-1
corresponding to the characteristic
modes (NO2 symmetric stretch) of the explosive molecule,
which are related to nitro-aromatic (or) nitramine group.
The other Raman modes significantly enhanced were at
834 cm-1
, 1055 cm-1
, 1095 cm-1
and 1277 cm-1
which
correspond to NC torsion + NO2 deformation, NC torsion +
ring torsion + NCH deformation, NN stretch + NC stretch
and NO stretch + CC torsion, respectively. It was assumed
that ~40 % molecules were adsorbed on the Cu NS
substrate. The evaluated E.F. was ~4.5×10⁵ for the 1331
cm-1
mode compared with normal Raman spectrum of CL-
20 (0.1 M).
Effects of number of pulses on Cu NSs in acetone prepared
by ~40 fs pulses and SERS studies
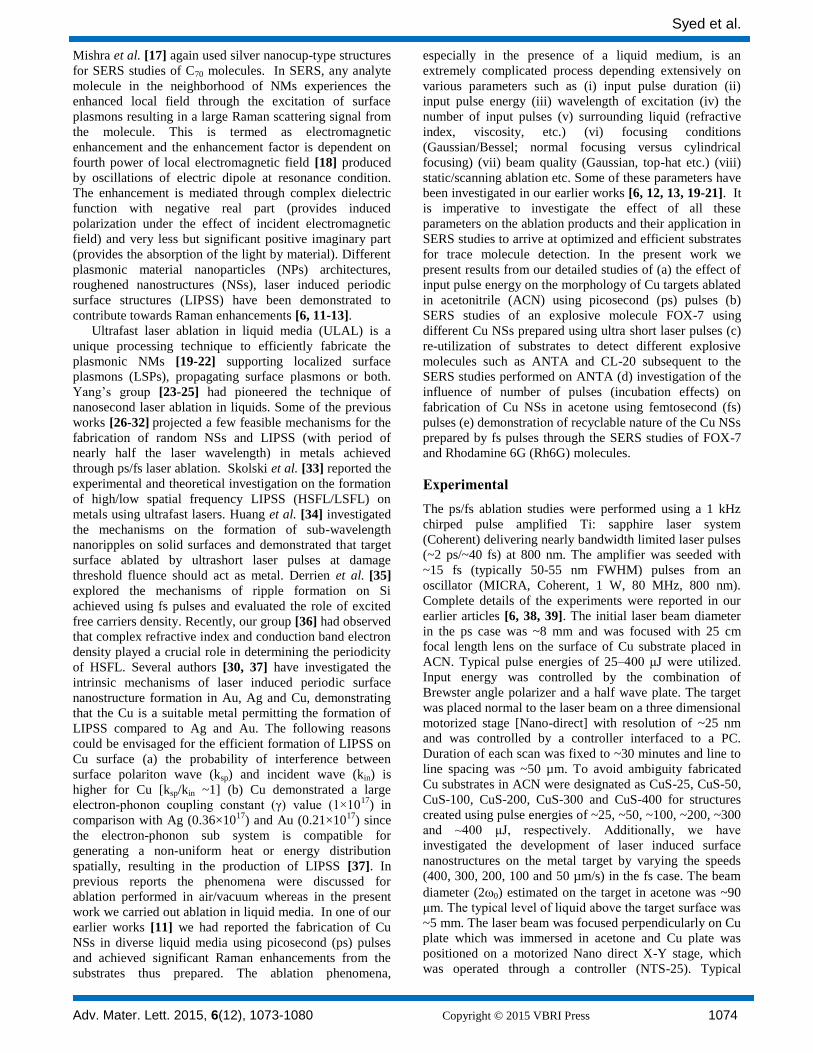
Fig. 3(a-e) demonstrate the FESEM images of NSs
fabricated on the Cu target obtained through fs ablation in
acetone with (a) N = 253 (b) N = 300 (c) N = 500 (d) N =
1000 and (e) N = 2000 number of pulses. The scale bar in
each of these images is 200 nm. These were achieved at
slightly above the threshold fluence of Cu (1.7±0.2 J/cm2)
[40]. Fig. 3(a) illustrates the random nanostructures
covering the metal surface and the estimated surface r.m.s.
roughness was found to be ~1.6 µm (N = 253 pulses).
Following the results from previous reports and our
understanding the formation of random nanostructures and
nano-cavities are tentatively ascribed to the hydro-
dynamical process occurring in the liquid media. With
increasing number of laser shots the random nano-
roughness turned sharper and heavier. The reason behind
the production of heavy and rough NSs could be due to the
large absorption by the nanoparticle grains that have been
formed by the earlier pulses. The geometrical effects also
contribute because of scattering from sharp edges of NSs.
After the ablation with N=253 pulses, the threshold fluence
of the Cu metal was reduced to ~0.98 J/cm2 (before
ablation, Fth = ~2 J/cm2) [43].
Fig. 3. FESEM images of Cu NSs obtained in acetone using fs pulses (a)
N = 253, (b) N = 300, (c) N = 500, (d) N = 1000 and (e) N = 2000 pulses.
The scale bar is 200 nm in all the pictures.
For the case of ablation with N=300 pulses, cuboids
(l ~400 nm, b ~200 nm, h ~60 nm) were produced on the
Cu surface and is evident from the data depicted in
Fig. 3(b). In this case, the input fluence of the laser pulses
(~2.5 J/cm2) was more than double the ablation threshold
(~0.98 J/cm2), and this played a significant role in the
growth mechanism. The evolution of NSs in the present
case could have taken place due to the existence of unique
locations which considerably modify the energy
distribution of subsequent interaction of laser shots with
the target and generate multiple cavitation bubbles.
Depending on the collapse of the bubbles, some of the NPs
could form clusters with larger size [26, 44] and these
clusters might have been truncated into cuboids or cubes.
The ablation threshold reached 0.95 J/cm2 after N=300
pulses. The threshold fluence of Cu target was observed to
reduce from 0.95 J/cm2 to 0.89 J/cm
2, 0.81 J/cm
2 and
0.74 J/cm2 as the pulse number increased from N = 300 to
500, 1000 and 2000 pulses, respectively [43]. Following
the ablation with N = 500 pulses (Fig. 3(c)), N=1000
pulses (Fig. 3(d)) and N=2000 pulses (Fig. 3(e)),

Syed et al.
Adv. Mater. Lett. 2015, 6(12), 1073-1080 Copyright © 2015 VBRI Press 1078
hexagonal NPs with ~125 nm size, spherical NPs with ~70
nm and random nano-roughness or nano-cavities with
mean size of ~1.8 µm were observed, respectively. As
observed from the results presented the cuboids were
modified into hexagonal structures with reduced size and
then finally changed into spherical nanoparticles.
A possible explanation could be the prominence of
fragmentation effects with increasing number of input
pulses [45]. In each of these cases the surface roughness
offered by the targets changed drastically with increasing
number of pulses and, consequently, the NSs formed were
diverse.
Additionally, the production of random nano-
cavities could be attributed to the complicated cavitation
bubble dynamics in the case of ULAL [26, 44]. The
morphology on Cu substrates (after the ablation) could be
summarized as (i) random nano-roughness with r.m.s.
value of ~1.6 µm (ii) cuboid (l ~400 nm, b ~200 nm, h ~60
nm) particles (iii) hexagonal particles with ~125 nm size
(iv) spherical particles with ~70 nm average size and (v)
random NSs with r.m.s. roughness of ~1.8 µm for a pulse
train of ~253, ~300, ~500, ~1000 and ~2000, respectively,
and they were labeled as CuNS-253, CuNS-300, CuNS-
500, CuNS-1000 and CuNS-2000, respectively for clarity.
Beyond 2000 pulses, the morphology on the substrates also
contained nanostructures, nonetheless, with lower density.
FOX-7 was considered as a probe molecule for
recording the SERS spectra. The compound was diluted
(25 µM) and then placed on Cu NSs fabricated using
different pulses numbers. A solution with 0.1 M
concentration was used as reference which was coated on a
plain silicon substrate. Subsequently, they were dried and
the Raman spectra from nanostructured Cu target and plain
Si surfaces were recorded and the obtained data is
illustrated in Fig. 4(a). It is evident from the data presented
in Fig. 4(a) that the characteristic Raman mode at 1335
cm-1
(symmetric C-NO2 stretching and NH wagging) was
observed with lower intensity in the normal Raman
spectrum along with some other modes. On the other hand,
in SERS spectra the modes were intensified (30-50 times)
which were present in normal Raman spectrum with lower
intensity. The elevated modes in SERS spectra were the
483 cm-1
(symmetric NO and NH wagging), 620 cm-1
(out
of layer symmetric NH wagging), 794 cm-1
(C-NO2
rocking), 861 cm-1
(NO and NH rocking), 1025 cm-1
(in-
layer asymmetric NH wagging), 1067 cm-1
(in-layer
symmetric NH wagging), 1169 cm-1
(C-C stretch and NH
wagging), 1205 cm-1
(asymmetric C-NO2 stretching and
NH wagging),1483 cm-1
(Out of layer symmetric NH
wagging, NO and NH rocking) and 1596 cm-1
(NH2
bending) modes. To evaluate the performance of these Cu
NSs, E.F.’s were estimated by considering the peak
intensity in the SERS spectra which was compared with the
corresponding peak intensity obtained from the normal
Raman spectra. The E.Fs calculated for a particular mode
of 1335 cm-1
were 2.0×10⁵, 3.6×10
5, 7.0×10
5, 2.8×10
5 and
2.3×10⁵ for random NSs with roughness of ~1.6 µm
(CuNS-250), cuboids with length of ~400 nm (CuNS-300),
hexagons with ~90 nm size (CuNS-500), spherical particles
with ~100 nm (CuNS-1000) and random NSs with r.m.s.
roughness of ~1.8 µm (CuNS-2000), respectively. The
estimated E.F.s was typically 105 for all the type of Cu NSs
investigated. However, the substrate with hexagonal NPs
demonstrated 2-3 times higher enhancement than substrates
containing random NSs, cuboid NPs and spherical NPs.
We believe that higher enhancement was obtained due to
(a) the intensified local electric field at sharp edges of
hexagonal NP which might act as the generators hotspots
through the excitation of localized surface plasmons and
(b) combined oscillations of surface plasmons due to sharp
edges of two hexagonal NPs could have also contributed to
the amplification of local field. Fig. 4(b) illustrates the
SERS spectra of Rh6G (5×10⁻⁶
M) recorded from ablated
Cu substrates achieved with different number of pulses
after cleaning. Following the procedures listed in earlier
reports [6, 11], the observed modes in normal Raman and
SERS spectra were assigned.
Fig. 4. SERS spectra of (a) FOX-7 (25×10-6 M) and (b) RH6G (5×10⁻⁶ M)
adsorbed on Cu NS substrates fabricated through fs ablation in acetone under the influence of pulse number at constant fluence of 2.5 J/cm2. The
Raman intensity is expressed in arbitrary units (a.u.). N.R. represents
normal Raman spectrum.
The Raman mode near 1361 cm-1
(corresponding to
aromatic C-C stretch vibration) is the characteristic mode
of Rh6G molecule. The Raman modes present at 611 cm-1
,
772 cm-1
and 1180 cm-1
correspond to C-C-C ring in-plane
bend, C-H out-of-plane bend, and C-C stretch modes,
respectively. The Raman peaks observed at 1507 cm-1
,
1572 cm-1
and 1648 cm-1
were mainly from the
contribution of aromatic C-C stretch. The estimated E.Fs
for the principal vibrational mode 1361 cm-1
were
200 nm 200 nm

Research Article Adv. Mater. Lett. 2015, 6(12), 1073-1080 Advanced Materials Letters
Adv. Mater. Lett. 2015, 6(12), 1073-1080 Copyright © 2015 VBRI Press
~3.4×10⁶, ~8.4×10
6, ~6.0×10
6, ~2.5×10
6 and ~3.2×10
6 for
CuNS-250, CuNS-300, CuNS-500, CuNS-1000 and CuNS-
2000, respectively. Among all the Cu substrates
investigated, CuNS-300 (whose surface morphology
comprised cuboids with dimensions of ‘l’ ~ 400 nm, ‘b’
~200 nm, ‘h’ ~60 nm), and CuNS-500 (possessing dimers
of hexagonal NPs) demonstrated superior enhancement
compared to other Cu NSs. Additionally, the
reproducibility of SERS measurements was high when the
sample was probed at different positions on the SERS
active Cu substrate. There are very few reports in literature
on the detection of explosives using SERS technique
[46-52], in general, and nanostructured substrates/targets,
in particular. Hakonen et al. [53], very recently, reviewed
different SERS substrates and mechanisms used for
explosives detection in security applications. They
discussed the prospects of SERS becoming an important
tool for convenient in-situ threat identification/detection
and summarized various existing SERS detection methods
and substrates with particular attention on ultra-sensitive
real-time detection.
Polavarapu et al. [54] discussed the possibilities of low-
cost flexible substrates for nanoplasmonic sensing in their
review article. Some of the important challenges all the
researchers encounter before using the deployment of
nanostructured substrates for consistently successful
detection of explosives are (a) achieving higher
enhancement factors (at least 108-10
10) with the intention of
detecting pM/fM concentrations effortlessly (b) reliably
and reproducibly create large area nanostructures using
various techniques involving lower cost and at rapid times
[55] (c) identify/understand the mechanism for
enhancements for each explosive molecule for a particular
morphology of the nanostructured target (d) implement
SERS studies with low power laser source and a hand-held
Raman spectrometer which can later be integrated to form
a compact portable device for on-field detection. Our future
studies will focus detecting pM and fM concentration
explosive molecules. To achieve this it is imperative to
thoroughly understand (a) the ablation mechanisms
performed under a variety of conditions [56-58] and (b) the
interaction mechanism of the nanostructures with the
analyte molecules enabling the preparation of efficient
substrates.
Conclusion
In summary, we have investigated the surface
morphologies of Cu NSs such as LIPSS, nano-roughness
along with formation of NPs with different shapes in ps
laser ablated Cu targets in acetonitrile. The structures were
fabricated with varying pulse energies and pulse numbers
using ps and fs pulse ablation of Cu in liquid media. In the
ps domain the heat diffusion of electrons in the Cu target
resulted in the formation of large area LIPSS. The trace
level detection of an explosive molecule FOX-7 from Cu
NSs, fabricated with different pulse energies, was studied
using the SERS technique. Estimated E.F.s for the
enhancements for various Raman modes of FOX-7
(25 μM) were ~105 for all the substrates. SERS studies of
ANTA and CL-20 molecules were also performed on
recycled CuS-200 target revealing a large enhancement
(E.F.s of 105–10
8). Additionally, Cu NS obtained with
different pulse numbers in fs domain were also utilized for
SERS studies of a FOX-7 molecule along with Rh6G
molecule separately after subjecting the substrates to
appropriate cleaning procedure and achieved enhancement
factors of >105.
Acknowledgements Authors acknowledge DRDO, India for continuous financial support and
UPE-II, University of Hyderabad for partial financial support.
Author contributions Conceived the plan: SVR; Performed the expeirments: SH, GKP, AMM; Data analysis: SH, GKP, AMM; Wrote the paper: SH, GKP, SVR.
Authors have no competing financial interests.
Reference
1. Nie, S.; Emory, S. R; Science, 1997, 275, 1102.
DOI: 10.1126/science.275.5303.1102
2. Moskovits, M; Rev. Mod. Phys., 1985, 57, 783. DOI: 10.1103/RevModPhys.57.783
3. Kneipp, K.; Wang, Y.; Kneipp, H.; Perelman, L. T.; Itzkan, I.;
Dasari, R. R.; Feld, M.S; Phys. Rev. Lett. 1997, 78, 1667. DOI: 10.1103/PhysRevLett.78.1667
4. Kneipp, K.; Kneipp, H.; Itzkan, I.; Dasari, R. R.; Feld, M.S.;
Dresselhaus, M. S; Top. Appl. Phys., 2002, 82, 227. DOI: 10.1007/3-540-44948-5
5. Stiles, P.L.; Dieringer, J. A.; Shah, N. C.; Van Duyne, R.P; Ann.
Rev. Anal. Chem., 2008, 1, 1, 601. DOI: 10.1146/annurev.anchem.1.031207.112814
6. Gopala Krishna, P.; Hamad, S.; Tewari, S. P.; Sreedhar, S.;
Prasad, M. D.; Venugopal Rao, S; J. Appl. Phys. 2013, 113,
073106.
DOI: 10.1063/1.4792483
7. Jiang, X.; Jiang, Z.; Xu, T.; Su, S.; Zhong, Y.; Peng, F.; Su, Y.; He, Y; Anal. Chem., 2013, 85, 2809.
DOI: 10.1021/ac303337b
8. Gracie, K.; Correa, E.; Mabbott, S.; Dougan, J. A.; Graham, D.; Goodacre, R. ; Faulds, K; Chem. Sci., 2014, 5, 1030.
DOI: 10.1039/C3SC52875H
9. Botti, S.; Almaviva, S.; Cantarini, L.; Palucci, A.; Puiu, A.; Rufolon, A; J. Raman Spectrosc., 2013, 44, 463.
DOI: 10.1002/jrs.4203
10. Guerrini, L.; Graham, D; Chem. Soc. Rev., 2012, 41, 7085. DOI: 10.1039/C2CS35118H
11. Hamad, S.; Gopala Krishna, P.; Ahamad Mohiddon, M.;
Venugopal Rao, S; Appl. Phys. Lett. 2014, 104, 263104. DOI: 10.1063/1.4885763
12. Gopala Krishna, P.; Hamad, S.; Ahamad Mohiddon,
M.; Venugopal Rao, S; Appl. Surf. Sci., 2014, 303, 217. DOI: 10.1016/j.apsusc.2014.02.152
13. Hamad, S.; Gopala Krishna, P.; Ahamad Mohiddon, M.;
Venugopal Rao, S; Chem. Phys. Lett., 2015, 621, 171. DOI: 10.1016/j.cplett.2015.01.006
14. Willets, K.A.; and Van Duyne, R.P; Ann. Rev. Phys. Chem., 2007,
58, 267. DOI: 10.1146/annurev.physchem.58.032806.104607
15. Mishra, Y. K; Mohapatra, S.; Singhal, R.; Avasthi, D. K.;
Agarwal, D. C.; Ogale, S. C; Appl. Phys. Lett., 2008, 92, 043107. DOI: 10.1063/1.2838302
16. Mohapatra, S.; Mishra, Y. K; Warrier, A. M.; Philip, R.; Sahoo,
S.; Arora, A.K; Avasthi, D.K; Plasmonics, 2012, 7, 25. DOI: 10.1007/s11468-011-9271-y
17. Mishra, Y.K; Adelung, R.; Kumar, G.; Elbahri, M.; Mohapatra, S.;
Singhal, R.; Tripathi, A.; Avasthi, D.K; Plasmonics 2013, 8, 811.
DOI: 10.1007/s11468-013-9477-2
18. Fontana, J.; Livenere, J.; Bezares, F. J.; Caldwell, J. D.; Rendell, R.; Ratna, B. R; Appl. Phys. Lett., 2013, 102, 201606.
DOI: 10.1063/1.4807659
19. Gopala Krishna, P.; Hamad, S.; Ahamad Mohiddon, M.; Venugopal Rao, S; Laser Phys. Lett., 2015, 12, 036003.
DOI:10.1088/1612-2011/12/3/036003

Syed et al.
Adv. Mater. Lett. 2015, 6(12), 1073-1080 Copyright © 2015 VBRI Press 1080
20. Vendamani, V.S.; Hamad, S.; Saikiran, S.; Nageswara Rao,
S.V.S.; Venugopal Rao, S; Pathak, A.P; J. Mater. Sci. 2015, 50, 1666.
DOI: 10.1007/s10853-014-8727-9
21. Venugopal Rao, S; Gopala Krishna, P.; Hamad, S; J. Nanosci. Nanotech. 2014, 14, 1364.
DOI: 10.1166/jnn.2014.9138
22. Itina, T.; J. Phys. Chem. C, 2011, 115, 5044. DOI: 10.1021/jp1090944
23. Yang, G. W.; Jin-Bin, W.; Qui-Xiang, L; J. Phys.: Condens.
Matter 1998, 10, 7923. DOI: 10.1088/0953-8984/10/35/024
24. Yang, G. W; Prog. Mater. Sci., 2007, 52, 648.
DOI: 10.1016/j.pmatsci.2006.10.016 25. Liu, P.; Cui, H.; Wang, C. X.; Yang, G. W; Phys. Chem. Phys.
Chem., 2010, 12, 3942.
DOI: 10.1039/b918759f 26. Yang, Y.; Yang, J.; Liang, C.; Wang, H.; Zhu, X.; Zhang, N; Opt.
Exp. 2009, 17, 21124.
DOI: 10.1364/OE.17.021124
27. Miyaji, G.; Miyazaki, K; Opt. Exp. 2008, 16, 16265.
DOI: 10.1364/OE.16.016265
28. Hopp, B.; Smausz, T.; Csizmadia, T.; Vass, C.; Tápai, C.; Kiss, B.; Ehrhardt, M.; Lorenz, P.; Zimmer, K; Appl. Phys. A 2013,
113, 291.
DOI 10.1007/s00339-013-7913-y 29. Bashir, S.; Rafique, M. S.; Nathala, C. S.; Husinsky, W; Appl.
Surf. Sci. 2014, 290, 53. DOI: 10.1016/j.apsusc.2013.10.187
30. Vorobyev, A. Y.; Makin, V. S.; Guo, C; J. Appl. Phys. 2007, 101,
034903. DOI: 10.1063/1.2432288
31. Gopala Krishna, P.; Hamad, S.; Sreedhar, S.; Tewari, S. P.;
Venugopal Rao, S; Chem. Phys. Lett. 2012, 530, 93. DOI: 10.1016/j.cplett.2012.01.081
32. Tanvir Ahmmed, K. M.; Grambow, C.; Anne-Marie, K;
Micromachines 2014, 5, 1219. DOI: 10.3390/mi5041219
33. S ols i, J. . P. omer, . . . E. incenc Obona, J. Huisin’t eld, A. J J. Appl. Phys. 2014, 115, 103102.
34. Huang, M.; Zhao, F.; Cheng, Y.; Xu, N.; Xu, Z; Phys. Rev. B.
2009, 79, 125436.
DOI: 10.1103/PhysRevB.79.125436 35. Derrien, T. J. Y.; Itina, T. E.; Torres, R.; Sarnet, T.; Sentis, M; J.
Appl. Phys., 2013, 114, 083104.
DOI: 10.1063/1.4818433?ver=pdfcov 36. Hamad, S.; Gopala Krishna, P.; Vendamani, V. S.; Nageswara
Rao, S.V.S.; Pathak, A. P.; Tewari, S. P.; Venugopal Rao, S; J.
Phys. Chem. C 2014, 118, 7139. DOI: 10.1021/jp501152x
37. Wang, J.; Guo, C; J. Appl. Phys., 2006, 100, 023511.
DOI: 10.1063/1.2214464
38. Hamad, S.; Gopala Krishna, P.; Tewari, S. P.; Venugopal Rao, S;
J. Phys. D: Appl. Phys. 2013, 46, 485501.
DOI: 10.1088/0022-3727/46/48/485501 39. Gopala Krishna, P.; Hamad, S.; Venugopal Rao, S; J. Phys. Chem.
C., 2015, 119, 16972.
DOI: 10.1021/acs.jpcc.5b03958 40. Huynh, T. T. D.; Semmar, N; Appl. Phys. A, 2014, 116.
DOI: 10.1007/s00339-014-8255-0
41. Barcikowski, S.; Menéndez-Manjón, A.; Chichkov, B.; Brikas, M.; Gediminas, R; Appl. Phys. Lett. 2007, 91, 083113.
DOI: 10.1063/1.2773937
42. Ghosh, M.; Venkatesan, V.; Sikder, N.; Sikder, A. K; Central Euro. J. Energetic Mater. 2013, 10, 419.
43. Liang, F.; Vall´ee, R.; Gingras, D.; Leang Chin, S; Opt. Mat. Exp.
2011, 1, 1244. DOI: 10.1364/OME.1.001244
44. Vogel, A.; Linz, N.; Freidank, S.; Paltauf, G; Phys. Rev. Lett.
2008, 100, 038102. DOI: 10.1103/PhysRevLett.100.038102
45. Lorazo, P.; Lewis, P. J.; Meunier, M; Phys. Rev. Lett. 2003, 91,
225502. DOI: 10.1103/PhysRevLett.91.225502
46. Farrell, M.E.; Holthoff, E.L.; Pellegrino, P.M; Appl. Spectrosc.
2014, 68, 287.
DOI: 10.1366/13-07035
47. Wackerbarth, H.; Gundrum, L.; Salb, C.; Christou, K.; Viöl, W; Appl. Opt. 2010, 49, 4367.
DOI: 10.1364/AO.49.004367
48. Wackerbarth, H.; Salb, C.; Gundrum, L.; Niederkrüger, M.; Christou, K.; Beushausen, V.; Viöl, W; Appl. Opt. 2010, 49, 4362.
DOI: 10.1364/AO.49.004362
49. Botti, S.; Cantarini, L.; Palucci, A; J. Raman. Spectrosc. 2010, 41, 866.
DOI:10.1002/jrs.2649
50. Wang, X.; Shi, W.; She, G.; Mu, L; Phys. Chem. Chem. Phys. 2012, 14, 5891.
DOI: 10.1039/c2cp40080d
51. Sajanlal, P. R.; Pradeep, T; Nanoscale 2012, 4, 3427. DOI: 10.1039/c2nr30557g
52. Baker, G.A.; Moore, D.S; Anal. Bioanal. Chem. 2005, 382, 1751.
DOI: 10.1007/s00216-005-3353-7 53. Hakonen, A.; Andersson, P. O.; Schmidt, M. S.; Rindzevicius T.;
Käll, M; Analytica Chimica Acta, 2015, 893, 1.
DOI: 10.1016/j.aca.2015.04.010.s
54. Polavarapu, L.; Liz-Marzán, L. M; Phys. Chem. Chem. Phys.
2013, 15, 5288.
DOI: 10.1039/C2CP43642F 55. Zheng, G.; Polavarapu, L.; Liz-Marzán, L.M.; Pastoriza-Santos, I.;
Pérez-Juste, J; Chem. Commun. 2015, 51, 4572.
DOI: 10.1039/c4cc09466b 56. Noël, S.; Hermann, J.; Itina, T.E; Appl. Surf. Sci. 2007, 253, 6310.
DOI: 10.1016/j.apsusc.2007.01.081 57. Hermann, J.; Noël, S.; Itina, T.E.; Axente, E.; Povarnitsyn, M. E;
Las. Phys. 2008, 18, 374.
DOI: 10.1134/s11490-008-4002-6 58. Povarnitsyn, M.E.; Itina, T.E; Appl. Phys. A 2014, 117, 175.
DOI: 10.1007/s00339-014-8319-1