Serations Analysis (Study 2.6) Final Report · Volume III Payload Designs for Space Servicing...
147
,AEROSPACE REPORT NO. ATR-74(7336)-3. VOL. II m ) r r0 z :D Serations Analysis (Study 2.6) Final Report Volume II Analysis Results i ,c .pq u ( n Prepared by ADVANCED VEHICLE SYSTEMS DIRECTORATE mZ 4 Systems Planning Division 15 Se te be 1973 Io 15Prepared for OFFICE OF MANNED SPACE FLIGHT1973 h , a Washington, D. C. Contract No. NASW-2472 0( 4 r. Prepared for OFFICE OF MANNED SPACE FLIGHT NATIONAL AERONAUTICS AND SPACE ADMINISTRATION i4 Hi ) Washington, D. C. Contract No. NASW-2472 Systems Engineering Operations THE AEROSPACE CORPORATION https://ntrs.nasa.gov/search.jsp?R=19740005465 2018-06-13T17:59:44+00:00Z
Transcript of Serations Analysis (Study 2.6) Final Report · Volume III Payload Designs for Space Servicing...
,AEROSPACE REPORT NO.ATR-74(7336)-3. VOL. II
m )r r0
z :D
Serations Analysis (Study 2.6) Final ReportVolume II
Analysis Results
i ,c
.pq u
( n Prepared by ADVANCED VEHICLE SYSTEMS DIRECTORATE
mZ 4 Systems Planning Division
15 Se te be 1973
Io
15Prepared for OFFICE OF MANNED SPACE FLIGHT1973
h , a Washington, D. C.Contract No. NASW-2472
0(
4 r. Prepared for OFFICE OF MANNED SPACE FLIGHTNATIONAL AERONAUTICS AND SPACE ADMINISTRATION
i4 Hi ) Washington, D. C.
Contract No. NASW-2472
Systems Engineering Operations
THE AEROSPACE CORPORATION
https://ntrs.nasa.gov/search.jsp?R=19740005465 2018-06-13T17:59:44+00:00Z
Aerospace Report No.ATR-74(7336)-3, Vol II
OPERATIONS ANALYSIS (STUDY 2.6) FINAL REPORT
Volume II. Analysis Results
Prepared by
Advanced Vehicle Systems DirectorateSystems Planning Division
15 September 1973
Systems Engineering OperationsTHE AEROSPACE CORPORATION
El Segundo, California
Prepared for
OFFICE OF MANNED SPACE FLIGHTNATIONAL AERONAUTICS AND SPACE ADMINISTRATION
Washington, D.C.
Contract No. NASW-2472
Aerospace Report No.ATR-74(7336)-3, Vol. II
OPERATIONS ANALYSIS (Study 2. 6)
FINAL REPORT
Volume II: Analysis Results
Prepared by
R. R. WolfeNASA Study DirectorAdvanced Vehicle SystemsDirectorateSystems Planning Division
Approved by
L. . itney, Asso te Group DirectorAdvanced Vehicle stemsDirectorate
Systems Planning Division
PRECEDING PAGE BLANK NOT FILMED
iii
FOREWORD
Study 2. 6, Operations Analysig has as its objective the assessment
of the Space Transportation System (STS) relative to future NASA space
program planning. Several options have been investigated to improve the
efficiency of operations as a means of reducing future resource expenditures.
The study has involved improvement in multiple payload deployment and
retrieval operations, multiple orbit maneuvers, and alternate upper stage
configurations. In addition, the study performed a preliminary estimate of
space servicing for synchronous equatorial orbit satellites in the NASA
mission model. These results indicate that space servicing offers an
improvement in both logistic operations and payload procurement costs.
There are four volumes to this final report as listed below. The
first volume provides an executive summary. The second volume provides
an overall summary of the study results with comparisons between space
servicing and ground refurbishment of payloads. The third volume provides
all of the detailed payload design information developed for space-servicing
configurations. The final volume provides a computer code specification
which is proposed to be developed in a follow-on effort to support space-
servicing tradeoffs.
Volume I Executive Summary
Volume II Analysis Results
Volume III Payload Designs for Space Servicing
Volume IV LOVES Computer Code Specification
Study 2. 6, Operations Analysis, is one of several study tasks con-
ducted under NASA Contract NASW-2472 in FY 1973. The NASA Study Director
was Mr. V. N. Huff, NASA Headquarters, Code MTE.
-iv-
CONTENTS
i. INTRODUCTION ................................ i
2. BASIC DATA DEVELOPMENT ....................... 7
A. Mission Characterization ...................... 7
B. Logistic Vehicle Options ....................... ii
C. Payload Design Options ........................ 27
3. SPACE-SERVICING CONCEPTS .................. ...... 47
A. Case 1: LMSC Standard Modules ................... 51
B. Case 2: Aerospace Modularization .................... 55
4. SPACE-SERVICING RESULTS ....................... 61
A. Case i: LMSC Standard Modules ................... 64
B. Case 2: Aerospace Modular Designs ........... ..... 74
5. SUMMARY AND CONCLUSIONS ....................... 91
6. REFERENCES.................................. .. 97
APPENDIX A. CASE i GROUND RULES AND MANIFEST ....... A-i
APPENDIX B. CASE 2 GROUND RULES AND MANIFEST ....... B-i
-v-
FIGURES
1. Operations Analysis Study Plan ...................... 3
2. Velocity Requirements to Service Two Orbits at28. 5-deg Inclination ............................ .. .... 15
3. Velocity Requirements to Service Two Elliptical90-deg Orbits . .... ............................. 16
4. Payload Capabilities of Tug Servicing for ThreeElliptical 90-deg Orbits ............... ............ 17
5. Phased Development Tug Options . ....... ... . . . . . . . . . ... 19
6. Performance Capabilities of Tug Options ....... . . . . . . . . . . 20
7. Performance Capability of Tug/SEPS Options ...... . . . . . .. 21
8. Tug Service Capabilities for Seven-Day Operating Period .... . 23
9. Distribution of Satellites in Synchronous Equatorial Orbit .... . 24
10. Tug Service Capabilities for 21-Day Operating Period ....... 25
ii. Service Capability of SEPS in Synchronous Equatorial Orbit . . 26
12. Shuttle Payload Bay Considerations ..................... 30
13. Baseline EOS Design .......... ............... .... 31
14. Space-Serviceable EOS (Top View) .......... . . . . . . . . . .... 32
15. Space-Serviceable EOS (Side View) ...... . . . . . . . . . . . . . . . . 33
16. EOS Data Bus Schematic ............................. 34
17. Typical SRU Reliability Data .... . . . . . . . . . . . . . . . . . . . . 35
18. Typical Satellite Operational Periods . . . ...... . . . . . . . ..... 39
19. Space-Servicing Unit/Tug Arrangement ..... . . . . . . . . . . . . 43
20. Detail of Ram Mechanism ... .. ... . . . . . . . . . . . . . . 44
-vi -
FIGURES (Continued)
21. Detail of Baseplate Mechanism ...................... 45
22. Space-Servicing Analysis Approach. . ................... 48
23. Schedule of Operations NC2-51 System Test Satellite . ....... 63
24. Synchronous Equatorial Traffic, Case 506 Versus Case 1 ..... 73
25. Synchronous Equatorial Traffic, Case 2 ................. 82
-vii-
TABLES
1. Mission Characterization Summary................... . 10
2. Candidate Mission Orbits for Multiple Operations ... .. . . . . . . 12
3. Multiple Orbit Servicing Capabilities . ............. . . . . . 13
4. NASA/Non-NASA Space-Servicing Candidate Payloads . ...... 38
5. Typical Mission Equipment Assignments ...... . . . . . . . . . . . 41
6. Space-Servicing Candidate Payloads ......... . . . . . . . . ... . 52
7. Selected Spacecraft Module Assignments, Case 1 ........ 53
8. Selected Spacecraft Module Assignments, Case 2 ... ... . . . . . 56
9. EOS Subsystem Reliability Comparison ....... . . . . . . . . . . . 58
10. Case 2 Satellite Longitude Placement ... .. . . . . . . .. . . . . . . 59
11. Case 506 Synchronous Equatorial Operations ......... . 65
12. NC2-51 System Test Satellite Servicing Operations ........ 66
13. Case i Synchronous Equatorial Orbit Servicing . ........ . . . 68
14. Case i Tug Operations .. .......... ................ 72
15. Space Servicing Design Weight Comparison . ... .... . . . . . . . 75
16. Case 2 Synchronous Equatorial Orbit Servicing ... ..... . . . . . 77
17. Comparison of Upper Stage Logistics. . . . . . . . . . . . . . . . . . . 80
18. Case 2 Tug Operations ............................. 83
19. Payload Program Procurement Requirements . .... ...... . . . 84
20. Payload Program Costs ($M 1973) ... . . . . . . . . . . . . . . . . . 87
21. Total Program Costs ............................. .... 89
-viii-
1. INTRODUCTION
In its evolution, the Space Transportation System (STS) may assume
various roles depending upon future mission requirements and economic
constraints. This study was originated to examine alternative operational
concepts for the future which could be developed with some degree of
economic benefit. The study examines the total concept at a system level
involving mission requirements, payload design options, and logistic vehicle
definitions. The problem is approached in a generic sense in that, in general,
payloads and missions of the future can be assumed to be an extrapolation
of today's missions, but detailed design information is beyond the realm of
possibility. Even design information on the Shuttle and upper stage are
fluid at this time. Consequently, although design information on vehicles
and payloads is required, the emphasis of this study has been directed at
assessing typical mission characteristics and searching for alternative
means to improve the operational capability of the STS system as a whole.
In this regard, this study has been unique in that alternate concepts could
be considered without being inhibited by a specific design approach except
for the Shuttle design which is considered to be relatively firm.
The emphasis has been placed first on improving utilization of the
Shuttle and Tug upper stage for payload deployment and retrieval. This
leads to increased multiple payload operations to maximize the loading
efficiency of these vehicles. Further improvement was developed by
modifying the payload design and operational approach to allow space
servicing with the promise of further economic improvement. Multiple
mission satellites and alternate upper stages were also examined, including
a brief look at solar-electric propulsion stages (SEPS) and in-space ware-
housing of space replaceable payload modules. Each item has inherent
benefits which must be traded off against cost of operations and design and
some measure of risk associated with new developments. Because of the
magnitude of the required effort to examine these concepts, it was possible
only to expose the potential benefits and develop an analysis technique to
. 1
support subsequent trade studies. However, although the results presented
in this report are constrained by input assumptions and ground rules, the
conclusions strongly point toward new space-servicing concepts which
inherently improve the efficiency of future space operations.
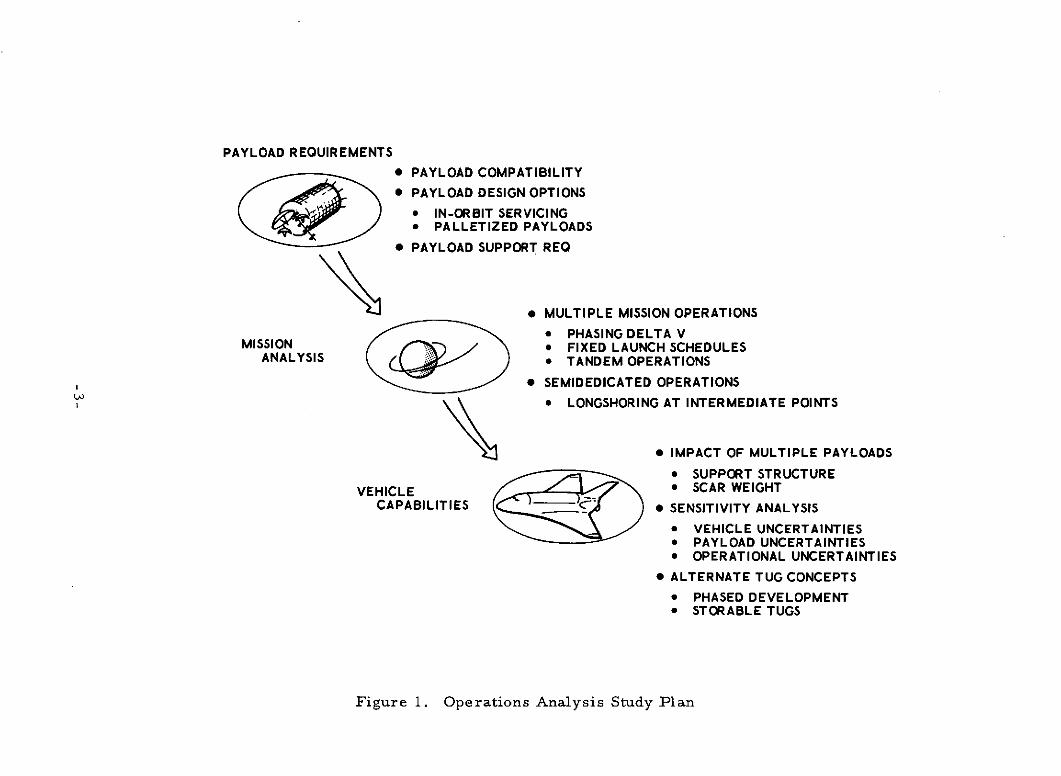
The study approach was developed around the three major elements
of the NASA space program as shown in Figure 1. The first element
addresses the payload definitions as provided in the payload data books
(Ref. 1 and 2) which describe candidate payload programs for the 1979 to
1990 time period. Rather than defining payloads in more detail, the
objective of this study is to examine generic types of payload programs. This
is based upon the belief that for an operational concept to be valid, it must
be applicable to a whole class of payloads rather than any discrete entity.
Specifically, the initial interest was directed at the compatibility of multiple
payload logistic operations. As the study evolved, interest developed in
space servicing as an operational concept and consequently payload
modularization was employed based upon Lockheed Missile and Space
Company, Inc. (LMSC) and Aerospace design approaches (Ref. 3 and Vol. III
of this report).
The second step consisted of analyzing varying approaches for
deploying and servicing multiple payload operations. This was based upon
the 1971 NASA mission model and the 1972 excursion as described in
References 4 and 5 respectively. In addition, the impulse required to
phase from one position to another in the same orbit was determined. This.
includes consideration of weight and volume load factors of the Shuttle and
upper stage as well as the impact of scar weights on the total system
performance. This information has been documented as mission character-
istics (Ref. 6). Additional information is provided in Reference 7 relative
to velocity requirements to support synchronous equatorial orbit operations.
The third step addressed candidate logistic vehicle concepts. The
Shuttle was assumed to be relatively fixed in concept as given in Reference 8.
However, upper stage concepts vary considerably from low technology
cryogenic stages to the Marshall Space Flight Center (MSFC) baseline Tug of
Reference 9 and include also storable upper stages. In addition, when
-2-
PAYLOAD REQUIREMENTS
* PAYLOAD COMPATIBILITY
* PAYLOAD DESIGN OPTIONS
* IN-ORBIT SERVICING* PALLETIZED PAYLOADS
* PAYLOAD SUPPORT REQ
* MULTIPLE MISSION OPERATIONS
* PHASING DELTA VMISSION * FIXED LAUNCH SCHEDULES
ANALYSIS * TANDEM OPERATIONS
* SEMIDEDICATED OPERATIONS
* LONGSHORING AT INTERMEDIATE POINTS
* IMPACT OF MULTIPLE PAYLOADS
* SUPPORT STRUCTUREVEHICLE * SCAR WEIGHT
CAPABILITIES * SENSITIVITY ANALYSIS* VEHICLE UNCERTAINTIES* PAYLOAD UNCERTAINTIES* OPERATIONAL UNCERTAINTIES
* ALTERNATE TUG CONCEPTS* PHASED DEVELOPMENT* STORABLE TUGS
Figure 1. Operations Analysis Study Plan
considering space concepts, a solar-electric propulsion stage (SEPS) (Ref. 10)
offers certain advantages. The basic tradeoffs between various upper stage
options, including tandem Tug operations, are provided as a separate part
of this study (Ref. 11). The dynamic operations requirements and cost
analysis (DORCA) interactive computer program (Ref. 12 and 13) was
employed for these tradeoffs.
The results of this study efforthave exposed several new concepts
which could provide cost benefits for future NASA operations. A broad
range of concepts has been examined, limited in depth by the available
resources. However, sufficient interest has been generated to consider
improving the analysis technique and performing in-depth studies as a follow-
on to this effort. Therefore, an adjunct to this effort was directed at
developing a computer program specification which could be coded and
employed in subsequent study efforts. This specification is identified as
Vol. IV of this report.
In summary, the results of various tradeoffs performed during this
study point to space servicing as a means of reducing overall program costs
including payload acquisition and logistic vehicle operations. For the cases
examined, the Tug operations were reduced by approximately 18% over
ground refurbishment of payloads. Payload procurement was reduced
approximately 10%. Space servicing also implies the use of standard
modules for subsystems, although deviations can be tolerated in specific
instances. This should provide further cost savings. A further extension
of this concept leads to multi-mission satellites in which a common set of
subsystems may support several payload programs simultaneously (time-
sharing operations) or allow mission equipment changeout. This of particular
interest because for many NASA payload programs the mission equipment is
the major source of uncertainty in future planning rather than subsystems.
Reliabilities of such mission equipment as multi-spectral scanners and
similar sensors are relatively low and can be projected to have no more
than a two-year operating life in the time period (1979-1990) of interest.
Since these equipments are mechanical in nature, the failure modes exhibit
wearout features rather than random failures and therefore, improvement
-4-
through design redundancy may be difficult to achieve. Space servicing
therefore offers a means of maintaining and upgrading mission equipment
at a reduced program cost if standardization of the operating concept can
be achieved; that is, commonality of payload design and efficient utilization
of logistic vehicles.
Numerous space-servicing policies can be postulated as shown in
subsequent sections, each exhibiting specific advantages. The key issue is
that space servicing as a concept offers new insight into systems level
requirements for payloads and logistic vehicles. It also offers a key to
management of multi-faceted operations where subsystems can be relegated
to standard components while still retaining flexibility in mission equipment
applications.
-5-
2. BASIC DATA DEVELOPMENT
The basic information developed in support of space-servicing
tradeoffs discussed in the next section is summarized here for information
purposes. Examples of the type of information required are given along with
some of the analysis results which led to space servicing as a concept.
Detail information is provided under separate cover as listed in the references.
The information is separated into three principal subjects:
Mission Characteristics
Logistic Vehicle Options
Payload Design Options
A. MISSION CHARACTERIZATION
It is important in assessing operational concepts to determine if
the results are overly sensitive to the initial mission model. In this case,
the interest lies in the application of multiple payload logistic operations
such as deployment, servicing, or retrieval of more than one payload on a
given Tug flight. A measure of the efficiency with which the operations can
be performed is the load factor achieved on each flight. This is defined as
the ratio of the payload weight to the weight capability of the logistic vehicle
(Shuttle, Tug, etc). A volume load factor is also useful to determine if
payload length limits the loading of logistic vehicles. An overall length of
18. 3 m (60 ft) is employed as a constraint to be compatible with the Shuttle
payload bay. When a Tug is employed, the upper stage payload length is
constrained to 7. 6 m (25 ft), thus allowing the Tug/payload combination to
meet the Shuttle constraint. The 1971 NASA mission model as defined in
Reference 4 is used as a basis for this analysis. Excursions are then made
to see if the logistics vary significantly. The following questions were
addressed:
1. What load factor (and volume factor) was achieved for eachlogistic operation ?
2. To what extent were multiple payload operations employed?
.7- PRECEDING PAGE BLANK NOT FILME
3. What potential exists for improving the efficiency of flightoperations ?
4. What uncertainties exist which may alter the derived results?
On the first leg of a synchronous equatorial mission, the Shuttle
takes the payload and Tug to an orbit altitude of approximately 296 km
(160 nmi) at 28. 5 degrees inclination. In addition, there are other payloads;
i. e., planetary, etc. which also require this first step. Combining these
delivery and retrieval requirements for the 1971 mission model results in
331 Shuttle flights over the time period 1979 to 1997. The vast majority of
these flights delivered and returned more than one payload. For example,
99 flights delivered two payloads (including the Tug as one payload) to the
reference orbit and returned two payloads to the launch site for refurbishment.
Each payload required an upper stage for subsequent operations but, in
general, more than one automated payload was handled on each flight.
The average load factor was 80 percent of the total of 331 flights.
No significant problems were encountered due to Shuttle bay volume
constraints. Continuing this example to the next leg resulted in 191 Tug and
10 tandem Tug flights to synchronous equatorial orbit. The average load
factor for Tug operations was only 67 percent with approximately 50 percent of
the flights handling a single payload up and a single payload down. Forty
flights had a load factor less than 30 percent with several flights below
10 percent. A detailed analysis is provided in Reference 6. In summary,
improved utilization of the Tug is needed and further improvement of
Shuttle flights is desirable. Some of this improvement can be achieved by
improved loading, adjustment of the individual flight schedule or, in other
cases, adjustment of the mission orbit. The reduction in flights may only
be 10 to 20 percent overall, but the operations cost allocated to certain
classes of payloads could be substantially reduced.
Although improved weight load factors for the Tug can be achieved
in some cases, a further look at the results shows that the volume load
factor will become dominant. Consequently, repackaging of the payloads to
improve the packing density in the Shuttle is a significant factor for improved
vehicle utilization. One way is to take advantage of the 4. 6-m (15-ft)
-8-
diameter by placing payloads in the bay like pineapple slices. This approach
is discussed in more detail in Section 3 and is especially appropriate for
space replaceable units.
An overall comparison of vehicle utilization is provided in Table 1
for the 1971 mission model (Case 403.) A second model (Case 506) developed
in Reference 5 as an excursion to the 1971 model is also shown. The overall
Shuttle utilization has a weight load factor of 75 percent which drops to 58
percent for Case 506 due to the extensive number of flights for space station
and sortie operations. A better comparison is achieved by considering
automated payloads only, in which the Shuttle weight load factor for both
cases is within five percentage points (71 percent vs 66 percent). The
improved Tug utilization shown stems from redefined payloads which
enhance the loading capability. It is also seen that in either case, Tug
operations at the western launch site, Vandenburg Air Force Base (VAFB),
have a low efficiency and should be improved. In summary, the mission
model provides sufficient traffic in each year that a mix of payloads can be
accommodated with approximately the same efficiency from model to model.
Hence, the average operations cost allocated to a payload program should
remain relatively constant, unless a drastic redesign of the payloads occurs
to improve the packing density.
This does not obviate the fact that further improvement in vehicle
utilization is needed. Operations from the western launch site have been
shown to be very inefficient when the Tug is required. Also, the Shuttle
performance is marginal for payload deployment and/or retrieval at 926 km
(500 nmi). One option is to use a smaller Tug, since the baseline Tug must
be off-loaded for these flights anyway. Another is to use a storable stage,
more in line with the impulsive velocity requirements. These options were
examined briefly as reported in Reference 11, but further work is required.
Another option to improve the Tug utilization for polar orbits is multiple-
orbit operations including plane change maneuvers of a few degrees. If the
Tug, off-loaded to meet Shuttle constraints, could deploy or service
payloads in one orbit and then transfer to a second orbit, the cost of
operations could be apportioned between the payload programs. To examine
-9-
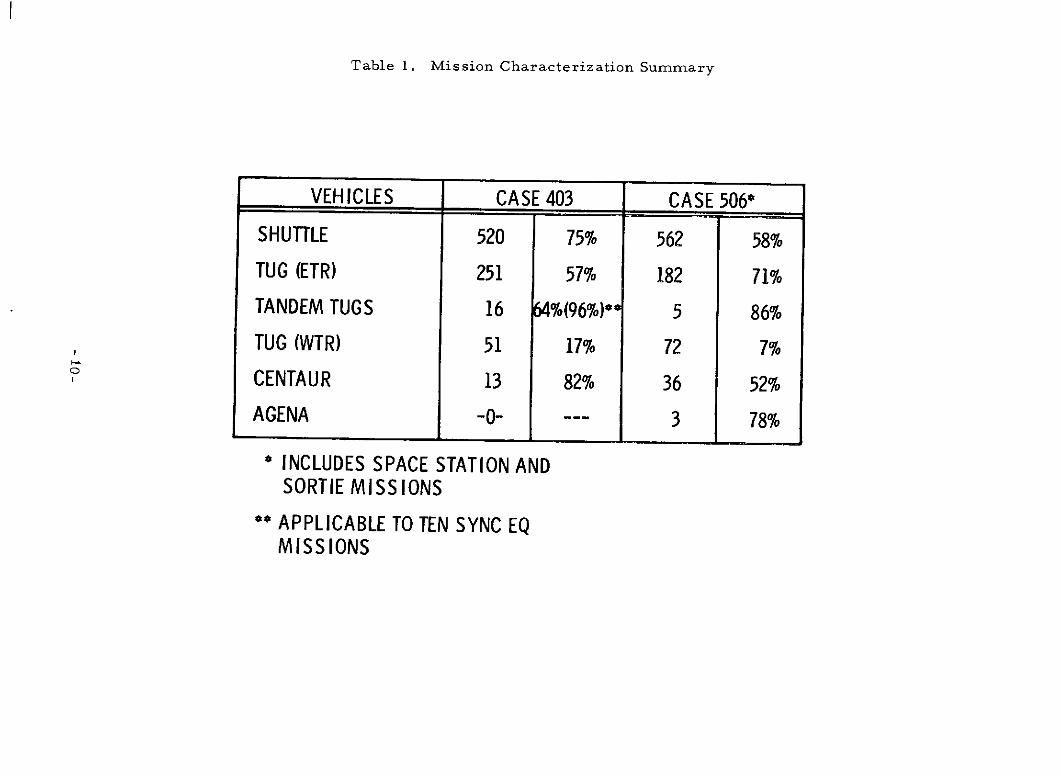
Table 1. Mission Characterization Summary
VEHICLES CASE 403 CASE 506*
SHUTTLE 520 75% 562 58%TUG (ETR) 251 57% 182 71%
TANDEM TUGS 16 64%(96%)** 5 86%TUG (WTR) 51 17% 72 7%CENTAUR 13 82% 36 52%AGENA -0- --- 3 78%
* INCLUDES SPACE STATION ANDSORTIE MISSIONS
*" APPLICABLE TO TEN SYNC EQMISSIONS
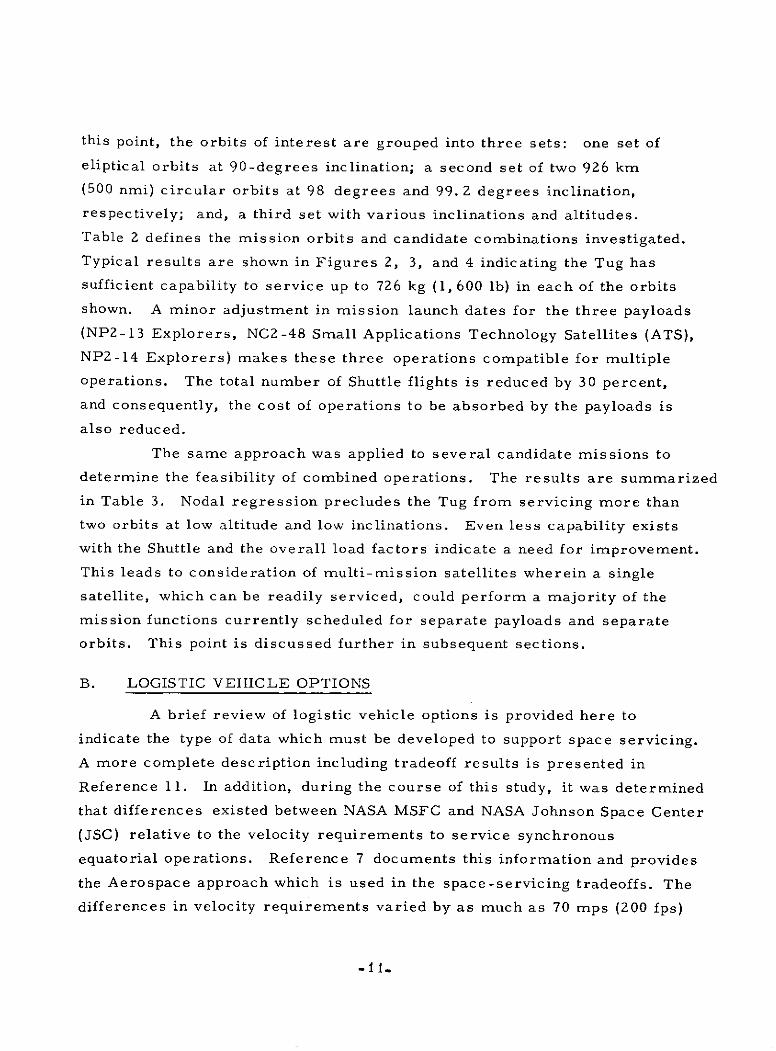
this point, the orbits of interest are grouped into three sets: one set of
eliptical orbits at 90-degrees inclination; a second set of two 926 km
(500 nmi) circular orbits at 98 degrees and 99. 2 degrees inclination,
respectively; and, a third set with various inclinations and altitudes.
Table 2 defines the mission orbits and candidate combinations investigated.
Typical results are shown in Figures 2, 3, and 4 indicating the Tug has
sufficient capability to service up to 726 kg (1,600 lb) in each of the orbits
shown. A minor adjustment in mission launch dates for the three payloads
(NP2-13 Explorers, NC2-48 Small Applications Technology Satellites (ATS),
NP2-14 Explorers) makes these three operations compatible for multiple
operations. The total number of Shuttle flights is reduced by 30 percent,
and consequently, the cost of operations to be absorbed by the payloads is
also reduced.
The same approach was applied to several candidate missions to
determine the feasibility of combined operations. The results are summarized
in Table 3. Nodal regression precludes the Tug from servicing more than
two orbits at low altitude and low inclinations. Even less capability exists
with the Shuttle and the overall load factors indicate a need for improvement.
This leads to consideration of multi-mission satellites wherein a single
satellite, which can be readily serviced, could perform a majority of the
mission functions currently scheduled for separate payloads and separate
orbits. This point is discussed further in subsequent sections.
B. LOGISTIC VEHICLE OPTIONS
A brief review of logistic vehicle options is provided here to
indicate the type of data which must be developed to support space servicing.
A more complete description including tradeoff results is presented in
Reference 11. In addition, during the course of this study, it was determined
that differences existed between NASA MSFC and NASA Johnson Space Center
(JSC) relative to the velocity requirements to service synchronous
equatorial operations. Reference 7 documents this information and provides
the Aerospace approach which is used in the space-servicing tradeoffs. The
differences in velocity requirements varied by as much as 70 mps (200 fps)
-lI-
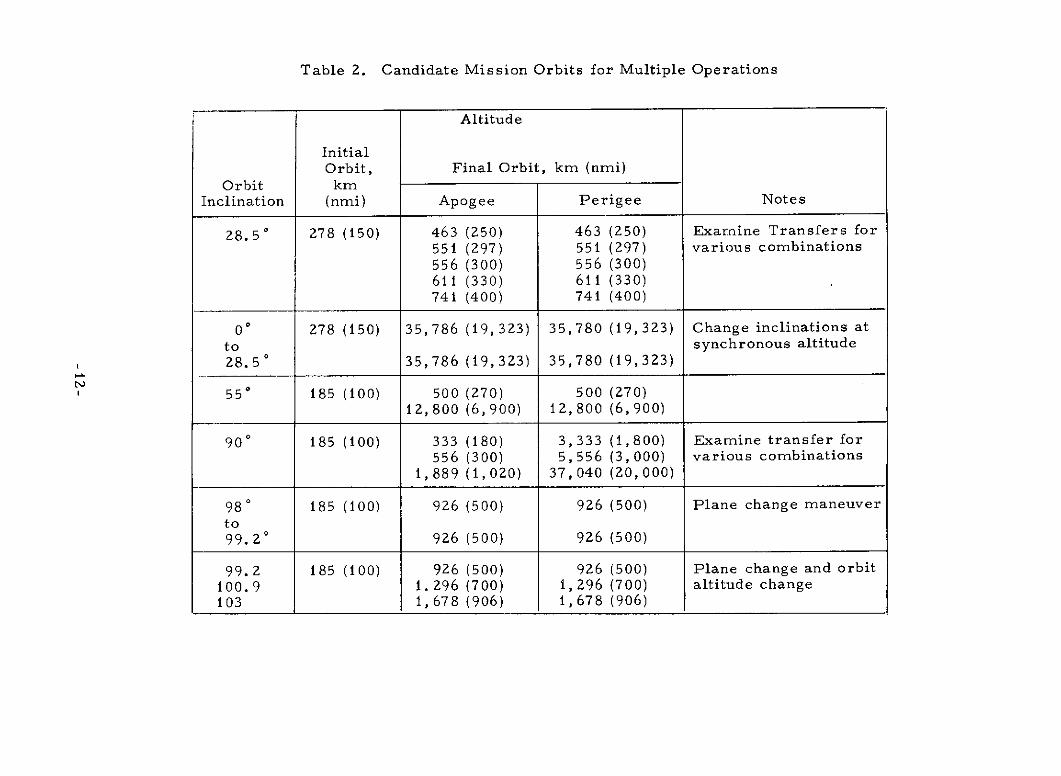
Table 2. Candidate Mission Orbits for Multiple Operations
Altitude
InitialOrbit, Final Orbit, km (nmi)
Orbit kmInclination (nmi) Apogee Perigee Notes
28. 5 278 (150) 463 (250) 463 (250) Examine Transfers for551 (297) 551 (297) various combinations556 (300) 556 (300)611 (330) 611 (330)741 (400) 741 (400)
0 ° 278 (150) 35,786 (19,323) 35,780 (19,323) Change inclinations atto synchronous altitude28.50 35,786 (19,323) 35,780 (19,323)
55' 185 (100) 500 (270) 500 (270)12,800 (6,900) 12,800 (6,900)
90 185 (100) 333 (180) 3,333 (1,800) Examine transfer for556 (300) 5,556 (3,000) various combinations
1,889 (1,020) 37,040 (20,000)
980 185 (100) 926 (500) 926 (500) Plane change maneuverto99.20 926 (500) 926 (500)
99.2 185 (100) 926 (500) 926 (500) Plane change and orbit100.9 1. 296 (700) 1,296 (700) altitude change103 1,678 (906) 1,678 (906)
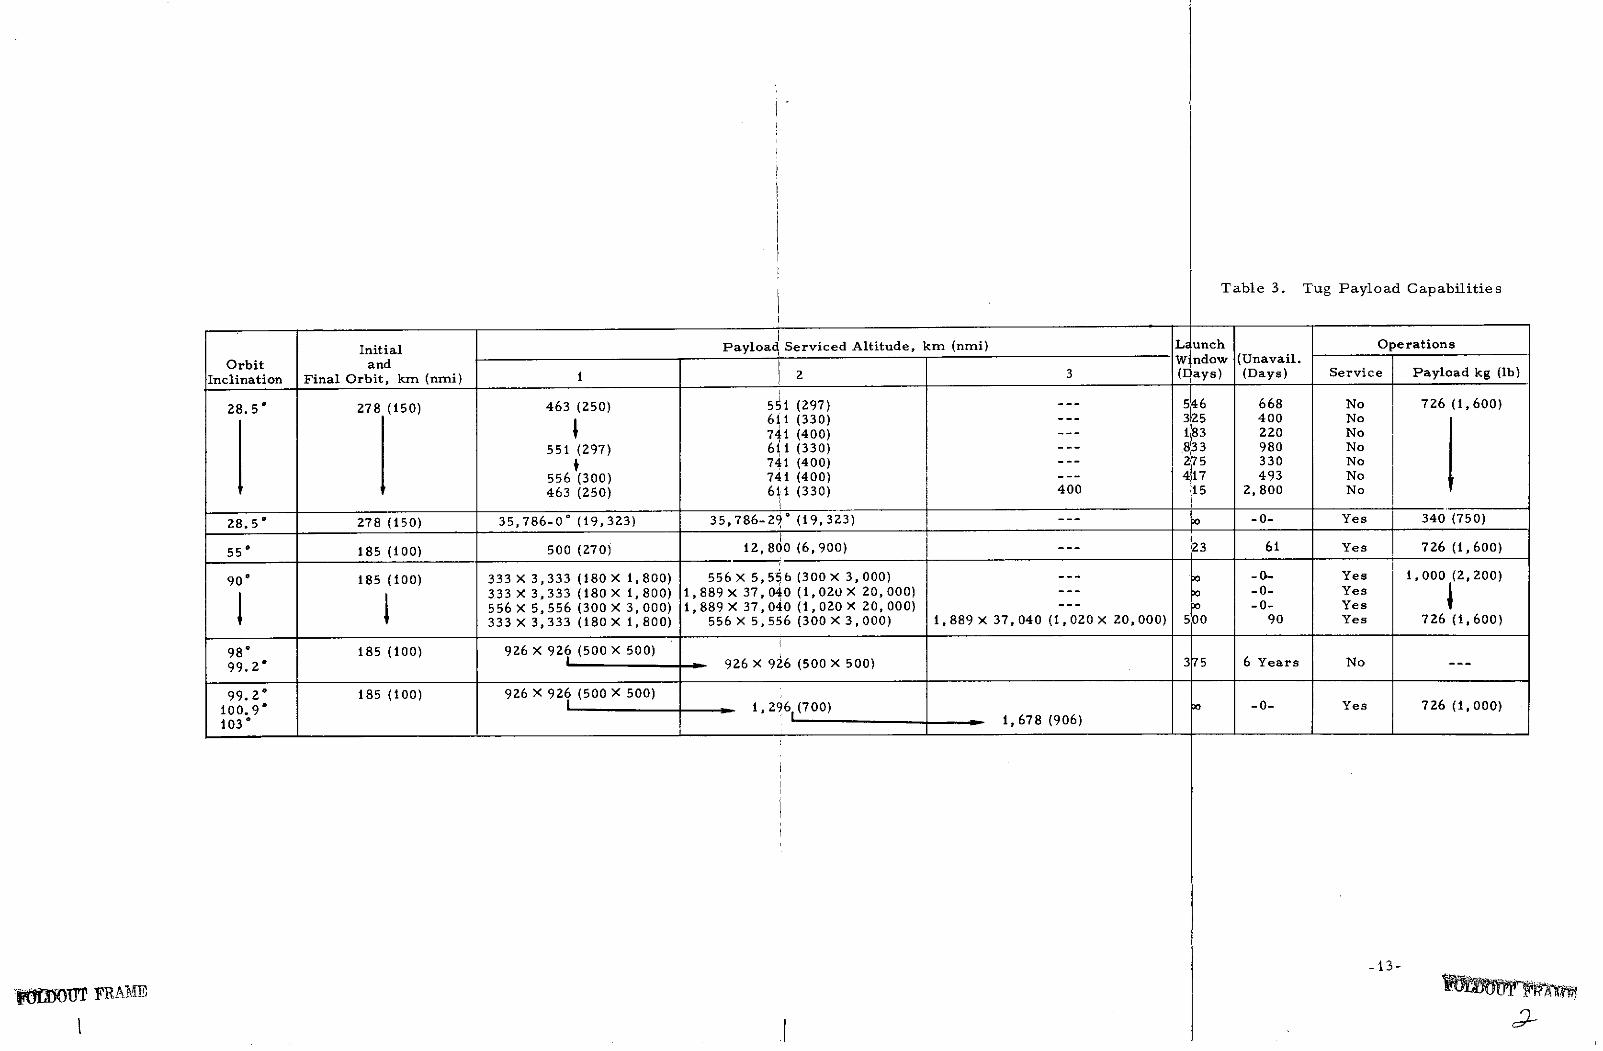
Table 3. Tug Payload Capabilities
Initial Payload Serviced Altitude, km (nmi) L unch Operations
Orbit and W' ndow (Unavail.
Inclination Final Orbit, km (nmi) 2 3 ( ays) (Days) Service Payload kg (b)
28.50 278 (150) 463 (250) 551 (297) --- 546 668 No 726 (1,600)611 (330) --- 325 400 No741 (400) --- 183 220 No
551 (297) 6ii11 (330) -833 980 No
S741 (400) --- 275 330 No
556 (300) 741 (400) --- 417 493 No463 (250) 611 (330) 400 15 2,800 No
28.50 278 (150) 35,786-0- (19,323) 35,786-2 .o (19,323) --- ) -0- Yes 340 (750)
55' 185 (100) 500 (270) 12, 800 (6,900) --- 23 61 Yes 726 (1,600)
900 185 (100) 333 X 3,333 (180 X 1,800) 556 X 5,55 b (300 X 3,000) --- -- Yes i,000 (2,200)333 X 3,333 (180 X 1,800) 1,889 X 37,040 (1,020 X 20, 000) --- m -0- Yes556 X 5,556 (300 X 3,000) 1,889 X 37, 040 (1,020 X 20, 000) --- D -0- Yes333 X 3,333 (180 X 1,800) 556 X 5,556 (300 X 3,000) 1,889 X 37,040 (1,020 X 20, 000) 500 90 Yes 726 (1,600)
980 185 (100) 926 x 926 (500 X 500)99.20 I 926 X 926 (500 X 500) 375 6 Years No
99.2 185 (100) 926 X 926 (500 X 500)100.9 I 1,296 (700) 0 -0- Yes 726 (1,000)1030 1 , 678 (906)
-13-
-WryTJ FRAMPE1I c
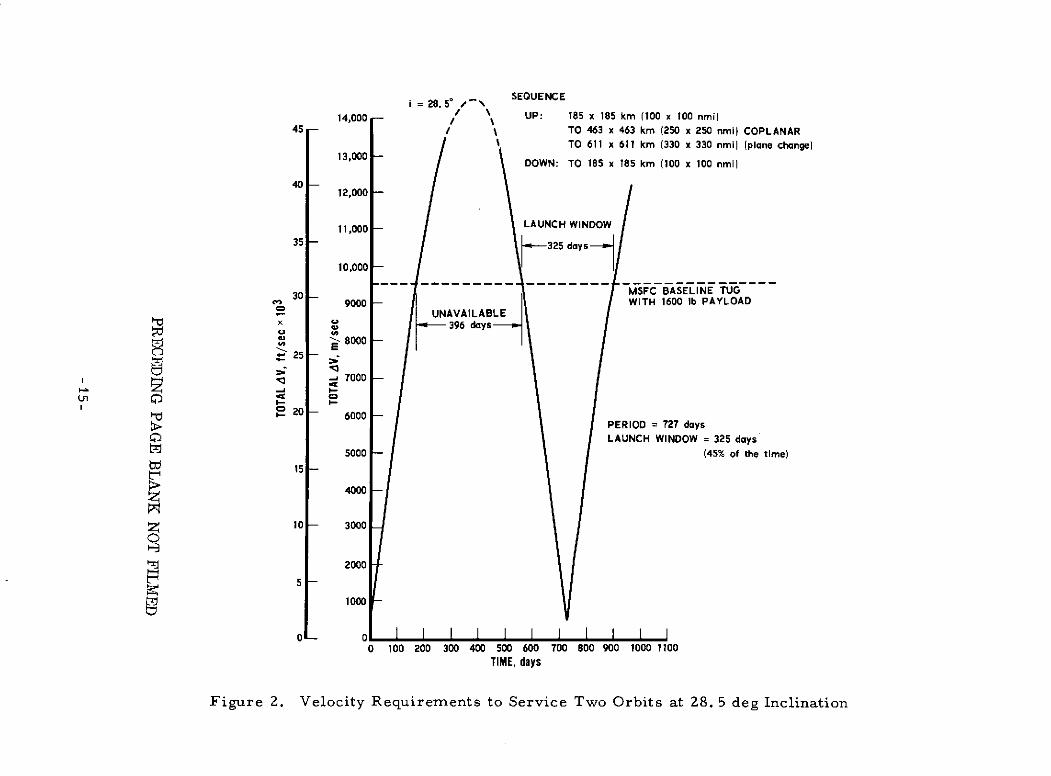
= 28.5 SEQUENCEi = 28. 5" /--
14,000 - UP: 185 x 185 km (100 x 100 nmi)45 - TO 463 x 463 km (250 x 250 nmi) COPLANAR
i TO 611 x 611 km (330 x 330 nmi) (plane change)13,000 - DOWN: TO 185 x 185 km (100 x 100 nmi)
40 -12,000 -
11,000 LAUNCH WINDOW
35 - 10,000 - 325 days
30 -MSFC BASELINE TUG9000 WITH 1600 Ib PAYLOAD
UNAVAILABLE6x 396 days
M 8000,E25
-7000
0 C
20 6000PERIOD = 727 days
0 LAUNCH WINDOW = 325 days5000 - (45% of the time)
15 -
4000 -
S10 - 3000
2000
5
1000 -
0[ 0 I
0 100 200 300 400 500 600 700 800 900 1000 1100TIME, days
Figure 2. Velocity Requirements to Service Two Orbits at 28. 5 deg Inclination
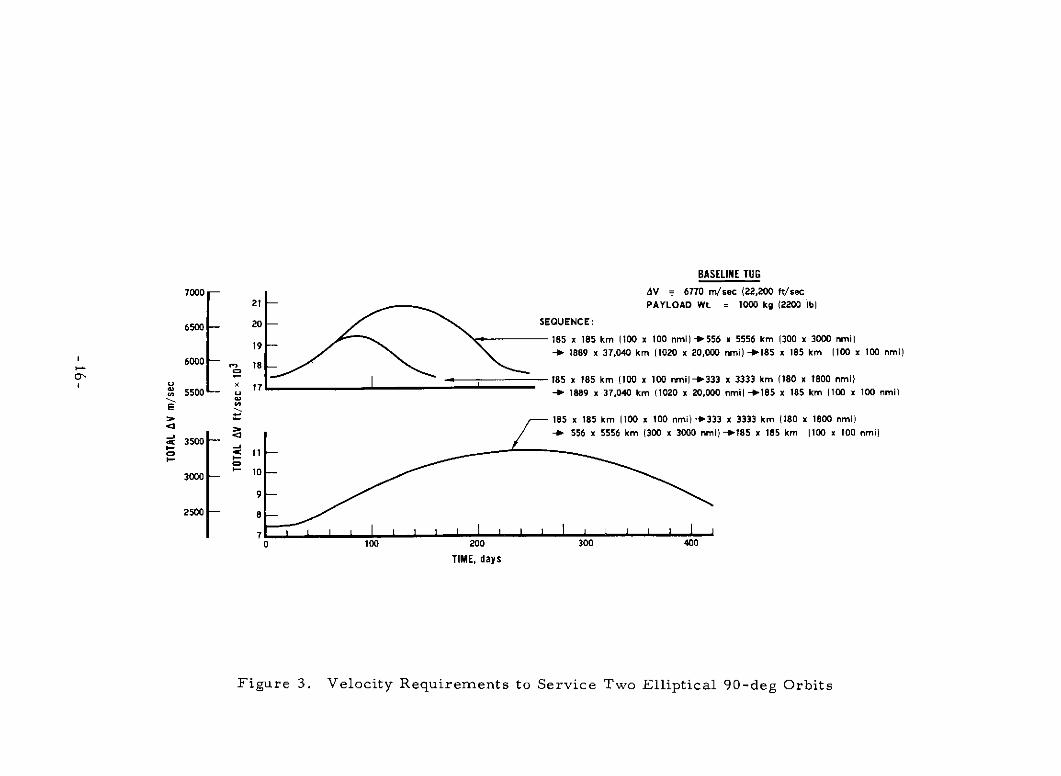
BASELINE TUG
7000 - dV = 6770 m/sec (22,200 ft/sec21 - PAYLOAD Wt. = 1000 kg (2200 Ib)
6500- 20 - SEQUENCE:
S 19 185 x 185 km (100 x 100 nmi) -556 x 5556 km (300 x 3000 nmi)
6000- 1 - 1889 x 37,040 km (1020 x 20,000 nmi) -185 x 185 km (100 x 100 nmi)
1 I 185 x 185 km (100 x 100 nmi)--333 x 3333 km (180 x 1800 nmi)5500 -N 1889 x 37,040 km (1020 x 20,000 nmi)-*185 x 185 km (100 x 100 nmi)
185 x 185 km (100 x 100 nmi)-.+333 x 3333 km (180 x 1800 nmi)S556 x 5556 km (300 x 3000 nmi) -185 x 185 km (100 x 100 nmi)
< 3500 -S11
3000 - 10
9-
2500 - 8
0 100 200 300 400
TIME, days
Figure 3. Velocity Requirements to Service Two Elliptical 90-deg Orbits
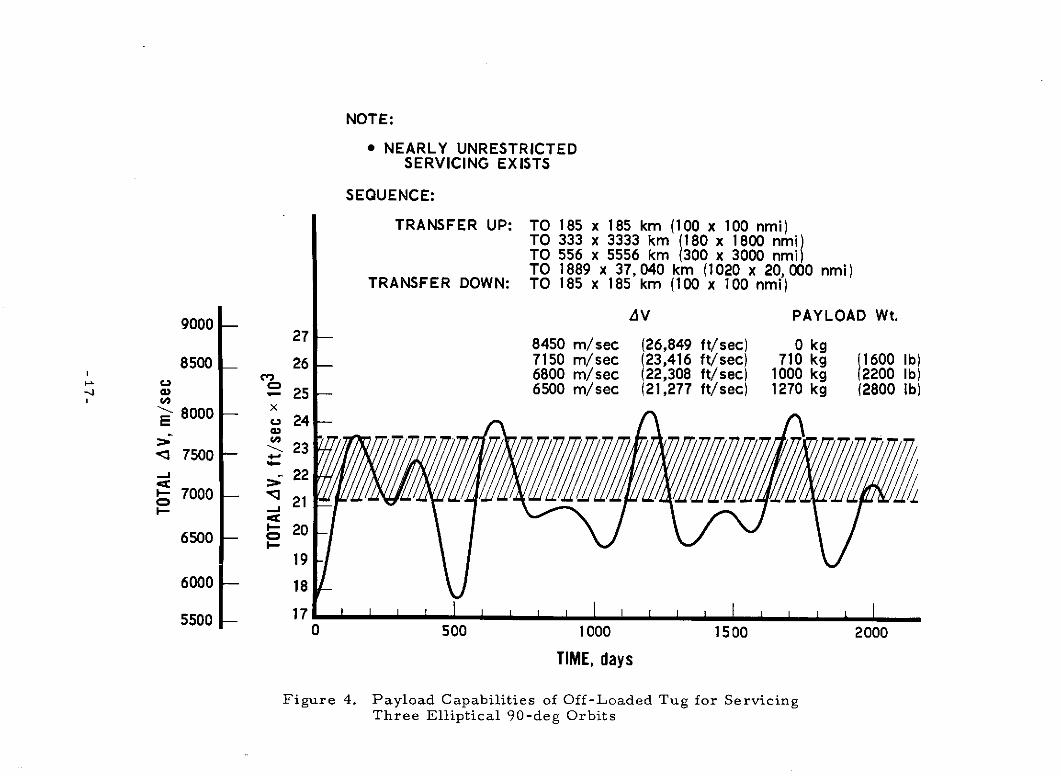
NOTE:
* NEARLY UNRESTRICTEDSERVICING EXISTS
SEQUENCE:
TRANSFER UP: TO 185 x 185 km (100 x 100 nmi)TO 333 x 3333 km (180 x 1800 nmiITO 556 x 5556 km (300 x 3000 nmi)TO 1889 x 37,040 km (1020 x 20,000 nmi)
TRANSFER DOWN: TO 185 x 185 km (100 x 100 nmi)
9000 AV PAYLOAD Wt.
8450 m/sec (26,849 ft/sec) 0 kg8500 26 7150 m/sec (23,416 ft/sec) 710 kg (1600 Ib)
co 6800 m/sec (22,308 ft/sec) 1000 kg (2200 Ib)- 25 6500 m/sec (21,277 ft/sec) 1270 kg (2800 Ib)
8000E 24
23< 7500S- 22
- 7000 - 10 21- 206500 - o1-
19
6000 - 18
5500 170 500 1000 1500 2000
TIME, days
Figure 4. Payload Capabilities of Off-Loaded Tug for ServicingThree Elliptical 90-deg Orbits
which is significant relative to phasing increments at synchronous altitudes.
The value selected for transfer from 296 km (160 nmi) orbit to synchronous
equatorial orbit, including losses, yaw steering, and longitude placement is
4, 309 mps (14, 138 fps) (one way). This value was then used consistantly
for all operations under consideration.
The space-servicing results presented in Section 3 utilize the NASA
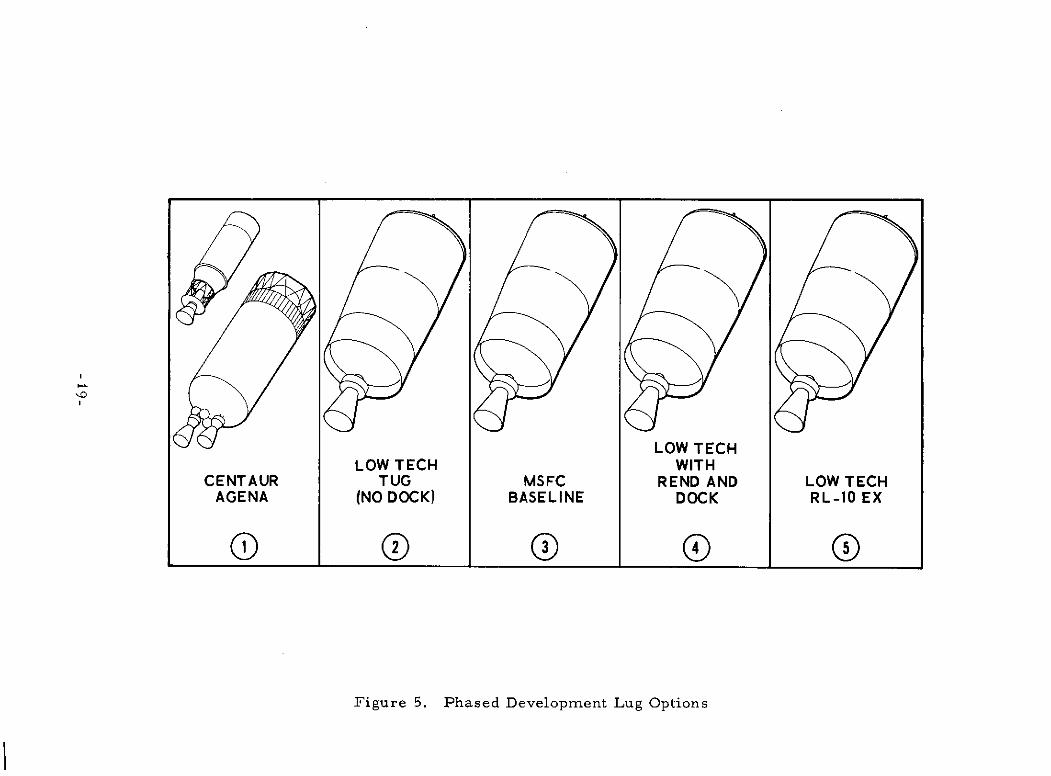
MSFC baseline cryogenic Tug as defined in Reference 9. Alternate upper
stage configurations also considered in tradeoffs based upon the 1971 mission
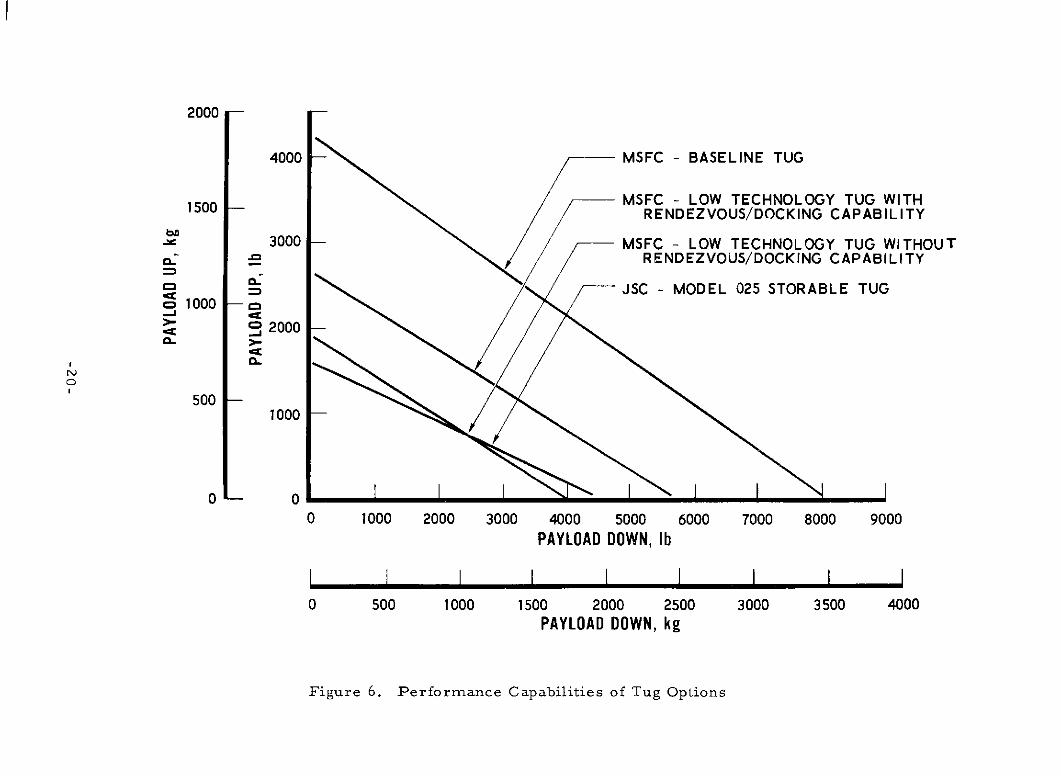
model (ground-refurbishable payloads) are shown in Figure 5. The
performance capabilities, including a preliminary description of the NASA
JSC storable Tug (model 025) are shown in Figure 6. Within the limits of
the ground rules in Reference 11, it was shown retrieval of payloads was
an important factor in reducing overall program costs, but having selected
a retrieval Tug design, the relative cost difference was small. The higher
cost of developing the baseline Tug was offset by the increased payload
benefits. The reduced cost of the low technology Tug (with retrieval
capability) was offset by the loss in performance increasing the operations
costs.
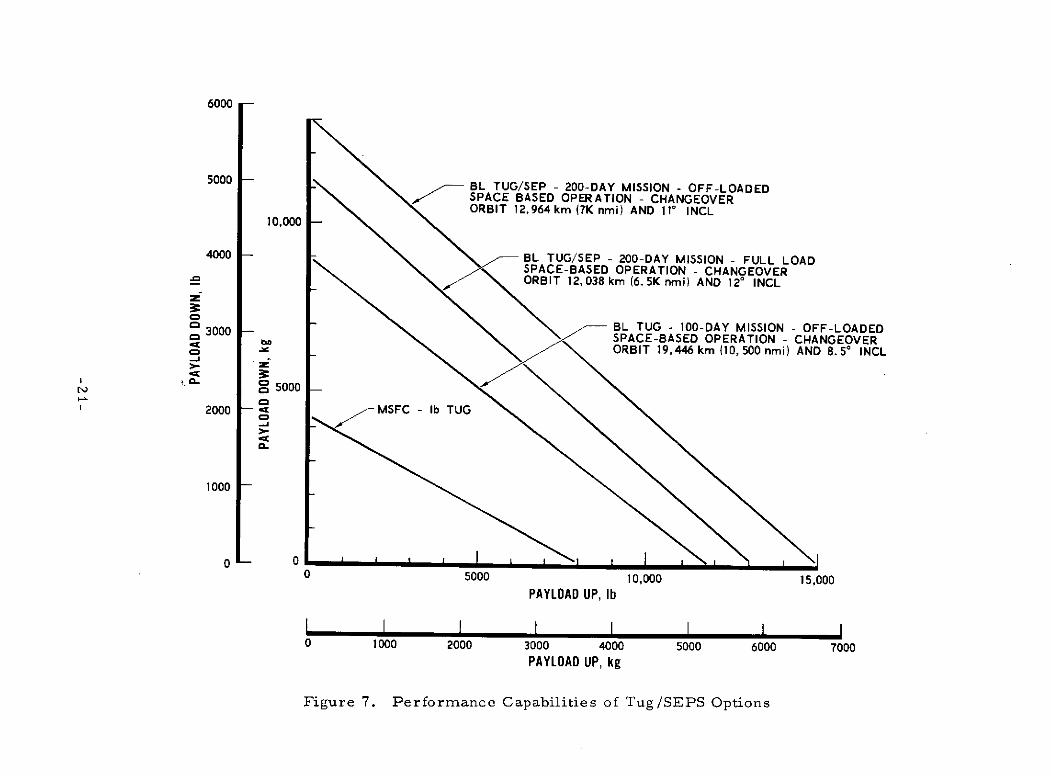
An alternate means of deploying and retrieving payloads was
examined using the baseline Tug equipped with a solar-electric propulsion
stage (SEPS). The impact of various options is shown in Figure 7. The
SEPS can more than double the performance capability of the Tug alone, if
the operation time period can be relaxed to 200 days. Constraining the time
to approximately three months still provides a significant improvement.
This may be acceptable considering the fact that current programs, after
initial insertion in synchronous equatorial orbit, may be allowed to drift for
30 to 45 days before final stabilization. Since the Tug is restricted to a
seven-day operation, it is necessary for the SEPS, after initial deployment,
to return to the changeover orbit and rendezvous with a second Tug. The
SEPS acquires the payload and transfers back to synchronous altitude. The
current design based on Reference 10 is capable of four round trips of this
type. Although the operations achieve an additional degree of complexity,
the increased performance is sufficiently attractive to warrant further
-18-
LOW TECHLOW TECH WITH
CENTAUR TUG MSFC REND AND LOW TECHAGENA (NO DOCK) BASELINE DOCK RL-10 EX
0 0 0 9
Figure 5. Phased Development Lug Options
2000 --
4000 - MSFC - BASELINE TUG
MSFC - LOW TECHNOLOGY TUG WITH1500 RENDEZVOUS/DOCKING CAPABILITY
3000 MSFC - LOW TECHNOLOGY TUG WITHOUT& RENDEZVOUS/DOCKING CAPABILITY
JSC - MODEL 025 STORABLE TUGo 1000 - a
a2000
{3-
5001000
0 00 1000 2000 3000 4000 5000 6000 7000 8000 9000
PAYLOAD DOWN, lb
S I iI I I I I
0 500 1000 1500 2000 2500 3000 3500 4000
PAYLOAD DOWN, kg
Figure 6. Performance Capabilities of Tug Options
6000
5000 - BL TUG/SEP - 200-DAY MISSION - OFF-LOADEDSPACE BASED OPERATION - CHANGEOVERORBIT 12,964 km (7K nmi) AND 11 INCL
10,000
4000 BL TUG/SEP - 200-DAY MISSION - FULL LOADSPACE-BASED OPERATION - CHANGEOVERORBIT 12,038 km (6.5K nmi) AND 120 INCL
3000 BL TUG - 100-DAY MISSION - OFF-LOADED3000 SPACE-BASED OPERATION - CHANGEOVERORBIT 19,446 km (10, 500 nmi) AND 8. 50 INCL
S5000 -
2000 - ' MSFC - Ib TUG-
1000
0 00 5000 10,000 15,000
PAYLOAD UP, lb
I I I I I I I0 1000 2000 3000 4000 5000 6000 7000
PAYLOAD UP, kg
Figure 7. Performance Capabilities of Tug/SEPS Options
analysis at a later date. Further benefits may be derived when considering
space servicing of multiple payloads as an operational concept.
Space servicing of multiple payloads in a given orbit requires the
logistic vehicle to transfer from one payload to another, exchanging modules
or performing some other service. Particular interest lies in synchronous
equatorial orbit where a majority of the projected payload programs will be
deployed. For the purpose of example cases in Section 3, it has been
assumed that the servicing weight is constant for the entire operation. That
is, if a module is taken to a satellite,the module removed is equivalent and
consequently the weight remains constant. This represents a conservative
assumption but eases the interpretation by allowing parametric data to be
developed.
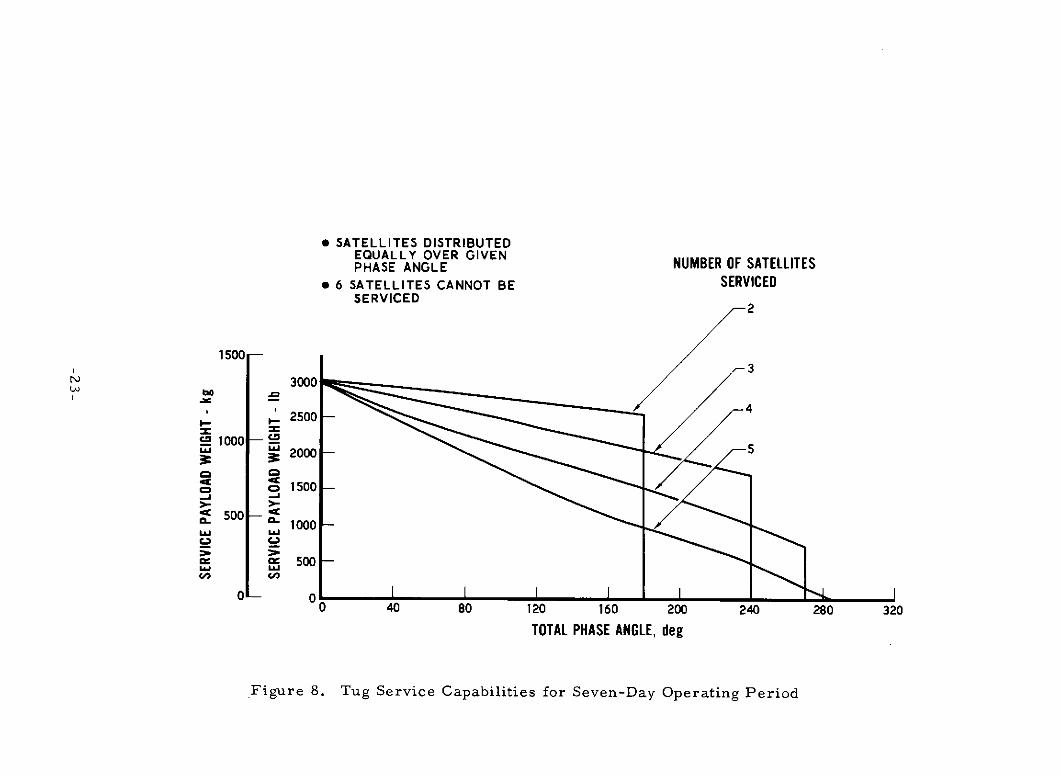
The baseline Tug capability to perform servicing is shown in
Figure 8 restricted to a seven-day mission duration. The number of
satellites to be serviced are distributed equally over the total phase angle
being considered. The Tug mission duration is highly restrictive due to the
long period of the transfer orbits required to change longitude placement.
However, even with this restriction, the Tug could service three to four
payloads if the satellites were clustered over a limited phase angle, say
120 degrees. Allowing 91 kg (200 lb) for a servicing unit, the Tug could
replace 204 kg (450 lb) of equipment ineach of four satellites. This is not
realistic considering the distribution of payloads in orbit as shown in
Figure 9.
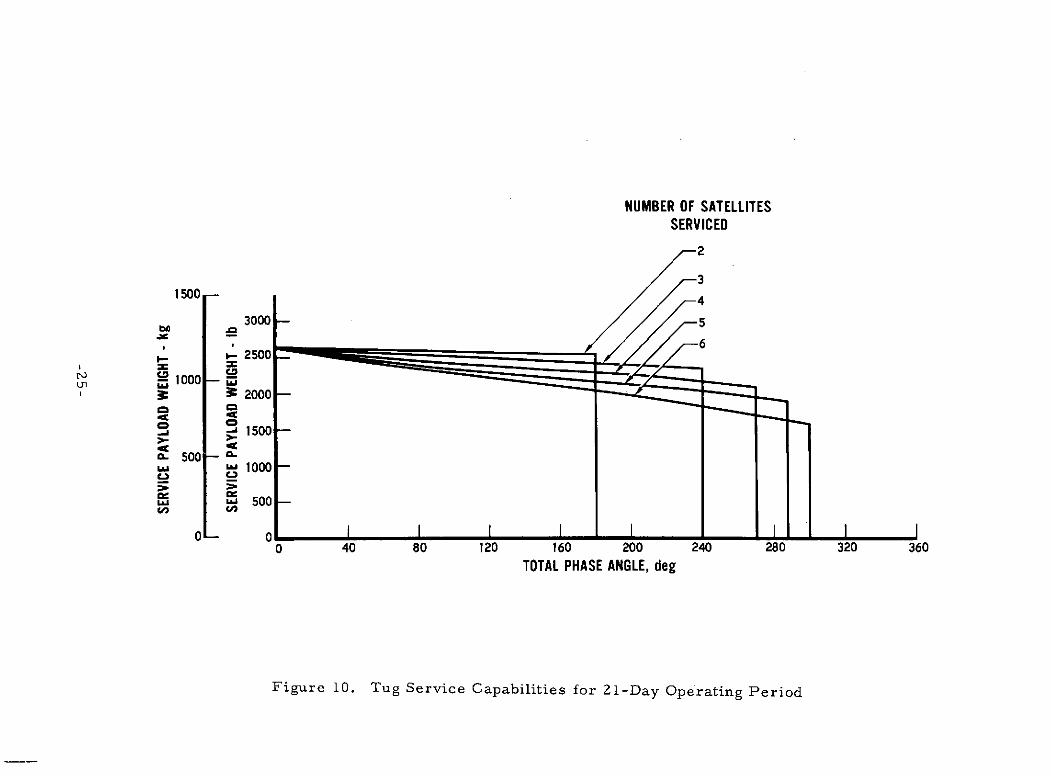
Extending the Tug mission life to 21 days provides a substantial
improvement in servicing capability as shown in Figure 10. The initial
capability is lower due to the increase in consumables required for attitude
control, power, and boiloff. As many as six or more payloads could be
serviced over a 300-deg phase angle. Over 113 kg (250 lb) could be trans-
ported to each payload. It will be shown in Section 3 that this weight
represents a reasonable value of space-serviceable modules.
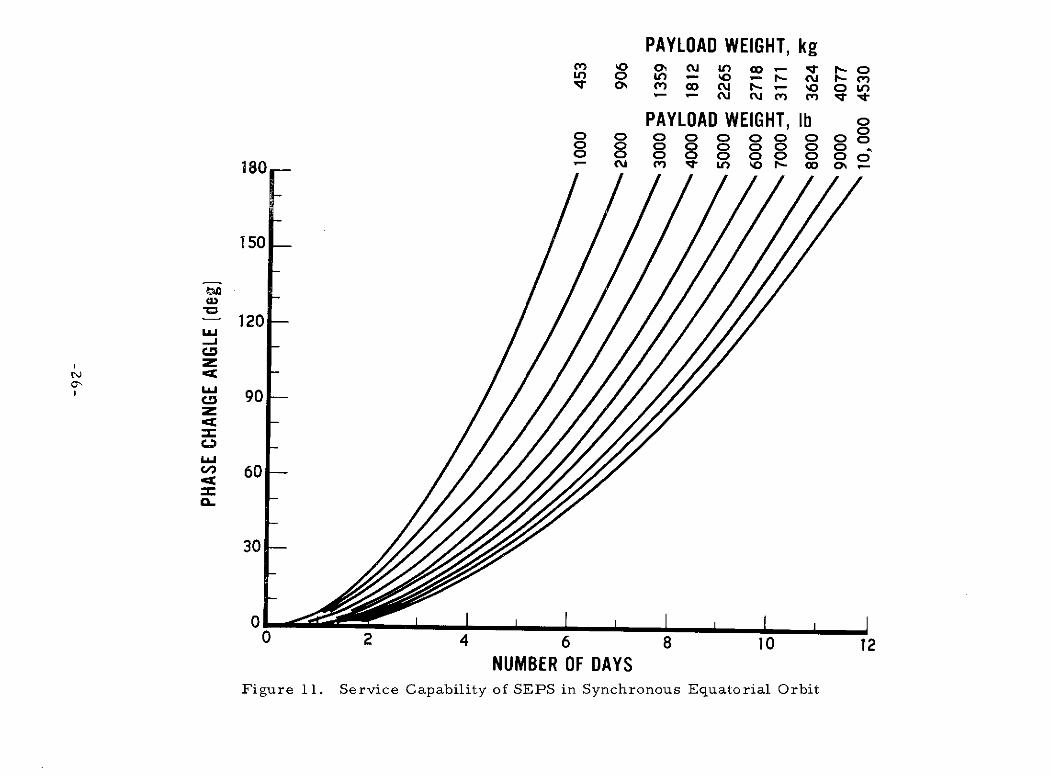
Applying this same idea to the use of a SEPS stationed at
synchronous equatorial orbit results in a further increase in capability
within reasonable time constraints. As shown in Figure 11, the SEPS can
-22-
* SATELLITES DISTRIBUTEDEQUALLY OVER GIVENPHASE ANGLE NUMBER OF SATELLITES
* 6 SATELLITES CANNOT BE SERVICEDSERVICED
1500-
o--4S2500 -
"1000 -U 2000 - 5
1 500
Ca1000 -
.= a: 500-€C,
0 40 80 120 160 200 240 280 320
TOTAL PHASE ANGLE, deg
Figure 8. Tug Service Capabilities for Seven-Day Operating Period
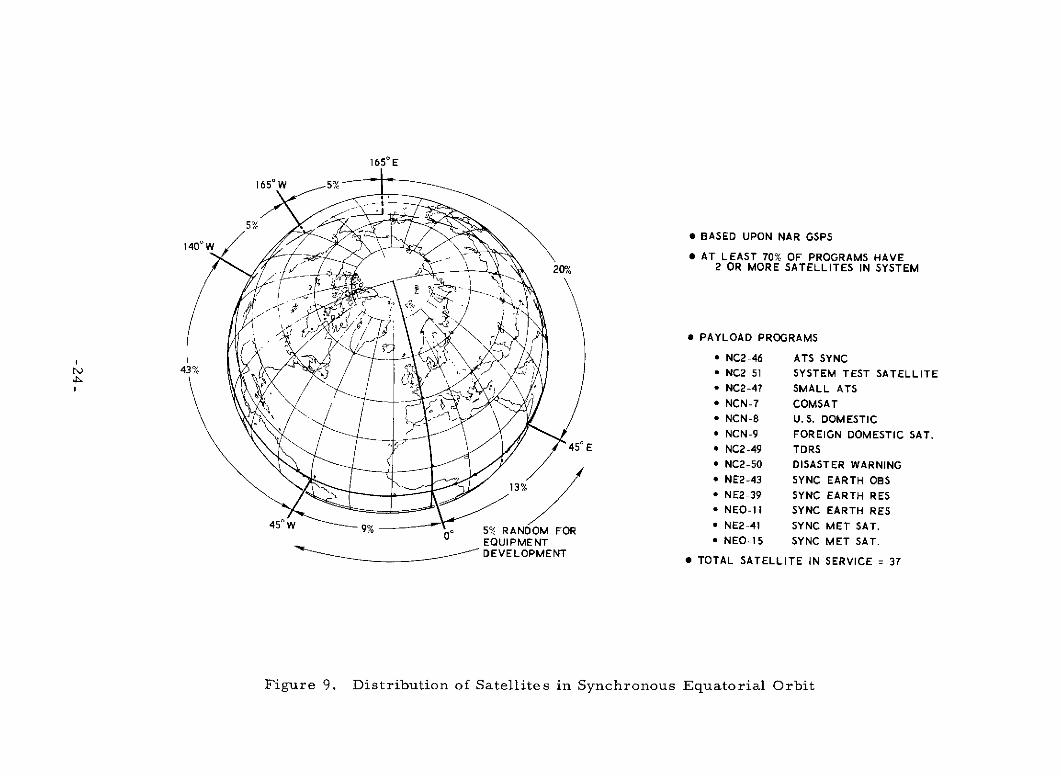
5%* BASED UPON NAR GSPS
* AT LEAST 70% OF PROGRAMS HAVE20% 2 OR MORE SATELLITES IN SYSTEM
* PAYLOAD PROGRAMS
* NC2-46 ATS SYNC* NC2-51 SYSTEM TEST SATELLITE* NC2-47 SMALL ATS* NCN-7 COMSAT* NCN-8 U.S. DOMESTIC* NCN-9 FOREIGN DOMESTIC SAT.
45E * NC2-49 TDRS* NC2-50 DISASTER WARNING* NE2-43 SYNC EARTH OBS
13% NE2-39 SYNC EARTH RES
* NEO-11I SYNC EARTH RES450W 9% 0 o 5% RANDOM FOR * NE2-41 SYNC MET SAT.
EQUIPMENT * NEO-15 SYNC MET SAT.DEVELOPMENT DEVELOPMENT TOTAL SATELLITE IN SERVICE = 37
Figure 9. Distribution of Satellites in Synchronous Equatorial Orbit
NUMBER OF SATELLITESSERVICED
2
1500 4
3000 - 5
m 1000 03: 3C 2000
S1500
oS 1000 -
I I I I0 40 80 120 160 200 240 280 320 360
TOTAL PHASE ANGLE, deg
Figure 10. Tug Service Capabilities for 21-Day Operating Period
PAYLOAD WEIGHT, kgLO a LO - CO r.-- cV 0 CO M 00 CM -- kO 0 )
-(U CU ) M m
PAYLOAD WEIGHT, Ib o0 O 0000 0000 0 000 0000180 -- a C Q a C a
180 (U (( m M V ) O - 0 O
150
120
90
60I
30
0 2 4 6 8 10 12NUMBER OF DAYS
Figure 11. Service Capability of SEPS in Synchronous Equatorial Orbit
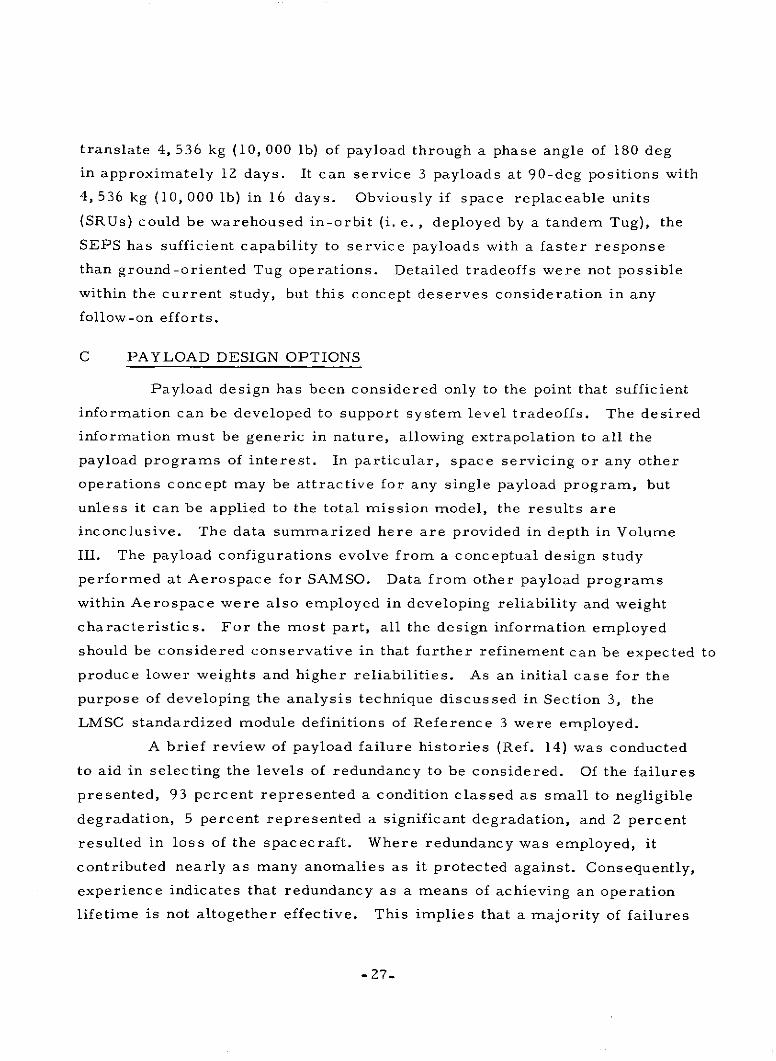
translate 4, 536 kg (10, 000 Ib) of payload through a phase angle of 180 deg
in approximately 12 days. It can service 3 payloads at 90-deg positions with
4, 536 kg (10, 000 lb) in 16 days. Obviously if space replaceable units
(SRUs) could be warehoused in-orbit (i. e., deployed by a tandem Tug), the
SEPS has sufficient capability to service payloads with a faster response
than ground-oriented Tug operations. Detailed tradeoffs were not possible
within the current study, but this concept deserves consideration in any
follow-on efforts.
C PAYLOAD DESIGN OPTIONS
Payload design has been considered only to the point that sufficient
information can be developed to support system level tradeoffs. The desired
information must be generic in nature, allowing extrapolation to all the
payload programs of interest. In particular, space servicing or any other
operations concept may be attractive for any single payload program, but
unless it can be applied to the total mission model, the results are
inconclusive. The data summarized here are provided in depth in Volume
III. The payload configurations evolve from a conceptual design study
performed at Aerospace for SAMSO. Data from other payload programs
within Aerospace were also employed in developing reliability and weight
characteristics. For the most part, all the design information employed
should be considered conservative in that further refinement can be expected to
produce lower weights and higher reliabilities. As an initial case for the
purpose of developing the analysis technique discussed in Section 3, the
LMSC standardized module definitions of Reference 3 were employed.
A brief review of payload failure histories (Ref. 14) was conducted
to aid in selecting the levels of redundancy to be considered. Of the failures
presented, 93 percent represented a condition classed as small to negligible
degradation, 5 percent represented a significant degradation, and 2 percent
resulted in loss of the spacecraft. Where redundancy was employed, it
contributed nearly as many anomalies as it protected against. Consequently,
experience indicates that redundancy as a means of achieving an operation
lifetime is not altogether effective. This implies that a majority of failures
-27.
are not random but rather are design deficiencies, either due to improper
design or a poor knowledge of the environment. Although the reliability of
satellites should continue to improve with experience, it can be expected
that these two factors will continue to influence the failure characteristics.
Space servicing provides one means by which satellites can be
maintained in an operational condition. If the failure occurrence of a
particular element is determined to be a design deficiency, the design can
be corrected and then be installed in all satellites with common equipment.
Redundancy would not necessarily provide the same operational capability.
It is prudent, however, to maintain a minimal level of redundancy or
redundant modes to support serviceability if required. As an example,
backup attitude stabilization should be provided to allow docking. Backup
transmitters should also be provided to support diagnosis of the failure
condition. Therefore, for the current study, redundancy of satellite
components has been minimized as will be shown later.
Another key item in considering space servicing as an operational
concept relates to payload availability. This term represents the ratio of
the time the payload is operating on orbit to the design life of the satellite.
A 95 percent availability inplies that 5 percent of the time the satellite is
not functioning as desired or to minimum specification. If a failure occurs
which interrupts payload operations until the failure can be repaired, this
represents the unavailable time; that is, the satellite is unavailable to the
user. The user requirements are unknown but would obviously vary over a
wide range depending upon the value of the data being obtained. The
Aerospace studies performed for SAMSO were directed at maintaining a high
availability for national security. Non-NASA domestic satellites desire a
high availability because of a direct relationship to revenues. However,
NASA experimental and developmental satellite programs may not require
a high availability due to the associated logistics costs. Since a valid
criterion does not exist, this parameter will be treated as a variable in
subsequent analyses. Because of its importance to the servicing policy,
the term will be repeatedly mentioned.
-28
Payload design information evolved from several sources. In the
final selection of data, it should be recognized that a certain degree of
engineering judgment was required to compile a sufficiently complete set of
data to support trade studies. The major source of payload design
information was developed by reconfiguring the NASA Earth Observatory
Satellite (NE2-38 EOS) to be space serviceable. This satellite is sufficiently
large and complex that design envelopes based upon modularization will
encompass a majority of the remaining satellites. Consequently, extrapolation
to other satellites should inherently be conservative. The reconfiguration
was based upon the initial work performed by Aerospace on the Defense
Support Program Satellite, utilizing detail design approaches where
applicable. The principal reason for this selection is that the payloads are
modularized around a 3. 0-m (10-ft) diameter ring frame. The entire
payload will fit into a volume of 4. 6 m (15 ft) in diameter by approximately
1.5 to 2.4 m (5 to 8 ft) in depth. With this approach, the payloads can be
assembled in the Shuttle payload bay as shown in Figure 12. This should
improve the logistic vehicle utilization mentioned previously. Other
payload data from previous analyses of SAMSO programs was used in
arriving at reliability and weight estimates.
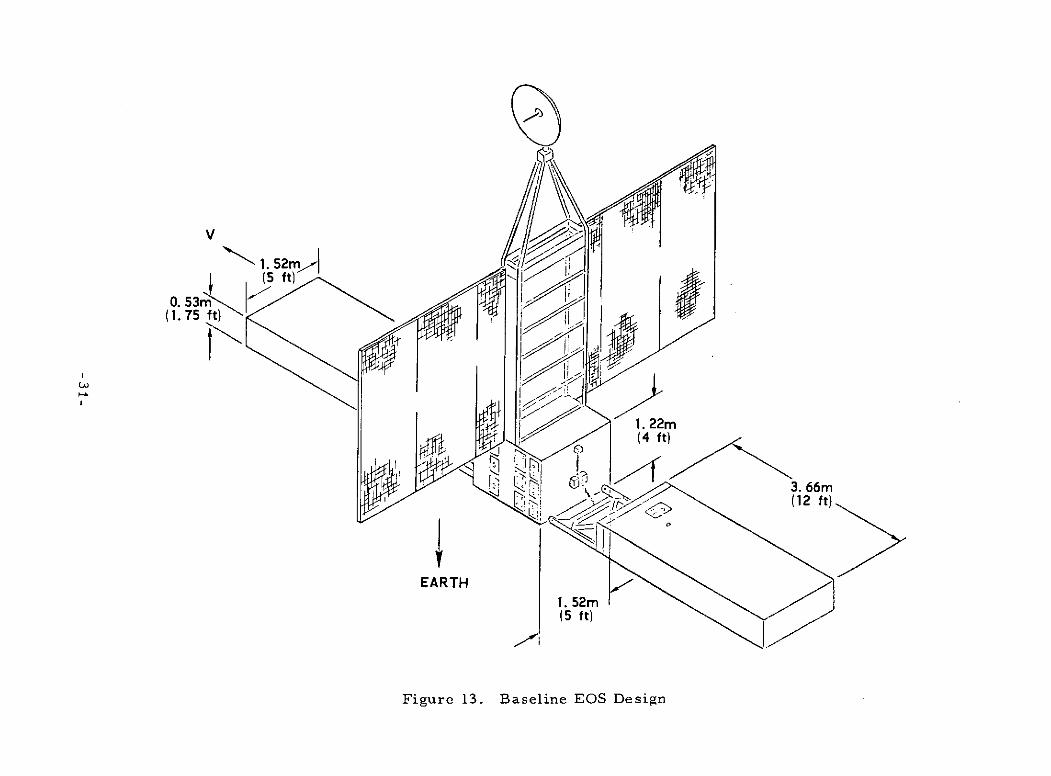
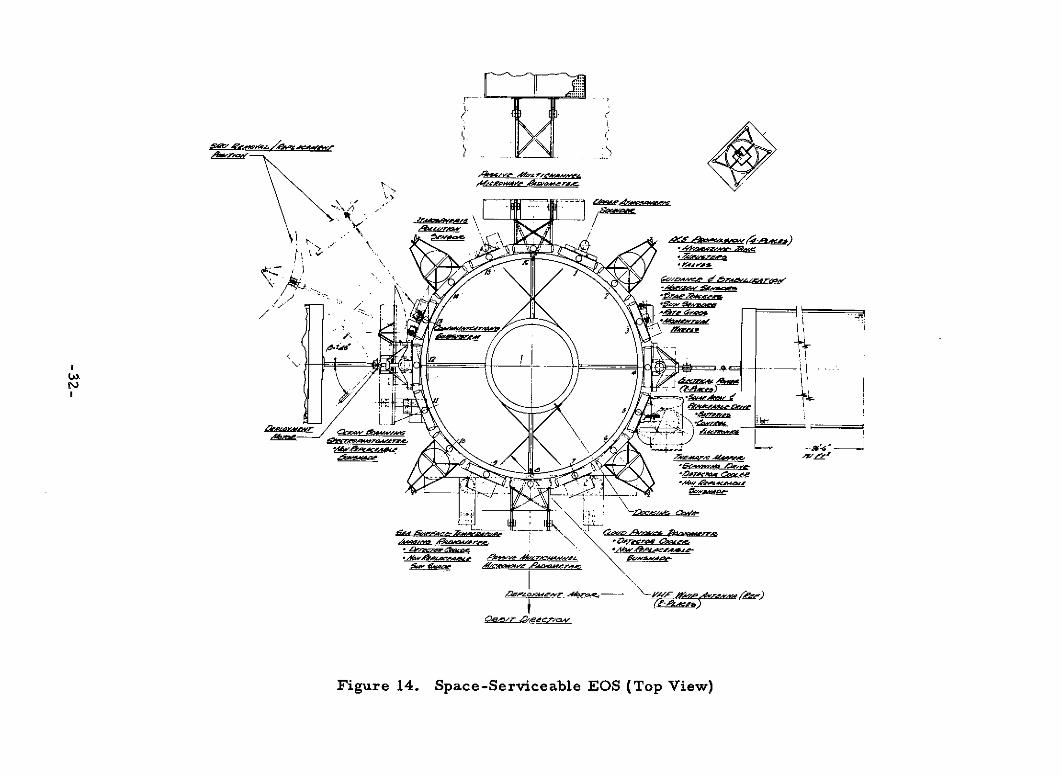
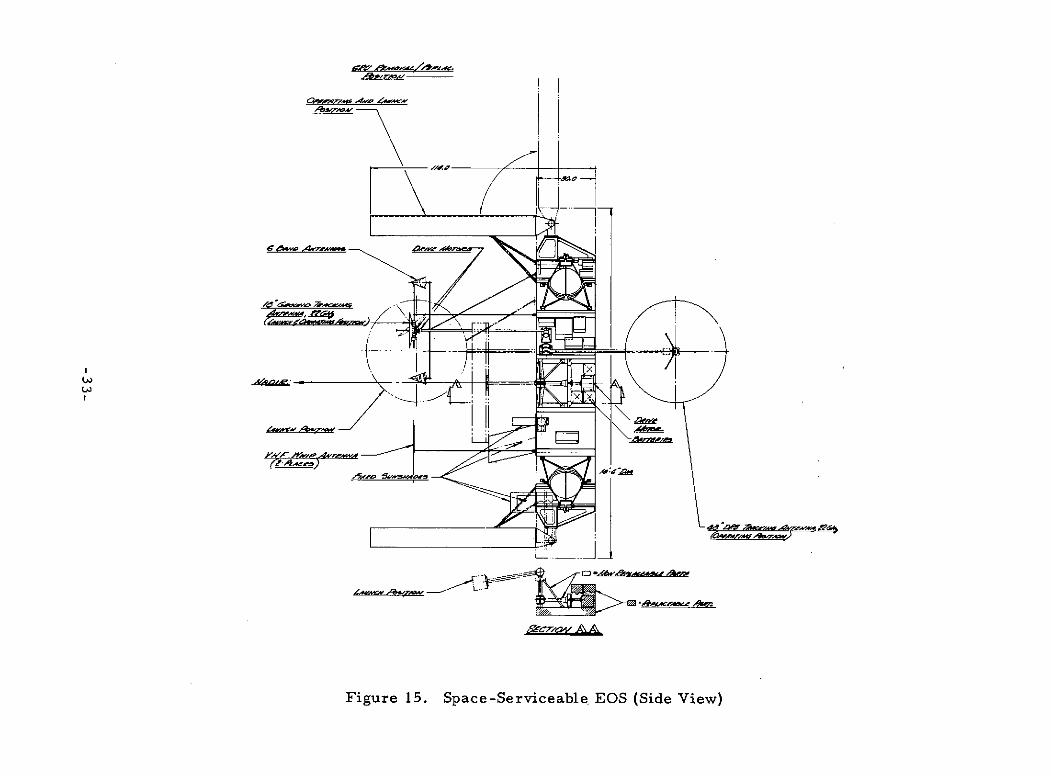
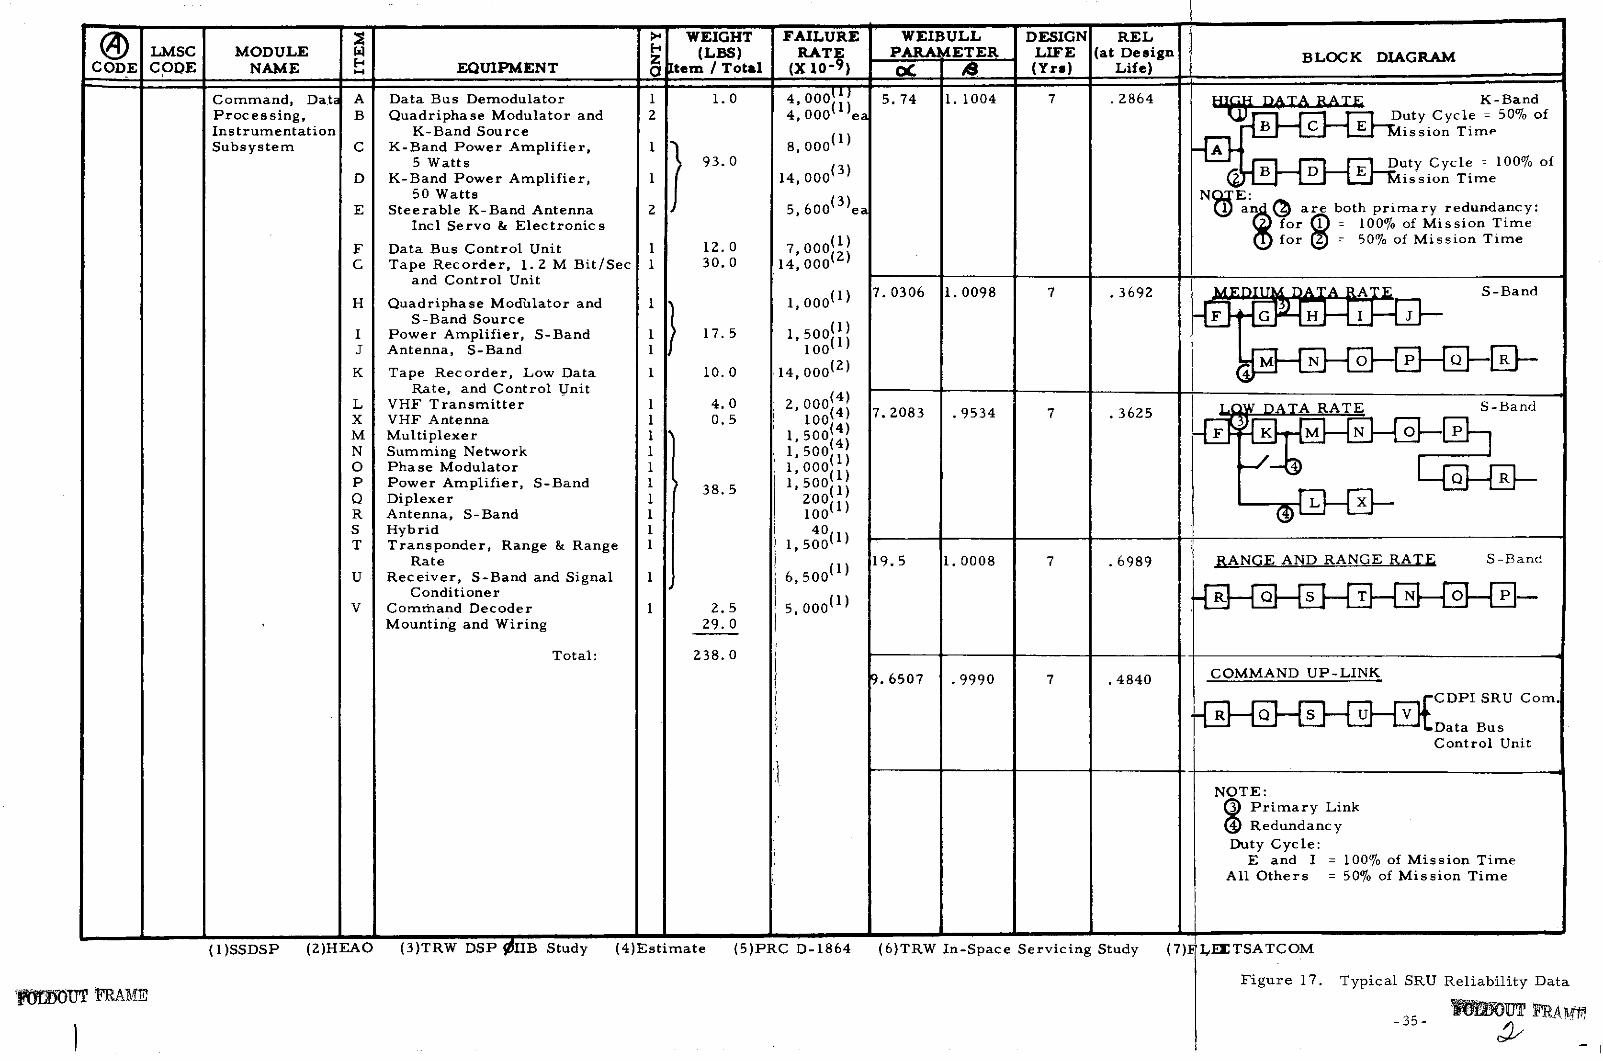
A view of the baseline EOS (Ref. 15) is shown in Figure 13. The
reconfigured EOS is shown in Figures 14 and 15. The mission equipment
sensors have been packaged as independent modules. The remaining
modules accommodate subsystems. Several alternatives are available in
terms of new mission equipment, alternate attitude control systems, etc.,
but for the purpose of this study, this design is sufficient to bracket module
sizes and weights. The payload weight increased from 1, 724 to 2, 313 kg
(3, 800 to 5, 100 lb). A more compact design could be achieved, but this
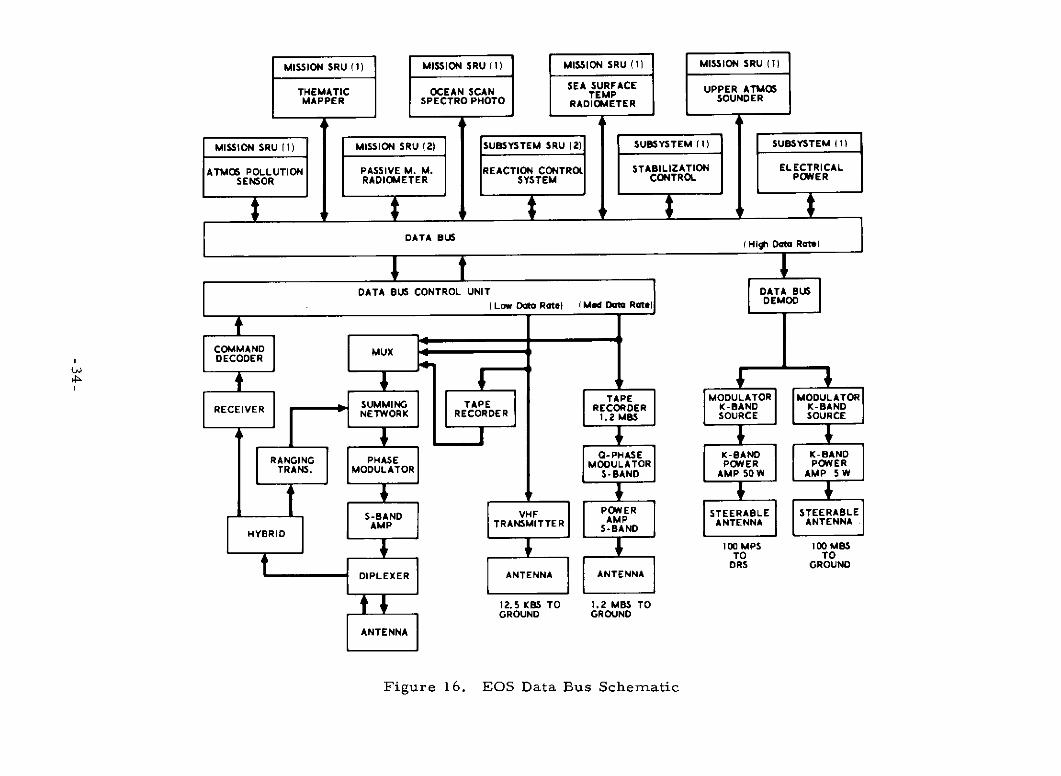
approach was considered to be reasonable and conservative. A schematic
of the data bus interfaces is shown in Figure 16. Each module was defined
to the component level to allow development of reliability block diagrams.
An example is shown as Figure 17. The Weibull parameters shown are
used in Section 3 to predict the random failure times.
-29-
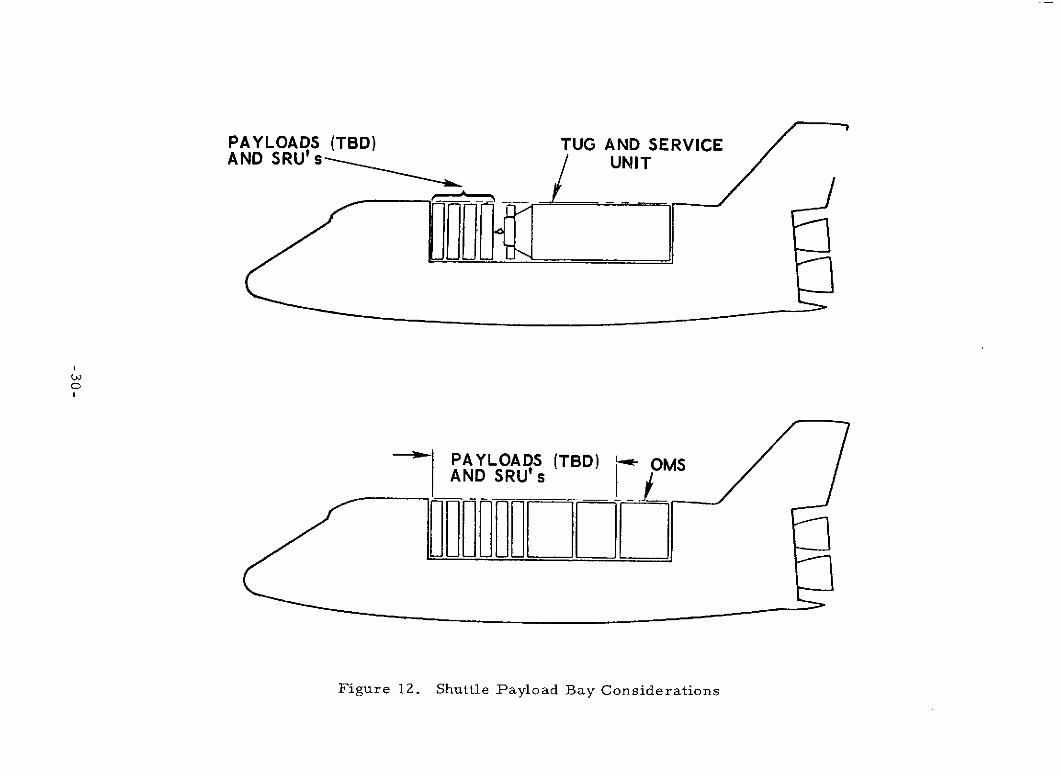
PAYLOADS (TBD) TUG AND SERVICEAND SRU's UNIT
PAYLOADS (TBD) OMS'AND SRU's O o
Figure 12. Shuttle Payload Bay Considerations
. 521.52m(5(5 ft)ft)
0. 513. Baseline EOS Desi(1. 75 ft) -
EARTH
Figure 13. Baseline EQS Design
satvasa
F----
-r -
//o
Figure 14 pce-eviebe Toi
*AA %4coacussac
Figre14 SpA~ace-Sevicabl EQ (To View)
* v mdese*a .& wra*,MwAecamnts - cws A sass
1ecv ,Reaswere\
yrGeCYS aDaaercreeevr~
Fiur 14.L Soc-eriebe O To w
-s --
(DO
a2cl7a4W AA
Figure 15. Space-Serviceable EOS (Side View)
MISSION SRU (1) MISSION SRU (1) MISSION SRU1 MISSION SRU ) MION RU (1)
THEMATIC OCEAN SCAN SEA SURFACE UPPER ATMOSTHEMATIC SCAN TEMP SOUNDERMAPPER 5PECTRO PHOTO RADIOMETERSOUNDER
MISSION SRU (1) MISSION SRU (2) SUBSYSTEM SRU (2)
SUBSYSTEM(I) SUBSYSTEM (1)
ATMOS POLLUTION PASSIVE M. M. REACTION CONTROL STABILIZATION ELECTRICALSENSOR RADIOMETER SYSTEM CONTROL POWER
DATA BS(HighI Data Rate)
DATA BUS CONTROL UNIT DATA BUS(Low Data Rate) Med Data Rate) DEMOD
COMMAND MUXDECODER
TAPE MODULATOR MODULATORRECEIVER SUMMING TAPE RECORDER K-BAND K-BAND
NETWORK RECORDER 1.2 MBS SOURCE SOURCE
O-PHASE K-BAND K-BANDRANGING PHASE MODULATOR POWER POWER
TRANS. MODULATOR S-BANDO AMP 50 W AMP 5 W
S-BAND VHF POWER STEERABLE STEERABLEAMP TRANSMITTER S-BAND ANTENNA ANTENNA
HYBRID100 MPS 100 MBS
TO TODRS GROUND
DIPLEXER ANTENNA ANTENNA
12.5 KBS TO 1.2 MBS TOGROUND GROUND
ANTENNA
Figure 16. EOS Data Bus Schematic
> WEIGHT FAILURE WEIBULL DESIGN RELLMSC MODULE W (LBS) RATE PARAMETER LIFE (at Design BLOCK DIAGRAM
CODE CODE NAME EQUIPMENT a Item / Total (X 10- ) L 0 (Yrs) Life)
Command, Data A Data Bus Demodulator 1 1.0 4, 000" 5.74 1. 1004 7 .2864 DATA RATE K-BandProcessing, B Quadriphase Modulator and 2 4, 000(l)ea DutyInstrumentation K-Band Source B C E ission TimeSubsystem C K-Band Power Amplifier, 1 8, 000 A
5 Watts 93.0 Duty Cycle 100% ofD K-Band Power Amplifier, 1 14, 000 2 ission Time
50 Watts N E:50) W atts 2) (oth primary redundancy:E Steerable K-Band Antenna 2 5,600(3)ea an are both primary redundancy:Incl Servo & Electronics for = 100% of Mission Time
(1) for = 50% of Mission TimeF Data Bus Control Unit 1 12.0 7,000,(.C Tape Recorder, 1. 2 M Bit/Sec 1 30.0 14, 000(2)
and Control Unit
H Quadriphase Modulator and 1 1,00(1) 7.0306 1.0098 7 .3692A
S-Band Source F G H I JI Power Amplifier, S-Band 1 17.5 1, 500 1 )
J Antenna, S-Band 1 1000
K Tape Recorder, Low Data 1 10.0 14, 000 ( )Rate, and Control Unit
L VHF Transmitter 1 4.0 2,000 ) DATA RATEX VHF Antenna 1 0.5 100(4) .2083 .9534 7 .3625M Multiplexer 1 1, 500(4)N Summing Network 1 1, 500(4)
O Phase Modulator 1 1,000(1)P Power Amplifier, S-Band 1 38.5 1, 500 1)
Q Diplexer 1 200= , XR Antenna, S-Band 1 1001)S Hybrid 1 40T Transponder, Range & Range 1 1,500(1)
Rate (1) 19.5 1.0008 7 .6989 RANGE AND RANGE RATE S-BandU Receiver, S-Band and Signal 1 6,500
Conditioner (1)V Command Decoder 1 2.5 5, 000(1 )Mounting and Wiring 29.0
Total: 238.0
.6507 .9990 7 .4840 COMMAND UP-LINK
CDPI SRU Comn
Control Unit
NOTE:P rimary LinkRedundancy
Duty Cycle:E and I = 100% of Mission Time
All Others = 50% of Mission Time
(1)SSDSP (2)HEAO (3)TRW DSP IIB Study (4)Estimate (5)PRC D-1864 (6)TRW In-Space Servicing Study (7) LEETSATCOM
Figure 17. Typical SRU Reliability Data
-35-
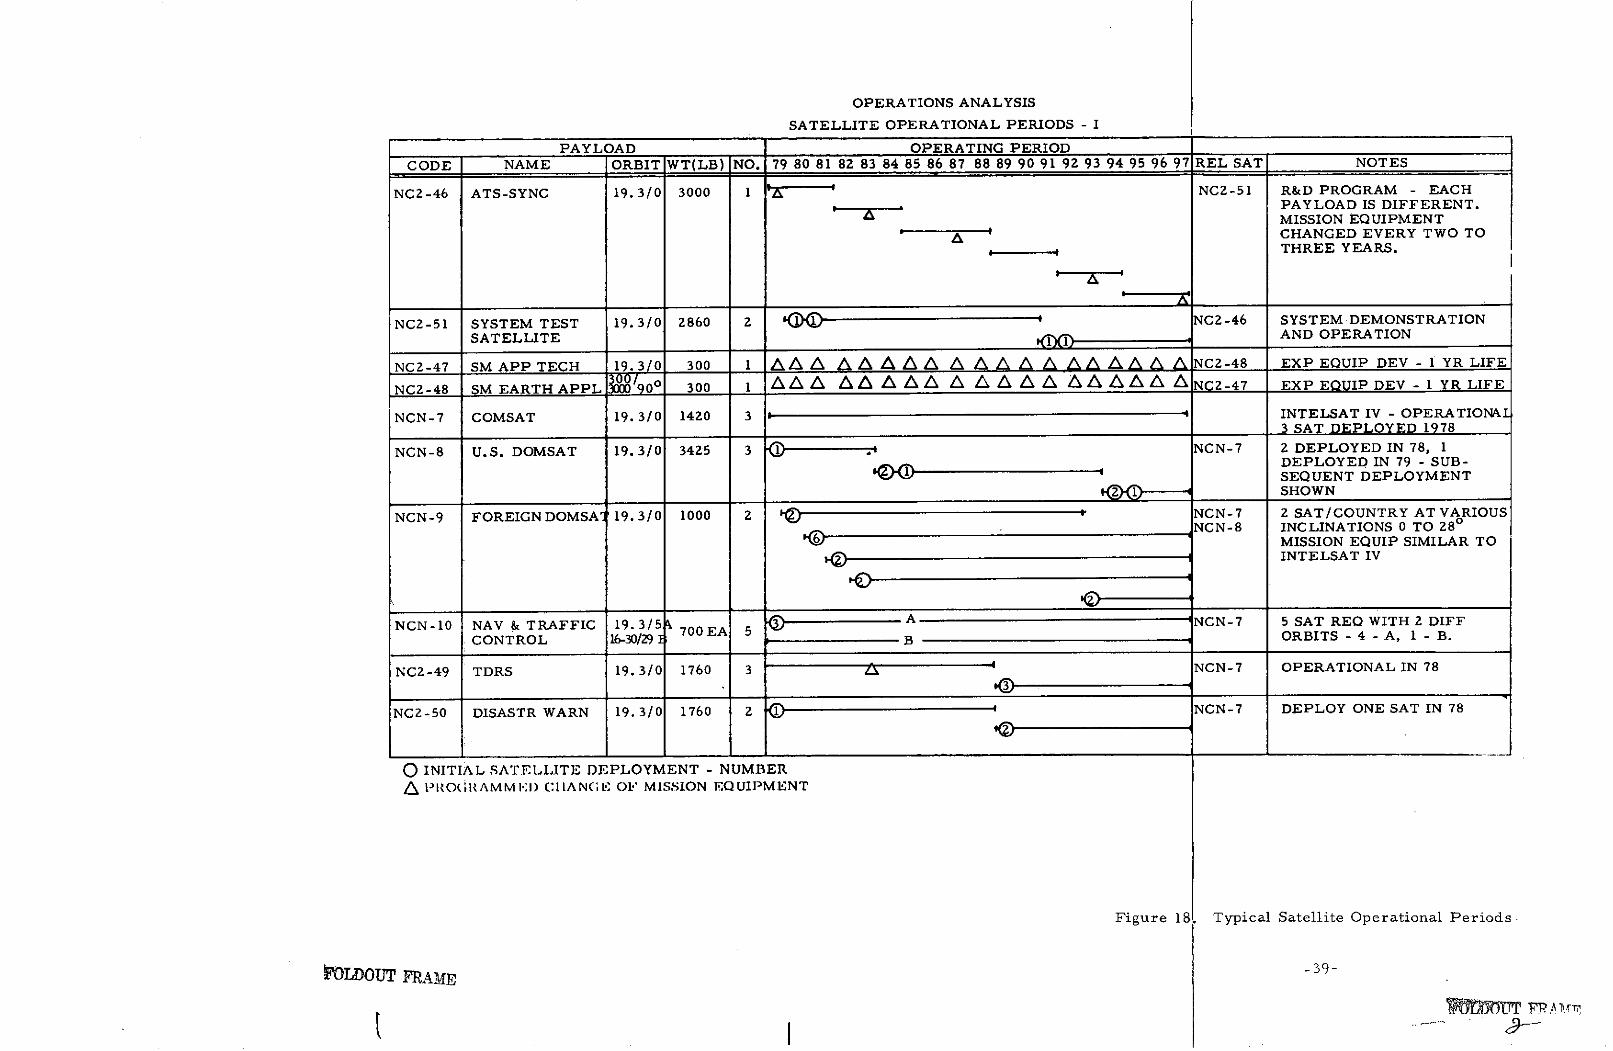
Before going into the mission equipment modularization, it is
necessary to identify those payloads which may benefit by use of space
servicing. A typical set of missions is shown in Figure 18. This figure
identifies the payload, when it is deployed, when block changes have been
scheduled, and when the payload is to be retrieved for refurbishment. This
schedule was developed from the information in Reference 5. The satellites
of interest can be further subdivided into generic design groups as shown in
Table 4. Eight programs are of the ComSat type, having characteristics
similar to Intelsat IV. Ten programs fall in the earth observations earth
resources group, each having similar equipment. Seven programs are
primarily scientific in nature and must be treated on an individual basis,
although there are direct similarities within this set. Four additional
programs use small satellites, scheduled on one- to two-year launch centers.
These can be treated as single modules to be deployed with other modules
but not to be serviced if a failure occurs.
Allocation of mission equipment modules to these payloads has
been performed based upon the available information in References 1 and 2.
A typical set of assignments is shown in Table 5. Although similar
equipment may be employed, it is reasonable to expect the users to be
interested in different applications such as number and type of spectral
bands. A thermal analysis indicated that solid cryogenic cooling was
preferred to allow flexibility in module applications. This has been included
in the module weights. However, an additional weight for base plate, inter-
connects, tracks, etc. of 22 kg (48 Ib) must be added to each module shown
to arrive at the total weight to be serviced.
The reliability definitions are the major point of concern. The
sophisticated sensors employed for earth observations have a current
operating life approximating six months. Extrapolating to the time period
of 1980 may support an upper bounds judgment of a two-year design life.
It appears impractical to expect longer time periods. It also is impractical
to enhance this life by adding redundancy, because of the wearout nature of
the failure modes. Deterioration of the mission data simply progresses to
the point of being unusable. Redundant modules (sensors) could be employed
-37- PRECEDING PAGE BLANK NOT FILMED
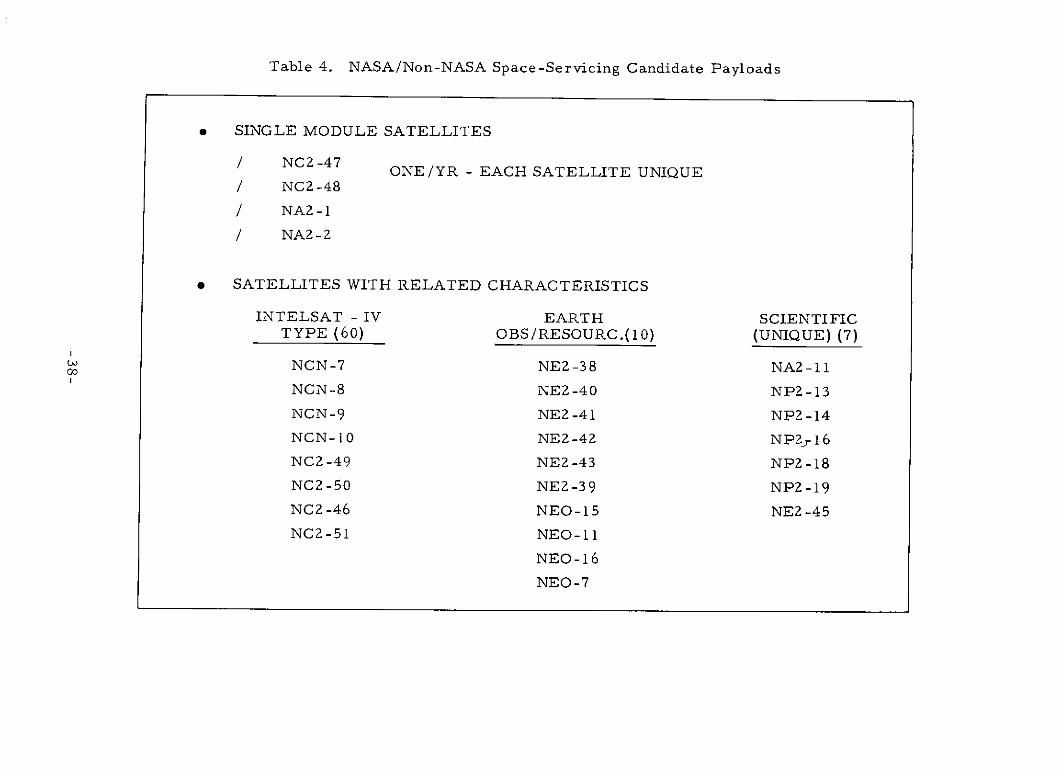
Table 4. NASA/Non-NASA Space-Servicing Candidate Payloads
* SINGLE MODULE SATELLITES
/ NC2 -47 ONE/YR - EACH SATELLITE UNIQUE/ NC2-48
/ NA2-1
/ NA2-2
* SATELLITES WITH RELATED CHARACTERISTICS
INTELSAT - IV EARTH SCIENTIFICTYPE (60) OBS/RESOURC.(10) (UNIQUE) (7)
NCN-7 NEZ-38 NA2 -11
NCN-8 NE2-40 NP2-13
NCN-9 NE2 -41 NP2-14
NCN-10 NE2-42 NP2r 16
NC2-49 NE2-43 NP2-18
NC2-50 NE2-39 NP2-19
NC2 -46 NEO-15 NE2-45
NC2-51 NEO-11
NEO-16
NEO-7
OPERATIONS ANALYSIS
SATELLITE OPERATIONAL PERIODS - I
PAYLOAD OPERATING PERIOD
CODE NAME ORBIT WT(LB) NO. 79 80 81 82 83 84 85 86 87 88 89 90 91 92 93 94 95 96 97 REL SAT NOTES
NC2-46 ATS-SYNC 19.3/0 3000 1 NC2-51 R&D PROGRAM - EACHPAYLOAD IS DIFFERENT.MISSION EQUIPMENT
- A CHANGED EVERY TWO TOTHREE YEARS.
NC2-51 SYSTEM TEST 19.3/0 2860 2 NC2-46 SYSTEM DEMONSTRATIONSATELLITE _ AND OPERATION
NC2-47 SM APP TECH 19.3/0 300 1 aa A A a a A A A A A aA A A NCZ-48 EXP EQUIP DEV - 1 YR LIFE
NC2-48 SM EARTH APPL W90 300 1 AAA AAAAA A AAAA AAAAA ANC.2- 4 7 EXP EQUIP DEV - 1 YRLIFE
NCN-7 COMSAT 19.3/0 1420 3 INTELSAT IV - OPERATIONA3 SAT DEPLOYED 1978
NCN-8 U.S. DOMSAT 19.3/0 3425 3 ) NCN-7 2 DEPLOYED IN 78, 1DEPLOYED IN 79 - SUB-SEQUENT DEPLOYMENT
1SHOWN
NCN-9 FOREIGN DOMSA 19.3/0 1000 2 ' NCN-7 2 SAT/COUNTRY AT VARIOUSNCN-8 INCLINATIONS 0 TO 28
MISSION EQUIP SIMILAR TOINTELSAT IV
NCN-10 NAV & TRAFFIC 19.3/5 A NCN-7 5 SAT REQ WITH 2 DIFF
CONTROL 16-30/29 E B ORBITS - 4 - A, 1 - B.
NC2-49 TDRS 19.3/0 1760 3 NCN-7 OPERATIONAL IN 78
NC2-50 DISASTR WARN 19.3/0 1760 2 1 NCN-7 DEPLOY ONE SAT IN 78
O INITIAL SATELLITE DEPLOYMENT - NUMBER
A PIO(RAMM I:I) C(I AN(;L OF MISSION EQUIPMENT
Figure 18 Typical Satellite Operational Periods
POLDOUT FRAME -39-
L"O8JT .T
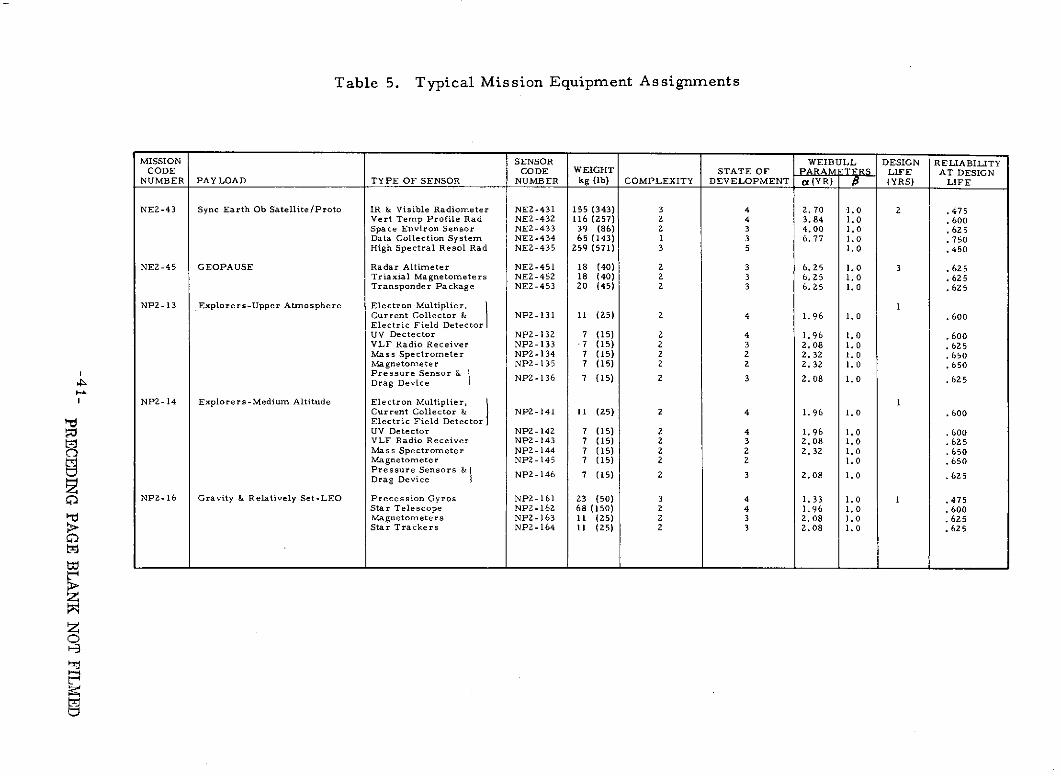
Table 5. Typical Mission Equipment Assignments
MISSION SENSOR WEIBULL DESIGN RELIABILITYCODE CODE WEIGHT STATE OF PARAMETERS LIFE AT DESIGN
NUMBER PAYLOAD TYPE OF SENSOR NUMBER kg (Ib) COMPLEXITY DEVELOPMENT a (YR) _ (YRS) LIFE
NE2-43 Sync Earth Ob Satellite/Proto IR & Visible Radiometer NE2-431 155 (343) 3 4 2.70 1.0 2 .475Vert Temp Profile Rad NE2-432 116 (257) 2 4 3.84 1.0 .600Space Environ Sensor NE2-433 39 (86) 2 3 4.00 1.0 .625Data Collection System NE2-434 65 (143) 1 3 6.77 1.0 .750High Spectral Resol Rad NE2-435 259 (571) 3 5 1.0 .450
NEZ-45 GEOPAUSE Radar Altimeter NE2-451 18 (40) 2 3 6.25 1.0 3 . 625Triaxial Magnetometers NEZ-452 18 (40) 2 3 6.25 1.0 .625Transponder Package NE2-453 20 (45) 2 3 6.25 1.0 .625
NP2-13 Explorers-Upper Atmosphere Electron Multiplier, 1Current Collector & NP2-131 11 (25) 2 4 1.96 1.0 .600Electric Field DetectorUV Dectector NP2-132 7 (15) 2 4 1.96 1.0 .600VLF Radio Receiver NP2-133 .7 (15) 2 3 2.08 1.0 .625Mass Spectrometer NP2-134 7 (15) 2 2 2.32 1.0 .650Magnetometer NPZ-135 7 (15) 2 2 2.32 1.0 .650
Pressure Sensor& NPZ-136 7 (15) 2 3 2.08 1.0 .6254P Drag Device
NP2-14 Explorers-Medium Altitude Electron Multiplier, 1Current Collector & NP2-141 11 (25) 2 4 1.96 1.0 .600Electric Field Detector IUV Detector NP2-142 7 (15) 2 4 1.96 1.0 .600VLF Radio Receiver NP2-143 7 (15) 2 3 2.08 1.0 .625Mass Spectrometer NP2-144 7 (15) 2 2 2.32 1.0 .650
Pressure Sensors &Magnetometer NP2-145 7 (15) 2 Z 1.0 .650
Drag Device nsors & NP2-146 7 (15) 2 3 2.08 1.0 .625
NPZ-16 Gravity & Relatively Set-LEO Precession Gyros NPZ-161 23 (50) 3 4 1.33 1.0 1 .475Star Telescope NPZ-162 68 (150) 2 4 1.96 1.0 .600Magnetometers NP2-163 11 (25) 2 3 2.08 1.0 .625Star Trackers NPZ-164 11 (25) 2 3 2.08 1.0 .625
w7
on high priority satellites, but the dormant failure rates have been estimated
to be between 25 and 50 percent of the active failure rate (Ref. 16).
Consequently, redundancy might add one more year of operation at best.
Therefore, the mission equipment was treated as non-redundant modules.
Mission equipment definitions for ComSats were developed based upon
experience with in-house Aerospace programs.
The LMSC standard subsystem modules were also investigated to
provide a basis of comparison with this design effort. Reliability block
diagrams were prepared and the estimated reliability developed. Application
of the modules to individual payload programs was taken from the LMSC
reports (Ref. 3). Combining these. with the mission modules provided the
definition of each complete payload to be used in the space-servicing analysis
of Section 3.
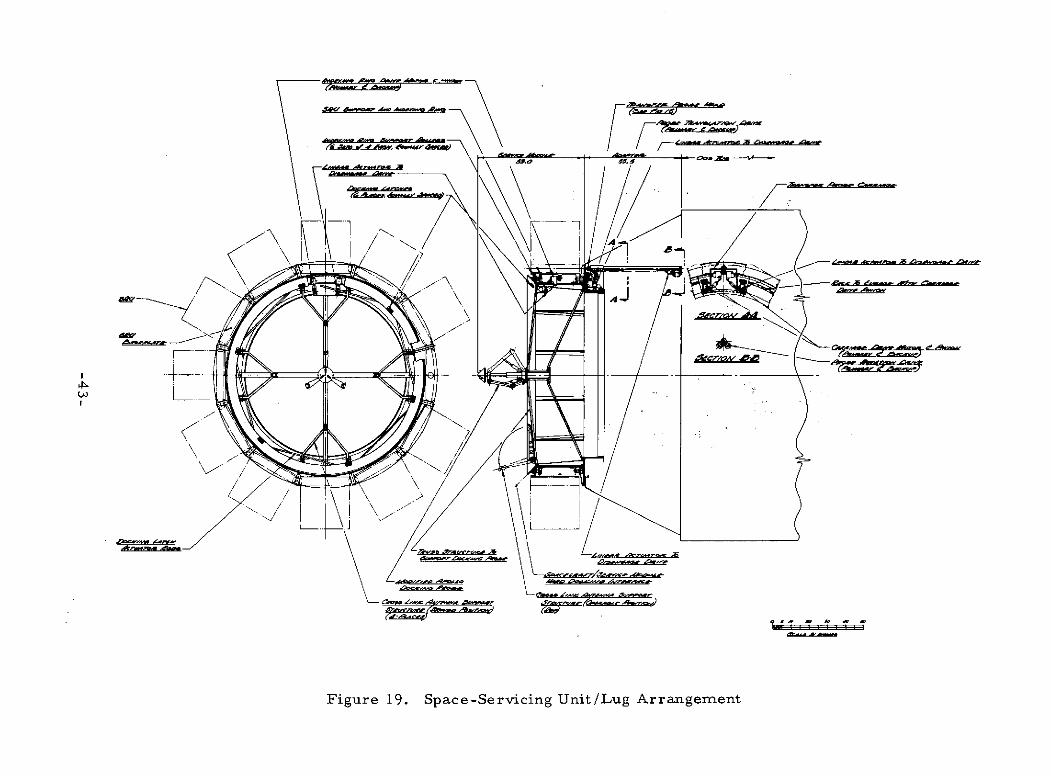
The final element in the design process is the service unit attached
to the front of the Tug. This design was developed for the Defense Support
Program (DSP) study and has been adapted in toto here. A detailed
description is given in Volume III of this report. The service unit is shown
in Figure 19, consisting of replacement modules around the periphery of an
indexing ring frame. At least one spare slot exists to accommodate the
failed module. After removing the failed module, the ring frame indexes
such that the replacement module is aligned properly with the payload. The
module is then translated into the payload, automatically engaging electrical
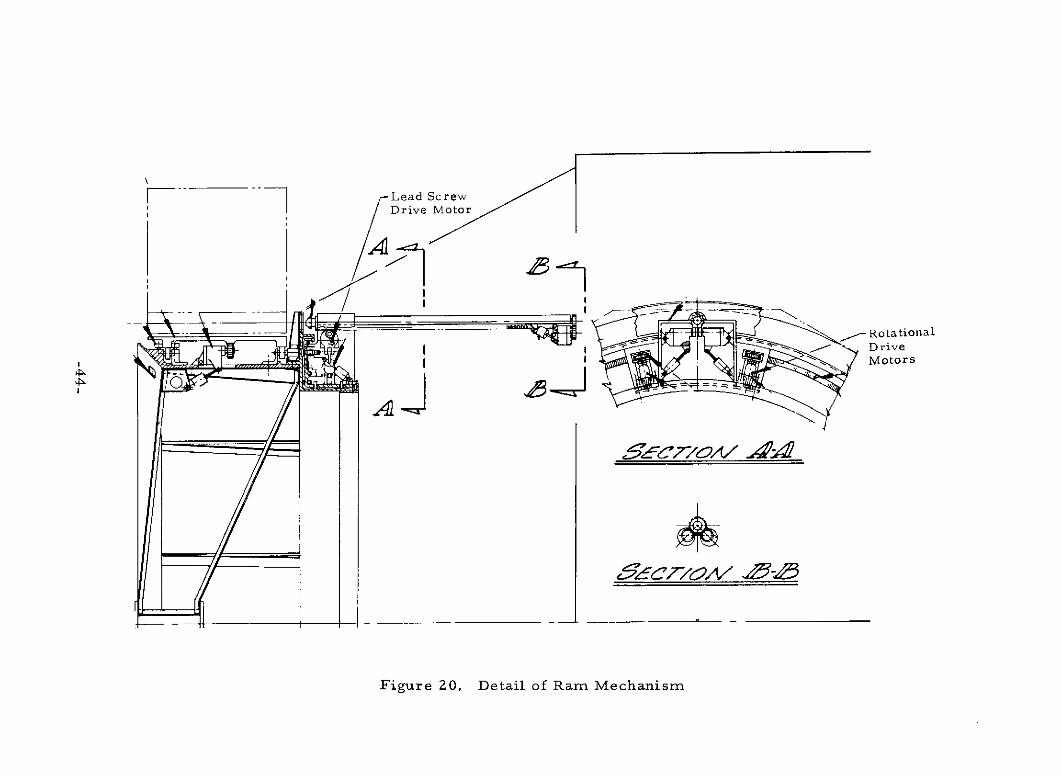
contacts. The design approach is shown in Figures 20 and 21. Numerous
design approaches by other contractors have been postulated, but in general
for the purpose here, the only important factor is the weight. The design
weight for this approach has been estimated at 91 kg (200 lb).
Whatever design is selected should provide for a mixture of module
installations or one cannot take advantage of multiple servicing operations.
This particular design uses very little Shuttle payload bay volume, and
could, if necessary, be collapsed further. In addition, the layout is such
that if redundancy of any actuation mechanisms is required there is
adequate space available. A further extension of this design deserves
consideration to allow both payload deployment and servicing functions to
-42-
- F-/
iur 9. pae e in n4 rrFgr 19 S cainga Un L rra
Lead ScrewDrive Motor
SRotationalD riveMotors
Figure 20. Detail of Ram Mechanism
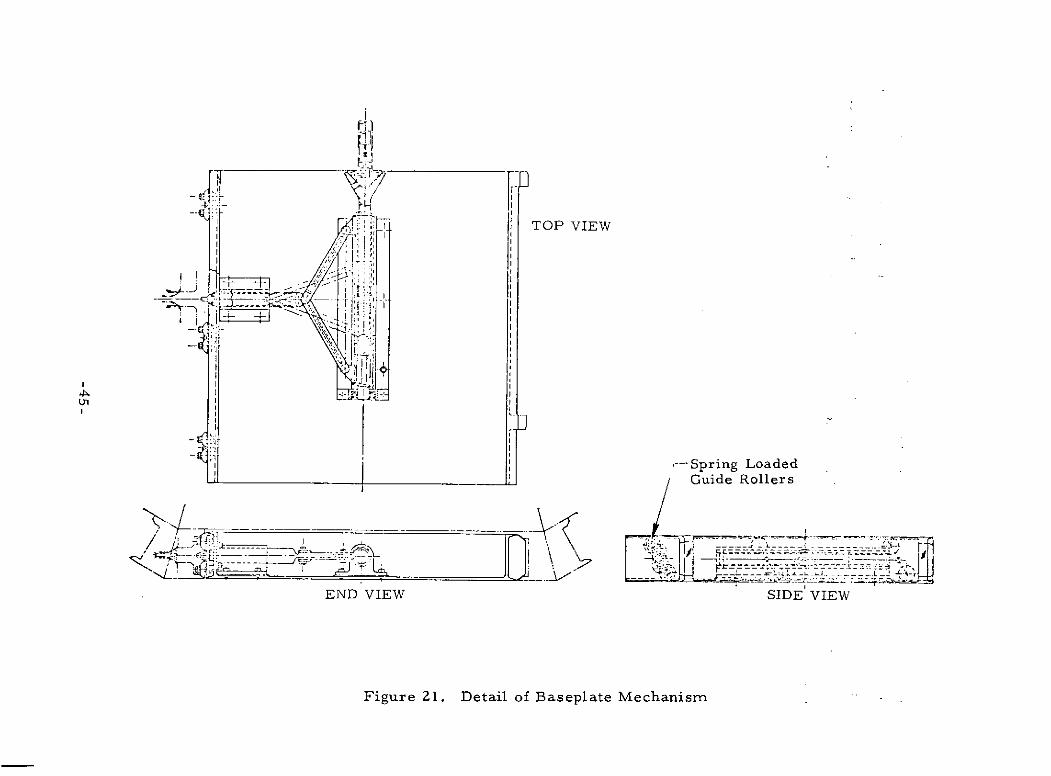
f , '_:1L TOP VIEW
. I
-- Spring LoadedGuide Rollers
END VIEW SIDE VIEW
Figure 21. Detail of Baseplate Mechanism
be performed by the same mission. This has not been addressed as yet
but there is no obvious reason why a payload could not be mounted on the
front of the servicing unit by one of several means. The new payload would
be deployed first, leaving the service module unhindered for servicing
operations.
-46-
3. SPACE-SERVICING CONCEPTS
Numerous approaches to space servicing can be postulated
depending upon such factors as availability, logistics costs, standardization
of SRUs, etc. The purpose of this section is to describe the analysis
technique for addreslsing the parameters and to define the ground rules used
in the two cases analyzed in this study. An extensive amount of work is yet
to be performed; consequently the information developed under this study
can only point toward trends relative to the cost of future operations if space
servicing is employed. The major points of concern can be summarized by
the following' questions.
Will total program costs be reduced by space servicing?
Will individual payload program costs be reduced by spaceservicing ?
Can system availability be maintained?
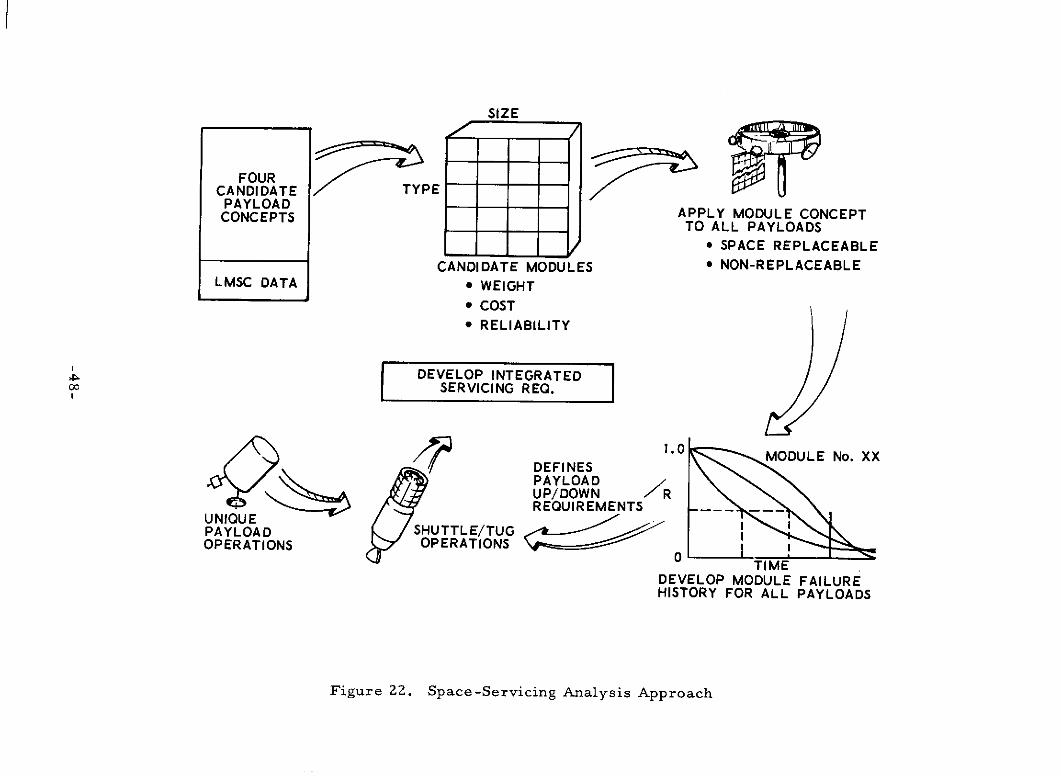
Space servicing will have a major impact on payload and logistic
vehicle designs. This impact in risk and cost must be weighed against
potential gains. The approach taken to perform this analysis is shown
schematically in Figure 22. This is a simplification of a rather complex
process but should serve as a basis for the results presented in Section 4.
The basic payload data obtained as the first step was described in Section 2.
This information is used to develop generic sets of subsystem and mission
equipment modules, weight, reliability, and costs. Candidate payloads from
the NASA mission model are then constructed from the module inventory,
allowing for basic structure, consumables, etc. as necessary to achieve a
representative weight for each payload program. The estimated time to
failure is then developed for each module, both space replaceable and non-
replaceable, by a random number process. For the space replaceable unit,
this defines when servicing is needed, and the replacement module is then
placed on the manifest to be shipped to orbit. When a sufficient load has
been established, the failed module is replaced and returned for refurbish-
ment. The cycle is repeated over the time period of interest.
-47.
SIZE
FOURCANDIDATE TYPEPAYLOADCONCEPTS
APPLY MODULE CONCEPTTO ALL PAYLOADS
* SPACE REPLACEABLE
CANDIDATE MODULES * NON-REPLACEABLELMSC DATA * WEIGHT
* COST* RELIABILITY
SDEVELOP INTEGRATEDSERVICING REQ. .MODULE No. XX
DEFINES MODULE No. XXPAYLOAD /UP/DOWN / RREQUIREMENTS
UNIQUEPAYLOAD SHUTTLE/TUGOPERATIONS OPERATIONS
TIMEDEVELOP MODULE FAILUREHISTORY FOR ALL PAYLOADS
Figure 22. Space-Servicing Analysis Approach
The results are integrated with other payload programs which are
not space serviceable to obtain total traffic requirements. The logistic
costs can then be apportioned between the various programs according to
weight or volume criteria. Further, although some payloads may not be
serviceable, they. may be modularized. The integrated number of modules,
by type, is required to develop the cost profile and production rate.
Certain ground rules have been employed in the process of selecting
candidate payloads for space servicing. Planetary payloads have been
excluded for obvious reasons; however, if cost benefits accrue, the payloads
could be modularized. Man-tended programs such as High Energy
Astronomical Observatory (HEAO) and the Large Stellar Telescope (LST)
were excluded because dedicated servicing has been scheduled a priori.
Also there is little commonality in the design approach with automated
payloads. Space station and sortie modules have been excluded for the
same reasons. Finally, small payloads such as Explorers which weigh
approximately 136 kg (300 lb) have been treated as single modules and in
general will not be serviced. In the sample cases analyzed under this study,
the payloads were further restricted to synchronous equatorial orbit to keep
the effort within scope. A complete analysis would encompass the total set
of candidate payloads.
The next point to be considered is the selection of a space-
servicing policy. This is in effect a definition of criteria to.be employed to
decide when and what satellites are to be serviced. Various policies have
been postulated, each having certain benefits, but until they can be applied
to a specific mission model, it is not possible to judge their merits. The
simplest policy is to replace modules after a failure has occurred and only
replace the failed SRUs. In this event, a large number of logistic flights-
would be required with inefficient load factors.
It can also be anticipated that two to four weeks of satellite down-
time (unavailability) will occur before servicing can be effected. This
assumes that replacement modules are available in stock and that the next
available launch date can be scheduled for servicing.
-49-
This policy can be extended further by stipulating a loading policy
for the logistic vehicle. For example, Tug operations can be constrained
until a weight load factor equals or exceeds 80 percent of the vehicle's
performance capability. This improves the efficiency of Tug operations,
but the first satellite to experience a failure may wait months or years
before other random failures accumulate modules sufficient to initiate a
flight. Another alternative is to impose no longer than a defined unavailability,
such as six months. At this time, if the load factor has not been achieved,
the service operation is initiated anyway. It can also be assumed that
servicing of existing satellites can be coupled with the initial deployment of
a new satellite.
Other policies point toward preventive maintenance servicing.
Satellites to be serviced are designed to provide a warning signal prior to
an outage occurrence. This triggers the service operation. In this way
there is a high probability that at least one string of modules in a satellite
is functioning continuously. This requires a high degree of redundancy,
imposing higher weights and cost, but may be justified where high availability
is required.
Further application can be made to a system of satellites. If a
failure or warning signal occurs in one satellite, it is reasonable to expect
the same condition to propagate to the remaining satellites in the system.
Consequently, when one satellite is serviced, all satellites in the system are
serviced. This generally results in a high availability but increases the
number of modules in the inventory. If, however, the failure is not a
design problem but is random in nature, a large number of modules would
be replaced unnecessarily.
The ultimate in redundancy is achieved when, instead of spare
modules, a spare satellite is placed in orbit. As an example, a system
requiring three at all times would be composed of four. When one satellite
fails, the spare is employed until servicing of the failure has been completed.
The initial deployment results in higher costs but availability approaches
100 percent provided the spare satellite is in the correct orbital position to
assume the activity of the failed satellite.
-50-
The options available for space servicing are extensive and
probably in the final analysis will be some mix of criteria which reflects
the availability requirements of each payload program. The final judgment
has to revert to economics to the payload user. For this reason, it has
been proposed that a statistical computer program be developed for use in
performing tradeoffs of servicing policies. A specification for this program
was prepared (Vol. IV) for implementation as a follow-on effort. The
current study was limited to the following two cases, performed manually.
A CASE 1: LMSC STANDARD MODULES
The candidate set of payloads to be serviced was limited to those
shown in Table 6. The modular composition of the payloads is provided in
Table 7 and based upon LMSC data (Ref. 3). The MSFC baseline Tug was
used with a 91 kg (200-1b) servicing unit and assuming an availability in
1979. The mission model of Reference 5 was modified to reflect operating
time periods rather than launch and retrieval schedules. The defined periods
are provided in Appendix A and reflect in general a seven- to nine-year
operational period for each payload program. The minimum time between
Tug operations is assumed to be one month, and the Tug is limited to a
mission time of seven days. When new satellites are specified for deploy-
ment in a given year, the satellites are assumed to be available on one-
month centers beginning i January of that year. Propulsion units have been
specified as having three years of propellant available. If the unit has not
failed previously, it will be truncated at that time.
The servicing policy is based on replacing modules upon identifi-
cation of a failure. No redundancy in the payload designs exists. The
replacement SRUs will be loaded onto a Tug on a first-come first serve basis
until the maximum number of modules are loaded consistent with the perfor -
mance capabilities. In any event, if a full load is not available, the Tug will
be launched no later than six months after the first module failure is identified.
Service flights take priority over deployment of new satellites; however,
where schedules permit, the two functions can be combined.
-51-
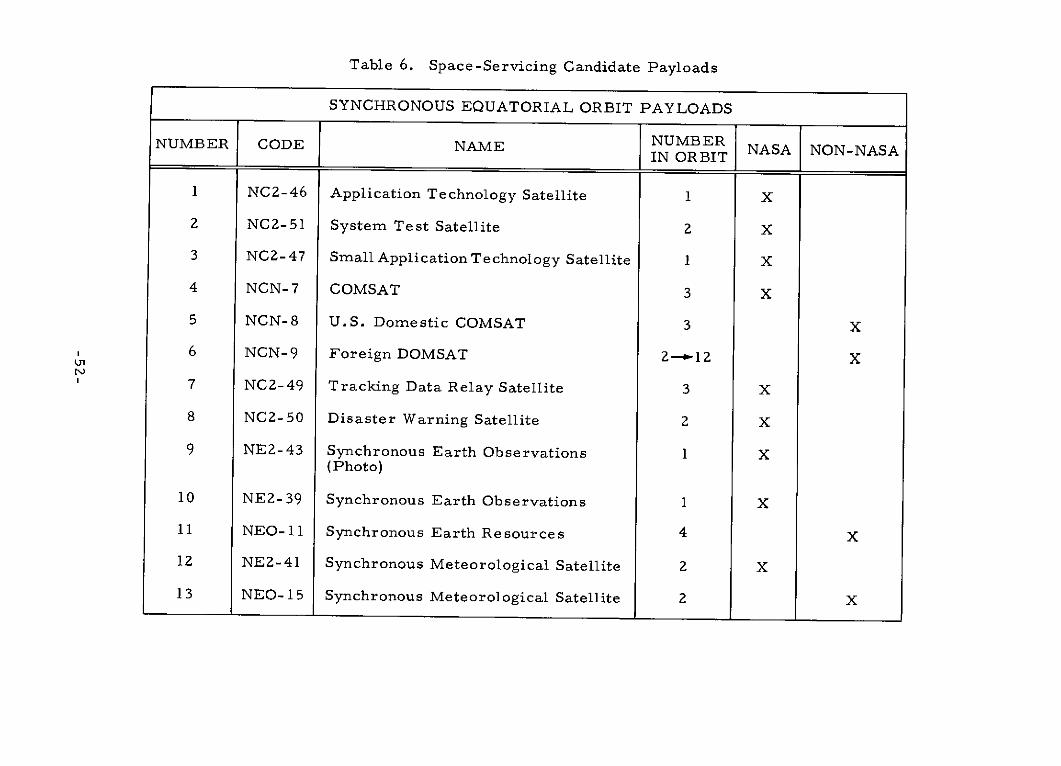
Table 6. Space-Servicing Candidate Payloads
SYNCHRONOUS EQUATORIAL ORBIT PAYLOADS
NUMBER CODE NAME NUMBER NASA NON-NASAIN ORBIT
1 NC2-46 Application Technology Satellite 1 X
2 NC2-51 System Test Satellite 2 X
3 NC2-47 Small Application Technology Satellite 1 X
4 NCN-7 COMSAT 3 X
5 NCN- 8 U.S. Domestic COMSAT 3 X
6 NCN-9 Foreign DOMSAT 2--a12 X
7 NC2-49 Tracking Data Relay Satellite 3 X
8 NC2-50 Disaster Warning Satellite 2 X
9 NE2-43 Synchronous Earth Observations 1 X(Photo)
10 NE2- 39 Synchronous Earth Observations 1 X
11 NEO-11 Synchronous Earth Resources 4 X
12 NE2-41 Synchronous Meteorological Satellite 2 X
13 NEO-15 Synchronous Meteorological Satellite 2 X
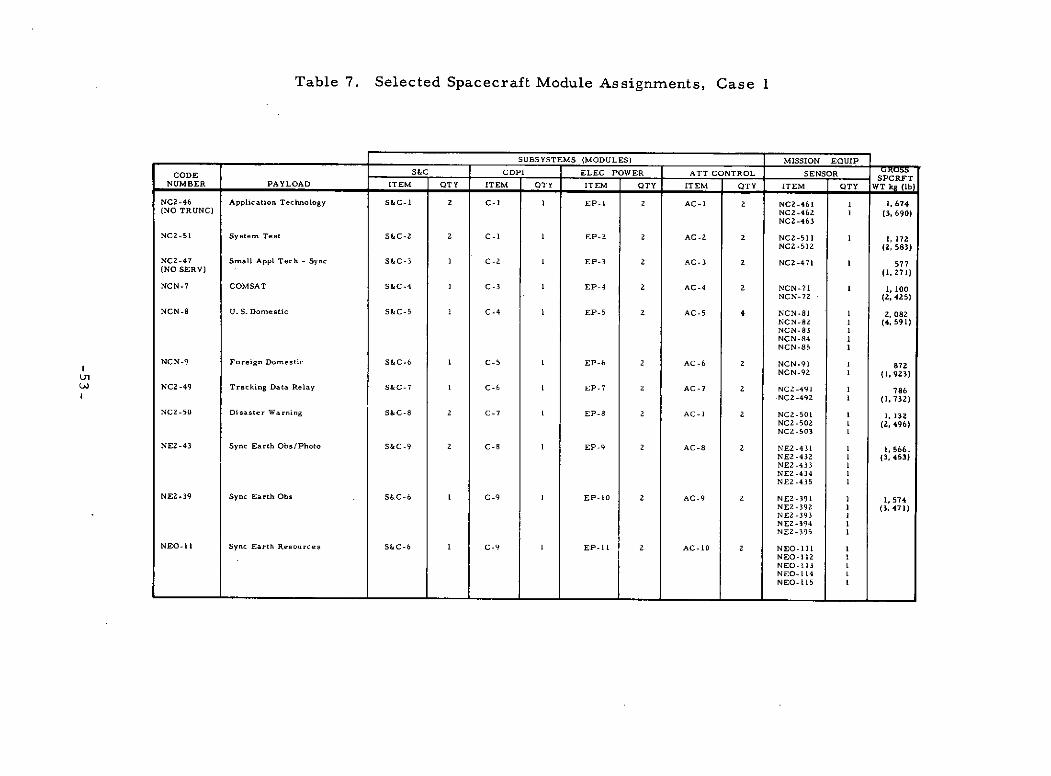
Table 7. Selected Spacecraft Module Assignments, Case 1
SUBSYSTEMS (MODULES) MISSION EQUIP
CODE S&C CDPI ELEC POWER ATT CONTROL SENSOR TCODE SPCRFTNUMBER PAYLOAD ITEM QTY ITEM QTY ITEM OTY ITEM QTY ITEM QTY WT kg (lb)
NC2-46 Application Technology S&C-1 2 C-1 I EP-1 2 AC-1 2 NC2-461 1 1, 674(NO TRUNC) NC2-462 1 (3, 690)
NC2-463
NC2-51 System Test S&C-2 2 C-i I EP-2 2 AC-2 2 NCZ-511 I I, 172NC2-512 (2, 583)
NC2-47 Small Appl Tech - Sync S&C-3 I C-2 I EP-3 Z AC-3 2 NCZ-471 1 577(NO SERV) (1, 271)
NCN-7 COMSAT S&C-4 I C-3 I EP-4 2 AC-4 2 NCN-71 1 1, 100NCN-72 (2, 425)
NCN-8 U.S. Domestic S&C-5 1I C-4 I EP-5 Z AC-5 4 NCN-81 I 2, 082NCN-82 1 (4, 591)NCN-83 INCN-84 INCN-85 I
NCN-9 Foreign Domestic S&C-6 I C-5 1 EP-6 2 AC-6 2 NCN-91 1 872NCN-92 1 (1,923)
LA) NC2-49 Tracking Data Relay S&C-7 1 C-6 1 EP-7 2 AC-7 2 NCZ-491 1 786*NCZ-492 1 (1, 732)
NCZ-50 Disaster Warning S&C-8 2 C-7 1 EP-8 2 AC-I 2 NC2-501 1 1, 132NC2-50Z 1 (2, 496)NC2-503 I
NE2-43 Sync Earth Obs/Photo S&C-9 2 C-8 I EP-9 2 AC-8 2 NEZ-431 I 1,566.NE2 -432 1 (3, 453)NE2-433 LNEZ-434 1NE2-435 1
NE2-39 Sync Earth Obs SLC-6 1I C-9 I EP-O0 2 AC-9 2 NE-391 I1 1,574NEZ-392 1 (3,471)NE2-393 1NE2-394 INEZ-395 1
NEO-II Sync Earth Resources S&C-6 1 C-9 I EP-11 2 AC-10 2 NEO-III INEO- 12 INEO-113 INEO-114 1NEO-115 I
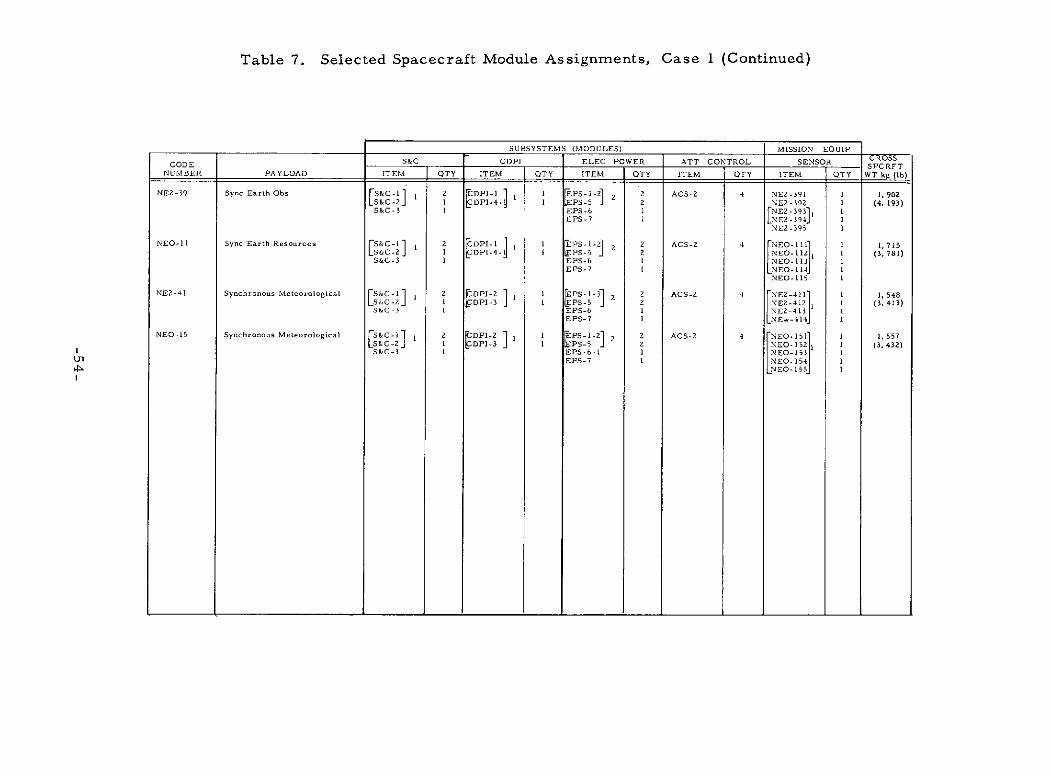
Table 7. Selected Spacecraft Module Assignments, Case 1 (Continued)
SUBSYSTEMS (MODULES) MISSION EQUIP
CODE S&C CDPI ELEC POWER ATT CONTROL SENSOR GCODE SPCRFT
NUMBER PAYLOAD ITEM QTY ITEM OTY ITEM OTY ITEM QTY ITEM QTY WT kg (lb)
NE2-39 Sync Earth Obs S&C-l] 1 2 DPI-I 1 PS-I-2]
2 ACS-2 4 NEZ-391 1 1,902LS&C-ZJ 1 CDPI-4- I EPS-5 J 2 NE2-392 1 (4, 193)
S&C-3 1 EPS-6 I FNEZ-393]1 1
EPS-7 1 LNE2-394J 1NE2-395 I
NEO-li Sync Earth Resources FS&C-] 1 2 DPI-i 1 EPS--2 2 ACS-2 4 [NEO-Il 1 1,715LS&C-2] I DPI-4- 1 PS-5 2 NEO-IIzI I (3,781)
S&C-3 I EPS-6 1 NEO- 113 IEPS-7 1 NEO- 114 1
NEO-l15 1
NE2-41 Synchronous Meteorological FS&C-1 1 2 DPI-2 S--3] 2 ACS-2 4 NE2-4 1 , 548LS&C-2]1 I DPI-3 1 EPS-5 J 2 NE2-412 1 (3, 413)
S&C-3 I EPS-6 1 NE2-413 1EPS-7 1 NEw-41 1
NEO-15 Synchronous Meteorological FS&C- 1 2 DPI-2 1 1 EPS-1-2 2 2 ACS-2 4 NEO-151 1 1,557LS&C-2J 1 DPI-3] 1 I PS-5J 2 EO-15 (3. 432)
S&C-3 I EPS-6-1 I NEO-153 IEPS-7 1 NEO-154 1
0NEO- 15 J
B. CASE 2: AEROSPACE MODULARIZATION
The same set of satellites are assumed as in Case 1; however, the
modular composition is modified as shown in Table 8. Total system weights
are changed considerably. The reliability estimates also differ from those
of Case 1 as shown by comparison in Table 9 for representative subsystems.
The fact that differences exist reflects the need for further analysis as no
attempt has been made to resolve these differences due to budgetary
constraints. In general, the LMSC modules tended to be higher in reliability
and weight. Each satellite for this case was truncated at nine years, except
for NC2-46 (ATS) which is assumed to operate over the full 1979-1997 time
period. The small ATS (NC2-47) is assumed to be deployed as an expendable
satellite on a yearly basis. Failure times were tracked for reference only.
Truncation time for propulsion units was three years and for power units,
five years. In addition, longitude placement of the satellites was assumed,
based on Reference 17, to take advantage of the performance benefits of
servicing payloads over limited phase angles. The assumed longitudes
listed in Table 10 are reasonably representative of key placements at
synchronous equatorial orbit (SEO).
The servicing policy is similar to Case 1 with minor variation. If
a module of a given satellite fails within the last year of the stated service
life of the satellite, the module is not replaced. The satellite was assumed
inoperative until the replacement satellite was deployed the following year.
Also, all replacement satellites were placed in the loading queue two months
prior to the scheduled launch. In both Cases 1 and 2, retrieval of satellites
at the end of their operational period was ignored to ease the burden of
calculation. A gross approximation of the Tug flights required to perform
this function was made for the purpose of comparing results with previous
analyses which employed ground refurbishment of payloads.
-55-
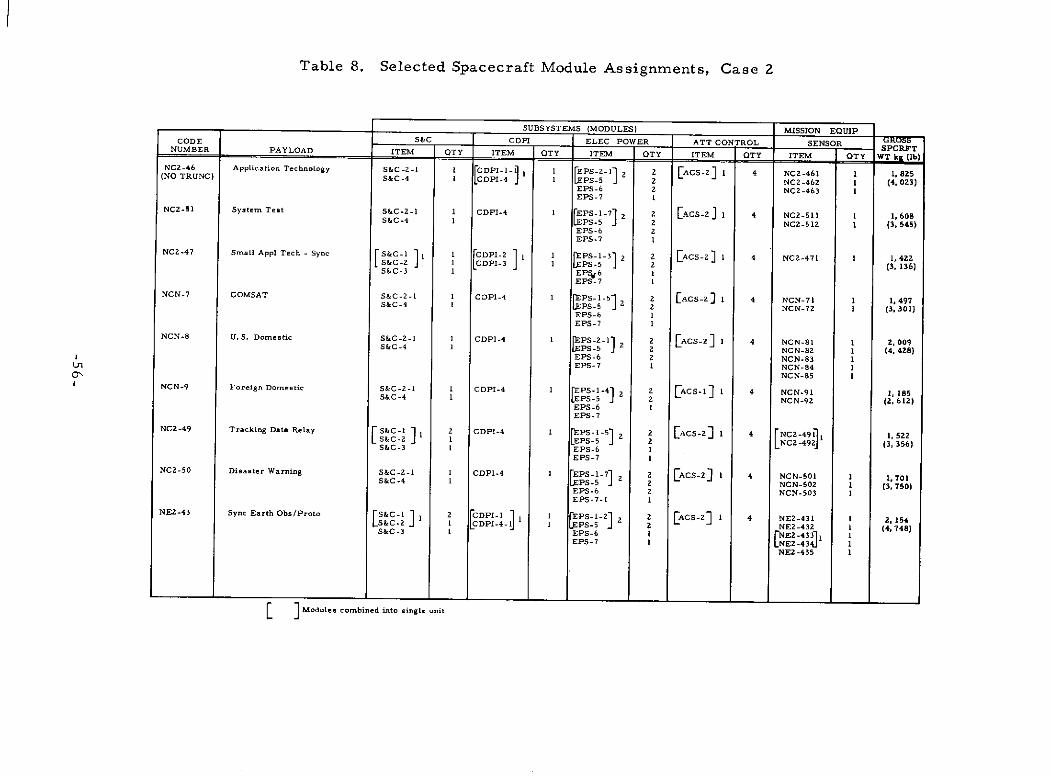
Table 8. Selected Spacecraft Module Assignments, Case 2
SUBSYSTEMS (MODULES) MISSION EQUIP
CODE S&C CDPI ELEC POWER ATT CONTROL SENSOR SPCRFTNUMBER PAYLOAD ITEM QTY ITEM QTY ITEM QTY ITEM QTY ITEM QTY WT ks (Ib)
NC2-46 Application Technology S&C-2-1 1 CDPI-1-11 I I EPS -- 11 2 2 [ACS-2] 1 4 NC2-461 1 1,825(NO TRUNC) S&C-4 I CDPI-4 J I LEPS-5 J 2 NCZ-462 1 (4, 023)EPS-6 2 NC2-463 1EPS-7 1
NC2-51 System Test S&C-2-1 1 CDPI-4 I PS-1-7 2 2 [ACS-2 1 4 NC2-511 1 1,608S&C-4 1 EPS-5 J 2 NC2-512 1 (3, 545)
EPS-6 2EPS-7 1
NC2-47 Small Appl Tech - Sync S&C-1 1 CDPI- 1 1 PS-1-31 2 2 EACS-2] 1 4 NC2-471 1 1,422SS&C-2 I CDPI3 J I NS-5 2 (3, 136)S&C-3 I EPS,6 I
EPS-7 1
NCN-7 COMSAT S&C-2-1 1 CDPI-4 I PS-1-5] 2 ACS- ] 1 4 NCN-71 1 1,497S&C-4 1 EPS-5 2 NCN-7Z 1 (3, 301)
EPS-6 1EPS-7 I
NCN-8 U.S. Domestic S&C-2-1 1 CDPI-4 EPS-2-1] 2 2 ACS-2 1 4 NCN-81 1 2,009S&C-4 1 EPS5 NCN-82 1 (4, 428)
EPS-6 2 NCN-83 1EPS-7 I NCN-84 1NCN-85 1
NCN-9 Foreign Domestic S&C-2-1 I CDPI-4 1 EPS-1-4 [A CS-1 1 4 NCN-91 1, 185S&C-4 1 S-5 2 NCN-92 (2. 612)
EPS-6 1EPS-7
NC2-49 Tracking Data Relay s&C-1 2 CDPI-4 PS-5 1 ACS- 4 NC ,52
S&C-3 1 EPS-6 1EPS-7 1
NC2-50 Disaster Warning S&C-1- 1 CDPI-4 I EPS-1-7] 2 2 ACS- I1 4 NCN-501 1 1,701S&C-4 1 -5 2 NCN-502 1 (3, 750)
EPS-6 2 NCN-503 IEPS-7-1 1
NE2-43 Sync Earth Obs/Proto rS&C- 1 2 CDPI-I 1 i EPS1-2] 2 ACS-2] 1 4 NE -41 1 2, 154LS&C-2 I I CDPI-4_IJ 1 lEPS-5 2 2 NEZ-432 I (4, 748)S&C-3 I EPS-6 1 NE2-4331 1EPS-7 I LNE2-431 1
NE2-435 1
[ ] Modules combined into single unit
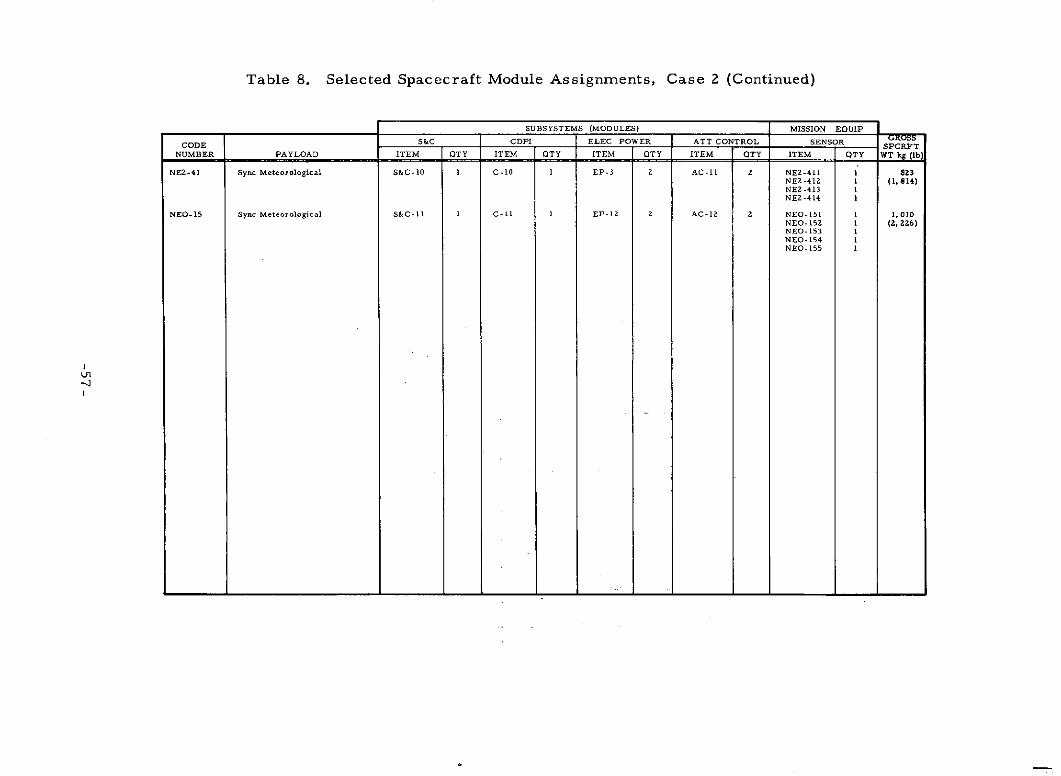
Table 8. Selected Spacecraft Module Assignments, Case 2 (Continued)
SUBSYSTEMS (MODULES) MISSION EQUIP
CODE S&C CDPI ELEC POWER ATT CONTROL SENSOR SCRFT
NUMBER PAYLOAD ITEM QTY ITEM QTY ITEM QTY ITEM QTY ITEM QTY WT kg (Ib)
NEZ-41 Sync Meteorological S&C-10 1 C-10 1 EP-3 2 AC-11 2 NE2-411 1 823NE2-412 1 (1, 814)NEZ-413 1NEZ-414 1
NEO-15 Sync Meteorological S&C-11 1 C-11 1 EP-12 2 AC-12 2 NEO-151 1 1,010NEO-152 1 (2. 226)NEO-153 INEO-154 INEO-155 I
U-1
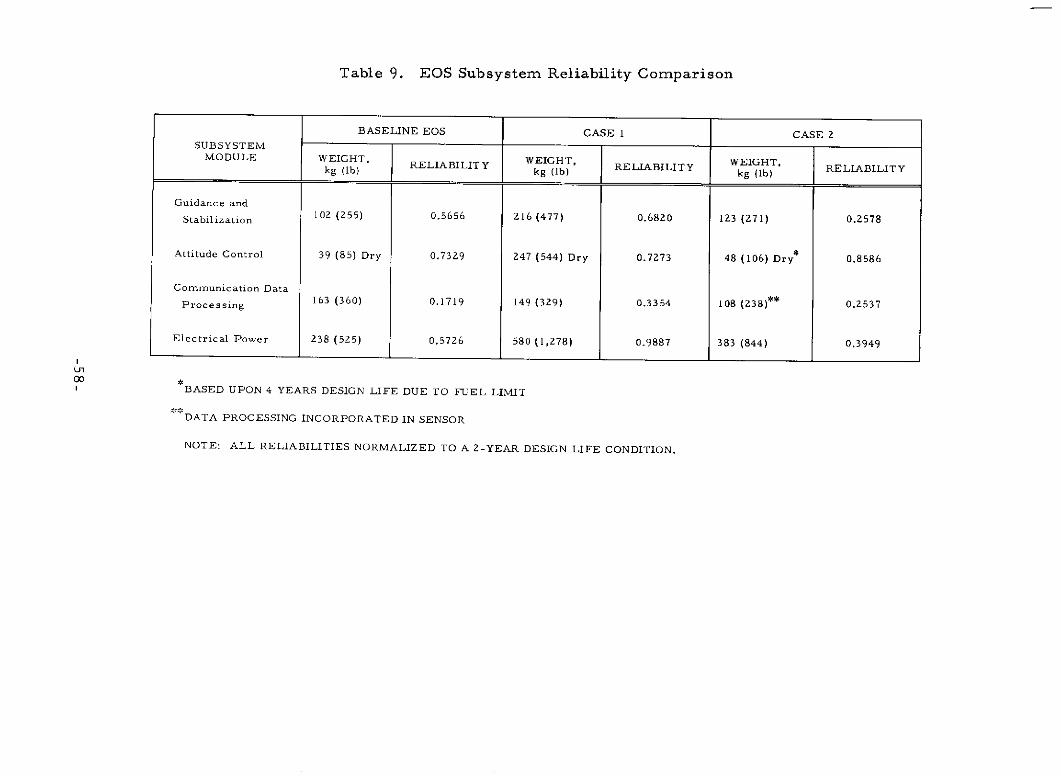
Table 9. EOS Subsystem Reliability Comparison
BASELINE EOS CASE 1 CASE 2SUBSYSTEM
MODULE WEIGHT, WEIGHT, WEIGHT,kg (lb) RELIABILITY kg (Ib)IITY RELIABILITY kg (b)
Guidance and
Stabilization 102 (255) 0.5656 216 (477) 0.6820 123 (271) 0.2578
Attitude Control 39 (85) Dry 0.7329 247 (544) Dry 0.7273 48 (106) Dry 0.8586
Communication Data
Processing 163 (360) 0.1719 149 (329) 0.3354 108 (238)** 0.2537
Electrical Power 238 (525) 0.5726 580 (1,278) 0.9887 383 (844) 0.3949
I
I BASED UPON 4 YEARS DESIGN LIFE DUE TO FUEL LIMIT
DATA PROCESSING INCORPORATED IN SENSOR
NOTE: ALL RELIABILITIES NORMALIZED TO A 2-YEAR DESIGN LIFE CONDITION.
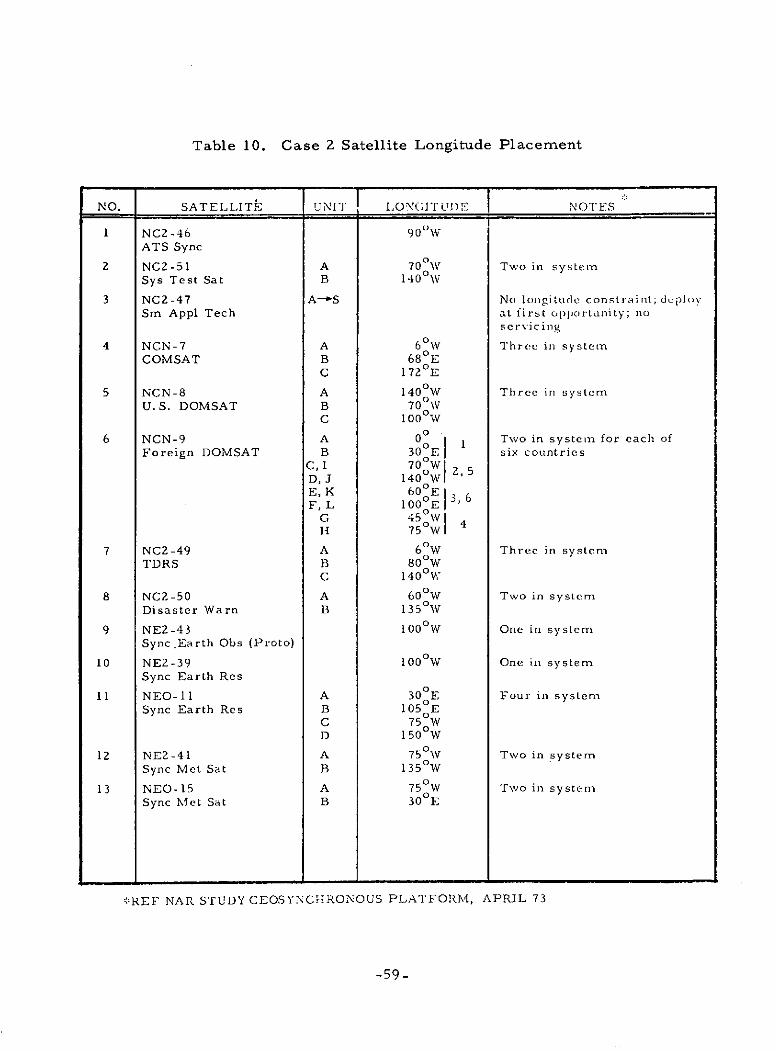
Table 10. Case 2 Satellite Longitude Placement
NO. SATELLITE UNIT LONGITUDE NOTES
1 NC2-46 900WATS Sync
2 NC2-51 A 700XV Two in systemSys Test Sat B 140 0N
3 NC2-47 A-S No longitude constraint; deplo\Sm Appl Tech at first opportunity; no
servicing
4 NCN-7 A 6 0 W Three in systemCOMSAT B 68 0 E
C 172 0 E
5 NCN-8 A 140 W Three in systemU.S. DOMSAT B 700W
C 100 0V
6 NCN-9 A 0 1 Two in system for each ofForeign DOMSAT B 30 E 1 six countries
C,I 700WlD, J 140 o1 2,5E, K 600E ,F, L 100°E 3,
G 450W 4H 75 0 W
7 NC2-49 A 6 0 W Three in systemTDRS B 80 W
C 1400 W
8 NC2-50 A 60 W Two in systemDisaster Warn B 135 0 W
9 NE2-43 100 0 W One in systemSync.Earth Obs (Proto)
10 NE2-39 100 0 W One in systemSync Earth Res
11 NEO- 11 A 300E Four in systemSync Earth Res B 105 E
C 75 WD 150 0 W
12 NE2-41 A 750 W Two in systemSync Met Sat B 1350W
13 NEO-15 A 75 0 W Two in systemSync Met Sat B 300E
::REF NAR STUDY CEOSYNCHiRONOUS PLATFORM, APRIL 73
-59-
4. SPACE-SERVICING RESULTS
Since there has been no previous analysis of space servicing, there
is no valid means of comparing the results of the two cases analyzed.
However, some understanding can be achieved by comparing in a gross
sense these results with ground refurbishment of payloads as analyzed in
Reference 5. A sample case of a single satellite program (NC2-51, System
Test Satellite) is described first. This is followed by a summary of the
results of Case 1 which is based upon LMSC standardized modules. The
results of Case 2 based upon Aerospace data are then presented and a
comparison of the two provided. Further details on input data and sequence
of events are provided in the appendix section.
The current effort was restricted to synchronous equatorial orbit
for the missions defined in Reference 5. Table 6 has already listed this
set, including the number of satellites required to comprise an operational
system. When ground refurbishment is considered, the total mission
operations require 182 Tug flights over the 1979 to 1997 time period based
upon a Tug availability in 1983. Of this amount, 130 flights are required
to support synchronous equatorial operations for the 13 payload programs
considered in this study. This is further reflected in 158 Shuttle flights to
support the Tug and payload operations. A detailed break down of the flight
operations is given in Table 7. A direct comparison will be difficult, however,
because of different ground rules and assumptions and basic input data.
Of the 130 Tug flights supporting synchronous operations, 10. 5 were
allocated to the sample payload program NC2-51 which has two satellites
operating simultaneously for 18 years. The equivalent charge for deployment
prior to the Tug IOC was 1. 7 Centaur flights. Also, there were two tandem
Tug flights in which this payload shared the ride. It should be recognized that
some of these charges are for retrieval since ground refurbishment was an
objective. The flight rate was established based upon a mean mission
duration of five years which has no corollary in the space-servicing study.
The satellite weight was given as 1, 896 kg (4, 181 lb) when designed for
ground refurbishment.
-61- PRECEDING PAGE BLANK NOT FILMED
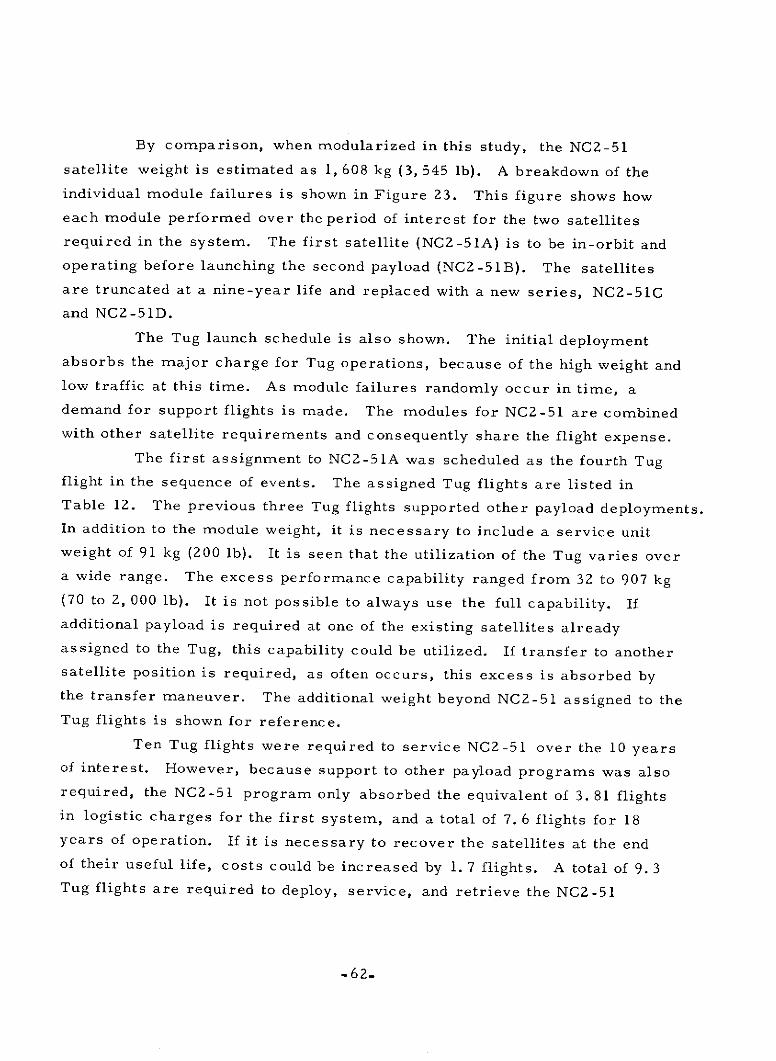
By comparison, when modularized in this study, the NC2-51
satellite weight is estimated as 1, 608 kg (3, 545 lb). A breakdown of the
individual module failures is shown in Figure 23. This figure shows how
each module performed over the period of interest for the two satellites
required in the system. The first satellite (NC2-51A) is to be in-orbit and
operating before launching the second payload (NC2-51B). The satellites
are truncated at a nine-year life and replaced with a new series, NC2-51C
and NC2-51D.
The Tug launch schedule is also shown. The initial deployment
absorbs the major charge for Tug operations, because of the high weight and
low traffic at this time. As module failures randomly occur in time, a
demand for support flights is made. The modules for NC2-51 are combined
with other satellite requirements and consequently share the flight expense.
The first assignment to NC2-51A was scheduled as the fourth Tug
flight in the sequence of events. The assigned Tug flights are listed in
Table 12. The previous three Tug flights supported other payload deployments.
In addition to the module weight, it is necessary to include a service unit
weight of 91 kg (200 lb). It is seen that the utilization of the Tug varies over
a wide range. The excess performance capability ranged from 32 to 907 kg
(70 to 2, 000 lb). It is not possible to always use the full capability. If
additional payload is required at one of the existing satellites already
assigned to the Tug, this capability could be utilized. If transfer to another
satellite position is required, as often occurs, this excess is absorbed by
the transfer maneuver. The additional weight beyond NC2-51 assigned to the
Tug flights is shown for reference.
Ten Tug flights were required to service NC2-51 over the 10 years
of interest. However, because support to other payload programs was also
required, the NC2-51 program only absorbed the equivalent of 3. 81 flights
in logistic charges for the first system, and a total of 7. 6 flights for 18
years of operation. If it is necessary to recover the satellites at the end
of their useful life, costs could be increased by 1. 7 flights. A total of 9. 3
Tug flights are required to deploy, service, and retrieve the NC2-51
-62.
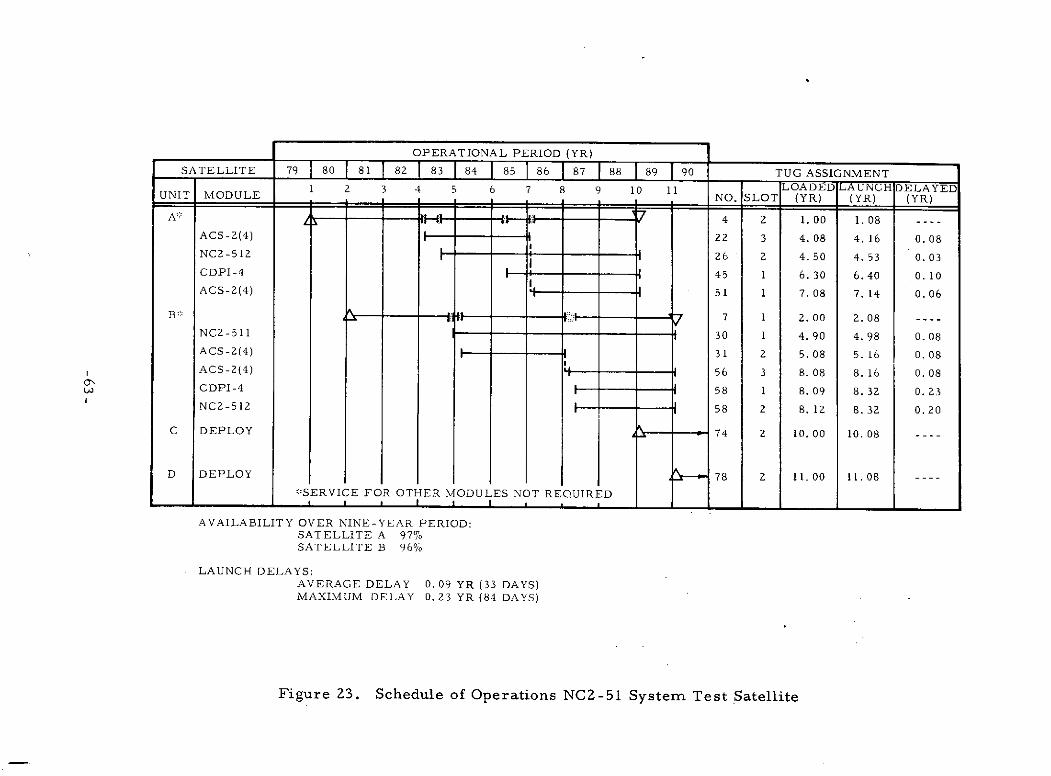
OPERATIONAL PERIOD (YR)
SATELLITE 79 80 81 82 83 184 85 86 87 88 89 90 TUG ASSIGNMENT1 2 3 4 5 6 7 8 9 10 11 LOADEDLAUNCHDELAYED
UNIT MODULE NO. SLOT (YR) (YR) (YR)
A::: 4 2 1.00 1.08
ACS-2(4) I I 22 3 4. 08 4. 16 0. 08
NC2-512 - - 26 2 4.50 4.53 0.03
CDPI-4 -- - 45 1 6. 30 6.40 0. 10
ACS-2(4) 51 1 7. 08 7. 14 0.06
B*:: i 1 1 - 7 1 2.00 2. 08
NC2-511 - 30 1 4.90 4.98 0.08
ACS-2(4) I I 31 2 5.08 5. 16 0.08
ACS-2(4) - - 56 3 8. 08 8. 16 0.08
CDPI-4 I 58 1 8. 09 8. 32 0. 23
NC2-512 J 58 2 8. 12 8.32 0.20
C DEPLOY I 74 2 10.00 10. 08
D DEPLOY I 78 2 11.00 11.08
*SERVICE FOR OTHER MODULES NOT REQUIRED
AVAILABILITY OVER NINE-YEAR PERIOD:SATELLITE A 97%SATELLITE B 96%
LAUNCH DELAYS:AVERAGE DELAY 0. 09 YR (33 DAYS)MAXIMUM DELAY 0.23 YR (84 DAYS)
Figure 23. Schedule of Operations NC2-51 System Test Satellite
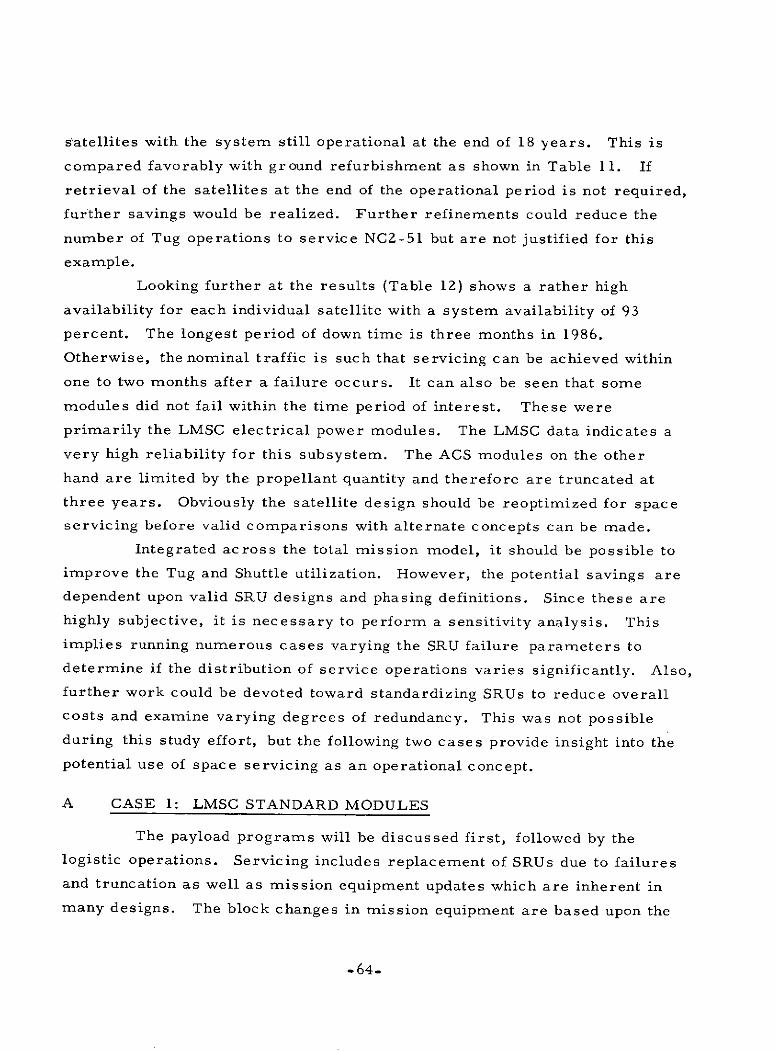
s'atellites with the system still operational at the end of 18 years. This is
compared favorably with ground refurbishment as shown in Table 11. If
retrieval of the satellites at the end of the operational period is not required,
further savings would be realized. Further refinements could reduce the
number of Tug operations to service NC2-51 but are not justified for this
example.
Looking further at the results (Table 12) shows a rather high
availability for each individual satellite with a system availability of 93
percent. The longest period of down time is three months in 1986.
Otherwise, the nominal traffic is such that servicing can be achieved within
one to two months after a failure occurs. It can also be seen that some
modules did not fail within the time period of interest. These were
primarily the LMSC electrical power modules. The LMSC data indicates a
very high reliability for this subsystem. The ACS modules on the other
hand are limited by the propellant quantity and therefore are truncated at
three years. Obviously the satellite design should be reoptimized for space
servicing before valid comparisons with alternate concepts can be made.
Integrated across the total mission model, it should be possible to
improve the Tug and Shuttle utilization. However, the potential savings are
dependent upon valid SRU designs and phasing definitions. Since these are
highly subjective, it is necessary to perform a sensitivity analysis. This
implies running numerous cases varying the SRU failure parameters to
determine if the distribution of service operations varies significantly. Also,
further work could be devoted toward standardizing SRUs to reduce overall
costs and examine varying degrees of redundancy. This was not possible
during this study effort, but the following two cases provide insight into the
potential use of space servicing as an operational concept.
A CASE 1: LMSC STANDARD MODULES
The payload programs will be discussed first, followed by the
logistic operations. Servicing includes replacement of SRUs due to failures
and truncation as well as mission equipment updates which are inherent in
many designs. The block changes in mission equipment are based upon the
-64-
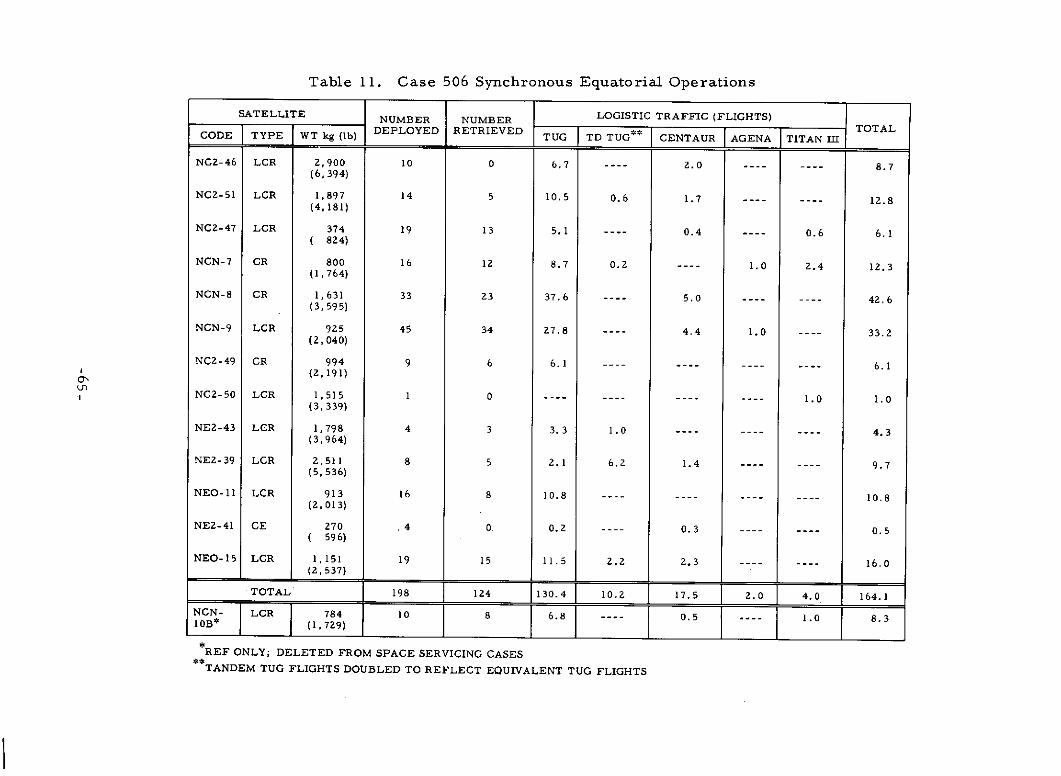
Table 11. Case 506 Synchronous Equatorial Operations
SATELLITE NUMBER NUMBER LOGISTIC TRAFFIC (FLIGHTS)
CODE TYPE WT kg (Ib) DEPLOYED RETRIEVED TUG TD TUG* CENTAUR AGENA TITAN III TOTAL
NCZ-46 LCR 2,900 10 0 6.7 ---- 2.0 ---- ---- 8.7(6,394)
NC2-51 LCR 1,897 14 5 10.5 0.6 1.7 ---- ---- 12.8(4,181)
NCZ-47 LGR 374 19 13 5.1 ---- 0.4 ---- 0.6 6.1(824)
NCN-7 CR 800 16 12 8.7 0.2 ---- 1.0 2.4 12.3(1,764)
NCN-8 CR 1,631 33 23 37.6 ---- 5.0 ---- ---- 42.6(3,595)
NCN-9 LCR 925 45 34 27.8 ---- 4.4 1.0 ---- 33.2(2,040)
NC2-49 CR 994 9 6 6.1 --- - ---- ---- 6.1(2,191)
U'NC2-50 LCR 1,515 1 0 ---- ---- ---- ---- 1.0 1.0
(3,339)
NE2-43 LCR 1,798 4 3 3.3 1.0 ---- ---- ---- 4.3(3,964)
NE2-39 LCR 2,511 8 5 2.1 6.2 1.4 ---- ---- 9.7(5,536)
NEO-11 LCR 913 16 8 10.8 ---- ---- ---- ---- 10.8(2,013)
NE2-41 CE 270 .4 0 0.2 ---- 0.3 ---- ---- 0.5( 596)
NEO-15 LCR 1,151 19 15 11.5 2.2 2.3 ---- ---- 16.0(2,537)
TOTAL 198 124 130.4 10.2 17.5 2.0 4.0 164.1NCN- LCR 784 10 8 6.8 ---- 0.5 ---- 1.0 8.310B* (1,729)
REF ONLY; DELETED FROM SPACE SERVICING CASESTANDEM TUG FLIGHTS DOUBLED TO REFLECT EQUIVALENT TUG FLIGHTSTANDEM TUG FLIGHTS DOUBLED TO REFLECT EQUIVALENT TUG FLIGHTS
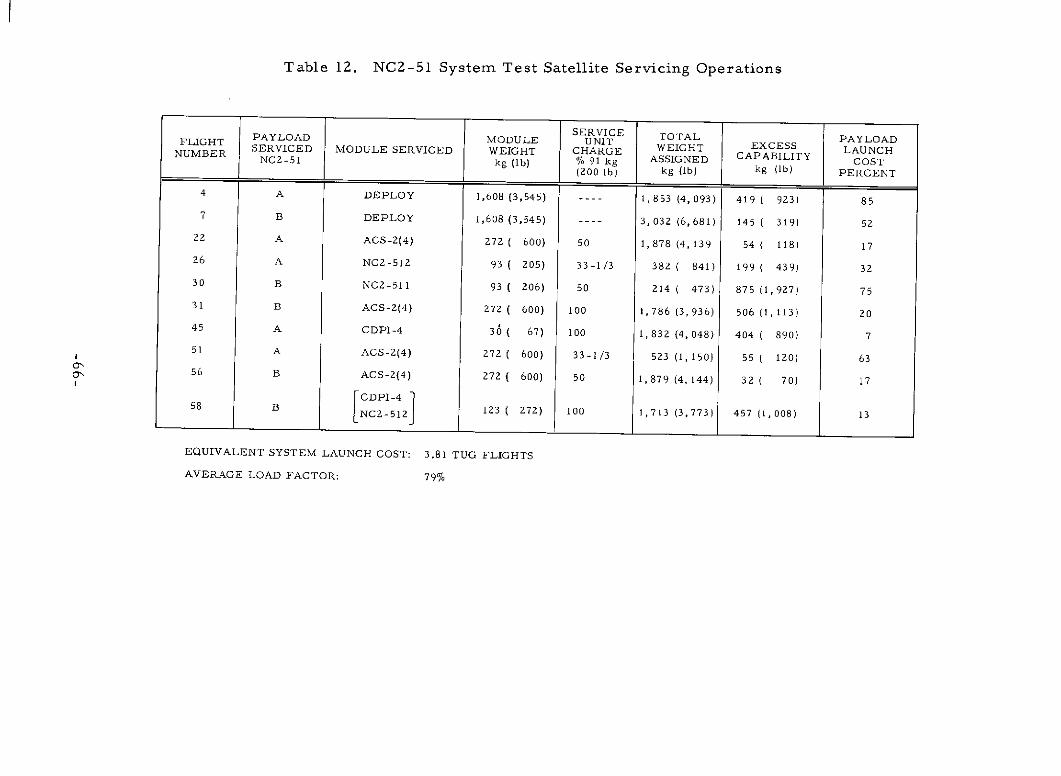
Table 12. NC2-51 System Test Satellite Servicing Operations
SERVICE TOTAL PAYLOAD
FLIGHT PAYLOAD MODULE U NITPAYLOADSERVICED MODULE SERVICED WEIGHT CHARGE WEIGHT EXCESS LAUNCHNC2-51 kg (ib) % 91 kg ASSIGNED CAPABILITY COST(200 Ib) kg (Ib) kg (Ib) PERCENT
4 A DEPLOY 1,608 (3,545) ---- 1,853 (4,093) 419 ( 923) 85
7 B DEPLOY 1,608 (3,545) ---- 3, 032 (6,681) 145 ( 319) 52
22 A ACS-2(4) 272 ( 600) 50 1,878 (4, 139 54 ( 118) 17
26 A NC2-512 93 ( 205) 33-1/3 382 ( 841) 199 ( 439) 32
30 B NCZ-511 93 ( 206) 50 214 ( 473) 875 (1,927) 75
31 B ACS-2(4) 272 ( 600) 100 1,786 (3, 936) 506 (1, 113) 20
45 A CDPI-4 36 ( 67) 100 1,832 (4, 048) 404 ( 890) 7
51 A ACS-2(4) 272 ( 600) 33-1/3 523 (1, 150) 55 ( 120) 63
56 B ACS-2(4) 272 ( 600) 50 1,879 (4, 144) 32 ( 70) 17
FCDPI-4 158 B NC2-512 123 ( 272) 100 1,713 (3,773) 457 (1,008) 13
EQUIVALENT SYSTEM LAUNCH COST: 3.81 TUG FLIGHTS
AVERAGE LOAD FACTOR: 79%
data of Reference 5. These service flights (for block changes) represent
dedicated operations to be conducted in the initial period of the year
programmed. A detailed breakdown of servicing parameters is given in
Table 13. System availability ranges from a low of 27 percent for NEO-11
Synchronous Earth Resources to a high of 92 percent for NC2-50 Disaster
Warning Satellites. The Small Application Technology Satellite (NC2-47)
has a 99 percent availability but this is due to yearly launches and not
servicing. In this particular case, two random failures occurred just
prior to the scheduled launch of a follow-on satellite resulting in a very
minor down time period. In general, the COMSAT-type satellites have a
high availability as individual units, but the system as a whole (as defined
here) is probably unsatisfactory for commercial usage. Resource satellites
tend to be relatively low in availability with a large number of SRU replace-
ments caused by sensor limitations.
The number of modules defined for each satellite of interest ranged
from 7 to 13, averaging approximately 10 modules for the 13 satellites.
Module replacements of each satellite tended to be in the range of three to
six SRUs over the operational life of the satellite, approximately nine years.
Some cases, where extensive changeout of mission equipment (NC2-46) was
defined, the number of SRU replacements was high (19). The average number
of SRU replacements per satellite was found to be 5.6 over the total time
period of 1979 through 1997. Therefore, since there was an average of 10
modules per satellite, approximately 56 percent of each satellite was
replaced over the 19-year time period. However, this does not reflect a
56 percent first unit cost increment. The major contributor was the
attitude control system SRUs due primarily to the truncation time of three
years to account for propellant usage. This SRU accounted for 36 percent
of the changeout requirements. Several alternatives are available to
improve this design. An additional 35 percent of SRU replacements was
allocated to mission equipment modules including estimated changes. This
can be improved in COMSAT-type satellites by redundancy, but for the
remaining programs, some major breakthrough will be required to improve
the basic equipment reliability. The remainder of the SRU replacements is
-67-
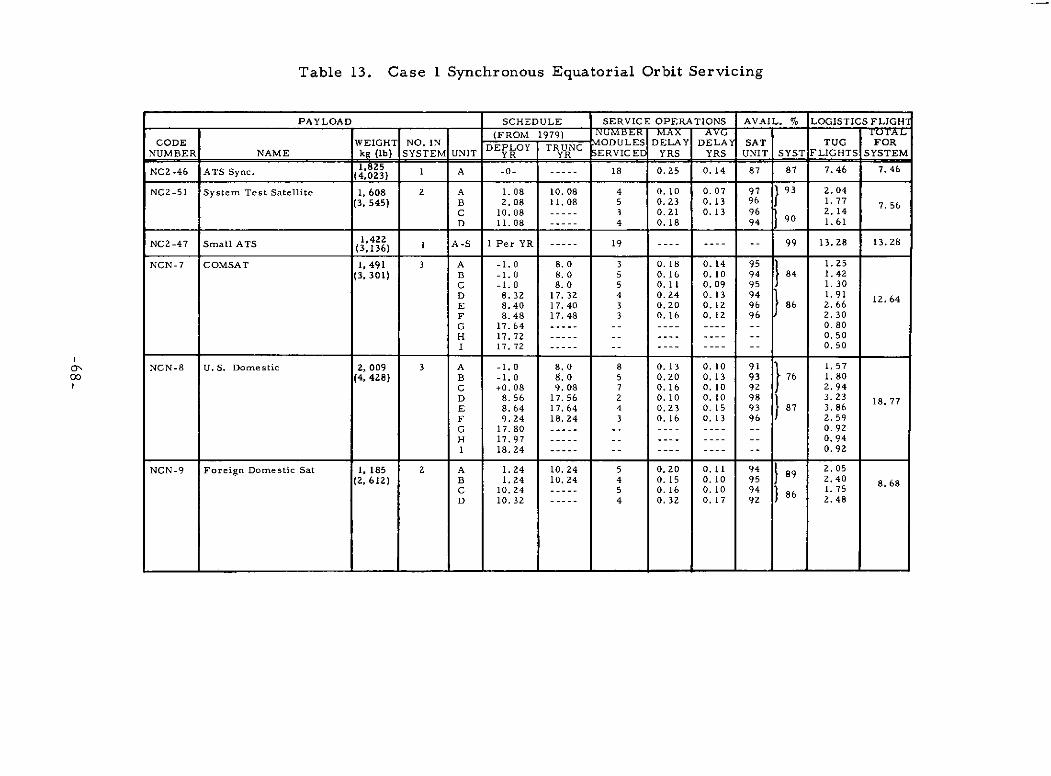
Table 13. Case 1 Synchronous Equatorial Orbit Servicing
PAYLOAD SCHEDULE SERVICE OPERATIONS AVAIL. % LOGISTICS FLIGHI
(FROM 1979) NUMBR MAX AV- TOTALCODE WEIGHT NO. IN DEPLOY TRUNC MODULES DELAY DELAY SAT TUG FOR
NUMBER NAME kg (lb) SYSTEM UNIT YR YR SERVICED YRS YRS UNIT SYST FLIGHTS SYSTEM
NC46 ATS Sy,825 1 A -0- ----- 18 0.25 0.14 87 87 7.46 7.46NC2-46 ATSSync. (4,023)NC2-51 System Test Satellite 1, 608 2 A 1.08 10.08 4 0.10 0.07 97 1 93 2.04
(3,545) B 2.08 11.08 5 0.23 0.13 96 J 1.77 7.56C 10.08 ----- 3 0.21 0.13 96 2.14D 11.08 ----- 4 0.18 94 90 1.61
NC2-47 Small ATS (3,136 1 A-S 1 Per YR 19 ---- ---- -- 99 13.28 13.28
NCN-7 COMSAT 1,491 3 A -1.0 8.0 3 0.18 0.14 95 1.25(3,301) B -1.0 8.0 5 0.16 0.10 94 84 1.42
C -1.0 8.0 5 0.11 0.09 95 1.30D 8.32 17.32 4 0.24 0.13 94 1.91 12. 64E 8.40 17.40 3 0.20 0.12 96 86 2.66F 8.48 17.48 3 0.16 0.12 96 2.30G 17.64 ----- -- ---- ---- -- 0.80
H 17.72 ----- -- ---- ---- -- 0.50I 17.72 ----- -- ---- ---- -- 0.50
' NCN-8 U.S. Domestic 2,009 3 A -1.0 8.0 8 0.13 0.10 91 1.5700 (4,428) B -1.0 8.0 5 0.20 0.13 93 76 1.80
C +0.08 9.08 7 0.16 0.10 92 2.94D 8.56 17.56 2 0.10 0. 10 98 3.23 18. 77E 8.64 17.64 4 0.23 0.15 93 87 3.86F 9.24 18.24 3 0.16 0.13 96 2.59G 17.80 ----- -- ---- ---- -- 0.92
H 17.97 ----- -- ---- ---- -- 0.94I 18.24 ----- -- ---- ---- -- 0.92
NCN-9 Foreign Domestic Sat 1, 185 2 A 1.24 10.24 5 0.20 0.11 94 89 2.05(2,612) B 1.24 10.24 4 0.15 0.10 95 2.40 8.68
C 10.24 5 0.16 0.10 94 86 1.75D 10.32 ----- 4 0.32 0.17 92J 2.48
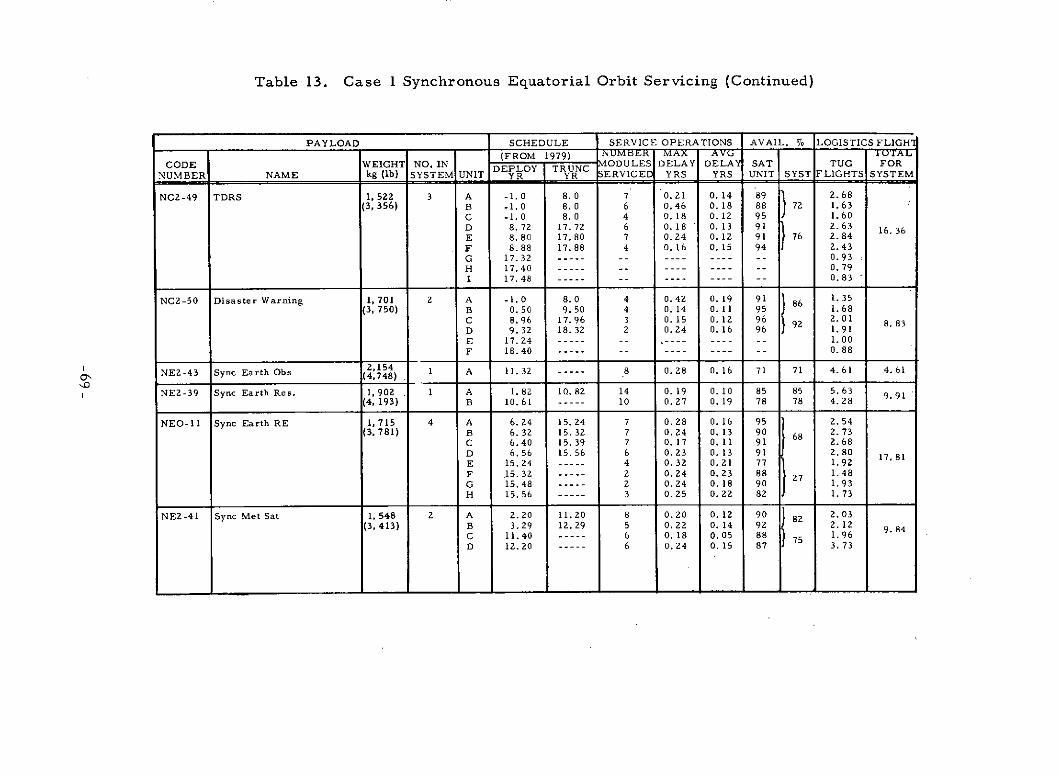
Table 13. Case 1 Synchronous Equatorial Orbit Servicing (Continued)
PAYLOAD SCHEDULE SERVICE OPERATIONS AVAIL. % LOGISTICS FLIGH
(FROM 1979) NUMBER MAX AVG .TTAL
CODE WEIGHT NO. IN DEPLOY TRUNC vODULES DELAY DELAY SAT TUG FORNUMBER NAME kg (lb) SYSTEM UNIT YR YR SERVICED YRS YRS UNIT SYST FLIGHTS SYSTEM
NC2-49 TDRS 1,522 3 A -1.0 8.0 7 0.21 0.14 89 1 2.68(3,356) B -1.0 8.0 6 0.46 0.18 88 72 1.63
C -1.0 8.0 4 0.18 0.12 95 1.60D 8.72 17.72 6 0.18 0.13 91 2.63 16. 36E 8.80 17.80 7 0.24 0.12 91 76 2.84F 8.88 17.88 4 0.16 0.15 94 2.43G 17.32 ----- -- ---- ---- -- 0.93H 17.40 ----- -- ---- ---- -- 0.79I 17.48 ----- -- ---- ---- -- 0.83
NC2-50 Disaster Warning 1,701 2 A -1.0 8.0 4 0.42 0.19 91 1.35(3,750) B 0.50 9.50 4 0. 14 0. 11 95 1.68
C 8.96 17.96 3 0.15 0.12 96 92 2.01 8.83D 9.32 18.32 2 0.24 0.16 96 1.91E 17.24 -- -- ---- ---- -- 1.00
F 18.40 ----- -- ---- ---- -- 0.88
NE -432,154 1 A 11.32 ----- 8 0.28 0.16 71 71 4.61 4.61NE2-43 Syne Earth Obs (4,748)
NE2-39 Sync Earth Res. 1,902 1 A 1.82 10.82 14 0.19 0.10 85 85 5. 63 9.91(4, 193) B 10.61 ----- 10 0.27 0.19 78 78 4.28
NEO-11 Sync Earth RE 1,715 4 A 6.24 15.24 7 0.28 0. 16 95 2.54(3, 781) B 6.32 15.32 7 0.24 0.13 90 68 2. 73
C 6.40 15.39 7 0.17 0.11 91 2.68D 6.56 15.56 6 0.23 0.13 91 2.80 17 81E 15.24 ----- 4 0.32 0.21 77 1.92F .15.32 2----- 0.24 0.23 88 27 1.48G 15.48 ----- 2 0.24 0.18 90 1.93H 15.56 ----- 3 0.25 0.22 82 1. 73
NE2-41 Sync Met Sat 1,548 2 A 2.20 11.20 8 0.20 0.12 90 82 2.03(3,413) B 3.29 12.29 5 0.22 0. 14 92 2. 12 9.84
C 11.40 6 0.18 0.05 88 75 1.96D 12.20 ----- 6 0.24 0.15 87 3.73
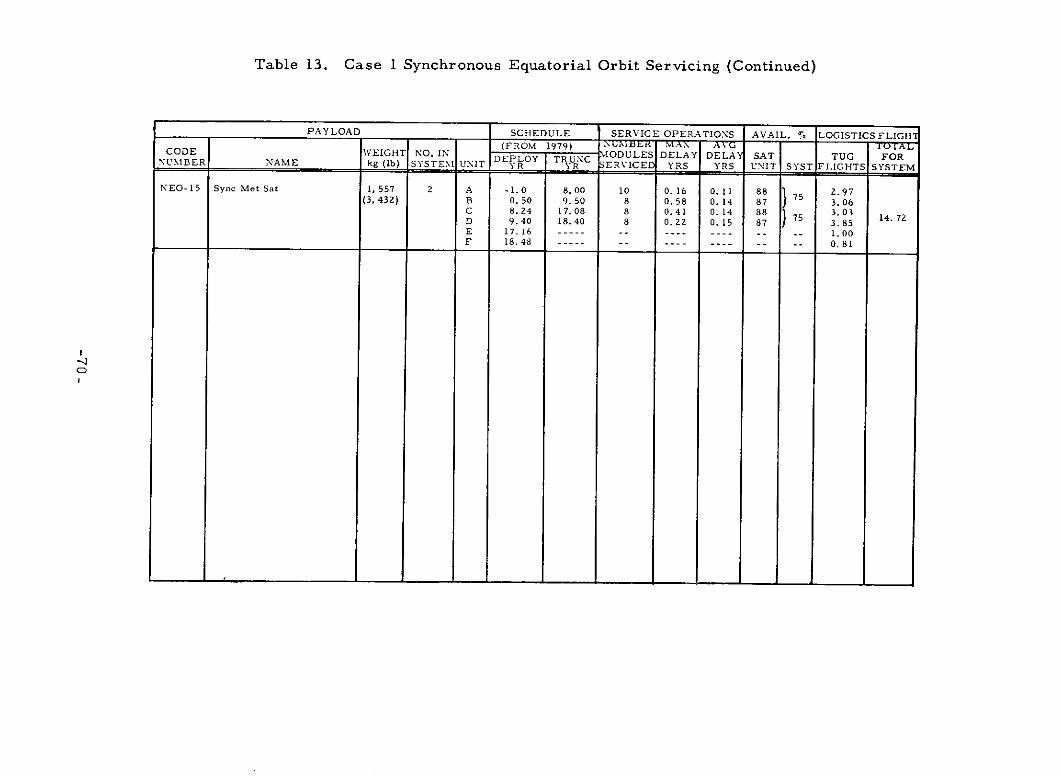
Table 13. Case 1 Synchronous Equatorial Orbit Servicing (Continued)
PAYLOAD SCHEDULE SERVICE OPERATIONS AVAIL. So LOGISTICSFLIGH'(FROM 1979) , R MAN AVG - -UTALCODE WEIGHT NO. IN DEPLOY TRUNC MODULES DELAY DELAY SAT TUG FOR
NUMBER NAME kg (Ib) SYSTE UNIT YR YR SERVICED YRS YRS UNIT SYST FLIGHTS SYSTEM
NEO-15 Sync Met Sat 1, 557 2 A -1.0 8.00 10 0.16 0.11 88 7 2.97(3, 432) B 0.50 9.50 8 0.58 0. 14 87 75 3.06
C 8.24 17.08 8 0.41 0.14 88 3.03D 9.40 18.40 8 0.22 0. 15 87 75 3.85 14. 72
E 17.16 -- ---- ---- -- -- 1.00F 18.48 -- ---- ---- -- -- 0.81
CD
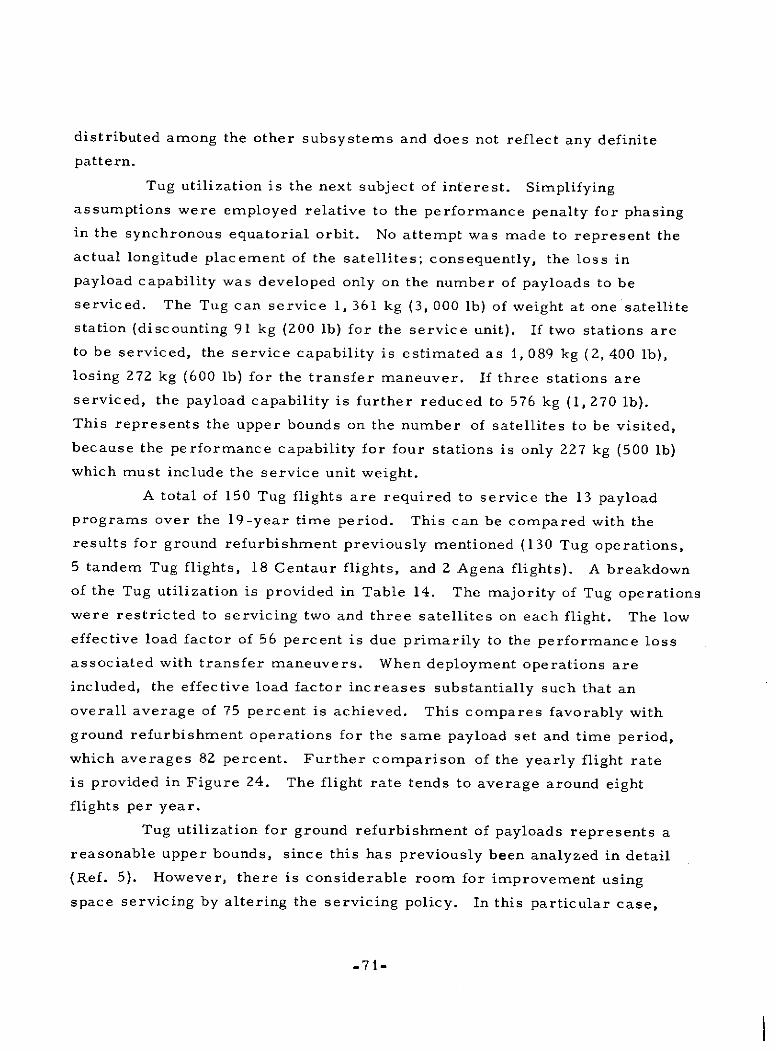
distributed among the other subsystems and does not reflect any definite
pattern.
Tug utilization is the next subject of interest. Simplifying
assumptions were employed relative to the performance penalty for phasing
in the synchronous equatorial orbit. No attempt was made to represent the
actual longitude placement of the satellites; consequently, the loss in
payload capability was developed only on the number of payloads to be
serviced. The Tug can service 1, 361 kg (3, 000 lb) of weight at one satellite
station (discounting 91 kg (200 lb) for the service unit). If two stations are
to be serviced, the service capability is estimated as 1,089 kg (2, 400 lb),
losing 272 kg (600 lb) for the transfer maneuver. If three stations are
serviced, the payload capability is further reduced to 576 kg (1,270 lb).
This represents the upper bounds on the number of satellites to be visited,
because the performance capability for four stations is only 227 kg (500 lb)
which must include the service unit weight.
A total of 150 Tug flights are required to service the 13 payload
programs over the 19-year time period. This can be compared with the
results for ground refurbishment previously mentioned (130 Tug operations,
5 tandem Tug flights, 18 Centaur flights, and 2 Agena flights). A breakdown
of the Tug utilization is provided in Table 14. The majority of Tug operations
were restricted to servicing two and three satellites on each flight. The low
effective load factor of 56 percent is due primarily to the performance loss
associated with transfer maneuvers. When deployment operations are
included, the effective load factor increases substantially such that an
overall average of 75 percent is achieved. This compares favorably with
ground refurbishment operations for the same payload set and time period,
which averages 82 percent. Further comparison of the yearly flight rate
is provided in Figure 24. The flight rate tends to average around eight
flights per year.
Tug utilization for ground refurbishment of payloads represents a
reasonable upper bounds, since this has previously been analyzed in detail
(Ref. 5). However, there is considerable room for improvement using
space servicing by altering the servicing policy. In this particular case,
_71-
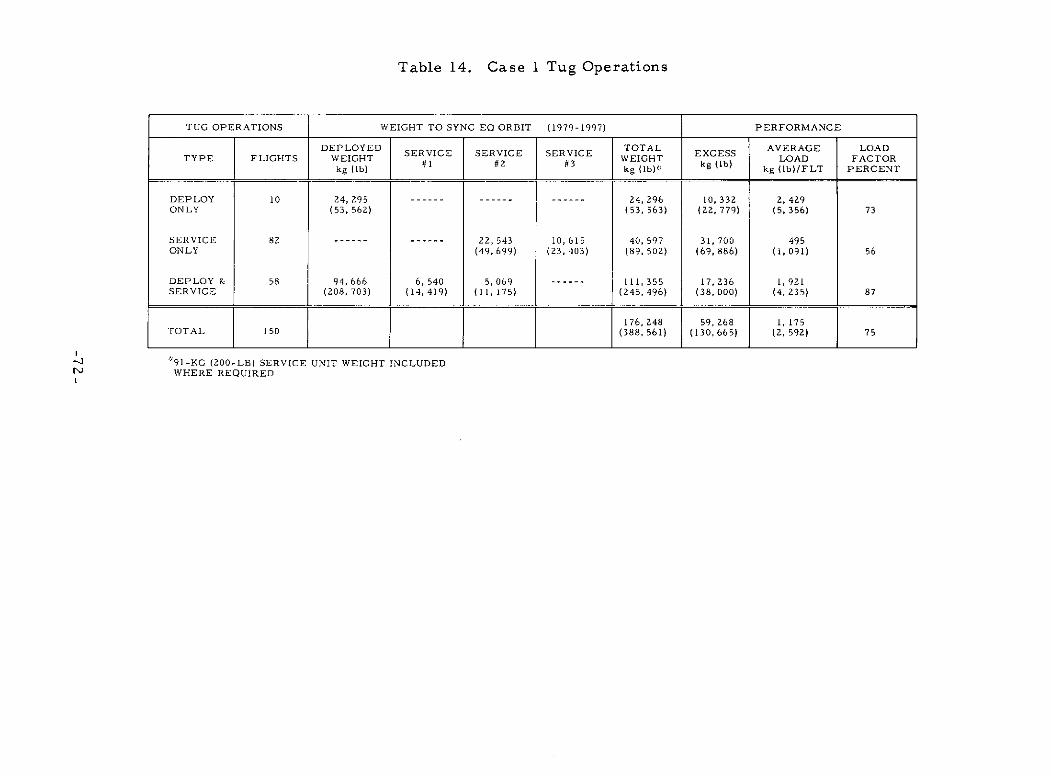
Table 14. Case 1 Tug Operations
TUG OPERATIONS WEIGHT TO SYNC EQ ORBIT (1979-1997) PERFORMANCE
DEPLOYED 11 TOTAL AVERAGE LOADTYPE FLIGHTS WEIGHT SERVICE SERVICE WEIGHT LOAD FACTOR
kg (Ib) #1 #j #3 kg (lb):: kg (1b) kg (lb)/FLT PERCENT
DEPLOY 10 24,295 ------ ------ ------ 24, 296 10, 332 2, 429ONLY (53, 562) (53, 563) (22, 779) (5, 356) 73
SERVICE 82 ------ ------ 22,543 10,615 40,597 31,700 495ONLY (49,699) (23, 403) (89,502) (69,886) (1,091) 56
DEPLOY & 58 94, 666 6, 540 5,069 ------ 111,355 17,236 1,921SERVICE (208, 703) (14,419) (11, 175) (245, 496) (38, 000) (4, 235) 87
176 248 59,268 1, 175TOTAL 150 (388, 561) (130,665) (2, 592) 75
91-KG (200-LB) SERVICE UNIT WEIGHT INCLUDEDWHERE REQUIRED
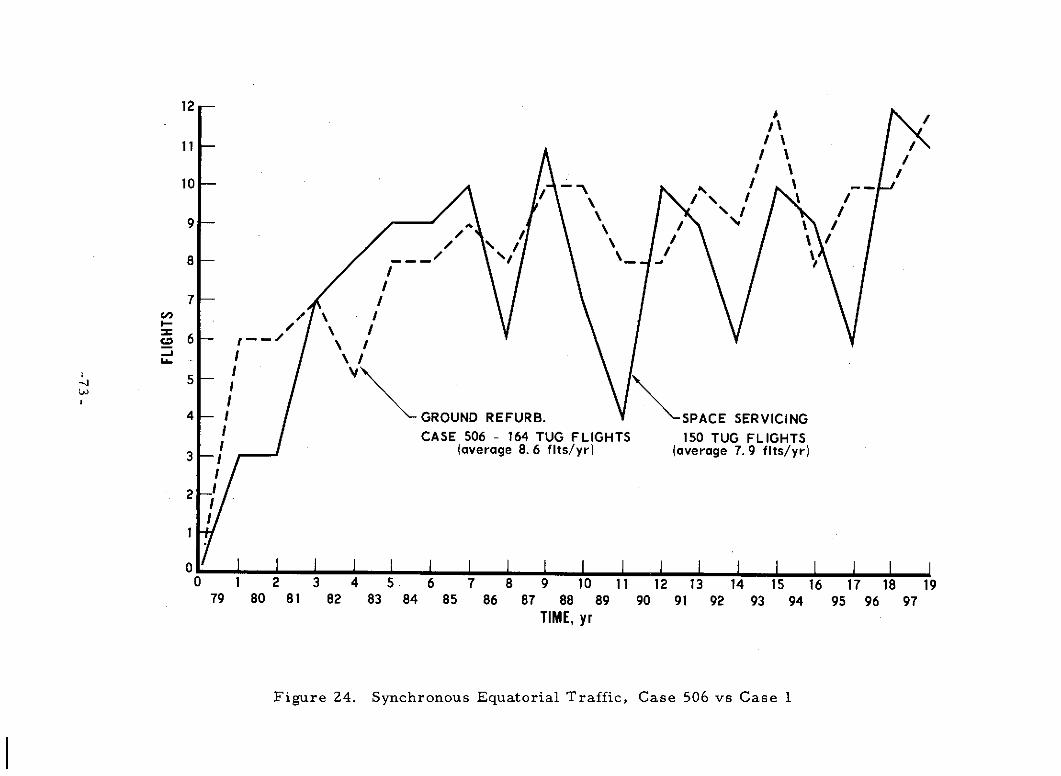
12
11 /11 - /101
/ \ I-
/ \\
8 -- I
II
7 I", I
..I
5
4 - I GROUND REFURB. SPACE SERVICINGCASE 506 - 164 TUG FLIGHTS 150 TUG FLIGHTS
3 (average 8. 6 flts/yr) (average 7.9 flts/yr)
2
1
0 1 2 3 4 5 6 7 8 9 10 11 12 13 14 15 16 17 18 1979 80 81 82 83 84 85 86 87 88 89 90 91 92 93 94 95 96 97
TIME, yr
Figure 24. Synchronous Equatorial Traffic, Case 506 vs Case 1
the replacement SRUs were loaded as they were identified, and the launch
delay was maintained relatively low (30 days). If, however, a launch delay
of 60 or 90 days was allowed, it would be possible to select payloads to be
serviced which are close to the same station on orbit. Further definition of
SRUs would probably result in lower weights which should also improve the
load factor. Finally, it was assumed that the attitude control modules
(ACS-2) were truncated at three years. This forced an abnormally high
number of flights just to service this SRU. Extending the operating life of
this SRU should reduce the number of flights and improve the Tug utilization.
Further consideration of these points is provided by Case 2 to be discussed
next.
In summary, the results of Case 1 using LMSC subsystem module
definitions are comparable with ground refurbishment of payloads, at least
to the extent of operational consideration. Payload costs including DDT&E
have not been developed, but since both approaches employ modular designs,
the costs should be comparable. Recurring payload costs could possibly be
lower, since on the average, only 50 percent of the modules were replaced
on orbit as opposed to refurbishing the entire satellite.
B. CASE 2: AEROSPACE MODULAR DESIGNS
The major difference between Case 1 and Case 2 exists in the
definition of subsystem modules. However in addition, the Tug performance
relative to phasing at synchronous equatorial orbit is more accurately
represented along with the satellite longitude placement. One other difference
is that deployment of the Foreign DOMSAT payloads was increased from 2
to 12 satellites to be in agreement with the ground refurbishment study
(Case 506). This provides for two satellites in a system supporting six
different foreign countries. One final point is that the electrical power
modules were truncated at five years, representing an upper bound on
battery life. All other ground rules are essentially unchanged.
A comparison of the relative satellite weights is provided in Table
15 for four different conditions. There are numerous variances between
the conditions due to the payload design approach chosen. Case 2 is in
.74-
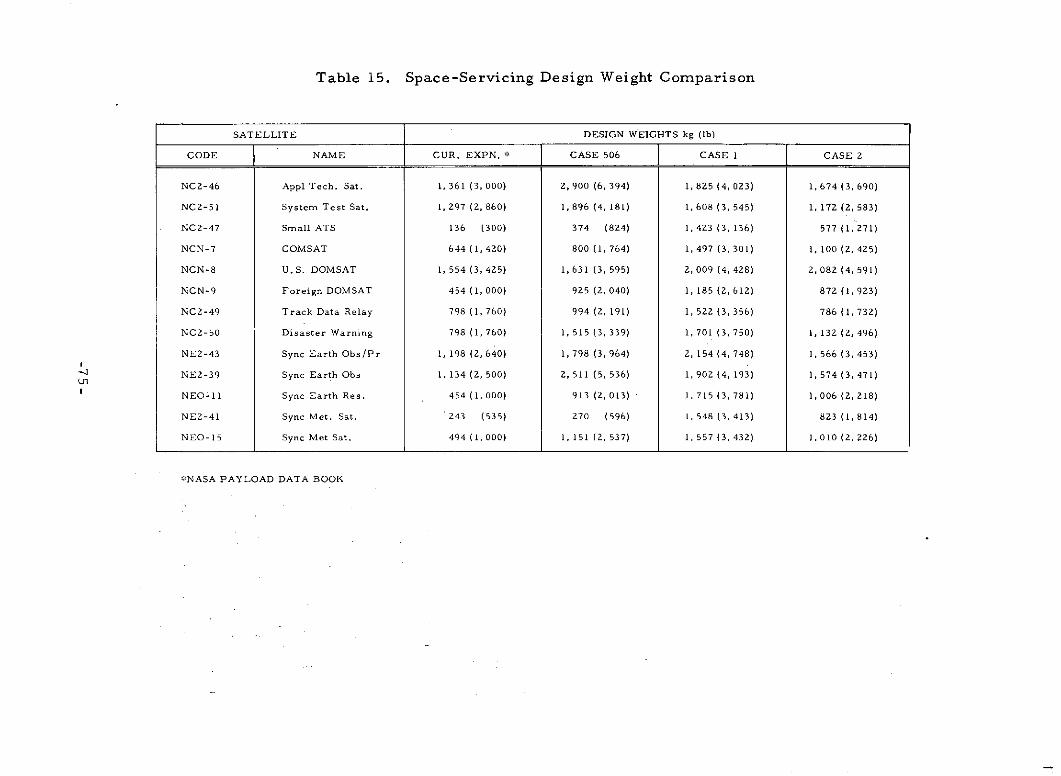
Table 15. Space-Servicing Design Weight Comparison
SATELLITE DESIGN WEIGHTS kg (lb)
CODE NAME CUR. EXPN. CASE 506 CASE 1 CASE 2
NC2-46 Appl Tech. Sat. 1, 361 (3, 000) 2,900 (6, 394) 1,825 (4, 023) 1,674 (3, 690)
NC2-51 System Test Sat. 1,297 (2, 860) 1,896 (4, 181) 1,608 (3, 545) 1, 172 (2, 583)
NCZ-47 Small ATS 136 (300) 374 (824) 1, 423 (3, 136) 577 (1, 271)
NCN-7 COMSAT 644 (1, 420) 800 (1, 764) 1, 497 (3, 301) 1, 100 (2, 425)
NCN-8 U.S. DOMSAT 1,554 (3, 425) 1,631 (3, 595) 2, 009 (4, 428) 2,082 (4, 591)
NCN-9 Foreign DOMSAT 454 (1, 000) 925 (2, 040) 1, 185 (2, 612) 872 (1,923)
NC2-49 Track Data Relay 798 (1, 760) 994 (2, 191) 1, 522 (3, 356) 786 (1, 732)
NC2-50 Disaster Warning 798 (1, 760) 1, 515 (3, 339) 1, 701 (3, 750) 1, 132 (2, 496)
NE2-43 Sync Earth Obs/Pr 1, 198 (2, 640) 1, 798 (3, 964) 2, 154 (4, 748) 1,566 (3, 453)
NEZ-39 Sync Earth Obs 1, 134 (2, 500) 2, 511 (5, 536) 1,902 (4, 193) 1,574 (3, 471)U-
NEO-11 Sync Earth Res. 454 (1, 000) 913 (2, 013) 1, 715 (3, 781) 1,006 (2, 218)
NE2-41 Sync Met. Sat. 243 (535) 270 (596) 1, 548 (3, 413) 823 (1, 814)
NEO-15 Sync Met Sat. 494 (1,000) 1, 151 (2, 537) 1, 557 (3, 432) 1,010 (2, 226)
*NASA PAYLOAD DATA BOOK
general lighter weight than Case 1, both of which exceed the current design
estimates. The reduced weight will be reflected in some measure in the
number of Tug operations, but the integrated effect should be small because
the satellites represent incremental loads on the Tug. Consequently, there
is always some reserve performance remaining on each flight which can be
absorbed without increasing the flight rate. The weights are considered to
be realistic for the design concept (ring frame) and module breakout selected.
The results of the manual analysis for all 13 payload programs are
shown in Table 16. This shows when each satellite was deployed, how long
it was on station, and what its availability was. In addition, the delay between
failure occurrence and the Tug service is shown. It is very interesting to
find that sufficient traffic exists such that, in general, the downtime on any
given satellite is less than two months. Considering the ground rule that
this also includes a 30-day preparation on the ground if a flight was not
previously scheduled, it indicates very good accessibility to the failed
satellite. The availability of any given satellite is also relatively high. The
system availability drops significantly, because it is assumed that all
satellites in the system must be operational. If two out of three satellites
in a system would be acceptable for short periods of time, the overall
availability would increase sharply. This is particularly noticeable with
NEO-11, Synchronous Earth Resources Satellite, where four satellites are
required in the system. The average for all the programs is approximately
81 percent availability. The logistic flight charges allocated to each payload
program are also shown.
A comparison of Tug operations is provided in Table 17. Case 2
has 10 percent less flights than Case 1, in spite of the fact that more payloads
and modules were deployed (NCN-9). Case 2 further represents a 18-percent
reduction in flights over ground refurbishment. One simplification exists
however; the satellites for Case 1 and Case 2 were not retrieved at the end
of their useful life (nine years). The option remains open to the payload
user, since it is assumed that after this time the payload has no value;
consequently, a $5- to $10-million retrieval cost may not be tolerable.
However, if retrieval were employed, an additional 20 to 30 flights would be
-76-
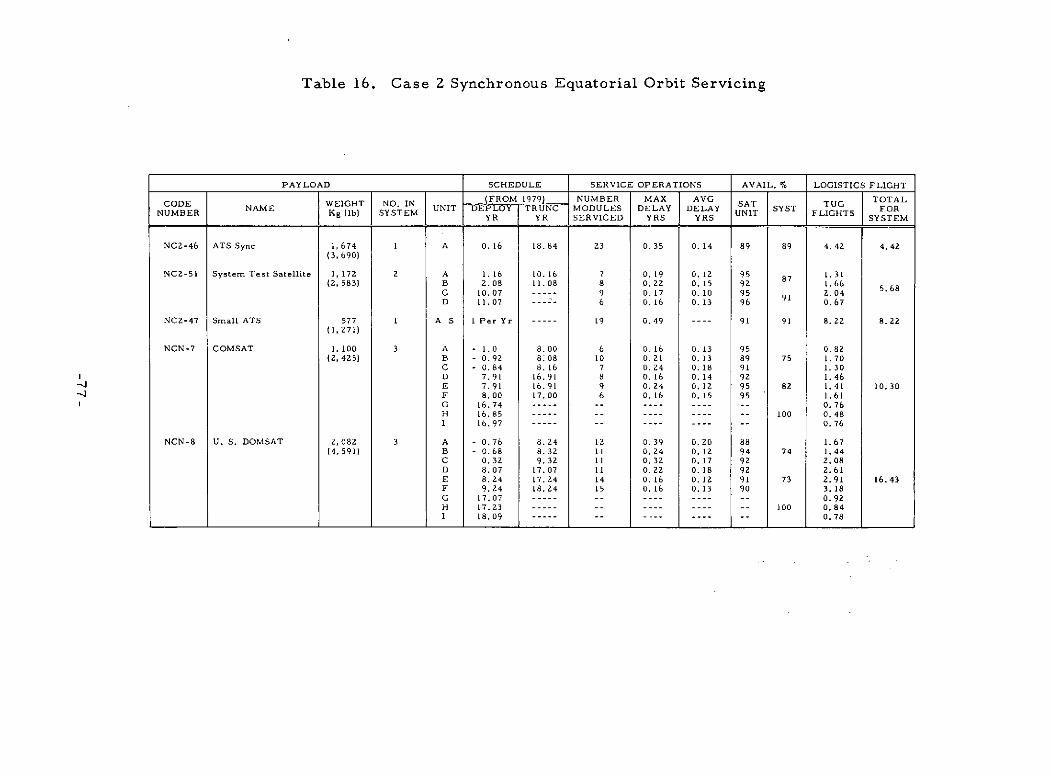
Table 16. Case Z Synchronous Equatorial Orbit Servicing
PAYLOAD SCHEDULE SERVICE OPERATIONS AVAIL. % LOGISTICS FLIGHT
CODE NWEIGHT NO. IN (FROM 1979 NUMBER MAX AVG SAT TOTALME1 NAME UNIT DEPLOY TRUNC MODULES DELAY DELAY SAT SYST GOR
STEM UNIT FLIGHTSYR YR SERVICED YRS YRS SYSTEM
NC2-46 ATS Sync 1,674 1 A 0.16 18.84 23 0.35 0.14 89 89 4.42 4.42(3,690)
NC2-51 System Test Satellite 1, 172 2 A 1. 16 10. 16 7 0. 19 0. 12 95 87 1. 31(2, 583) B 2.08 11.08 8 0.22 0.15 92 1. 66 5 68
C 10.07 ----- 9 0. 17 0.10 95 2.04D 11.07 6 0.16 0.13 96 91 0.67
NC2-47 Small ATS 577 1 A S I Per Yr ----- 19 0.49 ---- 91 91 8.22 8. 22(1,271)
NCN-7 COMSAT 1, 100 3 A - 1.0 8.00 6 0.16 0.13 95 0.82(2,425) B - 0.92 8.08 10 0.21 0.13 89 75 1.70
C - 0.84 8.16 7 0.24 0.18 91 1.30D 7.91 16.91 8 0.16 0.14 92 1.46E 7.91 16.91 9 0. 24 0. 12 95 82 1.41 10.30F 8.00 17.00 6 0.16 0.15 95 1.61G 16.74 ----- -- ---- ---- -- 0.76H 16.85 ----- -- ---- ---- -- 100 0.48I 16.97 ----- -- ---- ---- -- 0.76
NCN-8 U. S. DOMSAT 2,082 3 A - 0.76 8.24 12 0.39 0.20 88 1.67(4,591) B - 0.68 8.32 11 0.24 0.12 94 74 1.44
C 0.32 9.32 11 0.32 0.17 92 2.08D 8.07 17.07 11 0.22 0.18 92 2.61E 8.24 17.24 14 0.16 0.12 91 73 2.91 16.43F 9.24 18.24 15 0.16 0.13 90 3.18G 17.07 ----- -- ---- ---- -- 0.92H 17.23 ----- -- ---- ---- -- 100 0.84I 18.09 ----- -- ---- ---- -- 0.78

Table 16. Case 2 Synchronous Equatorial Orbit Servicing (Continued)
PAYLOAD SCHEDULE SERVICE OPERATIONS AVAIL. % LOGISTICS FLIGHT
CODE WEIGHT NO IN (FROM 1979) NUMBER MAX AVG TOTALNUMBER NAME UNIT DEPLOY TRUNC MODULES DELAY DELAY SAT SYST TUG FORNUMBER NAME Kg (Ib) SYSTEM YR YR SERVICED YRS YRS UNIT SYST FLIGHTS FOR
YR YR SERVICED YRS YRS SYSTEM
NCN-9 Foreign DOMSAT 872 2 Per A 1. 16 10. 16 10 0. 23 0. 14 88 8. 45(1, 93) Country B 1.48 10.48 7 0. 13 0.09 96 1. 45
C 2.24 11.24 8 0.17 0.14 92 1.77D 2.40 11.40 6 0.16 0. 14 95 1.73E 2.48 11.48 9 0.22 0.15 89 1.76F 2.48 11.48 8 0.24 0.11 94 1.89G 2.64 11.64 8 0.17 0.12 94 1.99H 2.72 11.72 8 0.26 0.16 90 1.42I 3.08 12.08 7 0. 24 0. 14 94 8 1.29J 3.24 12.24 9 0.27 0.14 90 1.74K 4.16 13.16 7 0.34 0.18 92 1.18L 4.24 13.24 11 0.51 0. 23 80 2. 13 36.62M 9.40 18.40 7 0.18 0.13 94 1.70N 10.15 ----- 9 0.18 0.10 94 1.79O 11.23 8 0.16 0. 10 94 1.13P 10.64 6 0.20 0.15 95 1.38Q 11.23 ----- 7 0.32 0.16 92 80 1.15R 11.47 ----- 8 0.24 0.17 88 z2.00S 11.55 9 0.21 0.14 90 1.53T 10.99 6 0.16 0.11 96 1.36U 12.07 7 0.24 0.17 90 1.36V 12.16 ----- 7 0.19 0.14 91 1.38W 13.07 5 0.17 0.14 93 1.03X 13.15 ----- 4 0.08 0.08 97 90 1.01
NCZ-49 TDRS 786 3 A - 0.60 8.40 8 C. 17 0.13 92 0.86(1,732) B - 0.52 8.48 8 0.16 0.07 96 80 0.93
C - 0.44 8.56 8 0.24 0.13 92 1.12D 8.32 17.32 7 0.16 0.16 93 1.36E 8.47 17.47 9 0.24 0.14 91 73 1.52 9.01F 8.47 17.47 9 0.29 0.16 89 1.66G 17.31 ----- -- ---- ---- -- 0.68H 17.39 ---- -- ---- ---- -- 100 0.44I 17.39 1 ---- -- ---- ---- -- 0.44
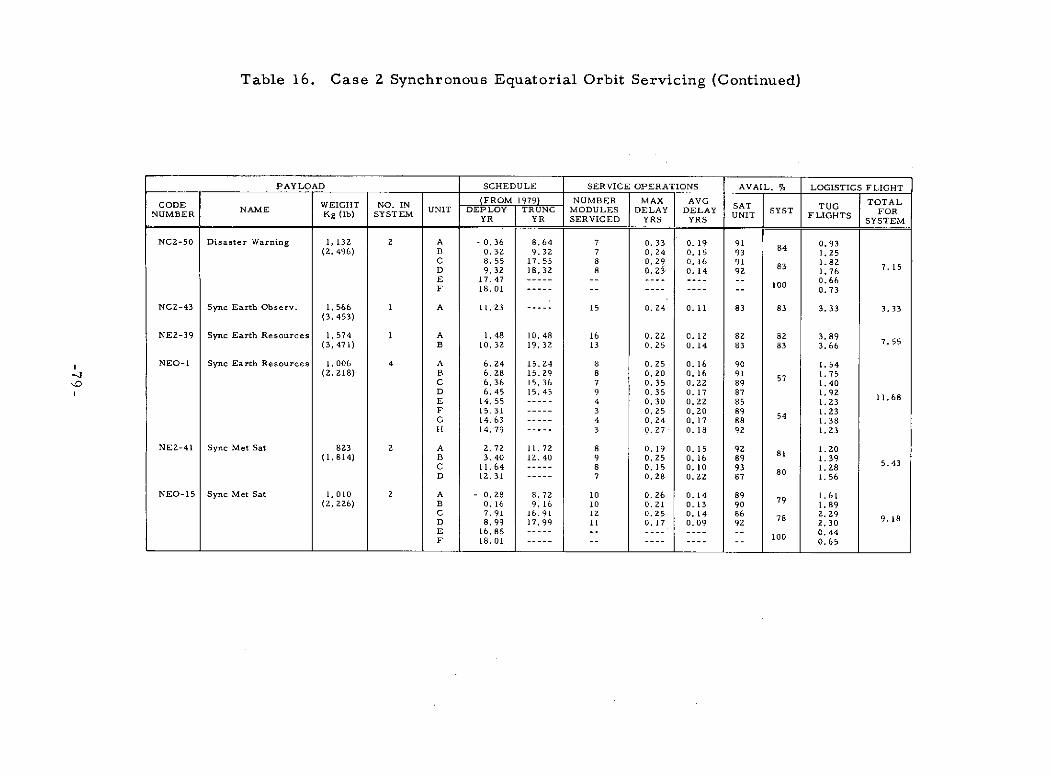
Table 16. Case 2 Synchronous Equatorial Orbit Servicing (Continued)
PAYLOAD SCHEDULE SERVICE OPERATIONS AVAIL. % LOGISTICS FLIGHT
CODE [WEIGHT NO. IN (FROM 1979 NUMBER MAX AVG SA T TUG TOTALNUMBER NAMEIKg (b) UNIT DEPLOY TRUNC MODULES DELAY DELAY UNIT SYST FLIGHTS FOR
YR YR SERVICED YRS YRS SYSTEM
NCZ-50 Disaster Warning 1, 132 2 A - 0.36 8.64 7 0. 33 0. 19 91 0.93(2,496) B 0.32 9.32 7 0.24 0.15 93 1.25
C 8.55 17.55 8 0.29 0.16 91 1.82D 9.32 18.32 8 0.23 0.14 92 83 1.767.15
E 17.47 ----- -- ---- ---- 0.66F 18.01 ----- -- ---- ---- -- 00 0.73
NC2-43 Sync Earth Observ. 1. 566 1 A 11.23 ----- 15 0.24 0.11 83 83 3.33 3.33(3, 453)
NE2-39 Sync Earth Resources 1.,574 1 A 1.48 10.48 16 0.22 0.12 82 82 3.89(3, 471) B 10.32 19.32 13 0.25 0.14 83 83 3.66 7.55
NEO-I Sync Earth Resources 1,006 4 A 6.24 15.24 8 0.25 0. 16 90 1.54(2,218) B 6.28 15.29 8 0.20 0.16 91 1.75
C 6.36 15.36 7 0.35 0.22 89 1.40D 6.45 15.45 9 0.35 0.17 87 1.92E 14.55 ----- 4 0.30 0.22 85 1.23F 15.31 ----- 3 0.25 0.20 89 1.23G 14.63 ----- 4 0.24 0.17 88 1.38H 14.79 ----- 3 0.27 0.18 92 1.23
NE2-41 Sync Met Sat 823 2 A 2.72 11.72 8 0.19 0. 15 92 81 1.20(1,814) B 3.40 12.40 9 0.25 0.16 89 1.39
C 11.64 ----- 8 0.15 0.10 93 80 1.28 5.43D 12.31 ----- 7 0.28 0.22 87 1.56
NEO-15 Sync Met Sat 1,010 2 A - 0.28 8.72 10 0.26 0.14 89 1.61(2,226) B 0.16 9.16 10 0.21 0.13 90 79 1.89
C 7.91 16.91 12 0.25 0.14 86 2.29D 8.99 17.99 11 0.17 0.09 92 2.30E 16.85 ----- -- ---- ---- -- 0.44F 18.01 ----- ------ ---- 100 0.65
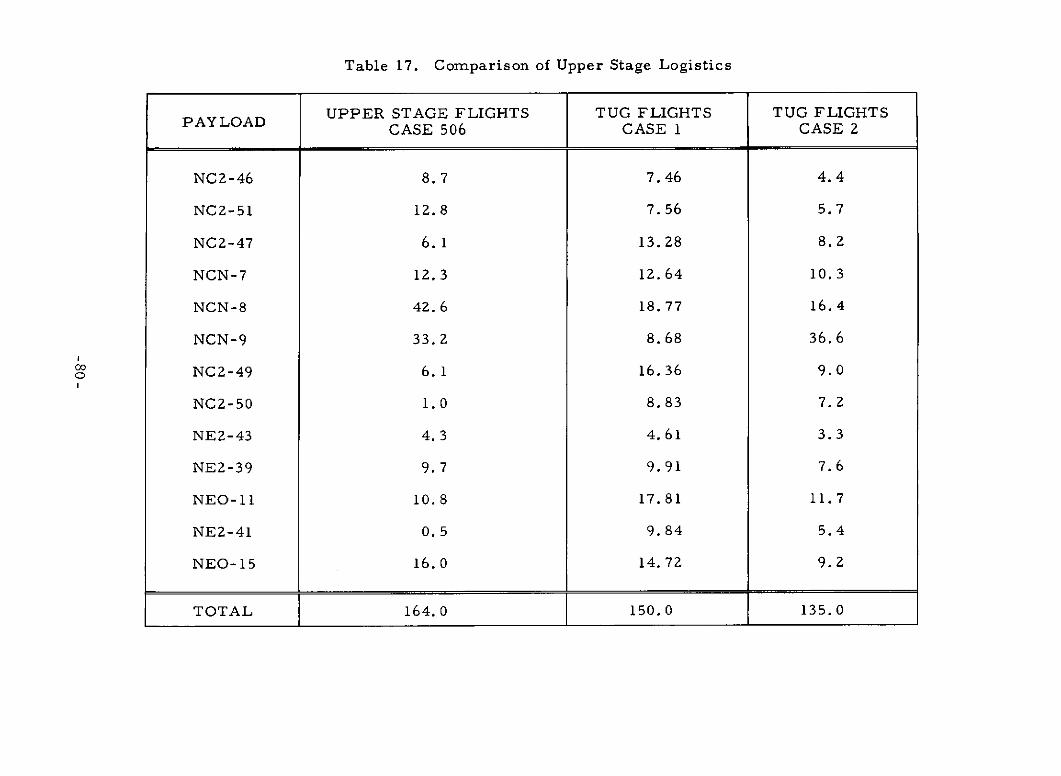
Table 17. Comparison of Upper Stage Logistics
UPPER STAGE FLIGHTS TUG FLIGHTS TUG FLIGHTSPAYLOAD CASE 506 CASE 1 CASE 2
NC2-46 8.7 7.46 4.4
NC2-51 12. 8 7.56 5.7
NC2-47 6. 1 13. 28 8. 2
NCN-7 12. 3 12.64 10.3
NCN-8 42. 6 18.77 16.4
NCN-9 33. 2 8.68 36.6
NC2-49 6. 1 16.36 9.0
NCZ-50 1. 0 8.83 7.2
NEZ-43 4.3 4.61 3.3
NE2-39 9. 7 9.91 7.6
NEO-11 10.8 17.81 11.7
NE2-41 0.5 9.84 5.4
NEO-15 16.0 14.72 9.2
TOTAL 164.0 150.0 135.0
required over the 19-year time period or approximately 1 to 2 per year.
The flight rate profiles are shown in Figure 25. The only significant points
are the dip in flight rate in 1989 due to the replacement of a number of
satellites in 1988. Modules have not had time to reach a failure state, and
consequently the flight rate is reduced. Prudent adjustment of the operational
periods could alleviate this characteristic.
A further consideration is the efficiency in loading the Tug. A
summary of the Tug operations and associated load factors is provided in
Table 18. It was possible to service up to five satellites on a single Tug
flight; however, this did not occur often. The total weight carried to orbit
over this time period was 162, 000 kg (357, 206 lb), including the 91 kg
(200 lb) service unit when required. This is essentially equivalent to the
payload deployment of Case 506 (161, 100 kg (355, 167 lb)). The excess
performance capability shown (35, 737 kg (78, 786 lb)) can probably be
reduced with further analysis, because smaller increments of weight are
being shipped. Even so, a load factor of 82 percent was achieved which is
comparable to Case 506.
In a gross sense, the payload procurement requirements can also
be established for each payload program. Table 19 summarizes the
equivalent procurement of payloads for Case 506 ground refurbishment and
the two space-servicing cases. Ground-refurbishment costs are estimated
to average one-third of the basic unit cost. Space-servicing costs are
based upon replacing a certain percentage of the modules making up a satellite.
The estimated number of modules per satellite varies from 8 to 13. On this
basis, space servicing required 25 percent more payload procurement,
although the total number of satellites deployed was reduced by 50 percent.
It is therefore necessary to look at the nature of the modules being serviced
to determine the driving factors involved.
Of the 598 modules serviced on-orbit, 50 percent were propulsion
modules which were replaced because of fuel depletion (3 years truncation).
As pointed out previously, this is highly conservative, and the module life
could be extended without compromising reliability. Twenty-three percent
of the modules replaced were electrical power modules. This also was due
-81-
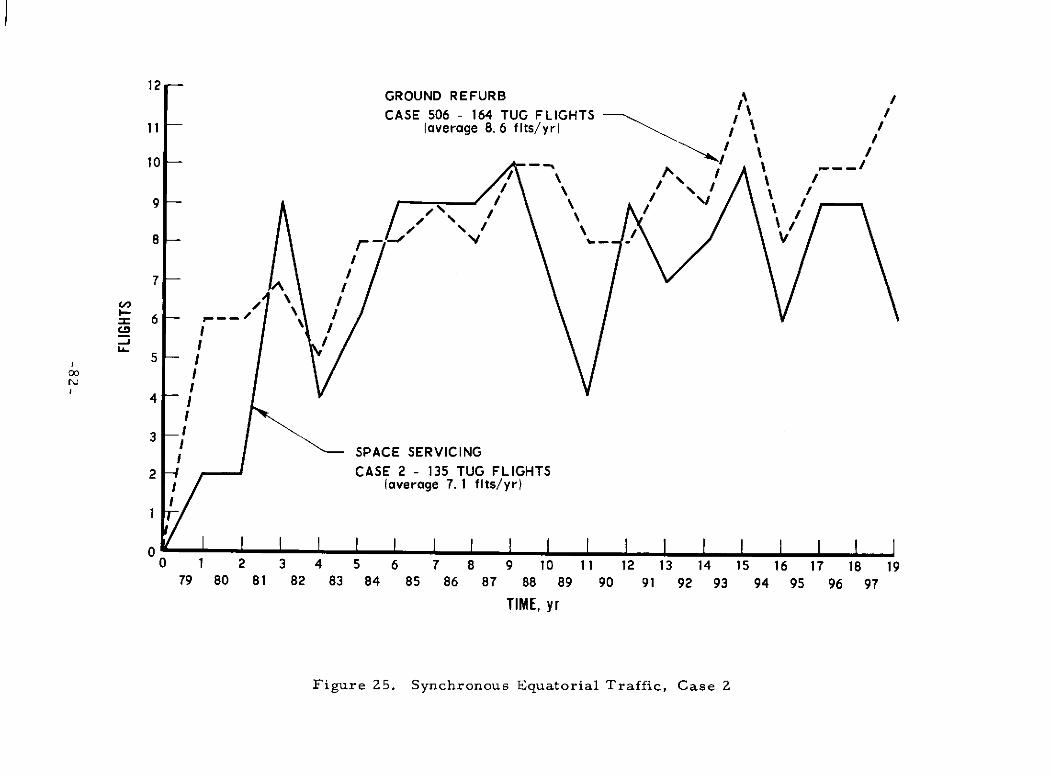
12GROUND REFURBCASE 506 - 164 TUG FLIGHTS / /
11 (average 8. 6 flts/yr) \ I
10 \
9 \ \\ i
8 % V
7
6-I
5 - III
I4 I
SPACE SERVICING
2 CASE 2 - 135 TUG FLIGHTS(average 7. 1 flts/yr)
0 1 2 3 4 5 6 7 8 9 10 11 12 13 14 15 16 17 18 1979 80 81 82 83 84 85 86 87 88 89 90 91 92 93 94 95 96 97
TIME, yr
Figure 25. Synchronous Equatorial Traffic, Case 2
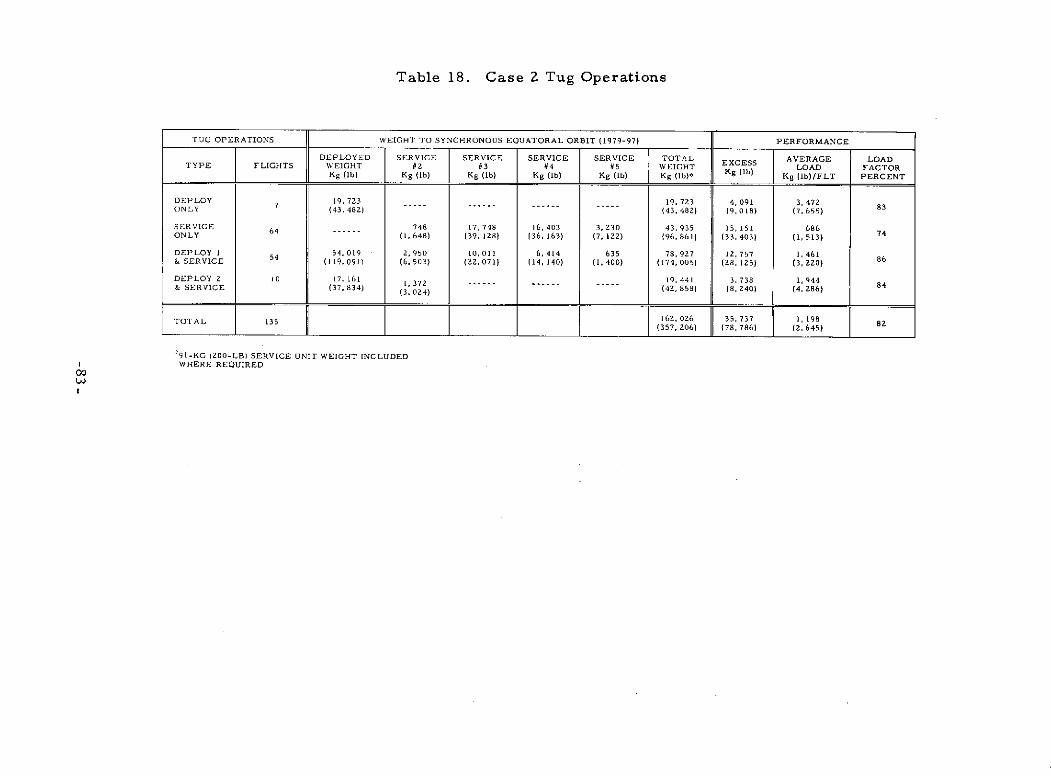
Table 18. Case 2 Tug Operations
TUG OPERATIONS WEIGHT TO SYNCHRONOUS EQUATORAL ORBIT (1979-97) PERFORMANCE
DEPLOYED SERVICE SERVICE SERVICE SERVICE TOTAL AVERAGE LOADTYPE FLIGHTS WEIGHT #2 #3 #4 #5 WEIGHT EXCESS LOAD FACTOR
Kg (lb) Kg (Ib) Kg (lb) Kg (lb) Kg (lb) Kg (lb)* Kg (lb) Kg (lb)/FLT PERCENT
DEPLOY 19, 723 19. 723 4 091 3 472ONLY (43, 482) (43, 482) (9,018) (7, 655) 83
SERVICE 64 748 17. 748 16, 403 3, 230 43, 935 15, 151 686ONLY (1,648) (39, 128) (36, 163) (7, 122) (96, 861) (33, 403) (1,513) 74
DEPLOY 1 54, 019 2,950 10,011 6. 414 635 78, 927 12, 757 1, 461& SERVICE (119, 091) (6, 503) (22, 071) (14, 140) (1,400) (174, 005) (28, 125) (3, 220) 86
DEPLOY 2 10 17, 161 19,441 3,738 1,944&1,3 ------ ------ ----- 7284SSERVICE (37 834) 024) (42, 858) (8, 240) (4, 286) 84
TOTAL 135 162,026 35 737 1, 198 82(357, 206) (78, 786) (2, 645)
:91-KG (200-LB) SERVICE UNIT WEIGHT INCLUDEDWHERE REQUIRED
00t.,
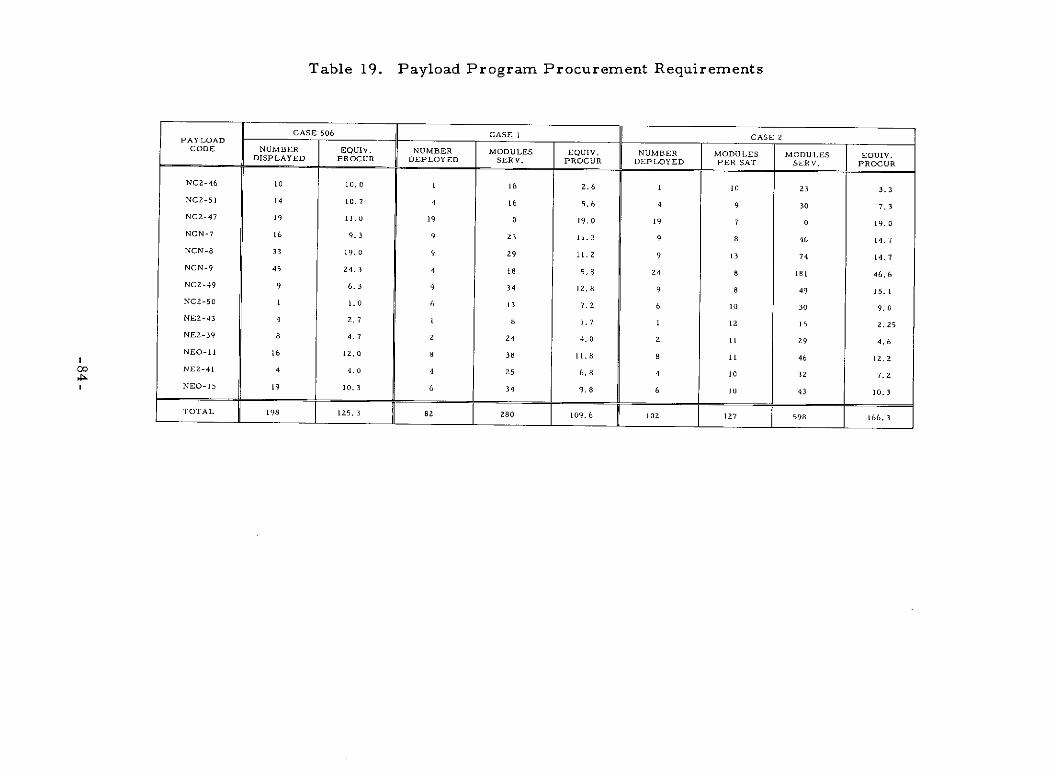
Table 19. Payload Program Procurement Requirements
PAYLOAD CASE 506 CASE I CASE 2PAYLOAD
DISPLAYED PROCUR DEPLOYED SERV. PROCUR DEPLOYED PER SAT SERV. PROCUR
NC2-46 10 10.0 1 18 2.6 1 10 23 3.3
NC2-51 14 10.7 4 16 5.6 4 9 30 7.3
NC2-47 19 11.0 19 0 19.0 19 7 0 19.0
NCN-7 16 9. 3 9 23 11.3 9 8 46 14.7
NCN-8 33 19.0 9 29 11.2 9 13 74 14.7
NCN-9 45 24. 3 4 18 5.8 24 8 181 46.6
NC2-49 9 6.3 9 34 12.8 9 8 49 15. 1
NC2-50 1 1.0 6 13 7.2 6 10 30 9.0
NE2-43 4 Z.7 1 8 1.7 1 12 15 2.25
NE2-39 8 4.7 2 24 4.0 2 11 29 4.6
NEO-11 16 12.0 8 38 11.8 8 11 46 12.2
NE2-41 4 4.0 4 25 6.8 4 10 32 7.2
NEO-15 19 10.3 6 34 9.8 6 10 43 10.3
TOTAL 198 125.3 82 280 109.6 102 127 598 166.3
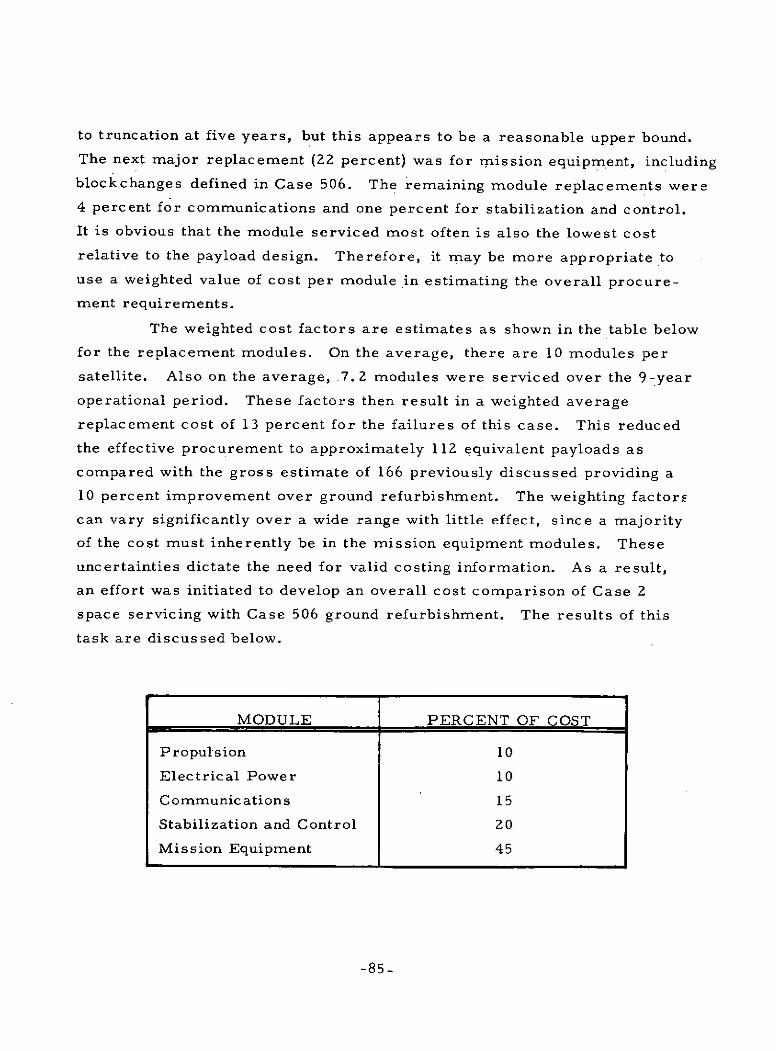
to truncation at five years, but this appears to be a reasonable upper bound.
The next major replacement (22 percent) was for mission equipment, including
blockchanges defined in Case 506. The remaining module replacements were
4 percent for communications and one percent for stabilization and control.
It is obvious that the module serviced most often is also the lowest cost
relative to the payload design. Therefore, it may be more appropriate to
use a weighted value of cost per module in estimating the overall procure-
ment requirements.
The weighted cost factors are estimates as shown in the table below
for the replacement modules. On the average, there are 10 modules per
satellite. Also on the average, .7. 2 modules were serviced over the 9-year
operational period. These factors then result in a weighted average
replacement cost of 13 percent for the failures of this case. This reduced
the effective procurement to approximately 112 equivalent payloads as
compared with the gross estimate of 166 previously discussed providing a
10 percent improvement over ground refurbishment. The weighting factors
can vary significantly over a wide range with little effect, since a majority
of the cost must inherently be in the mission equipment modules. These
uncertainties dictate the need for valid costing information. As a result,
an effort was initiated to develop an overall cost comparison of Case 2
space servicing with Case 506 ground refurbishment. The results of this
task are discussed below.
MODULE PERCENT OF COST
Propulsion 10
Electrical Power 10
Communications 15
Stabilization and Control 20
Mission Equipment 45
-85-
Cost estimate data was developed using the Aerospace Payload
Program Cost model. Factors were developed for each subsystem of the
13 payload programs to reflect the effect on cost of modular designs. These
factors range from zero to over 100 percent in terms of subsystem cost
increases. The results of the Aerospace DSP design study were used in
developing these factors along with other historical data. All costs are in
1973 dollars and reflect the uncertainty inherent in such a cursory analysis.
Three conditions were analyzed to provide a comparison of payload
costs and overall program costs. Payload costs include RDT&E, invest-
ment, and support operations costs. Launch vehicle costs consider only
operations since RDT&E and recurring investment would have to be spread
across the total space program. Case 506, ground refurbishment, provides
a basis for cost comparison with space servicing. It was necessary to
adjust the flight schedules of this case to reflect the payload mean mission
duration provided in the NASA Payload Data Book, such that the results
would be comparable to space servicing. In addition, in a few cases the
launch schedules were adjusted to reflect the extended operational time
periods used for the space servicing analysis. In general, these changes
provide a reasonable basis for comparison between space servicing of
payloads and ground refurbishment, however, at this time the results only
suggest trends. An in-depth analysis should be performed in the future to
verify preliminary conclusions.
The cost estimates for Case 2, space servicing, reflect
modularization of payloads without standardization. The estimates associated
with Case 506, ground refurbishment, include low-cost payload design
concepts, which as pointed out previously, define satellites that are heavier
in weight. A cost comparison by payload program of Case 506 and Case 2
is provided in Table 20. In addition, the cost benefits of using standardized
subsystem modules is shown by a third case. For this particular set of
conditions, ground refurbishment compared to space servicing is lower in
cost by approximately $300 million. This is caused by the large amount of
spares required for space servicing which varied between one and two
equivalent satellites worth. Such spare modules would be procured at the
-86-
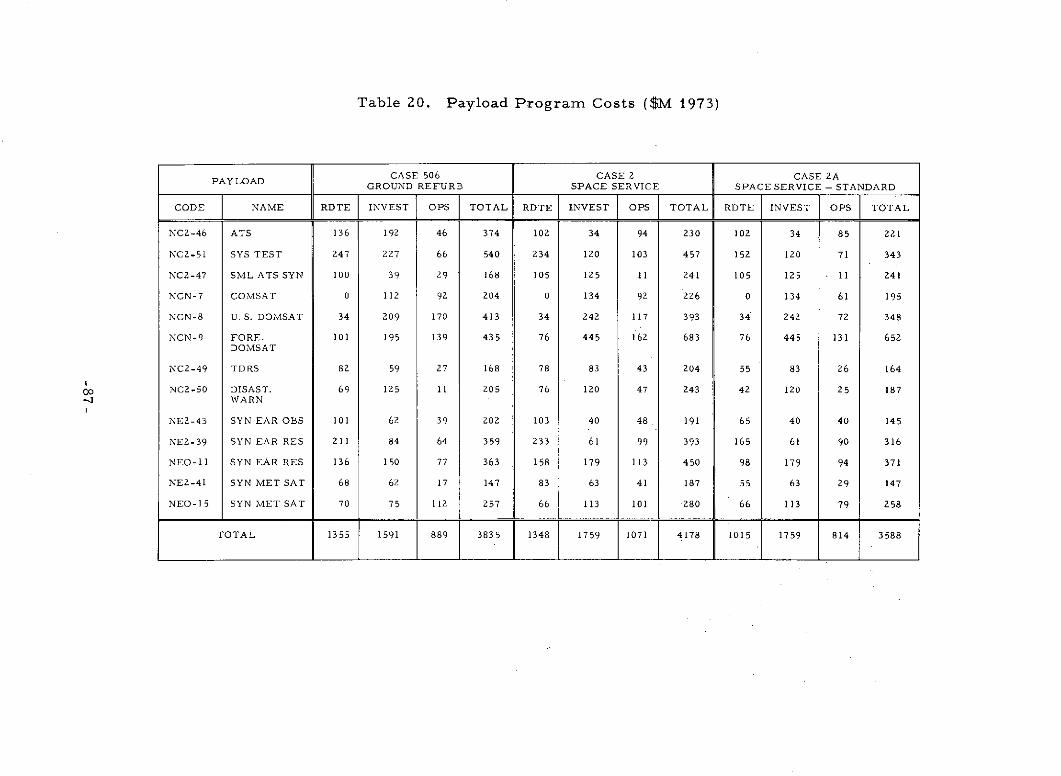
Table 20. Payload Program Costs ($M 1973)
CASE 506 CASE 2 CASE 2AGROUND REFURB SPACE SERVICE SPACE SERVICE - STANDARD
CODE NAME RDTE INVEST OPS TOTAL RDTE INVEST OPS ITOTAL RDTE INVEST OPS TOTAL
NC2-46 ATS 136 192 46 374 102 34 94 230 102 34 85 221
NC2-51 SYS TEST 247 227 66 540 234 120 103 457 152 120 71 343
NC2-47 SML ATS SYN 100 39 29 168 105 125 11 241 105 125 11 241
NCN-7 COMSAT 0 112 92 204 0 134 92 226 0 134 61 195
NCN-8 U. S. DOMSAT 34 209 170 413 34 242 117 393 34 242 72 348
NCN-9 FORE. 101 195 139 435 76 445 162 683 76 445 131 652DOMSAT
NC2-49 TDRS 82 59 27 168 78 83 43 204 55 83 26 164
NC2-50 DISAST. 69 125 11 205 76 120 47 243 42 120 25 187WARN
NE2-43 SYN EAR OBS 101 62 39 202 103 40 48 191 65 40 40 145
NE2-39 SYN EAR RES 211 84 64 359 233 61 99 393 165 61 90 316
NEO-11 SYN EAR RES 136 150 77 363 158 179 113 450 98 179 94 371
NE2-41 SYN MET SAT 68 62 17 147 83 63 41 187 55 63 29 147
NEO-15 SYN MET SAT 70 75 112 257 66 113 101 -280 66 113 79 258
TOTAL 1355 1591 889 3835 1348 1759 1071 4178 1015 1759 814 3588
initiation of a payload program. When the programs were reinstituted after
nine years of operation, such spares would again be procurred. If
standardized modules can be realized, the improved use of spares would
result in approximately equal payload costs for space servicing compared
to ground refurbishment.
The third case shown in Table 20, which reflects the benefits of
standardized subsystems, reduces RDT&E as well as the number of spares.
The net effect is a savings of $247 million over ground refurbishment of
approximately 6 percent.
These results are then integrated into the total program including
launch vehicle cost and summarized in Table 21. Space servicing shows an
overall saving, over ground refurbishment, of approximately 4 percent.
Standardization increases this savings to 14 percent or $818 million. The
figures suggest that space servicing may offer economic benefits for space
programs. The savings illustrated are only approximate but are felt to be
achievable and should be conservative. In-depth analyses should be
performed and cost estimating techniques should be improved to help
diminish uncertainty regarding the concept of space servicing.
-88-
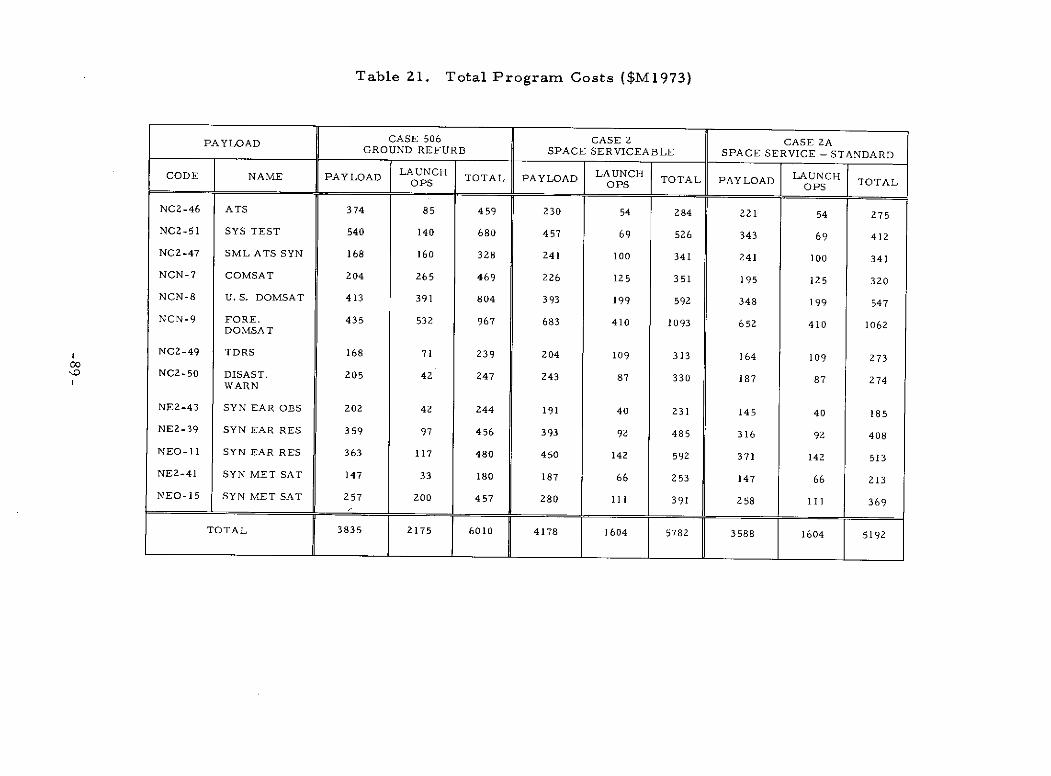
Table 21. Total Program Costs ($M1973)
PAYLOAD CASE 506 CASE 2 CASE 2AGROUND REFURB SPACE SERVICEABLE SPACE SERVICE - STANDARD
CODE LAUNCH LAUNCH LAUNCH 1
CODE NAME PAYLOAD LAUNCH TOTAL PAYLOAD LAUNCH TOTAL PAYLOAD LAUNCH TOTAL
NC2-46 ATS 374 85 459 230 54 284 221 54 275
NC2-51 SYS TEST 540 140 680 457 69 526 343 69 412
NC2-47 SML ATS SYN 168 160 328 241 100 341 241 100 341
NCN-7 COMSAT 204 265 469 226 125 351 195 125 320
NCN-8 U.S. DOMSAT 413 391 804 393 199 592 348 199 547
NCN-9 FORE. 435 532 967 683 410 1093 652 410 1062DOMSAT
NC2-49 TDRS 168 71 239 204 109 313 164 109 273
NC2-50 DISAST. 205 42 247 243 87 330 187 87 274WARN
NE2-43 SYN EAR OBS 202 42 244 191 40 231 145 40 185
NE2-39 SYN EAR RES 359 97 456 393 92 485 316 92 408
NEO-11 SYN EAR RES 363 117 480 450 142 592 371 142 513
NE2-41 SYN MET SAT 147 33 180 187 66 253 147 66 213
NEO-15 SYN MET SAT 257 200 457 280 111 391 258 111 369
TOTAL 3835 2175 6010 4178 1604 5782 3588 1604 5192
5. SUMMARY AND CONCLUSIONS
This study was originated to examine alternative operational
concepts for the Space Transportation System which could improve the
operational efficiency and provide some degree of economic benefit. The
study examined the total concept at a system level involving mission
requirements, payload design options, and logistic vehicle definitions. The
problem was approached in a generic sense in that payloads and missions
of the future are assumed to be an extrapolation of today's missions.
Although detail design information for each payload program cannot be
specified, descriptions can be developed to bound the weight and volume
considerations which impact on the STS system. Emphasis was placed first
on improving utilization of the Shuttle and Tug upper stage for payload
deployment and retrieval. After this, alternate upper.stages were evaluated
relative to overall program costs including solar electric propulsion (SEP).
The analysis was then expended to include space servicing as an operational
concept in an effort to improve logistic operations.
The STS logistic operations have several areas needing improvement.
Low altitude operations using the Shuttle for payload deployment or sortie
operations show a load factor (based upon weight) of approximately 50 percent.
In a few cases, this occurs because of large volume requirements imposed
by the payload, but in general it can be laid to poor utilization of the Shuttle.
The traffic requirements are so unique that multiple payload operations
cannot be exploited. In many cases, this is attributed to a lack of
appreciation of the flight requirements by the payload programs. It is not
apparent why specific altitudes are required when a shift of 93 km (50 nmi)
in apogee could allow deployment of multiple payloads. The cost benefits
to the payload programs are such that a reconsideration of the mission
requirements should be undertaken. Also, the projected resupply traffic
to the space station at 55 deg inclination utilizes only 25 percent of the
Shuttle capacity. There are a few payloads in this same inclination at
12, 800 km (6, 900 nmi) altitude, which require an upper stage. However,
ground rules to date have precluded inclusion of upper stages on manned
-91- PRECEDNG PAGE BLANK NOT FILMED
resupply missions as a safety precaution. An alternate approach is to save
the operations cost through better utilization of the Shuttle and apply these
funds toward reducing the hazards. There are also numerous polar missions
for earth observations. It is recommended that these be examined to
determine the degradation in mission data which might occur if they utilizeda 55-deg inclined orbit. Recognizing the benefits of operations cost sharing
should have some influence, since a majority of the earth surface can stillbe observed by this orbit.
Tug operations to synchronous equatorial orbit were found to be
relatively efficient with a load factor of 82 percent. Also, approximately
70 percent of the operations employed both deployment and retrieval
indicating that ground refurbishment of payloads is feasible without numerous
retrieval-only flights. Only two payloads were heavy enough to force
dedicated retrieval flights. These payloads (NE2-39, LCR Synchronous
Earth Observations, and NC2-46, LCR Applications Technology Satellite)
should be reevaluated to determine if the low cost design approach is validin these cases. It may also be possible to break down the mission objectives
into separate smaller payloads which could be absorbed into the normaltraffic flow.
Polar missions were found to result in poor utilization of the Tug.The Tug load factor on the average was less than 7 percent. Several optionsare available. The orbital requirements are such that (unless there is somemission constraint) up to three payloads could be deployed or retrieved ona single Tug flight. The operation becomes compounded, but the logisticcost is reduced to one-third the cost previously considered. The fundamentallaunch schedule of three such payloads is reasonably compatible for multipleuse of the Tug. This deserves more effort relative to the actual operationsinvolved to assure that the complexities involved can be accepted. Anotheralternative is to use a smaller Tug which is more compatible with themission requirements. The logistics could be reduced some, because theShuttle would have the capacity to deploy other payloads at low altitude onthe same flights. Development costs would obviously increase over thebaseline Tug; however, joint use of subsystems and powerplants could
-92-
minimize this effect. A two-stage operation could then be employed for
retrieval of the two synchronous satellites previously mentioned.
Another alternative which was investigated involved the use of a
solar electric propulsion stage (SEPS) in conjunction with a Tug. A
preliminary analysis indicated minor cost savings, considering the DDT&E
of the SEPS. However, a significant gain in deployment and retrieval can
be realized for those unique payloads which exceed the Tug alone capability.
This effort is reported in detail in an Aerospace report (Ref. 11). The
report includes a tradeoff of various Tug sizes.and shows the impact on the
total program costs. In summary, the cost variance between viable Tug
options, including phased deployment was less than 5 percent of the total
program costs. Spread over the 19-year program, it appears that cost
itself should not be the principal parameter in selecting a Tug configuration.
In an effort to improve the overall utilization of resources, space
servicing of payloads was analyzed as an operational concept. In-depth
analysis of a single program in synchronous equatorial orbit (DSP) indicated
a potential benefit approximating 20 to 45 percent of the program cost,
depending upon the servicing policy. However, it was not obvious that
these savings could be extrapolated to the full spectrum of payloads in the
NASA mission model. There are 13 payload programs at synchronous
equatorial orbit with 1 to 4 satellites in each program. This amounts to a
total of 37 satellites at various longitude placements. The baseline MSFC
Tug was found to have the performance capability to service up to 5
satellites distributed over 270 deg of longitude within a 7-day mission
period.
The results are based upon a statistical distribution of failures in
the candidate satellites which then forces a random loading of space
replaceable units (SRUs) on the Tug. The results are preliminary in that
only two sample cases could be analyzed, using a manual computation
technique. However, several points can be inferred as compared to ground
refurbishment of the same payloads.
-93-
a. Tug flight operations were reduced by 18 percent.
b. Tug utilization (load factor) averaged 82 percent which isequivalent to ground refurbishment operations.
c. Total equivalent procurement of payloads was reducedapproximately 10 percent.Integrated cost benefit is 14 percent.
d. Average availability of the satellite systems was 81 percent.
The results point favorably toward space servicing along with other
factors which may be just as important. The mission equipment on many
of the earth observation satellites has a typically short lifetime of
approximately one year. Consequently, equipment changeout or block
changes in design can be expected for some time in the future. An
operational concept which allows this flexibility without having to replace
the entire satellite should be a distinct improvement. In addition, the total
satellite weight is not constrained to a retrieval condition of 1, 814 kg
(4, 000 lb), allowing some relaxation of the design effort. Once the payload
is deployed, the concern focuses on the individual module weights.
The same servicing results may not be possible with low altitude
satellites due to orbital regression and reduced traffic to specific orbits.
In this case, a multi-mission satellite offers the potential to reduce program
costs. A single satellite stationed in a compromise orbit could have the
same mission equipment of several satellites in different orbits. In this
way, the multi-mission satellite could be serviced by a single Tug or Shuttle
operation replacing failed components and changing out mission equipment.
It is recommended that this concept be pursued in future studies as a meansof reducing overall system costs.
Further analysis is required to assess various space-servicing
options. Manual calculations are too time-consuming to produce enough datafor a statistically acceptable answer. Consequently, a computer program
has been considered for future efforts. The computer specification isincluded as Volume IV of this report. It is recommended that coding of thisprogram be initiated as early as possible in any follow-on study of spaceservicing.
-94-
In summary, this study effort has assessed several operational
approaches which could reduce future resource expenditures. Several
options appear promising and deserve further investigation. Also, there
is always a need to improve the input data upon which these tradeoffs are
made. Improved utilization of the Tug, especially for VAFB operations,
should be pursued to assure a viable alternative to the current launch
vehicles. The analysis of space servicing must be continued along with
standardization of design approaches. Standardization can be developed
without compromising the mission objectives and should provide substantial
cost benefits. It appears to date that,irrespective of common hardware, if
the SRUs can be designed for handling with a common servicing unit, space
servicing offers cost reductions over ground refurbishment.
-95-
6. REFERENCES
1. Integrated Operations/Payloads/Fleet Analysis, Phase II, SecondInterim Report, Volume II NASA Payload Data, ATR-71(7231)-1,Vol II, The Aerospace Corporation, El Segundo, Calif.. (31 March1971) (Contract No. NASw-2129).
2. NASA Payload Data Book, Payload Analysis for Space ShuttleApplications (Study 2.2) Final Report, ATR-72(7312)-1, Vol II, TheAerospace Corporation, El Segundo, Calif. (31 July 1972)(Contract No. NASw-2301).
3. Impact of Low Cost Refurbishable and Standard Spacecraft UponFuture NASA Space Programs, LMSC-D157926, Lockheed Missilesand Space Company, Inc. (30 April 1972) (Contract No. NASw-2312).
4. Integrated Operations/Payloads/Fleet Analysis Final Report,ATR-72(7231)-l, The Aerospace Corporation, El Segundo, Calif.(August 1971) (Contract No. NASw-2129).
5. Space Shuttle Mission and Payload Capture Analysis (Study 2. 1),ATR-73(7311)-1, The Aerospace Corporation, El Segundo, Calif.(15 June 1973) (Contract No. NASw-2129).
6. Study 2. 6 Operations Analysis, Mission Characterization,ATR-74(7336)-1, The Aerospace Corporation, El Segundo, Calif.(31 July 1973) (Contract No. NASw-2472.
7. Space Tug Geosynchronous Mission Simulation, ATR-73(7336)-1,The Aerospace Corporation, El Segundo, Calif. (4 May 1973)(Contract No. NASW-2472).
8. Space Shuttle Baseline Accommodations for Payloads, MSC-06900,NASA Manned Spacecraft Center, Houston (27 June 1972).
9. Baseline Tug Definition Document, Rev. A, NASA Marshall SpaceFlight Center, Huntsville, Ala. (26 June 1972).
10. Feasibility Study of a Solar Electrical Propulsion Stage for Geosynchro-nous Equatorial Missions, Final Report, Space Division, NorthAmerican Rockwell (23 February 1973) (Contract NAS8-27360).
11. Study 2.6 Interim Report, Programmatic Effects of Utilizing VariousSpace Tug Options, ATR 74(7336)-2, The Aerospace Corporation,El Segundo, Calif. (July 1973) (Contract No. NASW-2472).
-97- PRECEDING PAGE BLANK NOT FILMDj
12. DORCA II Computer Program, ATR-73(7315)-l, The AerospaceCorporation, El Segundo, Calif. (31 August 1972) (Contract No. NASw-2301).
13. DORMAN Computer Program, ATR-74(7335)-l, The Aerospace Corp.,El Segundo, Calif. (31 August 1973) (Contract No. NASW-2472).
14. Reliability Data from In-Flight Spacecraft: 1958-1970, PRC R-1453,Planning Research Corporation, El Segundo, Calif. (30 November 1971).
15. Earth Observatory Satellite (EOS) Definition Phase Report, GoddardSpace Flight Center, Greenbelt, Md. (August 1971).
16. Dormant Failure Rate Characteristics, Martin Marietta Corporation,Orlando, Fla. (to be published second quarter FY 1974).
17. Geosynchronous Platform Definition Study, SD73-SA-0036-4, SpaceDivision, Rockwell International, Downey, Calif. (April 1973) (ContractNo. NAS9-12909).
-98-

APPENDIX A
CASE 1 GROUND RULES AND MANIFEST
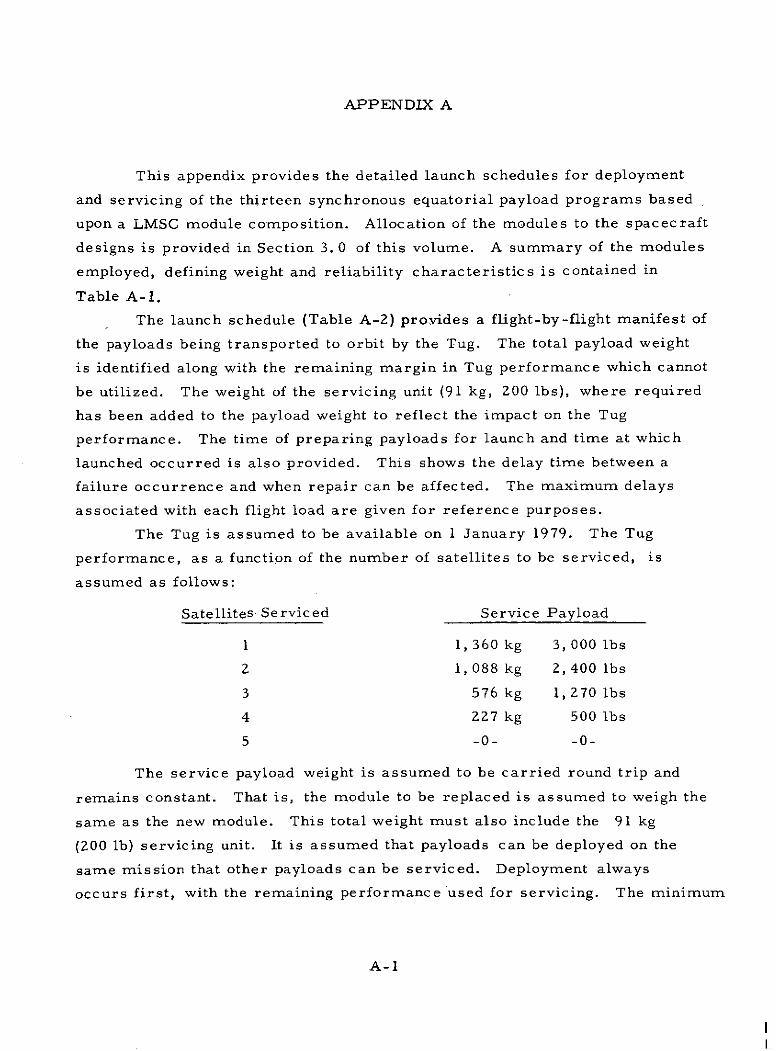
APPENDIX A
This appendix provides the detailed launch schedules for deployment
and servicing of the thirteen synchronous equatorial payload programs based
upon a LMSC module composition. Allocation of the modules to the spacecraft
designs is provided in Section 3. 0 of this volume. A summary of the modules
employed, defining weight and reliability characteristics is contained in
Table A-1.
The launch schedule (Table A-2) provides a flight-by-flight manifest of
the payloads being transported to orbit by the Tug. The total payload weight
is identified along with the remaining margin in Tug performance which cannot
be utilized. The weight of the servicing unit (91 kg, 200 lbs), where required
has been added to the payload weight to reflect the impact on the Tug
performance. The time of preparing payloads for launch and time at which
launched occurred is also provided. This shows the delay time between a
failure occurrence and when repair can be affected. The maximum delays
associated with each flight load are given for reference purposes.
The Tug is assumed to be available on 1 January 1979. The Tug
performance, as a function of the number of satellites to be serviced, is
assumed as follows:
Satellites- Serviced Service Payload
1 1, 360 kg 3,000 lbs
2 1,088 kg 2,400 lbs
3 576 kg 1,270 lbs
4 227 kg 500 lbs
5 -0- -0-
The service payload weight is assumed to be carried round trip and
remains constant. That is, the module to be replaced is assumed to weigh the
same as the new module. This total weight must also include the 91 kg
(200 lb) servicing unit. It is assumed that payloads can be deployed on the
same mission that other payloads can be serviced. Deployment always
occurs first, with the remaining performance used for servicing. The minimum
A-1
time between Tug operations is assumed to be 30 days (0. 08 yrs). Satellites
to be deployed in a given year are assumed to be available on one month
centers, starting 1 January -- no priority of operations is assumed for new
payload deployments. If after placing the first SRU in the loading que, a
full load is not achieved within six months,the TUG flight is to be performed
regardless. No satellite is to wait more than six months for servicing.
Further it is assumed that some time delay is required between identifying
a failed module and preparing a new one for flight. This time was taken
as 30 days.
A-2
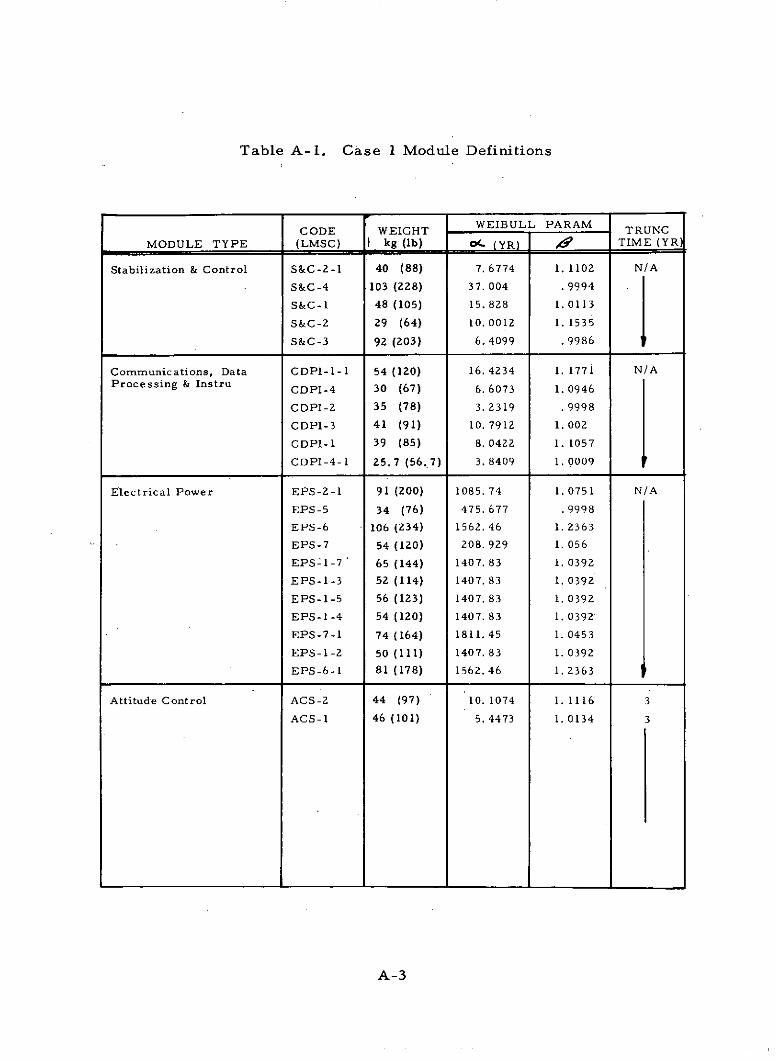
Table A-1. Case 1 Module Definitions
CODE WEIGHT WEIBULL PARAM TRUNCMODULE TYPE (LMSC) I kg (lb) oC (YR) 0 TIME (YR
Stabilization & Control S&C-2-1 40 (88) 7. 6774 1. 1102 N/A
S&C-4 103 (228) 37. 004 .9994
S&C-1 48 (105) 15.828 1.0113
S&C-2 29 (64) I0.0012 1.1535
S&C-3 92 (203) 6. 4099 .9986
Communications, Data CDPI-1-1 54 (120) 16.4234 1. 1771 N/AProcessing & Instru CDPI-4 30 (67) 6. 6073 1.0946
CDPI-2 35 (78) 3. 2319 .9998
CDPI-3 41 (91) 10. 7912 1.002
CDPI-1 39 (85) 8. 0422 1. 1057
CDPI-4-1 25.7 (56.7) 3. 8409 1.0009
Electrical Power EPS-2-1 91 (200) 1085. 74 1.0751 N/A
EPS-5 34 (76) 475. 677 .9998
EPS-6 106 (234) 1562.46 1. 2363
EPS-7 54 (120) 208. 929 1. 056
EPS-1-7 65 (144) 1407. 83 1. 0392
EPS-1-3 52 (114) 1407. 83 1. 0392
EPS-1-5 56 (123) 1407. 83 1. 0392
EPS-1-4 54 (120) 1407.83 1. 0392
EPS-7-1 74 (164) 1811.45 1.0453
EPS-1-2 50 (111) 1407.83 1.0392
EPS-6-1 81 (178) 1562.46 1.2363
Attitude Control ACS-2 44 (97) 10. 1074 1. 1116 3
ACS-1 46 (101) 5. 4473 1.0134 3
A-3
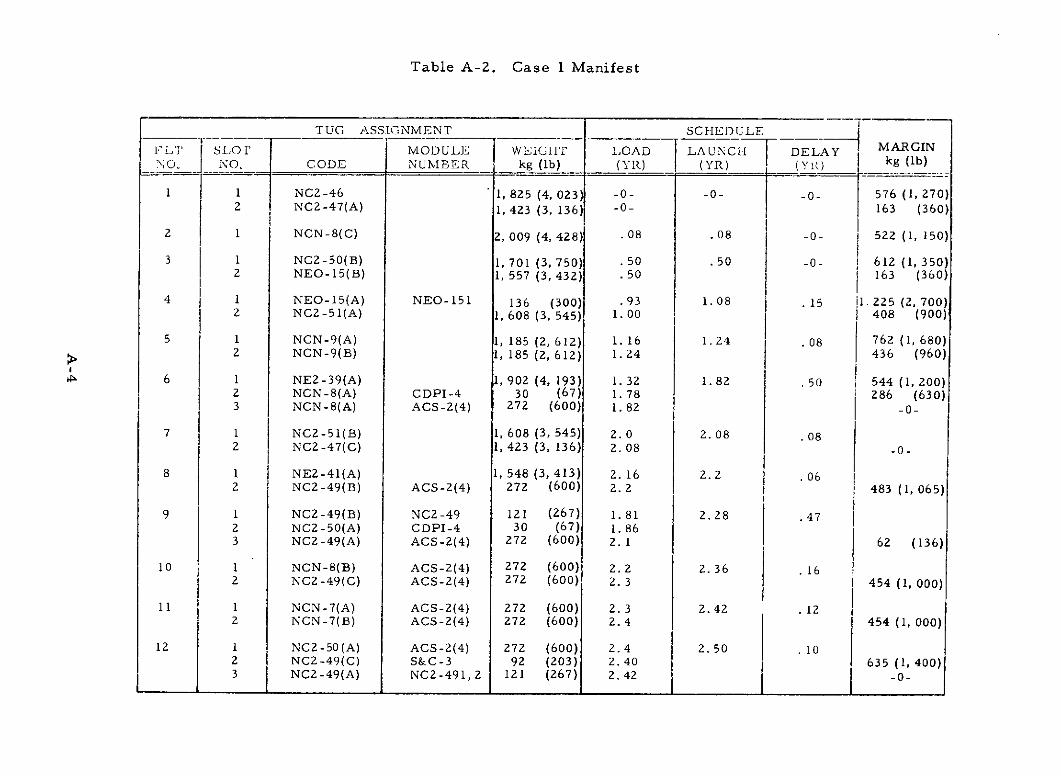
Table A-2. Case 1 Manifest
TUG ASSIGNMENT SCHEDULE
FLT SLO MODULE WEIT LOAD LAUNC DELAY MARGIN
NO. NO. CODE NUMBER kg (Ib) (YR) ( Y) (YR) kg (Ib)
1 1 NC2-46 1, 825 (4, 023) -0- -0- -0- 576 (1, 270)2 NC2-47(A) 1, 423 (3, 136) -0- 163 (360)
2 1 NCN-8(C) 2, 009 (4, 428) .08 .08 -0- 522 (1, 150)
3 1 NC2-50(B) 1, 701 (3, 750) .50 .50 -0- i 612 (1, 350)2 NEO-15(B) 1, 557 (3, 432) . 50 163 (360)
4 1 NEO-15(A) NEO-151 136 (300) .93 1.08 .15 l. 225 (2, 700)2 NC2-51(A) 1, 608 (3, 545) 1.00 408 (900)
5 1 NCN-9(A) 1, 185 (2, 612) 1. 16 1.24 .08 762 (1, 680)2 NCN-9(B) 1, 185 (2, 612) 1.24 436 (960)
6 1 NE2-39(A) 1, 902 (4, 193) 1. 32 1. 82 .50 544 (1, 200)2 NCN-8(A) CDPI-4 30 (67) 1.78 286 (630)3 NCN-8(A) ACS-2(4) 272 (600) 1. 82 -0-
7 1 NC2-51(B) 1, 608 (3, 545) 2. 0 2.08 .082 NC2-47(C) 1,423 (3, 136) 2. 08 -0-
8 1 NE2-41(A) 1, 548 (3, 413) 2. 16 2.2 .062 NC2-49(B) ACS-2(4) 272 (600) 2.2 i 483 (1, 065)
9 1 NC2-49(B) NC2-49 121 (267) 1.81 2.28 .472 NC2-50(A) CDPI-4 30 (67) 1. 863 NC2-49(A) ACS-2(4) 272 (600) 2. 1 1 62 (136)
10 1 NCN-8(B) ACS-2(4) 272 (600) 2.2 2.36 .162 NC2-49(C) ACS-2(4) 272 (600) 2. 3 454 (1, 000)
11 1 NCN-7(A) ACS-2(4) 272 (600) 2. 3 2.42 . 122 NCN-7(B) ACS-2(4) 272 (600) 2.4 454 (1, 000)
12 1 NC2-50(A) ACS-2(4) 272 (600) 2.4 2.50 . 102 NC2-49(C) S&C-3 92 (203) 2. 40 635 (1, 400)3 NC2-49(A) NC2-491,2 121 (267) 2.42 -0-
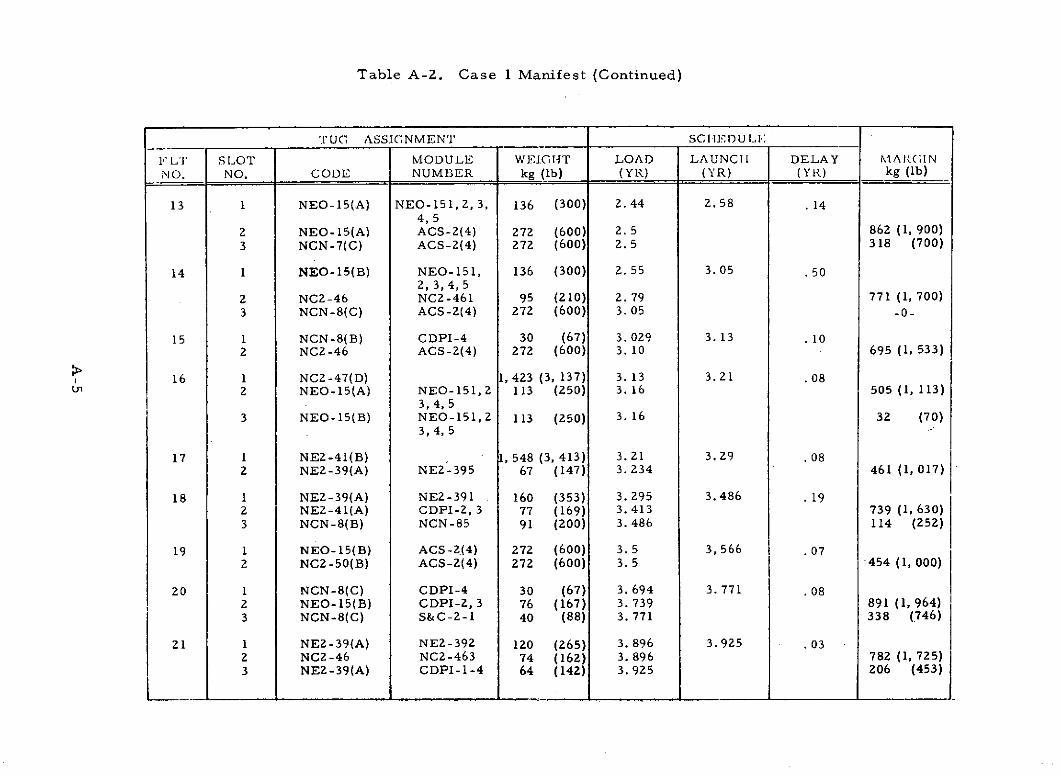
Table A-2. Case 1 Manifest (Continued)
TUG ASSIGNMENT SC I1DULI..
FLTJ SLOT MODULE WEIGHT LOAD LAUNCH DELAY MARI(IN
NO. NO. CODE NUMBER kg (Ib) (YR) (YR) (YR) kg (Ib)
13 1 NEO-15(A) NEO-151, 2, 3, 136 (300) 2.44 2.58 .144,5
2 NEO-15(A) ACS-2(4) 272 (600) 2. 5 862 (1, 900)3 NCN-7(C) ACS-2(4) 272 (600) 2.5 318 (700)
14 1 NEO-15(B) NEO-151, 136 (300) 2.55 3.05 .502, 3, 4, 5
2 NC2-46 NC2-461 95 (210) 2. 79 771 (1, 700)3 NCN-8(C) ACS-2(4) 272 (600) 3. 05 -0-
15 1 NCN-8(B) CDPI-4 30 (67) 3.029 3. 13 .102 NC2-46 ACS-2(4) 272 (600) 3. 10 695 (1, 533)
16 1 NC2-47(D) 1, 423 (3, 137) 3. 13 3.21 .082 NEO-15(A) NEO-151, 2 113 (250) 3. 16 505 (1, 113)
3, 4, 53 NEO-15(B) NEO-151, 2 113 (250) 3.16 32 (70)
3, 4, 5
17 1 NE2-41(B) 1, 548 (3, 413) 3.21 3.29 .082 NE2-39(A) NE2-395 67 (147) 3.234 461 (1, 017)
18 1 NE2-39(A) NE2-391 . 160 (353) 3.295 3.486 .192 NEZ-41(A) CDPI-2, 3 77 (169) 3.413 739 (1, 630)3 NCN-8(B) NCN-85 91 (200) 3. 486 114 (252)
19 1 NEO-15(B) ACS-2.(4) 272 (600) 3.5 3,566 .072 NC2-50(B) ACS-2(4) 272 (600) 3. 5 454 (1, 000)
20 1 NCN-8(C) CDPI-4 30 (67) 3. 694 3. 771 .082 NEO-15(B) CDPI-2, 3 76 (167) 3. 739 891 (1,964)3 NCN-8(C) S&C-2-1 40 (88) 3. 771 338 (746)
21 1 NE2-39(A) NE2-392 120 (265) 3.896 3.925 .032 NC2 -46 NC2-463 74 (162) 3. 896 782 (1, 725)3 NE2-39(A) CDPI-1-4 64 (142) 3. 925 206 (453)
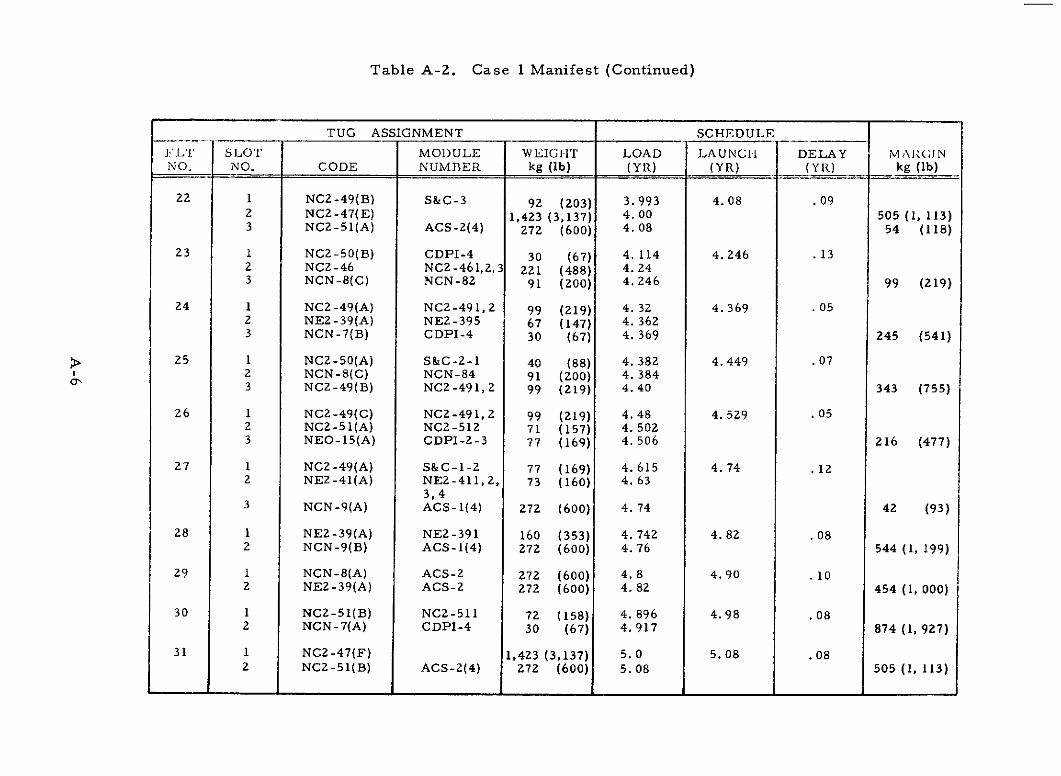
Table A-2. Case 1 Manifest (Continued)
TUG ASSIGNMENT SCHEDULE
FLT SLOT MODULE WEIG-T LOAD LAUNCH DELAY MARIJNNO. NO. CODE NUMBER kg (Ib) (YR) (YR) (YR) kg (Ib)
22 1 NC2-49(B) S&C-3 92 (203) 3.993 4.08 . 092 NC2-47(E) 1,423 (3,137) 4.00 505 (1, 113)3 NC2-51(A) ACS-2(4) 272 (600) 4.08 54 (118)
23 1 NC2-50(B) CDPI-4 30 (67) 4. 114 4.246 .132 NC2-46 NC2-461,2,3 221 (488) 4.243 NCN-8(C) NCN-82 91 (200) 4. 246 99 (219)
24 1 NC2-49(A) NC2-491, 2 99 (219) 4. 32 4. 369 .052 NEZ-39(A) NE2-395 67 (147) 4.3623 NCN-7(B) CDPI-4 30 (67) 4. 369 245 (541)
25 1 NC2-50(A) S&C-2-1 40 (88) 4. 382 4.449 .072 NCN-8(C) NCN-84 91 (200) 4. 3843 NC2-49(B) NC2-491, 2 99 (219) 4.40 343 (755)
26 1 NC2-49(C) NC2 -491, 2 99 (219) 4.48 4.529 .052 NC2-51(A) NC2-512 71 (157) 4.5023 NEO-15(A) CDPI-2-3 77 (169) 4. 506 216 (477)
27 1 NC2-49(A) S&C-1-2 77 (169) 4.615 4.74 .122 NE2-41(A) NE2-411,2, 73 (160) 4. 63
3,43 NCN-9(A) ACS-1(4) 272 (600) 4. 74 42 (93)
28 1 NE2-39(A) NE2-391 160 (353) 4.742 4.82 .082 NCN-9(B) ACS-1(4) 272 (600) 4. 76 544 (1, 199)
29 1 NCN-8(A) ACS-2 272 (600) 4. 8 4.90 . 102 NE2-39(A) ACS-2 272 (600) 4.82 454 (1, 000)
30 1 NC2-51(B) NC2-511 72 (158) 4. 896 4.98 .082 NCN-7(A) CDPI-4 30 (67) 4. 917 874 (1, 927)
31 1 NC2-47(F) 1,423 (3,137) 5.0 5.08 .082 NC2-51(B) ACS-2(4) 272 (600) 5.08 505 (1, 113)
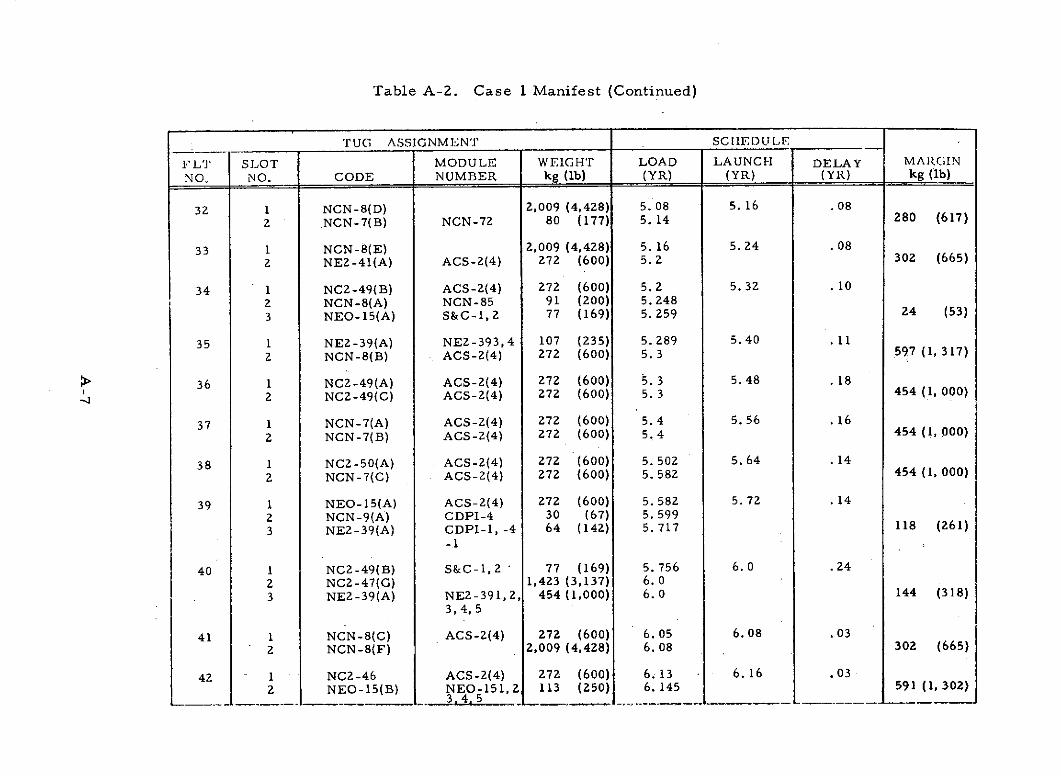
Table A-2. Case 1 Manifest (Continued)
TUG ASSIGNMENT SCHEDULE
FLT SLOT MODULE WEIGHT LOAD LAUNCH DELAY MARGIN
NO. NO. CODE NUMBER kg (Ib) (YR) (YR) (YR) kg (Ib)
32 1 NCN-8(D) 2,009 (4,428) 5. 08 5. 16 .082 NCN-7(B) NCN-72 80 (177) 5. 14 280 (617)
33 1 NCN-8(E) 2,009 (4,428) 5. 16 5. 24 .082 NE2-41(A) ACS-2(4) Z72 (600) 5.2 302 (665)
34 1 NC2-49(B) ACS-2(4) 272 (600) 5.2 5. 32 .102 NCN-8(A) NCN-85 91 (200) 5. 2483 NEO-15(A) S&C-1, 2 77 (169) 5.259 24 (53)
35 1 NE2-39(A) NE2-393, 4 107 (235) 5. 289 5.40 .112 NCN-8(B) ACS-2(4) 272 (600) 5. 3 597 (1, 317)
36 1 NC2-49(A) ACS-2(4) 272 (600) 5.3 5.48 .182 NC2-49(C) ACS-2(4) 272 (600) 5. 3 454 (1, 000)
37 1 NCN-7(A) ACS-2(4) 272 (600) 5.4 5. 56 .162 NCN-7(B) ACS-2(4) 272 (600) 5.4 454 (1, 000)
38 1 NC2-50(A) ACS-2(4) 272 (600) 5. 502 5.64 .14
2 NCN-7(C) ACS-2(4) 272 (600) 5. 582 454 (1, 000)
39 1 NEO-15(A) ACS-2(4) 272 (600) 5. 582 5. 72 .142 NCN-9(A) CDPI-4 30 (67) 5. 5993 NE2-39(A) CDPI-1, -4 64 (142) 5.717 118 (261)
-1
40 1 NC2-49(B) S&C-1, Z 77 (169) 5. 756 6.0 .242 NC2-47(G) 1,423 (3,137) 6. 03 NE2-39(A) NE2-391, 2, 454 (1,000) 6.0 144 (318)
3,4,5
41 1 NCN-8(C) ACS-2(4) 272 (600) 6. 05 6.08 .032 NCN-8(F) 2,009 (4,428) 6. 08 302 (665)
42 1 NC2-46 ACS-2(4) 272 (600) 6 13 - 6. 16 .03Z NEO-15(B) NEO-151, 2 113 (250) 6. 145 591 (1,302)
4. 3 4_ 5
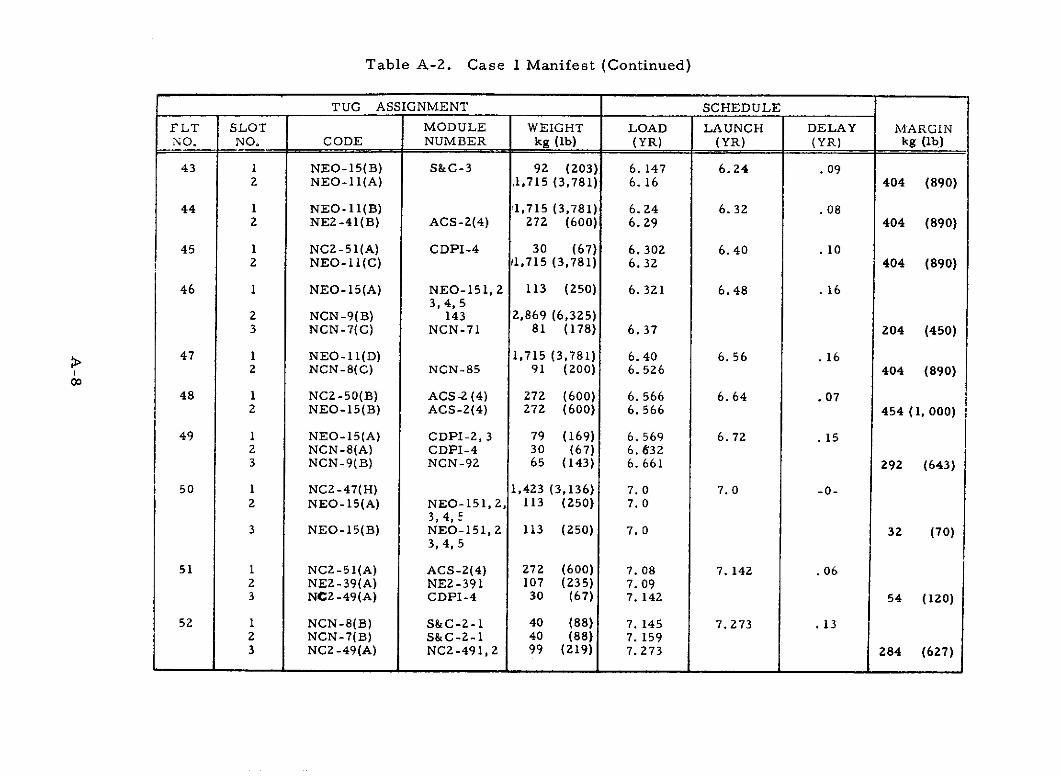
Table A-2. Case 1 Manifest (Continued)
TUG ASSIGNMENT SCHEDULE
FLT SLOT MODULE WEIGHT LOAD LAUNCH DELAY MARGINNO. NO. CODE NUMBER kg (Ib) (YR) (YR) (YR) kg (Ib)
43 1 NEO-15(B) S&C-3 92 (203) 6. 147 6.24 .092 NEO-11(A) ,1,715 (3,781) 6. 16 404 (890)
44 1 NEO-11(B) 11,715 (3,781) 6. 24 6. 32 .082 NE2-41(B) ACS-2(4) 272 (600) 6.29 404 (890)
45 1 NCZ-51(A) CDPI-4 30 (67) 6. 302 6.40 . 102 NEO-11(C) ,1,715 (3,781) 6.32 404 (890)
46 1 NEO-15(A) NEO-151,2 113 (250) 6. 321 6.48 .163, 4, 5
2 NCN-9(B) 143 2,869 (6,325)3 NCN-7(C) NCN-71 81 (178) 6. 37 204 (450)
47 1 NEO-11(D) 1,715 (3,781) 6.40 6.56 .162 NCN-8(C) NCN-85 91 (200) 6. 526 404 (890)
48 1 NC2-50(B) ACS-2 (4) 272 (600) 6. 566 6.64 .072 NEO-15(B) ACS-2(4) 272 (600) 6. 566 454 (1, 000)
49 1 NEO-15(A) CDPI-2, 3 79 (169) 6. 569 6.72 .152 NCN-8(A) CDPI-4 30 (67) 6. 6323 NCN-9(B) NCN-92 65 (143) 6. 661 292 (643)
50 1 NC2-47(H) 1,423 (3,136) 7.0 7. 0 -0-2 NEO-15(A) NEO-151, 2, 113 (250) 7.0
3, 4, E3 NEO-15(B) NEO-151,2 113 (250) 7.0 32 (70)
3, 4, 5
51 1 NC2-51(A) ACS-2(4) 272 (600) 7. 08 7. 142 .062 NE2-39(A) NE2-391 107 (235) 7. 093 NC2-49(A) CDPI-4 30 (67) 7. 142 54 (120)
52 1 NCN-8(B) S&C-2-1 40 (88) 7. 145 7.273 .132 NCN-7(B) S&C-2-1 40 (88) 7. 1593 NC2-49(A) NCZ-491, 2 99 (219) 7.273 284 (627)
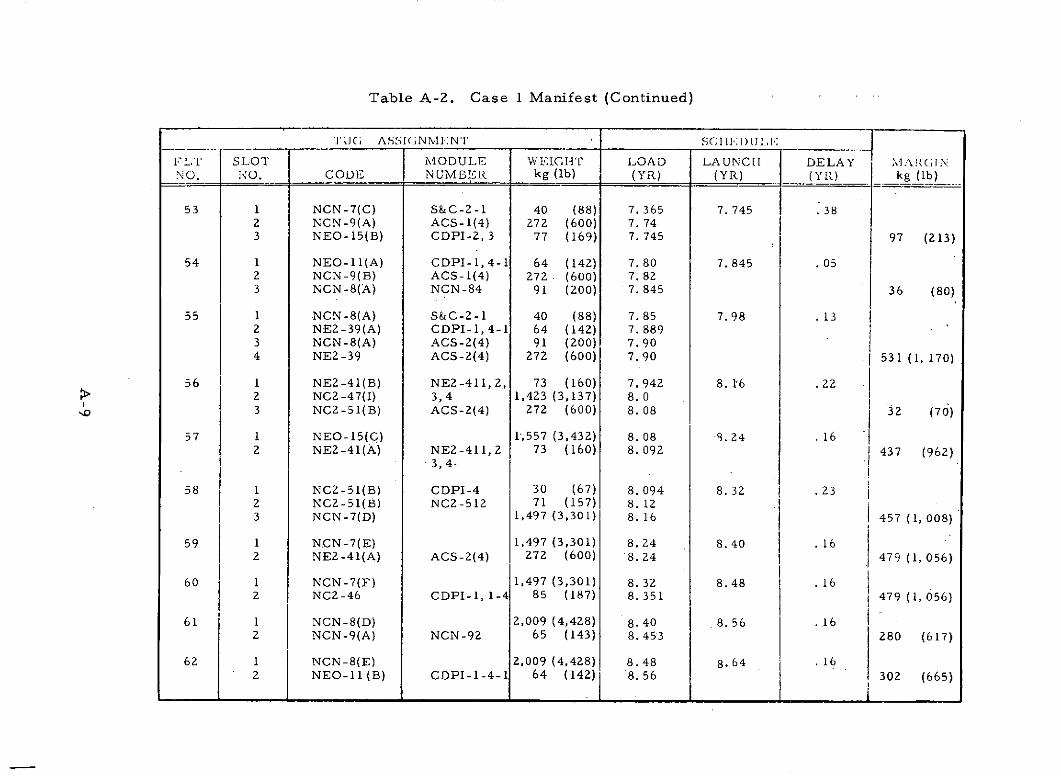
Table A-2. Case 1 Manifest (Continued)
TUG ASSJGNME NT SCHIiLI -
FL, SLOT MODULE WEIGHT LOAD LAUNCH DELAY MARGINNO. NO. CODE NUMBER kg (Ib) (YR) (YR) (Y\) kg (Ib)
53 1 NCN-7(C) S&C-2-1 40 (88) 7. 365 7. 745 .382 NCN-9(A) ACS-1(4) 272 (600) 7. 743 NEO-15(B) CDPI-2, 3 77 (169) 7. 745 97 (213)
54 1 NEO-11(A) CDPI-1, 4-1 64 (142) 7. 80 7.845 .052 NCN-9(B) ACS-1(4) 272 (600) 7. 823 NCN-8(A) NCN-84 91 (200) 7. 845 36 (80)
55 1 NCN-8(A) S&C-2-1 40 (88) 7. 85 7.98 . 132 NE2-39(A) CDPI-1, 4-1 64 (142) 7. 8893 NCN-8(A) ACS-2(4) 91 (200) 7. 904 NE2-39 ACS-2(4) 272 (600) 7.90 . 531 (1, 170)
56 1 NE2-41(B) NE2-411,2, 73 (160) 7.942 8. 16 .22 I2 NC2-47(I) 3,4 1,423 (3,137) 8.03 NC2-51(B) ACS-2(4) 272 (600) 8. 08 32 (70)
57 1 NEO-15(C) 1-,557 (3,432) 8. 08 '. 24 . 162 NE2-41(A) NE2-411, 2 73 (i60) 8. 092 437 (962)
3,4-
.58 1 NC2-51(B) CDPI-4 30 (67) 8. 094 8. 32 .232 NC2-51(B) NC2-512 71 (157) 8. 123 NCN-7(D) 1,497 (3,301) 8. 16 457 (1, 008)
59 1 NCN-7(E) 1,497 (3,301) 8.24 8.40 . 162 NE2-41(A) ACS-2(4) 272 (600) 8. 24 I 479 (1, 056)
60 1 NCN-7(F) 1,497 (3,301) 8. 32 8.48 . 162 NC2-46 CDPI-1, 1-4 85 (187) 8. 351 j 479 (1, 056)
61 1 NCN-8(D) 2,009 (4,428) 8.40 8.56 ..162 NCN-9(A) NCN-92 65 (143) 8. 453 280 (617)
62 1 NCN-8(E) 2,009 (4,428) 8.48 8.64 . 162 NEO-11 (B) CDPI-1-4-1 64 (142)j 8. 56 I 302 (665)
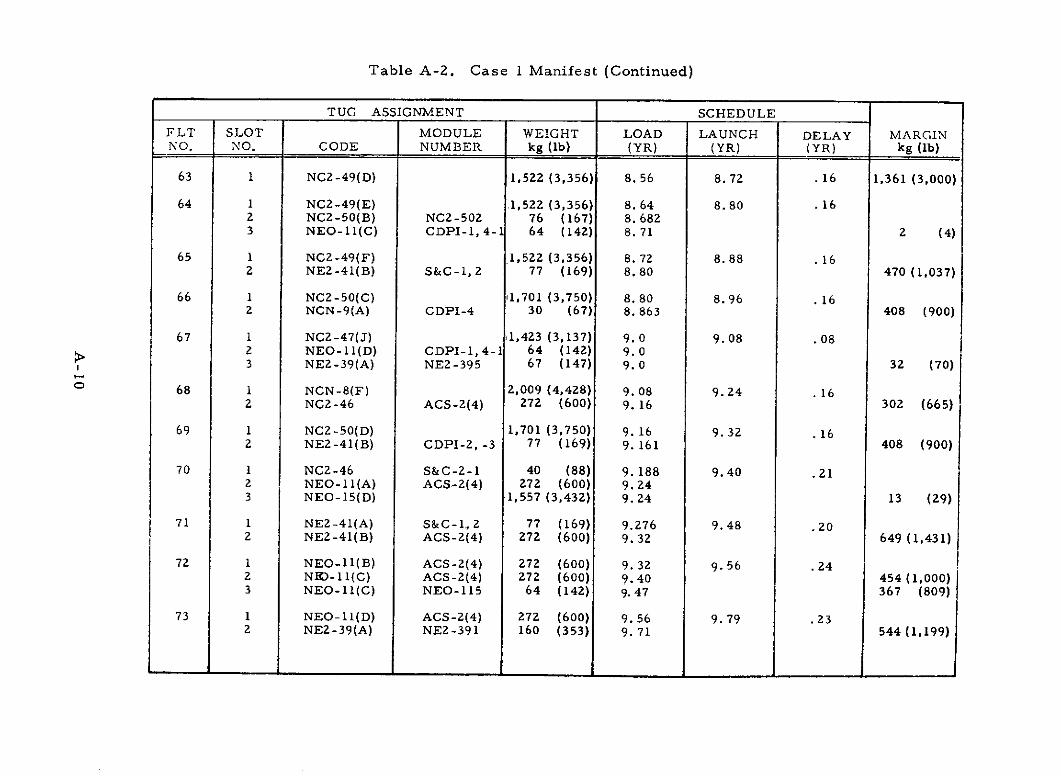
Table A-2. Case 1 Manifest (Continued)
TUG ASSIGNMENT SCHEDULE
FLT SLOT MODULE WEIGHT LOAD LAUNCH DELAY MARGINNO. NO. CODE NUMBER kg (Ib) (YR) (YR) (YR) kg (Ib)
63 1 NC2-49(D) 1,522 (3,356) 8. 56 8. 72 .16 1,361 (3,000)
64 1 NC2-49(E) .1,522 (3,356) 8. 64 8.80 .162 NC2-50(B) NC2-502 76 (167) 8. 6823 NEO-11(C) CDPI-1, 4-1 64 (142) 8.71 2 (4)
65 1 NCZ-49(F) 1,522 (3,356) 8.72 8.88 .162 NE2-41(B) S&C-1, 2 77 (169) 8.80 470 (1,037)
66 1 NCZ-50(C) 11,701 (3,750) 8.80 8.96 .162 NCN-9(A) CDPI-4 30 (67) 8. 863 408 (900)
67 1 NC2-47(J) 1,423 (3,137) 9.0 9. 08 .082 NEO-11(D) CDPI-1, 4-1 64 (142) 9.03 NE2-39(A) NE2-395 67 (147) 9.0 32 (70)
68 1 NCN-8(F) 2,009 (4,428) 9. 08 9.24 .162 NC2-46 ACS-2(4) 272 (600) 9. 16 302 (665)
69 1 NCZ-50(D) 1,701 (3,750) 9. 16 9. 32 .162 NE2-41(B) CDPI-2, -3 77 (169) 9. 161 408 (900)
70 1 NC2-46 S&C-2-1 40 (88) 9. 188 9.40 .212 NEO-11(A) ACS-2(4) 272 (600) 9.243 NEO-15(D) 1,557 (3,432) 9.24 13 (29)
71 1 NE2-41(A) S&C-1, 2 77 (169) 9.276 9.48 .202 NE2-41(B) ACS-2(4) 272 (600) 9. 32 649 (1,431)
72 1 NEO-11(B) ACS-2(4) 272 (600) 9.32 9.56 .242 N10-11(C) ACS-2(4) 272 (600) 9.40 454 (1,000)3 NEO-11(C) NEO-115 64 (142) 9.47 367 (809)
73 1 NEO-11(D) ACS-2(4) 272 (600) 9.56 9.79 .232 NE2-39(A) NE2-391 160 (353) 9.71 544 (1,199)
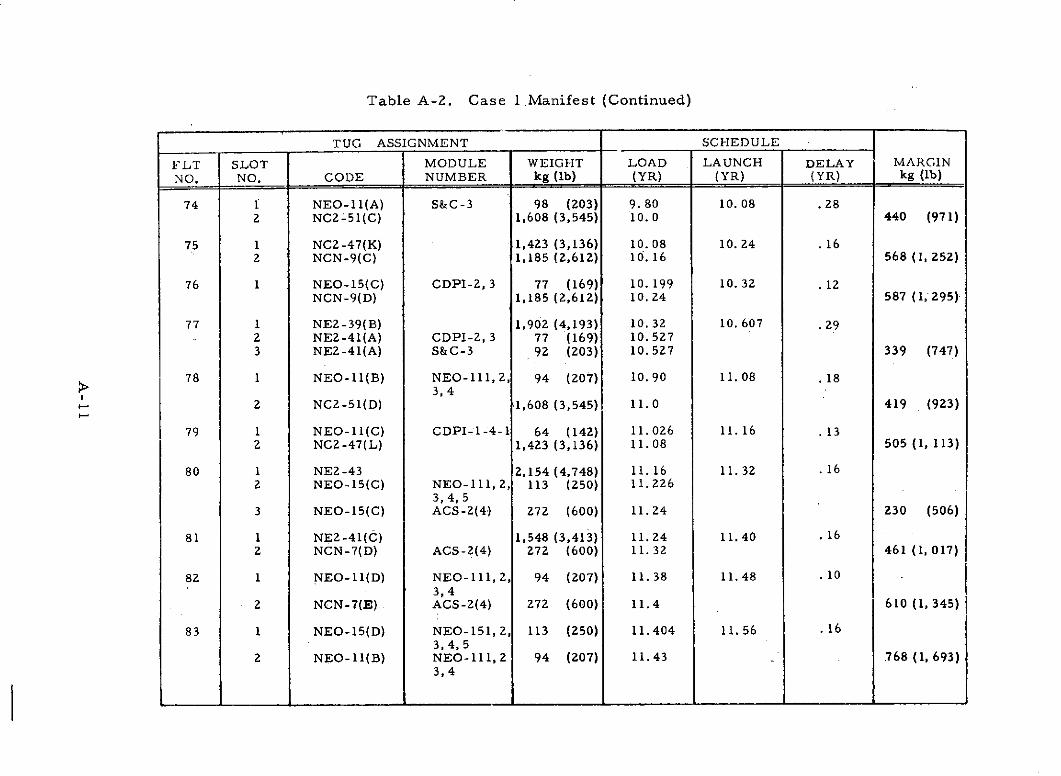
Table A-2. Case 1IManifest (Continued)
TUG ASSIGNMENT SCHEDULE
FLT SLOT MODULE WEIGHT LOAD LAUNCH DELAY MARGINNO. NO. CODE NUMBER kg (Ib) (YR) (YR) (YR) kg (Ib)
74 1 NEO-11(A) S&C-3 98 (203) 9.80 10.08 .282 NC2-51(C) 1,608 (3,545) 10.0 440 (971)
75 1 NC2-47(K) 1,423 (3,136) 10.08 10.24 .162 NCN-9(C) 1,185 (2,612) 10. 16 568 (1, 252)
76 1 NEO-15(C) CDPI-2, 3 77 (169) 10.199 10.32 .12NCN-9(D) 1,185 (2,612) 10.24 587 (1, 295)
77 1 NE2-39(B) 1,902 (4,193) 10.32 10. 607 .292 NEZ-41(A) CDPI-2, 3 77 (169) 10. 5273 NE2-41(A) S&C-3 92 (203) 10. 527 339 (747)
78 1 NEO-11(B) NEO-111, 2, 94 (207) 10.90 11.08 .183, 4
2 NC2-51(D) 1,608 (3,545) 11.0 419 (923)
79 1 NEO-11(C) CDPI-1-4-1 64 (142) 11.026 11. 16 .132 NC2-47(L) 1,423 (3,136) 11.08 505 (1, 113)
80 1 NE2-43 2,154 (4,748) 11. 16 11. 32 .162 NEO-15(C) NEO-111, 2, 113 (250) 11.226
3, 4, 53 NEO-15(C) ACS-2(4) 272 (600) 11.24 230 (506)
81 1 NE2-41(C) 1,548 (3,413) 11.24 11.40 .162 NCN-7(D) ACS-2(4) 272 (600) 11. 32 461 (1, 017)
82 1 NEO-11(D) NEO-111, 2, 94 (207) 11.38 11.48 .103,4
2 NCN-7(E) ACS-2(4) 272 (600) 11.4 610 (1, 345)
83 1 NEO-15(D) NEO-151,2, 113 (250) 11.404 11.56 .163,4, 5
2 NEO-11(B) NEO-111, 2 94 (207) 11.43 .768 (1, 693)3,4
_ _ __ _ _ _ __ __ _ _A
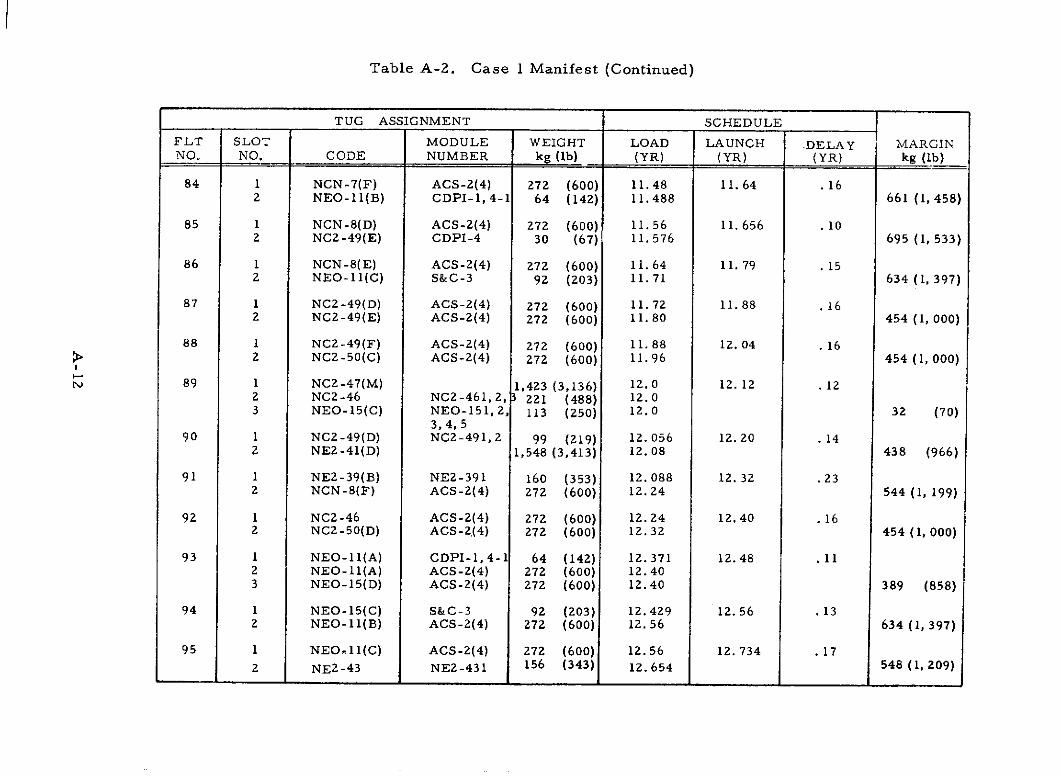
Table A-2. Case 1 Manifest (Continued)
TUG ASSIGNMENT SCHEDULE
FLT SLOT MODULE WEIGHT LOAD LAUNCH .DELAY MARGINNO. NO. CODE NUMBER kg (Ib) (YR) (YR) (YR) kg (Ib)
84 1 NCN-7(F) ACS-2(4) 272 (600) 11.48 11. 64 .162 NEO-11(B) CDPI-1, 4-1 64 (142) 11.488 661 (1, 458)
85 1 NCN-8(D) ACS-2(4) Z72 (600) 11. 56 11. 656 .102 NC2-49(E) CDPI-4 30 (67) 11.576 695 (1, 533)
86 1 NCN-8(E) ACS-2(4) 272 (600) 11. 64 11. 79 .152 NEO-11(C) S&C-3 92 (203) 11.71 634 (1, 397)
87 1 NC2-49(D) ACS-2(4) 272 (600) 11.72 11.88 .162 NC2-49(E) ACS-2(4) 272 (600) 11. 80 454 (1, 000)
88 1 NC2-49(F) ACS-2(4) 272 (600) 11.88 12. 04 .162 NC2-50(C) ACS-2(4) 272 (600) 11.96 454 (1, 000)
89 1 NC2-47(M) 1,423 (3,136) 12. 0 12. 12 .122 NC2-46 NC2-461,2, 221 (488) 12.03 NEO-15(C) NEO-151, 2, 113 (250) 12.0 32 (70)
3, 4, 590 1 NC2-49(D) NC2-491, 2 99 (219) 12. 056 12. 20 . 14
2 NE2-41(D) 1,548 (3,413) 12. 08 438 (966)
91 1 NE2-39(B) NE2-391 160 (353) 12. 088 12. 32 .232 NCN-8(F) ACS-2(4) 272 (600) 12.24 544 (1, 199)
92 1 NC2-46 ACS-2(4) 272 (600) 12. 24 12.40 .162 NC2-50(D) ACS-2.(4) 272 (600) 12. 32 454 (1,000)
93 1 NEO-11(A) CDPI-1, 4-1 64 (142) 12. 371 12.48 . 112 NEO-11(A) ACS-2(4) 272 (600) 12.403 NEO-15(D) ACS-2(4) 272 (600) 12. 40 389 (858)
94 1 NEO-15(C) S&C-3 92 (203) 12.429 12.56 .132 NEO-11(B) ACS-2(4) 272 (600) 12.56 634 (1, 397)
95 1 NEO,11(C) ACS-2(4) 272 (600) 12. 56 12. 734 .172 NE2-43 NE2-431 156 (343) 12.654 548 (1, 209)
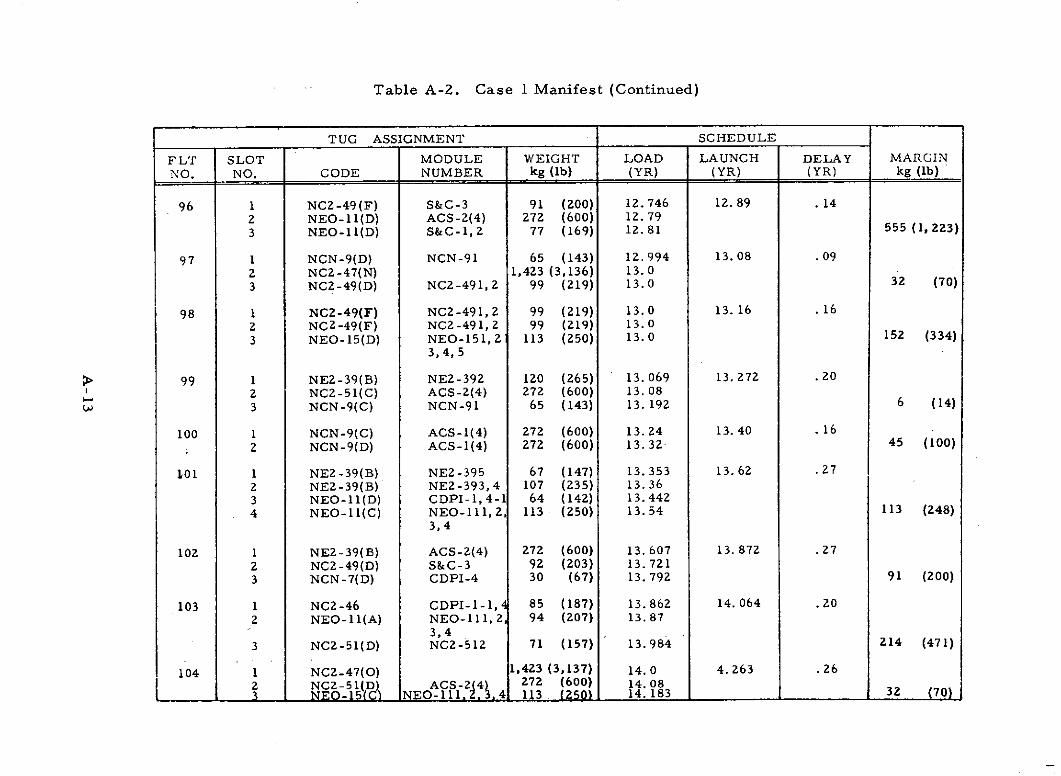
Table A-2. Case 1 Manifest (Continued)
TUG ASSIGNMENT SCHEDULE
FLT SLOT MODULE WEIGHT LOAD LAUNCH DELAY MARGIN
NO. NO. CODE NUMBER kg (Ib) (YR) (YR) (YR) kg (Ib)
96 1 NC2-49(F) S&C-3 91 (200) 12.746 12. 89 .142 NEO-11(D) ACS-2(4) 272 (600) 12. 793 NEO-11(D) S&C-1, 2 77 (169) 12.81 555 (1, 223)
97 1 NCN-9(D) NCN-91 65 (143) 12. 994 13. 08 .092 NCZ-47(N) 1,423 (3,136) 13.03 NC2-49(D) NC2-491,2 99 (219) 13.0 32 (70)
98 1 NC2-49(F). NC2-491,2 99 (219) 13.0 13. 16 .162 NC2-49(F) NC2 -491, 2 99 (219) 13.03 NEO-15(D) NEO-151, 2 113 (250) 13.0 152 (334)
3,4, 5
99 1 NE2-39(B) NE2-392 120 (265) 13.069 13. 272 .202 NC2-51(C) ACS-2(4) 272 (600) 13. 083 NCN-9(C) NCN-91 65 (143) 13. 192 6 (14)
100 1 NCN-9(C) ACS-1(4) 272 (600) 13. 24 13. 40 .162 NCN-9(D) ACS-1(4) 272 (600) 13. 32 45 (100)
101 1 NE2-39(B) NE2-395 67 (147) 13. 353 13.62 .272 NE2-39(B) NE2-393, 4 107 (235) 13. 363 NEO-11(D) CDPI-1, 4-1 64 (142) 13.4424 NEO-11(C) NEO-111, 2, 113 (250) 13.54 113 (248)
3,4
102 1 NE2-39(B) ACS-2(4) 272 (600) 13. 607 13. 872 . 272 NC2-49(D) S&C-3 92 (203) 13.7213 NCN-7(D) CDPI-4 30 (67) 13. 792 91 (200)
103 1 NC2-46 CDPI-1-1, 4 85 (187) 13.862 14.064 .202 NEO-11(A) NEO-111, 2, 94 (207) 13.87
3,43 NC2-51(D) NC2-512 71 (157) 13.984 214 (471)
104 1 NC2-47(0) 1,423 (3,137) 14. 0 4. 263 .262 NCZ-51(D) ACS-2(4) 272 (600) 14.083 NEO-15(C) NEO- 1I I, 3 4 113 (250) 14. 183 32 (70)
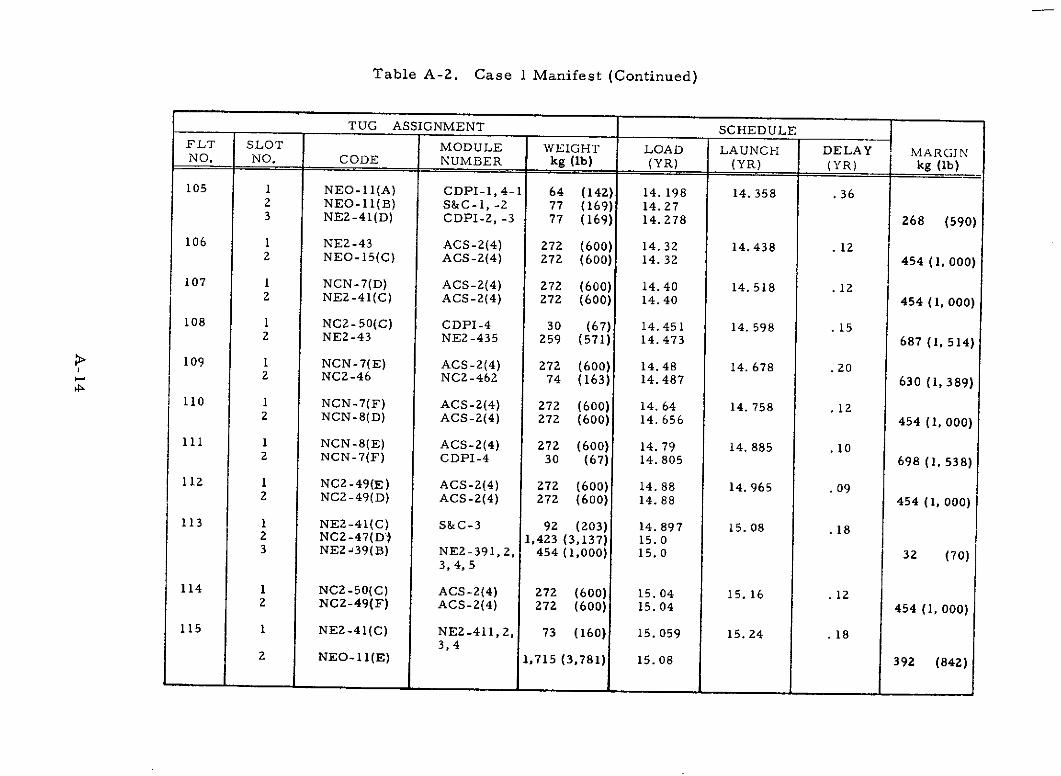
Table A-2. Case 1 Manifest (Continued)
TUG ASSIGNMENT SCHEDULEFLT SLOT MODULE WEIGHT LOAD LAUNCH DELAY MARGJNNO. NO. CODE NUMBER kg (Ib) (YR) (YR) (YR) kg (Ib)
105 1 NEO-11(A) CDPI-1, 4-1 64 (142) 14. 198 14. 358 .362 NEO-11(B) S&C-1, -2 77 (169) 14.273 NE2-41(D) CDPI-2, -3 77 (169) 14. 278 268 (590)
106 1 NE2-43 ACS-2(4) 272 (600) 14.32 14. 438 .122 NEO-15(C) ACS-2(4) 272 (600) 14.32 454 (1, 000)
107 1 NCN-7(D) ACS-2(4) 272 (600) 14.40 14. 518 . 122 NE2-41(C) ACS-2(4) 272 (600) 14.40 454 (1, 000)
108 1 NC2-50(C) CDPI-4 30 (67) 14. 451 14. 598 .152 NE2-43 NE2-435 259 (571) 14. 473 687 (1, 514)
109 1 NCN-7(E) ACS-2(4) 272 (600) 14.48 14. 678 .202 NCZ-46 NC2-462 74 (163) 14.487 630 (1, 389)
110 1 NCN-7(F) ACS-2(4) 272 (600) 14.64 14. 758 .122 NCN-8(D) ACS-2(4) 272 (600) 14. 656 454 (1, 000)
111 1 NCN-8(E) ACS-2(4) 272 (600) 14.79 14. 885 .102 NCN-7(F) CDPI-4 30 (67) 14. 805 698 (1, 538)
112 1 NC2-49(E) ACS-2(4) 272 (600) 14.88 14. 965 .092 NC2-49(D) ACS-2(4) 272 (600) 14. 88 454 (1, 000)
113 1 NE2-41(C) S&C-3 92 (203) 14.897 15.08 .182 NC2-47(D) 1,423 (3,137) 15.03 NE2-39(B) NE2-391, 2, 454 (1,000) 15.0 32 (70)
3,4, 5
114 1 NCZ-50(C) ACS-2(4) 272 (600) 15.04 15. 16 .122 NC2-49(F) ACS-2(4) 272 (600) 15. 04 454 (1, 000)
115 1 NE2-41(C) NE2-411, 2, 73 (160) 15. 059 15.24 .183,4
2 NEO-11(E) 1,715 (3,781) 15.08 392 (842)
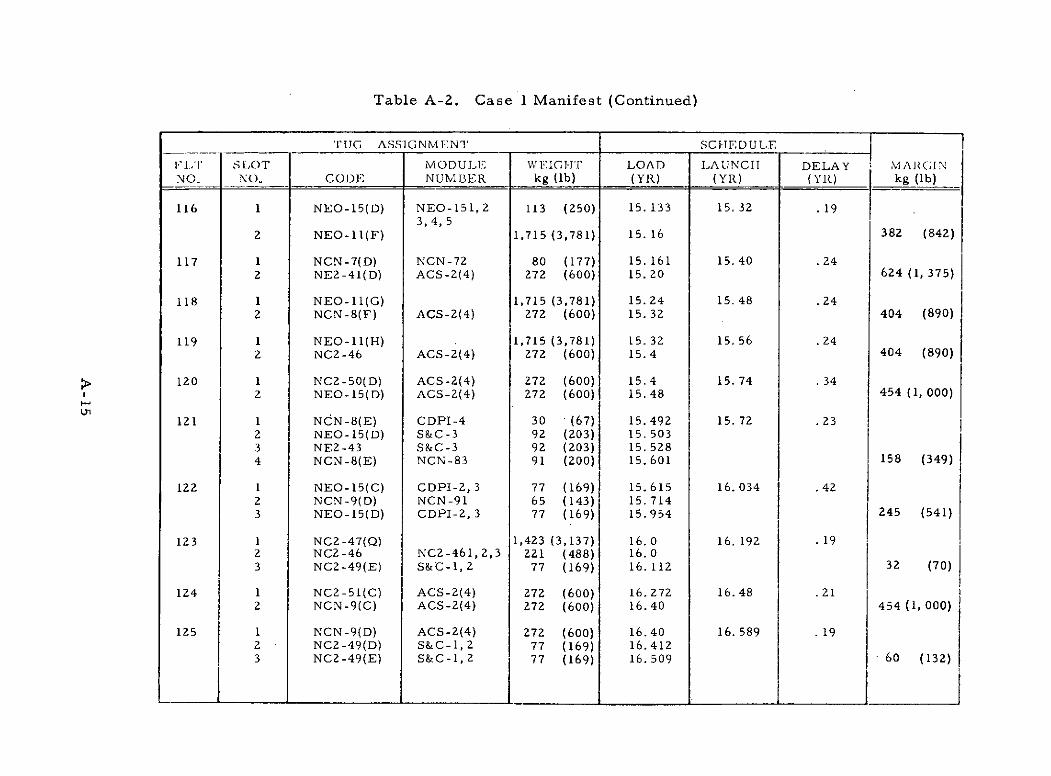
Table A-2. Case 1 Manifest (Continued)
TUG ASSIGNMENT SCHEDULE
FILT SILOT MODULE WEIGI-IT LOAD LAUNCH DELAY MARC;INNO. NO. CODE NUMBER kg (lb) (YR) (YR) (YR) kg (Ib)
116 1 NEO-15(D) NEO-151, 2 113 (250) 15. 133 15. 32 .193, 4, 5
2 NEO-11(F) 1,715 (3,781) 15. 16 382 (842)
117 1 NCN-7(D) NCN-72 80 (177) 15. 161 15.40 .242 NE2-41(D) ACS-2(4) 272 (600) 15.20 624 (1, 375)
118 1 NEO-11(G) 1,715 (3,781) 15.24 15.48 .242 NCN-8(F) ACS-2(4) 272 (600) 15. 32 404 (890)
119 1 NEO-11(H) 1,715 (3,781) 15. 32 15.56 .242 NC2-46 ACS-2(4) 272 (600) 15.4 404 (890)
120 1 NC2-50(D) ACS-2(4) 272 (600) 15.4 15. 74 .342 NEO-15(D) ACS-2(4) 272 (600) 15.48 454 (1, 000)
i I121 1 N(N-8(E) CDPI-4 30 '(67) 15.492 15. 72 .23
2 NEO-15(D) S&C-3 92 (203) 15. 5033 NE2-43 S&C-3 92 (203) 15.5284 NCN-8(E) NCN-83 91 (200) 15. 601 158 (349)
122 1 NEO-15(C) CDPI-2, 3 77 (169) 15. 615 16. 034 .422 NCN-9(D) NCN-91 65 (143) 15.7143 NEO-15(D) CDPI-2, 3 77 (169) 15.954 245 (541)
123 1 NC2-47(Q) 1,423 (3,137) 16.0 16. 192 . 192 NC2-46 NC2-461, 2,3 221 (488) 16.03 NC2-49(E) S&C-1,2 77 (169) 16.112 I 32 (70)
124 1 NC2-51(C) ACS-2(4) 272 (600) 16. 272 16.48 .212 NCN-9(C) ACS-2(4) 272 (600) 16.40 454 (1, 000)
125 1 NCN-9(D) ACS-2(4) 272 (600) 16.40 16. 589 . 192 NC2-49(D) S&C-1, 2 77 (169) 16. 4123 NC2-49(E) S&C-1, 2 77 (169) 16. 509 1 60 (132)
_ _ _ _ _ _ _ _ _ _ _ _ _ __ _
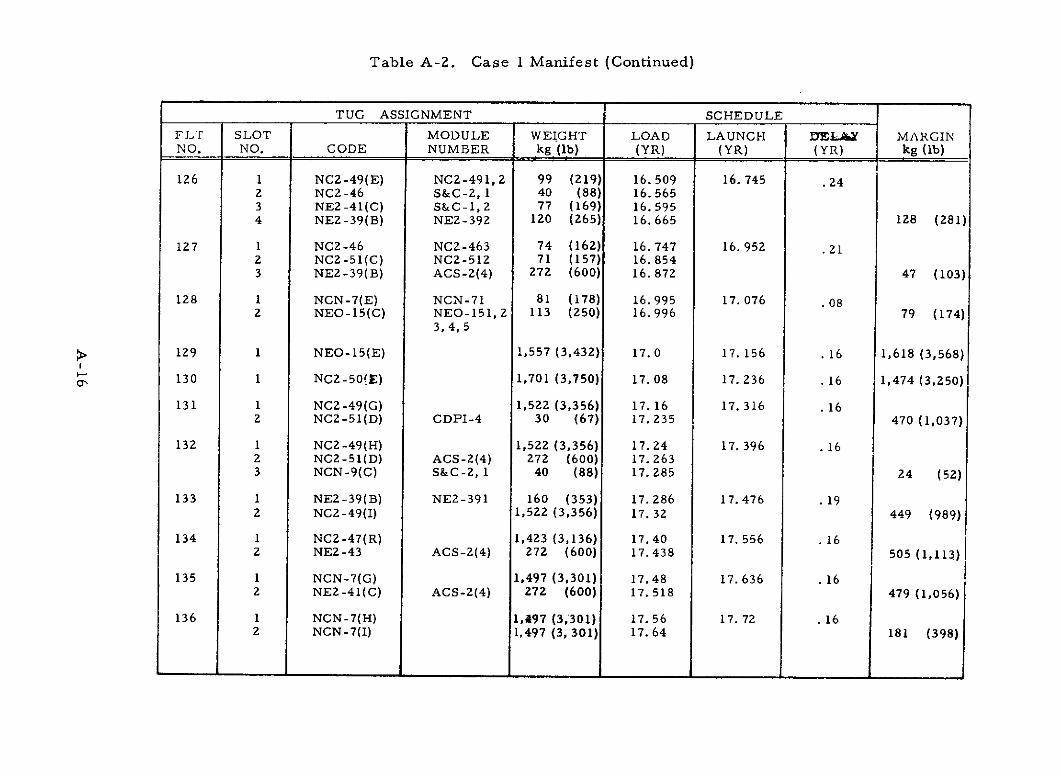
Table A-2. Case 1 Manifest (Continued)
TUG ASSIGNMENT SCHEDULE
FLT SLOT MODULE WEIGHT LOAD LAUNCH DEL Y MARGINNO. NO. CODE NUMBER kg (Ib) (YR) (YR) (YR) kg (Ib)
126 1 NC2-49(E) NC2-491, 2 99 (219) 16. 509 16. 745 .242 NC2-46 S&C-2, 1 40 (88) 16. 5653 NE2-41(C) S&C-1,2 77 (169) 16.5954 NE2-39(B) NE2-392 120 (265) 16. 665 128 (281)
127 1 NC2-46 NC2-463 74 (162) 16. 747 16. 952 .212 NC2-51(C) NCZ-512 71 (157) 16. 8543 NEZ-39(B) ACS-2(4) 272 (600) 16. 872 47 (103)
128 1 NCN-7(E) NCN-71 81 (178) 16. 995 17. 076 .082 NEO-15(C) NEO-151,2 113 (250) 16. 996 79 (174)
3, 4, 5
129 1 NEO-15(E) 1,557 (3,432) 17. 0 17. 156 .16 1,618 (3,568)
130 1 NC2-50(E) 1,701 (3,750) 17. 08 17. 236 .16 1,474 (3,250)
131 1 NC2-49(G) 1,522 (3,356) 17. 16 17. 316 .162 NC2-51(D) CDPI-4 30 (67) 17.235 470 (1,037)
132 1 NC2-49(H) 1,522 (3,356) 17. 24 17. 396 .162 NC2-51(D) ACS-2(4) 272 (600) 17. 2633 NCN-9(C) S&C-2, 1 40 (88) 17. 285 24 (52)
133 1 NE2-39(B) NE2-391 160 (353) 17. 286 17.476 .192 NC2-49(I) 1,522 (3,356) 17. 32 449 (989)
134 1 NC2-47(R) 1,423 (3,136) 17.40 17. 556 .162 NEZ-43 ACS-2(4) 272 (600) 17.438 505 (1,113)
135 1 NCN-7(G) 1,497 (3,301) 17.48 17. 636 .162 NE2-41(C) ACS-2(4) 272 (600) 17. 518 479 (1,056)
136 1 NCN-7(H) 1,497 (3,301) 17. 56 17. 72 .162 NCN-7(I) 1,497 (3, 301) 17. 64 181 (398)
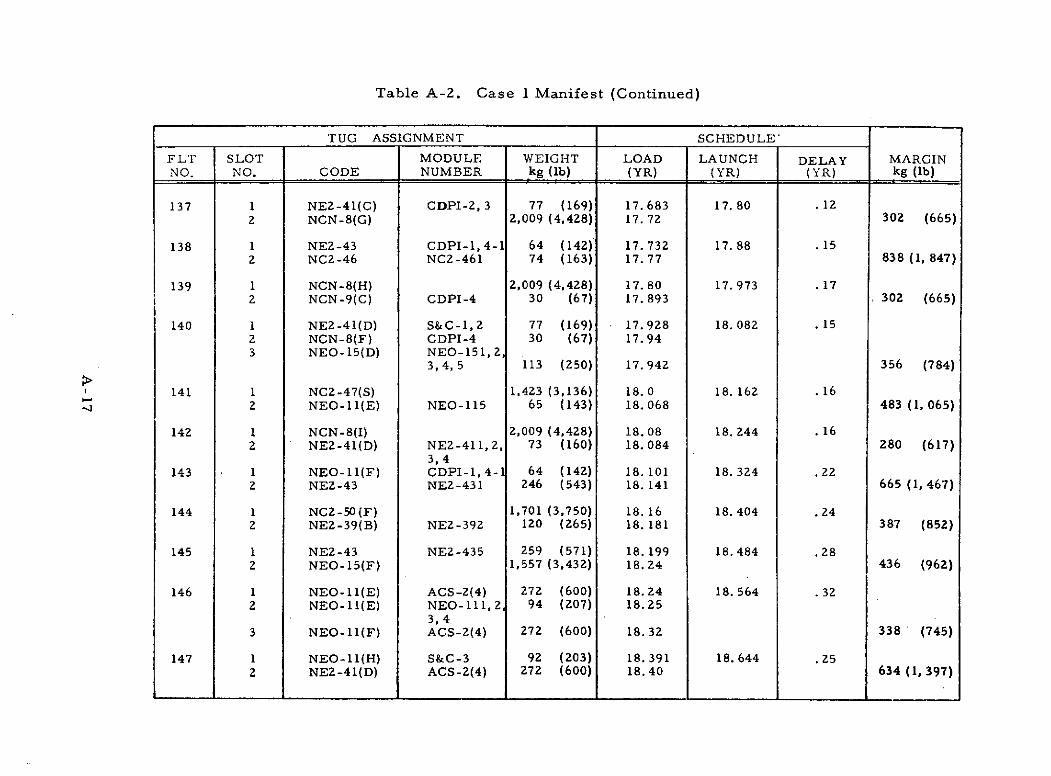
Table A-2. Case 1 Manifest (Continued)
TUG ASSIGNMENT SCHEDULE'
FLT SLOT MODULE WEIGHT LOAD LAUNCH DELAY MARGINNO. NO. CODE NUMBER kg (Ib) (YR) (YR) (YR) kg (Ib)
137 1 NEZ-41(C) CDPI-2, 3 77 (169) 17. 683 17.80 .122 NCN-8(G) 2,009 (4,428) 17. 72 302 (665)
138 1 NE2-43 CDPI-1, 4-1 64 (142) 17. 732 17. 88 .152 NC2-46 NC2-461 74 (163) 17.77 838 (1, 847)
139 1 NCN-8(H) 2,009 (4,428) 17. 80 17. 973 .172 NCN-9(C) CDPI-4 30 (67) 17. 893 302 (665)
140 1 NEZ-41(D) S&C-1, 2 77 (169) 17.928 18. 082 .152 NCN-8(F) CDPI-4 30 (67) 17.943 NEO-15(D) NEO-151, 2,
3, 4, 5 113 (250) 17. 942 356 (784)
141 1 NC2-47(S) 1,423 (3,136) 18. 0 18. 162 .162 NEO-11(E) NEO-115 65 (143) 18. 068 483 (1,065)
142 1 NCN-8(I) 2,009 (4,428) 18. 08 18. 244 . 162 NE2-41(D) NE2-411, 2, 73 (160) 18. 084 280 (617)
3,4143 1 NEO-11(F) CDPI-1, 4- 64 (142) 18. 101 18. 324 .22
2 NE2-43 NE2-431 246 (543) 18. 141 665 (1, 467)
144 1 NC2-50 (F) 1,701 (3,750) 18.16 18. 404 .242 NE2-39(B) NE2-392 120 (265) 18. 181 387 (852)
145 1 NE2-43 NE2-435 259 (571) 18. 199 18. 484 .282 NEO-15(F) 1,557 (3,432) 18.24 436 (962)
146 1 NEO-11(E) ACS-2(4) 272 (600) 18.24 18. 564 .322 NEO-11(E) NEO-111, 2 94 (207) 18.25
3, 43 NEO-11(F) ACS-2(4) 272 (600) 18. 32 338 (745)
147 1 NEO-11(H) S&C-3 92 (203) 18. 391 18. 644 .252 NE2-41(D) ACS-2(4) 272 (600) 18.40 634 (1, 397)
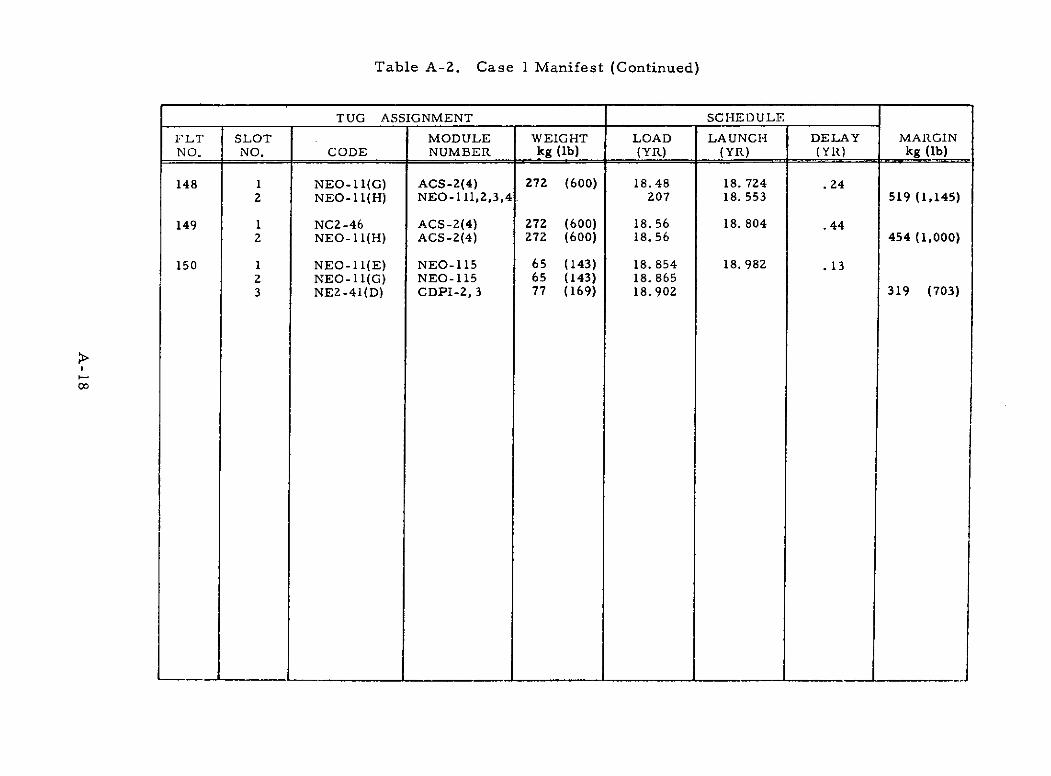
Table A-2. Case 1 Manifest (Continued)
TUG ASSIGNMENT SCHEDULE
FLT SLOT MODULE WEIGHT LOAD LAUNCH DELAY MARGINNO. NO. CODE NUMBER kg (lb) (YR) (YR) (YR) kg (Ib)
148 1 NEO-11(G) ACS-2(4) 272 (600) 18.48 18. 724 .242 NEO-11(H) NEO-111,2,3,4. 207 18. 553 519 (1,145)
149 1 NC2-46 ACS-2(4) 272 (600) 18.56 18. 804 .442 NEO-11(H) ACS-2(4) 272 (600) 18.56 454 (1,000)
150 1 NEO-11(E) NEO-115 65 (143) 18. 854 18. 982 .132 NEO-11(G) NEO-115 65 (143) 18. 8653 NE2-41(D) CDPI-2, 3 77 (169) 18. 902 319 (703)
0I.
APPENDIX B
CASE 2 GROUND RULES AND MANIFEST
21
APPENDIX B
This appendix provides the detailed launch schedules for deployment
and servicing of synchronous equatorial payloads composed of modular designs
developed by Aerospace. The type of modules and their reliability character-
istics are included in Table B-I. The launch schedule and payload manifest
are shown in Table B-2.
The significant differences between this case (Case 2) and Appendix A:
(Case I) are listed below.
(a) Tug phasing performance in orbit accurately represented.
(b) Subsystem modules are Aerospace design rather than LMSC
standard modules. This results in heavier payloads with slightly less
reliability.
(c) The payload program NCN-9, Foreign DOMSAT, was expanded
from one system of two satellites to six systems of two satellites each
for compatibility with the ground refurbishment reference case.
(d) Electrical power modules were truncated at five years to
represent reasonable battery life. Attitude control modules reduced
from four (LMSC) to two per satellite.
Table B-I provides a list of all subsystem used to compose the
thirteen satellite programs. No attempt was made to develop common
or standard modules. The mission equipment module definitions are
identical to Case I as defined in Section 3.
B-I
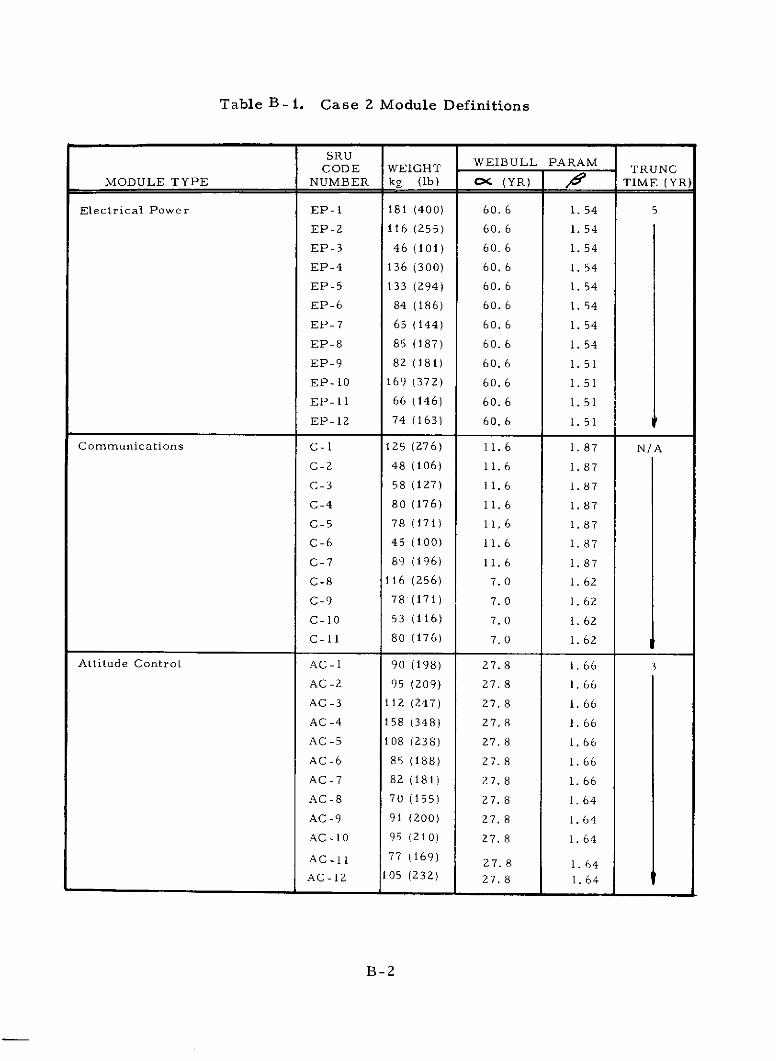
Table B-i. Case 2 Module Definitions
SRU WEIBULL PARAMCODE WEIGHT TRUNC
MODULE TYPE NUMBER kg (lb) CX (YR) / TIME (YR)
Electrical Power EP-1 181 (400) 60. 6 1.54 5
EP-2 116 (255) 60.6 1.54
EP-3 46 (101) 60.6 1.54
EP-4 136 (300) 60.6 1. 54
EP-5 133 (294) 60. 6 1. 54
EP-6 84 (186) 60.6 1.54
EP-7 65 (144) 60. 6 1. 54
EP-8 85 (187) 60.6 1. 54
EP-9 82 (181) 60.6 1.51
EP-10 169 (372) 60.6 1.51
EP-11 66 (146) 60.6 1.51
EP-12 74 (163) 60.6 1.51
Communications C-I 125 (276) 11.6 1.87 N/A
C-2 48 (106) 11.6 1.87
C-3 58 (127) 11.6 1.87
C-4 80 (176) 11.6 1.87
C-5 78 (171) 11.6 1.87
C-6 45 (100) 11.6 1.87
C-7 89 (196) 11.6 1.87
C-8 116 (256) 7.0 1.62
C-9 78 (171) 7.0 1.62
C-10 53 (116) 7.0 1.62
C-11 80 (176) 7.0 1.62
Attitude Control AC-1 90 (198) 27. 8 1.66 3
AC-2 95 (209) 27.8 1.66
AC-3 112 (247) 27.8 1.66
AC-4 158 (348) 27.8 1. 66
AC-5 108 (238) 27.8 1.66
AC-6 85 (188) 27.8 1.66
AC-7 82 (181) 27.8 1. 66
AC-8 70 (155) 27.8 1.64
AC-9 91 (200) 27. 8 1.64
AC-10 95 (210) 27. 8 1. 64
AC-11 77 (169) 27.8 1.64
AC-12 105 (232) 27. 8 1.64
B-2
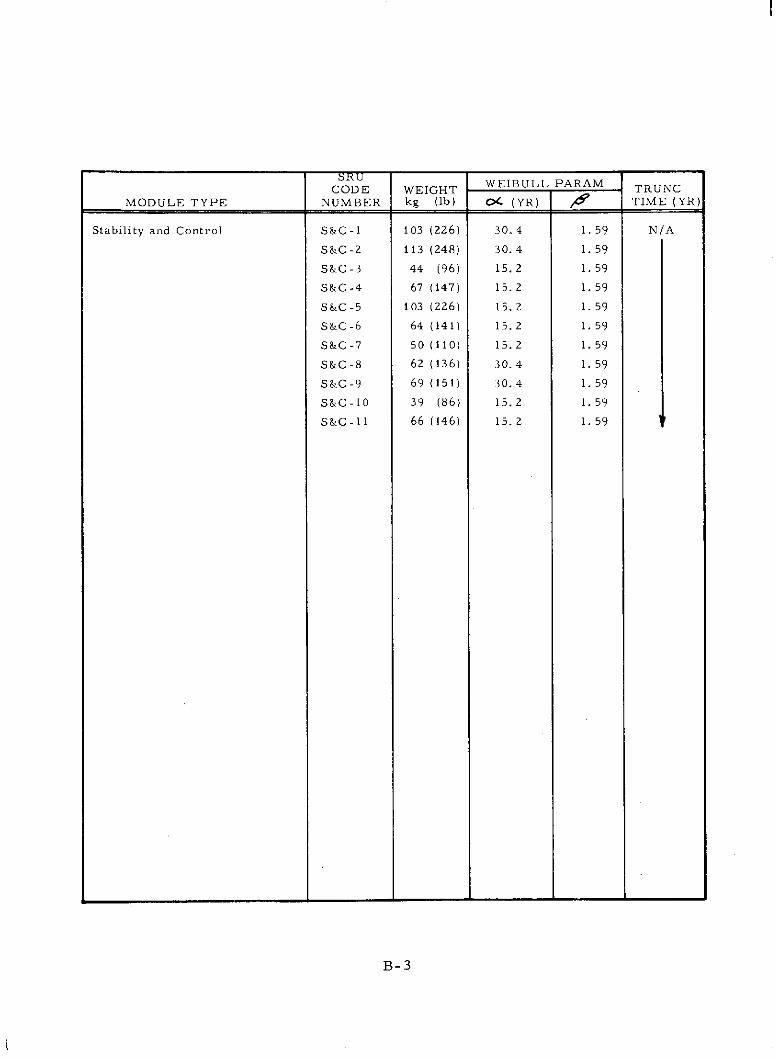
SRUCODE WEIGHT WEIBULL PARAM TRUNC
MODULE TYPE NUMBER kg (Ib) 04 (YR) 49 TIME (YR)
Stability and Control S&C-1 103 (226) 30.4 1. 59 N/A
S&C-2 113 (248) 30.4 1.59
S&C-3 44 (96) 15.2 1.59
S&C-4 67 (147) 15.2 1.59
S&C-5 103 (226) 15.2 1.59
S&C-6 64 (141) 15.2 1.59
S&C-7 50 (110) 15.2 1.59
S&C-8 62 (136) 30.4 1.59
S&C-9 69 (151) 30.4 1. 59
S&C-10 39 (86) 15.2 1.59
S&C-11 66 (146) 15.2 1.59
B-3
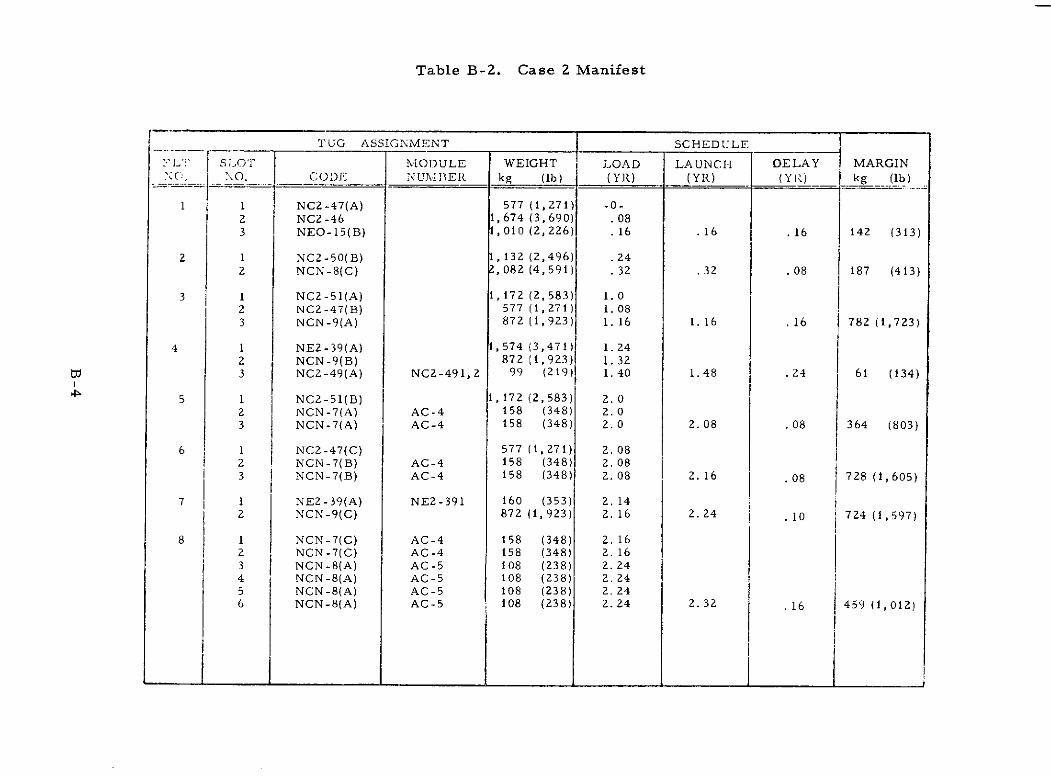
Table B-2. Case 2 Manifest
TUG ASSIGNMENT SCHEDULE
L i SLO'T MODULE WEIGHT LOAD LAUNCH DELAY MARGINN,. NO. COlDE; NUMBIER kg (Ib) (YR) (YR) (YR) kg (Ib)
1 1 NC2-47(A) 577 (1,271) -0-2 NC2-46 1,674 (3,690) .083 NEO-15(B) 1,010 (2,226) .16 .16 .16 142 (313)
2 1 NC2-50(B) 1,132 (2,496) .242 NCN-8(C) 2, 082 (4,591) .32 .32 .08 187 (413)
3 1 NC2-51(A) 1,172 (2,583) 1.02 NC2-47(B) 577 (1,271) 1.083 NCN-9(A) 872 (1,923) 1. 16 1. 16 .16 782 (1,723)
4 1 NE2-39(A) 1,574 (3,471) 1.242 NCN-9(B) 872 (1,923) 1. 323 NC2-49(A) NC2-491, 2 99 (219) 1.40 1.48 .24 61 (134)
5 1 NC2-51(B) 1,172 (2,583) 2. 02 NCN-7(A) AC-4 158 (348) 2. 03 NCN-7(A) AC-4 158 (348) 2.0 2.08 .08 364 (803)
6 1 NC2-47(C) 577 (1,271) 2. 082 NCN-7(B) AC-4 158 (348) 2. 083 I NCN-7(B) AC-4 158 (348) 2. 08 2. 16 .08 728 (1,605)
7 1 NE2-39(A) NE2-391 160 (353) 2. 142 NCN-9(C) 872 (1,923) 2. 16 2. 24 .10 724 (1,597)
8 1 NCN-7(C) AC-4 158 (348) 2. 162 NCN-7(C) AC-4 158 (348) 2. 163 NCN-8(A) AC-5 108 (238) 2. 244 NCN-8(A) AC-5 108 (238) 2. 245 NCN-8(A) AC-5 108 (238) 2. 246 NCN-8(A) AC-5 108 (238) 2.24 2.32 .16 459 (1, 012)i i __ __I _ _ _t_ _
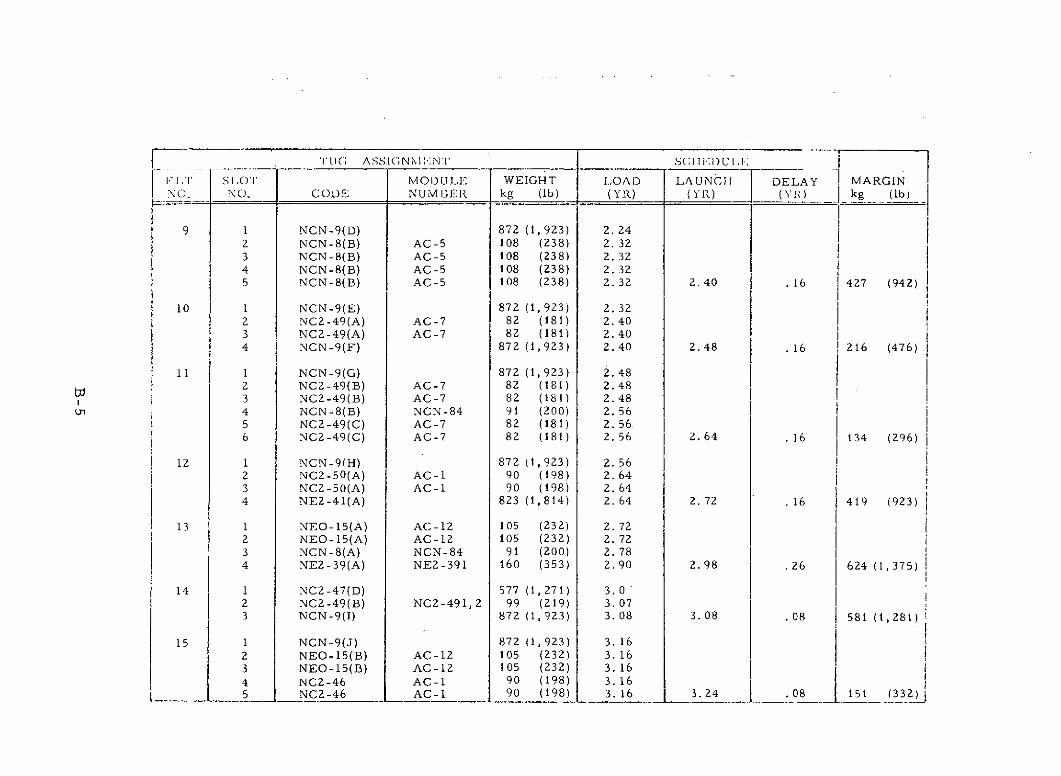
TUG ASS.I( NNI INT SCI I.I )U II:
LT SLOT MOI)ULE WEIGHT LOAD LAUNCI[ DELAY MARGINO. NO, CODE NUMBER kg (lb) (YR) (YR) (YB) kg (lb)
9 1 NCN-9(D) 872 (1,923) 2. 242 NCN-8(B) AC-5 108 (238) 2. 323 NCN-8(B) AC-5 108 (238) 2. 324 NCN-8(B) AC-5 108 (238) 2. 325 NCN-8(B) AC-5 108 (238) 2. 32 2.40 . 16 427 (942)
10 1 NCN-9(E) 872 (1,923) 2.322 NC2-49(A) AC-7 82 (181) 2.403 NC2-49(A) AC-7 82 (181) 2.404 NCN-9(F) 872 (1,923) 2.40 2.48 .16 216 (476)
11 1 NCN-9(G) 872 (1,923) 2.482 NC2-49(B) AC-7 82 (181) 2.483 NC2-49(B) AC-7 82 (181) 2.484 NCN-8(B) NCN-84 91 (200) 2. 565 NC2-49(C) AC-7 82 (181) 2. 566 NC2-49(C) AC-7 82 (181) 2. 56 2.64 .16 134 (296)
12 1 NCN-91H) 872 (1,923) 2. 562 NC2-50(A) AC-1 90 (198) 2. 643 NC2-50(A) AC-1 90 (198) 2. 644 NE2-41(A) 823 (1,814) 2. 64 2. 72 .16 419 (923)
13 1 NEO-15(A) AC-12 105 (232) 2. 722 NEO-15(A) AC-12 105 (232) 2. 723 NCN-8(A) NCN-84 91 (200) 2. 784 NE2-39(A) NE2-391 160 (353) 2.90 2.98 .26 624 (1,375)
14 1 NC2-47(D) 577 (1,271) 3.02 NC2-49(B) NC2-491,2 99 (219) 3. 073 NCN-9(I) 872 (1,923) 3. 08 3. 08 .08 I 581 (1,281)
15 1 NCN-9(J) 872 (1,923) 3. 162 NEO-15(B) AC-12 105 (232) 3. 163 NEO-15(B) AC-12 105 (232) 3. 164 NCZ-46 AC-1 90 (198) 3. 165 NC2-46 AC-1 90 (198) 3. 16 3. 24 .08 151 (332)
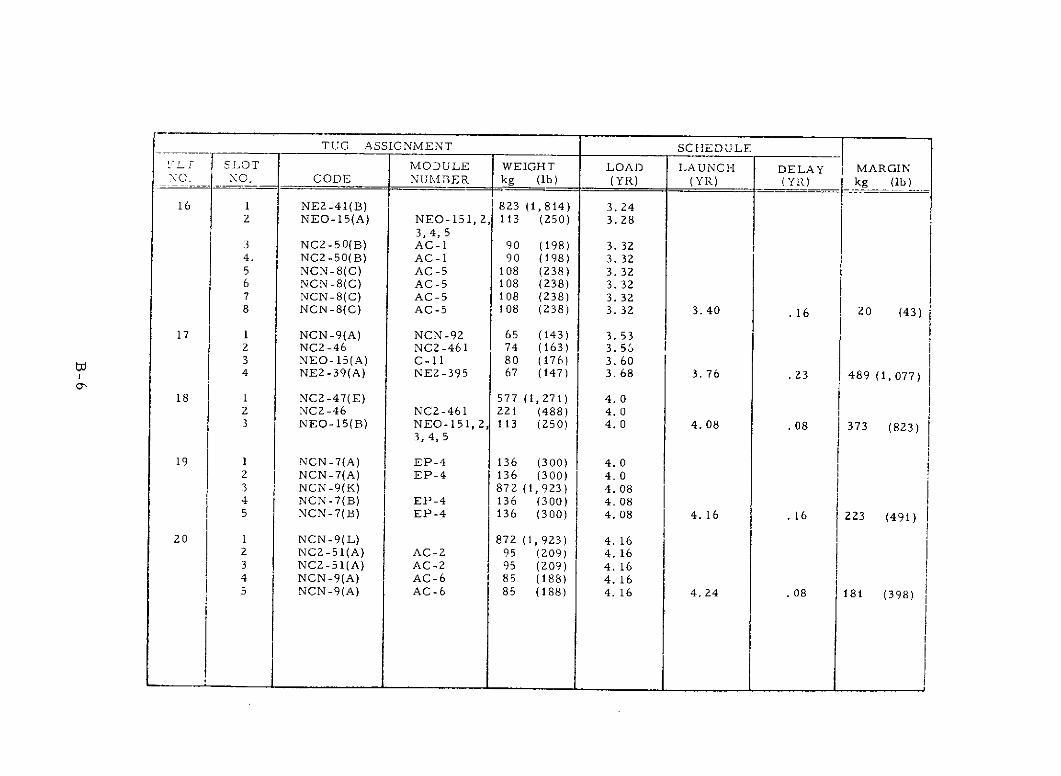
TUG ASSIGNMENT SCHEDULE
YLY SLOT MODULE WEIGHT LOAD LAUNCH DELAY MARGINXC NO, CODE NUMBER kg (lb) (YR) (YR) (YR) kg (Ib)
16 1 NE2-41(B) 823 (1,814) 3.242 NEO-15(A) NEO-151, 2, 113 (250) 3. 28
3, 4, 53 NC2-50(B) AC-1 90 (198) 3. 324. NC2-50(B) AC-1 90 (198) 3. 325 NCN-8(C) AC-5 108 (238) 3. 326 NCN-8(C) AC-5 108 (238) 3. 327 NCN-8(C) AC-5 108 (238) 3. 328 NCN-8(C) AC-5 108 (238) 3. 32 3.40 .16 20 (43)
17 1 NCN-9(A) NCN-92 65 (143) 3. 532 NC2-46 NC2-461 74 (163) 3. 553 NEO-15(A) C-11 80 (176) 3. 604 NE2-39(A) NE2-395 67 (147) 3. 68 3. 76 .23 489 (1,077)
18 1 NC2-47(E) 577 (1,271) 4.02 NC2-46 NC2-461 221 (488) 4.03 NEO-15(B) NEO-151, 2, 113 (250) 4.0 4.08 .08 373 (823)
3,4,5
19 1 NCN-7(A) EP-4 136 (300) 4.02 NCN-7(A) EP-4 136 (300) 4. 03 NCN-9(K) 872 (1,923) 4.084 NCN-7(B) EP-4 136 (300) 4. 085 NCN-7(B) EP-4 136 (300) 4. 08 4. 16 .16 223 (491)
20 1 NCN-9(L) 872 (1,923) 4. 162 NC2-51(A) AC-2 95 (209) 4. 163 NC2-51(A) AC-2 95 (209) 4. 164 NCN-9(A) AC-6 85 (188) 4. 165 NCN-9(A) AC-6 85 (188) 4. 16 4.24 .08 181 (398)
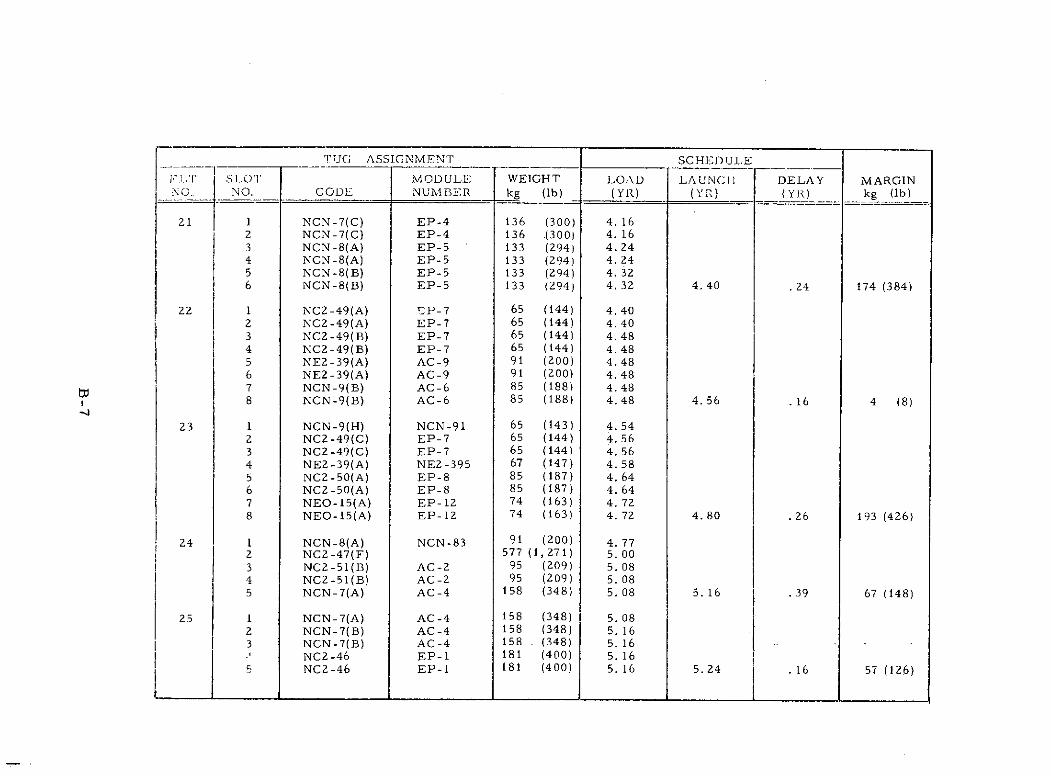
TUG ASSIGNMENT SCHEDULE
SloTT SO MODULE WEIGHT LOAD LAUNCII DELAY MARGINNO. NO. CODE NUMBER kg (Ib) (YR) (YR) (YR) kg (Ib)
21 1 NCN-7(C) EP-4 136 (300) 4. 162 NCN-7(C) EP-4 136 .(300) 4. 163 NCN-8(A) EP-5 133 (294) 4.244 NCN-8(A) EP-5 133 (294) 4. 245 NCN-8(B) EP-5 133 (294) 4. 326 NCN-8(B) EP-5 133 (294) 4. 32 4.40 .24 174 (384)
22 1 NC2-49(A) EP-7 65 (144) 4. 402 NC2-49(A) EP-7 65 (144) 4.403 NC2-49(B) EP-7 65 (144) 4.484 NC2-49(B) EP-7 65 (144) 4.485 NE2-39(A) AC-9 91 (200) 4.486 NE2-39(A) AC-9 91 (200) 4.487 NCN-9(B) AC-6 85 (188) 4.488 NCN-9(B) AC-6 85 (188) 4.48 4. 56 .16 4 (8)
23 1 NCN-9(H) NCN-91 65 (143) 4. 542 NC2-49(C) EP-7 65 (144) 4. 563 NC2-49(C) EP-7 65 (144) 4. 564 NE2-39(A) NE2-395 67 (147) 4. 585 NC2-50(A) EP-8 85 (187) 4. 646 NC2-50(A) EP-8 85 (187) 4. 647 NEO-15(A) EP-12 74 (163) 4. 728 NEO-15(A) EP-12 74 (163) 4. 72 4.80 .26 193 (426)
24 1 NCN-8(A) NCN-83 91 (200) 4. 772 NC2-47(F) 577 (1,271) 5.003 NC2-51(B) AC-2 95 (209) 5. 084 NC2-51(B) AC-2 95 (209) 5. 085 NCN-7(A) AC-4 158 (348) 5. 08 5. 16 .39 67 (148)
25 1 NCN-7(A) AC-4 158 (348) 5. 082 NCN-7(B) AC-4 158 (348) 5. 163 NCN-7(B) AC-4 158 (348) 5. 16
NC2-46 EP-1 181 (400) 5. 165 NC2-46 EP-1 181 (400) 5. 16 5.24 .16 57 (126)
L
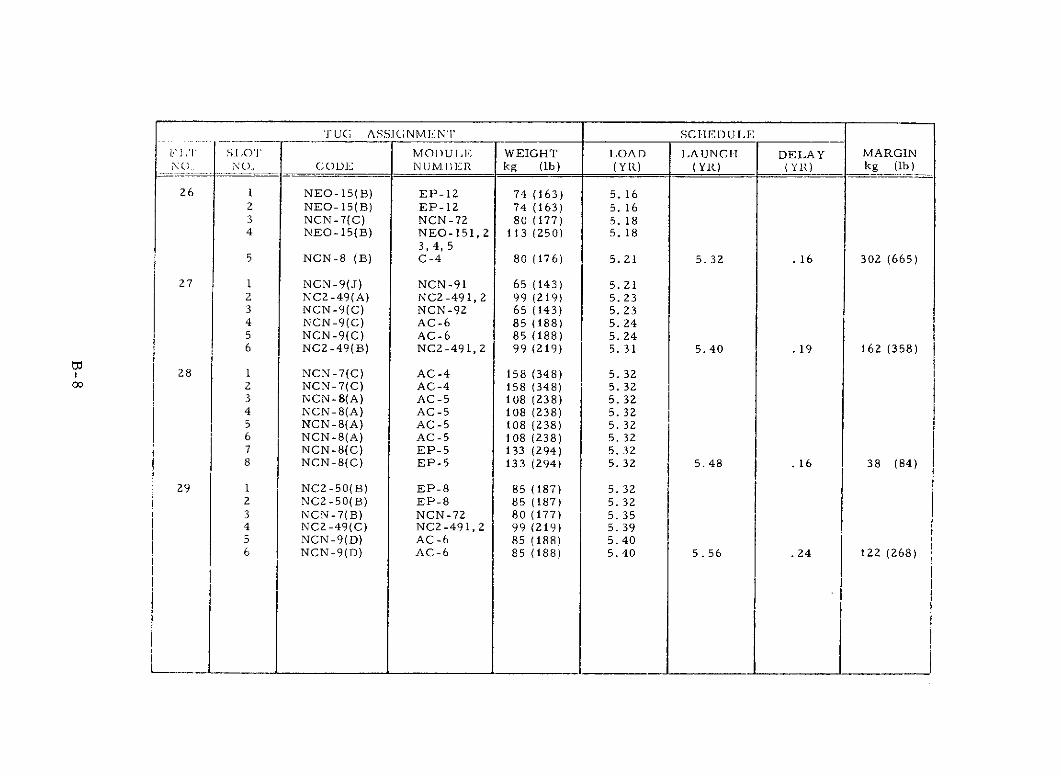
TUG ASS.IGNMENT SCHi ElD) U1'T SlO'1' MODULE WEIGHT IOAD IAUNCH DELAY MARGINN.. NO. CODE NUMBER kg (lb) (YR) (YR) (YR) kg (lb)
26 1 NEO-15(B) EP-12 74 (163) 5. 162 NEO-15(B) EP-12 74 (163) 5. 163 NCN-7(C) NCN-72 80 (177) 5. 184 NEO-15(B) NEO-151, 2 113 (250) 5. 18
3, 4, 55 NCN-8 (B) C-4 80 (176) 5.21 5.32 .16 302 (665)
27 1 NCN-9(J) NCN-91 65 (143) 5.212 NC2-49(A) NC2 -491, 2 99 (219) 5. 233 NCN-9(C) NCN-92 65 (143) 5. 234 NCN-9(C) AC-6 85 (188) 5. 245 NCN-9(C) AC-6 85 (188) 5.246 NC2-49(B) NC2 -491, 2 99 (219) 5.31 5.40 .19 162 (358)
28 1 NCN-7(C) AC-4 158 (348) 5. 322 NCN-7(C) AC-4 158 (348) 5. 323 NCN-8(A) AC-5 108 (238) 5. 324 NCN-8(A) AC-5 108 (238) 5. 325 NCN-8(A) AC-5 108 (238) 5. 326 NCN-8(A) AC-5 108 (238) 5. 327 NCN-8(C) EP-5 133 (294) 5. 328 NCN-8(C) EP-5 133 (294) 5. 32 5.48 .16 38 (84)
29 1 NC2-50(B) EP-8 85 (187) 5. 322 NC2-50(B) EP-8 85 (187) 5. 323 NCN-7(B) NCN-72 80 (177) 5. 354 NC2-49(C) NC2-491, 2 99 (219) 5. 395 NCN-9(D) AC-6 85 (188) 5.406 NCN-9(D) AC-6 85 (188) 5.40 5. 56 .24 122 (268)
t __ ___ ___ __ ___ ___ ___ ____ ___ ___ ___ ___ _ _ ___ ___ ___ ___ ___ ___ __ ___ ___ ___ j -_ ___ ___ _ I ___ ___ ___ ___
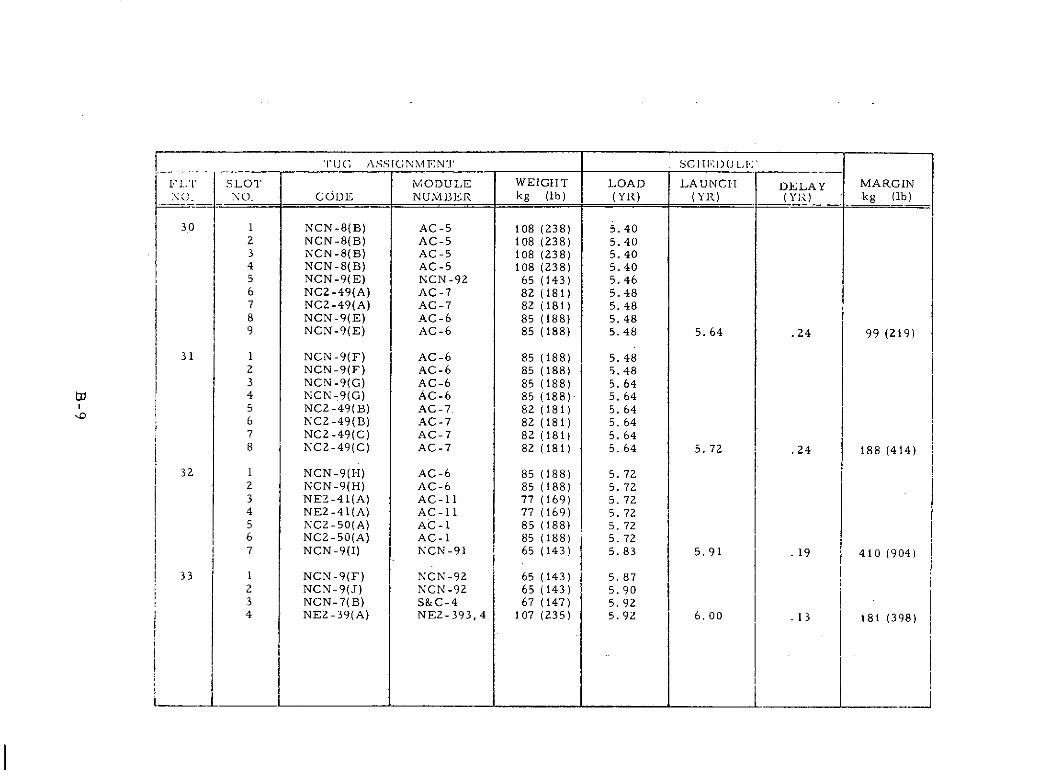
TUG ASSIC;M:NT SCIEULE
11T SL-OT IMODULE WEIGHT LOAD LAUNCHI DELAY MARGINNO NO, CODE NUMBER kg (lb) (Y) Y) (Y) (R) kg (lb)
30 1 NCN-8(B) AC-5 108 (238) 5.402 NCN-8(B) AC-5 108 (238) 5.403 NCN-8(B) AC-5 108 (238) 5. 404 NCN-8(B) AC-5 108 (238) 5. 405 NCN-9(E) NCN-92 65 (143) 5. 466 NC2-49(A) AC-7 82 (181) 5.487 NC2-49(A) AC-7 82 (181) 5.488 NCN-9(E) AC-6 85 (188) 5.489 NCN-9(E) AC-6 85 (188) 5.48 5. 64 .24 99 (219)
31 1 NCN-9(F) AC-6 85 (188) 5.482 NCN-9(F) AC-6 85 (188) 5.483 NCN-9(G) AC-6 85 (188) 5.644 NCN-9(G) AC-6 85 (188)- 5. 645 NC2-49(B) AC-7. 82 (181) 5. 646 NC2-49(B) AC-7 82 (181) 5.647 NC2-49(C) AC-7 82 (181) 5. 648 NC2-49(C) AC-7 82 (181) 5.64 5. 72 .24 188 (414)
32 1 NCN-9(H) AC-6 85 (188) 5. 722 NCN-9(H) AC-6 85 (188) 5. 723 NEZ-41(A) AC-11 77 (169) 5. 724 NE2-41(A) AC-11 77 (169) 5.725 NC2-50(A) AC-1 85 (188) 5. 726 NC2-50(A) AC-1 85 (188) 5. 727 NCN-9(I) NCN-91 i 65 (143) 5. 83 5.91 .19 410 (904)
33 1 NCN-9(F) NCN-92 65 (143) 5. 872 NCN-9(J) NCN-92 65 (143) 5.903 NCN-7(B) S&C-4 67 (147) 5.924 NE2-39(A) NE2-393,4 107 (235) 5.92 6.00 .13 181 (398)
__ __ _ __ _ _ _ __ _ __ _ _ __ _ __ _ __ _ __ _ __ _ _ _ __ __ _ __ _ __ _ _ _ __ _ __ __ _ __ _ __ _ __ _ __ _ __ _ _ __ _ __ _ __ _ __ _ 1 __ __ _ __ _ __ _ _ _ __ _ __ _
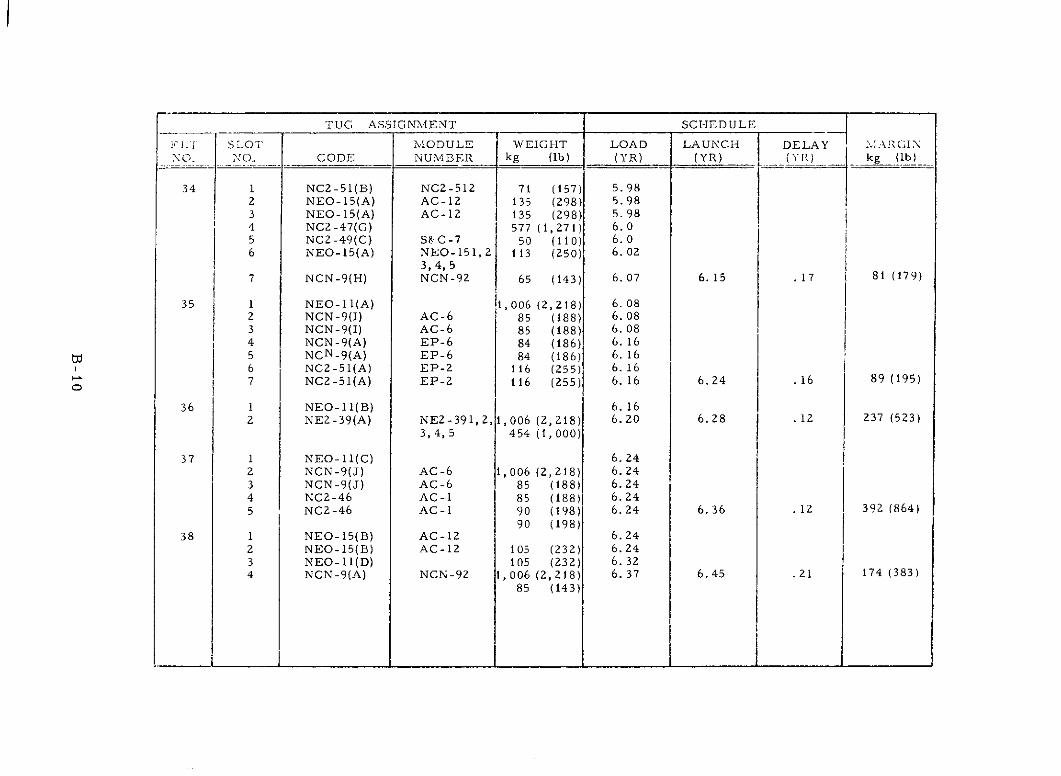
TUG ASSIGNMENT SCHEDULE
FL SLOT NIODULE WEIGHT LOAD LAUNCH DELAY MARGINNO. NO, CODE NUMBER kg (lb) (YR) (YR) (YR) kg (lb)
34 1 NC2-51(B) NC2-512 71 (157) 5.982 NEO-15(A) AC-12 135 (298) 5.983 NEO-15(A) AC-12 135 (298) 5.984 NC2-47(G) 577 (1,271) 6. o05 NC2-49(C) S&:C-7 50 (110) 6. o6 NEO-15(A) NEO-151,2 113 (250) 6.02
3,4, 57 NCN-9(H) NCN-92 65 (143) 6. 07 6. 15 .17 81 (179)
35 1 NEO-11(A) 1, 006 (2,218) 6. 082 NCN-9(I) AC-6 85 (188) 6.083 NCN-9(I) AC-6 85 (188) 6. 084 NCN-9(A) EP-6 84 (186) 6.165 NCN-9(A) EP-6 84 (186) 6. 166 NC2-51(A) EP-2 116 (255) 6.167 NC2-51(A) EP-2 116 (255) 6.16 6.24 .16 89 (195)
36 1 NEO-11(B) 6. 162 NE2-39(A) NE2-391, 2, 1,006 (2, 218) 6. 20 6.28 .12 237 (523)
3,4, 5 454 (1,000)
37 1 NEO-11(C) 6.242 NCN-9(J) AC-6 1,006 (2,218) 6. 243 NCN-9(J) AC-6 85 (188) 6.244 NC2-46 AC-1 85 (188) 6.245 NC2-46 AC-1 90 (198) 6. 24 6. 36 .12 392 (864)
90 (198)38 1 NEO-15(B) AC-12 6.24
2 NEO-15(B) AC-12 105 (232) 6.243 NEO-11(D) 105 (232) 6. 324 NCN-9(A) NCN-92 1,006 (2,218) 6. 37 6.45 .21 174 (383)
85 (143)
_ _ I. _ I _ __ __ _ _ _ _ _
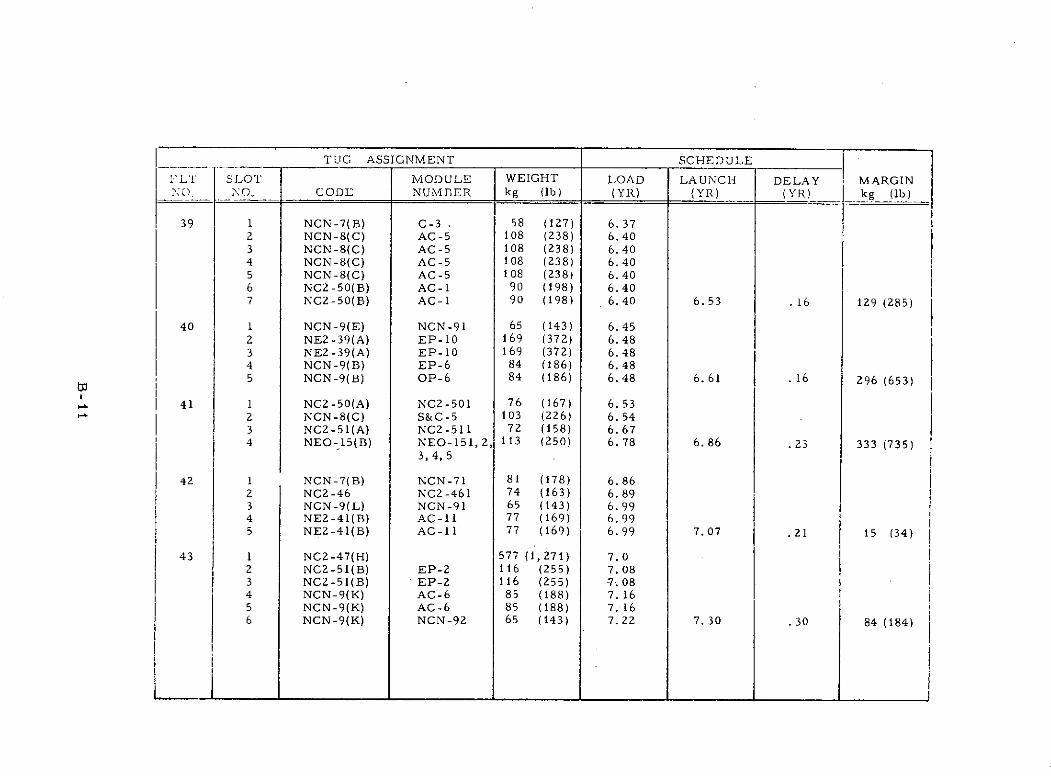
TUG ASSIGNMENT SCHEDULE
' LT' SLOT MODULE WEIGHT LOAD LAUNCH DELAY MARGINNO, NO. CODE NUMBER kg (Ib) (YR) (YR) (YR) kg (Ib)
39 I NCN-7(B) C-3 58 (127) 6. 372 NCN-8(C) AC-5 108 (238) 6.403 NCN-8(C) AC-5 108 (238) 6.404 NCN-8(C) AC-5 108 (238) 6.405 NCN-8(C) AC-5 108 (238) 6.406 NC2-50(B) AC-1 90 (198) 6.407 NC2-50(B) AC-1 90 (198) 6.40 6.53 .16 129 (285)
40 1 NCN-9(E) NCN-91 65 (143) 6.452 NE2-39(A) EP-10 169 (372) 6.483 NE2-39(A) EP-10 169 (372) 6.484 NCN-9(B) EP-6 84 (186) 6.485 NCN-9(B) OP-6 84 (186) 6.48 6.61 .16 296 (653)
41 1 NC2-50(A) NC2-501 76 (167) 6.532 NCN-8(C) S&C-5 103 (226) 6.543 NCZ-51(A) NC2-511 72 (158) 6. 674 NEO-15(B) NEO-151, 2, 113 (250) 6. 78 6.86 .23 333 (735)
3, 4, 5
42 1 NCN-7(B) NCN-71 81 (178) 6.862 NC2-46 NC2-461 74 (163) 6.893 NCN-9(L) NCN-91 65 (143) 6.994 NE2-41(B) AC-11 77 (169) 6.995 NE2-41(B) AC-11 77 (169) 6.99 7.07 .21 15 (34)
43 1 NC2-47(H) 577 (1,271) 7.02 NC2-51(B) EP-2 116 (255) 7.083 NC2-51(B) EP-2 116 (255) -7. 084 NCN-9(K) AC-6 85 (188) 7. 165 NCN-9(K) AC-6 85 (188) 7. 166 NCN-9(K) NCN-92 65 (143) 7. 22 7. 30 .30 84 (184)
__
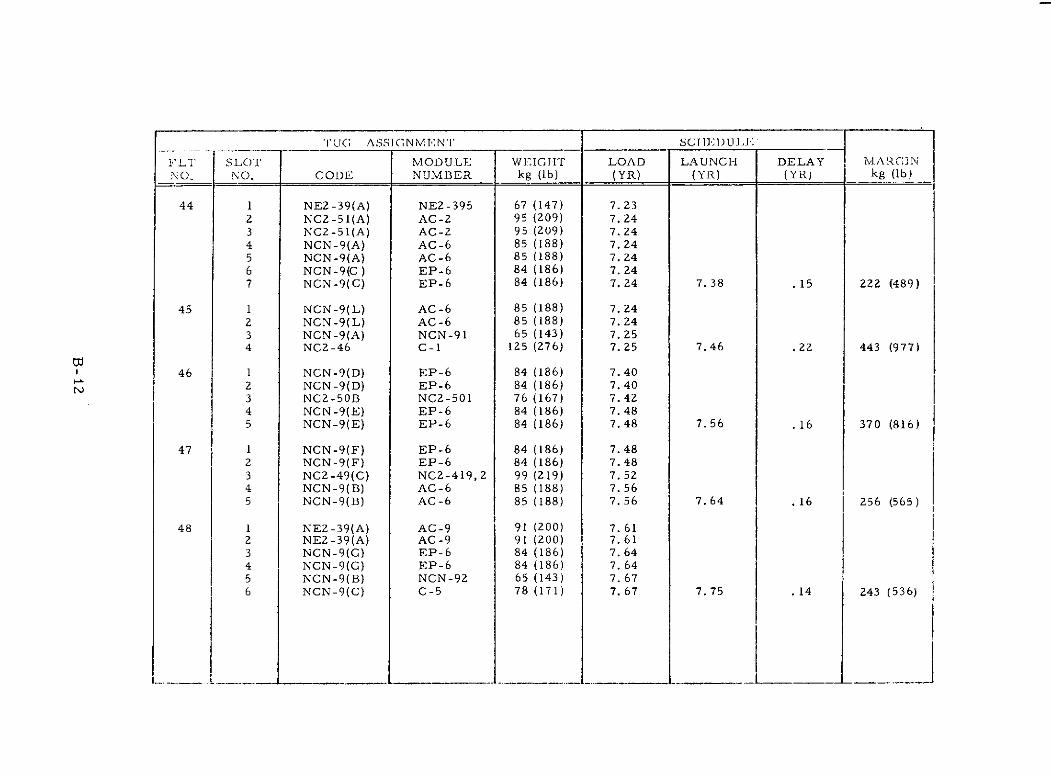
TUG ASS] (NMI:NT SI'1)UL
F'LT 'SLOT MODULE WEIGHT LOAD LAUNCH DELAY MARGINNO. NO. CODE NUMBER kg (lb) (YR) (YR) (YR) kg (lb)
44 1 NE2-39(A) NE2-395 67 (147) 7. 232 NC2-51(A) AC-2 95 (209) 7. 243 NC2-51(A) AC-2 95 (209) 7.244 NCN-9(A) AC-6 85 (188) 7.245 NCN-9(A) AC-6 85 (188) 7.246 NCN-9(C) EP-6 84 (186) 7.247 NCN-9(C) EP-6 84 (186) 7.24 7. 38 .15 222 (489)
45 1 NCN-9(L) AC-6 85 (188) 7.242 NCN-9(L) AC-6 85 (188) 7.243 NCN-9(A) NCN-91 65 (143) 7. 254 NC2-46 C-i 125 (276) 7.25 7.46 .22 443 (977)
46 1 NCN-9(D) EP-6 84 (186) 7.4046 NCN-9(D) EP-6 84 (186) 7.40
3 NC2-50B NC2-501 76 (167) 7.424 NCN-9(E) EP-6 84 (186) 7.485 NCN-9(E) EP-6 84 (186) 7.48 7.56 .16 370 (816)
47 1 NCN-9(F) EP-6 84 (186) 7.482 NCN-9(F) EP-6 84 (186) 7.483 NC2-49(C) NC2-419,2 99 (219) 7. 524 NCN-9(B) AC-6 85 (188) 7. 565 NCN-9(B) AC-6 85 (188) 7. 56 7.64 .16 256 (565)
48 1 NE2-39(A) AC-9 91 (200) 7. 612 NE2-39(A) AC-9 91 (200) 7. 613 NCN-9(G) EP-6 84 (186) 7.644 NCN-9(G) EP-6 84 (186) 7. 645 NCN-9(B) NCN-92 65 (143) 7. 676 NCN-9(C) C-5 78 (171) 7. 67 7. 75 .14 243 (536)
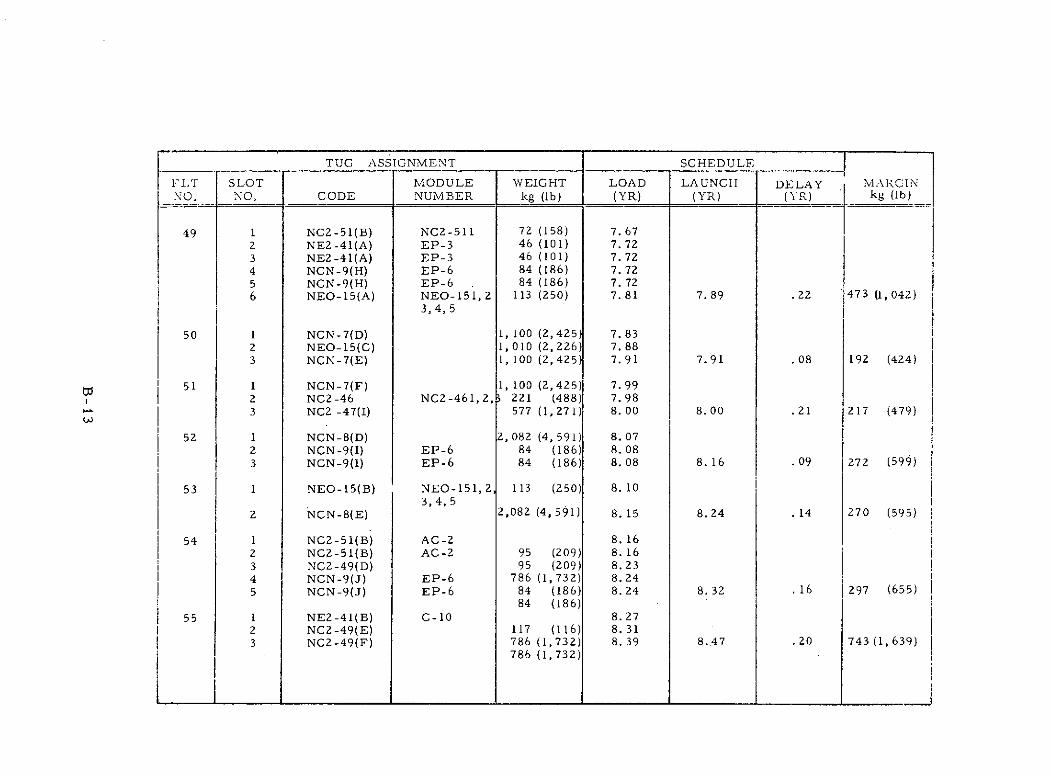
TUG ASSIGNMENT SCHEDULE
FLT SLOT MODULE WEIGHT LOAD LAUNCH DELAY MARGINNO. NO. CODE NUMBER kg (lb) (YR) (YR) (YR) kg (lb)
49 1 NC2-51(B) NC2-511 72 (158) 7. 672 NE2-41(A) EP-3 46 (101) 7.723 NE2-41(A) EP-3 46 (101) 7.724 NCN-9(H) EP-6 84 (186) 7. 725 NCN-9(H) EP-6 84 (186) 7.726 NEO-15(A) NEO-151,2 113 (250) 7.81 7.89 .22 473 (1,042)
3,4,5
50 1 NCN-7(D) 1, 100 (2,425) 7. 832 NEO-15(C) 1,010 (2, 226) 7.883 NCN-7(E) 1, 100 (2, 425) 7.91 7.91 .08 192 (424)
51 1 NCN-7(F) 1, 100 (2, 425)1 7.992 NC2-46 NC2-461,2, 221 (488) 7.983 NC2 -47(I) 577 (1, 271)1 8. 00 8.00 .21 217 (479)
52 1 NCN-8(D) 2,082 (4,591) 8.072 NCN-9(I) EP-6 84 (186) 8. 083 NCN-9(I) EP-6 84 (186) 8.08 8. 16 .09 1272 (599)
53 1 NEO-15(B) NEO-151, 2 113 (250) 8. 103,4,5
2 NCN-8(E) 2,082 (4, 591) 8. 15 8.24 .14 270 (595)
54 1 NC2-51(B) AC-2 8. 162 NC2-51(B) AC-2 95 (209) 8. 163 NC2-49(D) 95 (209) 8. 234 NCN-9(J) EP-6 786 (1,732) 8. 245 NCN-9(J) EP-6 84 (186) 8. 24 8. 32 . 16 297 (655)
84 (186)55 1 NE2-41(B) C-10 8.27
2 NC2-49(E) 117 (116) 8. 313 NC2-49(F) 786 (1,732) 8. 39 8.47 .20 743 (1, 639)
786 (1,732)I _ I. _ _ _ __ _ _ _ _ _ _ _
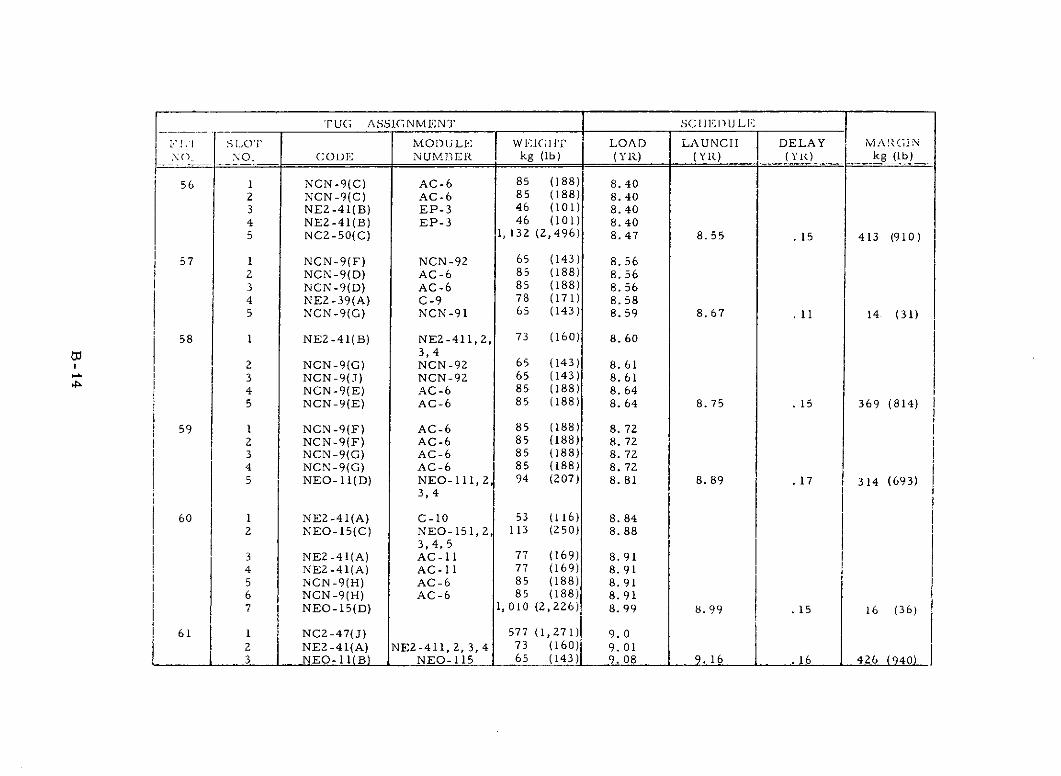
(0176) 9qP 91 !V6 10 6 091) S9 9' '73N 1-0TO *6 .(091) L t, 'c '7 'TZt,- HN Mlf-ZaN z0 6 (1LZ'1) LLS (f)Lt-ZON I 19
(9) 91 s1 66 8 66 8 (cZZ Z) 010 '1 (C)O-oaN L16 8 (881) s8 9Dov (H)6-NDN 916 8 (881) S8 9-DV (H)6-NON s16 8 (691) LL 1 I )v (Y)It-ZaN 116*8 (691) LL 11C1)V (M)IT-73N £
88 *8 (09Z) £1l 'Z 'TS-OaN (D)S1-oaN zH8 8 (911) £9 01-0 (V)Tf-ZaN 1 09
17 '£(169) HE1 LW 688 18'8 (LOZ) V6 -Z'11-O N (a)11I-oaN s
ZL'8 (881) 98 9Dov (0)6-NON tZL *8 (881) 98 9Jov (0)6-NDN EZL *8 (881) 98 9DoV (.J6-NDN 7ZL *8 (881) SR 9-DV (J)6-NON T 6S
(1718) 69£ S1 SL 8 179 *8 (881) S8 99oV (a)6-NDN sf19 8 (881) 98 9-ov (a)6-NDN 1719 8 (£17) S9 76-NON (f)6-NON c -
19 8 (£17) S9 Z6-NDN (9)6-NON 7
09 *8 (091) EL 'z'1T17-7N N (W)11-ZaN 1 8s
(1) v11 L9 '8 69 *8 (£171) S9 16-NON (0)6-NON s8s 8 (1 11) 8L 6-0 (v)6E-7N 179s *8 (881) 98 99oV (u)6-NON £9s 8 (881) 98 9-oV (a)6-NON z9s *8 99 76-NON (1)6-NDN I LS
(016) E11 ST ss 8 Lv '8 (96f7'Z) ZEI'Tj (o)09-79N Gof, 8 (101) 9t7 E-da (q)T t-7ZN t0178 (101) 9f7 £-da (W)it-ZN E07'8 (881) 98 99oV (D)6-NDN z0178 (881) S8 9-oy (0)6-NON 1 9s
(q ) IT ( (uX) (Ivx) (qT) 2hi ?CIO- 0 NAV AV'130 IINf1V' V LIe? 11 [!UOVM 1.0 -i 1*O
1 '1 H(.13L )S INK31NND 1SSV ,l J.
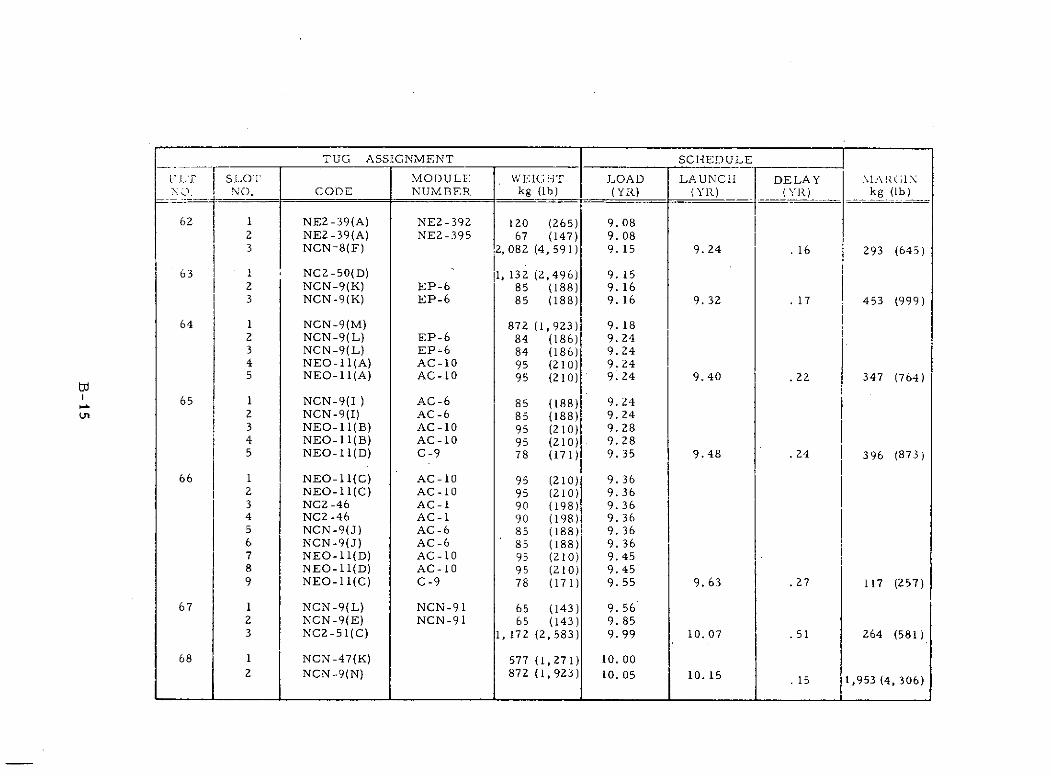
TUG ASSIGNMENT SCHEDULE
I. LT SLOT MODULE WEIGHT LOAD LAUNCH DELAY i .\i!G(;INNO. NO. CODE NUMBER kg (Ib) (YR) (YR) (YR) kg (Ib)
62 1 NE2-39(A) NE2-392 120 (265) 9.082 NE2-39(A) NE2-395 67 (147) 9. 083 NCN-8(F) !2, 082 (4, 591) 9. 15 9.24 . 16 293 (645)
63 1 NC2-50(D) 1, 132 (2,496) 9. 152 NCN-9(K) EP-6 85 (188) 9. 163 NCN-9(K) EP-6 85 (188) 9. 16 9.32 . 17 453 (999)
64 1 NCN-9(M) 872 (1,923) 9. 182 NCN-9(L) EP-6 84 (186) 9. 243 NCN-9(L) EP-6 84 (186) 9. 244 NEO-11(A) AC-10 95 (210) 9.245 NEO-11(A) AC-10 95 (210) 9.24 9.40 .22 347 (764)
65 1 NCN-9(I) AC-6 85 (188) 9.242 NCN-9(I) AC-6 85 (188) 9.243 NEO-11(B) AC-10 95 (210) 9. 284 NEO-11(B) AC-10 95 (210) 9.285 NEO-11(D) C-9 78 (171) 9.35 9.48 .24 396 (873)
66 1 NEO-11(C) AC-10 95 (210) 9. 362 NEO-11(C) AC-10 95 (210) 9. 363 NCZ-46 AC-1 90 (198) 9. 364 NC2-46 AC-1 90 (198) 9. 365 NCN-9(J) AC-6 85 (188) 9. 366 NCN-9(J) AC-6 85 (188) 9. 367 NEO-11(D) AC-10 95 (210) 9.458 NEO-11(D) AC-10 95 (210) 9.459 NEO-11(C) C-9 78 (171) 9.55 9. 63 .27 117 (257)
67 1 NCN-9(L) NCN-91 65 (143) 9. 562 NCN-9(E) NCN-91 65 (143) 9. 853 NC2-51(C) 1, 172 (2, 583) 9.99 10. 07 .51 264 (581)
68 1 NCN-47(K) 577 (1,271) 10.002 NCN-.9(N) 872 (1,923) 10. 05 10. 15 .15 1,953 (4, 306)
#____
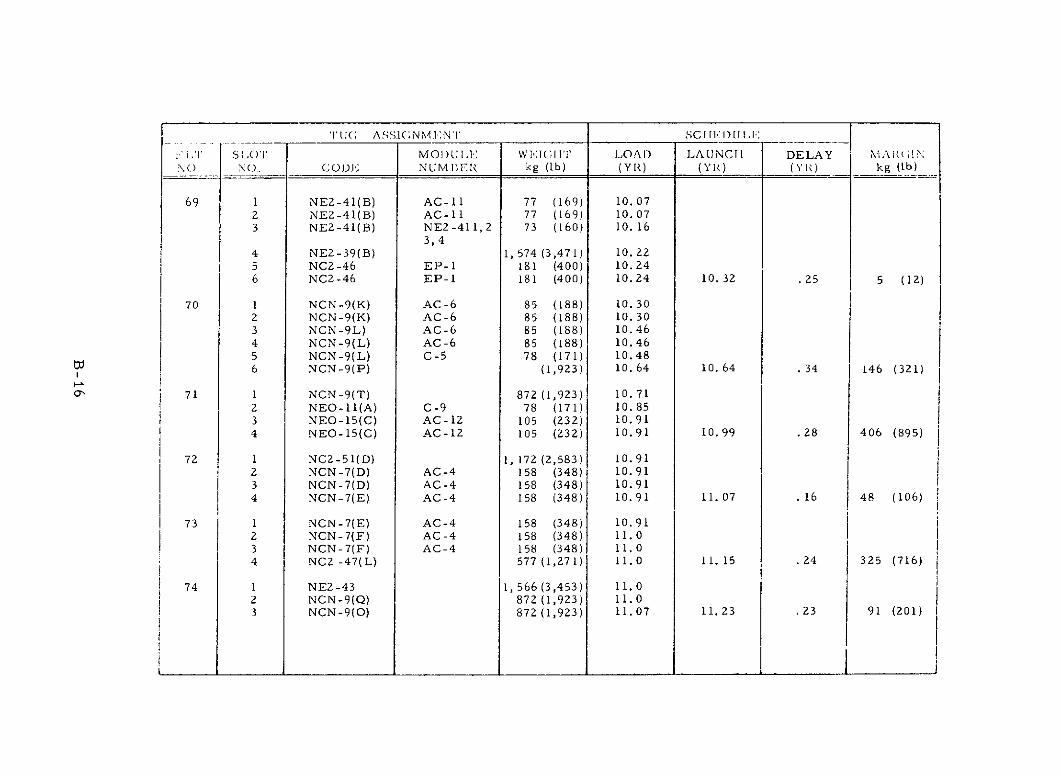
TU(; ASSIGNMi N SC ;I[I:)UI. l:
iT S LO MOI)UI:. WEIiT LOAI LA UNCTI DELAY M \(INN NO. CO1 NUMBIER kg (lb) (YR) (YYR) (Y jO kg (lb)
69 1 NE2-41(B) AC-11 77 (169) 10.072 NE2-41(B) AC-11 77 (169) 10.073 NE2-41(B) NE2-411,2 73 (160) 10. 16
3,44 NE2-39(B) 1,574(3,471) 10.225 NC2-46 EP-1 181 (400) 10.246 NC2-46 EP-1 181 (400) 10.24 10.32 .25 5 (12)
70 1 NCN-9(K) AC-6 85 (188) 10.302 NCN-9(K) AC-6 85 (188) 10.303 NCN-9L) AC-6 85 (188) 10.464 NCN-9(L) AC-6 85 (188) 10.465 NCN-9(L) C-5 78 (171) 10.486 NCN-9(P) (1,923) 10.64 10. 64 .34 146 (321)
71 1 NCN-9(T) 872 (1,923) 10. 712 NEO-11(A) C-9 78 (171) 10.853 NEO-15(C) AC-12 105 (232) 10.914 NEO-15(C) AC-12 105 (232) 10.91 10.99 .28 406 (895)
72 1 NC2-51(D) 1, 172 (2,583) 10.912 NCN-7(D) AC-4 158 (348) 10.913 NCN-7(D) AC-4 158 (348) 10.914 NCN-7(E) AC-4 158 (348) 10.91 11.07 .16 48 (106)
73 1 NCN-7(E) AC-4 158 (348) 10.912 NCN-7(F) AC-4 158 (348) 11.03 NCN-7(F) AC-4 158 (348) 11.04 NC2 -47(L) 577 (1,271) 11.0 11. 15 .24 325 (716)
74 1 NE2-43 1, 566 (3,453) 11.02 NCN-9(Q) 872 (1,923) 11.03 NCN-9(0) 872 (1,923) 11.07 11. 23 .23 91 (201)
_ _ _ _ _ _ _ _ _ _ _ _ _ _ _ _ I __
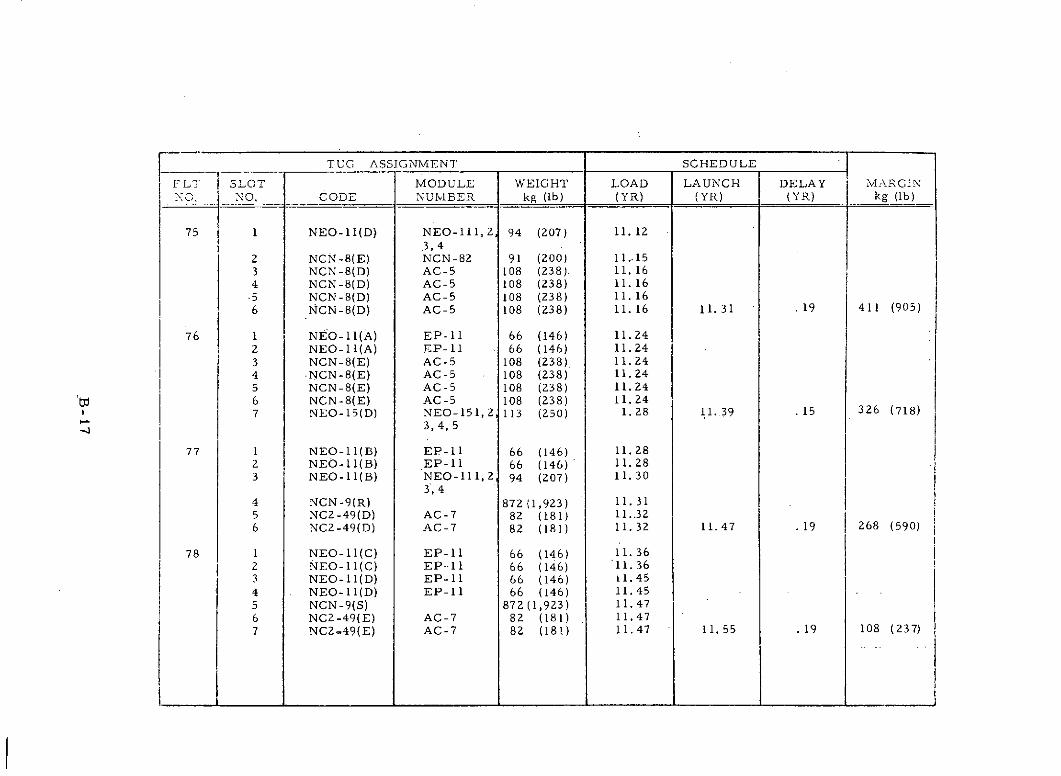
TUG ASSIGNMENT SCHEDULE
FLT SLOT MODULE WEIGHT LOAD LAUNCH DELAY MARGINNO NO. CODE NUMBER kg (lb) (YR) (YR) (YR) kg (Ib)
75 1 NEO-11(D) NEO-111, 2 94 (207) 11.123, 4
2 NCN-8(E) NCN-82 91 (200) 11.-153 NCN-8(D) AC-5 108 (238) 11. 164 NCN-8(D) AC-5 108 (238) 11.16
-5 NCN-8(D) AC-5 108 (238) 11. 166 NCN-8(D) AC-5 108 (238) 11. 16 11.31 .19 411 (905)
76 1 NEO-11(A) EP-11 66 (146) 11.242 NEO-11(A) EP-11 66 (146) 11.243 NCN-8(E) AC-5 108 (238) 11.244 -NCN-8(E) AC-5 - 108 (238) 11.245 NCN-8(E) AC-5 108 (238) 11.246 NCN-8(E) AC-5 108 (238) 11.247 NEO-15(D) NEO-151, 2 113 (250) 1.28 11. 39 .15 326 (718)
3, 4, 5
77 1 NEO-11(B) EP-11 66 (146) 11.282 NEO-11 (B) EP-11 66 (146) ' 11.283 NEO-11(B) NEO-111, 2 94 (207) 11.30
3', 44 NCN-9(R) 872 (1,923) 11.315 NC2-49(D) AC-7 82 (181) 11..326 NC2-49(D) AC-7 82 (181) 11.32 11.47 .19 268 (590)
78 1 NEO-11(C) EP-11 66 (146) 11.362 NEO-11(C) EP-11 66 (146) 11.363 NEO-11(D) EP-11 66 (146) 11.454 NEO-11(D) EP-11 66 (146) 11.455 NCN-9(S) 872 (1,923) 11.476 NCZ-49(E) AC-7 82 (181) 11.477 NC2-49(E) AC-7 82 (181) 11.47 11.55 .19 108 (237)
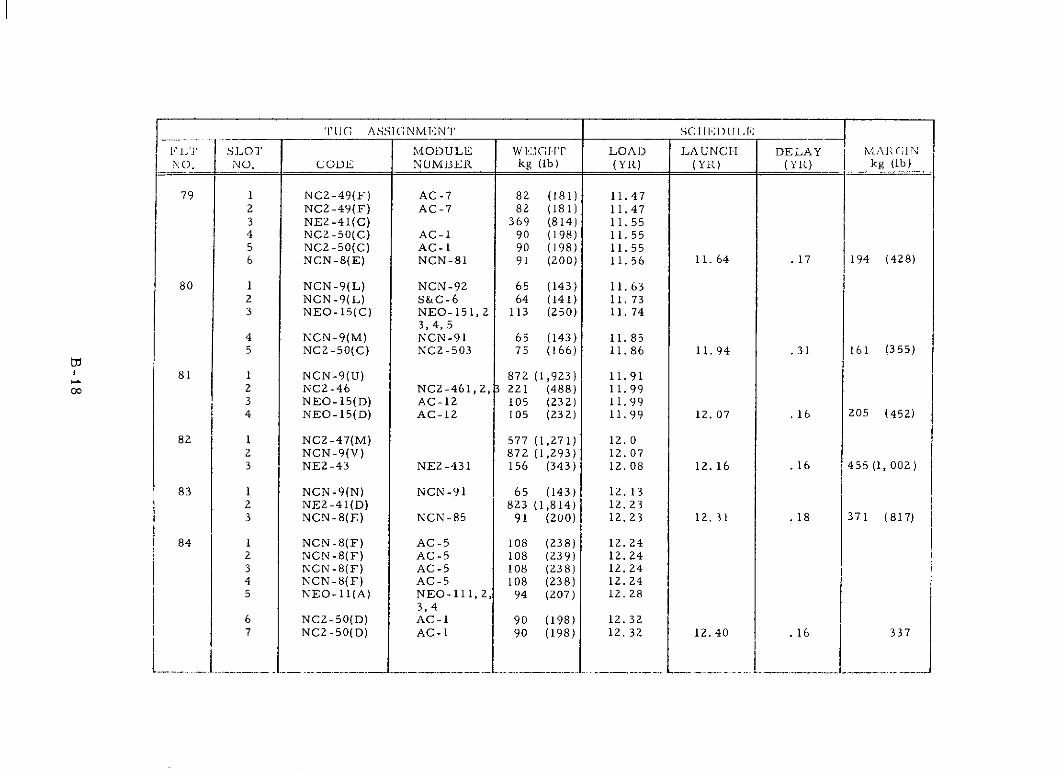
'UG ASSIGNMENT SC! II i)L.I.;
FL'.I SLOT MODULE W l.I -GHf LOAD LAUNCH DELAY MAI C;1NNO. NO. CODE NUMB3ER kg (Ib) (YR) (YR) (YR) kg (lb)
79 1 NC2-49(F) AC-7 82 (181) 11.472 NC2-49(F) AC-7 82 (181) 11.473 NE2-41(C) 369 (814) 11.554 NC2-50(C) AC-1 90 (198) 11.555 NC2-50(C) AC-1 90 (198) 11.556 NCN-8(E) NCN-81 91 (200) 11.56 11. 64 .17 194 (428)
80 1 NCN-9(L) NCN-92 65 (143) 11.632 NCN-9(L) S&C-6 64 (141) 11.733 NEO-15(C) NEO-151, 2 113 (250) 11.74
3, 4, 54 NCN-9(M) NCN-91 65 (143) 11.855 NC2-50(C) NC2-503 75 (166) 11.86 11.94 .31 161 (355)
81 1 NCN-9(U) 872 (1,923) 11.912 NC2-46 NC2-461,2,3 221 (488) 11.993 NEO-15(D) AC-12 105 (232) 11.994 NEO-15(D) AC-12 105 (232) 11.99 12. 07 .16 205 (452)
82 1 NC2-47(M) 577 (1,271) 12. 02 NCN-9(V) 872 (1,293) 12.073 NE2-43 NE2-431 156 (343) 12.08 12. 16 .16 455 (1,002)
83 1 NCN-9(N) NCN-91 65 (143) 12. 132 NE2-41(D) 823 (1,814) 12.233 NCN-8(E) NCN-85 91 (200) 12.23 12.31 .18 371 (817)
84 1 NCN-8(F) AC-5 108 (238) 12.242 NCN-8(F) AC-5 108 (239) 12.243 NCN-8(F) AC-5 108 (238) 12.244 NCN-8(F) AC-5 108 (238) 12.245 NEO-11(A) NEO-111, 2, 94 (207) 12.28
3, 46 NC2-50(D) AC-1 90 (198) 12.327 NC2-50(D) AC-1 90 (198) 12. 32 12.40 . 16 337
. . . .. . . .. . . . . .. . ... .. . . .. .... .. . . .. ..
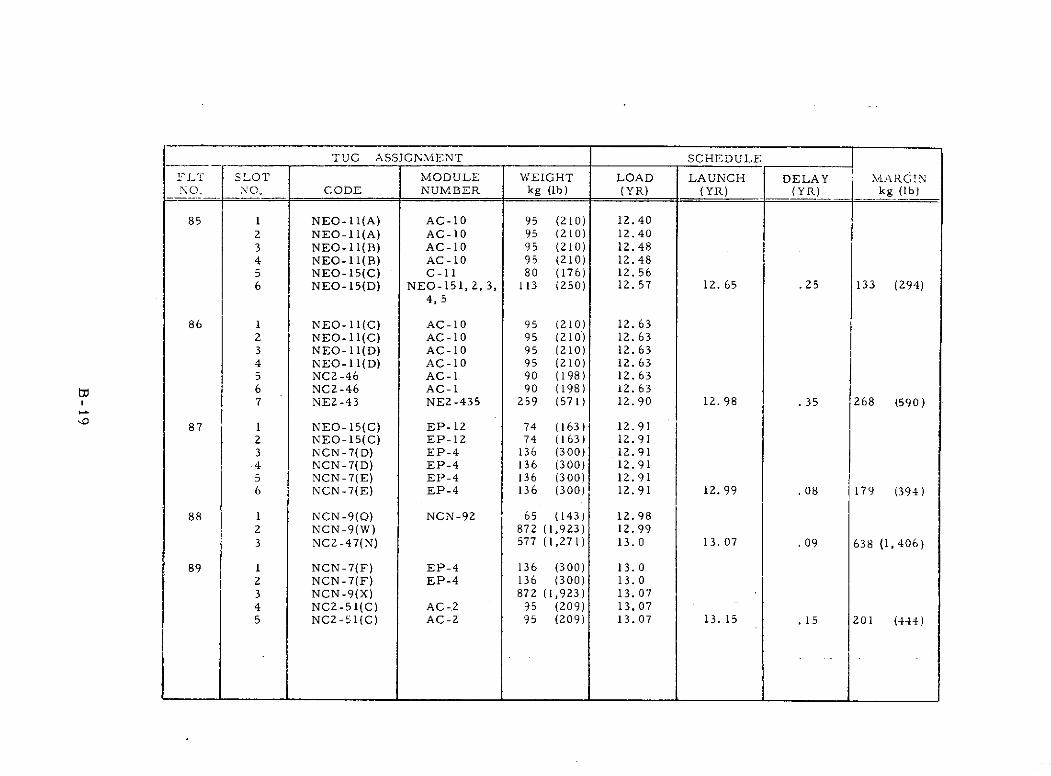
TUG ASSIGNMENT SCHEDULE
FLT SLOT MODULE WEIGHT LOAD LAUNCH DELAY MIARGINNO. NO. CODE NUMBER kg (lb) (YR) (YR) (YR) kg (Ib)
85 1 NEO-11(A) AC-10 95 (210) 12.402 NEO-11(A) AC-10 95 (210) 12.403 NEO-11(B) AC-10 95 (210) 12.484 NEO-11(B) AC-10 95 (210) 12.485 NEO-15(C) C-11 80 (176) 12.566 NEO-15(D) NEO-151, 2, 3, 113 (250) 12.57 12.65 .25 133 (294)
4, 5
86 1 NEO-11(C) AC-10 95 (210) 12.632 NEO-11(C) AC-10 95 (210) 12.633 NEO-11(D) AC-10 95 (210) 12.634 NEO-11(D) AC-10 95 (210) 12. 635 NC2-46 AC-1 90 (198) 12.636 NC2-46 AC-1 90 (198) 12.637 NE2-43 NE2-435 259 (571) 12.90 12.98 .35 1268 (590)
87 1 NEO-15(C) EP-12 74 (163) 12.912 NEO-15(C) EP-12 74 (163) 12.913 NCN-7(D) EP-4 136 (300) 12.914 NCN-7(D) EP-4 136 (300) 12.915 NCN-7(E) EP-4 136 (300) 12.916 NCN-7(E) EP-4 136 (300) 12.91 12.99 .08 1179 (394)
88 1 NCN-9(0) NCN-92 65 (143) 12.982 NCN-9(W) 872 (1,923) 12.993 NC2-47(N) 577 (1,271) 13.0 13. 07 .09 638 (1,406)
89 1 NCN-7(F) EP-4 136 (300) 13.02 NCN-7(F) EP-4 136 (300) 13.03 NCN-9(X) 872 (1,923) 13.074 NC2-51(C) AC-2 95 (209) 13.075 NC2-i1(C) AC-2 95 (209) 13.07 13. 15 .15 201 (444)
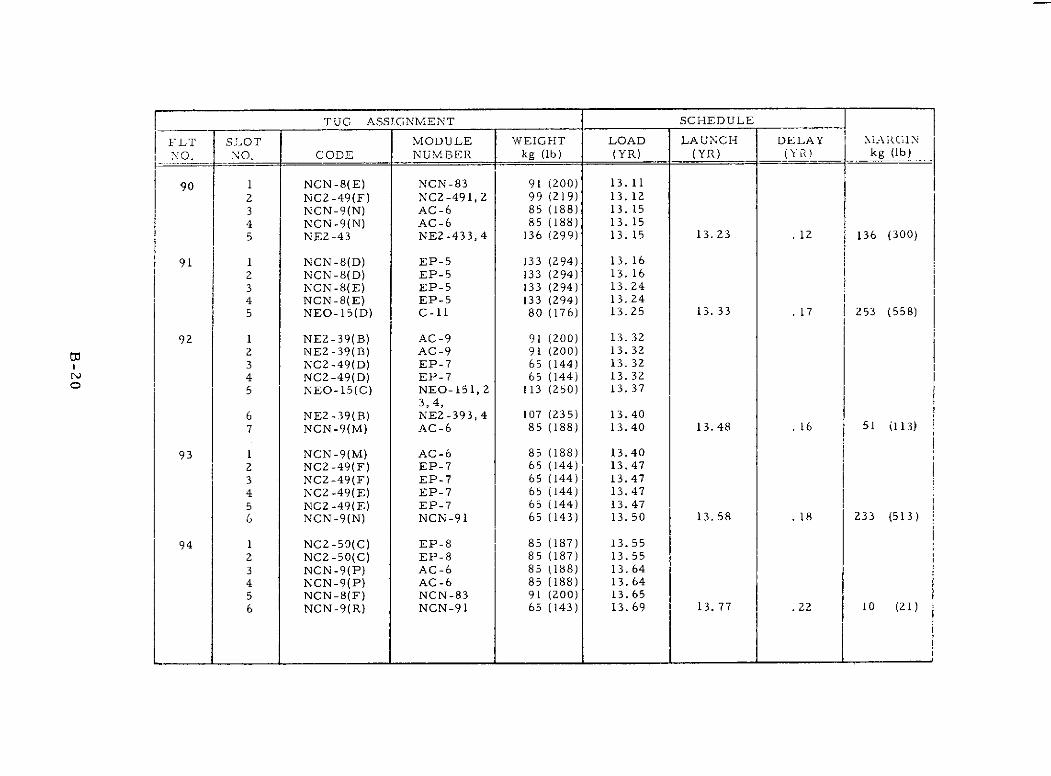
TUG ASSIGNMENT SCHEDULE
FLT SLOT MODULE WEIGHT LOAD LAUNCH DELAY N!AR(GIN
NO. NO. CODE NUMBER kg (lb) (YR) (YR) (YR) kg (Ib)
90 1 NCN-8(E) NCN-83 91 (200) 13. 11
2 NC2-49(F) NC2-491, 2 99 (219) 13. 123 NCN-9(N) AC-6 85 (188) 13. 154 NCN-9(N) AC-6 85 (188) 13. 155 NE2-43 NE2-433, 4 136 (299) 13. 15 13.23 .12 136 (300)
91 1 NCN-8(D) EP-5 133 (294) 13. 162 NCN-8(D) EP-5 133 (294) 13. 16
3 NCN-8(E) EP-5 133 (294) 13.244 NCN-8(E) EP-5 133 (294) 13.245 NEO-15(D) C-11 80 (176) 13.25 13. 33 .17 253 (558)
92 1 NE2-39(B) AC-9 91 (200) 13. 322 NE2-39(B) AC-9 91 (200) 13.323 NC2-49(D) EP-7 65 (144) 13.324 NC2-49(D) EP-7 65 (144) 13. 325 NEO-15(C) NEO-151, 2 113 (250) 13.37
3,4,6 NE2-39(B) NE2-393, 4 107 (235) 13.407 NCN-9(M) AC-6 85 (188) 13.40 13.48 .16 51 (113)
93 1 NCN-9(M) AC-6 85 (188) 13.402 NC2-49(F) EP-7 65 (144) 13.473 NC2-49(F) EP-7 65 (144) 13.474 NCZ-49(E) EP-7 65 (144) 13.47
5 NC2-49(E) EP-7 65 (144) 13.476 NCN-9(N) NCN-91 65 (143) 13. 50 13. 58 . 18 233 (513)
94 1 NC2-59(C) EP-8 85 (187) 13.552 NC2-50(C) EP-8 85 (187) 13.553 NCN-9(P) AC-6 85 (188) 13.644 NCN-9(P) AC-6 85 (188) 13.645 NCN-8(F) NCN-83 91 (200) 13. 656 NCN-9(R) NCN-91 65 (143) 13.69 13. 77 .22 10 (21)
_ _ _ _ _ _ _ _ _ _ _ _ _ _ I _
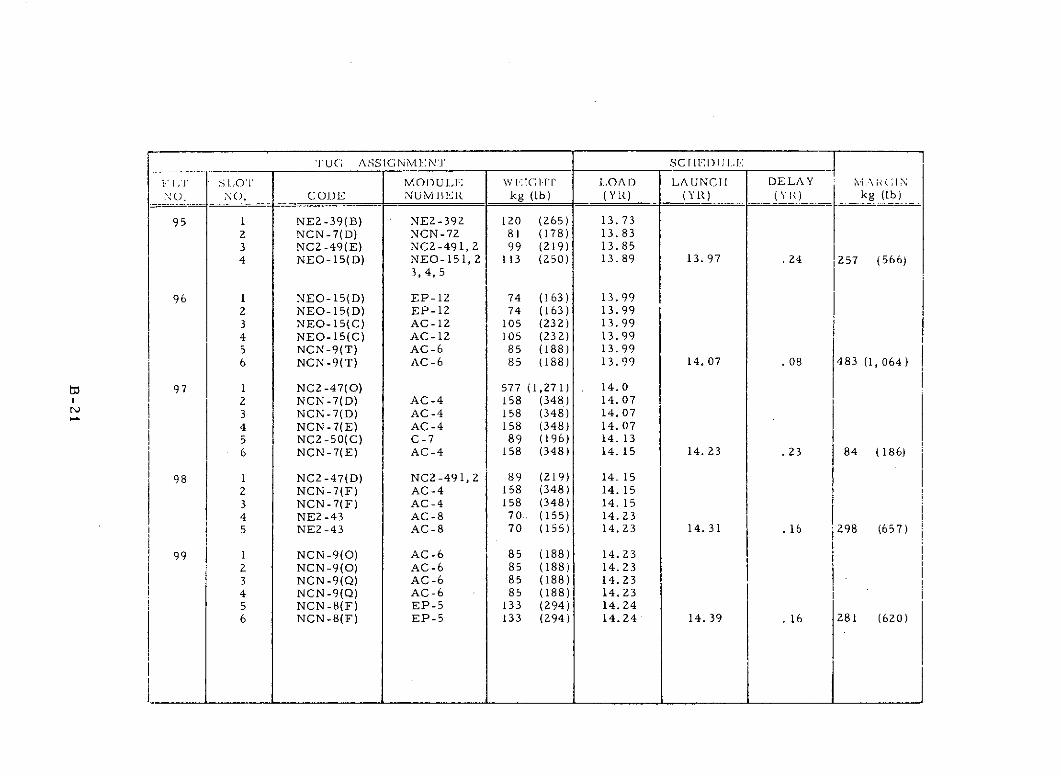
TUG ASS LG NMEN'.1' SCi l;I) I.I.I.:
'/L S.,OT MOI)ULE; WEII-IT I.,OAD 1LAUNCH DELAY : Xi .\ i ( ; NNO. NO. CODE NUMBE'R kg (Ib) (YYR) (YR) (YI) kg (lb)
95 1 NE2-39(B) NE2-392 120 (265) 13.732 NCN-7(D) NCN-72 81 (178) 13.833 NC2-49(E) NC2-491, 2 99 (219) 13.854 NEO-15(D) NEO-151, 2 113 (250) 13. 89 13.97 .24 1257 (566)
3, 4, 5
96 1 NEO-15(D) EP-12 74 (163) 13.992 NEO-15(D) EP-12 74 (163) 13.993 NEO-15(C) AC-12 105 (232) 13.994 NEO-15(C) AC-12 105 (232) 13.995 NCN-9(T) AC-6 85 (188) 13.996 NCN-9(T) AC-6 85 (188) 13.99 14.07 .08 483 (1, 064)
97 1 NC2-47(0) 577 (1,271) 14.02 NCN-7(D) AC-4 158 (348) 14.073 NCN-7(D) AC-4 158 (348) 14.074 NCN-7(E) AC-4 158 (348) 14.075 NC2-50(C) C-7 89 (196) 14. 136 NCN-7(E) AC-4 158 (348) 14.15 14.23 .23 84 (186)
98 1 NC2-47(D) NC2-491, 2 89 (219) 14. 152 NCN-7(F) AC-4 158 (348) 14. 153 NCN-7(F) AC-4 158 (348) 14. 154 NE2-43 AC-8 70. (155) 14.235 NE2-43 AC-8 70 (155) 14.23 14. 31 .16 298 (657)
99 1 NCN-9(0) AC-6 85 (188) 14.232 NCN-9(0) AC-6 85 (188) 14.233 NCN-9(Q) AC-6 85 (188) 14.234 NCN-9(Q) AC-6 85 (188) 14.235 NCN-8(F) EP-5 133 (294) 14.246 NCN-8(F) EP-5 133 (294) 14.24 14.39 . 16 281 (620)
_ _ _ _ _ _ _ _ _ __ _ _ _ _ _ _ _ I __
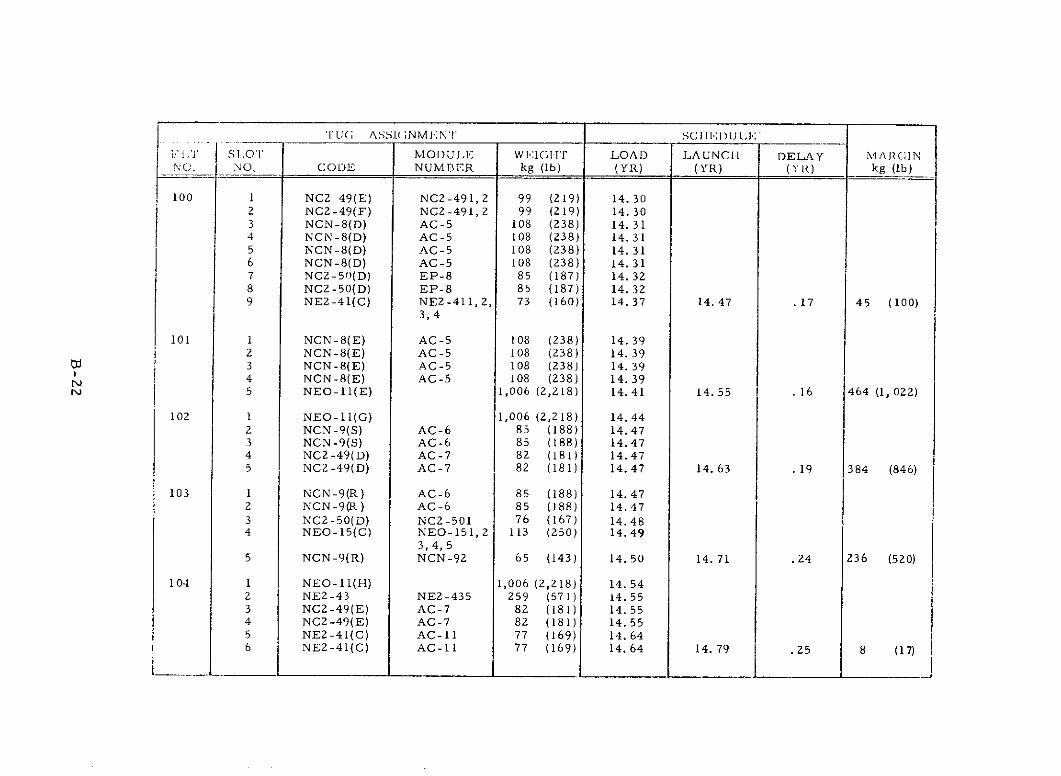
I'U ANS.( ;NMENT SCI 1)l.J.I
i.' SI,OT MOI)ULE W IH'F LOAD LAUNCIH DELAY MARGINNO. NO. CODE NUMBER kg (lb) (YR) (YR) (YR) kg (Ib)
100 1 NC2 49(E) NC2-491,2 99 (219) 14.302 NC2-49(F) NC2-491, 2 99 (219) 14.303 NCN-8(D) AC-5 108 (238) 14.314 NCN-8(D) AC-5 108 (238) 14.315 NCN-8(D) AC-5 108 (238) 14. 316 NCN-8(D) AC-5 108 (238) 14.317 NC2-50(D) EP-8 85 (187) 14.328 NC2-50(D) EP-8 85 (187) 14.329 NE2-41(C) NE2-411, 2, 73 (160) 14.37 14.47 .17 45 (100)
3,4
101 1 NCN-8(E) AC-5 108 (238) 14.392 NCN-8(E) AC-5 108 (238) 14. 393 NCN-8(E) AC-5 108 (238) 14.394 NCN-8(E) AC-5 108 (238) 14.395 NEO-11(E) 1,006 (2,218) 14.41 14. 55 .16 464 (1, 022)
102 1 NEO-11(G) 1,006 (2,218) 14.442 NCN-9(S) AC-6 85 (188) 14.473 NCN-9(S) AC-6 85 (188) 14.474 NC2-49(D) AC-7 82 (181) 14.475 NC2-49(D) AC-7 82 (181) 14.47 14. 63 .19 384 (846)
103 1 NCN-9(R) AC-6 85 (188) 14.472 NCN-9(R) AC-6 85 (188) 14.473 NC2-50(D) NC2-501 76 (167) 14.484 NEO-15(C) NEO-151, 2 113 (250) 14.49
3, 4, 55 NCN-9(R) NCN-92 65 (143) 14. 50 14. 71 .24 236 (520)
104 1 NEO-11(H) 1,006 (2,218) 14.542 NE2-43 NE2-435 259 (571) 14.553 NC2-49(E) AC-7 82 (181) 14.554 NC2-49(E) AC-7 82 (181) 14.555 NE2-41(C) AC-11 77 (169) 14.646 NE2-41(C) AC-11 77 (169) 14. 64 14. 79 .25 8 (17)
-- __ ___ ___ ___ ____ - _ ___ _ - ___ ___ _ .__ ____ _ - ___ - .___ _ _ ___ ___
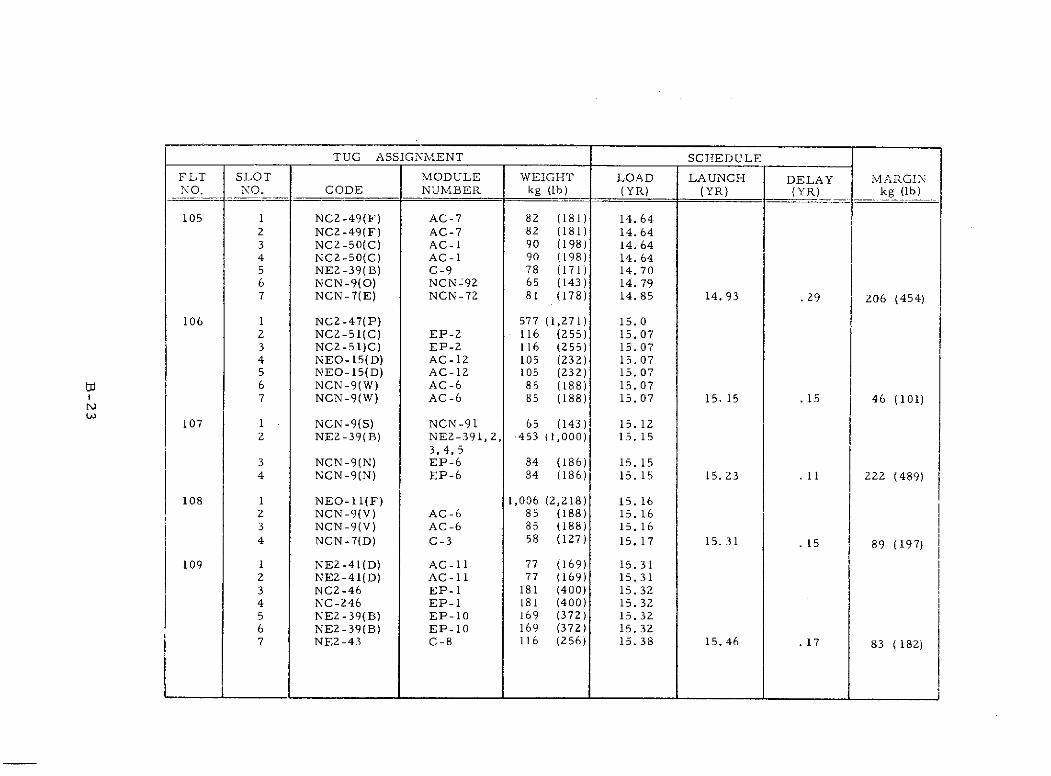
TUG ASSIGNMENT SCHEDULE
FLT SLOT MODULE WEIGHT LOAD LAUNCH DELAY MARGINNO. NO. CODE NUMBER kg (lb) (YR) (YR) (YR) kg (lb)
105 1 NC2-49(F) AC-7 82 (181) 14.642 NC2-49(F) AC-7 82 (181) 14.643 NC2-50(C) AC-1 90 (198) 14.644 NC2-50(C) AC-1 90 (198) 14.645 NE2-39(B) C-9 78 (171) 14.706 NCN-9(O) NCN-92 65 (143) 14.797 NCN-7(E) NCN-72 81 (178) 14.85 14.93 .29 206 (454)
106 1 NC2-47(P) 577 (1,271) 15.02 NC2-51(C) EP-2 116 (255) 15.073 NC2-51)C) EP-2 116 (255) 15.074 NEO-15(D) AC-12 105 (232) 15.075 NEO-15(D) AC-12 105 (232) 15.076 NCN-9(W) AC-6 85 (188) 15.077 NCN-9(W) AC-6 85 (188) 15.07 15. 15 .15 46 (101)
107 1 NCN-9(S) NCN-91 65 (143) 15.122 NE2-39(B) NE2-391,2, 453 (1,000) 15. 15
3, 4, 53 NCN-9(N) EP-6 84 (186) 15.154 NCN-9(N) EP-6 84 (186) 15.15 15.23 .11 222 (489)
108 1 NEO-11(F) 1,006 (2,218) 15.162 NCN-9(V) AC-6 85 (188) 15. 163 NCN-9(V) AC-6 85 (188) 15.164 NCN-7(D) C-3 58 (127) 15.17 15.31 .15 89 (197)
109 1 NE2-41(D) AC-11 77 (169) 15.312 NE2-41(D) AC-11 77 (169) 15.313 NC2-46 EP-1 181 (400) 15.324 NC-246 EP-1 181 (400) 15.325 NE2-39(B) EP-10 169 (372) 15.326 NE2-39(B) EP-10 169 (372) 15.327 NE2-43 C-8 116 (256) 15.38 15.46 .17 83 (182)
t _ _ _ _ _ _ _ _ _ _ _ _ _ _ _ _ _ _ _ _ _ _ _ _ _ _ _ _ _ _ _ _I _ _ _ _ _ _ _ _ _ _ _ _
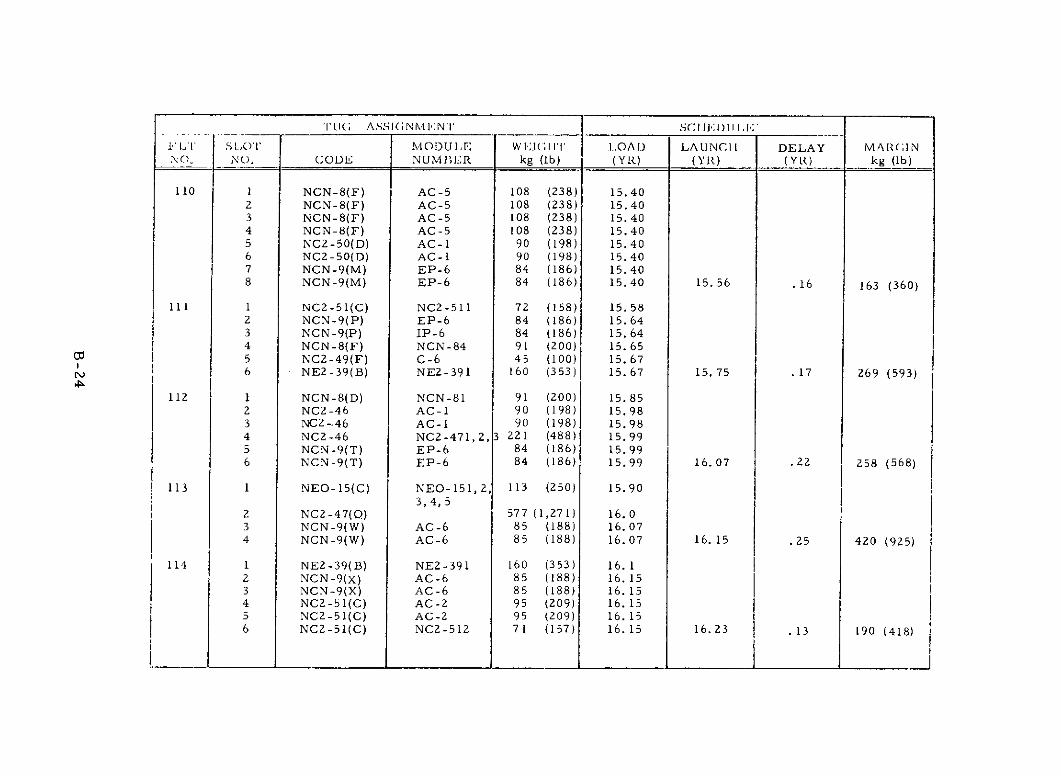
lTU( ASSI(; NN4I:N'I ' SCI E.:1)I I.
S.LT S , OT MODUL,E WE .LIGI IT LOAI) LAUNCHI DELAY MAR(;INNO) (CODE NUMIBER kg (lb) (YIR) (YR) (Y R) kg (lb)
110 1 NCN-8(F) AC-5 108 (238) 15.402 NCN-8(F) AC-5 108 (238) 15.403 NCN-8(F) AC-5 108 (238) 15.404 NCN-8(F) AC-5 108 (238) 15.405 NC2-50(D) AC-1 90 (198) 15.406 NC2-50(D) AC-1 90 (198) 15.407 NCN-9(M) EP-6 84 (186) 15.408 NCN-9(M) EP-6 84 (186) 15.40 15. 56 .16 163 (360)
111 1 NC2-51(C) NC2-511 72 (158) 15.582 NCN-9(P) EP-6 84 (186) 15.643 NCN-9(P) IP-6 84 (186) 15.644 NCN-8(F) NCN-84 91 (200) 15. 655 NC2-49(F) C-6 45 (100) 15. 676N 6 NE2-39(B) NE2-391 160 (353) 15.67 15. 75 .17 269 (593)
112 1 NCN-8(D) NCN-81 91 (200) 15. 852 NC2-46 AC-1 90 (198) 15.983 NC2--46 AC-1 90 (198) 15.984 NC2-46 NC2-471,2,3 221 (488) 15.995 NCN-9(T) EP-6 84 (186) 15.996 NCN-9(T) EP-6 84 (186) 15.99 16.07 .22 258 (568)
113 1 NEO-15(C) NEO-151, 2, 113 (250) 15.903,4,5
2 NC2-47(Q) 577 (1,271) 16.03 NCN-9(W) AC-6 85 (188) 16.074 NCN-9(W) AC-6 85 (188) 16.07 16. 15 .25 420 (925)
114 1 NE2-39(B) NE2-391 160 (353) 16.12 NCN-9(x) AC-6 85 (188) 16. 153 NCN-9(X) AC-6 85 (188) 16. 154 NC2-51(C) AC-2 95 (209) 16. 155 NC2-51(C) AC-2 95 (209) 16.156 NC2-51(C) NC2-512 71 (157) 16. 15 16.23 .13 190 (418)
________ _________ ________________ _______________ ________________________________________ ____________ ____ ______
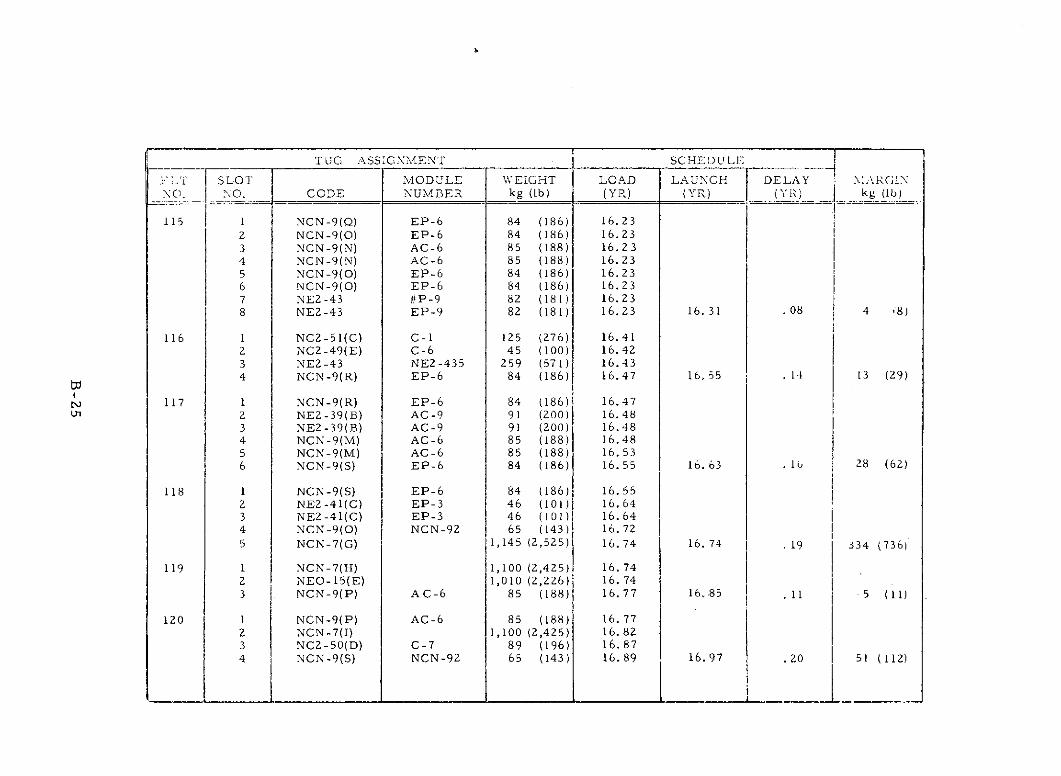
TUG ASSIGNMENT SCHEI)ULE
'LT SLOT MODULE WEIGHT LOAD LAUNCH DELAY MARGINNO. NO CODE NUMBER kg (Ib) (YR) (YR) (Y) kg (b)
115 1 NCN-9(0) EP-6 84 (186) 16.232 NCN-9(0) EP-6 84 (186) 16.233 NCN-9(N) AC-6 85 (188) 16.234 NCN-9(N) AC-6 85 (188) 16.235 NCN-9(0) EP-6 84 (186) 16.236 NCN-9(0) EP-6 84 (186) 16.237 NE2-43 #P-9 82 (181) 16.238 NE2-43 EP-9 82 (181) 16.23 16.31 .08 4 (8)
116 1 NC2-51(C) C-1 125 (276) 16.412 NC2-49(E) C-6 45 (100) 16.423 NE2-43 NE2-435 259 (571) 16.434 NCN-9(R) EP-6 84 (186) 16.47 16. 55 . 14 13 (29)
N 117 1 NCN-9(R) EP-6 84 (186) 16.472 NE2-39(B) AC-9 91 (200) 16.483 NE2-39(B) AC-9 91 (200) 16.484 NCN-9(M) AC-6 85 (188) 16.485 NCN-9(M) AC-6 85 (188) 16.536 NCN-9(S) EP-6 84 (186) 16. 55 16. 63 . 1u 28 (62)
118 1 NCN-9(S) EP-6 84 (186) 16.552 NE2-41(C) EP-3 46 (101) 16.643 NE2-41(C) EP-3 46 (101) 16.644 NCN-9(0) NCN-92 65 (143) 16.72
5 NCN-7(G) 1,145 (2,525) 16.74 16. 74 . 19 334 (736)
119 1 NCN-7(H) 1,100 (2,425) 16.742 NEO-15(E) 1,010 (2,226) 16. 743 NCN-9(P) AC-6 85 (188) 16.77 16. 85 11 - 5 (11)
120 1 NCN-9(P) AC-6 85 (188) 16. 772 NCN-7(I) 1,100 (2,425) 16.823 NC2-50(D) C-7 89 (196) 16.874 NCN-9(S) NCN-92 65 (143) 16.89 16.97 .20 51 (112)
______________ ____________ ___________ _________ _________ _________ ~ ... _____
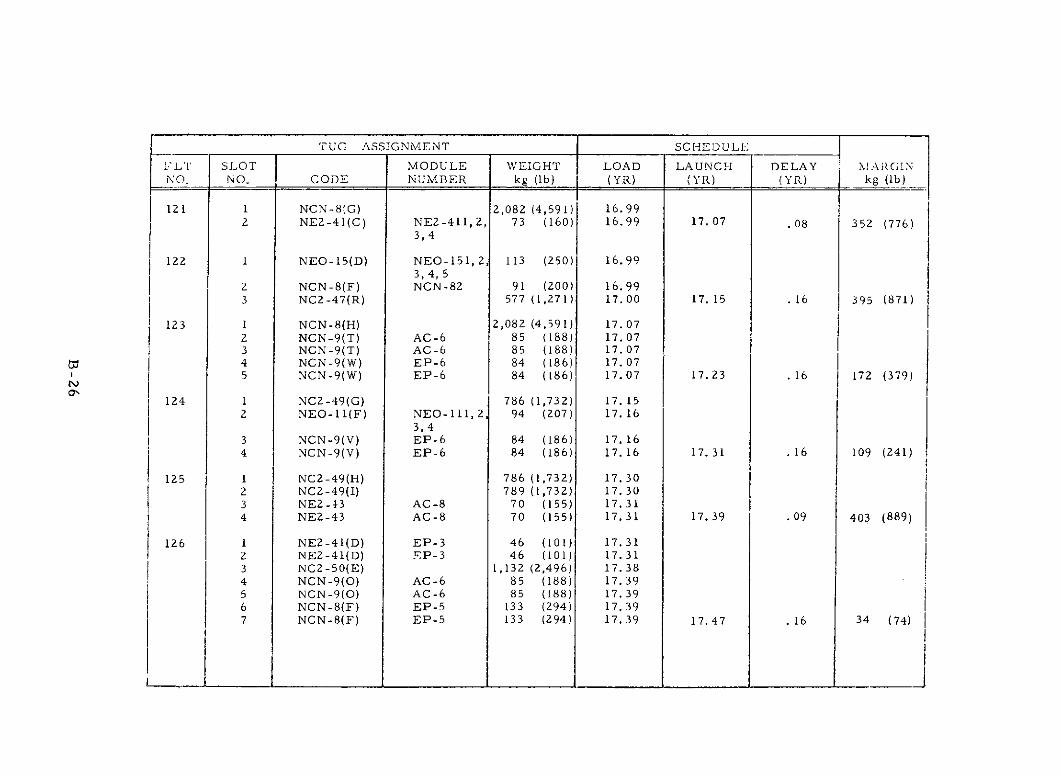
TUG ASSIGNMENT SCHEDULJE
F LT SLOT MODULE WEIGHT LOAD LAUNCH DELAY MARGINNO. NO. CODE NUMBER kg (lb) (YR) (YR) (YR) kg (lb)
121 1 NCN-8fG) 2,082 (4,591) 16.992 NE2-41(C) NE2-411,2, 73 (160) 16.99 17.07 .08 352 (776)
3, 4
122 1 NEO-15(D) NEO-151, 2, 113 (250) 16.993,4, 5
2 NCN-8(F) NCN-82 91 (200) 16.993 NC2-47(R) 577 (1,271) 17.00 17. 15 .16 395 (871)
123 1 NCN-8(H) 2,082 (4,591) 17.072 NCN-9(T) AC-6 85 (188) 17.073 NCN-9(T) AC-6 85 (188) 17.074 NCN-9(W) EP-6 84 (186) 17. 075 NCN-9(W) EP-6 84 (186) 17.07 17.23 .16 172 (379)
124 1 NC2-49(G) 786 (1,732) 17. 152 NEO-11(F) NEO-111, 2, 94 (207) 17. 16
3,43 NCN-9(V) EP-6 84 (186) 17. 164 NCN-9(V) EP-6 84 (186) 17. 16 17. 31 .16 109 (241)
125 1 NC2-49(H) 786 (1,732) 17.302 NC2-49(I) 789 (1,732) 17. 303 NE2-13 AC-8 70 (155) 17.314 NE2-43 AC-8 70 (155) 17.31 17. 39 .09 403 (889)
126 1 NE2-41(D) EP-3 46 (101) 17.312 NE2-41(D) EP-3 46 (101) 17.313 NC2-50(E) 1,132 (2,496) 17. 384 NCN-9(O) AC-6 85 (188) 17. 395 NCN-9(0) AC-6 85 (188) 17.396 NCN-8(F) EP-5 133 (294) 17. 397 NCN-8(F) EP-5 133 (294) 17. 39 17.47 .16 34 (74)
___ __ __ ___________ I __________ __ __ ___ _ __ __ ___ _ __ __ ___ _ ________ ____

TUG ASSIGNMENT SCHEDULE
FLT SLOT MODULE WEIGHT LOAD LAUNCH DELAY MARGINNO, NO. CODE NUMBER kg (lb) (YR) (YR) (YR) kg (lb)
127 1 NCN-9(Q) AC-6 85 (188) 17. 392 NCN-9(Q) AC-6 85 (188) 17. 393 NEO-11(E) NEO-111, 2 94 (207) 17.41
3,44 NCN-9(W) NCN-91 65 (143) 17.545 NEO-11(E) AC-10 95 (210) 17.556 NEO-11(E) AC-10 95 (210) 17.557 NCN-9(S) AC-6 85 (188) 17. 638 NCN-9(S) AC-6 85 (188) 17. 63 17. 71 .32 5 (12)
128 1 NEO-11(G) AC-10 95 (210) 17. 632 NEO-11(G) AC-10 95 (210) 17.633 NE2-43 NE2-431 156 (343) 17.674 NE2-39(B) NE2-392 120 (265) 17.705 NC2-46 S&C-1 103 (226) 17.70 17. 79 .16 534 (1, 170)
129 1 NCN-9(R AC-6 85 (188) 17.712 NCN-9(R) AC-6 85 (188) 17.713 NE2-41(C) AC-11 77 (169) 17.794 NE2-41(C) AC-11 77 (169) 17.795 NEO-11(H) AC-10 95 (210) 17.796 NEO-11(H) AC-10 95 (210) 17.79 17.87 .16 320 (706)
130 1 NCN-9(S) C-5 78 (171) 17.802 NE2-43 NE2-435 259 (571) 17.813 NEO-15(F) 1,010 (2,226) 17. 824 NCN-9(N) C-5 78 (171) 17.93 18.01 .21 -0-
131 1 NC2-47(S) 577 (1,271) 18.02 NCN-8(I) 2,082 (4,591) 18.07 18. 09 .09 743 (1, 638)
132 1 NCN-9(W) EP-6 84 (186) 18.072 NCN-9(W) EP-6 84 (186) 18.073 NC2-50(F) 1,132 (2,496) 18.154 NCN-9(X) EP-6 84 (186) 18. 155 NCN-9(X) EP-6 84 (186) 18. 15 18.23 . 16 43 (94)
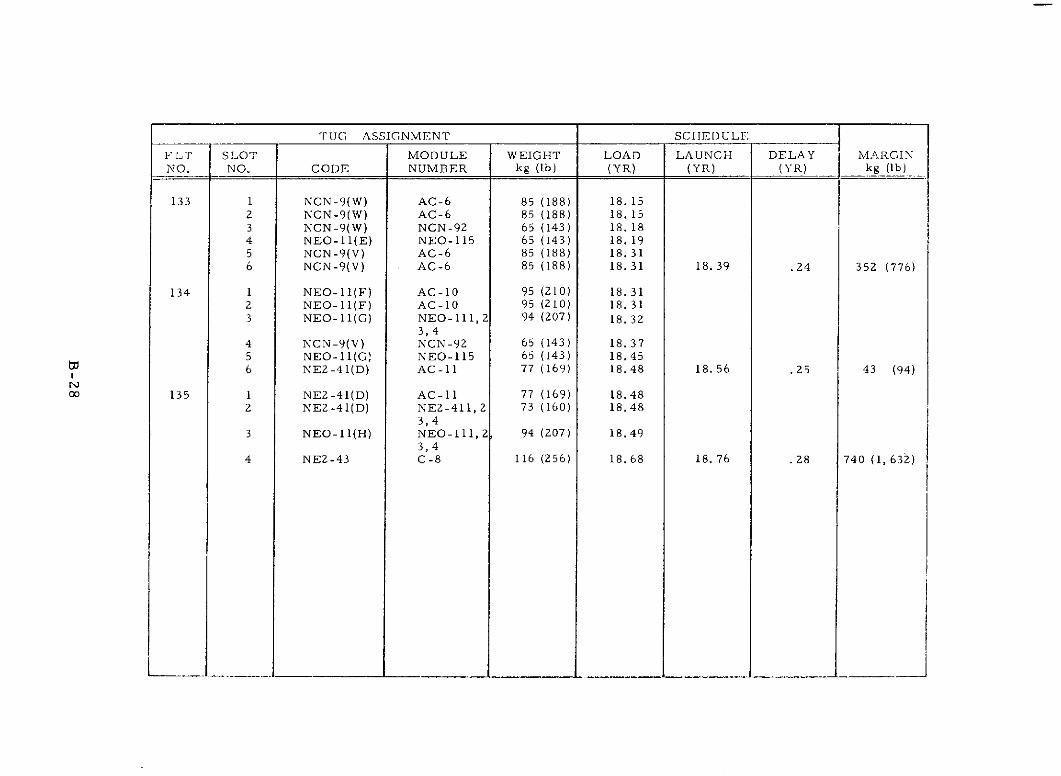
TUG ASSIGNMENT SCIIEI)ULE
FLT SLOT MODULE WEIGHT LOAD LAUNCH DELAY MARGINNO, NO. CODE NUMBER kg (lb) (YR) (YR) (YR) kg (lb)
133 1 NCN-9(W) AC-6 85 (188) 18. 152 NCN-9(W) AC-6 85 (188) 18.153 NCN-9(W) NCN-92 65 (143) 18. 184 NEO-11(E) NEO-115 65 (143) 18. 195 NCN-9(V) AC-6 85 (188) 18.316 NCN-9(V) AC-6 85 (188) 18.31 18. 39 .24 352 (776)
134 1 NEO-11(F) AC-10 95 (210) 18.312 NEO-11(F) AC-10 95 (210) 18.313 NEO-11(G) NEO-111, 2 94 (207) 18.32
3,44 NCN-9(V) NCN-92 65 (143) 18. 375 NEO-11(G) NEO-115 65 (143) 18.456 NE2-41(D) AC-11 77 (169) 18.48 18.56 .25 43 (94)
135 1 NE2-41(D) AC-11 77 (169) 18.482 NE2-41(D) NE2-411, 2 73 (160) 18.48
3,43 NEO-11(H) NEO-111, 2 94 (207) 18.49
3,44 NE2-43 C-8 116 (256) 18.68 18. 76 .28 740 (1, 632)
________________ _____________ ____________ ____________ _________________ _______ ____j