Sequence Stratigraphy: Methodology and...
74
Newsletters on Stratigraphy, Vol. 44/3, 173–245 Article Stuttgart, November 2011 Sequence Stratigraphy: Methodology and Nomenclature Octavian Catuneanu 1 , William E. Galloway 2 , Christopher G. St. C. Kendall 3 , Andrew D. Miall 4 , Henry W. Posamentier 5 , André Strasser 6 , and Maurice E. Tucker 7 With 50 figures and 1 table Abstract. The recurrence of the same types of sequence stratigraphic surface through geologic time defines cycles of change in accommodation or sediment supply, which correspond to sequences in the rock record. These cycles may be symmetrical or asymmetrical, and may or may not include all types of systems tracts that may be expected within a fully developed sequence. Depending on the scale of observation, sequences and their bounding surfaces may be ascribed to different hierarchical orders. Stratal stacking patterns combine to define trends in geometric character that include upstepping, forestep- ping, backstepping and downstepping, expressing three types of shoreline shift: forced regression (forestep- ping and downstepping at the shoreline), normal regression (forestepping and upstepping at the shoreline) and transgression (backstepping at the shoreline). Stacking patterns that are independent of shoreline trajec- tories may also be defined on the basis of changes in depositional style that can be correlated regionally. All stratal stacking patterns reflect the interplay of the same two fundamental variables, namely accommodation (the space available for potential sediment accumulation) and sediment supply. Deposits defined by specific stratal stacking patterns form the basic constituents of any sequence stratigraphic unit, from sequence to systems tract and parasequence. Changes in stratal stacking patterns define the position and timing of key sequence stratigraphic surfaces. Precisely which surfaces are selected as sequence boundaries varies as a function of which surfaces are best expressed within the context of the depositional setting and the preservation of facies relationships and stratal stacking patterns in that succession. The high degree of variability in the expression of sequence stratigraphic units and bounding surfaces in the rock record means ideally that the methodology used to analyze their de- positional setting should be flexible from one sequence stratigraphic approach to another. Construction of this framework ensures the success of the method in terms of its objectives to provide a process-based under- standing of the stratigraphic architecture. The purpose of this paper is to emphasize a standard but flexible methodology that remains objective. Key words. sequence stratigraphy, stratal stacking patterns, accommodation, sediment supply, shoreline trajectories © 2011 Gebrüder Borntraeger, Stuttgart, Germany DOI: 10.1127/0078-0421/2011/0011 www.borntraeger-cramer.de 0078-0421/2011/0011 $ 18.25 Authorsʼ addresses: 1 Department of Earth and Atmospheric Sciences, University of Alberta, 1–26 Earth Sciences Building, Edmonton, Alberta, T6G 2E3, Canada. 2 Institute for Geophysics, The University of Texas at Austin, Austin, Texas 78758-4445, USA. 3 Department of Geological Sciences, University of South Carolina, Columbia, South Carolina 29208, USA. 4 Department of Geology, University of Toronto, Toronto, Ontario, M5S 3B1, Canada. 5 Chevron Energy Technology Company, 1500 Lousiana Street, Houston, Texas 77382, USA. 6 Department of Geosciences, University of Fribourg, CH-1700 Fribourg, Switzerland. 7 Department of Earth Sciences, Durham University, Durham DH1 3LE, UK.
Transcript of Sequence Stratigraphy: Methodology and...

Newsletters on Stratigraphy, Vol. 44/3, 173–245 ArticleStuttgart, November 2011
Sequence Stratigraphy: Methodology and Nomenclature
Octavian Catuneanu1, William E. Galloway2, Christopher G. St. C. Kendall3,Andrew D. Miall4, Henry W. Posamentier5, André Strasser6, and Maurice E. Tucker7
With 50 figures and 1 table
Abstract. The recurrence of the same types of sequence stratigraphic surface through geologic time definescycles of change in accommodation or sediment supply, which correspond to sequences in the rock record.These cycles may be symmetrical or asymmetrical, and may or may not include all types of systems tractsthat may be expected within a fully developed sequence. Depending on the scale of observation, sequencesand their bounding surfaces may be ascribed to different hierarchical orders.Stratal stacking patterns combine to define trends in geometric character that include upstepping, forestep-ping, backstepping and downstepping, expressing three types of shoreline shift: forced regression (forestep-ping and downstepping at the shoreline), normal regression (forestepping and upstepping at the shoreline)and transgression (backstepping at the shoreline). Stacking patterns that are independent of shoreline trajec-tories may also be defined on the basis of changes in depositional style that can be correlated regionally. Allstratal stacking patterns reflect the interplay of the same two fundamental variables, namely accommodation(the space available for potential sediment accumulation) and sediment supply. Deposits defined by specificstratal stacking patterns form the basic constituents of any sequence stratigraphic unit, from sequence to systems tract and parasequence. Changes in stratal stacking patterns define the position and timing of key sequence stratigraphic surfaces.Precisely which surfaces are selected as sequence boundaries varies as a function of which surfaces are bestexpressed within the context of the depositional setting and the preservation of facies relationships and stratalstacking patterns in that succession. The high degree of variability in the expression of sequence stratigraphicunits and bounding surfaces in the rock record means ideally that the methodology used to analyze their de-positional setting should be flexible from one sequence stratigraphic approach to another. Construction of thisframework ensures the success of the method in terms of its objectives to provide a process-based under-standing of the stratigraphic architecture. The purpose of this paper is to emphasize a standard but flexiblemethodology that remains objective.
Key words. sequence stratigraphy, stratal stacking patterns, accommodation, sediment supply, shoreline trajectories
© 2011 Gebrüder Borntraeger, Stuttgart, GermanyDOI: 10.1127/0078-0421/2011/0011
www.borntraeger-cramer.de0078-0421/2011/0011 $ 18.25
Authorsʼ addresses:1 Department of Earth and Atmospheric Sciences, University of Alberta, 1–26 Earth Sciences Building, Edmonton, Alberta,T6G 2E3, Canada.2 Institute for Geophysics, The University of Texas at Austin, Austin, Texas 78758-4445, USA.3 Department of Geological Sciences, University of South Carolina, Columbia, South Carolina 29208, USA.4 Department of Geology, University of Toronto, Toronto, Ontario, M5S 3B1, Canada.5 Chevron Energy Technology Company, 1500 Lousiana Street, Houston, Texas 77382, USA.6 Department of Geosciences, University of Fribourg, CH-1700 Fribourg, Switzerland.7 Department of Earth Sciences, Durham University, Durham DH1 3LE, UK.

Contents
Abstract . . . . . . . . . . . . . . . . . . . . . . . . . . . . . . . 173
Part one – Concepts . . . . . . . . . . . . . . . . . 175
Introduction . . . . . . . . . . . . . . . . . . . . . . . . . . . 1751. Definition of sequence stratigraphy . . . . . . . 1752. Rationale: the need for formalization . . . . . 175
Basic concepts . . . . . . . . . . . . . . . . . . . . . . . . . 1771. Accommodation . . . . . . . . . . . . . . . . . . . . . . 1772. Stratal stacking patterns . . . . . . . . . . . . . . . . 1783. Allogenic versus autogenic controls . . . . . . 182
Sequence stratigraphic units: Sequences . . . 1831. Definition . . . . . . . . . . . . . . . . . . . . . . . . . . . 1832. Types of sequence . . . . . . . . . . . . . . . . . . . . 184
Sequence stratigraphic units: Systems tracts 1841. Definition . . . . . . . . . . . . . . . . . . . . . . . . . . . 1842. Shoreline-related systems tracts . . . . . . . . . . 1853. Shoreline-independent systems tracts . . . . . 186
Sequence stratigraphic units: Parasequences 1861. Definition . . . . . . . . . . . . . . . . . . . . . . . . . . . 1862. Scale and stacking patterns . . . . . . . . . . . . . 188
Sequence stratigraphic surfaces . . . . . . . . . . . 1891. Definition . . . . . . . . . . . . . . . . . . . . . . . . . . . 1892. Subaerial unconformity . . . . . . . . . . . . . . . . 1903. Correlative conformities . . . . . . . . . . . . . . . . 1904. Maximum flooding surface . . . . . . . . . . . . . 1905. Maximum regressive surface . . . . . . . . . . . . 1906. Transgressive ravinement surfaces . . . . . . . 1907. Regressive surface of marine erosion . . . . . 191
Hierarchy in sequence stratigraphy . . . . . . . . 191
Model-independent methodology . . . . . . . . . . 192
Part two – Case studies . . . . . . . . . . . . . . 192
Nonmarine settings . . . . . . . . . . . . . . . . . . . . . 1921. Introduction . . . . . . . . . . . . . . . . . . . . . . . . . 1922. Case study: The Castlegate Sandstone
(Upper Cretaceous), Book Cliffs, Utah . . . . 196
Coastal and shallow-water siliciclasticsettings . . . . . . . . . . . . . . . . . . . . . . . . . . . . . . . 1981. Introduction . . . . . . . . . . . . . . . . . . . . . . . . . 1982. Case study: The Yegua Formation (Eocene),
Gulf of Mexico . . . . . . . . . . . . . . . . . . . . . . . 200
Deep-water siliciclastic settings . . . . . . . . . . . 2041. Introduction . . . . . . . . . . . . . . . . . . . . . . . . . 2042. Case study: The Vischkuil Formation
(Permian), Karoo Basin, South Africa . . . . . 208
Carbonate settings . . . . . . . . . . . . . . . . . . . . . . 2081. Introduction . . . . . . . . . . . . . . . . . . . . . . . . . 2082. Case study: Late Jurassic (Kimmeridgian)
platform-to-basin correlation, JuraMountains . . . . . . . . . . . . . . . . . . . . . . . . . . . 215
3. Case study: Mid-Cretaceous carbonateplatform of the Maestrat Basin, IberianChain . . . . . . . . . . . . . . . . . . . . . . . . . . . . . . 219
Mixed carbonate-evaporite settings . . . . . . . . 2201. Introduction . . . . . . . . . . . . . . . . . . . . . . . . . 2202. Case study: The Upper Permian carbonate-
evaporite succession (Zechstein) of NW Europe . . . . . . . . . . . . . . . . . . . . . . . 225
Mixed carbonate-siliciclastic settings . . . . . . 2281. Introduction . . . . . . . . . . . . . . . . . . . . . . . . . 2282. Case study: Mixed carbonate-clastic
sequences, Mid-Carboniferous, northernEngland . . . . . . . . . . . . . . . . . . . . . . . . . . . . 229
Part three – Discussion and conclusions . . . . . . . . . 232
Links to other stratigraphic disciplines . . . . . 232
Sequence stratigraphic methodology . . . . . . . 232
Acknowledgements . . . . . . . . . . . . . . . . . . . . . 234
References . . . . . . . . . . . . . . . . . . . . . . . . . . . . . 234
O. Catuneanu et al.174

Part one – Concepts
Introduction
1. Definition of sequence stratigraphy
Sequence stratigraphy is a methodology that providesa framework for the elements of any depositional set-ting, facilitating paleogeographic reconstructions andthe prediction of facies and lithologies away from control points. This framework ties changes in stratalstacking patterns to the responses to varying accom-modation and sediment supply through time. Stratalstacking patterns enable determination of the order inwhich strata were laid down, and explain the geomet-ric relationships and the architecture of sedimentarystrata. The sequence stratigraphic framework also pro-vides the context within which to interpret the evolu-tion of depositional systems through space and time.This analysis is improved by integration of processsedimentology with an understanding of the geome-tries and scales of the component depositional ele-ments (e. g., Sprague et al. 2002).
The main tool used in sequence stratigraphic analy-sis is the stacking pattern of strata and the key surfacesthat bound successions defined by different stratalstacking patterns. Trends in geometric character, whichcombine to define stratal stacking patterns, include
upstepping, forestepping, backstepping, and downstep-ping. A sequence stratigraphic framework may consistof three different types of sequence stratigraphic unit,namely sequences, systems tracts, and parasequences.Each type of unit is defined by specific stratal stackingpatterns and bounding surfaces. The definition of theseunits is independent of temporal and spatial scales, andof the mechanism of formation.
Concepts that are precursors to modern sequencestratigraphy arose originally as an approach to the map-ping of the North American continental interior, whensome generalizations about regional unconformitiesbecame apparent (e. g., Sloss et al. 1949; Sloss 1963).Subsequently, this method of stratigraphic analysis hasdeveloped into the fundamental approach for interpret-ing and predicting the distribution of sediment bodies.Unlike the analytical stratigraphic methods of litho -stratigraphy and biostratigraphy that involve subdivi-sions as objectively free of interpretation as possible,sequence stratigraphy is a genetic, process-based ana-lytical approach to stratigraphic interpretation that ofnecessity involves conceptual depositional models.
2. Rationale: the need for formalization
In spite of its popularity among geoscientists in acade-mia, industry and government organizations, sequencestratigraphy remains a method that has no formalizeddefinitions in stratigraphic guides or codes. This reflects
Sequence Stratigraphy: Methodology and Nomenclature 175
SequencesSloss et al. (1949)
Sloss (1963)
Depositional Sequence I(Seismic Stratigraphy)Mitchum et al. (1977)
Depositional Sequence IIHaq et al. (1987)
Posamentier et al. (1988)
Depositional Sequence IIIVan Wagoner et al. (1988, 1990)
Christie-Blick (1991)
Depositional Sequence IVHunt & Tucker (1992, 1995)
Helland-Hansen & Gjelberg (1994)
Genetic SequencesFrazier (1974)
Galloway (1989)
T-R SequencesJohnson & Murphy (1984)
Embry & Johannessen (1992)
Fig. 1. Evolution of sequence stratigraphic approaches (from Catuneanu et al. 2010).

the existence of a variety of alternative approaches(Figs. 1, 2). Researchers usually choose the conceptualmodel that is best adapted to the depositional systemthey are studying, which naturally has led to a multitudeof different definitions of the sequence stratigraphicunits and surfaces. Such differences revolve largelyaround nomenclatural preferences and arguments withrespect to which stratigraphic surfaces hold the greatestutility to be elevated in importance to the rank of sequence boundary. Otherwise, all approaches share acommon ground that justifies the formalization of se-quence stratigraphy (Catuneanu et al. 2009, 2010).
Formalization is necessary if the present state ofmethodological and nomenclatural confusion is to be
eliminated along with the uncoordinated effort in thedevelopment of the method. Sequence stratigraphy re-quires the definition of a model-independent method-ology that honors the various approaches but tran-scends their differences. A single set of terms is re-quired so as to facilitate communication, but in no wayis formalization meant to be an obstacle that limits further conceptual development or prevents certain approaches to specific situations. The definition of thecommon ground in sequence stratigraphy should pro-mote flexibility with respect to the choice of approachthat is best suited to a specific set of conditions as defined by tectonic setting, depositional setting, dataavailable, and scale of observation.
O. Catuneanu et al.176
DepositionalSequence II
DepositionalSequence I
DepositionalSequence III
DepositionalSequence IV
GeneticSequence
T-RSequence
end of RSL fall
end of R
end of T
onset of RSL fall
Eventsand stages
Sequencemodel
early HST
early HST
early LST(fan)
early LST(fan)
late LST(wedge)
late LST(wedge)
late HST
HST HST
HST HST
TST TST
LST
TST TST TST
RST
RST
FSST
HST
HST
LST
sequence boundarysystems tract boundarywithin-sequence surfacewithin-systems tract surface
time
tim
e
onset ofRSL fall
end ofRSL fall
end ofregression
end oftransgression
CC*CC*
CC**
MFS
MRSS
equence
FR
T
LNR
HNR
HNR
Fig. 2. Nomenclature of systems tracts, and timing of sequence boundaries for the various sequence stratigraphic ap-proaches (modified from Catuneanu et al. 2010). Abbreviations: RSL – relative sea level; T – transgression; R – regression;FR – forced regression; LNR – lowstand normal regression; HNR – highstand normal regression; LST – lowstand systemstract; TST – transgressive systems tract; HST – highstand systems tract; FSST – falling-stage systems tract; RST – regres-sive systems tract; T-R – transgressive-regressive; CC* – correlative conformity in the sense of Posamentier and Allen(1999); CC** – correlative conformity in the sense of Hunt and Tucker (1992); MFS – maximum flooding surface; MRS –maximum regressive surface. References for the proponents of the various sequence models are provided in Figure 1.
Basic concepts
1. Accommodation
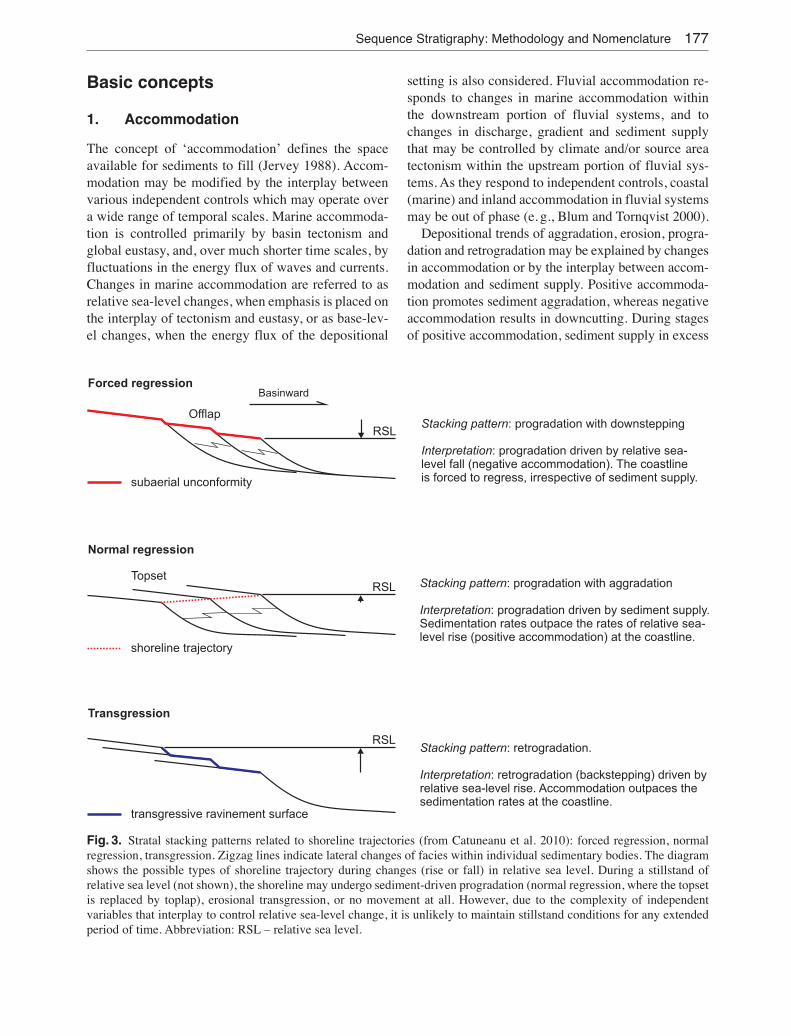
The concept of ʻaccommodationʼ defines the spaceavailable for sediments to fill (Jervey 1988). Accom-modation may be modified by the interplay betweenvarious independent controls which may operate overa wide range of temporal scales. Marine accommoda-tion is controlled primarily by basin tectonism andglobal eustasy, and, over much shorter time scales, byfluctuations in the energy flux of waves and currents.Changes in marine accommodation are referred to asrelative sea-level changes, when emphasis is placed onthe interplay of tectonism and eustasy, or as base-lev-el changes, when the energy flux of the depositional
setting is also considered. Fluvial accommodation re-sponds to changes in marine accommodation withinthe downstream portion of fluvial systems, and tochanges in discharge, gradient and sediment supplythat may be controlled by climate and/or source areatectonism within the upstream portion of fluvial sys-tems. As they respond to independent controls, coastal(marine) and inland accommodation in fluvial systemsmay be out of phase (e. g., Blum and Tornqvist 2000).
Depositional trends of aggradation, erosion, progra-dation and retrogradation may be explained by changesin accommodation or by the interplay between accom-modation and sediment supply. Positive accommoda-tion promotes sediment aggradation, whereas negativeaccommodation results in downcutting. During stagesof positive accommodation, sediment supply in excess
Sequence Stratigraphy: Methodology and Nomenclature 177
Normal regression
shoreline trajectory
subaerial unconformity
transgressive ravinement surface
Forced regression
RSL
RSL
RSL
Transgression
Stacking pattern
Interpretation
: retrogradation.
: retrogradation (backstepping) driven byrelative sea-level rise. Accommodation outpaces thesedimentation rates at the coastline.
Stacking pattern
Interpretation
: progradation with downstepping
: progradation driven by relative sea-level fall (negative accommodation). The coastlineis forced to regress, irrespective of sediment supply.
Stacking pattern
Interpretation
: progradation with aggradation
: progradation driven by sediment supply.Sedimentation rates outpace the rates of relative sea-level rise (positive accommodation) at the coastline.
Topset
Offlap
Basinward
Fig. 3. Stratal stacking patterns related to shoreline trajectories (from Catuneanu et al. 2010): forced regression, normal regression, transgression. Zigzag lines indicate lateral changes of facies within individual sedimentary bodies. The diagramshows the possible types of shoreline trajectory during changes (rise or fall) in relative sea level. During a stillstand of relative sea level (not shown), the shoreline may undergo sediment-driven progradation (normal regression, where the topsetis replaced by toplap), erosional transgression, or no movement at all. However, due to the complexity of independent variables that interplay to control relative sea-level change, it is unlikely to maintain stillstand conditions for any extendedperiod of time. Abbreviation: RSL – relative sea level.

of available accommodation results in progradation,whereas underfilled accommodation results in retro -gradation. During stages of negative accommodation,processes of subaerial exposure and erosion are typi-cally accompanied by progradation in the basinwardparts of the depositional profile.
2. Stratal stacking patterns
Stratal stacking patterns may be defined either in rela-tion to or independently of shoreline trajectories. Cri-teria involved in the definition of stratal stacking pat-terns include geometries and facies relationships thatarose from the interplay of available accommodationand sediment supply at syn-depositional time.
Shoreline-related stacking patterns are defined bycombinations of depositional trends that can be tied tospecific types of shoreline trajectory: forced regression(forestepping and downstepping at the shoreline, inter-preted as the result of negative accommodation); nor-mal regression (forestepping and upstepping at theshoreline, interpreted as the result of positive and over-filled accommodation); and transgression (backstep-ping at the shoreline, interpreted as the result of posi-
tive and underfilled accommodation) (Fig. 3). In thecase of stratigraphic cycles that include a stage offorced regression as well as a stage of transgression,normal regressions can occur during both lowstandsand highstands of relative sea level and, consequently,the products may be classified as ʻlowstandʼ and ʻhigh-standʼ deposits (Fig. 4). Forced regressions, normal re-gressions and transgressions can be observed in mod-ern depositional settings (Fig. 5), as well as in outcrop(Fig. 6) and subsurface (Figs. 7, 8). In addition to re-gressive or transgressive shorelines, stable shorelinesmay also develop where accommodation and sedimentsupply are in balance. However, as accommodation andsediment supply are controlled independently by dif-ferent mechanisms, stable shorelines are unlikely to be maintained for any significant periods of time. Theimportance of shoreline trajectories, whether or notwithin a sequence stratigraphic context, was reiteratedby Helland-Hansen and Hampson (2009).
Shoreline-independent stacking patterns may devel-op in areas remote from coeval shorelines where sedi-mentation processes are unaffected by shoreline shifts.Such stratal stacking patterns may be defined based onchanges in depositional style that can be correlated re-
O. Catuneanu et al.178
Lowstand normal regression (accelerating RSL rise)
Highstand normal regression (decelerating RSL rise)
shoreline trajectory (concave up)
shoreline trajectory (convex up)
The rates of progradation decrease with time,the rates of aggradation increase with time.
The rates of progradation increase with time,the rates of aggradation decrease with time.
RSL
RSLTopset
Topset
Fig. 4. Stratal stacking patterns of ʻlowstandʼ and ʻhighstandʼ normal regressions (modified from Catuneanu 2006). In bothcases progradation is driven by sediment supply (overfilled accommodation at the shoreline). Lowstand normal regressionsrecord a change in depositional trends from dominantly progradational to dominantly aggradational (concave up shorelinetrajectory). In contrast, highstand normal regressions record a change from aggradation to progradation (convex up shore-line trajectory). Abbreviation: RSL – relative sea level.

Sequence Stratigraphy: Methodology and Nomenclature 179
Arabian Sea
Highlands
Delta Plain
Indus River
Alluvial Plain
Mainland Florida
Gulf of Mexico
Lagoon
Barrierisland
A
B
C
Delta Plain
Fluvial Incision
FC
Delta plain to fluvial topset
Prodelta to delta front foreset
A
B
Forced regressive delta front
Transgressiveestuary-mouth
complex
WRS/SU
TRS/SU
C
Fig. 5. Types of shoreline trajectory: present-day environ-ment. A – forced regression (Svalbard; photograph courtesyof Jean-Loup Rubino); B – normal regression (Indus delta);C – transgression (Florida). See Figure 3 for stratal stackingpatterns associated with these types of shoreline trajectory.
Fig. 6. Types of shoreline trajectory: outcrop examples. A – forced regression (Panther Tongue, Upper Cretaceous,Utah); B – normal regression (Ferron delta, Upper Creta-ceous, Utah); C – transgression (Muddy Formation, UpperCretaceous, Colorado). Abbreviations: WRS – wave-ravine-ment surface; FC – facies contact; SU – subaerial unconfor-mity; TRS – tidal-ravinement surface.

O. Catuneanu et al.180
WRS
FC
20 m 20 m
NR
FR
NR
NR
NR
NR
TT
T
T
T
GRGRGR RRR
10 m
Estuarymouth
complex
Shelf
Shelf Shelf
Shelf
Fluvial
Shelf
Shoreface Shoreface
Shelf
MFS
TRS/SU
SU
RSME
WRS
WRS
A B C
one km
100 msec
MRSMFS
CC**
CC*
SU
FR
FR
NR
T
Fig. 7. Types of shoreline trajectory: well log examples. A – forced regression (sharp-based shoreface; Cardium Formation,Upper Cretaceous, Alberta); B – normal regression (gradationally based shoreface; Cardium Formation, Upper Cretaceous,Alberta); C – transgression (Colorado Group, Lower Cretaceous, Alberta). Abbreviations: GR – gamma ray log; R – resis-tivity log; FR – forced regressive; NR – normal regressive; T – transgressive; WRS – wave-ravinement surface; SU – sub-aerial unconformity; RSME – regressive surface of marine erosion; FC – facies contact; TRS – tidal-ravinement surface;MFS – maximum flooding surface.
Fig. 8. Types of shoreline trajectory: seismic example (Plio-Pleistocene to Holocene, Gulf of Mexico; modified from Posa-mentier and Kolla 2003). Stratal terminations: green arrows – offlap; yellow arrows – downlap; blue arrows – onlap. Ab-breviations: FR – forced regression; NR – normal regression; T – transgression; SU – subaerial unconformity; CC* – cor-relative conformity in the sense of Posamentier and Allen (1999) (= basal surface of forced regression); CC** – correlativeconformity in the sense of Hunt and Tucker (1992); MRS – maximum regressive surface; MFS – maximum flooding sur-face.

gionally. Distinct depositional styles are characterizedby specific types or combinations of depositional ele-ments. In upstream-controlled fluvial settings, stylesmay be defined by the degree of amalgamation of channel deposits, which may reflect syn-depositionalconditions of available fluvial accommodation (i. e.,low- versus high-accommodation settings; e. g., Shan-ley and McCabe 1994; Boyd et al. 2000; Figs. 9, 10). Indeep-water settings, depositional styles may be definedby the degree of channel confinement, which may re-flect changes in accommodation on the shelf and/orvariations in sediment supply in the staging area (e. g.,Posamentier and Kolla 2003; Catuneanu et al. 2009;Figs. 11, 12). Some of these deep-water stacking pat-terns may be genetically related to shoreline trajecto-ries, but there are also cases where offshore sub-basintectonism may generate stacking patterns in a mannerthat is independent of changes in accommodation at theshoreline (e. g., Fiduk et al. 1999). The pattern of sub-marine fan sedimentation is also strongly dependent onthe width of the continental shelf, the configuration ofthe continental margin, and their influence on sedimentsupply to the deep-water setting (e. g., Steel and Olsen2002; Porebski and Steel 2006).
Sequence Stratigraphy: Methodology and Nomenclature 181
A
B
1000
800
600
400
200
90 150
GR
(API)
LLD
2 100(ohm.m)
De
po
sitio
na
l S
eq
ue
nce
LA
ST
HA
ST
LAST
HAST
LAST
amalgamatedchannel fills
dominantlyoverbank facies
subaerialunconformity
(m)
Fig. 9. Stratal stacking patterns in upstream-controlled fluvial systems. A – channel-dominated succession (low-accom-modation setting: Katberg Formation, Early Triassic, Karoo Basin); B – overbank-dominated succession (high-accommo-dation setting: Burgersdorp Formation, Early-Middle Triassic, Karoo Basin).
Fig. 10. Stratal stacking patterns of a fully fluvial succes-sion in an overfilled foreland basin (Miocene, Assam Basin,India; from Catuneanu et al. 2009; well logs courtesy of theOil and Natural Gas Corporation, India). The fluvial succes-sion consists of depositional sequences bounded by subaer-ial unconformities, which may be subdivided into low- andhigh-accommodation systems tracts based on changes in depositional style that can be correlated regionally.

On carbonate platforms and ramps, sediment supplyis to a large part controlled by the ecology of the car-bonate-producing organisms, the contribution of no-directly biogenic particles such as lime mud and ooids,and by currents and waves that distribute the sediment.The stacking patterns are defined by deepening-up, aggrading, and shallowing-up facies trends that maycorrelate with the shoreline shifts or develop inde-pendently (e. g., give-up, keep-up, catch-up situationsof Kendall and Schlager 1981).
Whether or not their origin can be linked to shorelinetrajectories, all types of stratal stacking patterns reflectthe interplay of the same two fundamental variables,namely accommodation and sediment supply. Depositsdefined by specific stratal stacking patterns form thebasic constituents of any sequence stratigraphic unit,from sequence to systems tract and parasequence. Se-quences, systems tracts, and parasequences may in-clude both shoreline-related and shoreline-independentdeposits and associated stacking patterns.
3. Allogenic versus autogenic controls
The sequence stratigraphic framework records the re-sponse to both allogenic and autogenic controls onsedimentation. Allogenic processes are external to thesedimentary unit, and typically record the effects ofeustatic fluctuations, tectonism, and climate change.These processes represent the main control on accom-modation.
Within individual depositional environments, auto-genic processes of self organization towards the most energy-efficient state of equilibrium may generate strati-graphic signatures similar to those produced by allogenicmechanisms. Such processes may include channel avul-sion, delta lobe switching without changes in the rates ofsediment supply or accommodation, the generation ofstepped surfaces during transgression, and the generationof multiple incisions during constant rates of negative accommodation (Muto and Steel 2001a, b, 2004).
Autogenic mechanisms may modulate the internalarchitecture of facies successions and depositional elements within the larger scale allogenic-controlledframeworks. The relevance of allogenic controls to thesequence stratigraphic architecture increases with thevertical and/or lateral scale of observation, whereasthe importance of autogenic processes becomes moreevident at smaller scales of observation. Sequencesand systems tracts are commonly attributed to allo-genic controls, whereas parasequences may be gener-ated by either allogenic or autogenic mechanisms.
O. Catuneanu et al.182
A
A
B
B
B
CC**
CC**
Fig. 11. Stratal stacking patterns in a deep-water setting(Triassic, The Dolomites, Italian Alps). A – splay-dominat-ed succession of weakly confined and amalgamated channeldeposits; B – overbank deposits of a leveed channel-domi-nated succession; CC** – correlative conformity sensu Huntand Tucker (1992), marking the change from siliciclasticsediment (relative sea-level fall: carbonate factory switchedoff) to carbonate sediment (relative sea-level rise: carbonatefactory switched on).

Sequence stratigraphic units: Sequences
1. Definition
A ʻsequenceʼ was originally defined as an unconformi-ty-bounded stratigraphic unit (Sloss et al., 1949; Sloss1963). The concept of sequence was subsequently re-vised to include “a relatively conformable successionof genetically related strata bounded by unconformitiesor their correlative conformities” (Mitchum 1977).
The continued development of the sequence strati-graphic paradigm in the 1980s and 1990s resulted in a diversification of approaches and the definition of several types of sequence (Figs. 1, 2): depositional sequences, bounded by subaerial unconformities andtheir marine correlative conformities (e. g., Vail 1987;Posamentier et al. 1988; Van Wagoner et al. 1988,1990; Vail et al. 1991; Hunt and Tucker 1992); genet-ic stratigraphic sequences, bounded by maximumflooding surfaces (Galloway 1989); and transgressive-regressive (T-R) sequences, also referred to as T-R cy-cles, bounded by maximum regressive surfaces (John-son and Murphy 1984; Johnson et al. 1985). The T-Rsequence was subsequently redefined by Embry andJohannessen (1992) as a unit bounded by compositesurfaces that include the subaerial unconformity andthe marine portion of the maximum regressive surface.
The existence of several types of sequence requires a definition that is broad enough to accommodate all choices of approach. Every type of sequence may include unconformities within the sequence (Fig. 2): depositional sequences and transgressive-regressive(T-R) sequences can include marine surfaces of non-deposition or erosion that can form during times ofmaximum shoreline transgression (i. e., unconformablemaximum flooding surfaces); genetic stratigraphic se-quences can contain surfaces that record stages of sub-aerial hiatus and erosion (i. e., subaerial unconformi-ties). The potential presence of unconformities within asequence indicates that the succession of strata com-prising a sequence cannot always be described as ʻrela-tively conformableʼ or ʻgenetically relatedʼ. For thisreason, the concept of sequence was redefined as “a suc-cession of strata deposited during a full cycle of changein accommodation or sediment supply” (Catuneanu etal. 2009). This definition is generic, model-indepen-dent, and embraces all types of sequence that may de-velop at any spatial or temporal scale.
The specification that a sequence corresponds to afull stratigraphic cycle is required to separate a se-quence from component systems tracts. All existing sequence stratigraphic schemes (Figs. 1, 2) incorporatea full cycle of change in accommodation or sedimentsupply in the definition of a sequence, because the be-ginning and the end of one cycle is marked by the same
Sequence Stratigraphy: Methodology and Nomenclature 183
Sediment waves Leveed channel
Frontal splayMudflow deposits
50 ms1 km
CC*
CC**
Fig. 12. Stratal stacking patterns in a deep-water setting (Plio-Pleistocene to Holocene, Gulf of Mexico; from Posamentierand Kolla 2003). CC* – correlative conformity sensu Posamentier and Allen (1999); CC** – correlative conformity sensuHunt and Tucker (1992).
type of ʻeventʼ: the onset of relative sea-level fall; theend of relative sea-level fall; the end of regression; orthe end of transgression (Fig. 2). In contrast, the bound-aries of any systems tract correspond to differentʻevents’ of the relative sea-level cycle (Fig. 2).
2. Types of sequence
Depositional sequencesA depositional sequence forms during a full cycle ofchange in accommodation, which involves both an in-crease (positive) and decrease (negative) in the spaceavailable for sediments to fill. The formation of depo-sitional sequence boundaries requires periods of nega-tive accommodation. The dependency of depositionalsequences on negative accommodation (whether incontinental or marine settings), in addition to the na-ture of bounding surfaces, separates depositional se-quences from other types of sequence stratigraphicunit, the formation of which may not require negativeaccommodation (i. e., parasequences, genetic strati-graphic sequences, T-R sequences in the sense of John-son and Murphy (1984), and systems tracts that formduring positive accommodation).
Genetic stratigraphic sequencesThe formation of genetic stratigraphic sequences de-pends on the development of maximum flooding sur-faces, which form during times of positive accommoda-tion. A genetic stratigraphic sequence may form duringa full cycle of change in accommodation, as in the caseof a depositional sequence, but it may also form duringperiods of positive accommodation in response to fluc-tuations in the rates of accommodation creation and/orsediment supply. Consequently, a genetic stratigraphicsequence may or may not include an internal subaerialunconformity, depending on whether or not the corre-sponding cycle includes a stage of negative accommo-dation. Maximum flooding surfaces may include un-conformable portions expressed as “hiatal surfaces pre-served as marine unconformities” (Galloway 1989).Such unconformities may develop on the shelf and slopebecause of sediment starvation, shelf-edge instabilityand erosion during transgression. Where present, un-conformable maximum flooding surfaces are includedwithin but do not constitute the bounding surfaces defin-ing depositional sequences and T-R sequences.
Transgressive-regressive (T-R) sequencesThe original T-R sequence of Johnson and Murphy(1984) depends on the development of maximum re-
gressive surfaces, which form during times of positiveaccommodation. As in the case of genetic stratigraph-ic sequences, this type of sequence may form during afull cycle of change in accommodation, but it may alsoform during periods of positive accommodation as aresult of fluctuations in the rates of accommodationand/or sediment supply. By contrast, the T-R sequenceof Embry and Johannessen (1992) is dependent onnegative accommodation, as it requires a subaerial unconformity at the sequence boundary. As the maxi-mum regressive surface is younger than the subaerialunconformity, the marine portion of the maximum re-gressive surface may or may not meet with the basin-ward termination of the subaerial unconformity (Em-bry and Johannessen 1992). The temporal and spatialoffset between the two portions of the sequenceboundary is increasingly evident at larger scales of observation (Catuneanu et al. 2009).
Sequence stratigraphic units: Systems tracts
1. Definition
A systems tract is “a linkage of contemporaneous depositional systems, forming the subdivision of a se-quence” (Brown and Fisher 1977). The definition of asystems tract is independent of spatial and temporalscales. The internal architecture of a systems tract mayvary greatly with the scale of observation, from a suc-cession of facies (e. g., in the case of high-frequencysequences driven by orbital forcing) to a parasequenceset or a set of higher frequency sequences.
A systems tract consists of a relatively conformablesuccession of genetically related strata bounded byconformable or unconformable sequence stratigraphicsurfaces. As discussed by Catuneanu et al. (2009), theoriginal definition of a sequence provided by Mitchum(1977) is more applicable to the concept of systemstracts than it is to the concept of sequence. This is because sequences may include internal unconformi-ties, whereas such unconformities, where present, arealways placed at the boundary between systems tracts.This discussion considers sequences, systems tractsand bounding surfaces that develop at the same hierar-chical level: discontinuities of a higher frequency (i. e.,lower hierarchical rank) can occur within a sequence or systems tract without violating the above definitions.
Systems tracts are interpreted on the basis of stratalstacking patterns, position within the sequence, and
O. Catuneanu et al.184
types of bounding surface (Van Wagoner et al. 1987,1988, 1990; Posamentier et al. 1988; Van Wagoner1995; Posamentier and Allen 1999). Systems tractsmay be either shoreline-related, where their origin canbe linked to particular types of shoreline trajectory, orshoreline-independent, where a genetic link to coevalshorelines cannot be determined.
2. Shoreline-related systems tracts
Shoreline-related systems tracts consist of correlatabledepositional systems that are genetically related to spe-cific types of shoreline trajectory (i. e., forced regres-sion, normal regression, transgression). These systemstracts may be observed at different scales, and are de-fined by distinct stratal stacking patterns (Figs. 3, 5–8).
The systems tract nomenclature applied to forced re-gressive deposits includes ʻearly lowstand’, ʻlate high-stand’, ʻforced-regressive wedgeʼ, and ʻfalling-stageʼ.The systems tract nomenclature applied to lowstandnormal regressive deposits includes ̒ late lowstand’ andʻlowstand’, whereas highstand normal regressive de-posits are designated as ̒ highstand’ or ̒ early highstand’systems tracts. In all sequence stratigraphic schemes,the transgressive deposits comprise the transgressivesystems tract (Fig. 2).
Shoreline-related systems tracts are commonly in-terpreted to form during specific phases of the relativesea-level cycle (Posamentier et al. 1988; Hunt andTucker 1992; Posamentier and Allen 1999; Catuneanu2006; Catuneanu et al. 2009; Fig. 2). Five of these systems tracts are presented below.
Falling-Stage Systems Tract (FSST)The FSST includes all the regressive deposits that ac-cumulate after the onset of a relative sea-level fall andbefore the start of the next relative sea-level rise. TheFSST is the product of a forced regression. The FSSTlies directly on the sequence boundary sensu Posamen-tier and Allen (1999) and is capped by the overlyingLowstand Systems Tract (LST) sediments. However,Hunt and Tucker (1992) placed the sequence boundaryabove the FSST, since in their view the boundary heremarked the termination of one cycle of deposition andthe start of another. A variety of parasequence stackingpatterns can be produced, with ʻattachedʼ or ʻdetachedʼarchitecture, depending on the gradient of the deposi-tional profile, the rate of sediment supply, and the rateof relative sea-level fall (Posamentier and Morris2000). The characteristics of the FSST were set out byHunt and Tucker (1992), Nummedal (1992) and Ains -
worth (1994). The terminology applied to this systemstract varied from ʻforced regressive wedgeʼ (Hunt andTucker 1992) to ʻfalling sea-levelʼ (Nummedal 1992)and ʻfalling-stageʼ (Ainsworth 1994). The simplerʻfalling-stageʼ has been generally adopted by more re-cent work (e. g., Plint and Nummedal 2000; Catuneanu2006). This systems tract has also been termed the Ear-ly Lowstand Systems Tract (Posamentier et al. 1988;Posamentier and Allen 1999).
The fall in relative sea level is evidenced by the erosion of the subaerially exposed sediment surfaceupdip of the coastline at the end of forced regression,and the formation of a diachronous subaerial uncon-formity that caps the Highstand Systems Tract (HST).The subaerial unconformity may be onlapped by flu-vial deposits that belong to the lowstand or the trans-gressive systems tracts. The subaerial unconformitymay also be reworked by a time-transgressive marineravinement surface overlain by a sediment lag.
Lowstand Systems Tract (LST)The LST includes deposits that accumulate after theonset of relative sea-level rise, during normal regres-sion, on top of the FSST and the corresponding up-dip subaerial unconformity. Stacking patterns exhibitforestepping, aggrading clinoforms that (in siliciclas-tic systems) thicken downdip, and a topset of fluvial,coastal plain and/or delta plain deposits. LST sedi-ments often fill or partially infill incised valleys thatwere cut into the HST, and other earlier deposits, during forced regression. This systems tract has alsobeen termed the Late Lowstand Systems Tract (Posa-mentier et al. 1988; Posamentier and Allen 1999) orthe Lowstand Prograding Wedge Systems Tract (Huntand Tucker 1992).
In earlier papers the ʻShelf-margin Systems Tractʼwas recognized as the lowermost systems tract associ-ated with a ʻtype 2ʼ sequence boundary (Posamentieret al. 1988). With the abandonment of the distinctionbetween types 1 and 2 sequence boundaries, this termis now redundant (Posamentier and Allen 1999; Catu -neanu 2006); these deposits are now considered to bepart of the LST.
Transgressive Systems Tract (TST)The TST comprises the deposits that accumulatedfrom the onset of transgression until the time of max-imum transgression of the coast, just prior to the re-newed regression of the HST. The TST lies directly onthe maximum regressive surface formed at the end ofregression (also termed a ʻtransgressive surfaceʼ) and
Sequence Stratigraphy: Methodology and Nomenclature 185

is overlain by the ʻmaximum flooding surfaceʼ (MFS)formed when marine sediments reach their most land-ward position. Stacking patterns exhibit backstepping,onlapping, retrogradational clinoforms that (in silici-clastic systems) thicken landward. In cases wherethere is a high sediment supply the parasequences maybe aggradational.
Highstand Systems Tract (HST)The HST includes the progradational deposits thatform when sediment accumulation rates exceed therate of increase in accommodation during the latestages of relative sea-level rise (Fig. 2). The HST liesdirectly on the MFS formed when marine sedimentsreached their most landward position. This systemstract is capped by the subaerial unconformity and itscorrelative conformity sensu Posamentier and Allen(1999). Stacking patterns exhibit prograding and ag-grading clinoforms that commonly thin downdip,capped by a topset of fluvial, coastal plain and/or deltaplain deposits.
Regressive System Tract (RST)The RST lies above a TST and is overlain by the ini-tial transgressive surface of the overlying TST. Thecomplete sequence is known as a Transgressive-Re-gressive (T-R) Sequence (Johnson and Murphy 1984;Embry and Johannessen 1992). The sediments of thissystems tract include the HST, FSST and LST systemstracts defined above.
There are cases where the data available are insuffi-cient to differentiate between HST, FSST an HST sys-tems tracts. In such cases the usage of the RegressiveSystems Tract is justified. However, where permittedby data, the differentiation between the three types ofregressive deposits (highstand, falling-stage, lowstand)is recommended because they refer to different stratalstacking patterns; are characterized by different sedi-ment dispersal patterns within the basin; and conse-quently are associated with different petroleum plays.The last aspect relates to one of the most significant ap-plications of sequence stratigraphy, which is to increasethe resolution of stratigraphic frameworks that can op-timize petroleum exploration and production develop-ment.
3. Shoreline-independent systems tracts
Shoreline-independent systems tracts are stratigraphicunits that form the subdivisions of sequences in areaswhere sedimentation processes are unrelated to shore-
line shifts. These systems tracts are defined by specif-ic stratal stacking patterns that can be recognized andcorrelated regionally, without reference to shorelinetrajectories (Figs. 9–12). In upstream-controlled flu-vial settings, fluvial accommodation may change in-dependently of changes in accommodation at the near-est shoreline and create sequences and componentlow- and high-accommodation systems tracts (e. g.,Shanley and McCabe 1994; Boyd et al. 2000). Shore-line-independent systems tracts may also be mapped indeep-water settings controlled by sub-basin tectonism(e. g., Fiduk et al. 1999), but no nomenclature has beenproposed for these situations. The timing of shoreline-independent sequences and systems tracts is common-ly offset relative to that of shoreline-controlled se-quence stratigraphic units and bounding surfaces (e. g.,Blum and Tornqvist 2000).
Sequence stratigraphic units: Parasequences
1. Definition
A parasequence in its original definition (Van Wagoneret al. 1988, 1990) is an upward-shallowing successionof facies bounded by marine flooding surfaces. A ma-rine flooding surface is a lithological discontinuityacross which there is an abrupt shift of facies that com-monly indicates an abrupt increase in water depth.
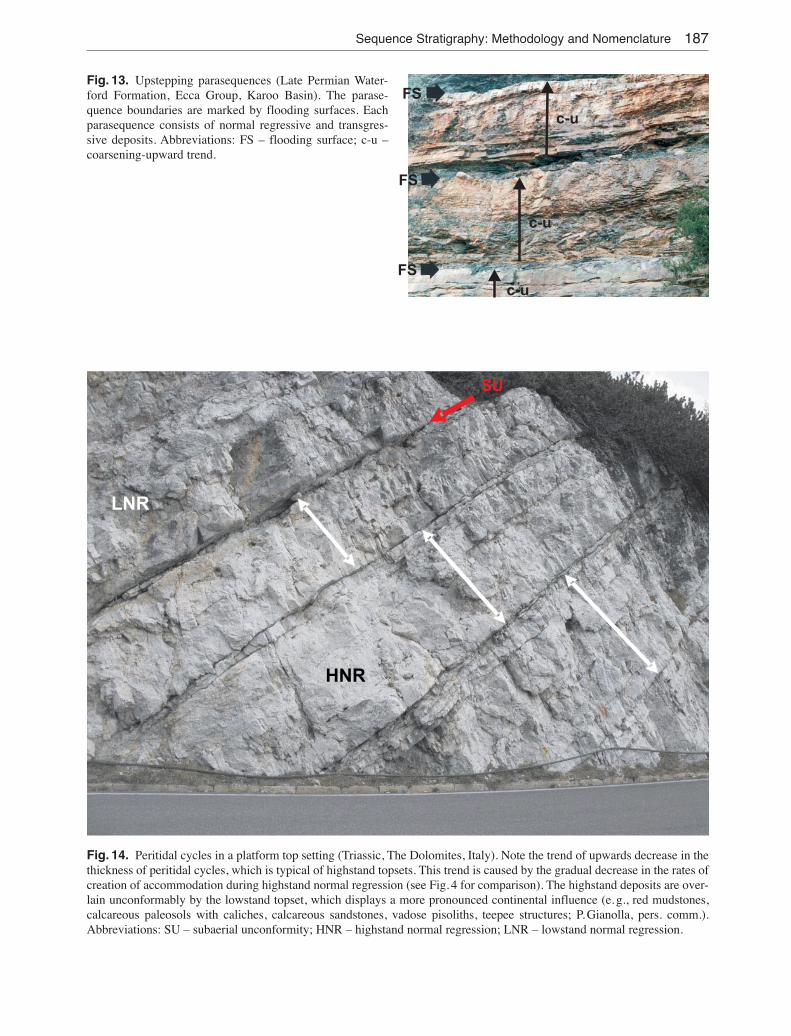
The concept was originally defined, and is com-monly applied, within the context of siliciclasticcoastal to shallow-water settings, where parasequen -ces correspond to individual prograding sediment bod-ies (Fig. 13). In carbonate settings, a parasequence cor-responds to a succession of facies commonly contain-ing a lag deposit or thin deepening interval followedby a thicker shallowing-upward part, as for example inperitidal cycles (Fig. 14).
In contrast to sequences and systems tracts, whichmay potentially be mapped across an entire sedimen-tary basin from fluvial into the deep-water setting,parasequences are geographically restricted to thecoastal to shallow-water areas where marine floodingsurfaces may form (Posamentier and Allen 1999). Inthe case of carbonate settings, peritidal cycles can insome cases be correlated into slope and basinal facies(e. g., Chen and Tucker 2003). For this reason, it hasbeen proposed that ʻparasequenceʼ be expanded to in-clude all regional meter-scale cycles, whether or notthey are bounded by flooding surfaces (Spence and
O. Catuneanu et al.186
Sequence Stratigraphy: Methodology and Nomenclature 187
FS
FS
FS
c-u
c-u
c-u
SU
LNR
HNR
Fig. 14. Peritidal cycles in a platform top setting (Triassic, The Dolomites, Italy). Note the trend of upwards decrease in thethickness of peritidal cycles, which is typical of highstand topsets. This trend is caused by the gradual decrease in the rates ofcreation of accommodation during highstand normal regression (see Fig. 4 for comparison). The highstand deposits are over-lain unconformably by the lowstand topset, which displays a more pronounced continental influence (e. g., red mudstones,calcareous paleosols with caliches, calcareous sandstones, vadose pisoliths, teepee structures; P. Gianolla, pers. comm.). Abbreviations: SU – subaerial unconformity; HNR – highstand normal regression; LNR – lowstand normal regression.
Fig. 13. Upstepping parasequences (Late Permian Water-ford Formation, Ecca Group, Karoo Basin). The parase-quence boundaries are marked by flooding surfaces. Eachparasequence consists of normal regressive and transgres-sive deposits. Abbreviations: FS – flooding surface; c-u –coarsening-upward trend.

Tucker 2007; Tucker and Garland 2010). However,following the principle that a sequence stratigraphicunit is defined by specific bounding surfaces, mostpractitioners favor restricting the concept of parase-quence to a unit bounded by marine flooding surfaces,in agreement with the original definition of Van Wag-oner et al. (1988, 1990).
2. Scale and stacking patterns
Parasequences are commonly nested within largerscale (higher rank) sequences and systems tracts.However, scale is not sufficient to differentiate parase-quences from sequences. For example, high-frequen-cy sequences controlled by orbital forcing may devel-op at scales comparable to, or even smaller than, thoseof many parasequences (e. g., Strasser et al. 1999;Fielding et al. 2008; Tucker et al. 2009). As such, evencycles as thin as a meter can sometimes be referred toas sequences and be described and interpreted in termsof sequence stratigraphic surfaces and systems tracts(e. g., Posamentier et al. 1992a; Strasser et al. 1999;Tucker et al. 2009). We recommend the use of the sequence stratigraphic methodology to the analysis of
any small, meter-scale cycles, as long as they displaydepositional trends that afford the recognition of sys-tems tracts and diagnostic bounding surfaces.
Parasequences consist of normal regressive, trans-gressive and forced regressive types of deposit, anddisplay various stacking patterns. Parasequences maybe stacked in an upstepping succession, in which casethey consist of normal regressive and transgressive deposits that accumulate during a period of positiveaccommodation in response to variations in the ratesof accommodation and/or sediment supply (Fig. 13).Upstepping parasequences may either be forestepping(Fig. 15) or backstepping (Fig. 16). Parasequencesmay also be stacked in a downstepping succession, inwhich case they consist primarily of forced regressivedeposits that accumulate during a period of overallnegative accommodation (Fig. 17). However, negativeaccommodation does not occur during the time of for-mation of the parasequence boundary. The pattern ofstacking of parasequences defines longer term normalregressions (Fig. 15), forced regressions (Fig. 17) ortransgressions (Fig. 16), which correspond to shore-line-related systems tracts of higher hierarchical rank(Fig. 3).
O. Catuneanu et al.188
SENW
Surfaces
3rd order MFS4th order MRS3rd order WRSfacies contact
coalcoal
25 m
Facies
regressive marine4th order MFS
transgressive marinefluvial
Fig. 15. Dip-oriented cross-section through the marine facies of Bearpaw Formation, based on gamma-ray well logs (Up-per Cretaceous, Alberta; modified from Catuneanu 2006). The section is approximately 30 km long. The internal architec-ture of the marine unit shows upstepping and prograding lobes (parasequences), which downlap the main maximum flood-ing surface of the Bearpaw seaway. Each prograding lobe consists of normal regressive and transgressive deposits. The pat-tern of stacking of parasequences defines a long-term normal regression. Abbreviations: MFS – maximum flooding surface;MRS – maximum regressive surface; WRS – wave ravinement surface.

Sequence stratigraphic surfaces
1. Definition
Sequence stratigraphic surfaces mark changes in stratalstacking pattern. They are surfaces that can serve, atleast in part, as systems tract boundaries.
Sequence stratigraphic surfaces may correspond toʻconceptualʼ horizons (i. e., without a lithologic con-
trast) or physical surfaces, depending on their outcropexpression (e. g., Carter et al. 1998). Unconformablesequence stratigraphic surfaces typically have a phys-ical expression. Any conformable sequence strati-graphic surface may be a ʻconceptualʼ horizon or anobservable surface with physical attributes, dependingon local conditions of deposition or preservation.
A set of seven sequence stratigraphic surfaces, in-cluding two types of correlative conformities, is in
Sequence Stratigraphy: Methodology and Nomenclature 189
30 m
West East
Datum
(MFS)
fluvial facies (main Almond) marine sandstone (upper Almond) marine shale (Lewis)
GR RES GR RES GR RES GR RES GR RES GR RES
1 km
1 km
40 m
40 m
3. Present-day sea level
2
2
1. Pleistocene highstand
2 = Pleistocene lowstand
Highstand prismDetached forced regressive wedge
Fig. 16. Regional well-log cross-section of the Almond Formation in the Washakie Basin, Wyoming. The backsteppingstacking pattern of parasequences records the overall transgression of the Western Interior Seaway during the Campanian.Each individual parasequence consists of normal regressive and transgressive deposits. The cross-section is approximately65 km long. Well logs shown: gamma ray (GR) and resistivity (RES). Modified from Weimer (1966), Martinsen and Chris-tensen (1992) and C. Bartberger (pers. comm.).
Fig. 17. Cross-section through the Pleistocene deposits of the Rhône shelf (offshore southeastern France), based on a re-gional seismic line. The three unconformity-bounded depositional sequences correspond to high-frequency glacial-inter-glacial cycles. Each sequence consists primarily of forced regressive deposits, which show a lateral stacking of downstep-ping parasequences. Modified from Posamentier et al. (1992b).

widespread use. Criteria for mapping each type of se-quence stratigraphic surface are summarized in Catu -neanu (2006).
2. Subaerial unconformity
The subaerial unconformity (Sloss et al. 1949) is anunconformity that forms under subaerial conditions asa result of fluvial erosion or bypass, pedogenesis, winddegradation, or dissolution and karstification. Alterna-tive terms include: ʻlowstand unconformityʼ (Schlager1992), ̒ regressive surface of fluvial erosionʼ (Plint andNummedal 2000), and ʻfluvial entrenchment/incisionsurfaceʼ (Galloway 2004).
Subaerial unconformities may form during forcedregression, within the downstream-controlled portionof fluvial systems (e. g., Posamentier et al. 1988); during transgression accompanied by coastal erosion(e. g., Leckie 1994); during periods of negative fluvialaccommodation within the upstream-controlled por-tion of fluvial systems (e. g., Blum 1994); or duringrelative sea-level fall exposing carbonate platformsand reefs to karstification.
3. Correlative conformities
The correlative conformity in the sense of Posamentieret al. (1988) is a marine stratigraphic surface thatmarks the change in stratal stacking patterns fromhighstand normal regression to forced regression. It isthe paleo-seafloor at the onset of forced regression. Analternative term is ʻbasal surface of forced regressionʼ(Hunt and Tucker 1992).
The correlative conformity in the sense of Hunt andTucker (1992) is a marine stratigraphic surface thatmarks the change in stratal stacking patterns fromforced regression to lowstand normal regression. Ittherefore records the paleo-seafloor at the end offorced regression.
4. Maximum flooding surface
The maximum flooding surface (Frazier 1974; Posa-mentier et al. 1988; Van Wagoner et al. 1988; Gal-loway 1989) is a stratigraphic surface that marks achange in stratal stacking patterns from transgressionto highstand normal regression. It is the paleo-seafloorat the end of transgression, and its correlative surfacewithin the nonmarine setting. Alternative terms in-clude: ʻfinal transgressive surfaceʼ (Nummedal et al.1993), ʻsurface of maximum transgressionʼ (Helland-
Hansen and Gjelberg 1994), and ʻmaximum transgres-sive surfaceʼ (Helland-Hansen and Martinsen 1996).Sometimes the switch in depositional trend from ret-rogradation to progradation is marked by a zone of(commonly condensed) deep-water facies rather thana unique surface and this can lend itself to ambiguityin the placing of this surface in the rock succession(Carter et al. 1998). The maximum flooding surface isoften expressed as a downlap surface in seismic strati-graphic terms, as it is typically downlapped by theoverlying highstand clinoforms which record progra-dation.
5. Maximum regressive surface
The maximum regressive surface (Helland-Hansen andMartinsen 1996) is a stratigraphic surface that marks achange in stratal stacking patterns from lowstand nor-mal regression to transgression. It is the paleo-seafloorat the end of lowstand normal regression, and its cor-relative surface within the nonmarine setting. Alterna-tive terms include: ʻtransgressive surfaceʼ (Posamen-tier and Vail 1988), ̒ top of lowstand surfaceʼ (Vail et al.1991), ʻinitial transgressive surfaceʼ (Nummedal et al.1993), ʻsurface of maximum regressionʼ (Helland-Hansen and Gjelberg 1994; Mellere and Steel 1995),ʻconformable transgressive surfaceʼ (Embry 1995), andʻmaximum progradation surfaceʼ (Emery and Myers1996). The term ʻmaximum regressive surfaceʼ is rec-ommended where emphasis is placed on the end of regression, and the term ʻtransgressive surfaceʼ is rec-ommended where emphasis is placed on the onset oftransgression.
6. Transgressive ravinement surfaces
The transgressive ravinement surfaces (Nummedaland Swift 1987) are erosional surfaces that form bymeans of wave scouring (i. e., wave-ravinement sur-faces; Swift 1975) or tidal scouring (i. e., tidal-ravine-ment surfaces; Allen and Posamentier 1993) duringtransgression in coastal to shallow-water environ-ments. Both types of transgressive ravinement sur-faces are diachronous, younging towards the basinmargin (Numme dal and Swift 1987). Their basinwardtermination merges into the maximum regressive sur-face; their landward termination merges into the max-imum flooding surface. An alternative term for eithertype of transgressive ravinement surface is the ʻtrans-gressive surface of erosionʼ (Posamentier and Vail1988).
O. Catuneanu et al.190

7. Regressive surface of marine erosion
The regressive surface of marine erosion (Plint 1988)is an erosional surface that forms typically by meansof wave scouring during forced regression in wave-dominated shallow-water settings due to the loweringof the wave base relative to the seafloor. However, thisscour may also form under conditions of high-energynormal regression, where the shoreline trajectory ishorizontal (i. e., progradation during a stillstand of rel-ative sea level) or rising at a low angle (i. e., prograda-tion during low rates of relative sea-level rise; Hel-land-Hansen and Martinsen 1996). The regressive sur-face of marine erosion is diachronous, younging bas-inward with the rate of shoreline regression. Alterna-tive terms include: ʻregressive ravinement surfaceʼ(Galloway 2001), and ʻregressive wave ravinementʼ(Galloway 2004).
Hierarchy in sequence stratigraphy
The concept of hierarchy refers to the classification ofsequences based on their relative scale and strati-graphic significance (Fig. 18).
Sequence-forming processes have natural periodic-ities. This led to the definition of hierarchy of se-quences based on the duration of cycles (e. g., Vail etal. 1977, 1991; Van Wagoner et al. 1990; Mitchum and
Van Wagoner 1991). However, the rates and periodic-ity of specific processes changed over geologic time,and the time spans of different process-related cyclesoverlap (Miall 2010). These facts raise questions withrespect to the utility of a hierarchical system that isbased on the duration of stratigraphic cycles (e. g.,Carter et al. 1991; Drummond and Wilkinson 1996;Schlager 2010).
The temporal and spatial scales of sequences do notdefine mutually exclusive ranges (Carter et al. 1991).The quantitative study of the duration and thickness of stratigraphic sequences made by Drummond andWilkinson (1996) confirmed that the discrimination ofstratigraphic hierarchies and their rank designationrepresent rather arbitrary subdivisions of an uninter-rupted stratigraphic continuum. Schlager (2004) pro-posed that at least at time scales of 103–106 yr, se-quences and systems tracts are scale-invariant fractalfeatures, even though different hierarchical orders mayinvolve different levels of stratigraphic complexity.The scale-independent, fractal-like nature of strati-graphic cycles has also been demonstrated by meansof laboratory experiments and modelling (e. g., Martinet al. 2009).
These conclusions question whether a universal andreproducible system of hierarchy exists at all in thestratigraphic rock record, and seem particularly truefor tectonically generated sequences. However, Mi-lankovitch-band cycles may give discrete modes in thefrequency distribution of sequence durations, albeitwith slight change over geologic time, if they are notoverprinted by other sequence-forming mechanismsthat may operate within similar temporal scales. If itcan be demonstrated that the hierarchy in the stackingof sequences was induced by orbital cycles, then thepotential for the creation of a high-resolution timescale is presented (e. g., D’Argenio et al. 1997; Stras -ser et al. 2006).
In the absence of precise geochronological control,it is recommended to refer to sequences in a relativesense, such as lower versus higher frequency, or low-er versus higher rank, and interpret their relative strati-graphic significance based on criteria that can be ob-served in the rock record. Such criteria may include thegeographic extent of unconformities, the magnitude ofdownstepping associated with offlap, the depth of flu-vial-incised valleys, or the magnitude of facies changeacross sequence stratigraphic surfaces (e. g., Embry1995; Catuneanu 2006). The applicability of thesefield criteria may vary with the case study, so any ap-proach to hierarchy that is independent of the duration
Sequence Stratigraphy: Methodology and Nomenclature 191
high
rank
(low
freq
uenc
y)
low
rank
(hig
hfreq
uenc
y)
fifth
order
first
order
second
order
third
order
fourth
order
Fig. 18. Diagrammatic representation of the concept of hierarchy. The use of ʻlowʼ versus ʻhighʼ orders is inconsis-tent: some refer to first-order cycles as high order, makingreference to the high position of those cycles within the hierarchy pyramid; others refer to first-order cycles as loworder, making reference to the numbers attributed to each order. For this reason, we recommend the less ambiguousterms of ʻhigh rankʼ versus ʻlow rankʼ.
of cycles may be basin specific. This approach pro-vides an empirical solution to a problem for whichthere is no universally applicable and acceptedmethodology for the definition of a hierarchy.
Model-independent methodology
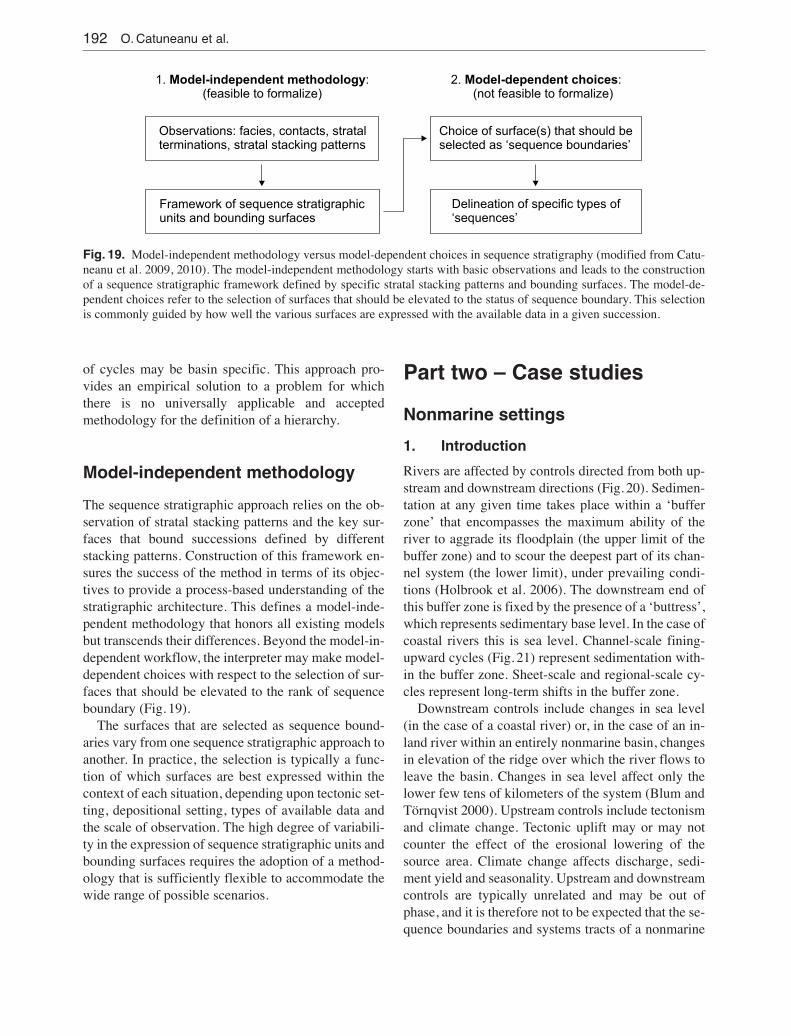
The sequence stratigraphic approach relies on the ob-servation of stratal stacking patterns and the key sur-faces that bound successions defined by differentstacking patterns. Construction of this framework en-sures the success of the method in terms of its objec-tives to provide a process-based understanding of thestratigraphic architecture. This defines a model-inde-pendent methodology that honors all existing modelsbut transcends their differences. Beyond the model-in-dependent workflow, the interpreter may make model-dependent choices with respect to the selection of sur-faces that should be elevated to the rank of sequenceboundary (Fig. 19).
The surfaces that are selected as sequence bound-aries vary from one sequence stratigraphic approach toanother. In practice, the selection is typically a func-tion of which surfaces are best expressed within thecontext of each situation, depending upon tectonic set-ting, depositional setting, types of available data andthe scale of observation. The high degree of variabili-ty in the expression of sequence stratigraphic units andbounding surfaces requires the adoption of a method-ology that is sufficiently flexible to accommodate thewide range of possible scenarios.
Part two – Case studies
Nonmarine settings
1. Introduction
Rivers are affected by controls directed from both up-stream and downstream directions (Fig. 20). Sedimen-tation at any given time takes place within a ʻbufferzoneʼ that encompasses the maximum ability of theriver to aggrade its floodplain (the upper limit of thebuffer zone) and to scour the deepest part of its chan-nel system (the lower limit), under prevailing condi-tions (Holbrook et al. 2006). The downstream end ofthis buffer zone is fixed by the presence of a ̒ buttressʼ,which represents sedimentary base level. In the case ofcoastal rivers this is sea level. Channel-scale fining-upward cycles (Fig. 21) represent sedimentation with-in the buffer zone. Sheet-scale and regional-scale cy-cles represent long-term shifts in the buffer zone.
Downstream controls include changes in sea level(in the case of a coastal river) or, in the case of an in-land river within an entirely nonmarine basin, changesin elevation of the ridge over which the river flows toleave the basin. Changes in sea level affect only thelower few tens of kilometers of the system (Blum andTörnqvist 2000). Upstream controls include tectonismand climate change. Tectonic uplift may or may notcounter the effect of the erosional lowering of thesource area. Climate change affects discharge, sedi-ment yield and seasonality. Upstream and downstreamcontrols are typically unrelated and may be out ofphase, and it is therefore not to be expected that the se-quence boundaries and systems tracts of a nonmarine
O. Catuneanu et al.192
1. :(feasible to formalize)
Model-independent methodology 2. :(not feasible to formalize)
Model-dependent choices
Choice of surface(s) that should beselected as ‘sequence boundaries’
Observations: facies, contacts, stratalterminations, stratal stacking patterns
Delineation of specific types of‘sequences’
Framework of sequence stratigraphicunits and bounding surfaces
Fig. 19. Model-independent methodology versus model-dependent choices in sequence stratigraphy (modified from Catu -neanu et al. 2009, 2010). The model-independent methodology starts with basic observations and leads to the constructionof a sequence stratigraphic framework defined by specific stratal stacking patterns and bounding surfaces. The model-de-pendent choices refer to the selection of surfaces that should be elevated to the status of sequence boundary. This selectionis commonly guided by how well the various surfaces are expressed with the available data in a given succession.

Sequence Stratigraphy: Methodology and Nomenclature 193
Maximum height of floodplain aggradation
Maximum depth of channel scour
buttress
basin subsidence
source-area uplift
climate
BUTTRESS(sea level, lake level,outflow ridge)
BUFFER ZONE(instantaneouspreservationspace)
Relative role of major controls
downstream controls upstream controls
Movement ofbuffer zone by
tectonism
graded profile
HO
LA
DA
DA
SB
LA
SB
SB
Sheet-scale fining-upward cycle (typically ~5-50 m)
Channel/scour-scale fining-upward cycle (approx. = depth of channel)
Element-scale fining-upward cycle (< channel depth)
Regional-scale fining-upward cycle (10s to 100s m)
Fig. 20. The controls on accommodation in nonmarine environments. The concepts of the buttress and the buffer are adapt-ed from Holbrook et al. (2006). The relative roles of the major controls on sedimentation were suggested by Shanley andMcCabe (1994).
Fig. 21. Types of cycle in fluvial deposits. Cycle thickness is the first clue regarding the origin of the cycle, but is not definitive, given the wide range of scales of fluvial channels and depositional systems. Sheet-scale and regional-scale cyclesmay be capable of regional subsurface correlation based on well-log or seismic data, but the smaller-scale cycles have later-al extents of only a few tens to hundreds of metres, and may therefore not be traceable from well to well. Numbers refer tothe classification of nonmarine bounding surfaces by Miall (1996): 4 = surface bounding major bar deposit, 5 = channel-scoursurface, 6 = regional stratigraphic surface, including sequence boundary. Two-letter architectural-element codes include LA =lateral-accretion deposit, DA = downstream-accretion deposit, SB = sand bedform element, HO = hollow element.

system may be readily correlated to those of contem-poraneous marine systems.
A rise in sea level elevates the downstream end of thebuffer zone, creating new accommodation. This maycause transgression and flooding of a river, turning itinto an estuary. With a high sediment load, however, arise in sea level may be accompanied by an increase inaggradation. A lowering of sea level usually leads to asimple extension of the fluvial profile out across a gen-tly dipping continental shelf, with little effect on inlandreaches of the river, except possibly a change in chan-nel style (Miall 1991; Schumm 1993). In the case of anarrow shelf, or where extreme sea-level fall takesplace, lowering of the river mouth causes incision andthe development, over time, of a broad coastal valley.
Many basins are bounded by tectonically activesource areas. Episodic uplift of the source area resultsin a rejuvenation of river systems, and uplift of thebuffer zone, and may also be accompanied by an in-crease in the calibre and quantity of the sediment loadof the river. The ancient record contains many examplesof fluvial profiles that coarsen upward over thicknessesof tens of metres as a result of a progressive increase in stream power and sediment load accompanying tec- tonic uplift (Miall 1996). Cyclic deposits of this typehave been termed ʻtectonic cyclothemsʼ by Blair andBilo deau (1988). Cessation of tectonic activity resultsin gradual erosional reduction of source-area relief andreduction in the quantity and calibre of the sedimentload, yielding regional-scale fining upward cycles.
Cyclic successions are ubiquitous in fluvial de-posits. Their presence reflects the fact that the fluvialenvironment is characterized by processes that tend toreproduce the same depositional results repeatedly.These repeated processes occur over a wide range ofphysical scales and time scales, but many are charac-terized by an initial pulse of high fluvial transport energy, which may be recorded as an erosion surface,followed by deposition of increasingly fine-grainedsediment, with associated hydrodynamic sedimentarystructures that decrease in scale (e. g., dune cross-bed-ding that becomes smaller in amplitude and passes up-ward into ripple cross-lamination). Successions thatshow an upward decrease in grain size, so called ʻfin-ing-upward cyclesʼ are therefore common, and arecommonly identified by ʻbell-shapedʼ or ʻblockyʼwireline-log profiles (Fig. 21).
The basic relationship between base-level changeand the cycle of aggradation and sedimentation in flu-vial systems was first explored by Allen (1974). Mod-ern sequence models have been proposed by Wright
and Marriott (1993) and Shanley and McCabe (1994).Figure 22 is based on these studies. The paragraphs be-low discuss the development of the sedimentary faciesand surfaces illustrated in this diagram, commencingwith the basal sequence boundary.
Forced regressionRivers in humid regions typically are characterized byan increase in discharge and a decrease in the caliberof the sediment load in a downstream direction. Thework required to balance these changes leads to the de-velopment of a smooth longitudinal profile, termed aʻgraded profileʼ, which decreases in slope toward baselevel (the ʻbuttress’ in Fig. 20). Valleys several kilo-metres wide and tens of metres deep may develop dur-ing a fall in base level. Pauses in this fall (e. g., periodsof stable sea level) may allow the valley to widen, andthe evidence of such episodes may be preserved in theform of terrace remnants along the valley walls. Awidespread erosion surface develops across the coastalplain. On the interfluves (the elevated areas betweenmajor river valleys) the rate of erosion may be slow,allowing for the development of widespread soils. Inarid to semi-arid settings, calcrete is commonly devel-oped at such surfaces.
In nonmarine systems, the subaerial unconformitydeveloped during forced regression is commonly takenas the sequence boundary. This surface represents thefinal position of the erosion surface immediately priorto the commencement of a new phase of base-level rise.The deep scour that occurs at the base of major riversmay cause this to form a prominent surface within a fluvial succession (Best and Ashworth 1997). The sur-face may cut down into a different facies succession,such as the transgressive or highstand shallow-marineor deltaic deposits of the preceding cycle, and the sur-face itself may be marked by a coarse lag deposit or evidence of extensive pedogenesis. How ever, in manysystems deep scour is not in evidence. Miall and Arush(2001a) suggested the term ʻcryptic sequence bound-aryʼ for the erosion surfaces that develop on low-reliefalluvial plains where, in outcrop, the subaerial uncon-formity appears identical to any other channel-scoursurface. Such cryptic sequence boundaries in fluvialsuccessions might be identified by sudden changes indetrital composition, major shifts in fluvial dispersaldirections, and evidence of early cementation in the de-posits immediately below the subaerial unconformity,all of which are indications of the extended period oftime represented by this surface, during which the flu-vial system continued to evolve.
O. Catuneanu et al.194

Lowstand normal regressionA rise in base level generates increased accommodationand aggradation is likely to occur in the lower courseof the river. The fill of an incised valley may commencewith a complex of amalgamated channel-fill deposits,regardless of the fluvial style, reflecting an extendedphase of channel reworking during a period when littlenew accommodation is being added to the fluvial pro-file. The rate of accommodation generation typically isless than the rate of sediment supply. Bar-top and flood-plain deposits have a low probability of preservationduring this phase. A sheet-scale topset with a ʻblockyʼvertical profile may be the result (Kerr et al. 1999).
The maximum regressive surface is typically placedat the contact between the amalgamated channel fills ofthe lowstand topset (low-accommodation conditions)and the overlying floodplain-dominated transgressivefluvial deposits (high-accommodation conditions; Kerret al. 1999). Basinward, the maximum regressive sur-face may be traced along the base of the oldest centralestuary facies. Upstream, the maximum regressive sur-face may onlap the subaerial unconformity.
TransgressionIn the case of rivers draining into the sea, as the ratesof base-level rise increase following the initial stage ofcreation of new accommodation, incised valleys be-come estuaries, with a range of depositional conditionsranging from fully marine at the mouth to fully non-marine at the inland end of the estuary (Dalrymple etal. 1994). There will be a decrease in slope of the low-er course of the river, leading to a reduction in compe-tency and, consequently, in the grain size of the sedi-ment transported and deposited. The rate of accom-modation generation typically is greater than the rateof sediment supply. Rapid generation of accommoda-tion may be reflected by high sedimentation rates, andprovides ideal conditions for floodplain accumulation.
The limit of transgression is reached during the pe-riod when the rate of accommodation generation byrise in base level no longer outpaces the sedimentationrate at the shoreline. In predominantly nonmarine flu-vial systems this may be indicated by the appearanceof marine influence in otherwise typical fluvial de-posits (Fig. 22). Marine ichnofacies may be present,
Sequence Stratigraphy: Methodology and Nomenclature 195
Incisedvalley-fill(“LST”)
Rs > Ra
Rs = Ra
Rs < Ra
SB
SB
“HST”
“TST”
interfluve with roots
soil with calcrete
hydromorphic soil fluvial channel sand
tidally-influenced channel sand
floodplain deposits
Fig. 22. Sequence model for nonmarine systems (adapted from Wright and Marriott 1993). Rs = rate of sedimentation, Ra =rate of accommodation generation. Conventional systems-tract acronyms are shown in quotes, because it may be questionedwhether it is appropriate to use a terminology based on sea-level change for depositional systems that have no connectionto the sea. For falling-stage and lowstand deposits, Currie (1997) suggested the term ʻdegradational systems tractʼ, for trans-gressive deposits, ʻtransitional systems tractʼ, and for highstand deposits, ʻaggradational systems tractʼ. These terms provideanalogous ideas regarding changes in accommodation and sediment supply and their consequences for depositional style.

and tidal influence may occur in the form of tidal bed-ding, reversing cross-bedding, sigmoidal bedding, andinclined heterolithic strata (Thomas et al. 1987). Thewidespread marine shales that commonly mark themaximum flooding surface in the marine realm mayextend landward into the previously purely nonmarinesuccession. The thickest and most laterally extensivecoals typically occur during this phase of the base-lev-el cycle (Bohacs and Suter 1997). Channel complexesmay be encased in thick floodplain fines and exhibitlittle lateral interconnectedness. Soils are likely to beimmature. Hydromorphic soils, commonly character-ized by siderites, are also typical of this phase of sed-imentation (Wright and Marriott 1993).
Highstand normal regressionAt the end of the phase of base-level rise, the rate ofaccommodation generation slows, leading to a reduc-tion in the ability of fluvial systems to aggrade. Chan-nel complexes become more laterally interconnected,developing broad sandstone sheets and, at the sametime, channel scour reduces the preservation potentialof floodplain deposits, resulting in increased sand-
stone/shale ratios relative to the underlying systemstract. Soils have more time to develop and becomemore mature. Those that develop on interfluves, wellaway from areas of active fluvial erosion, may surviveto become the subaerial unconformity during the nextphase of base-level fall.
2. Case study: The Castlegate Sandstone(Upper Cretaceous), Book Cliffs, Utah
The Castlegate Sandstone is part of the clastic wedgederived from the growing Cordilleran orogen, whichprograded eastward into the Western Interior Seawaybetween the Late Jurassic and the Eocene (Miall et al. 2008). It is particularly well exposed in the BookCliffs of central Utah, between Price and Green River(Figs. 23, 24).
There are two scales of sequences in this succession,long-term sequences, such as that comprising theCastlegate Sandstone, with durations of about 5 Myr(sequences 1 to 3 of Fig. 23; Olsen et al. 1995), andhigh-frequency sequences in the Neslen Formation(not shown in Fig. 23), each representing less than
O. Catuneanu et al.196
Joes ValleyReservoir
Castle GateSunnyside
HorseCanyon Trail
Canyon
TuscherCanyon
?
?
BluecastleSandstone
UpperCastlegateSandstone
Lower Castlegate Ss Sego Ss
Neslen Fm
L. CastlegateSs
BuckTongue
SE
QU
EN
CE
2S
EQ
UE
NC
E 1
SE
Q 3
30 m
50 km
Blackhawk Formation
Interbedded sandstone, siltstone, shale,fluvial-deltaic, in part tidally influenced
Marine shale
Braided fluvial sandstone, tidal influence inupper part of Lower Castlegate Sandstone
Deltaic sandstone, siltstone,shale, coal
Fig. 23. Stratigraphy of the Castlegate Sandstone. From Miall and Arush (2001b), as modified from Olsen et al. (1995) andYoshida et al. (1996).

1 Myr. Willis (2000) and Yoshida (2000) demonstrat-ed the unconformable truncation of the Buck Tongue,a unit of marine shale extending westward from thecentre of the Western Interior Basin in Colorado. TheBuck Tongue represents approximately a million yearsof sedimentation. Its westward truncation implies thepresence of a significant unconformity within the up-dip portion of the Lower Castlegate Sandstone. Nu-merous erosion surfaces are present within the braided
sheet sandstones that comprise most of the CastlegateSandstone, but most of these are channel scour sur-faces (bounding surface type 5 of Fig. 21). Miall andArush (2001b) correlated the unconformity with sur-face D at the type section of the Castlegate Sandstone(Fig. 24) on petrographic grounds.
Surface D is a good example of a cryptic sequenceboundary which, although representing several millionyears of missing time, is indistinguishable in outcrop
Sequence Stratigraphy: Methodology and Nomenclature 197
Fig. 25.The sequenceboundary at thebase of the Castle- gate Sandstone,At the Castle Gatetype section.
Fig. 24. The type section of the Castlegate Sandstone, atthe Castle Gate, near Price, Utah. The boundary between theupper and lower Castlegate Sandstone is interpreted to be atsurface D (Miall and Arush 2001b).

from other channel scour surfaces. The type of deepscour hollows that Best and Ashworth (1997) suggest-ed would characterize many nonmarine sequenceboundaries is not present in this system. The Castlegaterivers probably combed continuously across the allu-vial plain, resulting in a widespread erosion surface thatcan be traced down-dip for more than 150 km.
The base of the Castlegate Sandstone (lower rightcorner of the type section: Fig. 24, and in a closer viewin Fig. 25) is marked by a distinct change in facies fromthe coal-bearing, heterolithic, meandering-stream de-posits of the underlying Blackhawk Formation to thecoarser-grained, braided sheet sandstones of the Castle-gate. The sequence boundary is clearly a surface of erosion, with erosional relief of a few centimeters, fol-lowed by a lag deposit of wood fragments, and scat-tered dinosaur bone fragments.
Olsen et al. (1995) and Yoshida (2000) showed thatthe Upper Castlegate Sandstone contains abundant evidence of tidal influence, in the form of tidal bed-ding and inclined heterolithic stratification (Thomas etal. 1987) (Fig. 26). This part of the succession there-fore corresponds to the TST of Shanley and McCabe(1994) or ʻtransitional systems tractʼ of Currie (1997).
Coastal and shallow-watersiliciclastic settings
1. Introduction
Sequence stratigraphy is arguably easiest to apply incoastal to shallow-water siliciclastic settings, where the relationship between stratal stacking patterns andshoreline trajectories is most evident (Fig. 3). All se-quence stratigraphic surfaces and systems tracts mayform in these settings, although they may not necessar-ily occur together within the same stratigraphic section.
Forced regressionThe deposits of forced regression (i. e., the FSST) dis-play a stacking pattern characterized by foresteppingand downstepping at the shoreline, interpreted as theresult of relative sea-level fall (Figs. 3, 27). Criteria forthe recognition of forced regressive deposits include:separation (detachment) between successive paleo-coastlines; presence of sharp-based shoreface/deltafront deposits; presence of progressively shallower cli-noforms in a distal direction; occurrence of long-dis-tance regression; absence of fluvial and coastal plain/
O. Catuneanu et al.198
Fig. 26. Outcrop of the Castlegate Sandstone 10 km east of the type section. Recessive-weathering beds just below the centre of the field of view consist of interbedded sandstones and shales displaying inclined heterolithic stratification, inter-preted as indicating tidal influence. The beds above and below are typical braided sheet sandstones.
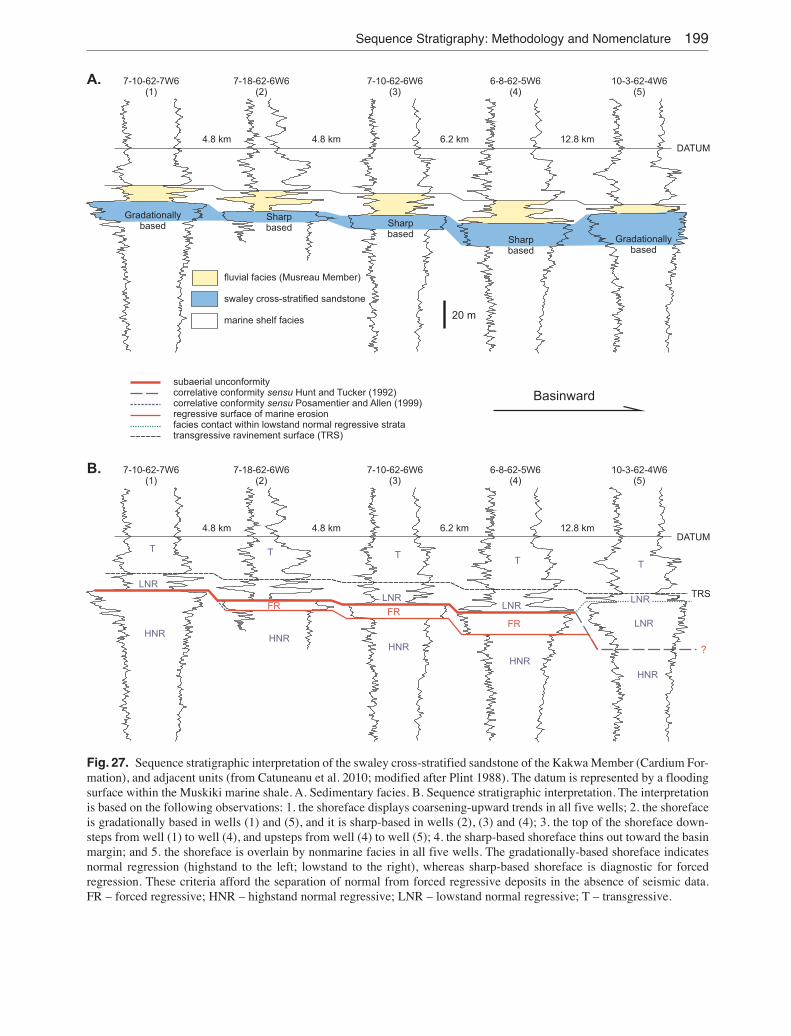
Sequence Stratigraphy: Methodology and Nomenclature 199
DATUM
TRS
7-10-62-7W6(1)
7-18-62-6W6(2)
7-10-62-6W6(3)
6-8-62-5W6(4)
10-3-62-4W6(5)
4.8 km 4.8 km 6.2 km 12.8 km
20 m
DATUM
7-10-62-7W6(1)
7-18-62-6W6(2)
7-10-62-6W6(3)
6-8-62-5W6(4)
10-3-62-4W6(5)
Basinward
4.8 km 4.8 km 6.2 km 12.8 km
subaerial unconformitycorrelative conformity Hunt and Tucker (1992)correlative conformity Posamentier and Allen (1999)regressive surface of marine erosionfacies contact within lowstand normal regressive stratatransgressive ravinement surface (TRS)
sensu
sensu
HNRHNR
HNR
HNR
HNR
FRFR
FR LNR
LNRLNR
LNR
LNR
T T TT T
?
fluvial facies (Musreau Member)
swaley cross-stratified sandstone
marine shelf facies
A.
B.
Gradationallybased
Sharpbased Sharp
basedSharpbased
Gradationallybased
Fig. 27. Sequence stratigraphic interpretation of the swaley cross-stratified sandstone of the Kakwa Member (Cardium For-mation), and adjacent units (from Catuneanu et al. 2010; modified after Plint 1988). The datum is represented by a floodingsurface within the Muskiki marine shale. A. Sedimentary facies. B. Sequence stratigraphic interpretation. The interpretationis based on the following observations: 1. the shoreface displays coarsening-upward trends in all five wells; 2. the shorefaceis gradationally based in wells (1) and (5), and it is sharp-based in wells (2), (3) and (4); 3. the top of the shoreface down-steps from well (1) to well (4), and upsteps from well (4) to well (5); 4. the sharp-based shoreface thins out toward the basinmargin; and 5. the shoreface is overlain by nonmarine facies in all five wells. The gradationally-based shoreface indicatesnormal regression (highstand to the left; lowstand to the right), whereas sharp-based shoreface is diagnostic for forced regression. These criteria afford the separation of normal from forced regressive deposits in the absence of seismic data.FR – forced regressive; HNR – highstand normal regressive; LNR – lowstand normal regressive; T – transgressive.

delta plain topsets at the top of forced regressive fore-sets; truncation of forced regressive foresets by a sea-ward-dipping unconformity; increase in average sedi-ment grain size in forced regressive foresets in a basin-ward direction; and presence of ʻforeshortenedʼ strati-graphic successions (Posamentier and Morris 2000).
Forced regressive deposits typically build the domi-nant systems tract of sequences that form on conti-nental shelves during periods of profound icehouse climatic and eustatic forcing (Fig. 17). This is becauseglacioeustatic changes in sea level are strongly asym-metrical, with brief stages of fast sea-level rise and pro-longed stages of slower sea-level fall (Bard et al. 1990).At the same time, both the magnitudes and the rates of sea-level change are higher in an icehouse world as compared to a greenhouse regime. Sequences of anicehouse affinity are typically less than 50 m thick andoften organized in stacks of several in succession, sug-gesting a relation to orbital forcing (e. g., Naish et al.2001; Fielding et al. 2008; Fig. 17). Examples of suchicehouse sequences have been documented in studies ofNeogene continental margin successions around Ant -arctica (Bartek et al. 1991, 1997; Fielding et al. 2001;Naish et al. 2001), from Plio-Pleistocene successions inNew Zealand (Naish and Kamp 1997; Saul et al. 1999),the Miocene Chesapeake Group of eastern USA (Kid-well 1997), the Miocene of western Chile and Ecuador(Di Celma and Cantalamessa 2007; Cantalamessa et al.2007), and from Lower Permian strata in the SydneyBasin of eastern Australia (Fielding et al. 2006).
Normal regressionThe deposits of normal regression display a stackingpattern characterized by forestepping and upsteppingat the shoreline, interpreted as the result of positive andoverfilled accommodation. Normal regressions aredriven by sediment supply and occur during relativesea-level rise, either before or after transgressions; thetwo types of normal regression are designated as ʻlow-standʼ (i. e., the LST) and ʻhighstandʼ (i. e., the HST)respectively. Shoreline trajectories are different duringlowstand versus highstand normal regressions (Fig. 4),reflecting accelerating or decelerating rates of creationof accommodation (e. g., fig. 19 in Catuneanu et al.2009). During normal regressions, fluvial and coastalplain/delta plain topsets aggrade and prograde at thetop of shallow-water foresets (Figs. 6–8 and 27).
TransgressionThe deposits of transgression (i. e., the TST) display astacking pattern characterized by backstepping at the
shoreline, interpreted as the result of positive and un-derfilled accommodation. During transgression, mostriverborne sediment is trapped within rapidly aggrad-ing and backstepping fluvial and coastal systems, whilethe shallow marine environment is often starved of sediment (Loutit et al. 1988; Van Wagoner et al. 1990).The decrease of sediment supply to the marine envi-ronment during transgression may result in the forma-tion of subaqueous unconformities, expressed as ̒ hiatalsurfacesʼ in the rock record (Galloway 1989). Such un-conformities may be accompanied by the formation ofhardgrounds or firmgrounds marked by substrate-con-trolled ichnofacies (e. g., Pemberton and MacEachern1995). Transgressive deposits are recognizable on seis-mic sections where condensed sections and/or marineor coastal onlap are observed (Fig. 8), but also in out-crop or well-log data sets (Figs. 6, 7, 15, 16).
2. Case study: The Yegua Formation(Eocene), Gulf of Mexico
The Yegua Formation records a significant terrigenousclastic depositional episode along the entire northernand northwestern continental margin of the Gulf ofMexico Basin (Galloway et al. 2011). The episode isrecorded by a sand-bearing genetic stratigraphic se-quence bounded by maximum-flooding surfaces with-in the regional marine Crockett (Texas) and CookMountain (Louisiana) Shales and the Moody’s BranchMarl (Fig. 28). The depositional episode extendedfrom about 38 to 36.1 Ma (Paleo-Data 2009) withinlate Middle to Late Eocene Standard ForaminiferalZone P15. The Yegua section reflects, in stratal stack-ing pattern and consequent log response, a typical Gulf Coast Cenozoic succession of progradational and aggradational facies, capped by relatively thinback-stepping/transgressive deposits (Fig. 28) (Frazier1974). Sedimentation rates were high; the northernGulf of Mexico depocentre contains 0.5 to � 1 km ofsediment deposited within about 2 years. This is one ofthe highest rates of sediment accumulation recorded inthe Gulf Cenozoic section (Galloway et al. 2011). TheYegua coastal plain prograded onto a deep, founderedcontinental shelf/ramp that was constructed by progra-dation of the Early Eocene Upper Wilcox sequence.Regional studies (Edwards 1991; Meckel and Gallo -way 1996; Galloway et al. 2000) delineate a large, flu-vial-dominated delta system that constructed the upperTexas coastal plain depocentre.
Fang (2000), in a sub-regional study area lying in thesoutheast Texas depocenter, recognized 15 physical
O. Catuneanu et al.200

stratigraphic markers, labeled Y00–Y14, that could be correlated within the study area (Fig. 28). MarkersY00 and Y14 are the maximum-flooding surfaces thatbound the Yegua genetic stratigraphic (Fig. 28). Graph-ic correlation displays chronostratigraphic terraces,recording condensation, non-deposition, and/or milderosion, at each of these horizons (Fang 2000). Theseconstitute two of only three demonstrable chronostra -tigraphic discontinuities (excluding fault and slumpplanes) found within the Yegua interval. Most of themarkers, including Y02, Y04, Y05, Y06, Y08, Y10,
Y11, and Y13, are flooding surfaces bounding parase-quences and parasequence sets that range from severalmetres to around a hundred metres in thickness. Y01corresponds to the Last Appearance Datum (LAD) ofbenthic foraminifer Ceratobulimina eximia and is thetraditional base of the Yegua Formation. It is charac-terized by the appearance of the first sand or siltstoneinterval, which is commonly sharp-based in updip andoutcrop sections. It is interpreted as a possible regres-sive surface of marine erosion. Surfaces Y00 throughY03 coalescence into a condensed section downdip
Sequence Stratigraphy: Methodology and Nomenclature 201
Meckel(1993)Markers
DepthfeetSP SFLA
5500
6000
6500
7000
7500
IntervalsLog
MarkersPaleo
Markers
Humble,#1 Hines
A NC Y14
B
CD
E
F
G
DYEY
NM
AU
CE
CG
TTGS
14
13
12
11
10
9
8
7
6
5
4
3
2
1
Y13Y12
Y11Y10
Y09Y08
Y07Y06
Y05
Y04
Y03
Y02
Y01
Y00
MFSFSRSMETRS/SU
-10+ ohm.m 40
Fig. 28. Representative electricallog of fully developed mid-dipYegua genetic sequence. Log markers divide the sequenceinto 14 genetic packages. Inter-preted origin of each log markeris shown in the right column. Modified from Fang (2000).

O. Catuneanu et al.202
N
1
2
3
4
5
9
10
14
8
6
7
11
12
13
0 50 km
C.I. 10, 20, or 50 ft
EXPLANATION
0 net sand
>_ 50 ft (15m) net sand
Shelf margin
Incised channel or valley
Slump
Sand input axis
Delta lobe outline
Fig. 29. Net sand isopach maps for each of the 14 Yegua genetic packages showing interpreted delta lobes, inferred fluvialinput axes, and shelf edge position. Note contour interval varies from map to map. Compiled from Fang (2000).

toward the paleo-shelf edge. Three offlapping parase-quence sets compose the basal Yegua regression ontothe Y00 maximum-flooding surface. This successionrecords normal regression within the highstand systemstract. The regressive succession culminates in markerY04, which records a mildly erosional event up dip,where it is overlain by sharp-based sand bodies of dis-tributary and fluvial channel fills. Down dip, the basalYegua sand body lies above the marker, which is inter-preted to be a possible regressive surface of marine ero-sion. Two aggradational parasequence sets, bounded by flooding surfaces Y04, Y05, and Y06, form the bulkof the remaining lower Yegua succession and record aresumption of normal regression. Marker Y06 recordsa prominent and regionally correlative surface of trans-gression of the Yegua coastal plain. A third possiblechronostratigraphic break as demonstrated by graphi-cal correlation lies at or near Y06.
Y07 evidences rejuvenation of Yegua sediment sup-ply and coastal regression. The overlying sand faciesdisplay either blocky, upward-fining or sharp-based,serrate log patterns; the shaley interval between flood-ing surface Y06 and Y07 is typically replaced updip bythick, upward-fining sand bodies. Consequently, theinterval between Y06 and Y07 pinches out. Biofaciesshow abrupt shoaling across Y07, which is interpretedto be a well-developed regressive surface of marineerosion. Neither widespread subaerial exposure norvalley incision is demonstrated by the data. Regressionwas, however, forced by relative sea-level fall. Y08records a marine flooding surface and increase in wa-ter depth within what is the thickest shale tongue in the Yegua Formation. Y09 records a second forced re-gression with prominent biofacies shoaling and wide-spread presence of sharp-based sand bodies above theshaley interval. Y10 and Y11 are both flooding sur-faces, associated with neritic faunas, widespread thinshale beds, and inter-regional markers.
Marker Y12 is unique. Abrupt shoaling occursacross the demonstrably erosional surface. Thick, up-ward-fining sand bodies cut several tens of metres fromthis surface into underlying strata. These highly ero-sional channels or small valleys extend across the muddy shelf to the paleo-shelf edge. In most mid- andup-dip wells, the marker is capped by a thin, laterallycontinuous, sharp-based sand unit. The surface is inter-preted to be a combined subaerial unconformity and su-perimposed transgressive ravinement surface. MarkerY13 is a regionally correlative marine flooding surfacethat caps Yegua sand bodies in mid- and down-dip sec-tions. It is chronostratigraphically significant, demark-
ing the LAD of Eponides yeguaensis. The LAD ofDiscorbis yeguaensis occurs just above the surface.Overlying marker Y14, characterized by the LAD ofNonionella cockfieldensis, is the regional maximum-flooding surface that caps the Yegua episode.
The upper Yegua, extending from Y06 to Y13,records a robust phase of normal depositional regres-sion, punctuated by at least three forced regressiveevents, followed by backstepping transgression, andterminated by flooding and sediment starvation acrossthe northern GOM continental margin. At the level ofchronostratigraphic resolution possible, both the upperand lower bounding maximum flooding surfaces aredocumented disconformities that can be accuratelydated. In contrast, internal forced regressive surfacesand the fluvial erosion surface do not create measura-ble temporal discontinuities (Fang 2000).
The 15 marker surfaces provide a high-resolutionstratigraphic framework of 14 genetic units for map-ping and interpreting the depositional history of theYegua. Given the ca. 2 Myr duration of the episode,each records on the order of 125,000 years. Figure 29shows mapped sand distribution in the 14 defined in-tervals. Mid to deep shelfal shale-dominated intervals1 and 2 display thin, linear sand bodies that extendNE-SW along depositional strike. The next ten inter-vals display digitate sand patterns that record a suc-cession of stacked delta lobes that repeatedly prograd-ed from NW to SE across the study area, showing ongoing lateral shifts in sand input axes, lobes, and de-pocentres. Interval 13, bounded below by the compos-ite subaerial unconformity and transgressive ravine-ment surface, is distinct. Two narrow valleys extendacross the shelf and connect downdip to locally thick(up to 50 m), pod-shaped, paleo-shelf edge sand suc-cessions. These are small, growth-faulted shelf-edgedeltas and their upper slope turbidite aprons were de-posited during the temporary lowstand and comprisethe lowstand systems tract. Above the transgressiveravinement surface, neritic shales contain thin, strike-elongate, transgressive shelf sands. Interval 14, thelast gasp of back-stepping deposition, is shale domi-nated, but contains strike-elongate belts and pods ofinner shelf, shoreface, and strandplain sand.
The composite record of the Yegua episode can besummarized as (1) initial muddy shelf and shore-zoneprogradation, (2) and extended period of repeateddelta lobe progradations (sometimes normal, some-times forced), abandonment, and transgression, (3) aterminal pulse of lowering base level resulting in deepfluvial channel incision across about 50 km of exposed
Sequence Stratigraphy: Methodology and Nomenclature 203

shallow shelf accompanied by accumulation of smallshelf margin delta lobes, and (4) terminal backsteppingtransgression. The northern Gulf margin was a broadsediment-starved continental shelf both before and af-ter Yegua deposition.
Deep-water siliciclastic settings
1. Introduction
Acquisition of 3D volumes of seismic data compensatesfor the difficulty of observing deep-water processes andproducts in modern environments (e. g., Posamentierand Walker 2006; Weimer and Slatt 2007). Most depo-sitional elements that form in the deep-water setting develop over km-size scales in plan view, which is why few outcrop-based studies can replace or rival theimaging generated by the high-resolution 3D seismicdata. This, together with the lack of accessibility of thedeep-water present-day environment, renders the seis-mic data a unique role into the understanding of thedeep-water setting, arguably more important than in thecase of any other depositional setting.
The application of sequence stratigraphy to thedeep-water setting is challenging because: (1) there ispotential for physical disconnection between the deep-water portion of sequences and their fluvial to shallow-water equivalents, commonly as a result of nondeposi-tion or sediment instability and erosion in the shelfedge to upper slope areas; (2) the time control to corre-late the deep-water and the shallow-water portions ofsequences is typically inadequate; (3) deposition in thedeep-water setting is controlled primarily by gravityflows and mass transport processes, which may resultin lateral rather than vertical stacking of depositionalelements and systems tracts; and (4) the evidence ofrelative sea-level change is only indirect in the deep-water setting. In spite of these challenges, significantprogress has been made in the definition of sequencestratigraphic models that describe the relationship be-tween the cyclic change in the type of deep-water de-positional elements and the corresponding changes inaccommodation and shoreline trajectories on the shelf(e. g., Posamentier and Kolla 2003; Catuneanu 2006;Fig. 30).
The cyclic nature of siliciclastic deposition in deepwater has been emphasized in numerous case studiesand syntheses (e. g., Weimer 1991; Winker and Booth2000; Posamentier and Kolla 2003; van der Merwe etal. 2010). A cycle of sedimentation in the deep water
starts with the activation of shelf-edge repositoriesduring relative sea-level fall, when a decrease in ac-commodation on the shelf results in an increase in sediment supply to the deep-water environment. Thecycle ends with the gradual deactivation of the shelf-edge staging areas during relative sea-level rise, whenrenewed accommodation on the shelf is able to trap the majority of terrigenous sediment within fluvial toshallow-water systems.
Changes in accommodation on the shelf, as well asin the location of the coastline, control both the vol-ume and the grain size of the riverborne sediment delivered to the deep-water setting. Sediment supplymay also be modified by climate and tectonism in thesource areas, the size and the energy of the rivers thatbring sediment to the coastline, as well as by the widthof the continental shelf. In the case of narrow shelves,sediment supply to the deep-water environment maybe higher during all stages of the relative sea-level cy-cle; however, the general trends are maintained in thesense that the lowest volume and the finest sedimentwill still accumulate during times of highest accom-modation on the shelf, whereas the largest volume andthe coarsest sediment will still be delivered duringtimes of lowest accommodation on the shelf.
Typically, three sequence stratigraphic surfaces aremappable regionally within the deep-water setting: the two types of correlative conformity and the maxi-mum flooding surface (Posamentier and Kolla 2003;Catuneanu 2006; Figs. 31, 32). These surfaces relate toimportant phases in the evolution of the deep-watersystem. The correlative conformity of Posamentierand Allen (1999) marks the onset of high sedimentsupply to the deep basin, which typically starts withmud-dominated gravity flow and mass transport de-posits. The correlative conformity of Hunt and Tucker(1992) corresponds to the top of the coarsest sedimentin the deep-water basin, which typically forms the bestpetroleum reservoirs. The maximum flooding surfacemarks the timing of the minimum sediment delivery tothe deep basin, and it is typically placed at the heart ofregionally extensive condensed sections.
A deep-water sequence includes the equivalents offorced regressive, lowstand normal regressive, trans-gressive and highstand normal regressive deposits onthe shelf (Fig. 30). The following are generalizedtrends that describe a cycle of deep-water sedimenta-tion. Departures from this model may occur as a func-tion of shelf width, sediment supply, and patterns ofsediment transport (e. g., Porebski and Steel 2006; Co-vault et al. 2007).
O. Catuneanu et al.204
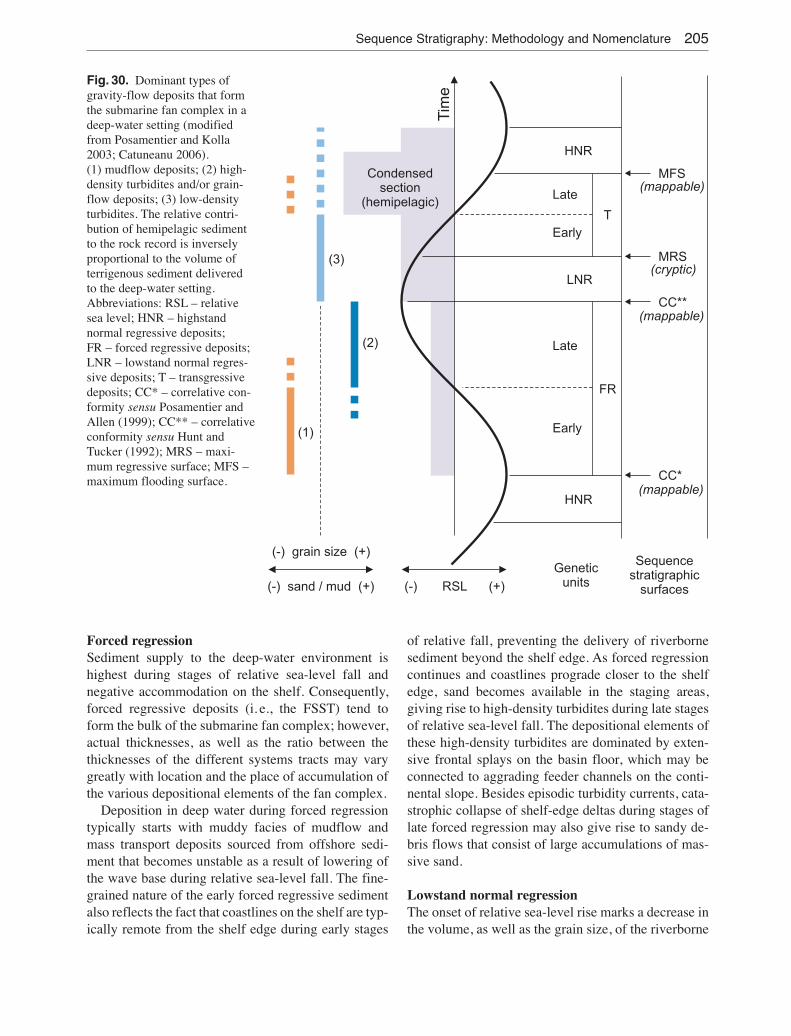
Forced regressionSediment supply to the deep-water environment ishighest during stages of relative sea-level fall and negative accommodation on the shelf. Consequently,forced regressive deposits (i. e., the FSST) tend toform the bulk of the submarine fan complex; however,actual thicknesses, as well as the ratio between thethicknesses of the different systems tracts may varygreatly with location and the place of accumulation ofthe various depositional elements of the fan complex.
Deposition in deep water during forced regressiontypically starts with muddy facies of mudflow andmass transport deposits sourced from offshore sedi-ment that becomes unstable as a result of lowering ofthe wave base during relative sea-level fall. The fine-grained nature of the early forced regressive sedimentalso reflects the fact that coastlines on the shelf are typ-ically remote from the shelf edge during early stages
of relative fall, preventing the delivery of riverbornesediment beyond the shelf edge. As forced regressioncontinues and coastlines prograde closer to the shelfedge, sand becomes available in the staging areas, giving rise to high-density turbidites during late stagesof relative sea-level fall. The depositional elements ofthese high-density turbidites are dominated by exten-sive frontal splays on the basin floor, which may beconnected to aggrading feeder channels on the conti-nental slope. Besides episodic turbidity currents, cata-strophic collapse of shelf-edge deltas during stages oflate forced regression may also give rise to sandy de-bris flows that consist of large accumulations of mas-sive sand.
Lowstand normal regressionThe onset of relative sea-level rise marks a decrease inthe volume, as well as the grain size, of the riverborne
Sequence Stratigraphy: Methodology and Nomenclature 205
Tim
e
HNR
HNR
Early
Late
LNR
Early
Late
(-) RSL (+)(-) sand / mud (+)
(-) grain size (+)
Condensedsection
(hemipelagic)
(1)
(2)
(3)
Sequencestratigraphic
surfaces
Geneticunits
FR
T
CC*
CC**
MRS
MFS
(mappable)
(mappable)
(mappable)
(cryptic)
Fig. 30. Dominant types ofgravity-flow deposits that formthe submarine fan complex in adeep-water setting (modifiedfrom Posamentier and Kolla2003; Catuneanu 2006).(1) mudflow deposits; (2) high-density turbidites and/or grain-flow deposits; (3) low-densityturbidites. The relative contri-bution of hemipelagic sedimentto the rock record is inverselyproportional to the volume ofterrigenous sediment delivered to the deep-water setting. Abbreviations: RSL – relativesea level; HNR – highstand normal regressive deposits; FR – forced regressive deposits;LNR – lowstand normal regres-sive deposits; T – transgressivedeposits; CC* – correlative con-formity sensu Posamentier andAllen (1999); CC** – correlativeconformity sensu Hunt andTucker (1992); MRS – maxi-mum regressive surface; MFS –maximum flooding surface.

O. Catuneanu et al.206
25 m
Lithofacies Interpretation
sandstone,thick beds
sandstone,thin beds
alternatingmudstoneand siltstone
muddy chaotic,folded andfaulted facies
mudstone
siltstone
LaingsburgFormation
Vis
chkuil
Form
ation
CollinghamFormation
high-densityturbidites
low-densityturbidites
low-densityturbidites
low-densityturbidites
mudflows,slumpsand slides
Sequence stratigraphic surfaces:
maximum flooding surfacecorrelative conformity **correlative conformity *
Systems tracts:
highstand normal regression
lowstand normal regression- transgression
forced regression
condensedsection
KEY:
1
2
3
4
5
Fig. 31. Composite profile of the Vischkuil Formation, Karoo Basin, South Africa (modified from van der Merwe et al.2010).

sediment delivered to the deep-water environment, asfluvial topsets trap the coarser sediment fractions onthe shelf (Catuneanu 2006). As a result, the dominanttype of gravity flow that carries sediment into thedeep-water setting changes from the high-density tur-bidity currents of late forced regression to low-densi-ty turbidity flows characterized by lower sediment-to-water and sand-to-mud ratios. The lower-density tur-bidites of the lowstand normal regression (i. e., theLST) are dominated by aggrading leveed-channel sys-tems on the basin floor, which typically become en-trenched updip on the continental slope (Posamentierand Kolla 2003).
TransgressionWith the rapid creation of accommodation and con-comitant trapping of riverborne sediment in backstep-ping fluvial and coastal systems, sediment entry pointsinto the marine environment shift back from the shelfedge and the supply of sand to the deep water gradu-ally decreases during transgression. The manifestationof low-density turbidity flows continues from the low-stand normal regression into early transgression, whencoastlines are still close to the shelf-edge staging areas.However, these turbidity flows become progressivelymore diluted, finer grained and infrequent duringtransgression, to the point when sedimentation from
suspension becomes the dominant process in the deep-water environment at the time of maximum flooding.In such cases, condensed sections characterize the latestages of transgression. Instability at the shelf edgeduring rapid increase in water depth, coupled with sed-iment starvation, may also result in upper slope failureand the manifestation of mass transport processes andmudflows during late transgression (Posamentier andKolla 2003). The transgressive deposits form the TST.
Highstand normal regressionThe highstand is a time of slow increase in accommo-dation, renewed progradation of coastlines followingthe maximum flooding, and relative stability at theshelf edge. In the case of wide continental shelves,riverborne sediment may also not reach the shelf edge.Consequently, gravity flows or mass transport process-es are unlikely and infrequent in the deep-water envi-ronment, and condensed sections are typical for thedeep-water portion of this (HST) systems tract. In thecase of narrow continental shelves, coastal prograda-tion may gradually bring the sediment entry pointsclose enough to the shelf edge for the delivery of riverborne sediment into the deep-water environment(Porebski and Steel 2006; van der Merwe et al. 2010).In such cases, low-density turbidites may be recordedabove the condensed section (Figs. 30, 31).
Sequence Stratigraphy: Methodology and Nomenclature 207
Collingham Formation
Laingsburg Formation
Laingsburg
0 10
10 km
20 30 40 50 km
highstand normal regressionlowstand normal regression - transgressionforced regression
50 m
W E
N
Cape Fold Belt
Karoo Basin
CAPETOWN
PORT ELIZABETH
100 km
Vischkuil Formation
maximum flooding surfacecorrelative conformity **correlative conformity *
1
23
4
5
Fig. 32. Sequence stratigraphy of the Vischkuil Formation, Karoo Basin, South Africa (modified from van der Merwe etal. 2010). The Vischkuil Formation consists of five submarine fan complexes, corresponding to five depositional sequences(1–5), which include forced regressive, lowstand normal regressive, transgressive and highstand normal regressive systemstracts (see text for details). See Fig. 31 for a lithofacies description of the five sequences and component systems tracts. Ver-tical bars represent measured outcrop sections.

2. Case study: The Vischkuil Formation(Permian), Karoo Basin, South Africa
The Ecca Group of the Karoo Supergroup includes depositional systems that exemplify both distal andproximal basin-floor settings, as well as overlying andprograding slope and shelf facies. The overall shal-lowing-upward succession from distal basin floor toshelf settings marks the transition from the underfilledto the filled phases in the evolution of the basin(Catuneanu et al. 2002). This case study presents thedistal basin-floor succession of the Permian VischkuilFormation in the Karoo Basin (Figs. 31, 32).
The Vischkuil Formation is a 280–380 m thickmudstone- and siltstone-dominated succession, whichincludes five sequences interpreted to have accumu-lated in relation to cyclic changes in accommodationon the shelf (van der Merwe et al. 2010; Figs. 31, 32).The bulk of the succession consists of gravity-flowand mass-transport deposits related to mudflows,slumps, high-density turbidity currents and/or grain-flows, and low-density turbidity currents. Each cycleof sedimentation comprises a relatively thin (i. e., me-tre-scale) but regionally extensive condensed sectionof hemipelagic mudstone that represents a starvedbasin floor, likely corresponding to a stage of maxi-mum flooding on the shelf (Figs. 30, 31). These con-densed sections are markers for regional correlation,and help to delineate sequences.
Each condensed section is overlain by a successionof silty turbidites interpreted as an HST (Fig. 31).Highstand systems tracts represent stages of renewedprogradation and delivery of riverborne sediment intothe deep basin, albeit in a relatively distal setting. Thedeposition is terminated by an abrupt shift in deposi-tional regime marked by a sharp increase in sedimentsupply interpreted to mark the onset of relative sea-level fall, and hence the change from highstand nor-mal regression to forced regression on the shelf. Theboundary separating these two systems tracts is a sur-face of regional extent that is referred to as either thecorrelative conformity or the basal surface of forcedregression.
The forced-regressive portions of sequences may in-clude muddy chaotic facies associated with mudflowsand slumps, as well as sandy facies related to high-den-sity turbidity currents (Figs. 30, 31). The two older se-quences include sandy deposits, whereas the overlyingthree sequences comprise muddy facies. This trend reflects the gradual progradation of the shelf edgethrough time.
The onset of lowstand normal regression is markedby a sharp decrease in sediment supply to the deep-water setting as sediment starts being trapped in ag-grading fluvial topsets on the shelf. The boundary between forced regressive and lowstand normal re-gressive systems tracts is a type of correlative con-formity (i. e., in the sense of Hunt and Tucker 1992).This surface can be traced regionally at the contact be-tween forced regressive mudflow and/or high-densityturbidity flow deposits and the overlying low-densityturbidites that accumulate dominantly within leveed-channel systems (Figs. 30, 31, 32). The correlativeconformity has lithological expression as it corre-sponds to an allogenic event that changes sedimentsupply to the basin within a short time interval (e. g.,Fig. 11).
The lowstand low-density turbidity flows continuedto dominate sedimentation during the transgressivestage as well, or at least during the early part of trans-gression (Posamentier and Kolla 2003; Catuneanu2006). For this reason, the maximum regressive sur-face is cryptic in the deep-water system, within an undifferentiated succession of low-density turbidites.The turbidite succession of lowstand normal-regres-sive to transgressive deposits becomes finer throughtime, as progressively less frequent turbidity currentsgive way to dominantly condensed sections during latestages of transgression.
Carbonate settings
1. Introduction
A sequence stratigraphic framework applied to car-bonates provides a major tool for the interpretation ofthe complex and diverse spectrum of the depositionalsystems, and the geometric architecture of their facies(Figs. 33, 34). The subdividing sequence stratigraphicsurfaces identified in carbonates, just as with silici-clastic sediments, are erosional and flooding surfacesproduced by base-level change (Handford and Loucks1993). This framework of surfaces is regional in ori-gin, and provides chronology to the order of depositionof the carbonate facies geometries defined by the hier-archy of the bounding surfaces and enables the inter-pretation and prediction of their extent and character.The methodology of this interpretive process is appli-cable no matter the response of the carbonates to thegeotectonic setting and the physical, chemical and bi-ological conditions of the specific depositional setting,
O. Catuneanu et al.208

be it a basin with a steep margin, a homoclinal ramp oran epeiric sea (Figs. 35, 36).
Though carbonate depositional settings and their as-sociated sediments have some similarities to clastics,major differences exist. Clastics are transported to theirdepositional setting, while carbonate sediments are theproducts of in situ generation linked to carbonate-pro-ducing organisms, many of which are products ofdepth-dependent photosynthetic activity and so havetheir greatest rates of generation close to the air/sea in-terface of the depositional setting. The depth-depen-dent character of most carbonate facies (with the ex-ception of mass transport down slope) means they areoften tied directly to sea-level position whereas clasticsare not. This often causes the character of carbonatesediment to change predictably during lowstands, rap-
id transgression, and/or highstands of sea level, where-as clastics do not provide such clear indicators of sea-level position. Additionally carbonate sediments nor-mally have a biochemical origin and so are influencedby the chemistry of the water from which they precip-itated. This means that carbonate facies can also beused to determine changes in paleogeography, includ-ing the development of isolation or access to the opensea (Fig. 37) providing a better understanding of theirdepositional setting and relationship to plate-tectonicconfiguration, and changes in paleoclimate. In additionthe evolution of the organisms, whose skeletal remainsform many carbonates, can provide better time controlson the sedimentary succession. Thus carbonates, as in-dicators of depositional setting, when combined withthe sequence stratigraphic framework often form more
Sequence Stratigraphy: Methodology and Nomenclature 209
Fig. 33. Composite sequence stratigraphic framework of a carbonate platform with (right-hand side) and without (left-handside) buildups. The lower portion of the diagram captures a carbonate margin where the falling-stage system tract (FSST) isexpressed as a forced regression that progrades and downsteps seaward in response to the loss of accommodation as rela-tive sea level falls. The three downstepping wedges of sediment build out over the basal surface of forced regression (BSFR)and terminate seaward in a basin-floor fan. Above the fan is a correlative conformity while up-dip the subaerial unconfor-mity forming the sequence boundary (SB) overlies the downstepping sediment wedges of the forced regression. Over theunconformity is the lowstand systems tract (LST) expressed by a shoreline whose trajectory rises seaward. This is followedby three onlapping retrograding carbonate units of the transgressive systems tract (TST) that overlie a transgressive surface(TS) and are topped by a maximum flooding surface (MFS). This in turn is overlain by a highstand systems tract (HST) car-bonate margin expressed as three shoaling-upward cycles which lie below the next depositional sequence boundary (SB).The designation of sequence boundary in this diagram conforms with Hunt and Tucker (1992). According to Posamentierand Allen (1999), the BSFR is the sequence boundary.The vertical section on the left-hand side is a schematic column of the stacked sediments that accumulated within each systems tract. The approximate position of the sedimentary column is indicated by white strips on the sections; no one locality provides a complete section through all the systems tracts and parasequences; the FSST is represented by a sectionthat is basinward; the LST has a section even farther basinward, and the section for the TST and HST parasequences is betterexpressed further onto the platform.

O. Catuneanu et al.210
Fig. 34. Hierarchy of carbonate architectural elements from carbonate grains to cycles, bedsets, incised tidal channel fill(single units to complexes that extend perpendicular to the basin margin), shingled carbonate ribbons (complexes of inter-tidal beaches and or shoals that parallel the basin margin), build-ups (patch reef), reef flat, climbing sigmoids, offset sub-marine channels and levees, amalgamated submarine channels and levees, platform sheet geometries in response physicaland ecological accommodation, and carbonate platform complex system set. Note relationship to depositional sequenceboundaries, transgressive surfaces (TS) and maximum flooding surfaces (MFS).

powerful interpretive indicators than clastics. Carbon-ates can therefore enhance the prediction of both thelithofacies and the hierarchies that develop within thisframework away from data-rich areas.
Framework of carbonate sequence stratigraphicgeometriesThe hierarchy of carbonate sequence stratigraphicgeometries includes those associated with normal andforced regressions of highstand, falling stage and low-stand systems tracts; and onlapping retrogradationtransgressive geometries (Figs. 33, 38–40). As withclastics, the geometries of carbonate strata are productsof the morphology of the depositional surface, and ratesof change of base level and sediment accumulation. For
instance when rates of change are rapid, as on Figures4 and 33, during lowstand normal regression it is notuncommon for carbonates to prograde through timewhile rates of aggradation increase with a resultingcoastal trajectory that is concave upwards; converselywith highstand normal regressions it is not uncommonthat progradation increases with time while aggrada-tion decreases, leading to a coastal trajectory that isconvex up. During forced regressions, downsteppingoccurs. As with clastics too, these geometries are de-fined by the bounding surfaces that include thoseformed during and following transgressions (TS andMFS) and those that formed during falls in sea level asregressive surfaces (SBs). Physical erosion, burrowing,boring, dissolution (Clari et al. 1995; Lukasik and
Sequence Stratigraphy: Methodology and Nomenclature 211
clasticsediment input
controls on carbonate accumulation
evolution mineralogy
climate belts change with
plate tectonics
biological factors
temperaturesalinity
sea level positionrise fall
HMC LMC ARAG.
age
drownedbankramp
isolatedbank
open shelf rimmed shelf
epeiric shelf
karst
age
dept
h
dept
htu
rbid
ity photiczone
production
foramol/bryomol
chloralgal
salinityincrease
water depthturbidity
chlorozoan
subm
erge
nce
emer
genc
e
subsidence
light
water movement controls
windwaves
tides
storms
oceancurrents
wavebase
-sea level-
antecedent topography
platform morphology
no influx
siliciclastic influence
influx
controls onaccommodation
dept
h
rate
accumulation
Fig. 35. Main factors that control the formation of carbonate successions on platforms (after Jones and Desrochers 1992).

James 2003), and/or cementation may have modifiedthese surfaces. Whatever their origin, these surfacesmark changes in the depositional regime, particularlybase level, and provide a convenient means to subdi-vide the carbonate section. From the perspective of se-quence stratigraphy, these surfaces are used to deter-mine the order in which strata are laid down and to de-fine the geometries that they enclose, and so interpret
their depositional setting. Biostratigraphic data (bothskeletal remains and ichnology) when tied to the stratalunits, enable the direct comparison between shallow-marine and deeper-marine carbonate sequences, theirrelated units and the potential correlation of the car-bonate cycles to relative sea-level rise and fall.
Carbonate strata can be expressed (Fig. 34) as un-confined sheets, unconfined but localized buildups
O. Catuneanu et al.212
give up
time
back step
down step
catch upkeep up
prograde
spill outsea
leve
lde
pth
accumulationrate
Carbonate response to sea-level rise
give up
back step
catch up
keep up
prograde
down step
fill up and spill out
new sea level
new sea level
old sea levels
new sea levelold sea levels
old sea level
new sea level
old sea level
new sea level
old sea level
new sea levelold sea level
give up
back step
down step
catch up
keep up
prograde
relativesea level
lowhigh
time
prograde
{
Fig. 36. The carbonate response to relative sea-level change (after Scaturo et al. 1989).

(reefs, banks and islands), unconfined but localizedsigmoids (reef cores; Pomar 1991) and bank margins,and confined incised channels (tidal channels and theproduct of flood events). Just as with clastics, what -ever the final carbonate geometry formed, this geom-etry is the product of both accumulation (aggradation,retrogradation and progradation) and erosion.
As with clastics, sequence stratigraphy of carbonatesuccessions is commonly determined from a combina-tion of the comparatively low-frequency resolution of2D and 3D seismic data, the high-frequency resolutionof well logs, the very high-frequency resolution ofcores and a combination of high-frequency resolutionand low-frequency resolution from outcrops. How -ever, unlike clastics, marine carbonate successions arethe products of base-level change that generates ac-commodation expressed in two forms (Pomar andKendall 2008) (Fig. 34): physical accommodation(controlled by hydrodynamic conditions) and ecologi-
cal accommodation (controlled by organisms and theirproductivity).
Carbonate sequence stratigraphy and depositionalsettingA carbonate sequence stratigraphic framework pro-vides a useful explanation of carbonate depositionalsetting and predictions of potential carbonate playsand reservoir models. It links depositional settings, facies, geometries, fauna, and systems tracts (see Figs.38–40 and Table 1).
In conclusion, a sequence stratigraphic frameworkfor carbonate rocks can be used to predict the extentand character of facies geometries, whether these carbonate sediments accumulated in updip platforms,platform margins, margin slopes and/or downslopebasins. The literature is replete with examples of theeffective use of sequence stratigraphic methodologyincluding many on the Permian Basin of west Texas
Sequence Stratigraphy: Methodology and Nomenclature 213
Fig. 37. Relationship of carbonate grains to cementation, and waves and currents, based on the Holocene carbonate rampof the United Arab Emirates and analogous to epeiric sea settings too.

O. Catuneanu et al.214
Fig. 38. Lowstand carbonate stacking including progradational trajectory and keep up response to stillstand of relative sealevel at a low sea level position within the basin and the downslope deeper basinal settings.
Fig. 39. Transgressive carbonate stacking including retrogradational trajectory and keep-up response to rapid rising of relative sea level during a transgression across a carbonate shelf.

and New Mexico (Tinker 1998; French and Kerans2004); Carboniferous of the Sacramento Basin (Bach-tel and Dorobek 1994; Bachtel et al. 2000a, b); Creta-ceous carbonate platforms of central Texas (Kerans et al. 1997a, b; Kerans 2002); Mississippian ParadoxBasin carbonates (Eberli et al. 2005; Grammer andRitter 2008); Mississippian Mission Canyon Forma-tion (Read and Dorobek 1993; and Smith et al. 2003);Mesozoic of the Middle East (Sharland et al. 2001; vanBuchem et al. 2002, 2003); Miocene carbonates of theBalearic Islands (Pomar 1993; Pomar and Ward 1995,1999); the platform to basin transition of the Maiellaplatform, Italy (Eberli et al. 2004); and Cretaceous(Aptian) of the Maestrat Basin, eastern Spain (Bover-Arnal et al. 2009).
2. Case study: Late Jurassic(Kimmeridgian) platform-to-basincorrelation, Jura Mountains
In the Swiss and French Jura Mountains, the massivecarbonate beds of the Kimmeridgian form prominentcliffs in the landscape. These carbonates originated inthe shallow, subtropical waters of the platform that separated the Vocontian Basin (a branch of the Tethys
ocean) to the south from the Paris Basin to the north(Dercourt et al. 2000). Detailed sections have beenlogged and high-resolution sequence- and cyclostrati-graphic interpretations have been performed by Co -lombié (2002), Colombié and Strasser (2005), andColombié and Rameil (2006). Ammonites in these plat-form sediments are rare but nevertheless they do fur-nish a biostratigraphic framework (Gygi 2000). A morerefined ammonite biostratigraphy has been establishedin time-equivalent hemipelagic sections in the Vocon-tian Basin (Atrops 1982). Consequently, the platform-to-basin correlation allows the placing of recognizedsequence-stratigraphic elements into a biostratigraphicframework. This further permits a comparison of thestudied interval with the sequence-chronostratigraphicchart that Hardenbol et al. (1998) prepared for the Eu-ropean basins. For the present case study, five outcropsections are presented, focusing on the interval cover-ing the Ataxioceras hypselocyclum and Crussolicerasdivisum ammonite biozones (Figs. 41, 42).
In the platform sections, a prominent break in verti-cal facies evolution occurs where birdseyes indicatethat lagoonal lime mudstones shallowed up into a tidalflat (Court) and where birdseyes, charophytes, anddolomitization suggest intertidal to supratidal condi-
Sequence Stratigraphy: Methodology and Nomenclature 215
Fig. 40. Highstand carbonate stacking including progradational trajectory and keep-up response to stillstand of relative sealevel at a high sea level position.

O. Catuneanu et al.216
Table 1 Carbonate sequence stratigraphy and depositional setting. Carbonate sequence stratigraphy links depositional set-tings and fauna to a predictable framework of facies, geometries, systems tracts and bounding surfaces. The facies,geometries, fauna and the framework of systems tracts recorded by epeiric seas are similar to those of shelf settings.
Setting Inner Shelf Outer Shelf Margin Slope Basin
Facies
Geometry
Fauna
LST(Fig. 41)
TST(Fig. 42)
HST(Fig. 43)
Sediment homogeneous –Micrites, peloids to bioclastic packstone towackestone; local evapor-itesShallowing upward cyclescommon, predictable andcorrelatable finer carbon-ate capped by tidal-flatdominated by cyanobacte-ria and/or evaporites
Sediment heterogeneous:ooids, grapestones andhardened peloids to bioclastic grain shoals topatch reef and shoal buildupsShallowing upward cyclescommon, predictable andcorrelatable
Sediments heterogeneousto homogenous, reefalboundstones, bioclasticpackstone to grainstoneaccumulationsShallowing upward cyclescommon
Upslope: Heterogeneouswackestones to packstonesto grainstone and rudstoneoffbank transportLime mudstone-wacke-stone from fine-grainedperiplatform shedding andquiescent foreslopeLocal presence of well-sorted grain-rich tem-pestitesBrittle reef failure and de-bris of breccias and blocks(olistoliths) commonDown slope homogenousdispersed bioclastic pack-stone to mudstone fromupslope, often bioturbatedFining-upward cyclescommon
Homogenous cycles of mud-stone, marl to shale, from relative sea-level changesFining-upward cycles common
Unconfined sheets of homogeneous sedimentLocal storm-driven confined channel fills
Unconfined heterogeneoussediment sheetsLocal confined channelfillsLocal confined lens-shaped buildups
Unconfined thick to mas-sive homogeneous sheetsto linear bodies parallel(barrier shoals) or perpen-dicular (tidal channels) tomargin
Interfingering unconfinedaggraded and retrogradedforeslope clinoform sheets;thicken upslope/thindownslopeLocal confined sheets andchannel fill can be com-mon
Unconfined thin widespreadsheets
Fauna often high numbersand restricted
Fauna commonly shallowwater, heterogeneous andmoderately cosmopolitan
Fauna high numbers andcosmopolitanDownslope ecological accommodation commonwith massive boundstonesand heterogeneous open-marine ʻreef-buildingʼskeletal materials oftengrain-prone in distal por-tions; upper bounding surfaces often SB and lessvisible MFS
Fauna high numbers upslope but sparser and restricted downslopeBioturbation cosmopolitanin shallows protected fromheavy wave action; in deeper upper slope burrowing often intense
Fauna low numbers andsparse away from marginBioturbation common on surfaces with low supplyrates
FSST and subsequent LSTexposure SBs, potentialkarstification and/or no accumulation
FSST and LST commonexposure surfaces and dis-continuous mudstone towackestone fill of incisedtidal channels perpendicu-lar to margin overlain bydiscontinuous to continu-ous microbial flat sheets
FSST and LST include ex-posure surfaces, or, wheresea-level fall less, forcedregressions of packstoneand wackestone facies ofshoreline bodies of upperslope area (perchedparasequences) parallel tomargin
FSST and lowstand LSTerosional surfaces fromsediment bypass from upslope, downslope fromforced regressive shore-lines with wackestone andpackstone facies extendingdownslope from the basinmarginFSST/LST collapse margin megabreccias atsea-level falls
LST and TST (and earlyHST) when platforms ag-grade rapidly they, and slope,supply debris and mud flows
TST often missing or reworked earlier sediments
TST onlapping linearsheets parallel to marginwith local aggradation ofTST lenses
TST onlapping sheets ofopen-marine facies ofmudstones, wackestonesand packstone sheets
TST onlapping sheets ofopen-marine facies ofargillaceous lime mud-stone and wackestone; local buildups, especiallyover topographic highs
LST and TST (and earlyHST) when platforms ag-grade rapidly they, and slope,supply debris and mud flows
HST base of organic-richargillaceous carbonate orshale
HST elevated aggradation-al, linear, ribbons of lime-sand barriers and shoalsparallel to margin cappedby subaerial SBs
HST base of finer limemudstones and wacke-stones, and overlain by aggrading shallowing-upcycles of grainstone rib-bons parallel to the plat-form margin and massivemerging boundstone paral-lel to margin capped bysubaerial SB
HST lime mudstone towackestone sheets frommargin, SB erosional tosubaerial unconformitycaps
HST platform shedding,grain-flow, density-flow and turbidite sands and lesslime mud. Lower slope thinning-thickening upwardcalciturbidites metre-scaleand upwards beds, product ofmillennial eustatic or climaticchange

tions with local freshwater lakes (Péry-Reuchenette;Fig. 41). At Pichoux, black pebbles and a restricted-la-goonal mudstone point to very shallow conditions. Inthe basin, at Châteauneuf-d’Oze, a slump in the Atax-ioceras hippolytense subzone implies slope instability.At Crussol, thick limestone beds suggest low sea lev-el that forced export of carbonate mud from the plat-form (Colombié and Strasser 2003). Hardenbol et al.(1998) placed a sequence boundary ʻKim2ʼ at the baseof the A. hippolytense subzone. It is therefore suggest-ed that the observed features (indicating a fall in rela-tive sea level) correspond to this sequence boundary.
Facies in the platform sections occur in beds andbedsets that can be interpreted as small-scale deposi-tional sequences (Strasser et al. 1999). While the indi-vidual beds do not necessarily display a facies evolu-tion indicating a relative sea-level fluctuation, the bedsets can in several cases be interpreted in terms ofsequence stratigraphy: they commonly have an erosivebase, display a deepening-up part composed of la-goonal packstones to grainstones with reworked mate-rial, and have a maximum-flooding to early highstandpart with low-energy wacke- to mudstones. Towardsthe top of these sequences, higher energy deposits in-dicate shallowing towards the following bounding surface (e. g., small-scale sequences 3 and 4 at Péry-Reuchenette). Through their stacking pattern and with-in the given bio-chronostratigraphic framework it canbe shown that these small-scale sequences formed intune with the orbital short eccentricity cycle of 100 kyr(Colombié 2002; Strasser 2007). The basinal sectionsof Crussol and Châteauneuf-d’Oze are dominated bylimestone-marl alternations. Each couplet is thought tocorrespond to the orbital precession cycle of 20 kyr.The 100-kyr cycles are visually less well expressedthan in the platform sections. However, Boulila et al.(2008) performed a cyclostratigraphic analysis includ-ing the Châteauneuf-d’Oze section and confirmed thepresence of the 100-kyr as well as the 400-kyr eccen-tricity cycles.
The maximum flooding of the large-scale (Kim2-Kim3) sequence is indicated by a change from gener-ally high-energy deposits to low-energy mudstones atPichoux and Court (uppermost part of small-scale se-quence 5). Even during maximum-flooding conditionswater depth was very shallow to intertidal, as indicat-ed by birdseyes and microbial mats. At Péry-Reuch-enette, an equivalent facies change occurs 100 kyr lat-er and coincides with the maximum-flooding surfaceof small-scale sequence 6. In the basinal section ofCrussol (and in several other sections of the Vocontian
Basin; Atrops 1982), the Ataxioceras lothari subzonecomprises 16 limestone-marl couplets, correspondingto 320 kyr (Hardenbol et al. 1998, indicated 300 kyr).At Châteauneuf-d’Oze, only 5 couplets are counted.At the base of the A. lothari subzone, the marly inter-val and a peak in manganese suggest condensation related to maximum flooding (De Rafélis et al. 2001).A second marly and thin-bedded interval with a man-ganese peak appears in the C. divisum zone. It corre-sponds to the condensed interval of the Kim2-Kim3sequence identified by Hardenbol et al. (1998) in manyother European basins. Correlating this interval up tothe platform, it is seen to correspond to the maximumflooding identified at Péry-Reucenette (Fig. 41). Theequivalent of sequence boundary Kim3 of Hardenbolet al. (1998) is indicated by charophytes, black peb-bles, dolomite, and birdseyes in the platform sections,and by thick limestone beds in the basin. It is situatedin the C. divisum ammonite zone.
In the absence of laterally continuous outcrop in thevegetated Jura Mountains and in the absence of seismiclines, it is not possible to reconstruct the geometries ofthe sequence-stratigraphic elements. In the platformsections, the general facies trends within the large-scaleKim2-Kim3 sequence do not imply deepening or shal-lowing that would indicate retrogradation or prograda-tion. However, many bedsets (small-scale sequences of Strasser et al. 1999) exhibit deepening-shallowingtrends. It is therefore suggested that the Jura platformwas in a general aggradational mode during this timebut that high-frequency (orbitally controlled) sea-levelfluctuations were superimposed on this long-term trendand controlled the facies evolution.
Across the whole platform, carbonate productionwas high enough to constantly fill in the availablespace, even during the transgressive part and the max-imum flooding of the large-scale sequence. Tidal flatswere common and islands with fresh-water lakes (as in-dicated by the charophytes) formed sporadically. Theabsence of karst or soils indicates that sea level neverdropped below the platform edge and that the high-fre-quency sea-level fluctuations were of low amplitude.The fact that the studied large-scale sequence is signif-icantly thicker at Péry-Reuchenette implies differentialsubsidence. The Jura platform was part of the northernpassive margin of the Tethys Ocean where extensionalblock-faulting was common (Wildi et al. 1989).
The slump at Châteauneuf-d’Oze represents a low-stand deposit. The thick limestone beds at Crussolformed during lowstand but also during transgressiveconditions when carbonate mud was exported from the
Sequence Stratigraphy: Methodology and Nomenclature 217

O. Catuneanu et al.218
Fig
.41.
Cor
rela
tion
of t
hree
pla
tfor
m a
nd t
wo
basi
nal
sect
ions
. Num
bers
in
colu
mns
to
the
left
ind
icat
e sm
all-
scal
e (1
00-k
yr)
sequ
ence
s. F
orle
gend
see
Fig
.42.

platform. During transgression, the energy on the plat-form was generally higher, which resulted in the re-curring pack- and grainstones there. In the basin, a firstcondensed interval formed while on the platform nochange in stacking pattern or facies is observed. Thesecond condensed interval, however, corresponds tothe shift from rather high-energy deposits to low-ener-gy facies on the outer platform (Péry-Reuchenette).This shift, however, happened earlier in the platforminterior (Pichoux and Court). Due to the high-frequen-cy sea-level fluctuations that were superimposed onthe long-term trend and due to the irregular platformmorphology, the threshold apparently was not passedat the same time all over the platform. The highstanddeposits are quite thin in the basin while they are welldeveloped on the platform. According to the time-linesgiven by the cyclostratigraphic interpretation, the latehighstand is much reduced in the platform interiorwhile at Péry-Reuchenette subsidence was sufficientto accommodate thick peritidal deposits.
This case study demonstrates that the combination ofsequence stratigraphy and cyclostratigraphy allows thereconstruction of systems tracts with a high time reso-lution. It is seen that the physical expression of se-quence-stratigraphic surfaces (as defined by facieschanges in the outcrop) can be shifted in time due tovarying basin morphology and due to superposition ofhigh-frequency sea-level fluctuations on a longer-termtrend of sea-level change (Strasser et al. 2000). If a spe-cific surface cannot be physically followed from onesection to the other, it may therefore be of advantage to
define ̒ sequence-boundary zonesʼ or ̒ maximum-flood-ing intervalsʼ (Montañez and Osleger 1993; Carter et al.1998). This study emphasizes the complexity of car-bonate systems where organic sediment production,sea-level changes, and subsidence patterns interact.
3. Case study: Mid-Cretaceouscarbonate platform of the MaestratBasin, Iberian Chain
The mid-Cretaceous carbonate system of the westernMaestrat Basin in the Iberian Chain shows clear faciespatterns and distinct key surfaces which enable sedi-ment-body geometries to be defined and interpreted interms of the 4-systems tract model of Hunt and Tuck-er (1992, 1995). Deposition during the late Early –Middle Aptian was controlled primarily by two ordersof relative sea-level change, and the higher-frequencysea-level rhythms created four types of meter-scale cycle (Bover-Arnal et al. 2009). The lower-frequencycyclicity resulted in five well-differentiated systemstracts within two depositional sequences: a highstandsystems tract (HST) and falling-stage systems tract(FSST) of depositional sequence A; and a lowstandsystems tract (LST), transgressive systems tract (TST)and highstand systems tract (HST) of depositional se-quence B (Fig. 43). The systems tracks could be sepa-rated and identified on the basis of well-developed keybounding surfaces, namely a basal surface of forcedregression, a subaerial unconformity and its marinecorrelative conformity, a transgressive surface and amaximum flooding surface. These are all broadly iden-tifiable and correlatable throughout the platform-to-basin transition.
The first HST of depositional sequence A consistsof prograding rudist-coral framestones-rudstones-floatstones. The succeeding FSST consists of a de-tached, slightly cross-bedded bioclastic pack/grain-stone unit situated at the toe of the slope in a basinalposition. The LST is characterized by a small carbon-ate platform dominated by rudists and corals, and thisdownlaps over the FSST and onlaps landwards overthe sequence boundary. The TST exhibits platformbackstepping and is composed of more marly, locallybioclastic wackestones. The second HST is character-ized by prograding units of bioclastic, rudist-coralpack/grain- stones as high rates of carbonate produc-tion resumed on the platform and skeletal debris wassupplied to the slope. Bover-Arnal et al. (2009) tookthe view that the sequence boundary should be placedabove the forced regressive wedge, below the low-
Sequence Stratigraphy: Methodology and Nomenclature 219
Texture
marlsmudstonewackestonepackstonegrainstone
mMWPG
Sequence stratigraphy
sequence boundary maximum floodingcondensed section
Kim2MFCS
Facies
limestone with quartzlimestone with dolomitepeloidsoncoidsooidslithoclastsblack pebblesbrachiopodsechinodermsforaminiferacoralsgreen algaebivalvesgastropodscharophytes
Sedimentary structures
birdseyesbioturbationmicrobial matlamination
Fig. 42. Legend for Fig. 41.

stand prograding wedge. On a more regional, evenglobal scale, these systems tracts occur within twolarger-scale Aptian T-R sequences.
On a smaller scale, the Maestrat succession is madeup of four types of meter-scale cycle resulting fromhigher-frequency sea-level fluctuations. These basi-cally accretional units are composed of ten lithofaciesassociations, which are interpreted in terms of ba-thymetry, hydrodynamic conditions and trophic levelof the various depositional environments. This Maes-trat Basin carbonate platform had a flat-topped non-rimmed depositional profile with well-developed rud-ist-bivalve floatstones containing corals, interpreted aslargely formed below wave-influence. For the mostpart, deposition of all these Aptian carbonates tookplace in low energy hydrodynamic conditions.
One feature of particular interest is that the majorsea-level fall recorded in this succession at the end of the first HST during the uppermost early Aptian(Dufrenoyia furcata biozone) was likely on the orderof tens of meters and appears to have been a global
event. This fall that subaerially exposed the carbonateplatform, led to the deposition of the FSST. Of the various mechanisms that could trigger a significantsea-level drop in less than 1 Myr, glacioeustasy was in-voked and this event could correlate with the coolingepisode proposed for this time slice (Hochuli et al.1999; Steuber et al. 2005).
Mixed carbonate-evaporite settings
1. Introduction
In evaporite systems, precipitation takes place in arange of shallow- to deep-water environments at timesof increased aridity (see review in Warren 2006). Themajority of the world’s thickest and most extensiveevaporite successions were precipitated in intracraton-ic basins, which were separated from the world oceanby some barrier. Examples include the Zechstein,Williston-Elk Point, Michigan, Paradox, Delaware,
O. Catuneanu et al.220
HST
HST
N
TST
Platform backstepping
MFS
FSST
BSFR
LST
TS CC
TRS/SU
15 m
Fig. 43. Sequence stratigraphic framework of an Aptian platform-to-basin carbonate succession in the western MaestratBasin (from Bover-Arnal et al. 2009). See Bover-Arnal et al. (2009) for full facies descriptions and interpretations. Abbre-viations: HST – highstand systems tract; FSST – falling-stage systems tract; LST – lowstand systems tract; TST – trans-gressive systems tract; BSFR – basal surface of forced regression (= correlative conformity sensu Posamentier and Allen,1999); CC – correlative conformity sensu Hunt and Tucker (1992); TS – transgressive surface (in this case, a transgressiveravinement surface reworking a maximum regressive surface); TRS – transgressive ravinement surface; SU – subaerial un-conformity; MFS – maximum flooding surface.

Moscow and Siberian basins. In most of these, carbon-ate platforms developed around the basin marginswhen there was free circulation within the basins andopen connection with the ocean. Evaporites were com-monly precipitated in sabkhas and hypersaline lagoons,often extremely extensive, behind the carbonate rims.The evaporites within the basin centers, where thethickest successions occur (the saline giants), were precipitated at times of reduced connection with, orcomplete isolation from, the open ocean, through theoperation of a sill or barrier. Once sea level has droppedbelow the height of the barrier to cut the basin off totally, then the basin may draw down very quicklythrough evaporation. Some water will seep into thebasin through marginal permeable rocks, and there maybe some reflux of hypersaline brines out of the basin.In a similar way, global sea level may only need to risea few meters to overtop the barrier and flood the basin.Much greater and more rapid water-level changes canthus be expected within such silled basins comparedwith those normally considered for siliciclastics andcarbonates deposited on passive margins and in othercompletely open basins. In addition, sea-water andbrine levels within an isolated saline basin may vary in-dependently of global sea level, responding especiallyto climate changes and tectonic effects.
In terms of sequence stratigraphic models for car-bonate-evaporite basins, two principal types were dis-tinguished by Tucker (1991), depending on the degreeof drawdown: model 1, incomplete drawdown, givingmarginal gypsum wedges and basinal laminated gyp-sum, and model 2, complete drawdown, giving halitebasin-fills (Figs. 44, 45). More recent discussions ofthese and other aspects of evaporite sequence stratig-raphy have been presented by Sarg (2001) and Warren(2006). The origin of sequences is generally assumedto be related to cycles of salinity change, but other ecological factors such as temperature may be equallyimportant in controlling facies and faunal cyclicity incarbonate-evaporite settings (Pratt and Haidl 2008).
Prior to the onset of evaporite precipitation, an in-tracratonic basin is typically fully connected to theworld ocean, with the sea level above sill height. Car-bonate platforms will occur around the basin and ex-tensive shallow-water biogenic and abiotic carbonatesedimentation will take place under the generally idealhot and dry climate, where there is limited siliciclasticinput. Retrogradational (TST) carbonates followed byaggradational-progradational (HST) shallow-watercarbonates would be developed, with thin (condensed)pelagic carbonates and hemipelagic mudrocks withinthe basin center (Figs. 44.1, 45.1).
Sequence Stratigraphy: Methodology and Nomenclature 221
vv v
vv
vv
vv v
vv
v
v
vvvvv v
vvvv v v
1. highstand open basin, carbonate rim
2. falling stage & lowstand marginal gypsum wedge
3. early TST retrogradational sabkha/evaporitic lagoons 6. late HST sabkha/evaporitic lagoons
5. highstand rimmed shelf
4. TST retrogradational carbonateopen ocean
sill/barrier
basinal laminites:carb/gyps/org C
reworked, slumped gypsum
shelf selenitesabkha sulphate
basinal carbonates
condensedsection
pinnacle reefs/mudmounds formed during TST
LSW
LSW
LSW
LSW
HST
HST
HST
HST
HST
HST
HST
TST
TST
TST
TST
TST
TST
TST
TST
sb
SL
Fig. 44. Carbonate – evaporite intracratonic basins: sequence stratigraphic model for a basin with incomplete drawdown,leading to basin-margin gypsum wedges (from Tucker 1991).

O. Catuneanu et al.222
vv v
vv
vv
vv v
vv
v
v
vv
vv
vv
vv
vv
v vv
vv v
v
v
vv
v v
vv
vv
v
v vvvvvvvvvvvvvvvvvvvvvvv
vvv
vvv
vv
v vvvvvvvvvvvvvvvv
vvvvvvv
v
v
vvv
vvvvv
vvvvv
v
v
vv
vvv
vvvvvvvvvvvvvvvvvv
vvv vvv
vvvvvvvvvv
vvvv v v
vv
v vvvvv
vv
vv
vvvvvv
v
vvvvvvv
v
v
vvv
vvvvv
vvvvv
v
v
vv
vvv
vvvvvvvvvvvvvvvvvv
vvv vvv
vv
vvvvvvvv
vvvv v v
1. highstand open basin, carbonate rim
2. falling stage & lowstand gypsum wedge during slow sea-level fall
3. lowstand halite pans and lakes
6. highstand rimmed shelf/ramp through basin-centre subsidence
open ocean
sill/barrier
seapage
if fast fall nogypsum wedge
pinnacle reefs/mudmounds formed during TST
LSW LSW
HST
HST
HST
HST HST
TST
TST TST
TST
sb
SL
4. basin-fill halite (BFH), early TST gypsum
LSW LSWHST HST
TST TST
5. highstand aggraded platform
LSW LS-BFH LSWHST HST
TST TST
LSW
LS-BFH
LSWHST HST
TST TST
Fig. 45. Carbonate – evaporite intracratonic basins: sequence stratigraphic model for a basin with complete drawdown lead-ing to basin-fill halite (from Tucker 1991).
Forced regressionWith a forced regression and sea-level falling close to or just below the sill height, the water level within the basin will quickly fall below the shelf break of the marginal carbonate platforms through evaporativedrawdown. Water within the basin will rapidly becomehypersaline, although some seawater replenishmentmay occur as a result of seepage through permeablecarbonates near the barrier. Gypsum will precipitate inabundance around the basin margins during this FSST,below the carbonate platform rims, to initiate wedges(Figs. 44.2, 45.2). On the basin floor, carbonate willcontinue to be deposited in the early stages of draw-down until the basinal waters themselves are saturatedfor calcium sulphate.
During the falling stage and subsequent lowstand,the marginal carbonate platforms will be exposed andmay be subjected to subaerial erosion, karstificationand, potentially, massive dolomitization. Fluvial inci-sion and siliciclastic influx may occur if there is hin-terland topography, but under an arid climate theamount of sand supplied may be limited.
Lowstand normal regressionIn the situation of incomplete drawdown, where thebasin always contains some water through partial tonear-complete isolation from the world ocean, extensivemarginal gypsum wedges will prograde into the basin.Gypsum precipitation during this time of more stablesea level within the basin may take place in shallow, la-goonal hypersaline waters as selenitic gypsum. Gypsumplatforms may form within the basin on local topo-graphic highs, as occurred in Poland during the upperPermian (Slowakiewicz and Mikolajewski 2009). Me-ter-scale sedimentary cycles (parasequences) may bedeveloped within the wedge if there are higher frequen-cy relative water-level changes within the basin. Resed-imentation of gypsum into deeper water by storms,slope failure, debris flows and turbidity currents willgive graded beds, slumps and breccias, and contributetowards the progradation of the gypsum platforms.Within the basin center, fine-grained gypsum will beprecipitated from surface waters on to the basin floor,and this may be interlaminated with carbonate and/ororganic matter, reflecting seasonal variations in precip-itation and plankton blooms. Salinity stratification ofthe water mass can be expected, and a pycnocline islikely to form too, through the weak circulation of wa-ter within the basin. This will enhance organic matterpreservation. Selenitic gypsum may be precipitated onthe basin floor if the water depth is below about 25 m.
If the conditions for subaqueous gypsum precipitationwithin the basin center are maintained for a long periodof time, a thick succession of sulphate laminites willform, perhaps with selenitic beds, and this could fill thebasin. Such was the case in the Permian Castile Forma-tion of Texas (Anderson et al. 1972). Reflux of brinesout of the basin and/or a relative humidity control maybe required to prevent halite precipitation.
A basin may endure complete drawdown during thelowstand, if there is a major drop in sea level well belowsill-height or there is complete blockage of the basin entrance (Fig. 45). If the climate is arid enough (atmos-pheric relative humidity below 76%) and there is virtu-ally no replenishment from the adjacent ocean or fromsurface run-off, then halite will be precipitated on thebasin floor, with deposition taking place in salt pans and salt lakes (Fig. 45.3). If the lowstand follows a veryrapid forced-regressive drawdown, there may be littlegypsum precipitated in basin-margin wedges. If there issufficient water seeping into the basin through perme-able rocks at the sill, then enough halite may be precip-itated to completely fill the basin (Fig. 45.4). Potashsalts may form in instances of extreme desiccation.
TransgressionWhen the basin is reconnected to the open ocean, theformerly exposed carbonate platforms will be re-flood-ed and carbonate deposition may resume there in trans-gressive, retrogradational (TST) geometries (Figs. 44.3,44.4). The early deposits of the TST along the shelf mar-gin could still be evaporitic if hypersaline shallow wa-ters were maintained long enough to establish sabkhasand salterns (Fig. 44.3).
In a lowstand halite-filled basin, initial deposits ofthe TST would likely still be hypersaline (Fig. 45.4).Dissolution of salts by the incoming seawater wouldmaintain hypersalinity for a time. Gypsum sabkhas andlagoons could be established and extend back over theformer marginal carbonate platforms. Where lowstandhalite has completely filled the basin, all original to-pography will have been removed and, in the absenceof any differential subsidence, succeeding transgres-sive carbonates will be deposited in an extensive shal-low sea, and highstand carbonates could well show arestricted fauna with further evaporites (Fig. 45.5).
Highstand normal regressionOnce a basin has been completely re-flooded and fullyconnected to the open ocean then normal shallow-ma-rine carbonates can be expected again on the marginalplatforms with highstand progradation (Figs. 44.5,
Sequence Stratigraphy: Methodology and Nomenclature 223

45.5). The area of shallow-water carbonate depositioncould now be much more extensive in view of the for-mation of the gypsum wedges and platforms during thepreceding forced regression and lowstand. The newcarbonate shelf margin will be located along the outer(basinward) edge of the gypsum wedge. Around the in-ner margins of the platforms, sabkhas and hypersalinelagoons could be very extensive during the highstand,although not necessarily creating thick successions(Figs. 44.6, 45.5).
DiscussionThick and relatively rapidly-precipitated evaporitescan have a significant loading effect on the crust (Vander Belt and de Boer 2007). This may well lead to in-creased subsidence of basin margins and basin floors,thereby creating further accommodation for moreevaporites (Fig. 45.6).
In terms of key surfaces, the depositional sequenceboundary will occur on the upper surface of the plat-form carbonates, where it could be represented by a pa-leokarst, or evaporite residue from later dissolution ofinner platform sabkha-lagoonal evaporites. Dolomitesmay occur and be related to the sequence boundary as
a result of seepage reflux. The correlative conformityof this surface in the basin would be best taken at the base of the evaporites, as a major facies change butalso marking the beginning of forced regression. Thiswould also be at the base of gypsum-carbonate/car-bonaceous laminites in the central part of the basin.
In a basin of incomplete drawdown, the sequencewould consist of an evaporitic lower part (the forced regressive-lowstand gypsum wedge and succeedingearly TST sabkha/lagoonal gypsum) passing up and lat-erally into platform carbonates of the TST and HST. Ina basin of complete drawdown, forced regressive gyp-sum could be succeeded by extremely thick lowstandhalite, before transgressive evaporites and then carbon-ates as the basin reflooded. Evaporites may also bepresent in the uppermost part of the sequence from deposition in late HST-early FSST sabkhas and hyper-saline lagoons on the inner part of the carbonate plat-form. Thus, in addition to the controls of climate onevaporite occurrence, evaporite precipitation is muchcontrolled by base-level change and accommodation.Evaporites occur in thick successions at basin marginsand in basin centers predominantly during lowstands ofsea level (global or regional). However, they may also
O. Catuneanu et al.224
vvv
vv v
vvvvvvvvvv
vvvvvvvvvvvv vvvv
vvvvvvvv v
vvvv
vvvvvvvv
vvvv
vvvv vvv
v v
vv
vvvvvvv vvvvv vvvv
vv
vvvvv
vvvv v
vv
v
v vv
vv
v
v
vv
vvvv
vv vv
v
vvvvv vvvvvvv
v vv
vvvvvv
vv vvv
vvvvvv
v
v
v
v
v
vvvvvvvvvvv
vvv vv
vvvv v
vv v
v
v
v
v
vvv
vvvvvv
vvvvvvvv vv
vvvv
vv
v
vvv
vvvvvvvvvvvvvvvv
vv v v
vvv
vv
vvvvvv
vv
vv
vv
v
v
v
vvv
v
vv
v
vvvv
vv
vv
vv
v
vv
vvvv
vvvvvvvvvv v
v
vvvv
v
vvv
v
v
vv
v
vv
vvv
v
vv v v
vv
v
v
v
v
v
vvv
vv vvvv
vv
v
vvv v
vvvvvv
vv
vv
v
v
vv v
v
vv
vvvv
vvvvvvv
vvvvvv
basinwardlandward
sabkha
siliciclastic-richalluvial-fill
carbonatemargin
key
carbonateplatform
carbonateslope
halite
subaqueousgypsum/anhydrite
HST
HST
HST
HST
HST
FSST
LST
LST
LST
ts
sb
TST
TST
TST
mfs mfs
mfs
TSTsb>
sb>
<sb
<sb
high
low
LS evaporites
relativesea level
FSST
sb
Fig. 46. Summary diagram of evaporite-carbonate lithofacies distribution in a sequence stratigraphic framework. Evapor-ites can occur within all systems tracts but are preferentially developed within the basin during falling-stage and lowstandsystems tracts, and on the platform itself during early transgressive and late highstand to falling-stage systems tracts (afterSarg 2001). The designation of sequence boundary in this diagram conforms with Posamentier and Allen (1999).

be precipitated in quite thick sections on platforms andshelves around basins during transgressive times whenaccommodation is being created. During highstands,evaporites may continue to be formed inboard of car-bonate platforms, generating sabkha and other arid-zone type cycles/parasequences, but these evaporiteswill generally be relatively thin. Figure 46 summarizesthe sequence stratigraphic context of evaporites.
2. Case study: The Upper Permiancarbonate-evaporite succession(Zechstein) of NW Europe
The Upper Permian Zechstein strata of NW Europewere deposited in the Southern Permian Basin, whichstretched for 1500 km from eastern Britain to easternPoland. The Zechstein succession has traditionally beendescribed as a series of carbonate-evaporite cycles, fivein total, which can be correlated across the whole basinwith some local variations (Taylor 1990; Menning et al.2006). Applying sequence stratigraphic concepts to theZechstein (Tucker 1991) has some advantages since thestratigraphy of whole basin is considered rather that justthe basin center as in the cycle concept. In addition, sequence stratigraphy extends the degree of predictionto the basin-margin platform carbonates and their dia-genesis, that is not evident in a cycle approach.
In NE England, the first-cycle platform carbonates(Z1Ca = Zechstein First-cycle carbonates) are theRaisby and Ford formations (equivalent to the Zech-steinkalk of continental Europe), with the first being a distally-steepened ramp deposit and the second arimmed shelf (Figs. 47 and 48). Each of these plat-forms is one sequence (ZS1 and ZS2 = Zechstein Se-quence 1 and 2), each dominated by transgressive andhighstand carbonates, and the SB between the two is akarstic surface. A major slide deposit (megabreccia)was generated during the forced regression that termi-nated Raisby deposition.
Subsequently, the Zechstein basin was subjected toa partial drawdown and during forced regression andlowstand, the Hartlepool Anhydrite (= Werra) was pre-cipitated as a 180 m thick and 30 km wide gypsumwedge, against the former shelf-margin carbonateslope. Much of the anhydrite is nodular, but this couldwell be a replacement of selenitic gypsum, precipitat-ed in shallow water. Slumps, debrites and turbiditeshave been described from the Werra Anhydrite of Ger-many and the Netherlands. In the southern North Seaand Poland, halite units occurring within the anhydritewere precipitated in salt lakes.
The succeeding carbonates (Roker Formation, equiv-alent to the Main Dolomite of Poland, second Zechsteincycle carbonates, Z2Ca), are transgressive and high-stand systems tracts, and with the underlying evaporitesform Zechstein sequence 3 (ZS3). The Roker mostlyconsists of shelf-margin oolite (60 m thick) with micro-bial bioherms. The shelf margin was now more basin-ward than the earlier carbonate margin as a result of the development of the gypsum wedge. The foreslopefacies (110 m thick) consists of graded beds, slumps and laminites, with well-developed cycles controlled bymillennial-scale and Milankovitch rhythms (Mawsonand Tucker 2009). To landward, marls and evaporiteswere deposited in shelf lagoons and sabkhas, mainlyduring the highstand.
Another forced regression and lowstand led to theprecipitation of further evaporites: the Fordon Evapor-ites (= Stassfurt in continental Europe). Marginal gyp-sum wedges were formed but in contrast to the earlierHartlepool-Werra evaporites, the basin was subjected tocomplete drawdown and so was completely filled withhalite (thickness exceeding 300 m). Late-stage poly-halite attests to extreme desiccation. In the basin center,the uppermost part of the evaporite section above thehalite is a very persistent anhydrite bed (the Deck An-hydrite); this represents the early stage of the succeed-ing transgression. Overlying carbonates (Z3Ca, SeahamFormation, Plattenkalk in Poland, maximum 100 mthick) are uniform, peloidal mudstone to packstone, lo-cally oolitic and bioclastic (restricted fauna), with cross-lamination and local storm bedding. This aggraded shelfdeposit extended for at least 100 km before passing intodeeper-water laminated carbonates, since now much ofthe basin accommodation was filled with evaporites.The Hartlepool-Werra evaporites (FSST, LST) and suc-ceeding Seaham-Plattenkalk carbonates (TST, HST)comprise Zechstein sequence 4 (ZS4).
The top part of the Zechstein succession, the third tofifth carbonate-evaporite cycles, generally has less car-bonate, more clastics and thinner evaporites, of whichsome are potash facies, especially carnallite (KCl).With these facies, deposition took place in sabkha, lagoonal and lacustrine environments, with clasticsfrom coastal plains and distal alluvial fans, the wholesuccession now becoming much more continental.These deposits could be subdivided into three se-quences, but they are relatively thin, and so could be regarded as higher-frequency cycles (parasequences)of one sequence (ZS5).
Examining a carbonate-evaporite succession in termsof its chronostratigraphy (Fig. 48) is instructive. This
Sequence Stratigraphy: Methodology and Nomenclature 225

O. Catuneanu et al.226
oo o o
oo
o oo
o
o o o
o o o
o o o
o o oo o
o o
oo
oo
oo o
o
o
o
o
oo
ooo
o
oo
oo
oo
oo
oo
oo
oo
oo
oo
o oo
oo
oo
oo
oo o
o oo
ooo
ooo
oo
oo
o
oo
oo
oo
oo o
oo
oo
o oo
oo
o oo
oo
ooo
oo
o
oo
o
oo
oo
oo
oo
o
oo
oo
oo
oo
oo
oo
oo
oo
--
-- -
--
---
--
----
--
-- -
--
--
----
--
-- - -
--- --
--
--
-- - - -
-- -
--
##
##
##
##
#
#
##
##
##
##
#
vv
v
vv
vv
vv
vv
vv
vv
vv
vv
vv v
vv
vv
vv
vv
vv
vv
vv
vv
vv
vv
v
v vv
vv
vv
vv
vv
vv
vv
v
v
v
v
v
vv
vv
vv v
v
vv
vv
vv
vv
v
vv
v
vv
v
v
vv
vv
vv
v
vv
vv
vv
v
vv
vv
vv
vv
vv
vv
v
xxx xx
xx
xxx
xx
x
xx
xx
oo
oo
++
+++
++
++
++
++
+
oo
oo
oo
oo
oo
o
oo
o
WE
ST
EA
ST
50m
50km
Rox
by F
m. /
Litt
lebe
ck A
nhyd
rite.
Sle
ight
s S
iltst
one
/ Sne
aton
Hal
ite.
Bou
lby
Hal
iteB
illin
gham
Anh
ydrit
e
Sea
ham
Fm
.
Rok
er F
m.
For
d F
m.
Rai
sby
Fm
.
Har
tlepo
ol A
nhy
Yello
w S
and
/ Rot
liege
nd
Car
boni
fero
us
For
don
Eva
porit
es
Mar
l Sla
te
Edl
ingt
on F
m.
She
rbur
n A
nhyd
rite
Tria
ssic
ZS
7
ZS
6
ZS
5
ZS
4
ZS
3
HS
T
HS
T
HS
T
HS
T
HS
T
HS
T
TS
T
TS
T
TS
T
TS
T
TS
T
LST
LST
LST
/TS
TB
FH
LST
LST
LS -
BF
HLS
W -
G
ZS
2
ZS
1
sb sb sb sb sb sb sb sb sb
appr
ox s
cale
0
Illiti
c S
hale
sand
ston
e
wac
kest
one
brec
cia
lime
mud
ston
e
ooid
spe
loid
s
bedd
edha
lite
reef
gyps
um/
anhy
drite
lam
inat
edgy
ps/a
nhy/
carb
.
K+
salts
halit
e
KE
Yo
o
v #+
+
ooo x
Fig
.47.
Lith
ostr
atig
raph
y of
the
Upp
er P
erm
ian
stra
ta o
f NE
Eng
land
and
Nor
th S
ea, s
how
ing
four
maj
or c
arbo
nate
pla
tfor
ms
(Rai
sby,
For
d, R
oker
and
Seah
am f
orm
atio
ns),
and
two
maj
or e
vapo
rite
suc
cess
ions
(ba
sin-
mar
gin
Har
tlepo
ol A
nhyd
rite
and
bas
in-f
ill F
ordo
n ev
apor
ites)
(fr
om T
ucke
r 19
91).

approach highlights the stratigraphic breaks, which pri-marily occur on the platforms surrounding the basin attimes when thick units of evaporites were being precip-itated in the basin. Platform sequences are dominantlytransgressive to highstand carbonates with increasingevaporitic deposition towards the top of the highstand,and with platform interior sabkha-saltern parasequenc -es. By way of contrast, basin center sequences arefalling-stage and lowstand evaporites (laminated gyp-
sum/anhydrite and bedded halite), passing up into trans-gressive-highstand pelagic, starved-basin, condensedorganic-calcareous rhythmites, possibly with highstandcalciturbidites derived from adjacent platforms.
In recent years, other sequence stratigraphic inter-pretations have been published for the Zechstein ofNW Europe including Strohmenger et al. (1996) forGermany, Peryt and Wagner (1998) and Slowakiewiczand Mikolajewski (2009) for Poland. Differences re-
Sequence Stratigraphy: Methodology and Nomenclature 227
Fig. 48. Chronostratigraphy of the Permian Strata of NE England and the adjoining North Sea (from Tucker 1991).

late to decisions of where to place the sequence bound-ary, and more data being available (from core andwell-logs) on evaporite facies, especially relating todeposition during the late HST, and evaporite rework-ing during the late LST-TST.
Mixed carbonate-siliciclasticsettings
1. Introduction
Terrigenous material generally has a detrimental effecton carbonate production, affecting the carbonate-se-creting organisms in several ways. Turbidity caused byfine-grained material in suspension affects organismsby reducing light penetration, driving animals andplants to live at shallower depths, while clogging uptheir feeding mechanisms. Sudden influxes of terrige-nous mud and sand can smother and bury organisms,and high nutrient levels which often accompany ter-rigenous input, can lead to intense microbial activity.This has a deleterious effect on many higher organismswhich produce carbonate skeletal material since manyare oligotrophic. Carbonate-producing organisms how-ever have made many adaptations to clastic input andthere are also many examples today where such animalsare happily growing in areas of terrigenous sedimenta-tion. This can lead to the formation of patch reefs onclastic shelves for example (e. g., the inner part of theQueensland shelf, inboard from the Great Barrier Reef;Larcombe et al. 2001), or to reefs growing on aban-doned delta-front bars in areas dominated by terrige-nous mud (e. g., the Mahakan Delta, Indonesia; Wilsonand Lockier 2002). In the Red Sea, coral reefs are inclose proximity to wadi-fan delta systems which peri-odically shed clastics over the reefs (e. g., Tucker 2003).There are numerous examples in the geological recordof reefal carbonates associated with clastics (e. g., San-tisteban and Taberner 1988; Braga et al. 1990).
Mixed-lithology sequences are of two broad types. In some cases the clastics, generally fine- to coarse-grained, occur above carbonates towards the top of a sequence (lower carbonate – upper clastic sequences),whereas in others, the clastics, dominantly mudrocks,occur in the lower part of the units, beneath the carbon-ates (lower mudrock – upper carbonate sequences).These mixed-lithology packages are developed wherecarbonate platforms are attached to terrigenous sourceareas (deltas, coastal mudflats) or where there is an ax-ial supply of clastic material to the basin, through long-
shore-drift and shoreline-parallel currents in shelf envi-ronments, and contour-flowing currents, tide-induced orwind-driven circulations dispersing micrite in slope-basinal environments. The clastic input is mostly con-trolled by sea-level and base-level changes, or throughfault-related uplift, advancing thrust sheets as in fore-land basins, or climatic effects. Clastic input and distri-bution, however, is not restricted to low stands of sealevel, as commonly supposed.
Lower carbonate – upper fine-to-coarse-clasticsequencesFollowing the deposition of transgressive and high-stand platform carbonates, which may involve slopeprogradation through clinoforms, clastic sediments arecommonly deposited during the late highstand-forcedregression-lowstand. Prograding clastic shorelines, flu-vial plains and aeolian sand sheets may develop duringthe late highstand along the platform interior. Duringthe forced regression, palaeosoils may form on the plat-form top, and incised valleys cut into the platform.Clastic sediment supplied to the basin during the FSSTand lowstand will lead to lowstand wedges on the low-er foreslope of the platform and the basin floor. This isthe notion of reciprocal sedimentation: lowstand shed-ding of clastics and highstand shedding of carbonates(Van Siclen 1958). This occurs in the slope and basinaldeposits of the Quaternary of the Caribbean area(Schlager et al. 1994) where clastic input to the deepsea was much greater during glacial times and carbon-ate production was higher during the interglacials whenplatforms were flooded. Ancient examples are docu-mented from the Cambrian of northern Greenland (In-eson and Surlyk 2000), Devonian of the Canning Basin(Southgate et al. 1993; Playford et al. 2009), the Per-mian of Texas (e. g., Saller et al. 1989), and the Tertiaryof northeast Australia and Gulf of Papua (Davies et al.1989).
A further type of lower carbonate–upper clastic sequence occurs where transgressive carbonates areoverlain by highstand clastics. In many cases, the low-er carbonate has been initiated by rapid sea-level risewith little time for reworking of the coastal plain clas-tics below. This scenario requires a plentiful supply ofterrigenous material to generate the upper clastic unit,usually a coarsening-upward deltaic or shoreline pack-age. This type of sequence is well-known from themid-Carboniferous of North America (e. g., Soreghan1997; Rankey et al. 1999; Miller and Eriksson 2000;Smith and Read 2001) and from western Europe, andis described below as a case study.
O. Catuneanu et al.228

Lower mudrock – upper carbonate sequencesBasinal-outer shelf mudrock through to shallow-waterlimestone sequences, typically several 100 metersthick, are characteristic of carbonate ramp succes-sions. They may themselves contain an internal small-er-scale cyclicity. Examples of these occur within the Carboniferous strata of South Wales (Burchetteand Wright 1992), Triassic Muschelkalk of Germany(Aigner 1984) and the Cretaceous of the central andwestern Pyrenees (Simo 1989; Lenoble and Canerot1993) and Austrian Alps (Sanders and Hofling 2000).Broadly, the deeper-water mudrock lower parts repre-sent transgressive facies, while the upper carbonateswere prograding shallow-water highstand facies. TheʻGrand Cyclesʼ of the Cambrian of the Rocky Moun-tains (Canada), Appalachians (USA; Glumac andWalker 2000), Canada (Aitken 1978), China (Meng etal. 1997) and elsewhere, are of this type. The terri -genous muds may be supplied axially into the basin,rather than across the drowned carbonate platforms.This is particularly true of foreland basins and narrowextensional basins, where carbonate platforms may bepreferentially developed on one side.
DiscussionWith the different types of mixed-lithology sequence,the lithofacies succession depends on the rate of sea-level change and availability of clastics. Slow sea-level rises can lead to extensive reworking of coastal-plain clastics and so well-developed clastic lower partsto cycles representing transgressive units. More rapidsea-level rises cause flooding of coastal plains and solittle reworking of sediment, especially if there hadbeen extensive pedogenesis and/or vegetative cover,such that ravinement erosion was limited. At the otherend of the sea-level cycle, stillstands allow coarsen-ing-upward alluvial-plain, shoreline and deltaic faciesto prograde over late transgressive-early highstandcarbonates, with accommodation space determiningthickness. A forced regression leads to platform expo-sure, river incision and the formation of lowstand fansand wedges on the basin-margin/toe of slope and in-cised-valley fills on the platform-top.
Mixed carbonate–clastic sequences are best devel-oped at times of high amplitude sea-level change, andsince these are typical of icehouse conditions, they arewell-represented in the Quaternary and Permo-Car-boniferous. During these times the high-frequency sea-level fluctuations were on the scale of 10’s of metersand this was sufficient to bring terrigenous sedimentinto the depositional environment during a sea-level
fall. The Permo–Carboniferous was also a time of first-order sea-level lowstand, when more of the continentallandmasses were exposed for weathering, erosion anddenudation than at other times. The late Paleozoic wasalso a period of supercontinent assembly, when moun-tain ranges were forming, being uplifted and eroded.
During greenhouse times, lower- and mid-Paleozoicand Mesozoic, low amplitude sea-level changes werethe norm and extensive carbonate platforms and clas-tic shelf seas were typical. Most shallow-marine, con-tinental-shelf sequences of these periods are composedof single, uniform lithofacies, all clastic or all carbon-ate. The mixed lower carbonate–upper clastic se-quences discussed here were rarely developed.
2. Case study: Mixed carbonate-clasticsequences, Mid-Carboniferous,northern England
The Carboniferous period was a time of developingglaciation in Gondwana (Wright and Vanstone 2001)and successions of this time in most parts of the world are markedly cyclic, which is usually attributedto glacioeustasy, although tectonic overprinting canmask the orbital-forcing signal (e. g. Wilkinson et al.2003). In Europe Lower Carboniferous cycles com-monly involve carbonates, while the Upper Carbonif-erous cycles are more clastic, with the Coal Measurecyclothems of the Westphalian being classic examples.In Northern England, in the upper Viséan through Ser-pukhovian, the cycles are typically mixed lower car-bonate–upper clastic facies, referred to as ʻYoredalecyclesʼ. The lower carbonate part is up to 30 metersthick, overlain by a clastic section, locally with a thincoal seam at the top (Tucker et al. 2009). These cyclesvary in thickness from 5 to 70 m.
The Yoredale limestones are typically well-beddedmuddy bioclastic packstones–wackestones with a di-verse fauna. Locally there are small biostromes ofcolonial corals or beds of solitary coral. The basal bed(up to 0.5 m thick) of some limestones is a prominentsand-rich or clay-rich bioturbated bioclastic packstonewith fish scales with the clastic material derived fromreworking of the top of the cycle below. Limestoneswere deposited in water depths of 10–40 meters, in agenerally quiet environment with occasional storms.This was effectively an extensive and flat, low-energyepeiric-type platform, probably 150 km across, cover-ing 10,000 sq km, with a gentle slope with micritemounds and debrites into deeper water of the CentralPennine Basin to the south.
Sequence Stratigraphy: Methodology and Nomenclature 229

O. Catuneanu et al.230
high
stan
d sy
stem
s tra
ctag
grad
atio
nal t
o pr
ogra
datio
nal
cycl
e be
d se
t
unco
nfor
mab
le b
ound
ary
max
imum
floo
ding
sur
face
fluvi
al &
/or e
stua
rine
sand
ston
esw
ithin
inci
sed
valle
ys
coas
tal p
lain
san
dsto
nes
and
mud
ston
es
fluvi
al s
ands
tone
s
shal
low
pla
tform
car
bona
tes
&
thin
tran
sgre
ssiv
e sh
ales
subm
arin
e fa
n &
leve
e-ch
anne
lsa
ndst
ones
high
stan
d sy
stem
s tra
ctpr
ogra
datio
nal
cycl
e be
d se
t
shel
f bre
ak
trans
gres
sive
sys
tem
s tra
ctba
ckst
eppi
ng re
trogr
adat
iona
lcy
cle
bed
set
low
stan
d sy
stem
s tra
ctpr
ogra
datio
nal
cycl
e be
d se
t
falli
ng s
tage
sys
tem
s tra
ctfo
rced
pro
grad
atio
nal
cycl
e be
d se
t
basi
n flo
or fa
n
axia
l cha
nnel
sl
ope
fan
slo
pe s
lum
ps
HS
T
HS
T
TST
TST
LST
FSS
T
SB
mfs
mfs
TS
}}
}}
}tra
nsgr
essi
ve s
urfa
ceTS
/SB>
TS/S
B>TS
>
SB?>
TST
TST
mfs
>m
fs>
HST
HST
HST
late
HST
FSST
/LST
FSST
LST
TST
mar
ine
limes
tone
mar
ine
flood
ing
surfa
cede
lta p
lain
dist
ribut
ary
chan
nel f
ill
delta
fron
t
prod
elta
mud
ston
em
arin
e sh
ale
mar
ine
limes
tone
sequ
ence
bou
ndar
yco
al
mar
ine
limes
tone
estu
arin
e/co
asta
lse
dim
ent
inci
sed
valle
y fil
l
mar
ine
limes
tone
coal
TST
early
TST
late
LST SB
>
TST TS
/SB
>
shel
f & s
lope
mud
ston
es &
th
in s
ands
tone
s
sea
leve
l & s
yste
m tr
act <S
B
<SB
<TS
<SB
<mfs
<mfs
Fig
.49.
Sequ
ence
str
atig
raph
ic m
odel
and
cyc
les
type
s fo
r a
mix
ed c
arbo
nate
-cla
stic
suc
cess
ion
base
d on
the
Yor
edal
e cy
cles
in th
e M
id-C
arbo
nife
rous
of
nort
hern
Eng
-la
nd. T
he s
chem
atic
logs
sho
w (
1)a
cycl
e w
ith a
n in
cise
d-va
lley
fill
sand
ston
e cu
tting
, and
(2)
coar
seni
ng-u
p de
ltaic
cla
stic
s ab
ove
carb
onat
es.

Two main types of clastic succession occur abovethe limestone in a Yoredale cycle: (1) a dominantlydeltaic unit of prodelta mudrocks passing up into dis-tal mouth-bar then proximal mouth-bar sandstones. Insome cases a distributary channel sand-body, severalmeters thick, cuts down into mouth-bar sandstone (seeFig. 49, right-hand log); and (2) a deep- to shallow-marine succession of mudrocks to sandstones withtempestites and HCS from storms and a range of tracefossils, and then shoreface – foreshore cross- and flat-bedded sandstones.
At several horizons in the succession, major len -ticular, cross-bedded, coarse sand bodies cut down10 meters or more into the coarsening-upward unit, insome cases reaching the limestone at the base of thecycle (see Fig. 49, left-hand log). These shoestringsand-bodies show a fining-up of grain-size and a de-crease of cross-bed set thickness, and in some caseswave-ripples and burrows towards the top. Thesesandstones are interpreted as incised-valley fills.
At the top of the Yoredale cycles, there is usually a palaeosoil (seatearth, fireclay, underclay, ganister,calcrete) of variable grain-size, colour, thickness andtexture, reflecting the climate of the time. A thin coalseam may complete the cycle. One or several meter-scale (ʻminorʼ) coarsening-upward cycles may also
occur at the top of a cycle. These coastal-plain faciesresult from small deltas filling lakes and bays.
The Yoredale cycles show all the features of fully developed sequences that include all systems tracts(Tucker et al. 2009; Figs. 49, 50). The limestones con-stituting the lower parts of the Yoredale cycles repre-sent the transgressive systems tracts (TST). The pas-sage up into the overlying mudrocks is equivalent to the maximum flooding. The succeeding coarsening-upward, shallowing-upward deltaic facies represent thehighstand systems tracts (HST), and the thin coals andpaleosoils at the top of a typical cycle are the late HST/FSST-LST/early TST. The incised-valley fills down-cutting into the HST facies represent the falling-stage(FSST) and lowstand (LST) systems tracts, of fluvialthrough estuarine facies, then succeeded by transgres-sive carbonates of the next sequence. The IVFs occurat specific stratigraphic horizons and represent times ofsharper and deeper glacioeustatic sea-level falls. Thevalleys would have fed lowstand fans and wedges located in the Central Pennine Basin to the south.
The cyclicity which so dominates Carboniferoussedimentary successions was largely produced byglacioeustatic changes in sea level as a result of orbitalforcing and variations in solar insolation. Notwith-standing the dominance of orbital forcing, there were
Sequence Stratigraphy: Methodology and Nomenclature 231
Fig. 50. Sequence stratigraphic model formixed carbonate-clastic mid-CarboniferousYoredale cycles of northern England (fromTucker et al. 2009).
locally tectonic and sedimentary controls on deposi-tion too. There have been numerous papers discussingthe periodicity of Carboniferous cycles in Europe andNorth America, with the consensus favouring the ec-centricity rhythm, but arguments over whether theshort or long eccentricity was the control (e. g., Smithand Read 2000, 2001 versus Wright and Vanstone2001). Davydov et al. (2010) have dated major Permo-Carboniferous oscillations as 100 kyr with 400 kyrmodulation.
The origin of the Yoredale cycles specifically hasbeen much discussed with tectonic, eustatic and sedi-mentary mechanisms all put forward. Broadly similarpatterns of cycle thickness variation across the regionsupport the role of eustasy and/or regional tectonics(subsidence), although there may well have still beenlocal tectonic (i. e., fault) or sedimentary controls.
Part three – Discussion and conclusions
Links to other stratigraphicdisciplines
Sequence stratigraphy relies on other stratigraphic dis-ciplines to constrain the correlation of surfaces andsystems tracts and to estimate the time involved in the formation of a sequence. Lithostratigraphy allowsshort-distance correlations in aggradational intervalswhere facies changes occur simultaneously over thestudied area. Allostratigraphy uses discontinuities andsurfaces that are assumed to have a time-stratigraphicsignificance. Thus, it can be considered as being a partof sequence stratigraphy.
Biostratigraphy is needed to tie the studied sequencesto the chronostratigraphic time frame. Magneto- andchemostratigraphy help in fine-tuning the chronos-tratigraphy by furnishing precise correlations (Langreiset al. 2010; Weissert et al. 2008). There may also be agenetic link between biostratigraphy and sequencestratigraphy because sea-level changes may force bio-logical evolution (e. g., Cecca et al. 2005; Sandoval etal. 2008). A genetic link may also exist between sea-lev-el changes and the chemical composition of the oceanbecause they are related to the same driving forces suchas ocean-floor spreading and climate changes (e. g.,Weissert and Mohr 1996; Weissert et al. 2008).
Cyclostratigraphy has a high potential to refine thesequence-stratigraphic analysis. It uses astronomicalcycles of known periodicities (Berger et al. 1989) to interpret repetitive patterns in the sedimentary record(e. g., Strasser et al. 2006) and to establish astro chro -no logical time scales (e. g., Hinnov and Ogg 2007). As-tronomical cycles cause insolation changes at the top of the atmosphere, which then translate into climatechanges and eventually into eustatic sea-level changes,mainly through glacioeustasy and thermal expansionand retraction of the uppermost layer of ocean water.Eustatic sea level, together with subsidence, controlsaccommodation. A sedimentary sequence created by anorbitally controlled sea-level fluctuation thus can po-tentially be interpreted in terms of sequence stratigra-phy (Vail et al. 1991; Strasser et al. 1999).
In many cases, parasequences (Van Wagoner et al.1990) or simple sequences (Vail et al. 1991) can beshown to have formed in tune with orbital cycles. Thestacking pattern that is commonly used in sequencestratigraphy to define retrogradational, aggradational,or progradational trends may reflect the hierarchy of orbital cycles. Care has to be taken in the interpreta-tion, however, because not all cycles are recorded if nothreshold was passed to create a recognizable faciescontrast, or if there was non-deposition or erosion(ʻmissed beatsʼ; Goldhammer et al. 1990). The effect oforbital cycles on sedimentation may also vary with thetectonic and depositional setting. For example, epicon-tinental seas are particularly sensitive to climatic fluc-tuations, and prone to changes in water temperature andsalinity that may result in the formation of regional se-quences (Pratt and Haidl 2008). The superposition ofhigh-frequency sea-level fluctuations on a longer-termtrend may add another degree of complexity to thestratigraphic record by producing intervals of repeatedsequence-stratigraphic surfaces rather than a single surface (Montañez and Osleger 1993; Strasser et al.2004). Furthermore, autogenic processes may producesequences and surfaces that are independent of accom-modation changes (e. g., Martin et al. 2009).
Sequence stratigraphicmethodology
Perhaps the most significant progress in sequencestratigraphy is the shift from models to methodology(Fig. 19). The debates that punctuated the last threedecades (Figs. 1, 2) led to the realization that all ap-proaches are correct under the specific circumstances
O. Catuneanu et al.232

for which they were proposed (Catuneanu et al. 2009,2010). A standard methodology can be defined basedon the common ground between the different ap-proaches, with emphasis on the observation of stratalstacking patterns in the rock record. Various data setscan be used for this purpose, including outcrop, core,well-log and seismic data. Each data set may be moresuitable to a particular scale of observation, and mayprovide different insights toward the identification ofstratal stacking patterns and key bounding surfaces.Mutual corroboration, wherever possible, is desirable.
A great deal of disagreement was fueled by argu-ments regarding the selection of sequence boundariesamong the set of sequence stratigraphic surfaces. Ear-ly models also promoted the idea that sequence strati-graphic surfaces are time lines and correlatable worldwide, which sparked intense debates and controversy.It is now clear that both global and local controls may contribute to the sequence stratigraphic frame-work of every sedimentary basin, and that no modelcan replace the value of data and observation. It wasdemonstrated that all sequence stratigraphic surfacesmay have physical expression in outcrop (e. g.,MacEachern et al. 1999; MacNeil and Jones 2006;Bover-Arnal et al. 2009), and that they all are poten-tially diachronous (e. g., Catuneanu 2006). These de-velopments reiterate the importance of field criteria tothe delineation of any type of sequences stratigraphicunit and bounding surface, and the fact that all se-quence stratigraphic approaches are data driven.
Sequence stratigraphic units (i. e., sequences, para -sequences, systems tracts) are defined by their bound-ing surfaces. The definition of units is independent oftemporal and thickness scales, and therefore the scalesof different types of unit may overlap. Sequences and parasequences correspond to cycles of change instratal stacking patterns, which are interpreted to re-flect cycles of change in accommodation or sedimentsupply. These cycles are defined by the recurrence ofthe same types of stratigraphic surface in the rockrecord, whether subaerial unconformities (in the caseof depositional sequences), maximum flooding sur-faces (in the case of genetic stratigraphic sequences),maximum regressive surfaces (in the case of T-R se-quences) or flooding surfaces (in the case of para -sequences). In contrast with sequences and para -sequences, systems tracts correspond to only portionsof full cycles, and therefore they have different typesof bounding surface at the base and at the top.
Stratal stacking patterns describing normal regres-sions, transgressions or forced regressions can succeed
each other in any order, as a function of syn-deposi-tional conditions and/or post-depositional preservation.Sequences may consist of any combination of thesetypes of deposit, and may or may not include all threetypes of deposit. However, all sequences whose timingand origin relate to shoreline trajectories share the com-mon element that they all consist of a combination ofthe same types of (normal regressive, transgressive and forced regressive) stacking patterns. Notably, thesame kinds of stacking patterns compose any type ofsequence stratigraphic unit, from sequence to systemstract and parasequence. This means that a methodolo-gy that focuses on stratal stacking patterns provides anobjective, model-independent workflow to the standardapplication of sequence stratigraphy (Fig. 19).
The sequence stratigraphic method must be kept in-dependent of assumptions regarding the controllingmechanisms on sequence development. It has becomeincreasingly evident that a range of allogenic process-es may operate over similar temporal scales to controlthe development of depositional patterns and strati-graphic cycles. Accommodation curves may be recon-structed based on geometries preserved in the rockrecord, including the thickness of topsets that formduring normal regressions, the increase in the relativeelevation of backstepping (transgressive) coastlines,the magnitude of downstepping during forced regres-sions, or the depth of fluvial incised valleys. However,such quantitative curves may only have local rele-vance due to variations in tectonic regimes and sedi-ment supply from one sedimentary basin to another, or between different sub-basins within the same sedi-mentary basin.
The scale of observation is a critical aspect of se-quence stratigraphic work; it may be selected on pur-pose according to the scope of the study (e. g., petro -leum exploration versus production development) or it may be imposed by the resolution of the availabledata. For example, outcrops and well-log data maysupport high-resolution sequence stratigraphic studies,suitable for understanding reservoir compartmental-ization, whereas seismic data afford lower resolutionstudies, more suitable for the purpose of petroleum ex-ploration. The relative significance of sequence strati-graphic units that develop at different scales of obser-vation is resolved via the concept of hierarchy.
Different proposals on how to define a hierarchysystem (e. g., Vail et al. 1977, 1991; Mitchum and VanWagoner 1991; Embry 1995; Krapez 1996, 1997) havestimulated active discussions within the stratigraphiccommunity (e. g., Miall 1995, 1997; Drummond and
Sequence Stratigraphy: Methodology and Nomenclature 233

Wilkinson 1996; Schlager 2004; see recent summariesin Catuneanu et al. 2009, 2010). A factor that limits thedefinition of a universally applicable hierarchy systemis that the interplay of competing sequence-formingmechanisms results in the formation of stratigraphiccycles across a continuum of temporal and spatialscales (Drummond and Wilkinson 1996; Schlager2004). In the absence of discrete modes within thewide continuum of scales, hierarchical subdivisionsoften remain arbitrary and may only be basin specific(Catuneanu et al. 2009, 2010).
In this paper we aim to clarify and streamline the sequence stratigraphic terminology and methodologyfor a more user-friendly and model-independent appli-cation in all types of academic or industry-oriented research. This model-independent approach is meantto release sequence stratigraphy from the straitjacketimposed by the requirements of any specific sequencestratigraphic model, and stimulate the flexibility that is needed to adapt to the particularities of any casestudy. The proposed streamlined methodology permitsthe construction of sequence stratigraphic frameworksthat are best fitted to the available data.
Acknowledgements. This paper is the result of the con-tinuing effort to provide a neutral platform for the inclusion of sequence stratigraphy in international stratigraphic guidesand codes. Work started in 2006 with the premise that a largeand inclusive working group is required for this task. We ac-knowledge the significant contributions brought by all mem-bers of this working group, which, in addition to the authors ofthis paper, includes V. Abreu, J. P. Bhattacharya, M. D. Blum,R. W. Dalrymple, P. G. Eriksson, C. R. Fielding, W. L. Fisher,P. Gianolla, M. R. Gibling, K. A. Giles, J. M. Holbrook, R. Jor-dan, B. Macurda, O. J. Martinsen, J. E. Neal, D. Nummedal,L. Pomar, B. R. Pratt, J. F. Sarg, K. W. Shanley, R. J. Steel andC. Winker. With this paper we build upon the work publishedby Catuneanu et al. (2009, 2010).
We thank Brian Pratt (Chair, ISSC) for his exceptionalsupport, guidance, and feedback throughout the processleading to this publication. We also thank all members of theInternational Subcommission on Stratigraphic Classifica-tion (ISSC) of the International Commission on Stratigraphywho provided useful and constructive comments on earlierversions of the manuscript.
The publication of this work in full colour was made pos-sible by the generous support provided by Chevron EnergyTechnology Company.
References
Aigner, T., 1984. Dynamic stratigraphy of epicontinentalcarbonates, Upper Muschelkalk (M. Triassic) South Ger-man Basin. Neues Jahrbuch für Geologie und Palaeon-tologie, Abhandlungen 169, 127–159.
Ainsworth, R. B., 1991. Sedimentology and high resolutionsequence stratigraphy of the Bearpaw-Horseshoe Can-yon transition (Upper Cretaceous), Drumheller, Alberta,Canada. M.Sc. Thesis, McMaster University, Hamilton,Ontario, 213 pp.
Ainsworth, R. B., 1992. Sedimentology and sequencestratigraphy of the Upper Cretaceous, Bearpaw-Horse-shoe Canyon transition, Drumheller, Alberta. AmericanAssociation of Petroleum Geologists Annual Convention,Calgary, Field Trip Guidebook 7, 118 pp.
Ainsworth, R. B., 1994. Marginal marine sedimentology andhigh resolution sequence analysis; Bearpaw-HorseshoeCanyon transition, Drumheller, Alberta. Bulletin of Cana-dian Petroleum Geology 42,1, 26–54.
Ainsworth, R. B., 2005. Sequence stratigraphic-based analy-sis of reservoir connectivity: influence of depositional ar-chitecture – a case study from a marginal marine deposi-tional setting. Petroleum Geoscience 11, 257–276.
Aitken, J. D., 1978. Revised model for depositional GrandCycles, Cambrian of the southern Rocky Mountains,Canada. Can. Pet. Geol. Bull. 26, 515–542.
Allen, J. R. L., 1974. Studies in fluviatile sedimentation: im-plications of pedogenic carbonate units, Lower Old RedSandstone, Anglo-Welsh outcrop: Geological Journal 9,181–208.
Allen, G. P., Posamentier, H. W., 1993. Sequence stratigra-phy and facies model of an incised valley fill: the Girondeestuary, France. Journal of Sedimentary Petrology 63,3,378–391.
Anderson, R. Y., Dean, W. E., Kirkland, D. W., Snider, H. I.,1972. Permian Castile varved evaporite sequence, westTexas and New Mexico. Bull. Geol. Soc. Am. 83, 59–86.
Atrops, F., 1982. La sous-famille des Ataxioceratinae (Am-monitina) dans le Kimméridgien inférieur du Sud-Est dela France. Systématique, évolution, chronostratigraphiedes genres Orthosphinctes et Ataxioceras. Doc. Lab.Géol. Lyon 83, 463 pp.
Bachtel, S. L., Dorobek, S. L., 1994. Mississippian carbon-ate platform profiles and preliminary sequence strati-graphic interpretation, San Andres and SacramentoMountains, south-central New Mexico. In: Garber, R. A.,Keller, D. R. (eds.), Field Guide to the Paleozoic Sectionof the San Andres Mountains: Midland, TX, PermianBasin Section – SEPM Publication 94–35, p. 47–59.
Bachtel, S. L., Raatz, W. D., Rankey, E. C., 2000a. Shelf tobasin variation in character of high-frequency sequencesdue to high-amplitude relative change in sea level: exam-ples from the Pennsylvanian Orogrande Basin, NewMexico [abs.]. In: Ahr, W. M., Harris, P. M., Morgan,W. A., Somerville, I. D., Stanton, R. J., Jr. (eds.), Permo-Carboniferous Carbonate Platforms and Reefs – SEPM-IAS Research and Field Conference, Programs and Ab-
O. Catuneanu et al.234

stracts Volume: Tulsa, OK, SEPM (Society for Sedimen-tary Geology), p. 23.
Bachtel, S. L., Rankey, E. C., Kaufman, J., 2000b. Fieldguide for Pennsylvanian Holder Formation, SacramentoMountains, NM: sequence development in mixed car-bonate-siliciclastic strata during global icehouse climaticperiods. In: Stanton, R. J., Jr. (ed.), Field Guide to the Carboniferous Geology of the Sacramento Mountains,New Mexico: Platforms and Mounds of the Lake Valleyand Holder Formations: Tulsa, OK, SEPM (Society forSedimentary Geology) and International Association ofSedimentologists Field Guide, p. 1–58.
Bard, B., Hamelin, R. G., Fairbanks, R., 1990. U-Th ob-tained by mass spectrometry in corals from Barbados: sealevel during the past 130.000 years. Nature 346, 456–458.
Bartek, L. R., Vail, P. R., Anderson, J. B., Emmet, P. A., Wu,S., 1991. Effect of Cenozoic ice sheet fluctuations inAntarctica on the stratigraphic signature of the Neogene.Journal of Geophysical Research 96, 6753–6778.
Bartek, L. R., Andersen, J. L. R., Oneacre, T. A., 1997. Sub-strate control on distribution of subglacial and glacioma-rine seismic facies based on stochastic models of glacialseismic facies deposition on the Ross Sea continentalmargin, Antarctica. Marine Geology 143, 223–262.
Berger, A., Loutre, M. F., Dehant, V., 1989. Astronomicalfrequencies for pre-Quaternary palaeoclimate studies.Terra Nova 1, 474–479.
Best, J. L., Ashworth, P. J., 1997. Scour in large braided riversand the recognition of sequence stratigraphic boundaries.Nature 387, 275–277.
Bhattacharya, J. P., 1993. The expression and interpretationof marine flooding surfaces and erosional surfaces incore; examples from the Upper Cretaceous DunveganFormation in the Alberta foreland basin. In: Summer-hayes, C. P., Posamentier, H. W. (eds.), Sequence stratig-raphy and facies associations. International Associationof Sedimentologists Special Publication 18, 125–160.
Bhattacharya, J. P., Willis, B. J., 2001. Lowstand deltas inthe Frontier Formation, Powder River Basin, Wyoming:Implications for sequence stratigraphic models. Ameri-can Association of Petroleum Geologists Bulletin 85,261–294.
Blackwelder, E., 1909. The valuation of unconformities.Journal of Geology 17, 289–299.
Blair, T. C., Bilodeau, W. L., 1988. Development of tectoniccyclothems in rift, pull-apart, and foreland basins: sedi-mentary response to episodic tectonism. Geology 16,517–520.
Blum, M. D., 1990. Climatic and eustatic controls on Gulfcoastal plain fluvial sedimentation: an example from theLate Quaternary of the Colorado River, Texas. In: Ar-mentrout, J. M., Perkins, B. F. (eds.), Sequence Stratigra-phy as an Exploration Tool, Concepts and Practices in theGulf Coast. SEPM (Society of Economic Palaeontolo-gists and Mineralogists) Gulf Coast Section, EleventhAnnual Research Conference, Program with Abstracts,p. 71–83.
Blum, M. D., 1991. Systematic controls of genesis and ar-chitecture of alluvial sequences: a Late Quaternary ex-ample. In: Leckie, D. A., Posamentier, H. W., Lovell,R. W. (eds.), NUNA Conference on High-Resolution Se-quence Stratigraphy. Program with Abstracts, p. 7–8.
Blum, M. D., 1994. Genesis and architecture of incised valleyfill sequences: a Late Quaternary example from the Col-orado River, Gulf Coastal Plain of Texas. In: Weimer, P.,Posamentier, H. W. (eds.), Siliciclastic sequence stratigra-phy: recent developments and applications. American As-sociation of Petroleum Geologists Memoir 58, 259–283.
Blum, M. D., Price, D. M., 1998. Quaternary alluvial plainconstruction in response to glacio-eustatic and climaticcontrols, Texas Gulf coastal plain. In: Shanley, K. W.,McCabe, P. J. (eds.), Relative Role of Eustasy, Climate,and Tectonism in Continental Rocks. SEPM (Society forSedimentary Geology) Special Publication 59, 31–48.
Blum, M. D., Törnqvist, T. E., 2000. Fluvial responses to climate and sea-level change: a review and look forward.Sedimentology 47, 2–48.
Bohacs, K., Suter, J., 1997. Sequence stratigraphic distribu-tion of coaly rocks: fundamental controls and paralic ex-amples. American Association of Petroleum GeologistsBulletin 81, 1612–1639.
Booler, J. P., Tucker, M. E., 2002. Distribution and geometryof facies and early diagenesis: the key to accommodationspace variation and sequence stratigraphy: Upper Creta-ceous Congost Carbonate Platform, Spanish Pyrenees.Sedimentary Geology, 146, 225–247.
Borer, J. M., Harris, P. M., 1991. Lithofacies and cyclicity ofthe Yates Formation, Permian Basin: Implications forreservoir heterogeneity. American Association of Petro -leum Geologists Bulletin 75, 726–779.
Boulila, S., Galbrun, B., Hinnov, L. A., Collin, P.-Y., 2008.Orbital calibration of the Early Kimmeridgian (south-eastern France): implications for geochronology and se-quence stratigraphy. Terra Nova 20, 455–462.
Bover-Arnal, T., Salas, R., Moreno-Bedmar, J. A., Bitzer,K., 2009. Sequence stratigraphy and architecture of a lateEarly-Middle Aptian carbonate platform succession fromthe western Maestrat Basin (Iberian Chain, Spain). Sedi-mentary Geology 219, 280–301.
Boyd, R., Diessel, C. F. K., Wadsworth, J., Leckie, D., Za-itlin, B. A., 2000. Organization of non marine stratigra-phy. In: Boyd, R., Diessel, C. F. K., Francis, S. (eds.), Ad-vances in the study of the Sydney Basin. Proceedings ofthe 34th Newcastle Symposium, University of Newcastle,Callaghan, New South Wales, Australia, 1–14.
Brachert, T. C., Forst, M. H., Pais, J. J., Legoinha, P., Reij -mer, J. J. G., 2003. Lowstand carbonates, highstand sand-stones? Sedimentary Geology 155, 1–12.
Braga, J. C., Martin, J. M., Alcala, B., 1990. Coral reefs incoarse-terrigenous sedimentary environments, UpperTor tonian, Granada Basin, southern Spain. SedimentaryGeology 66, 135–150.
Brami, T. R., Pirmez, C., Archie, C., Heeralal, S., Holman,K. L., 2000. Late Pleistocene deep-water stratigraphy anddepositional processes, offshore Trinidad and Tobago. In:
Sequence Stratigraphy: Methodology and Nomenclature 235

Weimer, P., Slatt, R. M., Coleman, J., Rosen, N. C., Nel-son, H., Bouma, A. H., Styzen, M. J., Lawrence, D. T.(eds.), Deep-water Reservoirs of the World. Gulf CoastSociety of the Society of Economic Paleontologists andMineralogists Foundation, 20th Annual Research Confer-ence, p. 104–115.
Brown, L. F., Jr., Fisher, W. L., 1977. Seismic stratigraphicinterpretation of depositional systems: examples fromBrazilian rift and pull apart basins. In: Payton, C. E. (ed.),Seismic Stratigraphy – Applications to Hydrocarbon Ex-ploration. American Association of Petroleum GeologistsMemoir 26, 213–248.
Burchette, T. P., Wright, V. P., 1992. Carbonate ramp deposi-tional systems. Sedimentary Geology 79, 3–57.
Cantalamessa, G., Di Celma, C., Ragaini, L., 2005. Se-quence stratigraphy of the middle unit of the Jama For-mation (Early Pleistocene, Ecuador): insights from inte-grated sedimentologic, taphonomic and paleoecologicanalysis of molluscan shell concentrations. Palaeogeog-raphy, Palaeoclimatology and Palaeoecology 216, 1–25.
Cantalamessa, G., Di Celma, C., Ragaini, L., Valleri, G.,Landini, W., 2007. Sedimentology and high-resolutionsequence stratigraphy of the late Middle to Late MioceneAngostura Formation (western Borbon Basin, northwest-ern Ecuador). Journal of the Geological Society, London164, 653–665.
Carter, R. M., Abbott, S. T., Fulthorpe, C. S., Haywick,D. W., Henderson, R. A., 1991. Application of global sea-level and sequence-stratigraphic models in southernhemisphere Neogene strata. In: Macdonald, D. I. M. (ed.),Sedimentation, Tectonics and Eustasy: Sea-LevelChanges at Active Margins. International Association ofSedimentologists, Special Publication 12, 41–65.
Carter, R. M., Fulthorpe, C. S., Naish, T. R., 1998. Sequenceconcepts at seismic and outcrop scale: the distinction between physical and conceptual stratigraphic surfaces.Sedimentary Geology 122, 165–179.
Catuneanu, O., 2006. Principles of Sequence Stratigraphy.Elsevier, Amsterdam, 375 pp.
Catuneanu, O., Martins-Neto, M. A., Eriksson, P. G., 2005.Precambrian sequence stratigraphy. Sedimentary Geolo-gy 176, 67–95.
Catuneanu, O., Hancox, P. J., Cairncross, B., Rubidge, B. S.,2002. Foredeep submarine fans and forebulge deltas: oro-genic off-loading in the underfilled Karoo Basin. Journalof African Earth Sciences 33, 489–502.
Catuneanu, O., Abreu, V., Bhattacharya, J. P., Blum, M. D.,Dalrymple, R. W., Eriksson, P. G., Fielding, C. R., Fisher,W. L., Galloway, W. E., Gibling, M. R., Giles, K. A., Hol-brook, J. M., Jordan, R., Kendall, C. G. St. C., Macurda, B.,Martinsen, O. J., Miall, A. D., Neal, J. E., Nummedal, D.,Pomar, L., Posamentier, H. W., Pratt, B. R., Sarg, J. F.,Shanley, K. W., Steel, R. J., Strasser, A., Tucker, M. E.,Winker, C., 2009. Towards the standardization of sequencestratigraphy. Earth-Science Reviews, vol. 92, 1–33.
Catuneanu, O., Bhattacharya, J. P., Blum, M. D., Dalrymple,R. W., Eriksson, P. G., Fielding, C. R., Fisher, W. L., Gal-loway, W. E., Gianolla, P., Gibling, M. R., Giles, K. A.,
Holbrook, J. M., Jordan, R., Kendall, C. G. St. C., Macur-da, B., Martinsen, O. J., Miall, A. D., Nummedal, D.,Posamentier, H. W., Pratt, B. R., Shanley, K. W., Steel,R. J., Strasser, A., Tucker, M. E., 2010. Sequence stratig-raphy: common ground after three decades of develop-ment. First Break 28, 21–34.
Cecca, F., Vrielynck, B., Lavoyer, T., Gaget, H., 2005.Changes in the ammonite taxonomical diversity gradientduring the late Jurassic – early Cretaceous. J. Biogeogr.32, 535–547.
Chen, D., Tucker, M. E., 2003. The Frasnian-Famennian massextinction: insights from high-resolution sequence stratig-raphy and cyclostratigraphy in South China. Palaeogeo -graphy, Palaeoclimatology, Palaeoecology 193, 87–111.
Christie-Blick, N., 1991. Onlap, offlap, and the origin of unconformity-bounded depositional sequences. MarineGeology 97, 35–56.
Clari, P. A., Dela Pierre, F., Martire, L., 1995. Discontinu-ities in carbonate successions: identification, interpreta-tion and classification of some Italian examples. Sedi-mentary Geology 100, 97–121.
Colombié, C., 2002. Sédimentologie, stratigraphie séquen-tielle et cyclostratigraphie du Kimméridgien du Jura suisse et du Bassin vocontien (France): relations plate-forme – bassin et facteurs déterminants. GeoFocus 4, Fri-bourg, 198 pp.
Colombié, C., Rameil, N., 2006. Tethyan-to-boreal correla-tion in the Kimmeridgian using high-resolution sequencestratigraphy (Vocontian Basin, Swiss Jura, Boulonnais,Dorset). International Journal Earth Sciences 96, 567–591.
Colombié, C., Strasser, A., 2003. Depositional sequences in the Kimmeridgian of the Vocontian Basin (France)controlled by carbonate export from shallow-water plat-forms. Geobios 36, 675–683.
Colombié, C., Strasser, A., 2005. Facies, cycles, and con-trols on the evolution of a keep-up carbonate platform(Kimmeridgian, Swiss Jura). Sedimentology 52, 1207–1227.
Covault, J. A., Normark, W. R., Romans, B. W., Graham,S. A., 2007. Highstand fans in the California borderland:the overlooked deep-water depositional systems. Geolo-gy 35, 783–786.
Cowan, C. A., James, N. P., 1993. The interactions of sea-level change, terrigenous-sediment influx and carbonateproductivity as controls on Upper Cambrian Grand Cy-cles of western Newfoundland, Canada. Bulletin Geolog-ical Society of America 105, 1576–1590.
Currie, B. S., 1997, Sequence stratigraphy of nonmarineJurassic-Cretaceous rocks, central Cordilleran foreland-basin system. Bulletin Geological Society of America109, 1206–1222.
Dalrymple, R. W., Boyd, R., Zaitlin, B. A., eds., 1994. In-cised-valley systems: origin and sedimentary sequences.Society of Economic Paleontologists and MineralogistsSpecial Publication 51, 391 pp.
D’Argenio, B., Ferreri, V., Amodio, S., Pelosi, N., 1997. Hi-erarchy of high-frequency orbital cycles in Cretaceous
O. Catuneanu et al.236

carbonate platform strata. Sedimentary Geology 113,3–4,169–193.
Davies, P. J., Symonds, P. A., Feary, D. A., Pigram, C. J.,1989. The evolution of the carbonate platforms of north-east Australia. – In: Crevello, P. G., Wilson, J. J., Sarg,J. F. & Read, J. F. (eds.): Carbonate Platform and BasinDevelopment. Soc. Econ. Petrol. Min. (Society for Sedi-mentary Geology) Spec. Publ. 44, 233–257.
Davydov, V., Crowley, J. L., Schmitz, M. D. & Poletaev, V.,2010. High-precision U-Pb zircon age calibration of theglobal Carboniferous time-scale and Milankovitch bandcyclicity in the Donets Basin, eastern Ukraine. Geochem.Geophys. Geosyst. 11: online at A.G.U.
De Rafélis, M., Emmanuel, L., Renard, M., Atrops, F., Jandu Chene, R., 2001. Geochemical characterization (Mncontent) of third order eustatic sequences in Upper Jurassic pelagic carbonates of the Vocontian Trough (SEFrance). Eclogae Geol. Helv. 94, 145–152.
Dercourt, J., Gaetani, M., Vrielynck, B., Barrier, E., Biju-Duval, B., Brunet, M. F., Cadet, J. P., Crasquin, S., Sand-ulescu, M., 2000. Atlas Peri-Tethys; Palaeogeographicalmaps. Paris.
Di Celma, C., Cantalamessa, G., 2007. Sedimentology andhigh-frequency sequence stratigraphy of a forearc exten-sional basin: the Miocene Caleta Herradura Formation,Mejillones Peninsula, northern Chile. Sedimentary Geol-ogy 198, 29–52.
Drummond, C. N., Wilkinson, B. H., 1996. Stratal thicknessfrequencies and the prevalence of orderedness in strati-graphic sequences. Journal of Geology 104, 1–18.
Eberli, G. P., Harris, P. M., Grammer, G. M., Cruz, F. E. G.,2005. Field Guide to the CSL-AAPG Seminar on se-quence Stratigraphy and Reservoir Distribution in a Mod-ern Carbonate Platform, Bahamas: University of MiamiComparative Sedimentology Laboratory Sedimenta CDSeries No. 3.
Eberli, G. P., Anselmetti, F. S., Betzler, C., Van Konijnen-burg, J.-H., Bernoulli, D., 2004. Carbonate platform tobasin transition on seismic data and in outcrop – GreatBahama Bank and the Maiella platform, Italy. In: Eberli,G. P., Massaferro, J. L., Sarg, J. F. (eds.) Seismic Imagingof Carbonate Reservoirs and Systems, AAPG Memoir 81,207–250.
Edwards, M. B., 1991. Stratigraphic analysis and reservoirprediction in the Eocene Yegua and Cook Mountain For-mations of Texas and Louisiana. In: Armentrout, J. M.,Perkins, B. F. (eds.), Sequence Stratigraphy as Explo-ration Tool, Concepts and Practices in the Gulf Coast:Gulf Coast Section, SEPM Foundation Eleventh AnnualResearch Conference, p. 141–160.
Elrick, M., Read, J. F., 1991. Cyclic ramp-to-basin carbon-ate deposits, Lower Mississippian, Wyoming and Mon-tana: a combined field and computer modelling study.Journal of Sed. Petrol. 61, 1194–1224.
Embry, A. F., 1995. Sequence boundaries and sequence hierarchies: problems and proposals. In: Steel, R. J., Felt,V. L., Johannessen, E. P., Mathieu, C. (eds.), Sequencestratigraphy on the Northwest European Margin. Nor -
wegian Petroleum Society (NPF), Special Publication 5,1–11.
Embry, A. F., Johannessen, E. P., 1992. T-R sequence stratig-raphy, facies analysis and reservoir distribution in the uppermost Triassic-Lower Jurassic succession, westernSverdrup Basin, Arctic Canada. In: Vorren, T. O., Berg -sager, E., Dahl-Stamnes, O. A., Holter, E., Johansen, B.,Lie, E., Lund, T. B. (Eds.), Arctic Geology and PetroleumPotential, vol. 2 (Special Publication). Norwegian Petro-leum Society (NPF), pp. 121–146.
Emery, D., Myers, K. J., 1996. Sequence Stratigraphy. Ox-ford, U.K., Blackwell, 297 pp.
Fang, Q., 2000. Biostratigraphic and sequence stratigraphicanalysis of the Yegua Formation, Houston salt embay-ment, northern Gulf of Mexico. University of Texas atAustin Ph. D. Dissertation, 284 pp.
Fiduk, J. C., Weimer, P., Trudgill, B. D., Rowan, M. G., Gale,P. E., Phair, R. L., Korn, B. E., Roberts, G. R., Gafford,W. T., Lowe, R. S., Queffelec, T. A., 1999. The PerdidoFold Belt, Northwestern Deep Gulf of Mexico, Part 2:Seismic Stratigraphy and Petroleum Systems. AmericanAssociation of Petroleum Geologists Bulletin 83,4, 578–612.
Fielding, C. R., Naish, T. R., Woolfe, K. J., Lavelle, M. A.,2000. Facies analysis and sequence stratigraphy ofCRP-2/2A, Victoria Land Basin, Antarctica. Terra Antar-tica 7, 323–338.
Fielding, C. R., Naish, T. R., Woolfe, K. J., 2001. Facies ar-chitecture of the CRP-3 drillhole, Victoria Land Basin,Antarctica. Terra Antartica 8, 217–224.
Fielding, C. R., Bann, K. L., MacEachern, J. A., Tye, S. C.,Jones, B. G., 2006. Cyclicity in the nearshore marine to coastal, Lower Permian, Pebbley Beach Formation,southern Sydney Basin, Australia: a record of relativesea-level fluctuations at the close of the Late PalaeozoicGondwanan ice age. Sedimentology 53, 435–463.
Fielding, C. R., Frank, T. D., Birgenheier, L. P., Rygel, M. C.,Jones, A. T., Roberts, J., 2008. Stratigraphic record andfacies associations of the late Paleozoic ice age in easternAustralia (New South Wales and Queensland). In: Field-ing, C. R., Frank, T. D., Isbell, J. L. (eds.), Resolving theLate Paleozoic Ice Age in Time and Space. GeologicalSociety of America, Special Paper 441, 41–57.
Fischer, A. G., 1964. The Lofer cyclothems of the AlpineTriassic. In: Merriam, D. F. (ed.), Symposium on CyclicSedimentation: Kansas Geological Survey, Bulletin 169,107–149.
Frazier, D. E., 1974. Depositional episodes: their relation-ship to the Quaternary stratigraphic framework in thenorthwestern portion of the Gulf Basin. University ofTexas at Austin, Bureau of Economic Geology Geologi-cal Circular 71-1, 28 pp.
French, V. L., Kerans, C., 2004. Accommodation-controlledsystems-tract – specific facies partitioning and resultinggeometric development of reservoir grainstone ramp-crestshoal bodies. In: Grammer, G. M., Harris, P. M., Eberli,G. P. (eds.), Integration of outcrop and modern analogs inreservoir modeling. AAPG Memoir 80, 171–190.
Sequence Stratigraphy: Methodology and Nomenclature 237

Galloway, W. E., 1989. Genetic stratigraphic sequences inbasin analysis, I. Architecture and genesis of flooding-surface bounded depositional units. American Associa-tion of Petroleum Geologists Bulletin 73, 125–142.
Galloway, W. E., 2001. The many faces of submarine ero-sion: theory meets reality in selection of sequence bound-aries. A.A.P.G. Hedberg Research Conference on “Se-quence Stratigraphic and Allostratigraphic Principles andConcepts”, Dallas, August 26–29, Program and AbstractsVolume, p. 28–29.
Galloway, W. E., 2004. Accommodation and the sequencestratigraphic paradigm. Reservoir, Canadian Society ofPetroleum Geologists 31,5, 9–10.
Galloway, W. E., 2008. Depositional evolution of the Gulf ofMexico Sedimentary Basin. In: Miall, A. D. (ed.), TheSedimentary Basins of the United States and Canada:Sedimentary Basins of the World, v. 5, K. J. Hsu, SeriesEditor, Elsevier Science Amsterdam, p. 505–550.
Galloway, W. E., Whiteaker, T., Ganey-Curry, P., 2011, inpress. History of Cenozoic North American drainagebasin evolution, sediment yield, and accumulation in theGulf of Mexico Basin. Geosphere 7.
Glumac, B., Walker, K. R., 2000. Carbonate deposition andsequence stratigraphy of the terminal Cambrian grand cy-cle in the southern Appalachians. Jour. of Sed. Res. 70,952–963.
Goldhammer, R. K., Dunn, P. A., Hardie, L. A., 1990. Depo-sitional cycles, composite sea-level changes, cycle stack-ing patterns, and the hierarchy of stratigraphic forcing:Examples from Alpine Triassic platform carbonates. Ge-ological Society of America Bulletin 102, 535–562.
Goldhammer, R. K., Oswald, E. J., Dunn, P. A., 1994. High-frequency glacio-eustatic cyclicity in the Middle Penn-sylvania of the Paradox Basin: an evaluation of Mi-lankovitch forcing. In: De Boer, P. L., Smith, D. G. (eds.),Orbital Forcing and Cyclic Sequences. IAS Spec. Publ.19, 243–283.
Grammer, G. M., Ritter, A. L., 2008. Phylloid algal moundsin the Paradox Basin U.S.A. – an alternative to the in situconstructional growth model? In: Swart, P. K., McKenzie,J., Eberli, G. P. (eds.), Perspectives in Sedimentary Geol-ogy: A Tribute to the Career of Robert Nathan Ginsburg.International Association of Sedimentologists SpecialPublication 40, 239–254.
Gygi, R. A., 2000. Integrated stratigraphy of the Oxfordianand Kimmeridgian (Late Jurassic) in northern Switzer-land and adjacent southern Germany. Mem. Swiss Acad.Sci. 104, 152 pp.
Hampson, G. J., Storms, J. E. A., 2003. Geomorphologicaland sequence stratigraphic variability in wave-dominat-ed, shoreface-shelf parasequences. Sedimentology 50,667–701.
Handford, R., Loucks, R. G., 1993. Carbonate depositionalsequences and systems tracts: responses of carbonateplatforms to relative sea-level change. In: Loucks, R. G.,Sarg, R. (eds.), Carbonate sequence stratigraphy: recentadvances and applications: American Association of Pe-troleum Geologists Memoir 57, 3–41.
Haq, B. U., Hardenbol, J., Vail, P. R., 1987. Chronology offluctuating sea levels since the Triassic (250 million yearsago to present). Science 235, 1156–1166.
Hardenbol, J., Thierry, J., Farley, M. B., Jacquin, T., De Gra-ciansky, P.-C., Vail, P. R., 1998. Jurassic sequence chro -nostratigraphy. SEPM Spec. Publ. 60, chart.
Hart, B. S., Plint, A. G., 1993. Origin of an erosion surfacein shoreface sandstones of the Kakwa Member (UpperCretaceous Cardium Formation, Canada): importance forreconstruction of stratal geometry and depositional histo-ry. In: Posamentier, H. W., Summerhayes, C. P., Haq,B. U., Allen, G. P. (eds.), Sequence Stratigraphy and Fa-cies Associations. International Association of Sedimen-tologists, Special Publication 18, 451–467.
Helland-Hansen, W., Gjelberg, J. G., 1994. Conceptual basisand variability in sequence stratigraphy: a different per-spective. Sedimentary Geology 92, 31–52.
Helland-Hansen, W., Hampson, G. J., 2009. Trajectoryanalysis: concepts and applications. Basin Research 21,454–483.
Helland-Hansen, W., Martinsen, O. J., 1996. Shoreline tra-jectories and sequences: description of variable deposi-tional-dip scenarios. Journal of Sedimentary Research66,4, 670–688.
Hinnov, L. A., Ogg, J. G., 2007. Cyclostratigraphy and theastronomical time scale. Stratigraphy 4, 239–251.
Hochuli, P. A., Menegatti, A. P., Weissert, H., Riva, A., Erba,E., Premoli Silva, I., 1999. Episodes of high productivityand cooling in the early Aptian Alpine Tethys. Geology27, 657–660.
Hodgson, D. M., Flint, S. S., Hodgetts, D., Drinkwater, N. J.,Johannessen, E. P., Luthi, S. M., 2006. Stratigraphic evo-lution of fine-grained submarine fan systems, Tanqua depocenter, Karoo Basin, South Africa. Journal of Sedi-mentary Research 76, 20–40.
Holbrook, J., Scott, R. W., Oboh-Ikuenobe, F. E., 2006.Base-level buffers and buttresses: a model for upstreamversus downstream control on fluvial geometry and ar-chitecture within sequences. Journal of Sedimentary Re-search 76, 162–174.
Hunt, D., Tucker, M. E., 1992. Stranded parasequences andthe forced regressive wedge systems tract: depositionduring base-level fall. Sedimentary Geology 81, 1–9.
Hunt, D., Tucker, M. E., 1995. Stranded parasequences andthe forced regressive wedge systems tract: depositionduring base-level fall – reply. Sedimentary Geology 95,147–160.
Ineson, J. R., Surlyk, F., 2000. Carbonate mega-breccias in a sequence stratigraphic context: evidence from the Cam-brian of North Greenland. In: Hunt, D., Gawthorpe, R. L.(eds.), Sedimentary Responses to Forced Regression.Geol. Soc. of London Spec. Publ. 172, 47–68.
Jennette, D. C., Pryor, W. A., 1993. Cyclic alternation ofproximal and distal storm facies: Kope, Fairview Forma-tions (Upper Ordovician), Ohio and Kentucky. Jour. ofSed. Petrol. 63, 183–203.
Jervey, M. T., 1988. Quantitative geological modeling ofsiliciclastic rock sequences and their seismic expression.
O. Catuneanu et al.238
In: Wilgus, C. K., Hastings, B. S., Kendall, C. G. St. C.,Posamentier, H. W., Ross, C. A., Van Wagoner, J. C.(eds.), Sea Level Changes – An Integrated Approach. Society of Economic Paleontologists and Mineralogists(SEPM) Special Publication 42, 47–69.
Johnson, J. G., Murphy, M. A., 1984. Time-rock model forSiluro-Devonian continental shelf, western United States.Geological Society of America Bulletin 95, 1349–1359.
Johnson, J. G., Klapper, G., Sandberg, C. A., 1985. Devon-ian eustatic fluctuations in Euramerica. Geological Soci-ety of America Bulletin 96, 567–587.
Jones., B., Desrochers, A., 1992. Shallow platform carbon-ates. In: Walker, R. G., James, N. P. (eds.), Facies Models:Response to Sea Level Change, p. 277–302.
Kendall, C. G. St. C., Schlager, W., 1981. Carbonates andrelative changes in sea level. Marine Geol. 44, 181–212.
Kerans, C., 2002. Styles of Rudist Buildup Developmentalong the Northern Margin of the Maverick Basin, PecosRiver Canyon, Southwest Texas. Gulf Coast Associationof Geological Societies Transactions, Volume 52, 501–516.
Kerans, C., Zahm, L., Kempter, K., Ward, W. B., 1997a. Se-quence stratigraphy of reservoir analog Cretaceous (Al-bian) carbonates, Pecos River, West Texas. The Universi-ty of Texas at Austin, Bureau of Economic Geology FieldTrip Guidebook, 85 pp.
Kerans, C., Fitchen, W., Zahm, L., Ward, B., Osleger, D.,Barnaby, R., Jennings, J., 1997b. Carbonate reservoir het-erogeneity styles within a sequence stratigraphic frame-work: Albian (Cretaceous), Pecos River Canyon. TheUniversity of Texas at Austin, Bureau of Economic Ge-ology, RCRL Laboratory Field Trip Guidebook, 130 pp.
Kerr, D., Ye, L., Bahar, A., Kelkar, B. G., Montgomery, S.,1999. Glenn Pool field, Oklahoma: a case of improvedprediction from a mature reservoir. American Associationof Petroleum Geologists Bulletin 83,1, 1–18.
Kidwell, S. M., 1997. Anatomy of extremely thin marine se-quences landward of a passive margin hinge-zone: Neo-gene Calvert Cliffs succession, Maryland, USA. Journalof Sedimentary Research 67, 322–340.
Krapez, B., 1996. Sequence-stratigraphic concepts appliedto the identification of basin-filling rhythms in Precam-brian successions. Australian Journal of Earth Sciences43, 355–380.
Krapez, B., 1997. Sequence-stratigraphic concepts applied tothe identification of depositional basins and global tecton-ic cycles. Australian Journal of Earth Sciences 44, 1–36.
Langreis, C. G., Krijgsman, W., Muttoni, G., Menning, M.,2010. Magnetostratigraphy – concepts, definitions, andapplications. Newsletter on Stratigraphy 43, 207–233.
Larcombe, P., Costen, A., Woolfe, K. J., 2001. The hydrody-namic and sedimentary setting of nearshore coral reefs,central Great Barrier Reef shelf, Australia, PalumaShoals, a case study. Sedimentology 48, 811–835.
Larue, D. K., Sprague, A. R., Patterson, P. E., Van Wagoner,J. C., 1995. Multi-Storey Sandstone Bodies, SequenceStratigraphy, and Fluvial Reservoir Connectivity. BulletinAAPG (Abstract), AAPG Annual Meeting 79, 13, 54.
Leckie, D. A., 1994. Canterbury Plains, New Zealand – Im-plications for sequence stratigraphic models. American As-sociation of Petroleum Geologists Bulletin 78, 1240–1256.
Lenoble, J. L., Canerot, J., 1993. Sequence stratigraphy of theClansayesian (uppermost Aptian) formations in the west-ern Pyrenees (France). In: Posamentier, H. W., Summer-hayes, C. P., Haq, B. U. & Allen, G. P. (eds.), SequenceStratigraphy and Facies Associations. Special PublicationInternational Association of Sedimentologists 18, 283–294, Blackwell Scientific Publications, Oxford.
Levorsen, A. L., 1943. Discovery thinking. American Asso-ciation of Petroleum Geologists Bulletin 27, 887–928.
Loucks, R. G., Kerans, C., Marhx, A., 2006. Origin and Organization of Mass-Transported Carbonate Debris inthe Lower Cretaceous (Albian) Tamabra Formation, PozaRica Field Area, Mexico. SEPM Research Symposium:The Significance of Mass Transport Deposits in Deepwa-ter Environments II, AAPG Annual Convention, April 9–12, 2006 Technical Program.
Loutit, T. S., Hardenbol, J., Vail, P. R., Baum, G. R., 1988.Condensed sections: the key to age-dating and correla-tion of continental margin sequences. In: Wilgus, C. K.,Hastings, B. S., Kendall, C. G. St. C., Posamentier, H. W.,Ross, C. A., Van Wagoner, J. C. (eds.), Sea LevelChanges – An Integrated Approach. SEPM Special Pub-lication 42, 183–213.
Lukasik, J. J., James, N. P., 2003. Deepening-Upward Sub -tidal Cycles, Murray Basin, South Australia. Journal ofSedimentary Research 73,5, 653–671.
MacEachern, J. A., Raychaudhuri, I., Pemberton, S. G.,1992. Stratigraphic applications of the Glossifungites ich-nofacies: delineating discontinuities in the rock record.In: Pemberton, S. G. (ed.), Applications of Ichnology toPetroleum Exploration. Society of Economic Paleontolo-gists and Mineralogists, Core Workshop Notes 17, 169–198.
MacEachern, J. A., Zaitlin, B. A., Pemberton, S. G., 1998.High resolution sequence stratigraphy of early transgres-sive incised shoreface and early transgressive valley/em-bayment deposits of the Viking Formation, Joffre Field,Alberta, Canada. American Association of Petroleum Ge-ologists Bulletin 82, 729–756.
MacEachern, J. A., Zaitlin, B. A., Pemberton, S. G., 1999. Asharp-based sandstone of the Viking Formation, Joffrefield, Alberta, Canada: criteria for recognition of trans-gressively incised shoreface complexes. Journal of Sedi-mentary Research 69,4, 876–892.
MacNeil, A. J., Jones, B., 2006. Sequence stratigraphy of aLate Devonian ramp-situated reef system in the WesternCanada Sedimentary Basin: dynamic responses to sea-level change and regressive reef development. Sedimen-tology 53, 321–359.
Manley, L., Flood, R. D., 1998. Cyclic sediment depositionwithin Amazon deep-sea fan. AAPG Bulletin 72, 912–925.
Martin, J., Paola, C., Abreu, V., Neal, J., Sheets, B., 2009.Sequence stratigraphy of experimental strata underknown conditions of differential subsidence and variablebase level. AAPG Bull. 93, 503–533.
Sequence Stratigraphy: Methodology and Nomenclature 239

Martinsen, R. S., Christensen, G., 1992. A stratigraphic andenvironmental study of the Almond Formation, Mesa -verde Group, Greater Green River Basin, Wyoming.Wyoming Geological Association Guidebook, Forty-third Field Conference, p. 171–190.
Masson, D. G., Canals, M., Alonso, B., Urgeles, R., Huh-nerbach, V., 1998. The Canary debris flow; source areamorphology and failure mechanisms. Sedimentology 45,411–432.
Mawson, M., Tucker, M. E., 2009. High-frequency cyclicity(millennial-scale and Milankovitch) in slope carbonates(Zechstein) Permian, NE England. Sedimentology 56,1905–1936.
Meckel, L. D., III, 1993. Stratigraphy and sedimentology ofthe Eocene Yegua Formation, Texas Gulf Coast. M.A.Thesis, Univ. Texas at Austin, 112 pp.
Meckel, L. D., III, Galloway, W. E., 1996. Formation ofhigh-frequency sequences and their bounding surfaces;case study of the Eocene Yegua Formation, Texas GulfCoast. Sedimentary Geology 102, 155–187.
Mellere, D., Steel, R., 1995. Variability of lowstand wedgesand their distinction from forced-regressive wedges in theMesaverde Group, southeast Wyoming. Geology 23,9,803–806.
Meng, X., Ge, M., Tucker, M. E., 1997. Sequence stratigra-phy, sea-level changes and depositional systems in theCambro–Ordovician of the North China carbonate plat-form. Sedimentary Geology 114, 189–223.
Menning, M., Alekseev, A.S., Chuvashov, B. I., Davydov, V. I.,Devuyst, F.-X., Forke, H.C., Grunt, T.A., Hance, L., Heck-el, P.H., Izokh, N.G., Jin, Y.-G., Jones, P. J., Kotlyar, G.V.,Kozur, H.W., Nemyrovska, T. I., Schneider, J.W., Wang,X.-D., Weddige, K., Weyer, D., Work, D.M., 2006. Globaltime scale and regional stratigraphic reference scales of Cen-tral and West Europe, East Europe, Tethys, South China, andNorth America as used in the Devonian–Carboniferous–Permian Correlation Chart 2003 (DCP 2003) Palaeogeogra-phy, Palaeoclimatology, Palaeoecology 240, 318–372.
Miall, A. D., 1988. Reservoir heterogeneities in fluvial sand-stones: lessons from outcrop studies. American Associa-tion of Petroleum Geologists Bulletin 72, 682–697.
Miall, A. D., 1991. Stratigraphic sequences and their chro -no stratigraphic correlation. Journal of Sedimentary Pe -trology 61, 497–505.
Miall, A. D., 1995. Whither stratigraphy? Sedimentary Ge-ology 100, 5–20.
Miall, A. D., 1996. The geology of fluvial deposits: sedi-mentary facies, basin analysis and petroleum geology.Springer-Verlag Inc., Heidelberg, 582 pp.
Miall, A. D., 1997. The Geology of Stratigraphic Sequences.Springer-Verlag, 433 pp.
Miall, A. D., 2010. The geology of stratigraphic sequences,second edition. Springer-Verlag, Berlin, 522 pp.
Miall, A. D., Arush, M., 2001a. Cryptic sequence boundariesin braided fluvial successions. Sedimentology 48(5),971–985.
Miall, A. D., Arush, M., 2001b. The Castlegate Sandstone ofthe Book Cliffs, Utah: sequence stratigraphy, paleogeog-
raphy, and tectonic controls. Journal of Sedimentary Re-search 71, 536–547.
Miall, A. D., Miall, C. E., 2001. Sequence stratigraphy as ascientific enterprise: the evolution and persistence of con-flicting paradigms. Earth-Science Reviews 54, 321–348.
Miall, A. D., Catuneanu, O., Vakarelov, B., Post, R., 2008.The Western Interior Basin. In: Miall, A. D. (ed.), TheSedimentary Basins of the United States and Canada:Sedimentary basins of the World, v. 5, K. J. Hsü, SeriesEditor, Elsevier Science, Amsterdam, p. 329–362.
Miller, D. J., Eriksson, K. A., 2000. Sequence stratigraphy ofUpper Mississippian strata in the Central Appalachians: arecord of glacio-eustasy and tectono-eustasy in a forelandbasin setting. Am. Assoc. Petrol. Geol. Bull. 84, 210–233.
Mitchum, R. M., Jr., 1977. Seismic stratigraphy and globalchanges of sea level, part 11: glossary of terms used inseismic stratigraphy. In: Payton, C. E. (ed.), SeismicStratigraphy – Applications to Hydrocarbon Exploration.American Association of Petroleum Geologists Memoir26, 205–212.
Mitchum, R. M., Jr., Van Wagoner, J. C., 1991. High-fre-quency sequences and their stacking patterns: sequencestratigraphic evidence of high-frequency eustatic cycles.Sedimentary Geology 70, 131–160.
Mitchum, R. M., Jr., Vail, P. R., Thompson, S., III, 1977.Seismic stratigraphy and global changes of sea-level,part 2: the depositional sequence as a basic unit for strati-graphic analysis. In: Payton, C. E. (ed.), Seismic Stratig-raphy – Applications to Hydrocarbon Exploration. Amer-ican Association of Petroleum Geologists Memoir 26,53–62.
Montañez, I. P., Osleger, D. A., 1993. Parasequence stackingpatterns, third-order accommodation events, and se-quence stratigraphy of Middle to Upper Cambrian plat-form carbonates, Bonanza King Formation, southernGreat Basin. In: Loucks, R. G., Sarg, J. F. (eds.), Carbon-ate Sequence Stratigraphy. AAPG Mem. 57, 305–326.
Naish, T., Kamp, P. J. J., 1997. Foraminiferal depth palaeo -ecology of Late Pliocene shelf sequences and systemstracts, Wanganui Basin, New Zealand. Sedimentary Ge-ology 110, 237–255.
Naish, T. R., Woolfe, K. J., Barrett, P. J., Wilson, G. S.,Atkins, C., Bohaty, S. M., Bucker, C. J., Claps, M., Dav-ey, F. J., Dunbar, G. B., Dunn, A. G., Fielding, C. R.,Florindo, F., Hannah, M. J., Harwood, D. M., Henrys,S. A., Krissek, L. A., Lavelle, M. A., van der Meer, J.,McIntosh, W. C., Niessen, F., Passchier, S., Powell, R. D.,Roberts, A. P., Sagnotti, L., Scherer, R. P., Strong, C. P.,Talarico, F., Verosub, K. L., Villa, G., Watkins, D. K.,Webb, P.-N., Wonik, T., 2001. Orbitally induced oscilla-tions in the East Antarctic ice sheet at the Oligocene/Miocene boundary. Nature 413, 719–723.
Nio, S. D., Yang, C. S., 1991. Sea-level fluctuations and thegeometric variability of tide-dominates sandbodies. Sed-imentary Geology 70, 161–193.
Nummedal, D., 1992. The falling sea-level systems tract inramp settings. In: SEPM Theme Meeting, Fort Collins,Colorado (abstracts), p. 50.
O. Catuneanu et al.240

Nummedal, D., Molenaar, C. M., 1995. Sequence stratigra-phy of a ramp-setting strand plain succession: the GallupSandstone, New Mexico. In: Van Wagoner, J. C., Bert -ram, G. B. (eds.), Sequence Stratigraphy of ForelandBasin Deposits – Outcrop and Subsurface examples fromthe Cretaceous of North America. American Associationof Petroleum Geologists Memoir 64, 277–310.
Nummedal, D., Swift, D. J. P., 1987. Transgressive stratigra-phy at sequence-bounding unconformities: some princi-ples derived from Holocene and Cretaceous examples. In:Nummedal, D., Pilkey, O. H., Howard, J. D. (eds.) Sea-level fluctuation and coastal evolution. Society of Eco-nomic Paleontologists and Mineralogists (SEPM) SpecialPublication 41, 241–260.
Nummedal, D., Riley, G. W., Templet, P. L., 1993. High- resolution sequence architecture: a chronostratigraphicmodel based on equilibrium profile studies. In: Posamen-tier, H. W., Summerhayes, C. P., Haq, B. U., Allen, G. P.(eds.), Sequence Stratigraphy and Facies Associations.International Association of Sedimentologists SpecialPublication 18, 55–68.
Olsen, T., Steel, R. J., Høgseth, K., Skar, T., Røe, S.-L.,1995. Sequential architecture in a fluvial succession: se-quence stratigraphy in the Upper Cretaceous MesaverdeGroup, Price Canyon, Utah. Journal of Sedimentary Re-search B65, 265–280.
Osleger, D., Read, J. F., 1991. Relation of eustasy to stackingpatterns of meter-scale carbonate cycles, Late Cambrian,USA. Journal of Sedimentary Petrology 61, 1225–1252.
Paleo-Data, 2009. Biostratigraphic Chart, Gulf BasinU.S.A., Paleogene: Version 0906, http://www.paleoda-ta.com/downloads.html.
Pemberton, S. G., MacEachern, J. A., 1995. The sequencestratigraphic significance of trace fossils: examples fromthe Cretaceous foreland basin of Alberta, Canada. In: VanWagoner, J. C., Bertram, G. (eds.), Sequence stratigraphyof foreland basin deposits – outcrop and subsurface exam-ples from the Cretaceous of North America. American As-sociation of Petroleum Geologists Memoir 64, 429–475.
Peryt, T. M., Wagner, R., 1998. Zechstein evaporite depositionin the Central European Basin: cycles and stratigraphic sequences. Journal of Seismic Exploration 7, 201–218.
Piper, D. J. W., Pirmez, C., Manley, P. L., Long, D., Flood,R. D., Normark, W. R., Showers, W., 1997. Mass-trans-port deposits of the Amazon fan. In: Flood, R. D., Piper,D. J. W., Klaus, A., Peterson, L. C. (Eds.), ProceedingsOcean Drilling Project. Scientific Results 155, 109–146.
Pirmez, C., Hiscott, R. N., Kronen, J. K., 1997. Sandy tur-bidite successions at the base of channel-levee systems of the Amazon Fan revealed by FMS logs and cores: un-ravelling the facies architecture of large submarine fans.In: Flood, R. D., Klaus, A., Piper, D. J. W., Peterson, L. C.(Eds.), Proceedings of the Ocean Drilling Program Sci-entific Results 155, 7–22.
Playford, P. E., Hocking, R. M., Cockbain, A. E., 2009. De-vonian Reef Complexes of the Canning Basin, WesternAustralia. Geological Survey of Western Australia Bul-letin 145, 444 pp.
Playton, T. E., Janson, X., Kerans, C., 2008. Characteriza-tion, Variations, and Controls of Reefal Carbonate Fores-lopes, Proceedings of the Annual Meeting of AAPG SanAntonio.
Plint, A. G., 1988. Sharp-based shoreface sequences and“offshore bars” in the Cardium Formation of Alberta;their relationship to relative changes in sea level. In: Wil-gus, C. K., Hastings, B. S., Kendall, C. G. St. C., Posa-mentier, H. W., Ross, C. A., Van Wagoner, J. C. (eds.), SeaLevel Changes – An Integrated Approach. SEPM SpecialPublication 42, 357–370.
Plint, A. G., Nummedal, D., 2000. The falling stage systemstract: recognition and importance in sequence strati-graphic analysis. In: Hunt, D., Gawthorpe, R. L. (Eds.),Sedimentary Response to Forced Regression, vol. 172.Geol. Soc. London Special Publication, pp. 1–17.
Pomar, L., 1991. Reef geometries, erosion surfaces andhigh-frequency sea-level changes, upper Miocene reefcomplex, Mallorca, Spain. Sedimentology 38, 243–270.
Pomar, L., 1993. High-resolution Sequence Stratigraphy inPrograding Carbonates: Application to Seismic Interpre-tation. In: Loucks, B., Sarg, R. J. (Eds.), Carbonate Se-quence Stratigraphy: Recent Advances and Applications,Chapter 15. A.A.P.G. Memoir 57, 545 pp.
Pomar, L., Kendall, C. G. St. C., 2008. Carbonate platformarchitecture; a response to hydrodynamics and evolvingecology. In: Lukasik, J., Simo, T. (Eds.): Controls on Car-bonate Platform and Reef Development, SEPM SpecialPublication 89, 187–216.
Pomar, L., Ward, W. C., 1995. Sea-level changes, carbonateproduction and platform architecture: the Llucmajor Plat-form, Mallorca, Spain. In: Haq, B. U. (Ed.), SequenceStratigraphy and Depositional Response to Eustatic, Tec-tonic and Climatic Forcing. Kluwer Academic Press,Dordrecht, p. 87–112.
Pomar, L., Ward, W. C., 1999. Reservoir-Scale Heterogene-ity in Depositional Packages and Diagenetic Patterns ona Reef-Rimmed Platform, Upper Miocene, Mallorca,Spain. American Association of Petroleum GeologistsBulletin 83: 1759–1773.
Porebski, S. J., Steel, R. J., 2006. Deltas and sea-levelchange. Journal of Sedimentary Research 76, 390–403.
Posamentier, H. W., 2002. Ancient shelf ridges – A poten-tially significant component of the transgressive systemstract: Case study from offshore northwest Java. AmericanAssociation of Petroleum Geologists Bulletin 86,1, 75–106.
Posamentier, H. W., Allen, G. P., 1999. Siliciclastic sequencestratigraphy: concepts and applications. SEPM Conceptsin Sedimentology and Paleontology no. 7, 210 pp.
Posamentier, H. W., Kolla, V., 2003. Seismic geomorphologyand stratigraphy of depositional elements in deep-watersettings. Journal of Sedimentary Research 73,3, 367–388.
Posamentier, H. W., Morris, W. R., 2000. Aspects of thestratal architecture of forced regressive deposits. In:Hunt, D., Gawthorpe, R. L. (eds.), Sedimentary Respons-es to Forced Regressions. Geological Society of London,Special Publication 172, 19–46.
Sequence Stratigraphy: Methodology and Nomenclature 241

Posamentier, H. W., Vail, P. R., 1988. Eustatic controls onclastic deposition. II. Sequence and systems tract models.In: Wilgus, C. K., Hastings, B. S., Kendall, C. G. St. C.,Posamentier, H. W., Ross, C. A., Van Wagoner, J. C.(Eds.), Sea Level Changes – An Integrated Approach.SEPM Special Publication 42, 125–154.
Posamentier, H. W., Walker, R. G., 2006. Deep-water tur-bidites and submarine fans. In: Posamentier, H. W., Wal -ker, R. G. (eds.), Facies Models Revisited. Society for Sedimentary Geology (SEPM), Special Publication 84,397–520.
Posamentier, H. W., Allen, G. P., James, D. P., 1992a. Highresolution sequence stratigraphy – the East Coulee Delta,Alberta. Journal of Sedimentary Petrology 62,2, 310–317.
Posamentier, H. W., Allen, G. P., James, D. P., Tesson, M.,1992b. Forced regressions in a sequence stratigraphicframework: concepts, examples, and exploration signifi-cance. American Association of Petroleum GeologistsBulletin 76, 1687–1709.
Posamentier, H. W., Jervey, M. T., Vail, P. R., 1988. Eustaticcontrols on clastic deposition. I. Conceptual framework.In: Wilgus, C. K., Hastings, B. S., Kendall, C. G. St. C.,Posamentier, H. W., Ross, C. A., Van Wagoner, J. C.(Eds.), Sea Level Changes – An Integrated Approach.SEPM Special Publication 42, p. 110–124.
Pratt, B. R., Haidl, F. M., 2008. Microbial patch reefs in Upper Ordovician Red River strata, Williston Basin,Saskatchewan: Signal of heating in a deteriorating epeir-ic sea. In: Pratt, B. R., Holmden, C. (Eds.), Dynamics ofEpeiric Seas. Geological Association of Canada, SpecialPublication 48, 303–340.
Rankey, E. C., Bachtel, S. L., Kaufman, J., 1999. Controls onstratigraphic architecture of icehouse mixed carbonate-siliciclastic systems: a case study from the Holder For-mation (Pennsylvanian, Virgillian), Sacramento Moun-tains, New Mexico. In: Harris, P. M., Saller, A. H., Simo,J. A. (eds.), Advances in Sequence Stratigraphy: Applica-tion to Reservoirs Outcrops and Models. Soc. Econ.Petrol. Min. (Society for Sedimentary Geology) Spec.Publ. 63, 127–150.
Reid, S. K., Dorobek, S. L., 1993. Sequence stratigraphy andevolution of a progradational, foreland carbonate ramp,lower Mississippian Mission Canyon Formation andstratigraphic equivalents, Montana and Idaho. In: Loucks,R. G., Sarg, J. F. (eds.), Carbonate sequence stratigraphy –Recent developments and applications. AAPG Memoir57, 327–352.
Rudwick, M., 1996. Geological travel and theoretical inno-vation: the role of ̒ Liminalʼ experience. Social Studies ofSciences 26, 143–159.
Saller, A. H., Barton, J. W., Barton, R. E., 1989. Slope sedi-mentation associated with a vertically building shelf,Bone Spring Formation, Mescalero Escarpe Field, south-eastern New Mexico. In: Crevello, P. G., Wilson, J. J.,Sarg, J. F., Read, J. F. (eds.), Carbonate Platform andBasin Development. Soc. Econ. Petrol. Min. (Society forSedimentary Geology) Spec. Publ. 44, 233–257.
Saller, A. H., Dickson, J. A. D., Rasbury, E. T., Ebato, T., 1999.Effects of long-term accommodation change on short-termcycles, Upper Palaeozoic platform limestones, West Texas.In: Harris, P. M., Saller, A. H., Simo, J. A. (eds.), Advancesin Sequence Stratigraphy: Application to Reservoirs Out-crops and Models. Soc. Econ. Petrol. Min. (Society forSedimentary Geology) Spec. Publ. 63, 227–246.
Sanders, D., Hofling, R., 2000. Carbonate deposition inmixed siliciclastic-carbonate environments on top of anorogenic wedge (Late Cretaceous, Northern CalcareousAlps, Austria). Sed. Geol. 137, 127–146.
Sandoval, J., O’Dogherty, L., Aguado, R., Bartolini, A.,Bruchez, S., Bill, M., 2008. Aalenian carbon-isotopestratigraphy: calibration with ammonite, radiolarian andnannofossil events in the Western Tethys. Palaeogeogr.Palaeoclimatol. Palaeoecol. 267, 115–137.
Santiseban, C., Taberner, C., 1988. Sedimentary models ofsiliciclastic deposits and coral reef interactions. In:Doyle, L. J., Roberts, H. H. (eds.), Carbonate-ClasticTransitions. Elsevier, Developments in Sedimentology42, 35–76, Amsterdam.
Sarg, J. F., 2001. The sequence stratigraphy, sedimentology,and economic importance of evaporite-carbonate transi-tions: a review. Sedimentary Geology 140, 9–42.
Saul, G., Naish, T. R., Abbott, S. T., Carter, R. M., 1999. Sedimentary cyclicity in the marine Pliocene-Pleistoceneof the Wanganui Basin (New Zealand): sequence strati-graphic motifs characteristic of the past 2.5 m.y. Geolog-ical Society of America Bulletin 111, 524–537.
Scaturo, D. M., Strobel, J. S., Kendall, C. G. St. C., Wendte,J. C., Biswas, G., Bezdek, J., Cannon, R., 1989. JudyCreek: a case study of a two dimensional sediment depo-sition simulation. In: Wilson, J. L., Crevello, P., Read, F.(eds.), Controls on Carbonate Platform and Basin Devel-opment, SEPM Spec. Publ. 44, 64–76.
Schlager, W., 1992. Sedimentology and sequence stratigra-phy of reefs and carbonate platforms. Continuing Educa-tion Course Note Series #34, American Association ofPetroleum Geologists, 71 pp.
Schlager, W., 2004. Fractal nature of stratigraphic sequen c -es. Geology 32, 185–188.
Schlager, W., 2005. Carbonate Sedimentology and SequenceStratigraphy. SEPM Concepts in Sedimentology and Pa-leontology #8, 200 pp.
Schlager, W., 2010. Ordered hierarchy versus scale invari-ance in sequence stratigraphy. International Journal ofEarth Sciences 99, S139–S151.
Schlager, W., Reijmer, J. J. G., Droxler, A., 1994. Highstandshedding of carbonate platforms. Jour. of Sed. Res., B64,270–281.
Schumm, S. A., 1993. River response to baselevel change:implications for sequence stratigraphy. Journal of Geolo-gy 101, 279–294.
Schwarzacher, A., 2000. Repetition and cycles in stratigra-phy. Earth-Science Reviews 50, 51–75.
Shanley, K. W., McCabe, P. J., 1994. Perspectives on the se-quence stratigraphy of continental strata. American Asso-ciation of Petroleum Geologists Bulletin 78, 544–568.
O. Catuneanu et al.242

Sharland, P. R., Archer, R., Casey, D. M., Davies, R. B., Hall,S. H., Heward, A. P., Horbury, A. D., Simmons, M. D.,2001. Arabian Plate Sequence Stratigraphy. GeoArabiaSpecial Publication 2, Gulf PetroLink, Bahrain, 371 pp.
Simo, A., 1989. Upper Cretaceous platform to basin deposi-tional sequence development, Tremp Basin, south centralPyrenees, Spain. In: Crevello, P. G., Wilson, J. J., Sarg, J. F.,Read, J. F. (eds.), Carbonate Platform and Basin Develop-ment. Soc. Econ. Petrol. Min. Spec. Publ. 44, 233–257.
Sixsmith, P. J., Flint, S. S., Wickens, H. de V., Johnson, S. D.,2004. Anatomy and stratigraphic development of a basinfloor turbidite systemin the Laingsburg formation, mainKaroo basin, South Africa. Journal of Sedimentary Re-search 74, 239–254.
Sloss, L. L., 1963. Sequences in the cratonic interior ofNorth America. Geological Society of America Bulletin74, 93–114.
Sloss, L. L., Krumbein, W. C., Dapples, E. C., 1949. Inte-grated facies analysis. In: Longwell, C. R. (ed.), Sedi-mentary Facies in Geologic History. Geological Societyof America Memoir 39, 91–124.
Slowakiewicz, M., Mikolajewski, Z., 2009. Sequence strati -g raphy of the Upper Permian Zechstein Main Dolomite carbonates in western Poland: a new approach. Journal Petroleum Geology 32, 215–234.
Smith, L. B., Read, J. F., 2000. Rapid onset of late Palaeo-zoic glaciation on Gondwana: evidence from Upper Mis-sissippian strata of the Mid-continent, U.S.A. Geology28, 279–282.
Smith, L. B., Read, J. F., 2001. Discrimination of local andglobal effects on Upper Mississippian stratigraphy, Illi-nois Basin, U.S.A. Journal of Sedimantary Research 71,985–1002.
Smith, L. B., Eberli, G. P., Sonnenfeld, M. D., 2003. Se-quence-stratigraphic and paleogeographic distribution ofreservoir-quality dolomite, Madison Formation, Wyomingand Montana. In: Grammer, G. M., Eberli, G. P., Harris,P. M. (eds.), Integration of outcrop and modern analogs inreservoir modeling. – AAPG Memoir 80, 94–118.
Soreghan, G. S., 1997. Walther’s law, climate change andupper Paleozoic cyclostratigraphy in the ancestral RockyMountains. Journal of Sedimnetary Research 67, 1001–1004.
Southgate, P. N., Kennard, J. M., Jackson, M. J., O’Brien,P. E., Sexton, M. J., 1993. Reciprocal lowstand clastic andhighstand carbonate sedimentation, subsurface DevonianReef Complex, Canning Basin, Western Australia. In:Loucks, R. G., Sarg, J. F. (eds.), Carbonate SequenceStratigraphy. AAPG Memoir 57, 157–179.
Spence, G. H., Tucker, M. E., 1997. Genesis of limestonemegabreccias and their significance in carbonate sequencestratigraphic models: a review. Sedimentary Geology 112,163–193.
Spence, G. H., Tucker, M. E., 2007. A proposed integratedmulti-signature model for peritidal cycles in carbonates.Journal of Sedimentary Research 77, 797–808.
Sprague, A. R., Patterson, P. E., Hill, R. E., Jones, C. R.,Campion, K. M., Van Wagoner, J. C., Sullivan, M. D.,
Larue, D. K., Feldman, H. R., Demko, T. M., Wellner,R. W., Geslin, J. K., 2002. The Physical Stratigraphy ofFluvial Strata: A Hierarchical Approach to the Analysis ofGenetically Related Stratigraphic Elements for ImprovedReservoir Prediction. (Abstract) AAPG Annual Meeting.
Sprague, A. R., Sullivan, M. D., Campion, K. M., Jensen,G. N., Goulding, F. J., Garfield, T. R., Sickafoose, D. K.,Rossen, C., Jennette, D. C., Beaubouef, R. T., Abreu, V.,Ardill, J., Porter, M. L., Zelt, F. B., 2003. The PhysicalStratigraphy of Deep-Water Strata: A Hierarchical Ap-proach to the Analysis of Genetically Related Strati-graphic Elements for Improved Reservoir Prediction.AAPG Bulletin, (Abstract) AAPG Annual Meeting, 87,10 p.
Sprague, A. R., Patterson, P. E., Sullivan, M. D., Campion,K. M., Jones, C. R., Garfield, T. R., Sickafoose, D. K.,Jennette, D. C., Jensen, G. N., Beaubouef, R. T., Gould-ing, F. J., Van Wagoner, J. C., Wellner, R. W., Larue, D. K.,Rossen, C., Hill, R. E., Geslin, J. K., Feldman, H. R.,Demko, T. M., Abreu, V., Zelt, F. B., Ardill, J., Porter,M. L., 2004. Physical Stratigraphy of Clastic Strata: A Hierarchical Approach to the Analysis of Genetically Re-lated Stratigraphic Elements for Improved Reservoir Pre-diction. Abstract, AAPG 2003-04 Distinguished lecturerTour Information.
Steel, R. J., Olsen, T., 2002. Clinoforms, clinoform trajecto-ries and deepwater sands. In: Armentrout, J. M., Rosen,N. C. (eds.), Sequence Stratigraphic Models for Explo-ration and Production: Evolving Methodology, EmergingModels and Application Histories. Proceeding of the 22nd
Annual Bob F. Perkins Research Conference. Gulf CoastSection, Society of Economic Paleontologists and Miner-alogists (GCS-SEPM), 367–381.
Steuber, T., Rauch, M., Masse, J.-P., Graaf, J., Malkoc, M.,2005. Low-latitude seasonality of Cretaceous tempera-tures in warm and cold episodes. Nature 437, 1341–1344.
Strasser, A., 2007. Astronomical time scale for the MiddleOxfordian to Late Kimmeridgian in the Swiss and FrenchJura Mountains. Swiss J. Geosci. 100, 407–429.
Strasser, A., Hilgen, F. J., Heckel, P. H., 2006. Cyclostratig-raphy – concepts, definitions, and applications. Newslet-ters on Stratigraphy 42, 75–114.
Strasser, A., Hillgärtner, H., Hug, W., Pittet, B., 2000. Third-order depositional sequences reflecting Milankovitchcyclicity. Terra Nova 12, 303–311.
Strasser, A., Hillgärtner, H., Pasquier, J.-B., 2004. Cyclo -stratigraphic timing of sedimentary processes: an exam-ple from the Berriasian of the Swiss and French JuraMountains. SEPM Spec. Publ. 81, 135–151.
Strasser, A., Pittet, B., Hillgärtner, H., Pasquier, J.-B., 1999.Depositional sequences in shallow carbonate-dominatedsedimentary systems: concepts for a high-resolution anal -ysis. Sedimentary Geology 128, 201–221.
Strohmenger, C., Voight, E., Zimdars, J., 1996. Sequencestratigraphy and cyclic development of Basal Zechsteincarbonate-evaporite deposits with emphasis on Zechstein2 off-platform carbonates (Upper Permian, NortheastGermany). Sedimentary Geology 102, 33–54.
Sequence Stratigraphy: Methodology and Nomenclature 243

Swift, D. J. P., 1975. Barrier-island genesis: evidence fromthe central Atlantic shelf, eastern U.S.A. SedimentaryGeology 14, 1–43.
Taylor, J. C. M., 1990. Upper Permian–Zechstein. In: Glen-nie, K. W. (Ed.), Introduction to the Petroleum Geologyof the North Sea. Blackwell Science, Oxford, p. 153–190.
Thomas, R. G., Smith, D. G., Wood, J. M., Visser, J., Calver-ley-Range, E. A., Koster, E. H., 1987. Inclined heterolith-ic stratification – terminology, description, interpretationand significance. Sedimentary Geology 53, 123–179.
Tinker, S. W., 1998. Shelf-to-basin facies distributions andsequence stratigraphy of a steep-rimmed carbonate mar-gin: Capitan depositional system, McKittrick Canyon,New Mexico and Texas. Journal of Sedimentary Research68,6, 1146–1174.
Tucker, M. E., 1991. Sequence stratigraphy of carbonateevaporite basins, models and application to the UpperPermian (Zechstein of northeast England and adjoiningNorth Sea. Journal of the Geological Society 148, 1019–1036.
Tucker, M. E., 2003. Mixed clastic carbonate successions:Quaternary of Egypt, Mid Carboniferous, NE England.Geologica Croatica 56, 19–37.
Tucker, M. E., Garland, J., 2010. High-frequency cycles andtheir sequence stratigraphic context: orbital forcing andtectonic controls on Devonian cyclicity, Belgium. Geo-logica Belgica 13/3, 213–240.
Tucker, M. E., Gallagher, J., Leng, M., 2009. Are beds mil-lennial-scale cycles? An example from the Carboniferousof NE England. Sedimentary Geology 214, 19–34.
Vail, P. R., 1987. Seismic stratigraphy interpretation proce-dure. In: Bally, A. W. (Ed.), Atlas of Seismic Stratigraphy,vol. 27. American Association of Petroleum GeologistsStudies in Geology, p. 1–10.
Vail, P. R., Mitchum, R. M. Jr., Thompson, S., III, 1977.Seismic stratigraphy and global changes of sea level, partfour: global cycles of relative changes of sea level. Amer-ican Association of Petroleum Geologists Memoir 26,83–98.
Vail, P. R., Audemard, F., Bowman, S. A., Eisner, P. N.,Perez-Cruz, C., 1991. The stratigraphic signatures of tectonics, eustasy and sedimentology – an overview. In:Einsele, G., Ricken, W., Seilacher, A. (eds), Cycles andEvents in Stratigraphy. Springer–Verlag, p. 617–659.
Van Buchem, F. S. P., Razin, P., Homewood, P. W., Oter-doom, W. H., Philip, J., 2002. Stratigraphic Organizationof Carbonate Ramps and Organic-Rich Intrashelf Basins:Natih Formation (Middle Cretaceous) of Northern Oman.AAPG Bulletin 86,1, 21–53.
Van Buchem, F. S. P., Pittet, B., Hillgarten, H., Grötsch, J., Al-Mansouri, A., Billing, I. M., van Steenwinkel, M., Droste,H. H. J., Oterdoom, H., 2003. High-Resolution SequenceStratigraphic Architecture of Barremian-Aptian CarbonateSystems in Northern Oman and the United Arab Emirates(Kharaib and Shu’aiba Formations). GeoArabia 7,3, 461–500.
Van den Belt, F. J. G., de Boer, P. L., 2007. A shallow-basinmodel for ʻsaline giantsʼ based on isostasy-driven subsi-
dence. In: Nichols, G., Williams, E., Paola, C. (Eds.),Sedimentary Processes, Environments and Basins. Inter-national Association of Sedimentologists Special Publi-cation 38, 241–252.
Vandenberghe, J., 1993. Changing fluvial processes underchanging periglacial conditions. Z. Geomorph. N.F. 88,17–28.
Vandenberghe, J., Kasse, C., Bohnke, S., Kozarski, S., 1994.Climate-related river activity at the Weichselian-Holo -cene transition: a comparative study of the Warta andMaas rivers. Terra Nova 6, 476–485.
Van der Merwe, W. C., Flint, S. S., Hodgson, D. M., 2010.Sequence stratigraphy of an argillaceous, deepwaterbasin-plain succession: Vischkuil Formation (Permian),Karoo Basin, South Africa. Marine and Petroleum Geol-ogy 27, 321–333.
Van Wagoner, J. C., 1995. Sequence Stratigraphy and Ma-rine to Nonmarine Facies Architecture of Foreland BasinStrata, Book Cliffs, Utah, U.S.A. In: Van Wagoner, J. C.,Bertram, G. T. (Eds.), Sequence Stratigraphy of ForelandBasin Deposits. American Association Petroleum Geolo-gists Memoir 64, 137–223.
Van Wagoner, J. C., Mitchum, R. M., Posamentier, H. W.,Vail, P. R., 1987. An overview of sequence stratigraphyand key definitions. In: Bally, A. W. (Ed.), Atlas of Seis-mic Stratigraphy, volume 1. AAPG Studies in Geology27, 11–14.
Van Wagoner, J. C., Posamentier, H. W., Mitchum, R. M.,Vail, P. R., Sarg, J. F., Loutit, T. S., Hardenbol, J., 1988.An overview of sequence stratigraphy and key defini-tions. In: Wilgus, C. K., Hastings, B. S., Kendall, C. G.St. C., Posamentier, H. W., Ross, C. A., Van Wagoner,J. C. (Eds.), Sea Level Changes – An Integrated Ap-proachSEPM Special Publication 42, 39–45.
Van Wagoner, J. C., Mitchum Jr., R. M., Campion, K. M.,Rahmanian, V. D., 1990. Siliciclastic sequence stratigra-phy in well logs, core, and outcrops: concepts for high-resolution correlation of time and facies. American Asso-ciation of Petroleum Geologists Methods in ExplorationSeries 7, 55 pp.
Warren, J., 2006. Evaporites: Sediments, Resources, Hydro-carbons. Springer-Verlag, Berlin.
Weimer, P., 1991. Seismic facies, characteristics, and varia-tions in channel evolution, Mississippi Fan (Plio/Pleis-tocene), Gulf of Mexico. In: Weimer, P., Link, M. H.(eds.), Seismic facies and sedimentary processes of sub-marine fans and turbidite systems. Springer-Verlag, NewYork, p. 323–347.
Weimer, P., Slatt, R. M., 2007. Petroleum geology of deep-water settings. AAPG Studies in Geology, vol. 57, Amer-ican Association of Petroleum Geologists, Tulsa, 816 pp.
Weimer, R. J., 1966. Time-stratigraphic analysis and petro-leum accumulations, Patrick Draw field, SweetwaterCounty, Wyoming. Bulletin of the American Associationof Petroleum Geologists 50,10, 2150–2175.
Weissert, H., Mohr, H., 1996. Late Jurassic climate and itsimpact on carbon cycling. Palaeogeology, Palaeoclima-tology, Palaeoecology 122, 27–43.
O. Catuneanu et al.244

Weissert, H., Joachimski, M., Sarnthein, M., 2008. Chemo -stratigraphy. Newsletters on Stratigraphy 42, 145–179.
Wildi, W., Funk, H., Loup, B., Amato, E., Huggenberger, P.,1989. Mesozoic subsidence history of the European mar-ginal shelves of the Alpine Tethys (Helvetic realm, SwissPlateau and Jura). Eclogae Geol. Helv. 82, 817–840.
Wilkinson, B. H., Merrill, G. K., Kivett, S. J., 2003. Stratalorder in Pennsylvanian cyclothems. Bulletin GeologicalSociety of America 115, 1068–1087.
Willis, A. J., 2000. Tectonic control of nested sequence ar-chitecture in the Sego Sandstone, Neslen Formation, andUpper Castlegate Sandstone (Upper Cretaceous), SevierForeland Basin, Utah, USA. Sedimentary Geology 136,277–317.
Wilson, M. E. J., Lockier, S. W., 2002. Siliciclastic and vol-ca niclastic influences on equatorial carbonates: insightsfrom the Neogene of Indonesia. Sedimentology 49, 583–601.
Winker, C. D., Booth, J. R., 2000. Sedimentary dynamics ofthe salt-dominated continental slope, Gulf of Mexico: in-tegration of observations from the sea floor, near-surfaceand deep subsurface. In: Weimer, P., Slatt, R. M., Cole-man, J., Rosen, N. C., Nelson, H., Bouma, A. H., Styzen,
M. J., Lawrence, D. T. (Eds.), Deepwater Reservoirs ofthe World. Gulf Coast Society of the Society of Econom-ic Paleontologists and Mineralogists Foundation, 20thAnnual Research Conference, p. 1059–1086.
Wright, V. P., Marriott, S. B., 1993. The sequence stratigra-phy of fluvial depositional systems: the role of floodplainsediment storage. Sedimentary Geology 86, 203–210.
Wright, V. P., Vanstone, S. D., 2001. Onset of late Palaeozoicglacio-eustasy and the evolving climates of low latitudes:a synthesis of current understanding. Journal GeologicalSociety London 158, 579–582.
Yoshida, S., 2000. Sequence stratigraphy and facies archi-tecture of the upper Blackhawk Formation and the LowerCastlegate Sandstone (Upper Cretaceous), Book Cliffs,Utah, USA. Sedimentary Geology 136, 239–276.
Yoshida, S., Willis, A., Miall, A. D., 1996. Tectonic controlof nested sequence architecture in the Castlegate Sand-stone (Upper Cretaceous), Book Cliffs, Utah. Journal ofSedimentary Research 66, 737–748.
Manuscript received: February 8, 2011; accepted: July 21,2011.
Sequence Stratigraphy: Methodology and Nomenclature 245