Sensory factors limiting horizontal and vertical visual ... · The isolated letter ‘‘x’’ is...
17
Sensory factors limiting horizontal and vertical visual span for letter recognition Deyue Yu # $ College of Optometry, The Ohio State University, Columbus, Ohio, USA Gordon E. Legge # $ Department of Psychology, University of Minnesota, Minneapolis, Minnesota, USA Gunther Wagoner $ Department of Psychology, University of Minnesota, Minneapolis, Minnesota, USA Susana T. L. Chung # $ School of Optometry, University of California, Berkeley, California, USA Reading speed for English text is slower for text oriented vertically than horizontally. Yu, Park, Gerold, and Legge (2010) showed that slower reading of vertical text is associated with a smaller visual span (the number of letters recognized with high accuracy without moving the eyes). Three possible sensory determinants of the size of the visual span are: resolution (decreasing acuity at letter positions farther from the midline), mislocations (uncertainty about the relative position of letters in strings), and crowding (interference from flanking letters in recognizing the target letter). In the present study, we asked which of these factors is most important in determining the size of the visual span, and likely in turn in determining the horizontal/vertical difference in reading when letter size is above the critical print size for reading. We used a decomposition analysis to represent constraints due to resolution, mislocations, and crowding as losses in information transmitted (in bits) about letter recognition. Across vertical and horizontal conditions, crowding accounted for 75% of the loss in information, mislocations accounted for 19% of the loss, and declining acuity away from fixation accounted for only 6%. We conclude that crowding is the major factor limiting the size of the visual span, and that the horizontal/vertical difference in the size of the visual span is associated with stronger crowding along the vertical midline. Introduction Reading is an essential daily activity heavily reliant on vision. Extensive research conducted on the psychophysics of reading in the past two decades suggests that the size of the visual span, the number of letters in text that can be recognized reliably without moving the eyes, is a sensory bottleneck limiting reading speed (Legge, 2007; Legge et al., 2007; Legge, Mansfield, & Chung, 2001; Pelli et al., 2007; Yu, Cheung, Legge, & Chung, 2007). A visual-span profile, a plot of letter-recognition performance (proportion correct) as a function of letter position relative to fixation, is measured with a letter-recognition task using trigrams (strings of three random letters), and depicts the sensory information available for letter recognition during reading. A possible causal connec- tion between visual-span size and reading speed has been demonstrated in an ideal-observer model (Legge, Hooven, Klitz, Mansfield, & Tjan, 2002; Legge, Klitz, & Tjan, 1997). Strong correlation between the two measurements has been revealed empirically in many studies (e.g., Legge et al., 2007; Yu et al., 2007; Yu, Park, Gerold, & Legge, 2010). Quantitatively, an increase of one letter recognized perfectly in the visual span represents an increase of 4.7 bits of information and is associated with an increase in reading speed by about 40% (Legge et al., 2007). The size of the visual span may be limited by three sensory properties: (a) decreasing resolution (letter acuity decreasing away from the midline), (b) misloca- tions (errors in the sequence of letters due to uncertainty about relative position of letters in strings, and (c) crowding (the interfering effects of flanking letters) (Legge, 2007). In the present study, we investigated how these factors influence changes in the Citation: Yu, D., Legge, G. E.,Wagoner, G., & Chung, S.T. L. (2014). Sensory factors limiting horizontal and vertical visual span for letter recognition. Journal of Vision, 14(6):3, 1–17, http://www.journalofvision.org/content/14/6/3, doi:10.1167/14.6.3. Journal of Vision (2014) 14(6):3, 1–17 1 http://www.journalofvision.org/content/14/6/3 doi: 10.1167/14.6.3 ISSN 1534-7362 Ó 2014 ARVO Received March 31, 2014; published August 25, 2014
-
Upload
nguyendung -
Category
Documents
-
view
214 -
download
0
Transcript of Sensory factors limiting horizontal and vertical visual ... · The isolated letter ‘‘x’’ is...
Sensory factors limiting horizontal and vertical visual span forletter recognition
Deyue Yu # $College of Optometry, The Ohio State University,
Columbus, Ohio, USA
Gordon E. Legge # $Department of Psychology, University of Minnesota,
Minneapolis, Minnesota, USA
Gunther Wagoner $Department of Psychology, University of Minnesota,
Minneapolis, Minnesota, USA
Susana T. L. Chung # $School of Optometry, University of California,
Berkeley, California, USA
Reading speed for English text is slower for text orientedvertically than horizontally. Yu, Park, Gerold, and Legge(2010) showed that slower reading of vertical text isassociated with a smaller visual span (the number ofletters recognized with high accuracy without moving theeyes). Three possible sensory determinants of the size ofthe visual span are: resolution (decreasing acuity at letterpositions farther from the midline), mislocations(uncertainty about the relative position of letters instrings), and crowding (interference from flanking letters inrecognizing the target letter). In the present study, weasked which of these factors is most important indetermining the size of the visual span, and likely in turn indetermining the horizontal/vertical difference in readingwhen letter size is above the critical print size for reading.We used a decomposition analysis to represent constraintsdue to resolution, mislocations, and crowding as losses ininformation transmitted (in bits) about letter recognition.Across vertical and horizontal conditions, crowdingaccounted for 75% of the loss in information, mislocationsaccounted for 19% of the loss, and declining acuity awayfrom fixation accounted for only 6%. We conclude thatcrowding is the major factor limiting the size of the visualspan, and that the horizontal/vertical difference in the sizeof the visual span is associated with stronger crowdingalong the vertical midline.
Introduction
Reading is an essential daily activity heavily relianton vision. Extensive research conducted on thepsychophysics of reading in the past two decades
suggests that the size of the visual span, the number ofletters in text that can be recognized reliably withoutmoving the eyes, is a sensory bottleneck limitingreading speed (Legge, 2007; Legge et al., 2007; Legge,Mansfield, & Chung, 2001; Pelli et al., 2007; Yu,Cheung, Legge, & Chung, 2007). A visual-span profile,a plot of letter-recognition performance (proportioncorrect) as a function of letter position relative tofixation, is measured with a letter-recognition taskusing trigrams (strings of three random letters), anddepicts the sensory information available for letterrecognition during reading. A possible causal connec-tion between visual-span size and reading speed hasbeen demonstrated in an ideal-observer model (Legge,Hooven, Klitz, Mansfield, & Tjan, 2002; Legge, Klitz,& Tjan, 1997). Strong correlation between the twomeasurements has been revealed empirically in manystudies (e.g., Legge et al., 2007; Yu et al., 2007; Yu,Park, Gerold, & Legge, 2010). Quantitatively, anincrease of one letter recognized perfectly in the visualspan represents an increase of 4.7 bits of informationand is associated with an increase in reading speed byabout 40% (Legge et al., 2007).
The size of the visual span may be limited by threesensory properties: (a) decreasing resolution (letteracuity decreasing away from the midline), (b) misloca-tions (errors in the sequence of letters due touncertainty about relative position of letters in strings,and (c) crowding (the interfering effects of flankingletters) (Legge, 2007). In the present study, weinvestigated how these factors influence changes in the
Citation: Yu, D., Legge, G. E.,Wagoner, G., & Chung, S. T. L. (2014). Sensory factors limiting horizontal and vertical visual span forletter recognition. Journal of Vision, 14(6):3, 1–17, http://www.journalofvision.org/content/14/6/3, doi:10.1167/14.6.3.
Journal of Vision (2014) 14(6):3, 1–17 1http://www.journalofvision.org/content/14/6/3
doi: 10 .1167 /14 .6 .3 ISSN 1534-7362 � 2014 ARVOReceived March 31, 2014; published August 25, 2014
size of the visual span through a decompositionanalysis.
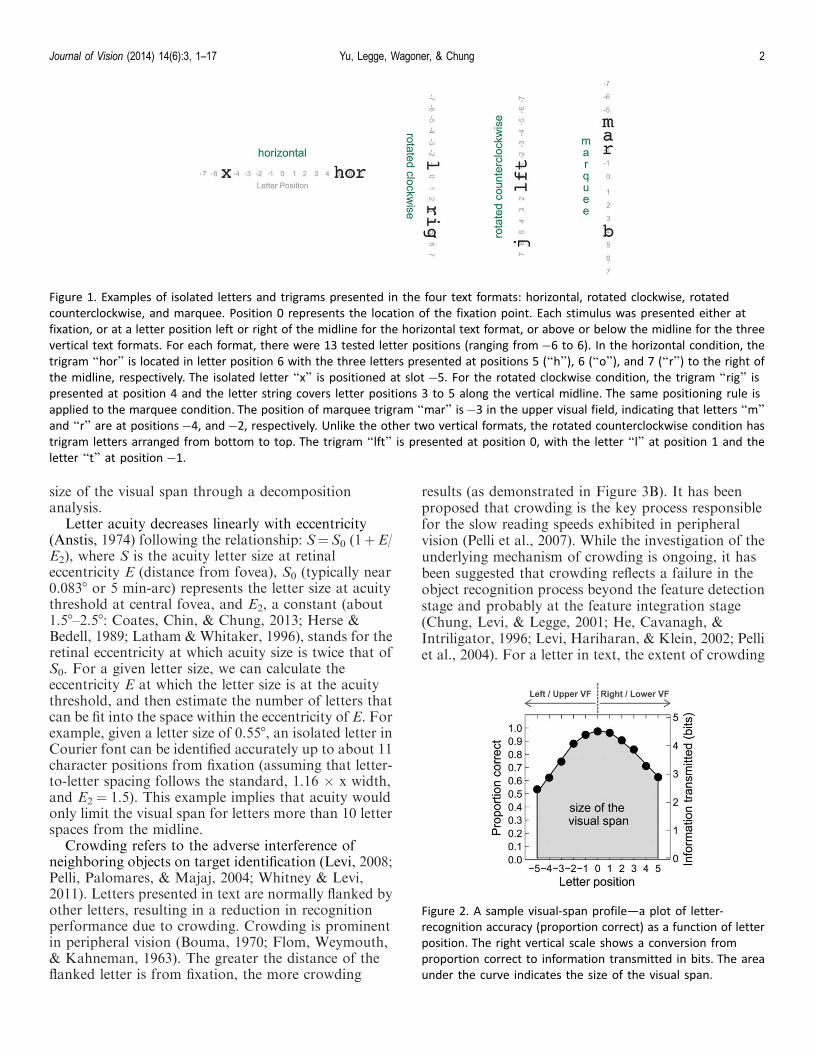
Letter acuity decreases linearly with eccentricity(Anstis, 1974) following the relationship: S¼S0 (1þE/E2), where S is the acuity letter size at retinaleccentricity E (distance from fovea), S0 (typically near0.0838 or 5 min-arc) represents the letter size at acuitythreshold at central fovea, and E2, a constant (about1.58–2.58: Coates, Chin, & Chung, 2013; Herse &Bedell, 1989; Latham & Whitaker, 1996), stands for theretinal eccentricity at which acuity size is twice that ofS0. For a given letter size, we can calculate theeccentricity E at which the letter size is at the acuitythreshold, and then estimate the number of letters thatcan be fit into the space within the eccentricity of E. Forexample, given a letter size of 0.558, an isolated letter inCourier font can be identified accurately up to about 11character positions from fixation (assuming that letter-to-letter spacing follows the standard, 1.16 · x width,and E2¼ 1.5). This example implies that acuity wouldonly limit the visual span for letters more than 10 letterspaces from the midline.
Crowding refers to the adverse interference ofneighboring objects on target identification (Levi, 2008;Pelli, Palomares, & Majaj, 2004; Whitney & Levi,2011). Letters presented in text are normally flanked byother letters, resulting in a reduction in recognitionperformance due to crowding. Crowding is prominentin peripheral vision (Bouma, 1970; Flom, Weymouth,& Kahneman, 1963). The greater the distance of theflanked letter is from fixation, the more crowding
results (as demonstrated in Figure 3B). It has beenproposed that crowding is the key process responsiblefor the slow reading speeds exhibited in peripheralvision (Pelli et al., 2007). While the investigation of theunderlying mechanism of crowding is ongoing, it hasbeen suggested that crowding reflects a failure in theobject recognition process beyond the feature detectionstage and probably at the feature integration stage(Chung, Levi, & Legge, 2001; He, Cavanagh, &Intriligator, 1996; Levi, Hariharan, & Klein, 2002; Pelliet al., 2004). For a letter in text, the extent of crowding
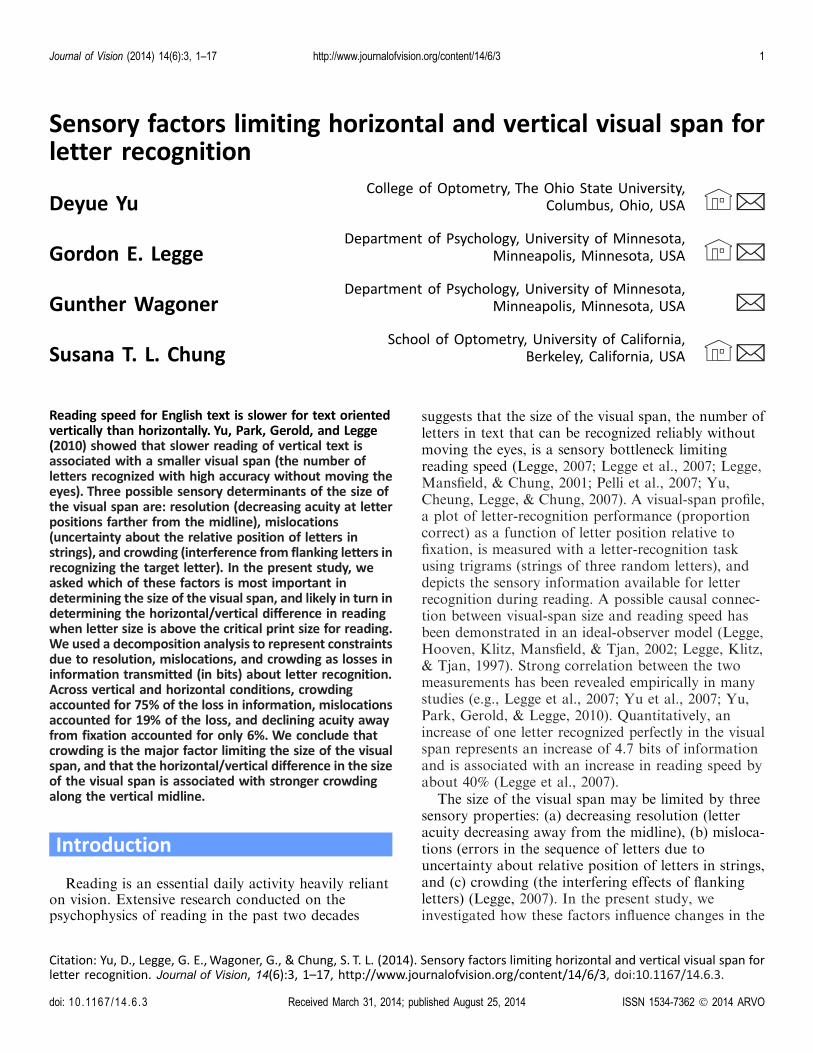
Figure 1. Examples of isolated letters and trigrams presented in the four text formats: horizontal, rotated clockwise, rotated
counterclockwise, and marquee. Position 0 represents the location of the fixation point. Each stimulus was presented either at
fixation, or at a letter position left or right of the midline for the horizontal text format, or above or below the midline for the three
vertical text formats. For each format, there were 13 tested letter positions (ranging from�6 to 6). In the horizontal condition, the
trigram ‘‘hor’’ is located in letter position 6 with the three letters presented at positions 5 (‘‘h’’), 6 (‘‘o’’), and 7 (‘‘r’’) to the right of
the midline, respectively. The isolated letter ‘‘x’’ is positioned at slot �5. For the rotated clockwise condition, the trigram ‘‘rig’’ ispresented at position 4 and the letter string covers letter positions 3 to 5 along the vertical midline. The same positioning rule is
applied to the marquee condition. The position of marquee trigram ‘‘mar’’ is�3 in the upper visual field, indicating that letters ‘‘m’’and ‘‘r’’ are at positions�4, and�2, respectively. Unlike the other two vertical formats, the rotated counterclockwise condition has
trigram letters arranged from bottom to top. The trigram ‘‘lft’’ is presented at position 0, with the letter ‘‘l’’ at position 1 and the
letter ‘‘t’’ at position �1.
Figure 2. A sample visual-span profile—a plot of letter-
recognition accuracy (proportion correct) as a function of letter
position. The right vertical scale shows a conversion from
proportion correct to information transmitted in bits. The area
under the curve indicates the size of the visual span.
Journal of Vision (2014) 14(6):3, 1–17 Yu, Legge, Wagoner, & Chung 2
depends on whether the letter is flanked on one or bothsides. It is known that flankers on the outward side(away from the fovea) produce more crowding thanletters on the inward side (Bouma, 1973). Our methodfor compiling visual-span profiles (see Methods)averages over these cases. However, we are able todissect the visual-span profile into sub-profiles reveal-ing the differences in letter recognition associated withthe different flanker configurations (see examples inFigure 4).
Word recognition requires not only correct identifi-cation of the letters but also accurate recognition of thespatial arrangement of letters. In the visual-spanmeasurement, a letter is scored as correct only when itsidentity is reported at the correct letter position. Errorsin the spatial order of letters are termed mislocationsand affect the size of the visual span. This kind ofconfusion has been analyzed separately from identifi-cation errors (Strasburger & Malania, 2013; Zhang,Zhang, Liu, & Yu, 2012). It has been shown that thecoding of letter position becomes less precise withincreasing eccentricity resulting in inaccurate reportingof the spatial order of letters (Chung & Legge, 2009).
It is likely that crowding and mislocations representerrors in position labeling at two different bottom-upstages of letter recognition. Crowding may reflect afailure in segmenting one letter from its neighborsbecause of errors in assigning positions to the sensoryfeatures of the letters. The result would be inappro-priate spatial pooling or scrambling of features betweenletters (Pelli et al., 2004). Mislocations may indicateerrors in assigning positions to letters after they havebeen identified. This view is consistent with theproposal that position errors for features should be
distinguished from position errors for letters (Stras-burger, Rentschler, & Juttner, 2011). Here, we adopt adecomposition analysis (He, Legge, & Yu, 2013) thatwill help us understand sensory constraints at threesequential stages of information processing culminatingin the formation of the visual span: (a) availability ofraw sensory information for letter recognition (letteracuity measurements); (b) segmentation of features intoclusters representing letters (crowding measurements);and (c) labeling letters with appropriate position signals(mislocation measurements). The results of the de-composition analysis can help us better explain whyreading speed and visual-span size change with spatiallayout and physical properties of letters (Legge et al.,2001), and ultimately lead us to a better understandingof the processes involved in letter recognition andreading.
Figure 3. (A) Sample profiles (proportion correct plotted as a function of letter position) used in the decomposition analysis—the
perfect profile corresponds to 100% recognition performance; the isolated profile is for the recognition of single letters; the visual-
span profile (the red curve labeled as ‘‘Vspan’’) is for the identification performance in the trigram test; and the mislocation-corrected
visual-span profile (the blue curve labeled as ‘‘VspanþMisloc’’) is for the trigram identification performance without considering
localization accuracy. (B) Examples of difference curves (error rate plotted as a function of letter position). The green curve is obtained
by subtracting the isolated-letter profile from the perfect profile. The area under the green curve shows the reduction in performance
due to decreased acuity. The blue curve, a plot of the difference between the isolated-letter profile and the mislocation-corrected
visual-span profile, represents the effect of crowding. The red curve shows the decrease in performance due to mislocation errors.
Figure 4. Examples of a visual-span profile and its three sub-
profiles. The inner, middle, and outer curves are separate
profiles obtained in the trigram test, one for each of the three
within-trigram letter positions.
Journal of Vision (2014) 14(6):3, 1–17 Yu, Legge, Wagoner, & Chung 3

Yu et al. (2010) compared reading speeds and visual-span sizes for four text formats (Figure 1). Readingspeed for marquee text (upright letters arranged in avertical column) was 42% of horizontal reading speed,and the reading speeds for 908 clockwise or counter-clockwise rotation of text lines were 55% of thehorizontal speed. They also found that the slowerreading of vertical text is associated with reducedvisual-span size for the vertical formats. In the presentstudy, we applied a decomposition analysis of thevisual-span profiles to determine the factors accountingfor this difference.
Our results indicated that the narrower visual spansin the vertical direction were due to greater crowdingalong the vertical midline than the horizontal midline.Although stronger crowding along the vertical versusthe horizontal midline was present in the data describedby Toet and Levi (1992), these authors did notexplicitly comment on this asymmetry in crowding. Weare not aware of other reports of this asymmetry in theliterature. To confirm this crowding asymmetry, weconducted an auxiliary experiment with a traditionalmethod to assess crowding along the horizontal andvertical midlines.
The main goal of this study is to determine thecontributions of sensory factors accounting for thedifference in horizontal and vertical visual spans.
Methods
Participants
Ten normally-sighted, native-English-speakingyoung adults (aged 19 to 27) were recruited from theUniversity of Minnesota. All subjects signed an IRB-approved consent form before beginning testing. Noneof them had prior experience with the vertical textstimuli used in this study.
Apparatus and stimuli
The experimental stimuli were generated and pre-sented on a Sony Trinitron color graphic display(model: GDM-FW900; refresh rate: 76 Hz; resolution:1600 · 1024) by a Power Mac G4 computer (model:M8570; Apple, Inc., Cupertino, CA) running MAT-LAB 5.2.1 with the Psychophysics Toolbox extensions(Brainard, 1997; Pelli, 1997). The stimuli were 26lowercase alphabet letters in Courier font, a serif fontwith fixed width. All stimuli were rendered as blackcharacters on a white background (87.7cd/m2) withWeber contrast higher than�99%. The print size(defined as the height of the lowercase letter x) was
0.558 of visual angle that exceeds the critical print size(the smallest print size at which subjects can read attheir maximum reading speed) for all four text formats(Yu et al., 2010). A viewing distance of 40 cm was used.
Subjects read randomly selected isolated letters andstrings of three random letters (trigrams) presented infour different formats: horizontal, rotated clockwise(908), rotated counterclockwise (908), and marquee(shown in Figure 1). Marquee text is composed ofupright letters arranged vertically. Standard center-to-center letter spacing (used in normal Courier text),defined as 1.16 times the width of the lowercase letter x,was used in the horizontal, rotated clockwise, androtated counterclockwise conditions. There is noexisting standard for letter spacing of marqueeformatted text. Following the previous study onvertical reading by Yu et al. (2010), we adopted theminimum nonoverlapping letter spacing (1.67 · x-width) as the standard for marquee text. Note that thisletter spacing is still 44% larger than the other three textformats (see Discussion section for further comments).
Measuring visual-span profiles and isolated-letter profiles
We measured two types of letter-recognition profiles,visual-span profiles and isolated-letter profiles. Stimuliused for the measurement of visual-span profiles weretrigrams, random strings of three letters selected fromthe 26 lowercase English letters with replacement. Theexposure duration for each trigram was 105 ms.Subjects were asked to fixate at the center of the display(between two green dots) and identify all three letters ofeach trigram. Trigrams were centered at 13 differentletter positions (at fixation, and six positions to the leftand right of the midline for horizontal text and sixpositions above and below the midline for verticaltexts). To obtain isolated-letter profiles, randomly-selected single letters were used as stimuli. The testingconditions were the same as in the trigram task.
Figure 1 shows examples of isolated letters andtrigrams in four different text formats. For thehorizontal text format, letter slots along a horizontalline were labeled by negative or positive numbers toindicate positions to the left or right of the midline. Forthe three vertical formats, letter positions were dis-tributed along a vertical line. Consistent with ourprevious study (Yu et al., 2010), we assigned positivenumbers to indicate letter positions in the lower visualfield and negative numbers to the upper visual field.The positions of isolated letters and of the middle letterwithin trigrams ranged from�6 to 6. Within eachtrigram, the center letter of the trigram is referred to asthe middle letter; the one farthest from the midline is
Journal of Vision (2014) 14(6):3, 1–17 Yu, Legge, Wagoner, & Chung 4
labeled as the outer letter, and the one nearest themiddle as the inner letter.
For each letter position, we accumulated data fromthe inner, middle, and outer letters of the trigramspresented at that location, and calculated the propor-tion of letters that were correctly recognized as shownon the left vertical scale of Figure 2. These proportionscorrect were plotted as a function of letter position toform a visual-span profile. Each visual span profile wasbased on four blocks of 65 trigram trials (13 letterpositions · 5 trials per position). Only data withinletter positions�5 to 5 were analyzed for constructingthe visual-span profile since the rest of the positionshave fewer data points collected (absence of innerletters for positions�6 and 6, and absence of both innerand middle letters for positions�7 and 7). The left sideof the profile corresponds to the left visual field in thehorizontal format and the upper visual field in the threevertical formats, while the data on the right side of theprofiles are from the right horizontal visual field andthe lower vertical visual field.
A split Gaussian function was used to fit each visualspan profile with three parameters: peak amplitude,standard deviation for the left side of the profile, andright-side standard deviation (Legge et al., 2001). Theright vertical scale in Figure 2 shows the conversionfrom proportion correct for letter recognition to bits ofinformation transmitted. Perfect letter recognitionperformance (i.e., 100% accuracy) corresponds to themaximum amount (4.7 bits) of information transmit-ted, while the minimum (0 bits) is obtained when theperformance is at chance accuracy (1 out of 26¼ 3.8%).The conversion was calculated using letter confusionmatrices (Beckmann & Legge, 2002). The size of thevisual span is quantified by summing up the amount ofinformation transmitted by the profile covering letterpositions�5 to 5 (see Figure 2).
Similar to the visual-span profile, an isolated-letterprofile is a plot of recognition performance for isolatedletters (rather than trigrams) as a function of letterposition left and right of the midline. Each profile wasdeveloped based on the data collected from four blocksof 130 isolated-letter trials. This means that for each ofthe 13 positions, the proportion correct of single letterrecognition was computed based on 40 trials.
Reporting direction is likely to be a factor influenc-ing subject’s performance. To examine the effect ofreporting direction, we asked subjects to report thethree letters of each trigram in one of two reportingdirections: normal or reversed. The ‘‘normal’’ reportingdirection was from left to right for the horizontalformat, from top to bottom for the marquee androtated clockwise formats, and from bottom to top forthe rotated counterclockwise format. The trigram datawere analyzed separately for the two reporting direc-tions.
Subjects were tested with 2,080 isolated letter trialsand 2,080 trigram trials, which were divided into threesessions, with 16 blocks per session. The block sequencewas pseudo-randomized across sessions to minimizeany sequencing effects.
Decomposition analysis
Visual-span profiles describe the sensory informationavailable for letter recognition in reading. Resolution,mislocation, and crowding are three factors that maydetermine the size and shape of the visual-span profiles.Here, we adopt a decomposition analysis to distinguishbetween these three sensory components (He et al.,2013).
Decomposition analysis utilizes four profiles—aperfect profile, an isolated-letter profile, a visual-spanprofile, and a mislocation-corrected visual-span profile(shown in Figure 3A). The perfect profile (black line inFigure 3A) is hypothetical and corresponds to 100%recognition performance at all letter positions. Theisolated-letter profile (green line in Figure 3A) showsthe availability of front-end sensory information forsingle letter recognition. The width of the isolated-letterprofile is determined by the eccentricity at which lettersof a given size reach their local acuity limit in peripheralvision and is related to factors such as the decline inphotoreceptor and ganglion cell density. The differencebetween the perfect profile and isolated-letter profilerepresents the reduction in performance due to reducedacuity (green curve in Figure 3B). The reduction inisolated letter recognition could also be due to a non-upright letter orientation (see Discussion for moredetails).
Visual-span profiles1 (red line in Figure 3A) arecreated by presenting trigrams rather than isolatedletters. Because these profiles are based on multipleletters presented simultaneously, visual-span profilesare subject to mislocation errors and to crowdingeffects in addition to the resolution limitations ob-served for isolated-letter profiles. We can tease out theseparate effects of mislocation and crowding bycomparing trigram performance with two scoringmethods: by requiring that the letter’s identity andposition be named correctly (visual-span profile, redline in Figure 3A), and by the more lenient criterion ofscoring the letter correct even if it is identified out oforder (mislocation-corrected visual-span profile, blueline in Figure 3A). By considering the differencebetween these two methods of scoring, we can separatethe effects of mislocation from that of crowding andresolution: as shown in Figure 3B, the red curve, a plotof the difference between the mislocation-correctedvisual-span profile and the standard visual-span profile,represents the isolated effect of mislocations. Similarly,
Journal of Vision (2014) 14(6):3, 1–17 Yu, Legge, Wagoner, & Chung 5

we can isolate the effects of crowding (blue curve inFigure 3B) by considering the difference between themislocation-corrected visual-span profile (where theeffect of mislocations has been eliminated) and theisolated letter profile. The areas under these differencecurves (resolution, crowding, and mislocation curves)represent the information lost due to the three sensorycomponents, respectively.
Applying decomposition analysis to the visual-span profile and its sub-profiles (inner, middle,and outer letter profiles)
Figure 4 shows examples of a visual-span profile andits three sub-profiles (the inner, middle, and outerprofiles). Since there is no outer letter presented atposition 0, the outer-letter profiles were plotted basedon the performance at letter positions�7 to�1 and 1 to7. The middle-letter profiles were plotted for letterpositions�6 to 6, and the inner-letter profiles coveronly the letter positions�5 to 5. As described in thedecomposition analysis above, performance for eachsub-profile can be parsed into effects of resolution,mislocations, and crowding.
Auxiliary experiment: Comparing crowding onthe horizontal and vertical midlines
As shown in the Results section, we found strongercrowding along the vertical midline than the horizontalmidline. However, it is unclear whether this asymmetryin crowding generalizes to stimuli other than letters.Two properties of our letter stimuli, not typical oftargets in other crowding studies, may have accountedfor the asymmetry—for vertical conditions, letters wereeither rotated 908 or separated by a letter spacing largerthan the horizontal standard. We conducted anauxiliary experiment to determine whether the crowd-ing asymmetry we observed generalizes to more typicalcrowding stimuli.
Six normally sighted young adults participated inthe two-session auxiliary experiment. In both sessions,the Landolt broken ring (Sloan C) stimulus was usedas the target. In each trial, subjects chose the facingdirection of the gap in the ring from among eightpossibilities (left, right, up, down, and the fourdiagonals). All the stimuli were black on a whitebackground with a Weber contrast of nearly �100%.The exposure duration was 105 ms. Identificationperformance was measured at eight retinal locations(2.58 and 58 left and right of the fixation point alongthe horizontal midline, and above and below thefixation point along the vertical midline). In Session 1,we measured target acuity defined as the target size
yielding 90% correct performance in recognition foreach of the eight target locations. The averaged targetacuities and standard errors obtained at 2.58 eccen-tricity were 0.298 6 0.028 (left field), 0.278 6 0.018
(right), 0.318 6 0.028 (upper), and 0.328 6 0.028
(lower). At 58 eccentricity, the average acuities andstandard errors were 0.398 6 0.038 (left), 0.408 6 0.068
(right), 0.548 6 0.108 (upper) and 0.478 6 0.028
(lower). These results reveal that the horizontalmidline has better acuity than the vertical midline at2.58 and 58, F(1, 5) ¼ 8.11, p ¼ 0.036. Neither a leftversus right nor upper versus lower field differencewas found. The target size of 0.558 was selected forSession 2 to match the print size used in the mainexperiment. The target size was larger than all thetarget acuities except the ones at 58 in the right andupper fields for subject S3 whose data were excludedfrom Session 2.
Session 2 was devoted to the crowding measure-ment. Two flankers, Sloan Os, were added to eachtarget in a radial direction. For the targets positionedalong the vertical midline, one flanker was placedabove the target and the other one below the target.For the horizontal conditions, the two flankers wereplaced to the left and right of the target. A viewingdistance of 40 cm was maintained. The target waspresented at one of the eight locations or at the fovea.At the fovea, the target was flanked either vertically orhorizontally. To measure the spatial extent of crowd-ing for each condition, we tested five target-flankercenter-to-center spacings. For comparison with theletter spacing in the visual-span measurements withletters, the smallest target-flanker spacing used wastarget size · 1.16. The largest spacing was infinity(isolated target). The other three spacings were targeteccentricity · 0.7, · 0.5, and · 0.3. For 2.58
eccentricity, the spacings were 0.6388, 0.758, 1.258,1.758, and infinity. For 58 eccentricity, the spacingswere 0.6388, 1.58, 2.58, 3.58, and infinity. For 08
eccentricity, only two spacings, 0.6388 (target size ·1.16) and infinity, were tested.
In the data analysis, we first normalized theperformance levels by the maximum proportioncorrect for each target location and subject. Twocrowding related measures were calculated based onthe normalized data. One measurement was thedifference in recognition accuracy between the isolatedtarget (no crowding) and the flanked target at thesmallest spacing (0.6388). The other was the spatialextent of crowding defined as the target-flankerspacing yielding 80% of the maximum performancelevel in target recognition.
For all experiments, repeated measures analyses ofvariance (ANOVAs) and t-tests were used to analyzethe data. Post-hoc tests were performed as needed.
Journal of Vision (2014) 14(6):3, 1–17 Yu, Legge, Wagoner, & Chung 6

Results
Measuring visual-span profiles and isolated-letter profiles
Group data for isolated letter, visual span, andmislocation-corrected visual span profiles are plottedfor both normal and reversed reporting directions andfor four text formats in Figure 5. The profiles consist ofplots of letter-recognition accuracy as a function ofletter position. Table 1 lists the group averages of thetotal amount of information transmitted by the central11 slots (�5 to þ5) in isolated-letter profiles, normal-reading visual-span profiles, and reversed-readingvisual-span profiles. Two repeated measures ANOVAswere used to analyze the data, one for the isolated-letter-span size (within-subject factor: text format) andthe other for the visual-span size (within-subjectfactors: reporting direction and text format).
The performance of isolated letter recognition wasnearly perfect for all text formats, but recognizinghorizontal isolated letters was still slightly better thanrecognizing isolated vertical letters in each of the otherthree formats (an average increase of 0.9 bits;
significant main effect of text format, F(3, 27)¼ 8.83, p, 0.0005; significant post-hoc pairwise comparisons, p� 0.01 for all the three horizontal-vertical pairs).
As expected, there was a significant effect of textformat on visual-span size, F(3, 27)¼ 249.20, p ,0.0005. Horizontal text format always led to the bestperformance (see Table 1). On average, the horizontalvisual-span size was 11.3 bits larger than the threevertical formats. There was a significant interactionbetween the text format and the reporting direction,F(3, 27) ¼ 7.78, p ¼ 0.001. The visual-span sizedecreased by 2.1 bits when reporting direction wasreversed for the rotated counterclockwise condition,F(1, 9)¼ 12.89, p¼ 0.006. No reduction was found forthe other three text formats.
The sub-profiles (inner, middle, and outer letterprofiles) and corresponding analyses are shown inAppendix A.
Decomposition analysis
Decomposition analyses were conducted for bothnormal and reversed reporting directions in the fourtext formats (Figure 6).
Figure 5. Isolated-letter profiles, mislocation-corrected visual-span profiles, and visual-span profiles (group average) are shown for
both normal and reversed reporting directions in the four text formats. The profiles consist of plots of letter-recognition accuracy as a
function of letter position (data are available at 13 positions for isolated-letter profiles and at 11 positions for visual-span profiles).
Data for each measurement and condition are fitted with split Gaussians. The error bars indicate standard errors.
Horizontal
Rotated 908
clockwise
Rotated 908
counterclockwise Marquee
Isolated letter 50.76 6 0.06 50.07 6 0.26 49.85 6 0.31 49.80 6 0.21
Visual span, normal direction 46.06 6 0.56 34.77 6 1.13 36.11 6 1.21 33.22 6 0.86
Visual span, reversed direction 45.41 6 0.88 34.63 6 1.06 33.99 6 1.01 34.09 6 1.02
Table 1. Summary of group performance (sum of information transmitted at 11 letter positions [�5 to 5]) for each task and textformat (mean 6 standard error).
Journal of Vision (2014) 14(6):3, 1–17 Yu, Legge, Wagoner, & Chung 7
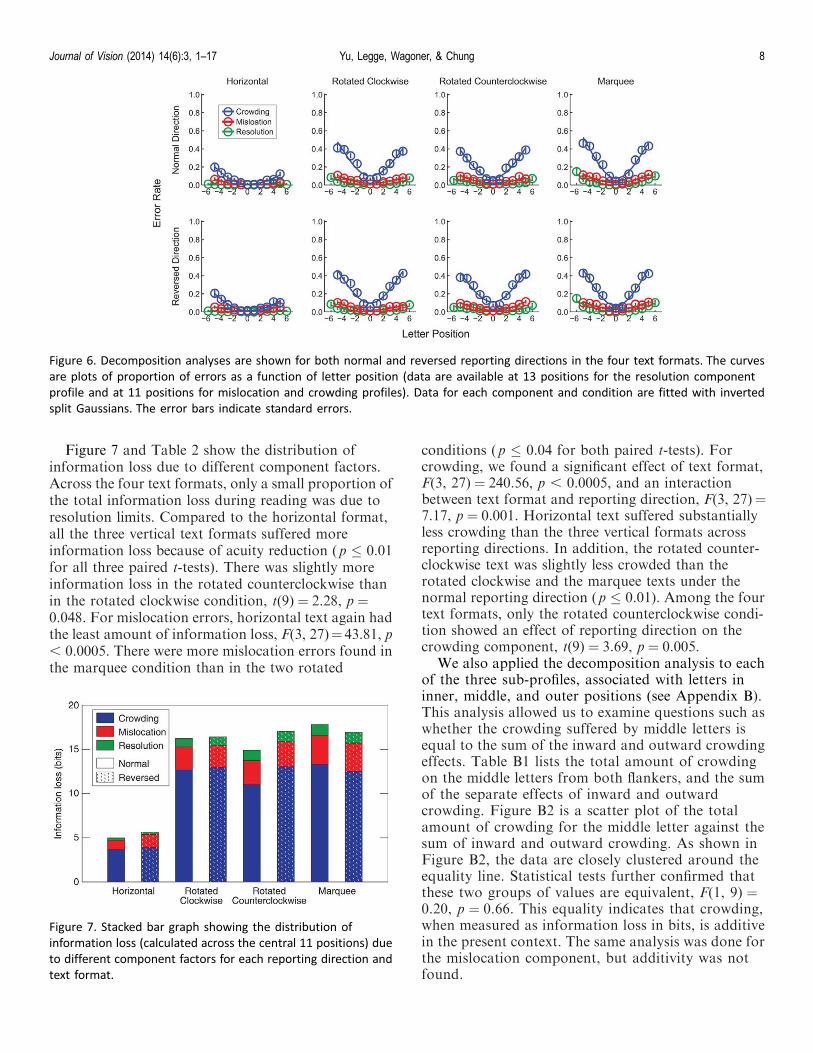
Figure 7 and Table 2 show the distribution ofinformation loss due to different component factors.Across the four text formats, only a small proportion ofthe total information loss during reading was due toresolution limits. Compared to the horizontal format,all the three vertical text formats suffered moreinformation loss because of acuity reduction (p � 0.01for all three paired t-tests). There was slightly moreinformation loss in the rotated counterclockwise thanin the rotated clockwise condition, t(9)¼ 2.28, p ¼0.048. For mislocation errors, horizontal text again hadthe least amount of information loss, F(3, 27)¼43.81, p, 0.0005. There were more mislocation errors found inthe marquee condition than in the two rotated
conditions (p � 0.04 for both paired t-tests). Forcrowding, we found a significant effect of text format,F(3, 27) ¼ 240.56, p , 0.0005, and an interactionbetween text format and reporting direction, F(3, 27)¼7.17, p ¼ 0.001. Horizontal text suffered substantiallyless crowding than the three vertical formats acrossreporting directions. In addition, the rotated counter-clockwise text was slightly less crowded than therotated clockwise and the marquee texts under thenormal reporting direction (p � 0.01). Among the fourtext formats, only the rotated counterclockwise condi-tion showed an effect of reporting direction on thecrowding component, t(9) ¼ 3.69, p ¼ 0.005.
We also applied the decomposition analysis to eachof the three sub-profiles, associated with letters ininner, middle, and outer positions (see Appendix B).This analysis allowed us to examine questions such aswhether the crowding suffered by middle letters isequal to the sum of the inward and outward crowdingeffects. Table B1 lists the total amount of crowdingon the middle letters from both flankers, and the sumof the separate effects of inward and outwardcrowding. Figure B2 is a scatter plot of the totalamount of crowding for the middle letter against thesum of inward and outward crowding. As shown inFigure B2, the data are closely clustered around theequality line. Statistical tests further confirmed thatthese two groups of values are equivalent, F(1, 9) ¼0.20, p ¼ 0.66. This equality indicates that crowding,when measured as information loss in bits, is additivein the present context. The same analysis was done forthe mislocation component, but additivity was notfound.
Figure 6. Decomposition analyses are shown for both normal and reversed reporting directions in the four text formats. The curves
are plots of proportion of errors as a function of letter position (data are available at 13 positions for the resolution component
profile and at 11 positions for mislocation and crowding profiles). Data for each component and condition are fitted with inverted
split Gaussians. The error bars indicate standard errors.
Figure 7. Stacked bar graph showing the distribution of
information loss (calculated across the central 11 positions) due
to different component factors for each reporting direction and
text format.
Journal of Vision (2014) 14(6):3, 1–17 Yu, Legge, Wagoner, & Chung 8

Auxiliary experiment: Comparing crowding onthe horizontal and vertical midlines
At the fovea, performance (proportion correct) wasnear ceiling for both the smallest target-flankerspacing (a mean accuracy of 0.99 6 0.01 for thehorizontal flanking and 0.98 6 0.01 for the verticalflanking condition) and the largest spacing (i.e.,unflanked condition; 0.98 6 0.00). Apparently,crowding was not present in the foveal conditionsmeasured in this study.
Table 3 lists the mean values of the crowdingmeasurements, the spatial extent of crowding and theamplitude of crowding for the smallest target-flankerspacing (0.6388), at eccentricities 2.58 and 58 for bothhorizontal and vertical midlines for radially arrangedflankers.
It has been found that the spatial extent ofcrowding is usually near 40%–50% of the targeteccentricity (Bouma, 1970; Chung et al., 2001;Whitney & Levi, 2011). The proportionality constantsobtained from our results were close to this range (onaverage, 0.36 at 2.58 eccentricity and 0.48 at 58eccentricity).
An ANOVA was conducted with the within-subjectfactors being eccentricity (2.58 and 58), crowdingorientation (horizontal and vertical), and visual field(right vs. left field, or lower vs. upper field). Consistentwith many previous findings, crowding increased witheccentricity in both spatial extent and amplitude (p �
0.01). Across eccentricities, the spatial extents ofcrowding along the vertical midline were larger than theones measured along the horizontal midline, F(1, 4)¼13.85, p¼ 0.02. We also found that the amplitude ofcrowding was larger along the vertical midline comparedto the horizontal midline, F(1, 4)¼ 9.97, p¼ 0.03.Therefore, both the spatial extent and the amplitude ofcrowding were greater along the vertical midline (spatialextent: 50% larger across testing conditions; amplitude:54% stronger) than along the horizontal midline. Ouranalysis also revealed some two-way interactions thatare not discussed here in the interest of brevity.
Discussion
The decomposition analysis allowed us to distinguishbetween three factors limiting the size of the visual spanfor reading—acuity, mislocations, and crowding—andto determine the origin of the horizontal/verticaldifference. Among the three factors studied, a differ-ence in crowding along the horizontal and verticalmidlines was the primary factor accounting for thesmaller size of the vertical visual span. Our finding isconsistent with the results of a recent study, in whichthe basis of the improvement in peripheral visual spanfollowing training is a large reduction in the adverseeffect of crowding and a small reduction in theproportion of mislocation errors (He et al., 2013).
Reporting
direction Horizontal
Rotated 908
clockwise
Rotated 908
counterclockwise Marquee
Resolution* Normal 0.27 6 0.06 0.96 6 0.26 1.18 6 0.31 1.23 6 0.21
Reversed
Mislocation Normal 1.08 6 0.16 2.61 6 0.16 2.70 6 0.33 3.30 6 0.31
Reversed 1.49 6 0.30 2.51 6 0.27 2.82 6 0.20 3.23 6 0.20
Crowding Normal 3.63 6 0.38 12.68 6 1.00 11.04 6 0.75 13.29 6 0.59
Reversed 3.87 6 0.56 12.94 6 0.72 13.04 6 0.75 12.49 6 0.81
Total Normal 4.97 6 0.56 16.26 6 1.13 14.92 6 1.21 17.81 6 0.86
Reversed 5.62 6 0.88 16.40 6 1.06 17.04 6 1.01 16.94 6 1.02
Table 2. Summary of decomposition analysis for each reporting direction and text format (mean 6 standard error). Component-spansize was assessed by summing the information loss due to each component at 11 letter positions (�5 to 5). Notes: * Reportingdirection is not applicable for the Resolution profile because it is based on the identification of single letters rather than trigrams.
2.58 eccentricity 58 eccentricity
Left Right Upper Lower Left Right Upper Lower
Spatial extent of crowding Mean 0.838 0.758 1.148 0.868 1.548 2.068 3.148 2.948
SE 0.138 0.088 0.138 0.058 0.268 0.378 0.278 0.168
Amplitude of crowding Mean 0.29 0.18 0.55 0.39 0.66 0.65 0.65 0.71
SE 0.05 0.06 0.05 0.05 0.08 0.07 0.05 0.09
Table 3. Summary of crowding measurements (spatial extent of crowding, and amplitude of crowding along the horizontal and verticalmidlines) for each eccentricity and visual field.
Journal of Vision (2014) 14(6):3, 1–17 Yu, Legge, Wagoner, & Chung 9
The three sensory components
As discussed in the Introduction, the three sensorycomponents may constrain three sequential stages ofinformation processing. Acuity, limiting recognitioneven for isolated targets, is at the lowest level.Crowding with an impact on positions of features canoccur for targets larger than the acuity limit. Lettermislocations likely follow crowding in the hierarchy. Inprevious studies, letter position uncertainty has beenanalyzed separately from letter identification error(crowding) (Chung & Legge, 2009; Strasburger &Malania, 2013; Zhang et al., 2012). Here, mislocationand crowding were also analyzed as two separatefactors.
Evidence obtained in the present study is alsoconsistent with distinct mechanisms underlying themislocation and crowding factors. We found additivityfor crowding and lack of additivity for mislocations(See Appendix B). To illustrate this difference, considerthe impact of crowding and mislocations on marqueetext for normal reporting direction (see Table B1).When we sum the information loss across the 11 letterpositions, the crowding-induced reduction is about 20bits for letters flanked on both sides (i.e., middle lettersof trigrams), 14 bits for letters flanked only on the outerside, and 6 bits for letters flanked only on the inner side.The amount of crowding upon the middle letters isequivalent to the sum of the inward and the outwardcrowding (20 bits). In other words, the crowdingsuffered by the middle letter can be predicted given anindependent measurement of inward and outwardcrowding. However, the information loss due tomislocation errors for the middle letters (3 bits) was notgreater than that for the inner letters (4 bits), let alonethe sum from the inner and outer letters (6 bits). Ourresults are consistent with the proposed hierarchy ofthe three sensory components.
Interestingly, crowding additivity does not appear tobe universal among various visual stimuli. In fact, fortarget stimuli that differ from the flankers in a singledistinct feature such as color, the crowding effect maydecrease with an increasing number of flankers (Levi &Carney, 2009; Poder, 2006). It is possible that flankersof this kind can be grouped together separately fromthe target while the flanker grouping for morecomplicated stimuli such as randomly selected Englishletters is much harder.
Chung and Legge (2009) proposed that mislocationerrors are due to reduced precision in the coding ofletter position in the periphery. The changes ofmislocation errors with text format in the present studysuggest that the coding of letter position is most precisefor the horizontal text and least accurate (mostuncertain) for the marquee text. Greater imprecision inposition coding for upright letters (marquee) compared
to rotated letters may mainly reflect the intrinsiccharacteristics of marquee text—disruption of thenormal orthogonal relationship between letter orienta-tion and word orientation. Another subtle issue may bethat for a corresponding number of letter positionsaway from the midline, the marquee letters are fartherfrom the midline in angular units because of the largerbetween-letter spacing required. Since proportion ofmislocation errors increase gradually with eccentricity(Figure 6), presenting letters further from the foveamay account partially for the poorer position coding.This speculation is also supported by reanalysis of datafrom Yu et al. (2007). In that study, visual spans weremeasured for different between-letter spacing condi-tions in horizontal trigrams, and more mislocationswere found for the larger spacing conditions.
Unlike mislocation errors, the amount of crowdingdid not always seem to be greater for marquee than forrotated texts. However, due to the confounding factorof letter spacing (44% larger for marquee text),crowding may be underestimated in the marqueeformat.
The effect of letter orientation
For rotated clockwise and counterclockwise verticalconditions, the reduced performance in isolated-letterrecognition and crowded letter recognition (shrinkageof the isolated letter span and visual span) could also bedue to the extra effort associated with recognizing anon-upright letter, an effect we refer to as ‘‘mentalrotation’’ (possibly a combined effect of sparse readingexperience with rotated letters and the cognitive processof mentally rotating an image).
The effect of mental rotation can be assessed bycomparing the letter recognition accuracy for rotatedformats to the accuracy for recognizing standardupright letters while matching the other parameterssuch as eccentricity along the vertical midline (seeAppendix C for detailed analysis). However, thisanalysis can be done only for the isolated letterrecognition but not for the crowded letter recognitionbecause larger letter-to-letter spacing was used toobtain the measurement of crowded marquee (upright)letter recognition.
In Appendix C, we further analyzed the resolutioncomponent into two subcomponents—resolution forupright letters (0.86 6 0.12 bits) and letter rotation(0.10 6 0.21 bits for rotated clockwise and 0.32 6 0.25bits for rotated counterclockwise). The minor amountof information loss due to letter rotation is consistentwith previous findings that accuracy and reaction timefor single letter recognition is largely independent ofletter orientation (Koriat & Norman, 1984, 1989).Nevertheless, word or connected text recognition can
Journal of Vision (2014) 14(6):3, 1–17 Yu, Legge, Wagoner, & Chung 10

be affected by letter orientation (Koriat & Norman,1984, 1985, 1989). It is possible that letter rotation hasa bigger effect on the other two sensory components(crowding and mislocation).
Our results also showed slightly poorer acuity (moreinformation loss due to resolution limits) along thevertical axis than the horizontal midline (0.86 vs. 0.27bits). This is consistent with previous findings thatvisual acuity at a given eccentricity is better along thehorizontal midline than the vertical midline (Wertheim,1980). However, in both cases, the contributions to thevisual span are minimal.
Crowding differs along the horizontal andvertical midlines
We found significantly stronger crowding along thevertical midline than the horizontal midline. Thisasymmetry of crowding has also been present,although not discussed, in the data reported by Toetand Levi (1992). Based on the crowding zonesmeasured by Toet and Levi, the vertical midline seemsto have larger spatial extent than the horizontalmidline at 2.58, 58, and 108 eccentricity. In our mainexperiment, the crowding measurement was theamplitude of crowding rather than its spatial extent.Therefore, in the auxiliary experiment, we measuredand compared amplitude and spatial extent ofcrowding along horizontal and vertical midlines usingnon-letter stimuli. The findings from the auxiliarystudy verified that crowding is stronger along thevertical midline than the horizontal midline in terms ofboth spatial extent and amplitude, and confirmed thatthe vertical-horizontal crowding asymmetry alongmidlines generalizes beyond the letter.
Conclusions
This study clarifies the sensory factors underlying thehorizontal and vertical differences in the visual span forreading. Based on results from our decompositionanalysis, we conclude that crowding and mislocationsplay important roles in determining the size of visualspans when letter size is larger than the critical printsize for reading and in accounting for the horizontal/vertical difference. Among the three components,crowding is the major factor limiting the size of thevisual spans for letter recognition, likely playing a keyrole in limiting reading speed.
Keywords: visual span, crowding, reading, verticaltext, acuity, mislocation
Acknowledgments
NIH grant EY002934 (GEL) and EY012810 (STLC)supported this research.
Commercial relationships: none.Corresponding author: Deyue Yu.Author: [email protected]: College of Optometry, The Ohio StateUniversity, Columbus, Ohio, USA.
Footnote
1To assess mislocation errors, the letters thatappeared more than once within the trigram (7.5% ofthe letters in total) were excluded from the decompo-sition analysis. The change in visual-span profilefollowing this process is negligible (on average 0.3%difference across letter positions).
References
Anstis, S. M. (1974). Letter: A chart demonstratingvariations in acuity with retinal position. VisionResearch, 14(7), 589–592.
Beckmann, P. J., & Legge, G. E. (2002). Preneurallimitations on letter identification in central andperipheral vision. Journal of the Optical Society ofAmerica A: Optics, Image Science, and Vision,19(12), 2349–2362.
Bouma, H. (1970). Interaction effects in parafovealletter recognition. Nature, 226, 177–178.
Bouma, H. (1973). Visual interference in the parafovealrecognition of initial and final letters of words.Vision Research, 13(4), 767–782.
Brainard, D. H. (1997). The psychophysics toolbox.Spatial Vision, 10, 433–436.
Chung, S. T. L., & Legge, G. E. (2009). Precision ofposition signals for letters. Vision Research, 49(15),1948–1960. doi:10.1016/j.visres. 2009.05.004.
Chung, S. T. L., Levi, D. M., & Legge, G. E. (2001).Spatial-frequency and contrast properties ofcrowding. Vision Research, 41(14), 1833–1850.
Coates, D. R., Chin, J. M., & Chung, S. T. L. (2013).Factors affecting crowded acuity: Eccentricity andcontrast. Optometry and Vision Science, 90, 628–638.
Flom, M. C., Weymouth, F. W., & Kahneman, D.(1963). Visual resolution and contour interaction.
Journal of Vision (2014) 14(6):3, 1–17 Yu, Legge, Wagoner, & Chung 11

Journal of the Optical Society of America, 53(9),1026–1032.
He, S., Cavanagh, P., & Intriligator, J. (1996).Attentional resolution and the locus of visualawareness. Nature, 383(6598), 334–337. doi:10.1038/383334a0.
He, Y., Legge, G. E., & Yu, D. (2013). Sensory andcognitive influences on the training-related im-provement of reading speed in peripheral vision.Journal of Vision, 13(7):14, 1–14, http://www.journalofvision.org/content/13/7/14, doi:10.1167/13.7.14. [PubMed] [Article]
Herse, P. R., & Bedell, H. E. (1989). Contrastsensitivity for letter and grating targets undervarious stimulus conditions. Optometry and VisionScience, 66(11), 774–781.
Koriat, A., & Norman, J. (1984). What is rotated inmental rotation? Journal of Experimental Psychology.Learning, Memory, and Cognition, 10(3), 421–434.
Koriat, A., & Norman, J. (1985). Reading rotatedwords. Journal of Experimental Psychology: HumanPerception and Performance, 11(4), 490.
Koriat, A., & Norman, J. (1989). Why is wordrecognition impaired by disorientation while theidentification of single letters is not? Journal ofExperimental Psychology: Human Perception andPerformance, 15(1), 153–163.
Latham, K., & Whitaker, D. (1996). Relative roles ofresolution and spatial interference in foveal andperipheral vision. Ophthalmic and PhysiologicalOptics, 16, 49–57.
Legge, G. E. (2007). Psychophysics of reading in normaland low vision. Mahweh, NJ: Erlbaum.
Legge, G. E., Cheung, S. H., Yu, D., Chung, S. T. L.,Lee, H. W., & Owens, D. P. (2007). The case for thevisual span as a sensory bottleneck in reading.Journal of Vision, 7(2):9, 1–15, http://www.journalofvision.org/content/7/2/9, doi:10.1167/7.2.9. [PubMed] [Article]
Legge, G. E., Hooven, T. A., Klitz, T. S., Mansfield, J.S., & Tjan, B. S. (2002). Mr. Chips 2002: Newinsights from an ideal-observer model of reading.Vision Research, 42, 2219–2234.
Legge, G. E., Klitz, T. S., & Tjan, B. S. (1997). Mr.Chips: An ideal-observer model of reading. Psy-chological Review, 104, 524–553.
Legge, G. E., Mansfield, J. S., & Chung, S. T. L.(2001). Psychophysics of reading. XX. Linkingletter recognition to reading speed in central andperipheral vision. Vision Research, 41(6), 725–743.
Levi, D. M. (2008). Crowding—An essential bottleneckfor object recognition: A mini-review. Vision
Research, 48(5), 635–654. doi:10.1016/j.visres.2007.12.009.
Levi, D. M., & Carney, T. (2009). Crowding inperipheral vision: Why bigger is better. CurrentBiology, 19(23), 1988–1993.
Levi, D. M., Hariharan, S., & Klein, S. A. (2002).Suppressive and facilitatory spatial interactions inperipheral vision: Peripheral crowding is neithersize invariant nor simple contrast masking. Journalof Vision, 2(2):3, 167–177, http://www.journalofvision.org/content/2/2/3, doi:10.1167/2.2.3. [PubMed] [Article]
Pelli, D. G. (1997). The VideoToolbox software forvisual psychophysics: Transforming numbers intomovies. Spatial Vision, 10, 437–442.
Pelli, D. G., Palomares, M., & Majaj, N. J. (2004).Crowding is unlike ordinary masking: Distin-guishing feature integration from detection. Journalof Vision, 4(12):12, 1136–1169, http://www.journalofvision.org/content/4/12/12, doi:10.1167/4.12.12. [PubMed] [Article]
Pelli, D. G., Tillman, K. A., Freeman, J., Su, M.,Berger, T. D., & Majaj, N. J. (2007). Crowding andeccentricity determine reading rate. Journal ofVision, 7(2):20, 1–36, http://www.journalofvision.org/content/7/2/20, doi:10.1167/7.2.20. [PubMed][Article]
Poder, E. (2006). Crowding, feature integration, andtwo kinds of ‘‘attention.’’ Journal of Vision, 6(2):7,163–169, http://www.journalofvision.org/content/6/2/7, doi:10.1167/6.2.7. [PubMed] [Article]
Strasburger, H., & Malania, M. (2013). Sourceconfusion is a major cause of crowding. Journal ofVision, 13(1):24, 1–20, http://www.journalofvision.org/content/13/1/24, doi:10.1167/13.1.24.[PubMed] [Article]
Strasburger, H., Rentschler, I., & Juttner, M. (2011).Peripheral vision and pattern recognition: A review.Journal of Vision, 11(5):13, 1–82, http://www.journalofvision.org/content/11/5/13, doi:10.1167/11.5.13. [PubMed] [Article]
Toet, A., & Levi, D. M. (1992). The two-dimensionalshape of spatial interaction zones in the parafovea.Vision Research, 32(7), 1349–1357.
Wertheim, T. (1980). Peripheral visual acuity: Th.Wertheim. American Journal of Optometry andPhysiological Optics, 57(12), 915–924.
Whitney, D., & Levi, D. M. (2011). Visual crowding: Afundamental limit on conscious perception andobject recognition. Trends in Cognitive Sciences,15(4), 160–168. doi:10.1016/j.tics.2011.02.005.
Yu, D., Cheung, S. H., Legge, G. E., & Chung, S. T. L.
Journal of Vision (2014) 14(6):3, 1–17 Yu, Legge, Wagoner, & Chung 12

(2007). Effect of letter spacing on visual span andreading speed. Journal of Vision, 7(2):2, 1–10,http://www.journalofvision.org/content/7/2/2 , doi:10.1167/7.2.2. [PubMed] [Article]
Yu, D., Park, H., Gerold, D., & Legge, G. E. (2010).Comparing reading speed for horizontal andvertical English text. Journal of Vision, 10(2):21, 1–17, http://www.journalofvision.org/content/10/2/21, doi:10.1167/10.2.21. [PubMed] [Article]
Zhang, J.-Y., Zhang, G.-L., Liu, L., & Yu, C. (2012).Whole report uncovers correctly identified butincorrectly placed target information under visualcrowding. Journal of Vision, 12(7):5, 1–11, http://www.journalofvision.org/content/12/7/5, doi:10.1167/12.7.5. [PubMed] [Article]
Appendix A. Visual-span’s sub-profiles
Visual span’s sub-profiles (inner, middle, and outerletter profiles) are plotted in Figure A1 (red symbols
and curves). Table A1 lists the size of each letter spanfor different reporting directions and text formats.Each letter span size was calculated as the informationtransmitted through the sub-profile at 11 letterpositions (�5 to 5). Since outer letters cannot bephysically presented at letter position 0, estimation ofthe central point based on curve fitting was made tocomplete the calculation. Consistent with previousfindings (Legge et al., 2001), the outer letters have thebroadest profiles and highest recognition accuracy(largest letter span). The middle letters have thenarrowest profiles and the lowest accuracy (smallestletter span). The inner letters have similar but slightlybetter recognition accuracy than the middle letters.This is true for all the four text formats.
Data were analyzed with a repeated measuresANOVAs (three within-subject factors: letter positionin trigram, text format, and reporting direction). Wefound an effect of letter position, F(2, 18)¼ 4.95, p ¼0.019, an effect of reporting direction, F(1, 9)¼ 14.04, p¼ 0.005, an interaction between position and reportingdirection, F(2, 18)¼ 39.66, p , 0.0005, and a three-wayinteraction between position, text format, and report-ing direction, F(6, 54)¼ 36.96, p , 0.0005.
Letter
position
Reporting
direction Horizontal
Rotated 908
clockwise
Rotated 908
counterclockwise Marquee
Inner Normal 44.63 6 0.79 33.48 6 1.20 35.60 6 1.32 32.02 6 0.92
Reversed 44.14 6 1.14 33.06 6 1.13 33.76 6 1.32 32.63 6 1.27
Middle Normal 43.82 6 0.87 28.68 6 1.27 30.12 6 1.41 26.82 6 1.00
Reversed 42.72 6 1.29 28.33 6 1.46 27.04 6 0.96 27.46 6 1.42
Outer Normal 49.68 6 0.23 42.35 6 1.26 42.55 6 1.06 40.86 6 1.02
Reversed 49.42 6 0.44 42.52 6 0.86 41.25 6 0.99 42.25 6 0.80
Table A1. Summary of group sub-profile size for each reporting direction and text format (mean 6 standard error). Letter-span size isassessed by summing the information transmitted (bits) through each sub-profile at 11 letter positions (�5 to 5).
Journal of Vision (2014) 14(6):3, 1–17 Yu, Legge, Wagoner, & Chung 13

Figure A1. Isolated-letter profiles, and sub-profiles (inner, middle, and outer profiles), and mislocation-corrected sub-profiles (group
average) are shown for both normal and reversed reporting directions in the four text formats. The profiles consist of plots of letter-
recognition accuracy as a function of letter position. Data for each measurement and condition are fitted with split Gaussians. The
error bars indicate standard errors.
Journal of Vision (2014) 14(6):3, 1–17 Yu, Legge, Wagoner, & Chung 14
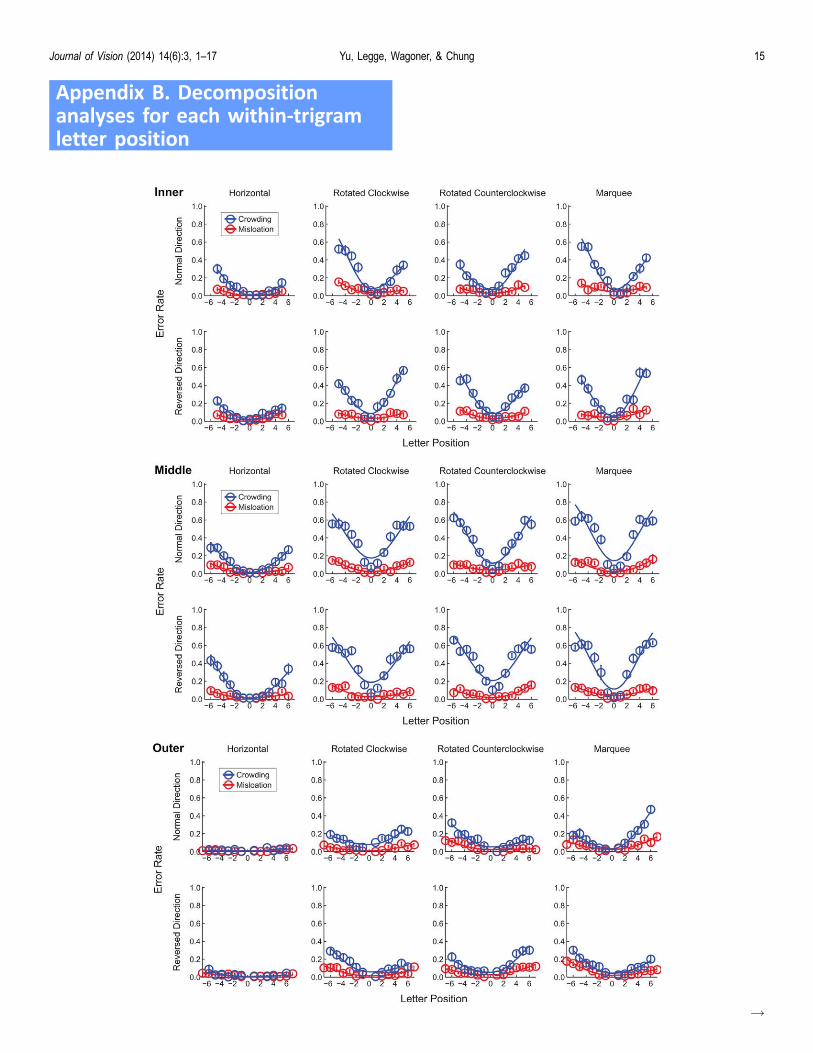
Appendix B. Decompositionanalyses for each within-trigramletter position
�
Journal of Vision (2014) 14(6):3, 1–17 Yu, Legge, Wagoner, & Chung 15

Letter position
Reporting
direction Horizontal
Rotated 908
clockwise
Rotated 908
counterclockwise Marquee
Mislocation Inner Normal 1.36 6 0.27 3.33 6 0.27 2.92 6 0.36 3.92 6 0.53
Reversed 2.05 6 0.36 2.90 6 0.38 3.30 6 0.28 3.49 6 0.29
Middle Normal 1.53 6 0.26 3.13 6 0.25 3.23 6 0.49 3.36 6 0.24
Reversed 1.73 6 0.39 2.87 6 0.34 2.79 6 0.27 3.68 6 0.33
Outer Normal 0.32 6 0.09 1.33 6 0.23 1.96 6 0.38 2.55 6 0.50
Reversed 0.67 6 0.22 1.72 6 0.33 2.40 6 0.35 2.45 6 0.31
Inner þ Outer Normal 1.68 6 0.24 4.67 6 0.35 4.88 6 0.61 6.47 6 0.90
Reversed 2.72 6 0.54 4.63 6 0.57 5.70 6 0.46 5.94 6 0.32
Crowding Inner Normal 4.77 6 0.60 13.26 6 1.08 11.33 6 1.11 13.86 6 0.74
Reversed 4.57 6 0.78 14.10 6 0.86 12.79 6 1.15 13.69 6 1.20
Middle Normal 5.40 6 0.63 18.27 6 1.14 16.50 6 0.88 19.63 6 0.84
Reversed 6.31 6 0.93 18.87 6 1.11 20.02 6 0.73 18.66 6 1.20
Outer Normal 0.76 6 0.23 6.38 6 1.13 5.34 6 0.62 6.39 6 0.64
Reversed 0.68 6 0.21 5.83 6 0.58 6.19 6 0.83 5.10 6 0.59
Inner þ Outer Normal 5.53 6 0.71 19.64 6 2.09 16.67 6 1.51 20.25 6 1.14
Reversed 5.25 6 0.88 19.94 6 1.11 18.98 6 1.71 18.79 6 1.35
Table B1. Summary of decomposition analysis for each sub-letter profile, reporting direction, and text format (mean 6 standarderror). Component-span size was assessed by summing the information loss due to each component at 11 letter positions (�5 to 5).
Figure B2. A scatter plot of crowding on the middle letters of trigrams plotted against the sum of inward crowding (crowding on the
inner letters) and outward crowding (crowding on the outer letters) for individual subjects. Data are plotted as open squares for the
normal reporting direction and filled circles for the reversed reporting direction. Data obtained in the four text formats are
represented by black (horizontal), red (rotated clockwise), blue (rotated counterclockwise), and green (marquee) symbols. The gray
dashed line is the equality line. Each data point represents the middle-letter crowding and the corresponding total of inward and
outward crowding for an individual subject tested for one text format and one reporting direction. Points resting on the gray equality
line indicate that inner plus outer crowding is equal to the crowding applied on the middle letters.
Figure B1. Decomposition analyses for each within-trigram letter position are shown for both normal and reversed reporting
directions in the four text formats. The curves consist of plots of error rates as a function of letter position. Data for each component
and condition are fitted with inverted split Gaussians. The error bars indicate standard errors.
Journal of Vision (2014) 14(6):3, 1–17 Yu, Legge, Wagoner, & Chung 16

Appendix C. Assessing the effect ofmental rotation
We assessed the effect of mental rotation bycomparing the letter recognition accuracy for rotatedformats to the accuracy for recognizing standardupright letters while matching the other parameters.Along the vertical midline, the nonzero letter positions(i.e., �6 to �1 and 1 to 6) for marquee format arefurther away from the fixation point than for rotatedformats because larger letter spacings (1.67 · instead of1.16 · x width) were used in marquee text. To generatea profile for upright letters (a plot of letter recognitionaccuracy as a function of ‘‘standard’’ letter position,i.e., separation of adjacent letter positions by 1.16 · x
width), we fit the marquee data with split Gaussians,retrieved the fitted values for each ‘‘standard’’ letterposition, and plotted the fitted values as a function of‘‘standard’’ letter position. As shown in Figure C1, theeffect of mental rotation was assessed by subtractingthe rotated-letter profile from the upright-letter profile.
As shown in Table 2, the amount of information lossdue to resolution limits was 0.96 bits for rotatedclockwise text and 1.18 for rotated counterclockwisetext. As we discussed, part of the information loss wasinduced by mental rotation. Therefore, we furtheranalyzed the component into two subcomponents—resolution for upright letters (0.86 6 0.12 bits) andletter rotation (0.10 6 0.21 bits for rotated clockwiseand 0.32 6 0.25 bits for rotated counterclockwise).
Figure C1. (A) Comparing the isolated-letter profiles for rotated formats (orange circles and curves) to the isolated-letter profile for
upright letters (black curves). (B) Effect of mental rotation, as assessed by subtracting the isolated-rotated-letter profile from the
isolated-upright-letter profile. Data for each condition are fitted with inverted split Gaussians. The error bars indicate standard errors.
Journal of Vision (2014) 14(6):3, 1–17 Yu, Legge, Wagoner, & Chung 17