![Sensors OPEN ACCESS sensors - unipi.it...Sensors 2013 ,13 12220 idealized description that is dependent on the cognitive requirements of the designer [16]. Typically, this approach](https://static.fdocuments.in/doc/165x107/60841fef82af7a7ca84bc126/sensors-open-access-sensors-unipiit-sensors-2013-13-12220-idealized-description.jpg)
Sensors OPEN ACCESS sensors - unipi.it of the most important lessons learned from these ......
26
, 12218-12243; doi:10.3390/s130912218 OPEN ACCESS sensors ISSN 1424-8220 www.mdpi.com/journal/sensors MARS, a Multi-Agent System for Assessing Rowers’ Coordination via Motion-Based Stigmergy Marco Avvenuti, Daniel Cesarini and Mario G. C. A. Cimino * Department of Information Engineering, University of Pisa, Largo Lucio Lazzarino 1, Pisa 56122, Italy; E-Mails: [email protected] (M.A.); [email protected] (D.C.) * Author to whom correspondence should be addressed; E-Mail: [email protected]; Tel.: +39-050-2217-455; Fax: +39-050-2217-600. Received: 10 July 2013; in revised form: 3 September 2013 / Accepted: 5 September 2013 / Published: 12 September 2013 Abstract: A crucial aspect in rowing is having a synchronized, highly-efficient stroke. This is very difficult to obtain, due to the many interacting factors that each rower of the crew must perceive. Having a system that monitors and represents the crew coordination would be of great help to the coach during training sessions. In the literature, some methods already employ wireless sensors for capturing motion patterns that affect rowing performance. A challenging problem is to support the coach’s decisions at his same level of knowledge, using a limited number of sensors and avoiding the complexity of the biomechanical analysis of human movements. In this paper, we present a multi-agent information-processing system for on-water measuring of both the overall crew asynchrony and the individual rower asynchrony towards the crew. More specifically, in the system, the first level of processing is managed by marking agents, which release marks in a sensing space, according to the rowers’ motion. The accumulation of marks enables a stigmergic cooperation mechanism, generating collective marks, i.e., short-term memory structures in the sensing space. At the second level of processing, information provided by marks is observed by similarity agents, which associate a similarity degree with respect to optimal marks. Finally, the third level is managed by granulation agents, which extract asynchrony indicators for different purposes. The effectiveness of the system has been experimented on real-world scenarios. The study includes the problem statement and its characterization in the literature, as well as the proposed solving approach and initial experimental setting.
-
Upload
truongkhuong -
Category
Documents
-
view
219 -
download
1
Transcript of Sensors OPEN ACCESS sensors - unipi.it of the most important lessons learned from these ......
Sensors 2013, 13, 12218-12243; doi:10.3390/s130912218OPEN ACCESS
sensorsISSN 1424-8220
www.mdpi.com/journal/sensors
Article
MARS, a Multi-Agent System for Assessing Rowers’Coordination via Motion-Based StigmergyMarco Avvenuti, Daniel Cesarini and Mario G. C. A. Cimino *
Department of Information Engineering, University of Pisa, Largo Lucio Lazzarino 1, Pisa 56122,Italy; E-Mails: [email protected] (M.A.); [email protected] (D.C.)
* Author to whom correspondence should be addressed; E-Mail: [email protected];Tel.: +39-050-2217-455; Fax: +39-050-2217-600.
Received: 10 July 2013; in revised form: 3 September 2013 / Accepted: 5 September 2013 /Published: 12 September 2013
Abstract: A crucial aspect in rowing is having a synchronized, highly-efficient stroke. Thisis very difficult to obtain, due to the many interacting factors that each rower of the crew mustperceive. Having a system that monitors and represents the crew coordination would be ofgreat help to the coach during training sessions. In the literature, some methods alreadyemploy wireless sensors for capturing motion patterns that affect rowing performance. Achallenging problem is to support the coach’s decisions at his same level of knowledge,using a limited number of sensors and avoiding the complexity of the biomechanical analysisof human movements. In this paper, we present a multi-agent information-processingsystem for on-water measuring of both the overall crew asynchrony and the individual rowerasynchrony towards the crew. More specifically, in the system, the first level of processingis managed by marking agents, which release marks in a sensing space, according to therowers’ motion. The accumulation of marks enables a stigmergic cooperation mechanism,generating collective marks, i.e., short-term memory structures in the sensing space. Atthe second level of processing, information provided by marks is observed by similarityagents, which associate a similarity degree with respect to optimal marks. Finally, the thirdlevel is managed by granulation agents, which extract asynchrony indicators for differentpurposes. The effectiveness of the system has been experimented on real-world scenarios.The study includes the problem statement and its characterization in the literature, as well asthe proposed solving approach and initial experimental setting.
Sensors 2013, 13 12219
Keywords: accelerometer; emergent approach; multi-agent systems; sports performanceanalysis; stigmergy; wireless motion sensing
1. Background and Motivations
The primary goal in competitive rowing is to achieve better control of velocity during the whole race.Such a goal requires highly-efficient rowing, which depends on many dynamically interacting factors.Variables, such as interpersonal coordination, seat acceleration, boat balancing and feathering shouldbe perceived by the rower to avoid checking of the boat and wasting energy. In practice, this task isextremely difficult to perform, as it requires continuous coordination between two to eight rowers and acoxswain [1].
Conventional coaching layout in rowing consists of a coxswain in the stern and a coach in a motorboat,offering advice based on what they see and feel, based on few empirical data. With the naked eye, theycan only acquire aggregate data, such as the speed of the boat, or individual data, such as the stroke rateof each rower. Suggestions are seldom precise enough to correct flaws in individual performance. Forthis reason, novice rowers are often taught the basics of rowing through endless hours of practice aimedat coalescing them into a team. On the other hand, professional rowing races are typically decided by theorder of tenths of seconds. Hence, a computer-aided approach to improve the training process in rowingis highly desirable [2].
The classical way a rower can evaluate his individual performance is by indoor rowing machinesequipped with a software system [3]. Several studies on the monitoring of rowing have reported on thefactors influencing performance. As a general remark, most studies and systems concerned with therecording of rowing biomechanics provide only some basic measurement and simple statistical analysistools to assist the coach and the athletes on the training phase [4–6].
In the last decade, wearable sensors and wireless sensor networks (WSNs) have been applied tomonitor human movements [7–11] and, more specifically, to obtain high-resolution real-time parameterson rowing performance [12]. Most of the initial efforts have been concentrated on data acquisition andintegration [13,14]. Recently, some experimental studies have started to address the problem of providingreal-time feedback and on-water analysis of the biomechanics indexes of the athletes during training. Inpractice, monitoring the crew performance in real-time requires choosing a trade-off between what tomonitor and how to present it [15]. Indeed, there are many possible parameters, and their trackingshould be related to the specific training practice, according to a process-oriented approach. Actually,many efforts in the field have been aimed at supporting system-oriented analyses based on complexmathematical models of the rowing performance. One of the most important lessons learned from theseefforts is that the algorithms used to perform the parametric aggregation must use a limited amount ofstates, be highly flexible and be able to handle noise. Indeed, much work still has to be done before suchsystems can be used on a regular basis for monitoring crew team performance [4].
A novel perspective can be gained by considering a different design paradigm. It has been argued thatany explicit modeling of a collective behavior effectively biases the system and constrains it within an
Sensors 2013, 13 12220
idealized description that is dependent on the cognitive requirements of the designer [16]. Typically, thisapproach deploys an arsenal of techniques, including machine learning and probabilistic modeling, inthe attempt to deal with the inherent uncertainness, time-varying and incomplete nature of sensory data.However, this does not alter the fact that the representation of a functional structure is still predicatedon the descriptions of the designers. In contrast, with an emergent approach, collective perception isconcerned with the augmentation of sensory data in order to enable local action. It is not a processwhereby the observation of an external observer is abstracted and represented in a more or less symbolicmanner, i.e., the so-called cognitivist approach [16]. Emergent paradigms are based on the principle ofself-organization [17], which means that a functional structure appears and stays spontaneous at runtime.The control needed to achieve results is distributed over all participating entities. In the literature, themechanisms used to organize these types of systems and the collective behavior that emerges from themare known as swarm intelligence, i.e., a loosely structured collection of interacting entities [18].
An emergent system is intrinsically embodied, and its physical instantiation plays a direct constitutiverole in its lifecycle [16]. There are two complementary aspects in the embodiment: the self-organizationof the system and the coupling of the system itself with its environment. Emergent behavior is theninherently specific to the embodiment of the system and dependent on the systems history of interactions,i.e., its experiences. Hence, an emergent system cannot be specified and designed as a separate part withrespect to its application domain. In contrast, with cognitivist systems, there is a dualist distinctionbetween the computational processes and the computational infrastructure and devices that effect anyphysical interaction. Indeed, cognitivism asserts that external reality can be modeled and embedded inthe system by a human designer.
Emergent approaches represent the application of biologically-inspired patterns to software design.The purpose is to overcome designer-dependent representations of a system, which are more efficient,but work, as long as the system does not have to stray too far from the conditions under which theseexplicit representations were formulated. By using emergent paradigms, the collective properties orinteractions between the parts of a complex system can be described in terms of the properties ofindividual agents that interact with the environment and whose behavior is specified by it. In contrast,cognitivism involves a view of cognition that requires the representation of a given pre-determinedobjective established on the basis of domain knowledge acquisition in the design process. Hence,a cognitivist system can be characterized for its efficiency in solving a specific application problemwith more or less adaptability, in contradistinction with an emergent system, which is characterized byadaptation, autonomy and self-organization.
The fact that simple individual behaviors can lead to a complex emergent behavior has been knownfor decades. More recently, it has been noted that this type of emergent collective behavior is adesirable property in pervasive computing [18,19]. In [18], a number of application scenarios froma range of different domains have been reported. Such scenarios are supported by the stigmergicparadigm in order to build self-coordinating environments that promote the autonomy of entities andprovide robust behavior. The evaluation is used to demonstrate how a model based on stigmergycan be used to provide a highly-decentralized method of organizing the components of a pervasivecomputing environment. In [19], the authors present an agent-based framework, in which cooperativesoftware agents find solutions to back-end tracing problems by self-organization. Such cooperative
Sensors 2013, 13 12221
agents are based on a business process-aware traceability model and on a service-oriented compositionparadigm. Furthermore, an interface agent assists each user to carry out the front-end tracking activities.Interface agents rely on the context-awareness paradigm to gain self-configurability and self-adaptationof the user interface and, on ubiquitous computing technology, i.e., mobile devices and radio-frequencyidentification, to perform agile and automatic lot identification. Biological paradigms have inspiredsignificant research, not only in robotics and communication networks, but also in pattern detectionand classification. For example, in [20], a number of agent-based architectures for distributed patterndetection and classification are presented. More specifically, basic components of such systems, theirdifferent strategies and the different types of agents are studied. The study demonstrates importantproperties, such as robustness, scalability and fast convergence.
According to the stigmergy paradigm [21,22], agents do not communicate with each other, butindirectly interact by changing their environment. In biology, stigmergy is a class of mechanisms thatmediate animal-animal interactions. It consists of indirect communication that is taking place betweenindividuals of an insect society by local modifications induced by these insects on their environment [23].The term is formed from the Greek words stigma and ergon, which mean sign and action, respectively,and captures in the information processing field the notion that an agents actions leave signs in theenvironment, signs that it and other agents sense and that determine their subsequent actions. In theliterature, various types of stigmergy have been distinguished. Sign-based stigmergy occurs whenmarkers are left in the environment to influence the subsequent behavior (choice and parameters) ofentities. In quantitative stigmergy, the mark varies in a quantitative manner. In a stigmergic computingscheme, the environment acts as a shared medium through which agents communicate. Each agent isable to sense and change the state of a part of the environment. These changes need to persist longenough to affect the subsequent behavior of other agents. Hence, the environment acts as a commonshared service for all entities, enabling a robust and self-coordinating mechanism [23,24].
This paper describes and discusses how an emergent approach can be used for measuring both theoverall crew asynchrony and the individual rower asynchrony towards the crew. Based on this approach,a prototype of a tool for assisting the coach in perceiving the crew’s coordination on water has beenimplemented and demonstrated experimentally. The results of this in situ experiment are presentedand discussed. The approach and the prototype are referred to as MARS (multi-agent system forassessing rowers’ coordination via motion-based stigmergy). Agents of the system use stigmergy asthe coordination mechanism.
In [24], we presented a multi-agent system for the detection of situations related to social eventsvia position-based stigmergy and fuzzy rules. The proposed system is managed by different agents inorder to recognize situations through inference of fuzzy rules. Antecedent and consequent parametersof fuzzy rules are defined by means of an adaptation procedure. The system was tested on real-worldmeeting scenarios involving a different number of participants. The obtained results in terms of situationdetection and responsiveness show that the proposed scheme can be successfully applied to recognizesituations in any scenario regardless of the number of participants.
The paper is organized as follows. Section 2 covers the related work on performance analysis inrowing. In Section 3, we introduce the architecture of the MARS system. Section 4 is devoted tothe multi-agent model of processing with its related stigmergic paradigm. Section 5 describes the
Sensors 2013, 13 12222
deployment of the MARS system architecture. In Section 6, we discuss experimental results. Section 7draws some conclusion and suggests future work to be undertaken.
2. On-Water Rowing Monitoring: Related Work
To the best of our knowledge, no work has been done in the field of rowers asynchrony processingusing an emergent approach and wireless sensors. However, there are a number of projects thatmeasure raw biomechanical parameters of rowing and perform analysis using a cognitivist approach.In this section, we intend to present such projects with the aim of providing a landscape of the currentmethodologies. Moreover, the comparison presented in this section does not take into account hardwaresettings (e.g., number and types of sensors) and performance indicators.
In [2], the experience of the application of WSN for rowing performance was presented. The systemwas able to monitor boat speed and set and the synchrony of the rowers based on their seat acceleration.Since acceleration data contains a high noise ratio, with a cognitivist approach, only a few data pointsare of practical interest, namely, maximum acceleration during stroke and maximum deceleration duringfinish. The local computation is then mainly devoted to extract and report critical points and to calculatesome aggregation, e.g., frequency of oscillation. Such extracted data are then sent to a display. To copewith the highly variable and noisy character of such data, the authors employ a dynamic calibrationalgorithm in the parameters’ setting. However, the authors claim that such an algorithm is not sensitiveenough and might be fine-tuned for use on a regular basis.
In [13], the authors have applied WSN to the oars and boat for monitoring boat movement, boatbalancing and the trajectory of the stroke. The novelty of the approach consists in the usage of a coupleof accelerometers placed on each oar in order to calculate its angular velocity. Three different tests areperformed: an early calibration in the laboratory, an indoor experiment with an ergo-meter and on-boattrials. The resulting data is stored in a file. Subsequent analysis of such data is not performed, as theauthors have performed this test and data collection only as a proof-of-concept of their technology.
In [25], the authors presented a coaching device for rowing and an analysis software, called Accrowand Regatta, respectively. Accrow employs an accelerometer and a GPS receiver to measure the boatacceleration and velocity, respectively. Regatta analysis provides boat velocity, stroke rate, propulsionper stroke, distance traveled by the boat and the required running times. The coach receives suchperformance data at the end of the on-water training unit. The system made of Accrow and Regatta canbe used to analyze the effects of different rowing techniques or different stroke rates on the boat velocity.
Geospatial data has been used by [4] for measuring rowing performance in terms of boat velocity andacceleration variation of a single stroke cycle. In particular, the study provides a classification of physicalparameters in four categories, depending on their source, and a conceptual approach for monitoring andevaluating rowing. Some preliminary tests are discussed, focusing on the potential of mobile mappingtechnology, on the various data types, the sensors, their level of integration and limitations. The testing iscarried out with a data acquisition system made of an acceleration sensor and a GPS receiver. However,the system is focused on stroke cycle characterization in terms of acceleration and speed.
In [14], an integrated data acquisition system for rowing performance analysis was presented. Theanalysis is carried out by means of post-processing. The authors point out that a great deal of effort
Sensors 2013, 13 12223
is necessary for the in-field calibration procedure, which is supported by an ad hoc software directlyinterfaced with the tool used to handle the signals. The paper describes the design, calibration andevaluation of a broad range of sensing devices placed on the boat. The study is focused on designinginnovative rowing shells meeting the specific requirements of a crew.
In [26], a WSN-based approach to improve rowing performance was presented. The authorsdescribe the design of the system and some real-world experiments. They investigate how to integrateinertial measurement units into the process of rowing technique optimization. The study is focused onpossibilities offered by the sensors and employs conventional signal processing techniques, giving someinsights about the type of sensors to be used. The system has been experimented upon in both trainingand racing conditions, showing its ability to measure rowing technique indicators, such as stroke lengthand stroke rate, for both amateurs and world-class rowers.
In [27], the authors presented an evaluation of online sonification as an aid for visually-impairedrowing athletes. The approach allows athletes to better follow the movements of the rest of the rowingteam. The system, called Sofirow, is implemented on a device that samples accelerations and the speedof the boat and produces a parametric sound, directly proportional to the linear acceleration of the boat.Thus, the perception of the boat run by the athletes is enhanced, as the single rowing cycle can beperceived as a short sound sequence.
In [15], a quantitative evaluation of four different sonification schemes for rowers was presented. Thestudy is considered more extensive than the work carried out in [27], as a broad range of sonificationmodels are used, i.e., wind, pure tone, musical instruments and car engine. Questions about thecharacteristics of the sound stimuli are also posed in order to assess the ability of the participants toextract information from the sonification models.
3. The Overall Architecture
In this section, we first provide an ontology-driven conceptual modeling, so as to sufficiently capturethe most important requirements and tasks to be performed; then, we detail the main modules ofthe system.
3.1. An Ontological View of the Proposed Approach
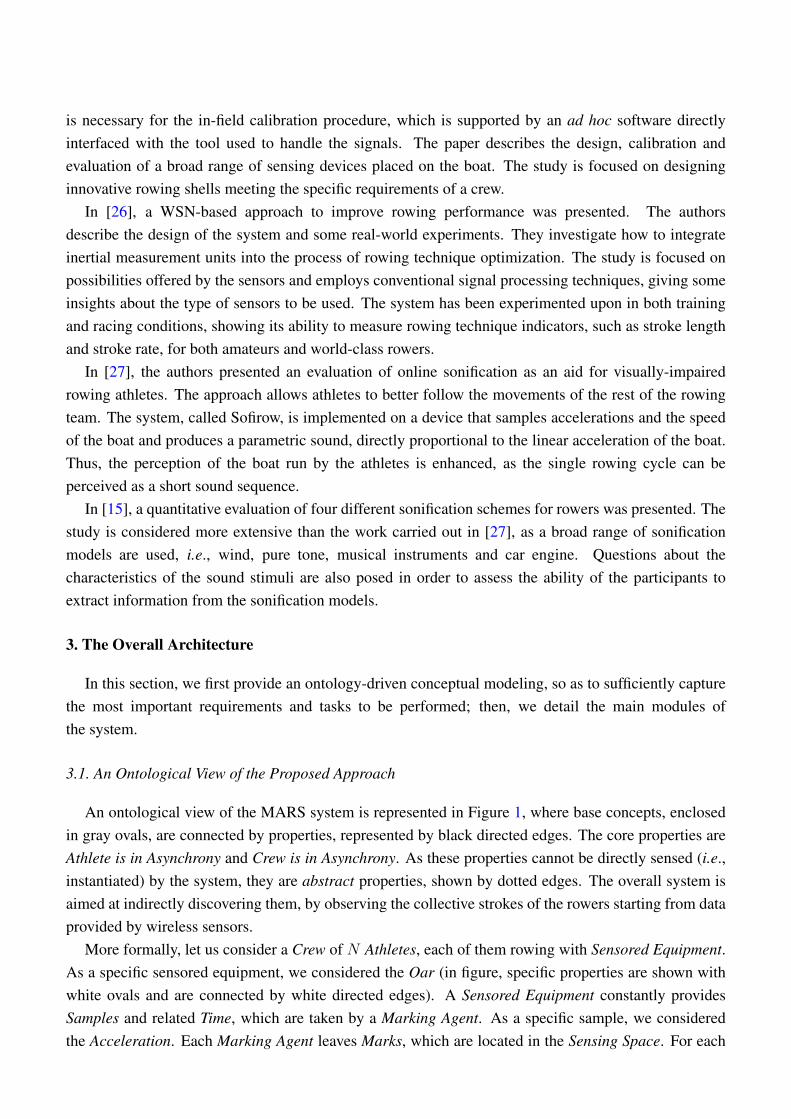
An ontological view of the MARS system is represented in Figure 1, where base concepts, enclosedin gray ovals, are connected by properties, represented by black directed edges. The core properties areAthlete is in Asynchrony and Crew is in Asynchrony. As these properties cannot be directly sensed (i.e.,instantiated) by the system, they are abstract properties, shown by dotted edges. The overall system isaimed at indirectly discovering them, by observing the collective strokes of the rowers starting from dataprovided by wireless sensors.
More formally, let us consider a Crew of N Athletes, each of them rowing with Sensored Equipment.As a specific sensored equipment, we considered the Oar (in figure, specific properties are shown withwhite ovals and are connected by white directed edges). A Sensored Equipment constantly providesSamples and related Time, which are taken by a Marking Agent. As a specific sample, we consideredthe Acceleration. Each Marking Agent leaves Marks, which are located in the Sensing Space. For each
Sensors 2013, 13 12224
Sensored Equipment, there is a Marking Agent. Marks are aggregated in the Sensing Space, generatingCollectiveMarks. For each Crew, a Similarity Agent observes Marks and Collective Marks in order toproduce a Similarity measure of them with respect to optimal marks; these correspond to the marksproduced under a desired level of synchrony. Finally, a Granulation Agent takes as input the Similarityand generates a level of Asynchrony.
Figure 1. An ontological view of the emergent approach for measuring asynchronyin rowing.
3.2. The Main Modules of the MARS System
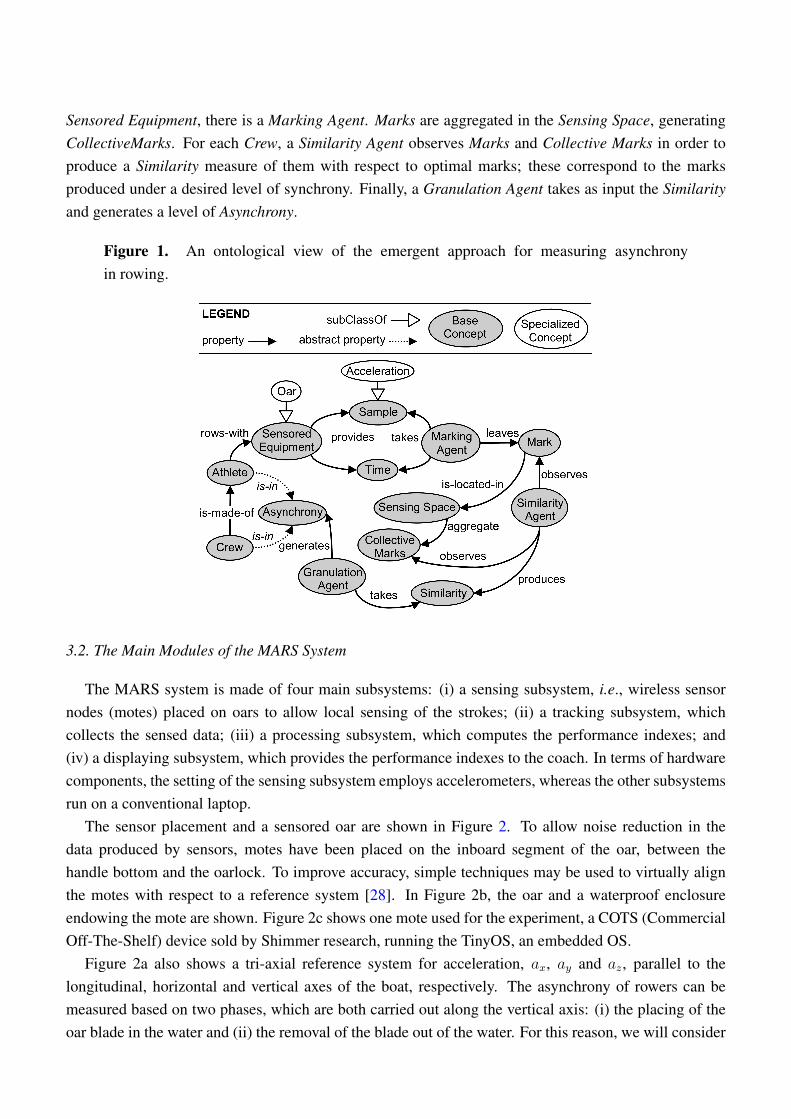
The MARS system is made of four main subsystems: (i) a sensing subsystem, i.e., wireless sensornodes (motes) placed on oars to allow local sensing of the strokes; (ii) a tracking subsystem, whichcollects the sensed data; (iii) a processing subsystem, which computes the performance indexes; and(iv) a displaying subsystem, which provides the performance indexes to the coach. In terms of hardwarecomponents, the setting of the sensing subsystem employs accelerometers, whereas the other subsystemsrun on a conventional laptop.
The sensor placement and a sensored oar are shown in Figure 2. To allow noise reduction in thedata produced by sensors, motes have been placed on the inboard segment of the oar, between thehandle bottom and the oarlock. To improve accuracy, simple techniques may be used to virtually alignthe motes with respect to a reference system [28]. In Figure 2b, the oar and a waterproof enclosureendowing the mote are shown. Figure 2c shows one mote used for the experiment, a COTS (CommercialOff-The-Shelf) device sold by Shimmer research, running the TinyOS, an embedded OS.
Figure 2a also shows a tri-axial reference system for acceleration, ax, ay and az, parallel to thelongitudinal, horizontal and vertical axes of the boat, respectively. The asynchrony of rowers can bemeasured based on two phases, which are both carried out along the vertical axis: (i) the placing of theoar blade in the water and (ii) the removal of the blade out of the water. For this reason, we will consider
Sensors 2013, 13 12225
only the vertical axis, az, referred to as a, for brevity. This mono-dimensional input signal will also allowus a simple and effective presentation of the method.
Figure 2. (a) Position of the motes on the boat; (b) a sensored oar; (c) a mote.
(a)
(b) (c)
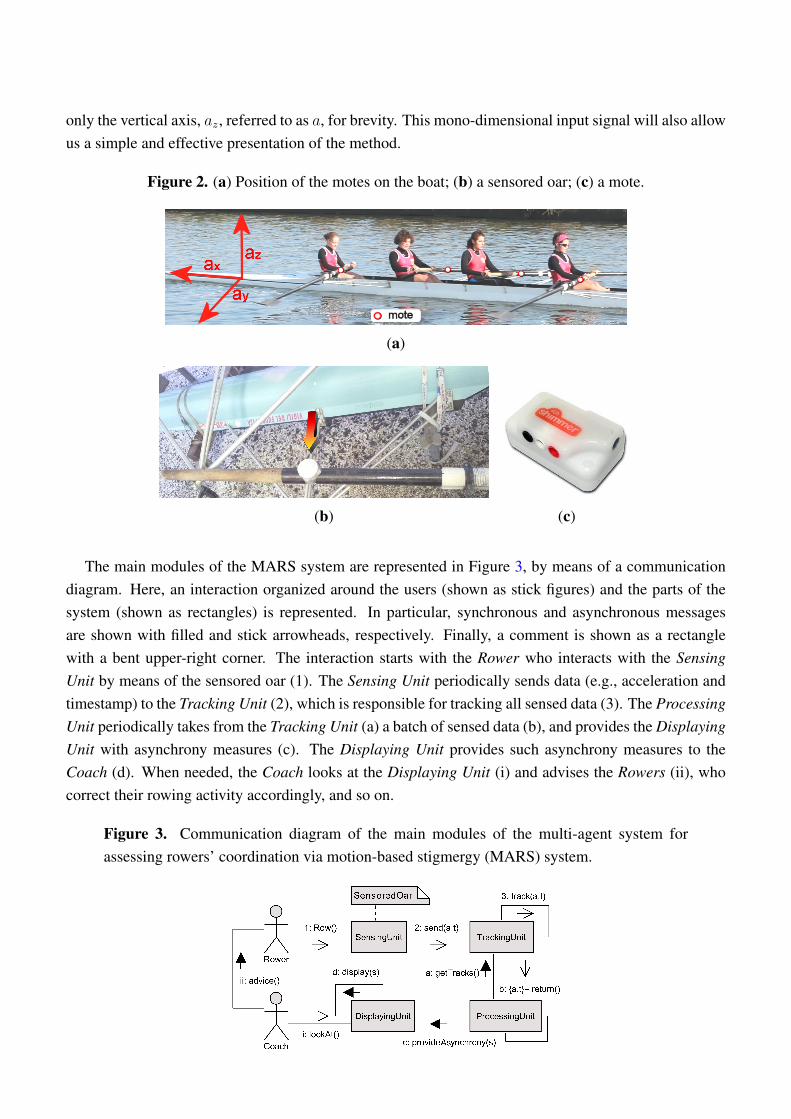
The main modules of the MARS system are represented in Figure 3, by means of a communicationdiagram. Here, an interaction organized around the users (shown as stick figures) and the parts of thesystem (shown as rectangles) is represented. In particular, synchronous and asynchronous messagesare shown with filled and stick arrowheads, respectively. Finally, a comment is shown as a rectanglewith a bent upper-right corner. The interaction starts with the Rower who interacts with the SensingUnit by means of the sensored oar (1). The Sensing Unit periodically sends data (e.g., acceleration andtimestamp) to the Tracking Unit (2), which is responsible for tracking all sensed data (3). The ProcessingUnit periodically takes from the Tracking Unit (a) a batch of sensed data (b), and provides the DisplayingUnit with asynchrony measures (c). The Displaying Unit provides such asynchrony measures to theCoach (d). When needed, the Coach looks at the Displaying Unit (i) and advises the Rowers (ii), whocorrect their rowing activity accordingly, and so on.
Figure 3. Communication diagram of the main modules of the multi-agent system forassessing rowers’ coordination via motion-based stigmergy (MARS) system.
Sensors 2013, 13 12226
In the following section, we provide a more detailed view of the peripheral units. The core of thesystem is represented by the ProcessingUnit, which is described and analyzed in Section 4.
3.3. The SensingUnit Module
The sensing unit is made of a Shimmer mote attached to the oar. The size of a mote is53 × 32 × 25 mm. Each mote is composed of a micro-controller, a rechargeable battery, a three-axisaccelerometer, a Bluetooth transceiver and other components not relevant to this work. The mote runsa program written in NesC (http://nescc.sourceforge.net) over TinyOS (http://www.tinyos.net), an opensource, event-driven operating system designed for networked embedded sensor systems. The motehas been programmed so as to be managed with minimum power consumption. More specifically, itcyclically samples the accelerometer at a given frequency and sends the sampled data to the tracking unit.The sampling frequency can be set via wireless communication, by using a simple two-way protocol.The mote can also be reset and synchronized upon commands sent using a wireless transceiver. Weexperienced that, with this management program, the average battery life was three hours, thus allowingus to perform long-lasting on-field tests. A limit of such motes is the relatively short transmission rangeof their on-board Bluetooth transceiver, which is roughly 20 m.
3.4. The TrackingUnit Module
The tracking unit is made of a laptop equipped with a Bluetooth receiver. The logic of the unit isdeveloped in Java. The unit is responsible for wireless interactions with the motes, i.e., reset mote,set sampling frequency and synchronize mote. At the physical level, the unit works as a Bluetoothmaster to the motes. At the application level, when the application starts, the unit forces a preliminarysynchronization of the motes, through a simple three-way handshake protocol. While the system isrunning, some clock drifts on the motes may occur. Hence, timestamps provided by motes may not besynchronized with respect to the tracking unit. To overcome this issue, timestamps are adjusted on thetracking unit, considering the sampling period and the inter-arrival time of the samples.
3.5. The DisplayingUnit Module
The MARS system supplies the coach with both visual and aural [29] displays. The visualchannel provides quantitative values of asynchrony, whereas the aural channel is designed for providingqualitative information. The aural channel is more immediate and has the advantage of leaving thecoach free from watching the asynchrony data continuously. This allows him to follow the evolutionof the whole team or the performance of a single rower with respect to the team in an easier and moreeffective way.
With the MARS system, the coach is able to access the asynchrony via the following use cases:(i) listen to the individual asynchrony; (ii) watch the individual asynchrony; (iii) listen to the collectiveasynchrony; and (iv) watch the collective asynchrony. Advice to rowers can be provided by the coach ina conventional manner, i.e., with his own voice. During a training session, the coach, who is normallytuned via the aural channel, looks at the visual content only occasionally. At the end of the training
Sensors 2013, 13 12227
session, he can examine the visual plot of individual and collective asynchrony, in order to establish aperformance improvement initiative for the next session.
4. The ProcessingUnit Module
In this section, we first introduce some definitions to formalize our method. Then, we describe thedifferent processing phases.
4.1. The Static Pre-Filtering
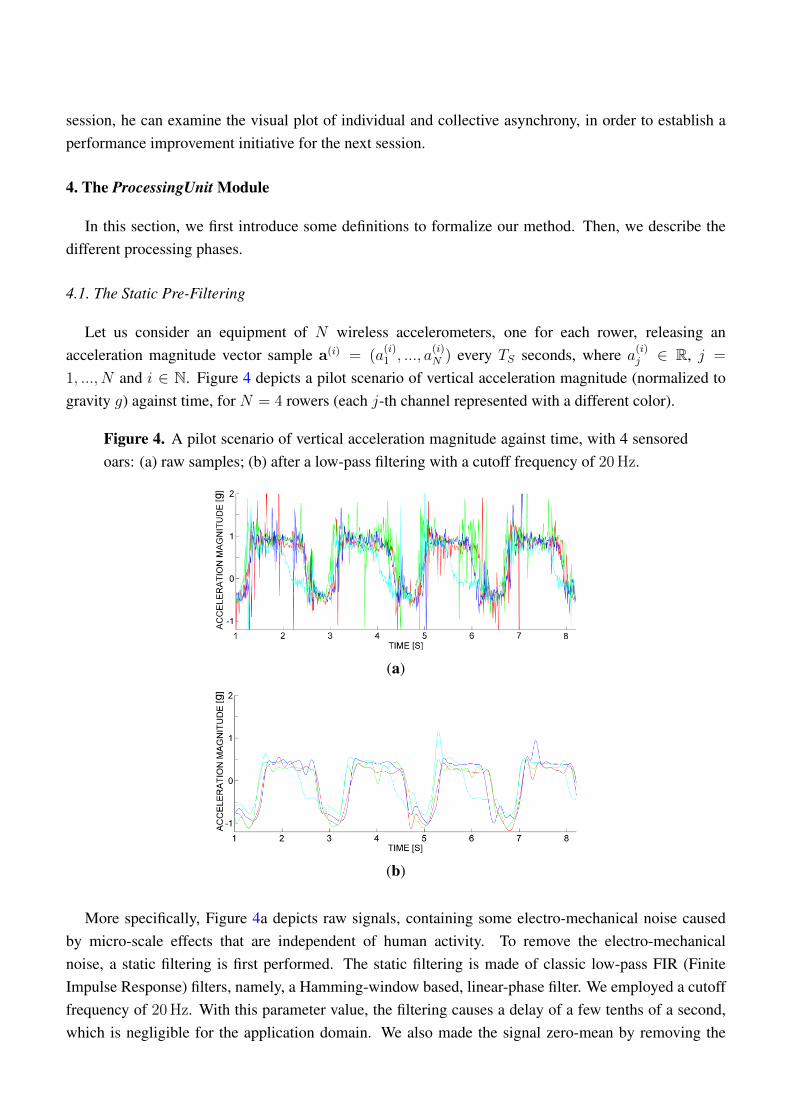
Let us consider an equipment of N wireless accelerometers, one for each rower, releasing anacceleration magnitude vector sample a(i) = (a
(i)1 , ..., a
(i)N ) every TS seconds, where a(i)
j ∈ R, j =
1, ..., N and i ∈ N. Figure 4 depicts a pilot scenario of vertical acceleration magnitude (normalized togravity g) against time, for N = 4 rowers (each j-th channel represented with a different color).
Figure 4. A pilot scenario of vertical acceleration magnitude against time, with 4 sensoredoars: (a) raw samples; (b) after a low-pass filtering with a cutoff frequency of 20 Hz.
(a)
(b)
More specifically, Figure 4a depicts raw signals, containing some electro-mechanical noise causedby micro-scale effects that are independent of human activity. To remove the electro-mechanicalnoise, a static filtering is first performed. The static filtering is made of classic low-pass FIR (FiniteImpulse Response) filters, namely, a Hamming-window based, linear-phase filter. We employed a cutofffrequency of 20 Hz. With this parameter value, the filtering causes a delay of a few tenths of a second,which is negligible for the application domain. We also made the signal zero-mean by removing the
Sensors 2013, 13 12228
average, which is irrelevant for detecting the rowing stroke. Figure 4b shows the effect of the staticfiltering on the raw samples in the pilot scenario.
4.2. The Marking Processing Level
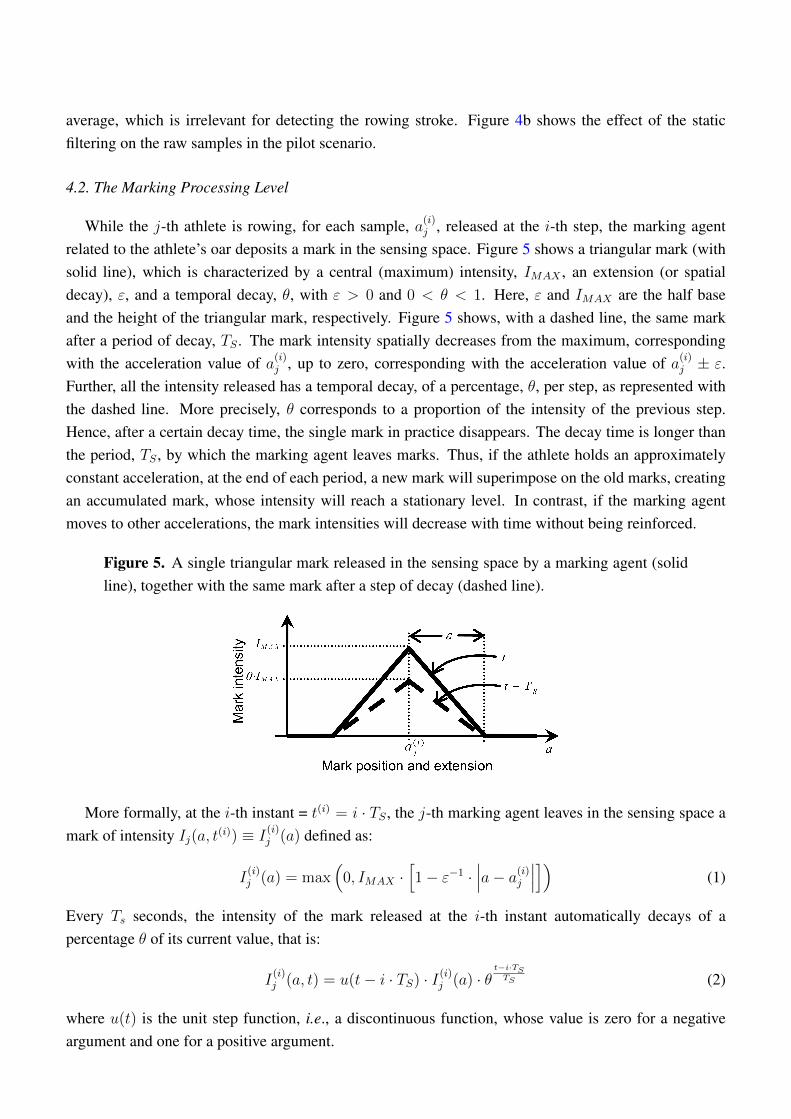
While the j-th athlete is rowing, for each sample, a(i)j , released at the i-th step, the marking agent
related to the athlete’s oar deposits a mark in the sensing space. Figure 5 shows a triangular mark (withsolid line), which is characterized by a central (maximum) intensity, IMAX , an extension (or spatialdecay), ε, and a temporal decay, θ, with ε > 0 and 0 < θ < 1. Here, ε and IMAX are the half baseand the height of the triangular mark, respectively. Figure 5 shows, with a dashed line, the same markafter a period of decay, TS . The mark intensity spatially decreases from the maximum, correspondingwith the acceleration value of a(i)
j , up to zero, corresponding with the acceleration value of a(i)j ± ε.
Further, all the intensity released has a temporal decay, of a percentage, θ, per step, as represented withthe dashed line. More precisely, θ corresponds to a proportion of the intensity of the previous step.Hence, after a certain decay time, the single mark in practice disappears. The decay time is longer thanthe period, TS , by which the marking agent leaves marks. Thus, if the athlete holds an approximatelyconstant acceleration, at the end of each period, a new mark will superimpose on the old marks, creatingan accumulated mark, whose intensity will reach a stationary level. In contrast, if the marking agentmoves to other accelerations, the mark intensities will decrease with time without being reinforced.
Figure 5. A single triangular mark released in the sensing space by a marking agent (solidline), together with the same mark after a step of decay (dashed line).
More formally, at the i-th instant = t(i) = i · TS , the j-th marking agent leaves in the sensing space amark of intensity Ij(a, t(i)) ≡ I
(i)j (a) defined as:
I(i)j (a) = max
(0, IMAX ·
[1− ε−1 ·
∣∣∣a− a(i)j
∣∣∣]) (1)
Every Ts seconds, the intensity of the mark released at the i-th instant automatically decays of apercentage θ of its current value, that is:
I(i)j (a, t) = u(t− i · TS) · I(i)
j (a) · θt−i·TS
TS (2)
where u(t) is the unit step function, i.e., a discontinuous function, whose value is zero for a negativeargument and one for a positive argument.
Sensors 2013, 13 12229
In order to assess whether the superimposition of marks yields the maximum intensity level toconverge to a stationary level, let us consider a theoretical scenario that produces the utmost possibleintensity level. In such a scenario, the j-th marking agent keeps its value of acceleration, a(i)
j , constantand releases an infinite series of identical marks, with a temporal period of TS seconds. Hence, thecurrent intensity level, Ij(a, t), of the accumulated mark is obtained as the sum of the intensities of themarks left by the j-th marking agent, that is, from Formula (2):
Ij(a, t) =
Z=bt/TSc∑i=0
u(t− i · TS) · I(i)j (a) · θZ−i (3)
Then, from Formula (3), we can deduce that after Z · TS seconds:
Ij(a, t) = I(0)j (a) · θZ + I
(1)j (a) · θZ−1 + ...+ I
(Z)j (a) (4)
Since a(i)j = a
(i)j is constant, from Formula (1), it follows that I(0)
j (a) = I(1)j (a) = ... = I
(Z)j (a). As
a consequence, Formula (4) becomes the sum of the first Z + 1 terms of a geometric series, and itfollows that:
Ij(a, t) = I(0)j (a) · 1− θZ+1
1− θ(5)
If Z � 1, then:
Ij(a, t)→ I(0)j (a) · 1
1− θ(6)
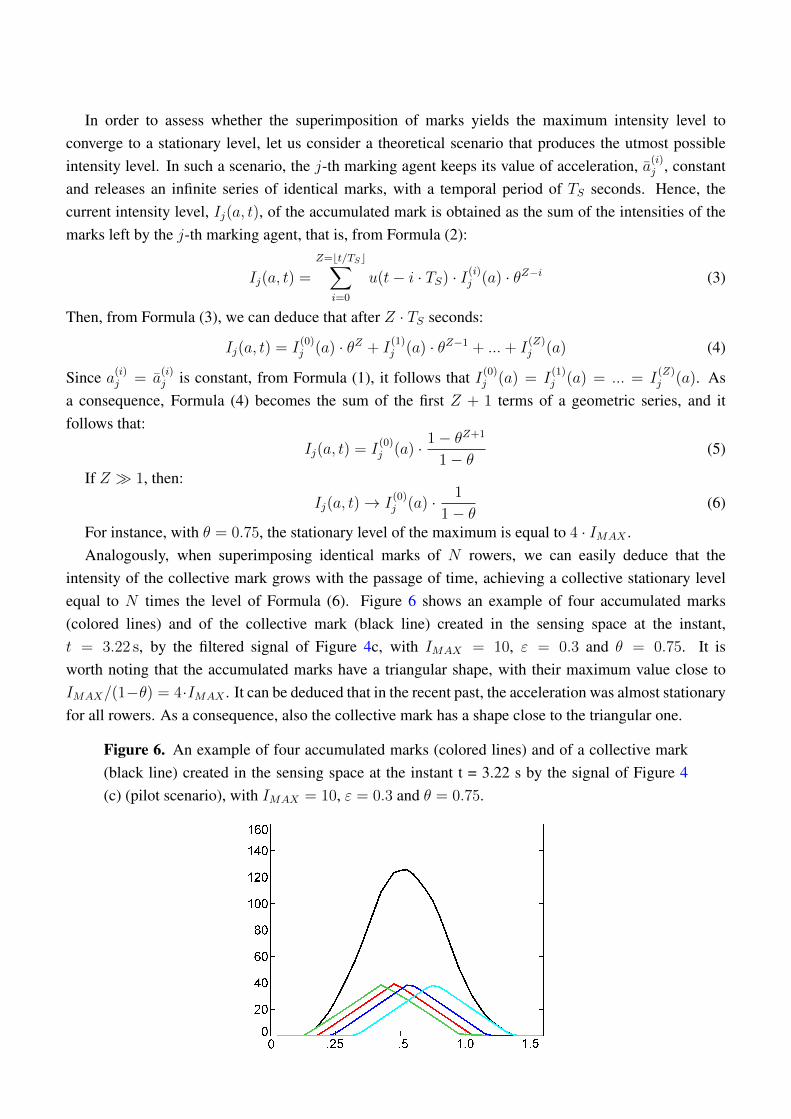
For instance, with θ = 0.75, the stationary level of the maximum is equal to 4 · IMAX .Analogously, when superimposing identical marks of N rowers, we can easily deduce that the
intensity of the collective mark grows with the passage of time, achieving a collective stationary levelequal to N times the level of Formula (6). Figure 6 shows an example of four accumulated marks(colored lines) and of the collective mark (black line) created in the sensing space at the instant,t = 3.22 s, by the filtered signal of Figure 4c, with IMAX = 10, ε = 0.3 and θ = 0.75. It isworth noting that the accumulated marks have a triangular shape, with their maximum value close toIMAX/(1−θ) = 4·IMAX . It can be deduced that in the recent past, the acceleration was almost stationaryfor all rowers. As a consequence, also the collective mark has a shape close to the triangular one.
Figure 6. An example of four accumulated marks (colored lines) and of a collective mark(black line) created in the sensing space at the instant t = 3.22 s by the signal of Figure 4(c) (pilot scenario), with IMAX = 10, ε = 0.3 and θ = 0.75.
Sensors 2013, 13 12230
4.3. The Similarity Processing Level
The first important observation from the marking processing level is that an accumulated mark takesa triangular shape when acceleration does not vary sensibly within the last steps. We suppose herethat any rowing stroke produces a signal whose acceleration pattern strongly depends on a number offactors. In our approach, we do not need to establish which phases of the rowing stroke correspondto a stable acceleration. We only assume that in synchronized rowers, these phases might be close. Asecond observation is that the collective mark contains a short-term memory concerning the overallcloseness of the stroke accelerations of the rowers. Here, we can associate some semantics to theparameters of a mark. Small spatial and temporal decay may generate a Boolean processing: onlyalmost identical rowing strokes can produce collective marking. Larger spatial and temporal decayallows distinguishing of different rowing strokes, up to a limit, which may cause growing collectivemarks with no stationary level.
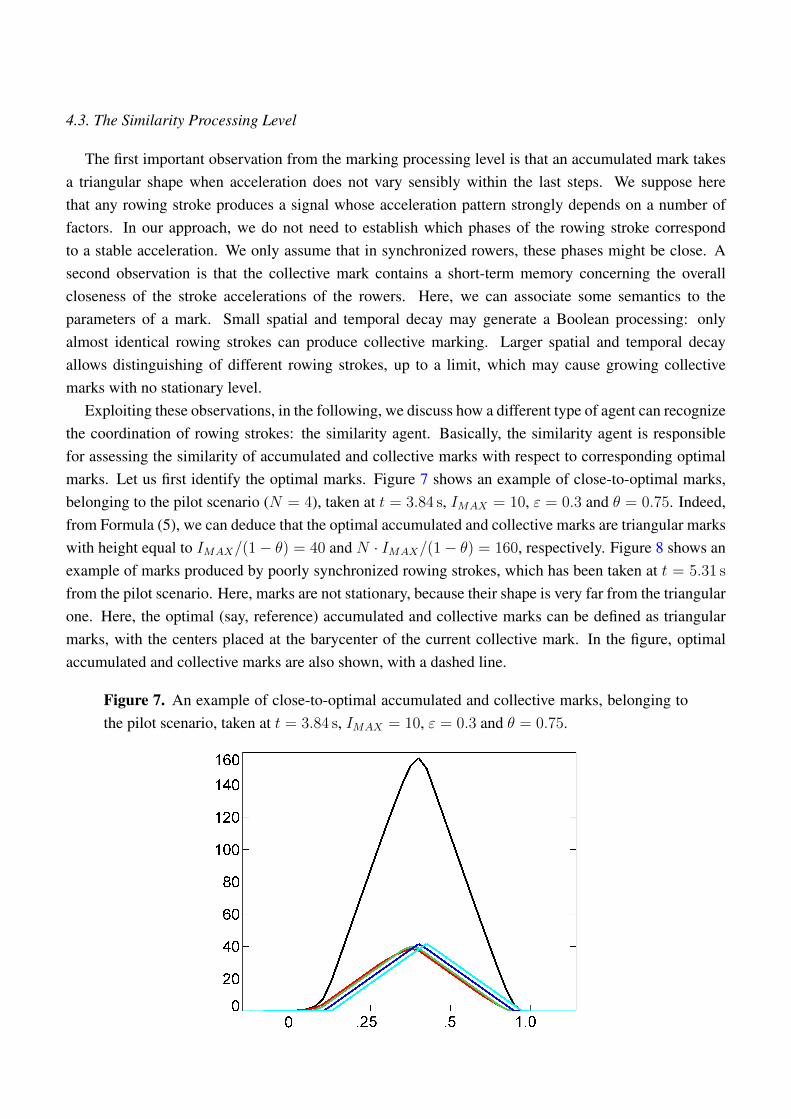
Exploiting these observations, in the following, we discuss how a different type of agent can recognizethe coordination of rowing strokes: the similarity agent. Basically, the similarity agent is responsiblefor assessing the similarity of accumulated and collective marks with respect to corresponding optimalmarks. Let us first identify the optimal marks. Figure 7 shows an example of close-to-optimal marks,belonging to the pilot scenario (N = 4), taken at t = 3.84 s, IMAX = 10, ε = 0.3 and θ = 0.75. Indeed,from Formula (5), we can deduce that the optimal accumulated and collective marks are triangular markswith height equal to IMAX/(1− θ) = 40 and N · IMAX/(1− θ) = 160, respectively. Figure 8 shows anexample of marks produced by poorly synchronized rowing strokes, which has been taken at t = 5.31 s
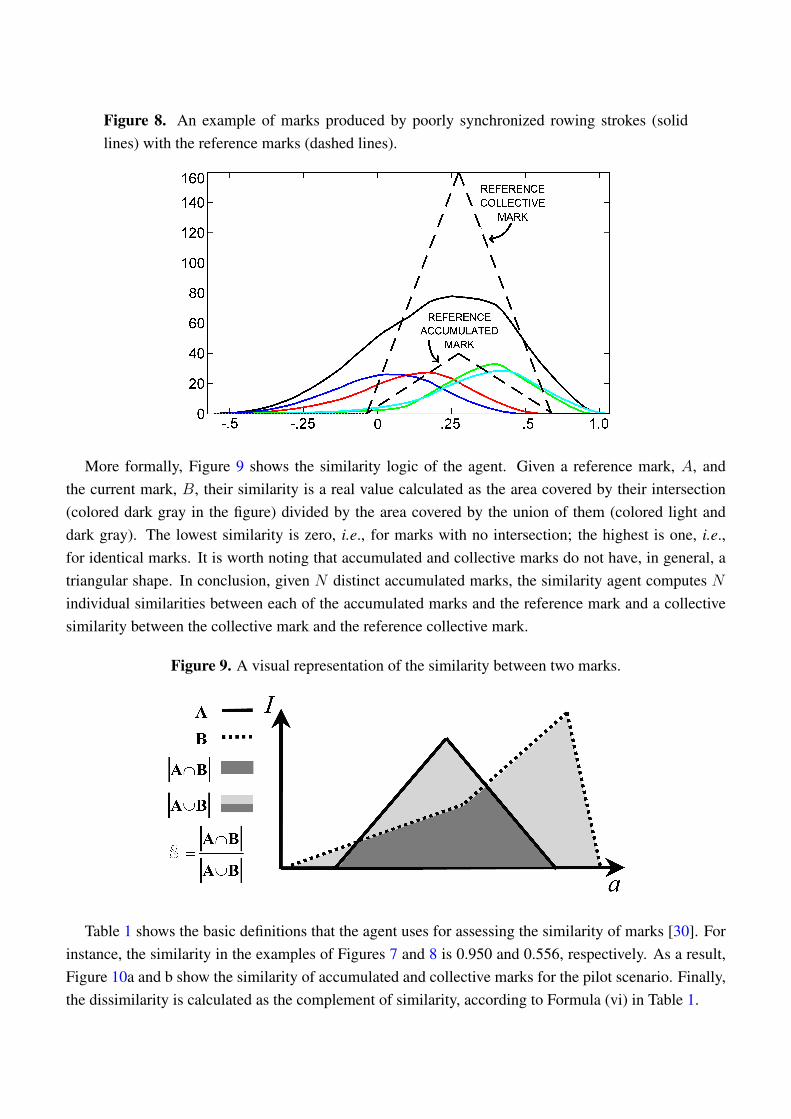
from the pilot scenario. Here, marks are not stationary, because their shape is very far from the triangularone. Here, the optimal (say, reference) accumulated and collective marks can be defined as triangularmarks, with the centers placed at the barycenter of the current collective mark. In the figure, optimalaccumulated and collective marks are also shown, with a dashed line.
Figure 7. An example of close-to-optimal accumulated and collective marks, belonging tothe pilot scenario, taken at t = 3.84 s, IMAX = 10, ε = 0.3 and θ = 0.75.
Sensors 2013, 13 12231
Figure 8. An example of marks produced by poorly synchronized rowing strokes (solidlines) with the reference marks (dashed lines).
More formally, Figure 9 shows the similarity logic of the agent. Given a reference mark, A, andthe current mark, B, their similarity is a real value calculated as the area covered by their intersection(colored dark gray in the figure) divided by the area covered by the union of them (colored light anddark gray). The lowest similarity is zero, i.e., for marks with no intersection; the highest is one, i.e.,for identical marks. It is worth noting that accumulated and collective marks do not have, in general, atriangular shape. In conclusion, given N distinct accumulated marks, the similarity agent computes Nindividual similarities between each of the accumulated marks and the reference mark and a collectivesimilarity between the collective mark and the reference collective mark.
Figure 9. A visual representation of the similarity between two marks.
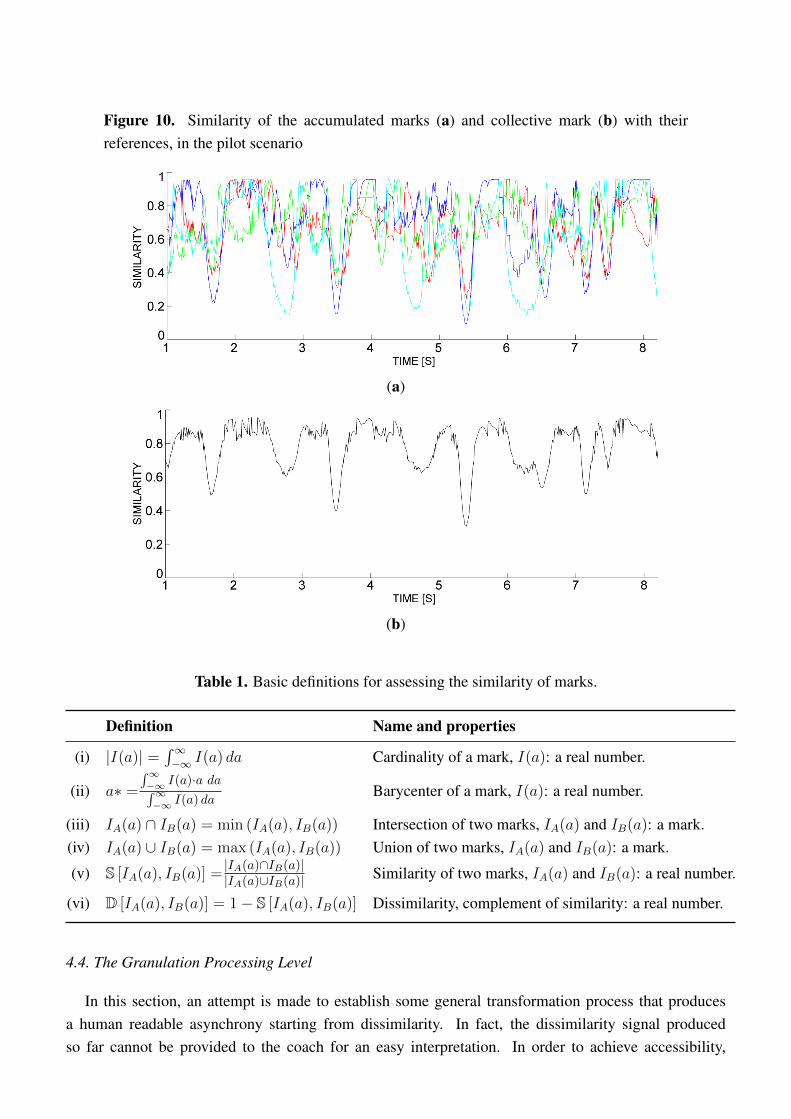
Table 1 shows the basic definitions that the agent uses for assessing the similarity of marks [30]. Forinstance, the similarity in the examples of Figures 7 and 8 is 0.950 and 0.556, respectively. As a result,Figure 10a and b show the similarity of accumulated and collective marks for the pilot scenario. Finally,the dissimilarity is calculated as the complement of similarity, according to Formula (vi) in Table 1.
Sensors 2013, 13 12232
Figure 10. Similarity of the accumulated marks (a) and collective mark (b) with theirreferences, in the pilot scenario
(a)
(b)
Table 1. Basic definitions for assessing the similarity of marks.
Definition Name and properties
(i) |I(a)| =∫∞−∞ I(a) da Cardinality of a mark, I(a): a real number.
(ii) a∗ =
∫∞−∞ I(a)·a da∫∞−∞ I(a) da
Barycenter of a mark, I(a): a real number.
(iii) IA(a) ∩ IB(a) = min (IA(a), IB(a)) Intersection of two marks, IA(a) and IB(a): a mark.(iv) IA(a) ∪ IB(a) = max (IA(a), IB(a)) Union of two marks, IA(a) and IB(a): a mark.
(v) S [IA(a), IB(a)] =|IA(a)∩IB(a)||IA(a)∪IB(a)| Similarity of two marks, IA(a) and IB(a): a real number.
(vi) D [IA(a), IB(a)] = 1− S [IA(a), IB(a)] Dissimilarity, complement of similarity: a real number.
4.4. The Granulation Processing Level
In this section, an attempt is made to establish some general transformation process that producesa human readable asynchrony starting from dissimilarity. In fact, the dissimilarity signal producedso far cannot be provided to the coach for an easy interpretation. In order to achieve accessibility,
Sensors 2013, 13 12233
relevant information should be presented for actively supporting the decision process of the coach. Morespecifically, we focus on the concept of information granulation of a time series.
The process of information granulation is a vehicle of abstraction leading to the emergence ofhigh-level concepts. More specifically, information can be granulated over predefined time intervals,giving rise to temporal granulation, but also, over the sensing variable (i.e., acceleration), giving riseto sensing granulation. Information granules need to be stable, meaning that they have to retain theiridentity in spite of some small fluctuations occurring within the experimental data, as any judgmentof an experienced coach. Further, information granules need to be distinguishable, meaning that theiridentities should be distinct enough from each other.
In user-oriented granulation, the user (i.e., the coach) identifies the parameters of the informationgranules, according to his supervisory process. Proceeding with a given window of granulation, wepropose some basic transformation. The interested reader may refer to [31] for a detailed study. Morespecifically, our objective is to construct crew and rower asynchrony descriptors that can be legitimizedby the direct experience of a coach. The problem can be posed in the following way; given a collectionof numeric dissimilarity data, let us say, D = d
(i)j ∈ R(N+1)×T , where d(i)
0 and d(i)j are the collective
and the (j-th) individual dissimilarity at the i-th instant of time. A granulation process provides acollection of asynchrony data suitable for a specific Performance Improvement Initiative (PII) takenby the coach during a training process. Let us say: Γ(D)PII = {σ(i)
j } ∈ R(N+1)×T , where σ(i)0 and σ(i)
j
are the collective and the (j-th) individual asynchrony at the i-th instant. Hence, Γ(D) is a performanceindicator with an intuitive interpretation based on the experimental evidence of an experienced coach.In brief, the PII represents a training process aimed at improving a performance indicator. Such aperformance indicator is calculated via a granulation of the asynchrony measure.
In the following, we consider both local (online) and global (offline) PIIs, in order to monitor rowingperformance within temporal windows of different scales. For this purpose, the process of granulation isestablished by determining the window of granulation and its numeric representative as a descriptor. Abasic descriptor that can be considered is the simple moving average (SMA), i.e., the unweighted meanof the previous ∆ samples:
Γ(D) = {σ(i)j } =
undefined if i 6 ∆
1∆
∑∆−1k=0 d
(i−k)j if i > ∆
(7)
where ∆ is the temporal window. We use Formula (7) with two different scales of granulation, i.e., amacro-granulation for a global (offline) PII and a micro-granulation for a local (online) PII.
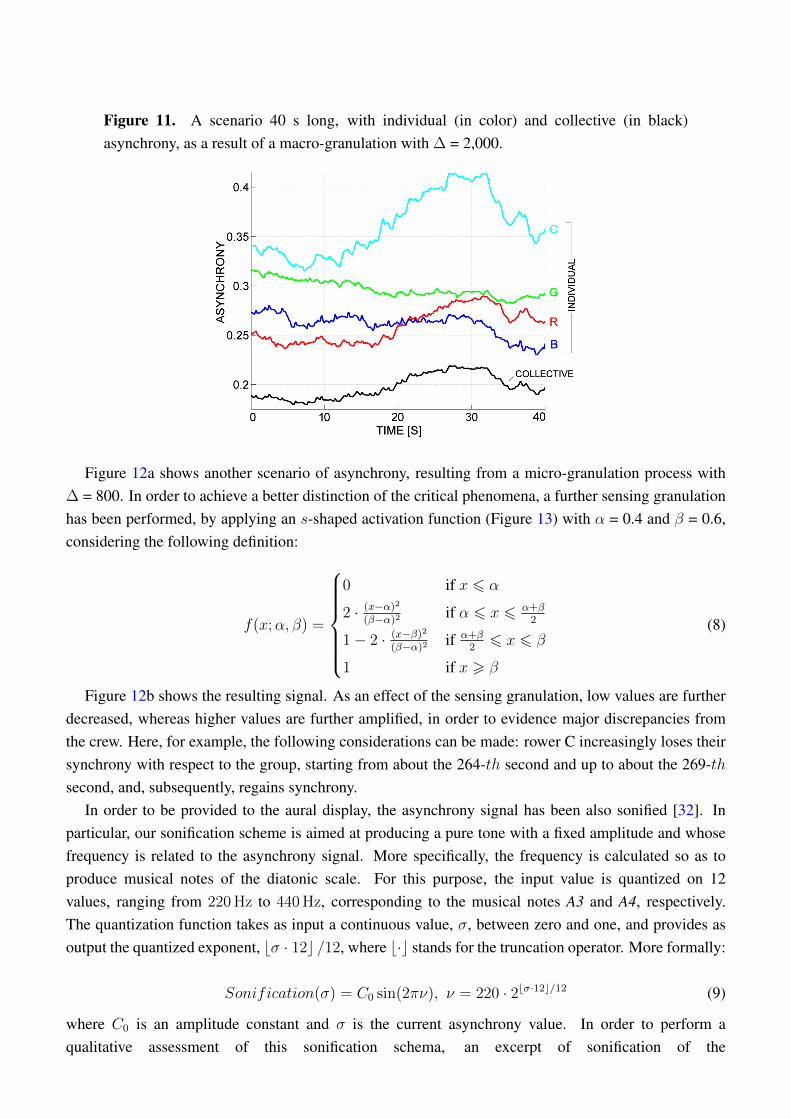
Figure 11 shows a scenario 40 s long, with individual (in color) and collective (in black) asynchrony,as a result of a macro-granulation process with ∆ = 2,000. Here, we involved a crew of four rowers,named Cyan (C), Red (R), Blue (B) and Green (G). The following considerations can be easily made:(i) rowers C and G have the worst performance; (ii) rowers C and R sensibly diminished theirperformance in the second half of the scenario; and (iii) the collective performance sensibly diminishedin the second half of the scenario.
Sensors 2013, 13 12234
Figure 11. A scenario 40 s long, with individual (in color) and collective (in black)asynchrony, as a result of a macro-granulation with ∆ = 2,000.
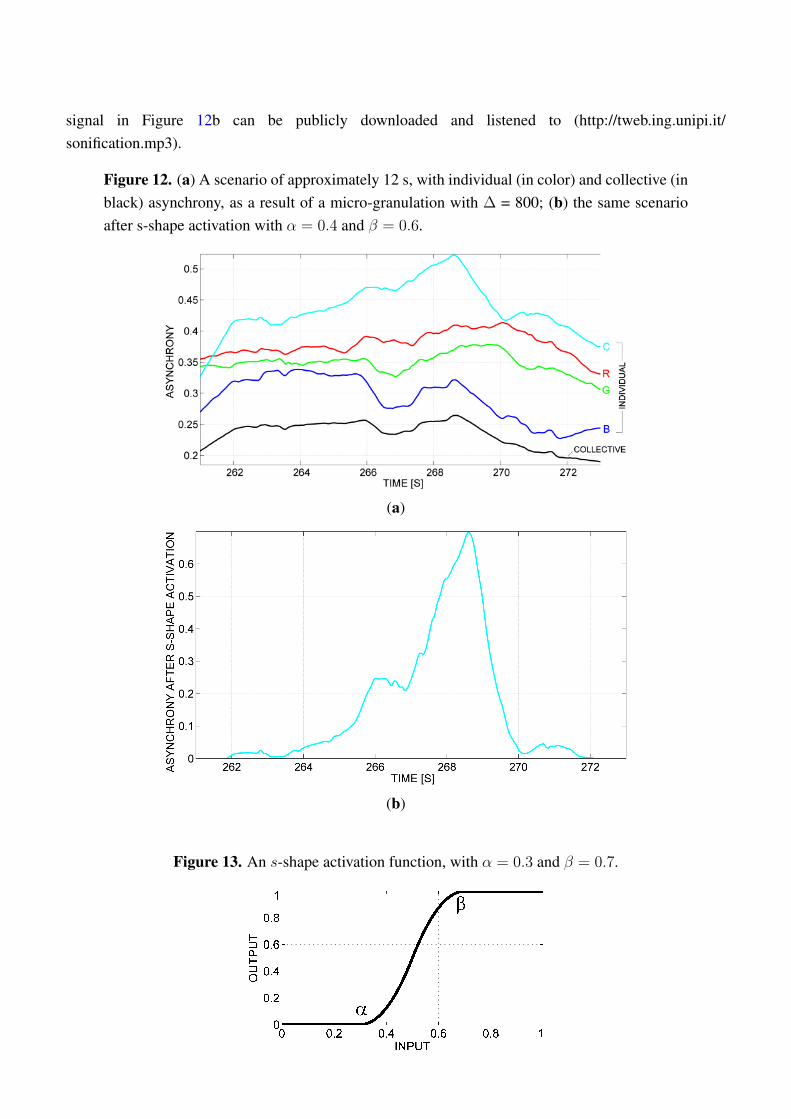
Figure 12a shows another scenario of asynchrony, resulting from a micro-granulation process with∆ = 800. In order to achieve a better distinction of the critical phenomena, a further sensing granulationhas been performed, by applying an s-shaped activation function (Figure 13) with α = 0.4 and β = 0.6,considering the following definition:
f(x;α, β) =
0 if x 6 α
2 · (x−α)2
(β−α)2if α 6 x 6 α+β
2
1− 2 · (x−β)2
(β−α)2if α+β
26 x 6 β
1 if x > β
(8)
Figure 12b shows the resulting signal. As an effect of the sensing granulation, low values are furtherdecreased, whereas higher values are further amplified, in order to evidence major discrepancies fromthe crew. Here, for example, the following considerations can be made: rower C increasingly loses theirsynchrony with respect to the group, starting from about the 264-th second and up to about the 269-thsecond, and, subsequently, regains synchrony.
In order to be provided to the aural display, the asynchrony signal has been also sonified [32]. Inparticular, our sonification scheme is aimed at producing a pure tone with a fixed amplitude and whosefrequency is related to the asynchrony signal. More specifically, the frequency is calculated so as toproduce musical notes of the diatonic scale. For this purpose, the input value is quantized on 12values, ranging from 220 Hz to 440 Hz, corresponding to the musical notes A3 and A4, respectively.The quantization function takes as input a continuous value, σ, between zero and one, and provides asoutput the quantized exponent, bσ · 12c /12, where b·c stands for the truncation operator. More formally:
Sonification(σ) = C0 sin(2πν), ν = 220 · 2bσ·12c/12 (9)
where C0 is an amplitude constant and σ is the current asynchrony value. In order to perform aqualitative assessment of this sonification schema, an excerpt of sonification of the
Sensors 2013, 13 12235
signal in Figure 12b can be publicly downloaded and listened to (http://tweb.ing.unipi.it/sonification.mp3).
Figure 12. (a) A scenario of approximately 12 s, with individual (in color) and collective (inblack) asynchrony, as a result of a micro-granulation with ∆ = 800; (b) the same scenarioafter s-shape activation with α = 0.4 and β = 0.6.
(a)
(b)
Figure 13. An s-shape activation function, with α = 0.3 and β = 0.7.
Sensors 2013, 13 12236
5. The Deployment of the MARS System Architecture
The MARS system is not intended to substitute or replace the advice of the coach when conductingthe training session. Instead, the system is aimed at helping the coach to better perceive the crewcoordination. In our opinion, the fact that the MARS system performs as good as a trainer is indeeda primary goal and a good achievement.
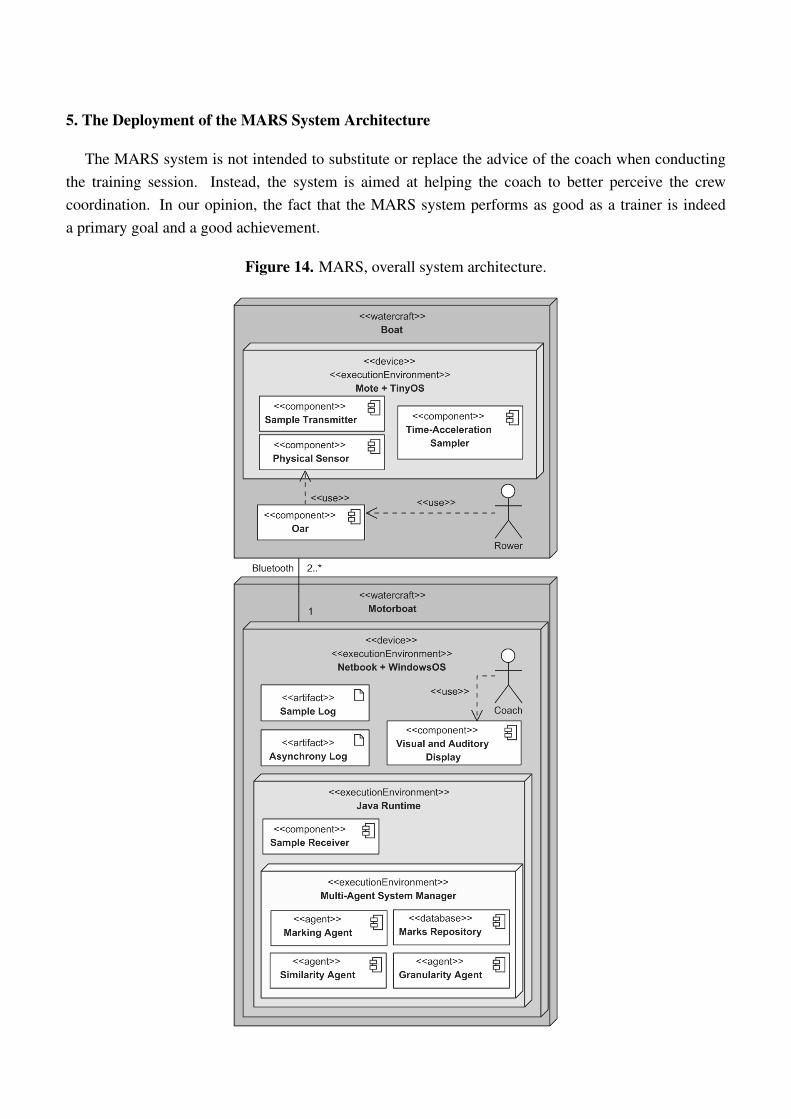
Figure 14. MARS, overall system architecture.

Sensors 2013, 13 12237
Figure 14 shows a UML (Unified Modeling Language) deployment diagram of the MARS systemarchitecture. Here, there are two device categories, i.e., Mote and Netbook, which reside on the boat andthe motorboat, respectively. There are many motes taking part in a sensing unit, each managed via theTinyOS operating system as an autonomous execution environment. There is a single netbook managedvia the Windows OS, which hosts the tracking, processing and displaying units. On the boat, each Rowerinteracts indirectly with the Physical Sensor of a mote via his Oar. In the mote, the Time-AccelerationSampler processes and records time and acceleration data from the physical sensor, whereas the SampleTransmitter component sends data to the Tracking Unit. On the motorboat, the coach is provided withasynchrony measures via the Visual and Auditory Display component, i.e., the netbook display and theheadphone, respectively. On the tracking unit, the Sample Receiver (a Java-based component) is providedwith the data coming from motes. Such data are stored in the Sample Log. The processing unit is entirelybased on the Java-based Multi-Agent Systems Manager, which hosts the various agents, and the MarksRepository implementing the mark properties. The Multi-Agent Systems Manager is based on RepastSimphony (http://repast.sourceforge.net) , a Java-based modeling system supporting the development ofinteracting agents. It can be used as a GUI-based (user-driven) simulation environment, as well as anexecution engine run from another Java application. As a final outcome, the processing unit provides theAsynchrony Log, which is the input for the Visual and Auditory Display. A single netbook can support upto a few tens of motes, via a wireless communication protocol based on Bluetooth. In particular, we useda total of four motes, one for each rower (as in the experiment, rowers used one oar each). In general,we can support a number of motes higher than the number of rowers.
6. Experimental Studies
The MARS research project got started by collaborating with a rowing team headed by a professionalcoach and comprising Olympic-level athletes. The current beta testing carried out with this team aimsat assessing the effectiveness of the system in recognizing a reliable asynchrony measure, helping anexperienced coach in his work. For this reason, a very expert coach has been chosen, so as to havereliable feedback. In this section, we report on experiments carried out to perform a check of the accuracyand repeatability of the MARS system. For such experiments, we involved a crew of four rowers: anovice, named Cyan(C), and three intermediate-level rowers, named Red (R), Blue (B) and Green (G).For each considered run, we made an acquisition session, involving the use of the MARS system and aparallel video recording of the session, respectively. In all sessions, the sampling frequency has been setto 100 Hz. Table 2 shows the main features of the considered runs. Different types of runs have beenconsidered, in order to test the system on a variety of conditions. Each session is divided into observationslices. An observation slice is a temporal window of some seconds in which the coach expresses a levelof asynchrony by observing rowers with the naked eye, namely, watching the video (possibly in slowmotion) without using the MARS system. There are three possible levels of asynchrony that can beexpressed: Low (L), Medium (M) and High (H).
For each session, the local (online) asynchrony has been processed, by using ∆ = 2,000. Trainingand testing data are separated in the validation. More specifically, session A has been used as the tuning(training) session, whereas the other sessions are used for testing. Hence, during the first session, the
Sensors 2013, 13 12238
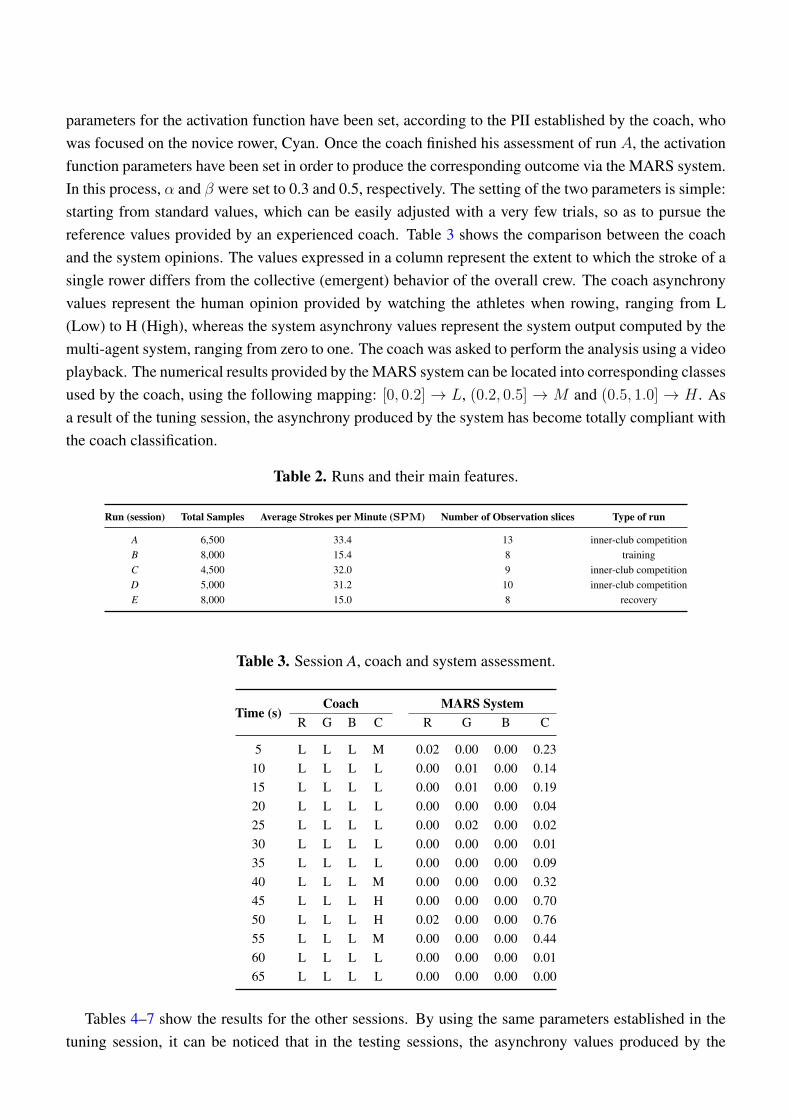
parameters for the activation function have been set, according to the PII established by the coach, whowas focused on the novice rower, Cyan. Once the coach finished his assessment of run A, the activationfunction parameters have been set in order to produce the corresponding outcome via the MARS system.In this process, α and β were set to 0.3 and 0.5, respectively. The setting of the two parameters is simple:starting from standard values, which can be easily adjusted with a very few trials, so as to pursue thereference values provided by an experienced coach. Table 3 shows the comparison between the coachand the system opinions. The values expressed in a column represent the extent to which the stroke of asingle rower differs from the collective (emergent) behavior of the overall crew. The coach asynchronyvalues represent the human opinion provided by watching the athletes when rowing, ranging from L(Low) to H (High), whereas the system asynchrony values represent the system output computed by themulti-agent system, ranging from zero to one. The coach was asked to perform the analysis using a videoplayback. The numerical results provided by the MARS system can be located into corresponding classesused by the coach, using the following mapping: [0, 0.2] → L, (0.2, 0.5] → M and (0.5, 1.0] → H . Asa result of the tuning session, the asynchrony produced by the system has become totally compliant withthe coach classification.
Table 2. Runs and their main features.
Run (session) Total Samples Average Strokes per Minute (SPM) Number of Observation slices Type of run
A 6,500 33.4 13 inner-club competitionB 8,000 15.4 8 trainingC 4,500 32.0 9 inner-club competitionD 5,000 31.2 10 inner-club competitionE 8,000 15.0 8 recovery
Table 3. Session A, coach and system assessment.
Time (s)Coach MARS System
R G B C R G B C
5 L L L M 0.02 0.00 0.00 0.2310 L L L L 0.00 0.01 0.00 0.1415 L L L L 0.00 0.01 0.00 0.1920 L L L L 0.00 0.00 0.00 0.0425 L L L L 0.00 0.02 0.00 0.0230 L L L L 0.00 0.00 0.00 0.0135 L L L L 0.00 0.00 0.00 0.0940 L L L M 0.00 0.00 0.00 0.3245 L L L H 0.00 0.00 0.00 0.7050 L L L H 0.02 0.00 0.00 0.7655 L L L M 0.00 0.00 0.00 0.4460 L L L L 0.00 0.00 0.00 0.0165 L L L L 0.00 0.00 0.00 0.00
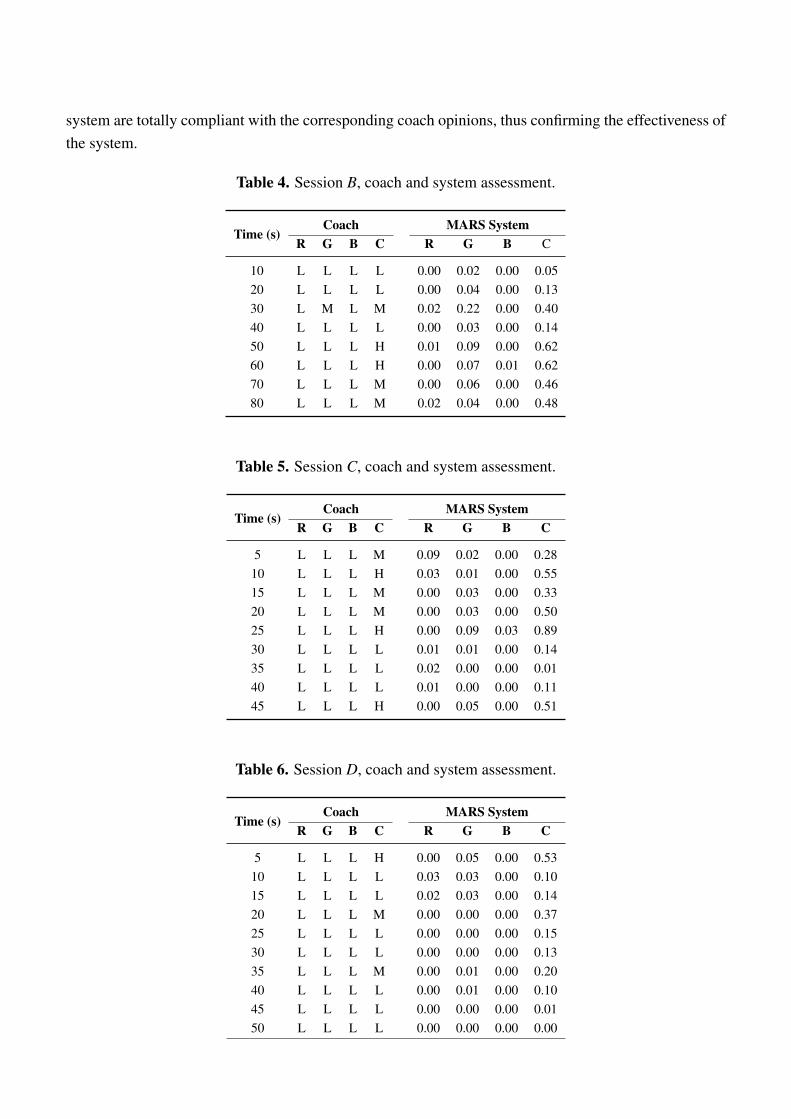
Tables 4–7 show the results for the other sessions. By using the same parameters established in thetuning session, it can be noticed that in the testing sessions, the asynchrony values produced by the
Sensors 2013, 13 12239
system are totally compliant with the corresponding coach opinions, thus confirming the effectiveness ofthe system.
Table 4. Session B, coach and system assessment.
Time (s)Coach MARS System
R G B C R G B C
10 L L L L 0.00 0.02 0.00 0.0520 L L L L 0.00 0.04 0.00 0.1330 L M L M 0.02 0.22 0.00 0.4040 L L L L 0.00 0.03 0.00 0.1450 L L L H 0.01 0.09 0.00 0.6260 L L L H 0.00 0.07 0.01 0.6270 L L L M 0.00 0.06 0.00 0.4680 L L L M 0.02 0.04 0.00 0.48
Table 5. Session C, coach and system assessment.
Time (s)Coach MARS System
R G B C R G B C
5 L L L M 0.09 0.02 0.00 0.2810 L L L H 0.03 0.01 0.00 0.5515 L L L M 0.00 0.03 0.00 0.3320 L L L M 0.00 0.03 0.00 0.5025 L L L H 0.00 0.09 0.03 0.8930 L L L L 0.01 0.01 0.00 0.1435 L L L L 0.02 0.00 0.00 0.0140 L L L L 0.01 0.00 0.00 0.1145 L L L H 0.00 0.05 0.00 0.51
Table 6. Session D, coach and system assessment.
Time (s)Coach MARS System
R G B C R G B C
5 L L L H 0.00 0.05 0.00 0.5310 L L L L 0.03 0.03 0.00 0.1015 L L L L 0.02 0.03 0.00 0.1420 L L L M 0.00 0.00 0.00 0.3725 L L L L 0.00 0.00 0.00 0.1530 L L L L 0.00 0.00 0.00 0.1335 L L L M 0.00 0.01 0.00 0.2040 L L L L 0.00 0.01 0.00 0.1045 L L L L 0.00 0.00 0.00 0.0150 L L L L 0.00 0.00 0.00 0.00
Sensors 2013, 13 12240
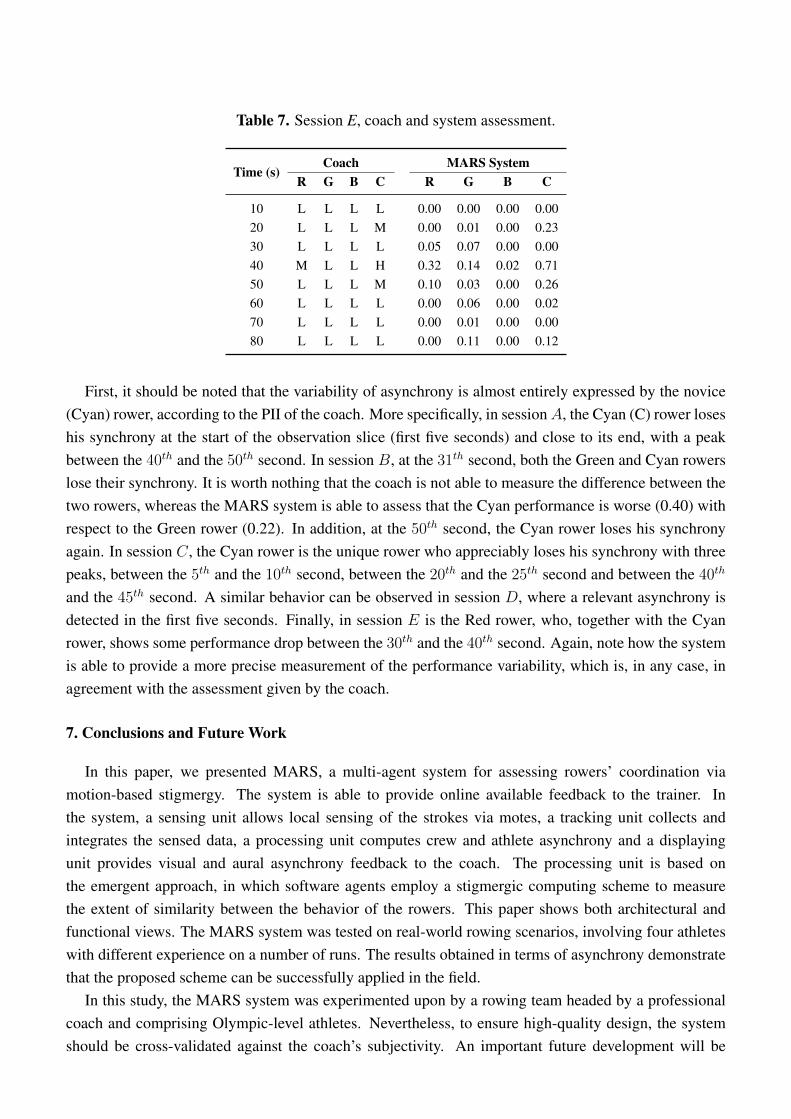
Table 7. Session E, coach and system assessment.
Time (s)Coach MARS System
R G B C R G B C
10 L L L L 0.00 0.00 0.00 0.0020 L L L M 0.00 0.01 0.00 0.2330 L L L L 0.05 0.07 0.00 0.0040 M L L H 0.32 0.14 0.02 0.7150 L L L M 0.10 0.03 0.00 0.2660 L L L L 0.00 0.06 0.00 0.0270 L L L L 0.00 0.01 0.00 0.0080 L L L L 0.00 0.11 0.00 0.12
First, it should be noted that the variability of asynchrony is almost entirely expressed by the novice(Cyan) rower, according to the PII of the coach. More specifically, in sessionA, the Cyan (C) rower loseshis synchrony at the start of the observation slice (first five seconds) and close to its end, with a peakbetween the 40th and the 50th second. In session B, at the 31th second, both the Green and Cyan rowerslose their synchrony. It is worth nothing that the coach is not able to measure the difference between thetwo rowers, whereas the MARS system is able to assess that the Cyan performance is worse (0.40) withrespect to the Green rower (0.22). In addition, at the 50th second, the Cyan rower loses his synchronyagain. In session C, the Cyan rower is the unique rower who appreciably loses his synchrony with threepeaks, between the 5th and the 10th second, between the 20th and the 25th second and between the 40th
and the 45th second. A similar behavior can be observed in session D, where a relevant asynchrony isdetected in the first five seconds. Finally, in session E is the Red rower, who, together with the Cyanrower, shows some performance drop between the 30th and the 40th second. Again, note how the systemis able to provide a more precise measurement of the performance variability, which is, in any case, inagreement with the assessment given by the coach.
7. Conclusions and Future Work
In this paper, we presented MARS, a multi-agent system for assessing rowers’ coordination viamotion-based stigmergy. The system is able to provide online available feedback to the trainer. Inthe system, a sensing unit allows local sensing of the strokes via motes, a tracking unit collects andintegrates the sensed data, a processing unit computes crew and athlete asynchrony and a displayingunit provides visual and aural asynchrony feedback to the coach. The processing unit is based onthe emergent approach, in which software agents employ a stigmergic computing scheme to measurethe extent of similarity between the behavior of the rowers. This paper shows both architectural andfunctional views. The MARS system was tested on real-world rowing scenarios, involving four athleteswith different experience on a number of runs. The results obtained in terms of asynchrony demonstratethat the proposed scheme can be successfully applied in the field.
In this study, the MARS system was experimented upon by a rowing team headed by a professionalcoach and comprising Olympic-level athletes. Nevertheless, to ensure high-quality design, the systemshould be cross-validated against the coach’s subjectivity. An important future development will be
Sensors 2013, 13 12241
the recruitment of other experienced coaches and rowing teams for enabling a robust expert-drivenvalidation. Moreover, as future work, we aim at designing a self-tuning module for the parametersthat need a manual setting. We will also experiment with new sonification methods based on earcons,musical or vocal motifs/sounds that humans use to improve the aural display of the system.
Acknowledgments
The authors would like to thank Kyle J. Lauersen for critical editing of the manuscript.
Conflicts of Interest
The authors declare no conflict of interest.
References
1. Baudouin, A.; Hawkins, D. Investigation of biomechanical factors affecting rowing performance.J. Biomech. 2004, 37, 969–976.
2. Fok, C.L.; Balasubramanian, D.; Tamola, M.; Lu, C. TinyCoxswain: Using a Sensor Networkto Enhance Crew Performance; Technical Report; Washington University in St. Louis School ofEngineering & Applied Science, Department of Computer Science & Engineering: St. Louis, MO,USA, 2004.
3. Concept2. e-Row User’s Guide; Concept2, Inc.: Morrisville, VT, USA, 2013.4. Mpimis, A.; Gikas, V. Monitoring and evaluation of rowing performance using mobile mapping
data. Arch. Photogramm. Cartogr. Remote Sens. 2011, 22, 337–349.5. Cirmirakis, D.; Pollard, J. Rowing Optimisation. In Proceedings of the IEEE International
Workshop on Intelligent Data Acquisition and Advanced Computing Systems: Technology andApplications (IDAACS 2009), Cosenza, Italy, 21–23 September 2009; pp. 159–161.
6. Kleshnev, V. Rowing Biomechanics: Technology and Technique; Technical Report; Biorow Ltd.:Slough, Berkshire, UK, 2004.
7. Yick, J.; Mukherjee, B.; Ghosal, D. Wireless sensor network survey. Comput. Netw. 2008, 52,2292–2330.
8. Abbate, S.; Avvenuti, M.; Light, J. MIMS: A minimally invasive monitoring sensor platform. IEEESens. J. 2012, 12, 677–684.
9. Abbate, S.; Avvenuti, M.; Bonatesta, F.; Cola, G.; Corsini, P.; Vecchio, A. A smartphone-based falldetection system. Pervasive Mob. Comput. 2012, 8, 883–899.
10. Fortino, G.; Gravina, R.; Guerrieri, A. Agent-oriented Integration of Body Sensor Networks andBuilding Sensor Networks. In Proceedings of the 2012 Federated Conference on Computer Scienceand Information Systems, (FedCSIS), Wrocław, Poland, 9–12 September 2012; pp. 1207–1214.
11. Patel, R.; Jain, D. A Multiagent System for Distributed Sensor Networks. In Proceedings of theInternational Conference on Advances in Computing, Control, Telecommunication Technologies(ACT’09), Trivandrum, Kerala, India, 28–29 December 2009; pp. 823–826.
Sensors 2013, 13 12242
12. Rajkovic, Z.M.; Ilic, D.B.; Mrdakovic, V.D.; Mitrovic, D.M.; Jankovic, N.N. Evaluation of learningrowing technique in a twelve-oared school boat gallery. Facta Univ. Series Phys. Educ. Sport 2011,9, 329–347.
13. Llosa, J.; Vilajosana, I.; Vilajosana, X.; Navarro, N.; Surinach, E.; Marques, J.M. REMOTE,a wireless sensor network based system to monitor rowing performance. Sensors 2009, 9,7069–7082.
14. Bettinelli, S.; Placido, A.; Susmel, L.; Tovo, R. An integrated data acquisition system for on-watermeasurement of performance in rowing. Strain 2010, 46, 493–509.
15. Dubus, G. Evaluation of four models for the sonification of elite rowing. J. Multimodal UserInterfaces 2012, 5, 143–156.
16. Vernon, D.; Metta, G.; Sandini, G. A survey of artificial cognitive systems: Implications for theautonomous development of mental capabilities in computational agents. Trans. Evol. Comput.2007, 11, 151–180.
17. Heylighen, F.; Gershenson, C. The meaning of self-organization in computing. IEEE Intell. Syst.Section Trends Controv. Self-Organ. Inf. Syst. 2003, 18, 72–75.
18. Barron, P. Using Stigmergy to Build Pervasive Computing Environments. Ph.D. Thesis, Universityof Dublin, Trinity College, Dublin, Ireland, 2005.
19. Cimino, M.G.C.A.; Marcelloni, F. Autonomic tracing of production processes with mobile andagent-based computing. Inf. Sci. 2011, 181, 935–953.
20. Rao, V.S. Multi-agent distributed data mining: An overview. Int. J. Rev. Comput. 2010, 3, 83–92.21. Van Dyke Parunak, H. A Survey of Environments and Mechanisms for Human-Human Stigmergy.
In Environments for Multi-Agent Systems II; Weyns, D., Dyke Parunak, H., Michel, F., Eds.;Springer: Berlin/Heidelberg, Germany, 2006; Volume 3830, pp. 163–186.
22. Shi, K.; Qin, X. Stigmergy Based Autonomous Shop Floor Control with Wireless Sensor Networks.In Proceedings of the 2011 9th IEEE International Conference on Industrial Informatics (INDIN),Caparica, Lisbon, Portugal, 26–29 July 2011; pp. 375–380.
23. Karuna, H.; Valckenaers, P.; Kollingbaum, M.; van Brussel, H. Multi-agent coordination andcontrol using stigmergy. Comput. Ind. 2004, 53, 75–96.
24. Castellano, G.; Cimino, M.G.C.A.; Fanelli, A.M.; Lazzerini, B.; Marcelloni, F.; Torsello, M.A.A collaborative situation-aware scheme based on an emergent paradigm for mobile resourcerecommenders. J. Ambient Intell. Hum. Comput. 2013, 4, 421–437.
25. Mattes, K.; Schaffert, N. A new measuring and on water coaching device for rowing. J. Hum.Sport Exerc. Univ. Alicant. 2010, 5, 226–239.
26. Tessendorf, B.; Gravenhorst, F.; Arnrich, B.; Troster, G. An IMU-based Sensor Network toContinuously Monitor Rowing Technique on the Water. In Proceedings of the 2011 SeventhInternational Conference on Intelligent Sensors, Sensor Networks and Information Processing,(ISSNIP), Melbourne, Australia, 6–9 December 2011; pp. 253–258.
27. Schaffert, N.; Mattes, K. Acoustic Feedback Training in Adaptive Rowing. In Proceedings of the18th International Conference on Auditory Display (ICAD2012), Atlanta, GA, USA, 18–22 June2012; pp. 83–88.

Sensors 2013, 13 12243
28. Avvenuti, M.; Casella, A.; Cesarini, D. Using gait symmetry to virtually align a triaxialaccelerometer during running and walking. Electron. Lett. 2013, 49, 120–121.
29. McGookin, D.; Brewster, S. Earcons. In The Sonification Handbook; Hermann, T., Hunt, A.,Neuhoff, J.G., Eds.; Logos Publishing House: Berlin, Germany, 2011; Chapter 14, pp. 339–361.
30. Pedrycz, W. Knowledge-Based Clustering: From Data to Information Granules; John Wiley &Sons, Inc.: Hoboken, NJ, USA, 2005.
31. Pedrycz, W.; Gacek, A. Temporal granulation and its application to signal analysis. Inf. Sci. 2002,143, 47–71.
32. Dombois, F.; Eckel, G. Audification. In The Sonification Handbook; Hermann, T., Hunt, A.,Neuhoff, J.G., Eds.; Logos Publishing House: Berlin, Germany, 2011; Chapter 12, pp. 301–324.
c© 2013 by the authors; licensee MDPI, Basel, Switzerland. This article is an open access articledistributed under the terms and conditions of the Creative Commons Attribution license(http://creativecommons.org/licenses/by/3.0/).