Sensitivity of Initial Abstraction Coefficient on Prediction of...
9
IJSRST151548 | Received: 26 December 2015 | Accepted: 31 December 2015 | November-December 2015 [(1)5: 213-221] © 2015 IJSRST | Volume 1 | Issue 5 | Print ISSN: 2395-6011 | Online ISSN: 2395-602X Themed Section: Science and Technology 213 Sensitivity of Initial Abstraction Coefficient on Prediction of Rainfall- Runoff for Various Land Cover Classes of ‘Ton Watershed’ Using Remote Sensing & GIS Based ‘Rinspe’ Model Narasayya Kamuju Central Water and Power Research Station, Pune, Maharashtra, India ABSTRACT Rainfall, Runoff, Infiltration are most important parameters in water balance equation of any hydrological problems. Among these parameters the real prediction of surface runoff is the crucial task. Many hydrologic models are available to estimate surface runoff from precipitation data. The development of a GIS based model that would make it possible to assess the surface runoff accurately and efficiently. On the basis of this requirement a model called „Runoff, Infiltration and Nonpoint Source Pollution Estimation‟ (RINSPE) was developed for estimating runoff, infiltration and nonpoint source pollution in the Ton river catchment based on the different land cover type distribution within the catchment. The Curve Number method for estimating direct runoff from rainstorms is now widely used in engineering design, post-event appraisals, and environmental impact estimation. In the present investigation the Initial Abstraction coefficient in the Curve Number method considered with 2 different scenarios by assuming „λ‟ value as 0.2 for general conditions and 0.3 for Indian conditions to run RINSPE model. The results reveal that the surface runoff of 860.79 mm occurred with a loss of 62.93 mm in the form of infiltration for scenarios: 1. The most occupied area in the Ton watershed is forest which is having a runoff of 656 mm with 124mm infiltration and a very slight variation in prediction of runoff and infiltration for scenario: 2 for the same land cover classes. In the present study the results reveals that „λ‟ value is 0.2 of I a gave minute higher runoff values than „λ‟ value with 0.3. This experimental investigation makes sure that, higher the initial abstraction lowers the runoff and vice versa. Keywords: RINSPE, Initial Abstarction, precipitation, Runoff, Soil texture, Initial Loss I. INTRODUCTION Runoff is what occurs when rain is not absorbed by the ground on which it falls and so then flows downhill. The most important factor in determining the quantity of runoff that will result from a given storm event is the percent imperviousness of the land cover. Other factors include soil infiltration properties, topography, vegetative cover, and prevailing site conditions [11]. Oceans make up 71% of the Earth's surface and the solar radiation received here powers the global evaporation process. In fact, 86% of the Earth's evaporation occurs over the oceans, while only 14% occurs over land. Of the total amount of water evaporated into the atmosphere, precipitation returns only 79% to the oceans and 21% to the land. Surface runoff sends 7% of the land based precipitation back to the ocean to balance the processes of evaporation and precipitation [6]. The rate of runoff flow depends on the ratio of rainfall intensity to the infiltration rate. If the infiltration rate is relatively low, such as when a soil is crusted or compacted, and the rainfall intensity is high, then the runoff rate will also be high. Infiltration is the initial process of water entering the soil at the ground surface from precipitation or anthropogenic sources, which plays a major role in runoff [12]. Infiltration is a direct loss that governs the volume and rate of runoff, and thus it controls the shape of the runoff hydrograph [10]. Infiltration depends on the type of land use, soil type (texture class), vegetative cover, porosity and hydraulic conductivity, degree of
Transcript of Sensitivity of Initial Abstraction Coefficient on Prediction of...
IJSRST151548 | Received: 26 December 2015 | Accepted: 31 December 2015 | November-December 2015 [(1)5: 213-221]
© 2015 IJSRST | Volume 1 | Issue 5 | Print ISSN: 2395-6011 | Online ISSN: 2395-602X Themed Section: Science and Technology
213
Sensitivity of Initial Abstraction Coefficient on Prediction of Rainfall-
Runoff for Various Land Cover Classes of ‘Ton Watershed’ Using Remote
Sensing & GIS Based ‘Rinspe’ Model Narasayya Kamuju
Central Water and Power Research Station, Pune, Maharashtra, India
ABSTRACT
Rainfall, Runoff, Infiltration are most important parameters in water balance equation of any hydrological problems.
Among these parameters the real prediction of surface runoff is the crucial task. Many hydrologic models are
available to estimate surface runoff from precipitation data. The development of a GIS based model that would
make it possible to assess the surface runoff accurately and efficiently. On the basis of this requirement a model
called „Runoff, Infiltration and Nonpoint Source Pollution Estimation‟ (RINSPE) was developed for estimating
runoff, infiltration and nonpoint source pollution in the Ton river catchment based on the different land cover type
distribution within the catchment. The Curve Number method for estimating direct runoff from rainstorms is now
widely used in engineering design, post-event appraisals, and environmental impact estimation. In the present
investigation the Initial Abstraction coefficient in the Curve Number method considered with 2 different scenarios
by assuming „λ‟ value as 0.2 for general conditions and 0.3 for Indian conditions to run RINSPE model. The results
reveal that the surface runoff of 860.79 mm occurred with a loss of 62.93 mm in the form of infiltration for
scenarios: 1. The most occupied area in the Ton watershed is forest which is having a runoff of 656 mm with
124mm infiltration and a very slight variation in prediction of runoff and infiltration for scenario: 2 for the same
land cover classes. In the present study the results reveals that „λ‟ value is 0.2 of Ia gave minute higher runoff values
than „λ‟ value with 0.3. This experimental investigation makes sure that, higher the initial abstraction lowers the
runoff and vice versa.
Keywords: RINSPE, Initial Abstarction, precipitation, Runoff, Soil texture, Initial Loss
I. INTRODUCTION
Runoff is what occurs when rain is not absorbed by the
ground on which it falls and so then flows downhill. The
most important factor in determining the quantity of
runoff that will result from a given storm event is the
percent imperviousness of the land cover. Other factors
include soil infiltration properties, topography,
vegetative cover, and prevailing site conditions [11].
Oceans make up 71% of the Earth's surface and the solar
radiation received here powers the global evaporation
process. In fact, 86% of the Earth's evaporation occurs
over the oceans, while only 14% occurs over land. Of
the total amount of water evaporated into the atmosphere,
precipitation returns only 79% to the oceans and 21% to
the land. Surface runoff sends 7% of the land based
precipitation back to the ocean to balance the processes
of evaporation and precipitation [6]. The rate of runoff
flow depends on the ratio of rainfall intensity to the
infiltration rate. If the infiltration rate is relatively low,
such as when a soil is crusted or compacted, and the
rainfall intensity is high, then the runoff rate will also be
high. Infiltration is the initial process of water entering
the soil at the ground surface from precipitation or
anthropogenic sources, which plays a major role in
runoff [12]. Infiltration is a direct loss that governs the
volume and rate of runoff, and thus it controls the shape
of the runoff hydrograph [10]. Infiltration depends on
the type of land use, soil type (texture class), vegetative
cover, porosity and hydraulic conductivity, degree of
International Journal of Scientific Research in Science and Technology (www.ijsrst.com)
214
soil saturation, soil stratification, drainage conditions,
depth to water table, and intensity and volume of rainfall.
The amount of rainwater that runs off during /
immediately after a rainfall event depends heavily on the
amount of rainfall, „initial abstraction‟, and the type and
condition of ground it lands on.
Development of a GIS based runoff model is a
challenging task because of the complexities involved in
the urban set up. However attempts were made in
Birmingham, UK to develop GIS models for estimating
direct or precipitation recharge, indirect recharge
through seepage from surface water bodies, indirect
recharge through mains leaks and indirect recharge
through sewer leaks in a city on a regional scale [7],[8]
and the same approach was used in the development of
this model as applied to the Western Cape‟s Kuils-Eerste
river catchment in South Africa.
In this project, GIS based model namely „Runoff
Infiltration and Nonpoint Source Pollution Estimation‟
(RINSPE) for estimating runoff and infiltration from
various land use/ land cover types was developed for an
urbanised and agricultural catchment. The model was
developed taking into consideration that the model
needed to be sophisticated enough to account for the
routing of all precipitation in the form of surface runoff,
infiltration and pollution loading. In order to estimate
these parameters, some suitable method for estimating
the areal distribution of rainfall losses through
infiltration and runoff had to be chosen first in designing
the model [9].
Notwithstanding this, there are other possible models
that can be adopted and include the following: i) the
rational method, ii) SCS CN method, iii) Horton‟s model
for infiltration capacity, and iv) Green-Ampt infiltration
model etc [5]. After considering various available
methods for infiltration and runoff estimation, the
United States Department of Agriculture, Soil
Conservation Service (SCS, now known as the Natural
Resources Conservation Service, or NRCS) Runoff
Curve Number (CN) method was chosen.
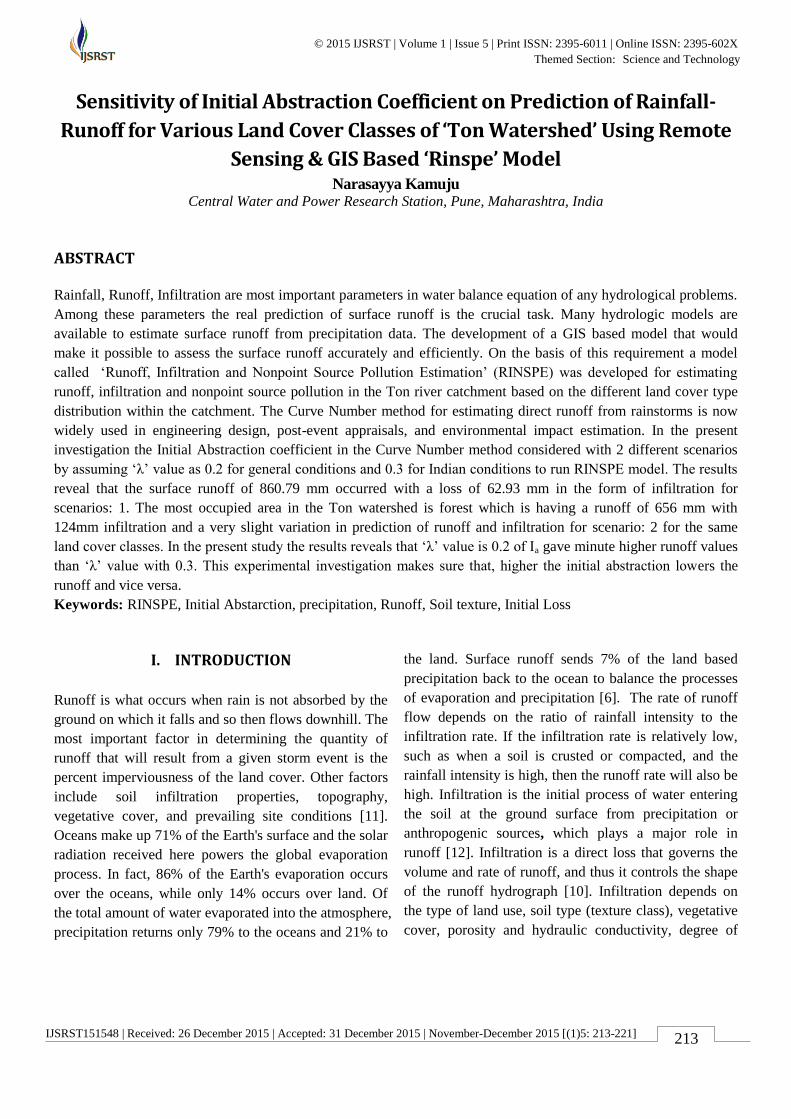
A. Study Area
The study area is located in the western part of Doon
valley, Dehradun district and Uttarakhand state in India.
The sub-watershed „Ton Watershed‟, which is a Sub-
basin in „Asan‟ watershed, is selected to run the RINSPE
model. The Ton watershed is upper part of Asan River,
which is called as Ton river in earlier days of the local
people [2]. The Asan river is tributary of Yamuna River.
Geographical location of the study area covers a total of
approximately 150 km2 and lies between 77
o45‟33” and
77o57‟46”and 30
o24‟39” and 30
o29‟05” as shown in
Fig.1. The study area having large area under hilly tract.
The climate is humid to sub-tropical varying from valley
to the high mountain ranges of Himalayas. During rainy
season 1625 mm rainfall is observed in the year. The
area has a favourable climate for the growth of abundant
vegetation due to reasonably good rainfall & elevation
Dense & moderate mixed forest, shrubs, agriculture
crops. Soils of the study area are found to be derived
from alluvium parent material. These were observed,
well to excessively drain with low to medium
permeability and having texture sandy loam to clay loam
with low to medium productivity.
Figure 1: Location Map of Ton Watershed
B. Data Required
GIS based runoff and infiltration estimation using the
NRCS Curve Number method normally requires the
spatial inputs such as land use / land cover map, soil
type/hydrologic soil group map, rainfall distribution map
and values of initial abstraction or initial losses for each
type of land use / land cover with attributes of specific
group types and group codes. The preparation of each
map is described in detail as fallows.
International Journal of Scientific Research in Science and Technology (www.ijsrst.com)
215
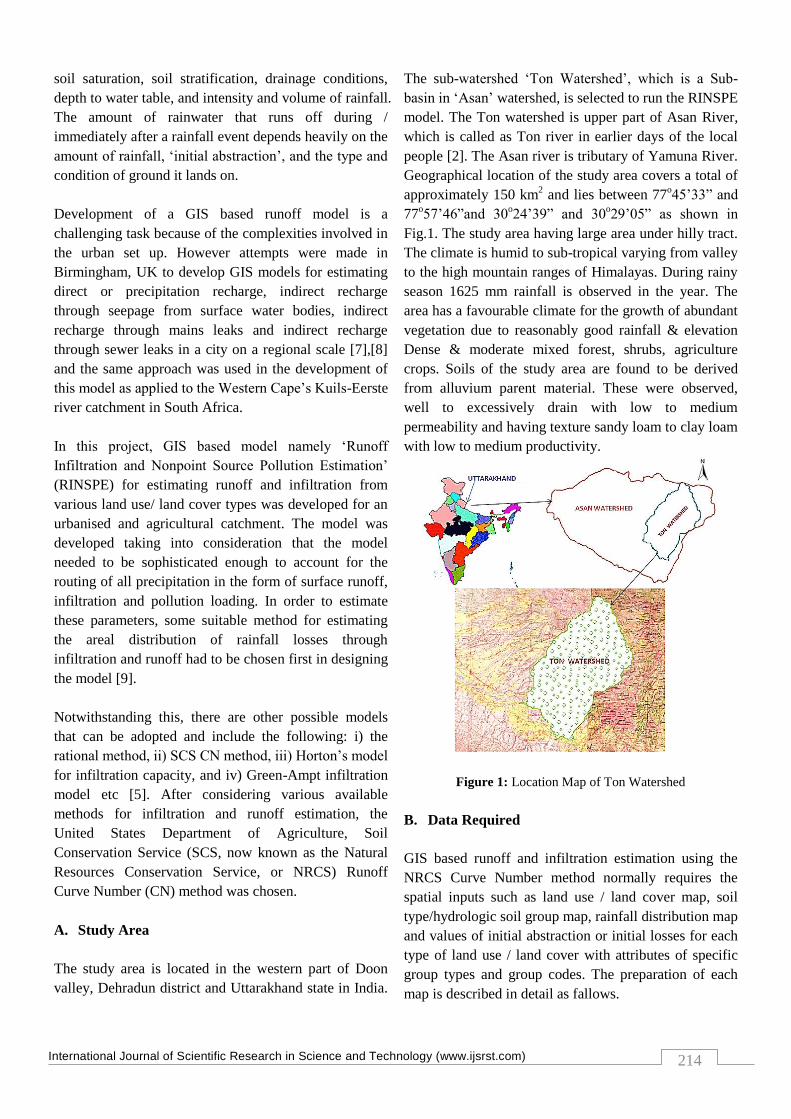
i. Preparation of Land Use/Land Cover Map:
A Landsat TM satellite image acquired on 14 Nov 2004
was downloaded from website to prepare land cover
classes grid map. There are 7 basic classes are identified
under „supervised classification‟ with ground truth data
in Ton watershed as shown in Fig.2. The basic classes
are Agricultural crops, Fallow, Forest, Scrubland,
Settlements, Dry river bed, water and Tea gardens. The
highest land cover class of 94.27 km2 area covered under
forest land. The lowest area of 0.01 km2
covered under
water body. Agricultural crops covered an area of 2.89
km2, fallow land covered 6.27 km
2 area, settlements
covered an area of 3.78 km2 and scrub, dry river bed,
and Tea Gardens covered 35.54, 4.70, 2.68 km2 area
respectively.
Figure 2: Land use –Land Cover Classification of Ton
Watershed
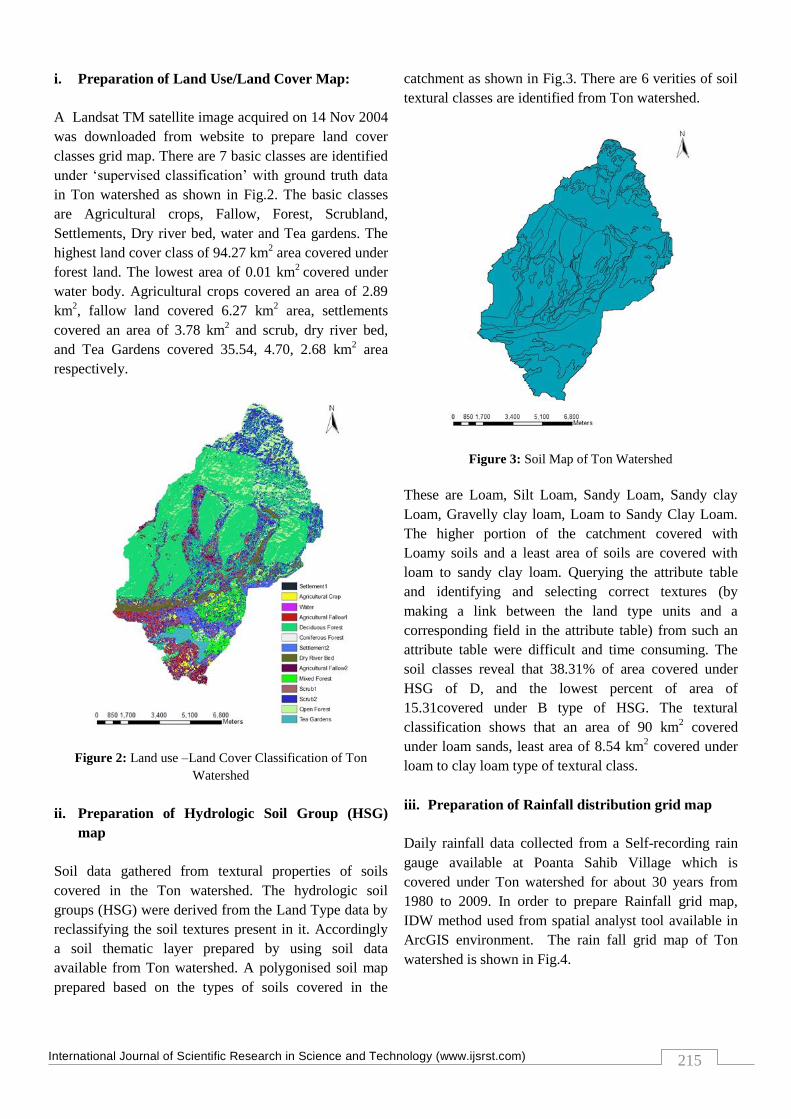
ii. Preparation of Hydrologic Soil Group (HSG)
map
Soil data gathered from textural properties of soils
covered in the Ton watershed. The hydrologic soil
groups (HSG) were derived from the Land Type data by
reclassifying the soil textures present in it. Accordingly
a soil thematic layer prepared by using soil data
available from Ton watershed. A polygonised soil map
prepared based on the types of soils covered in the
catchment as shown in Fig.3. There are 6 verities of soil
textural classes are identified from Ton watershed.
Figure 3: Soil Map of Ton Watershed
These are Loam, Silt Loam, Sandy Loam, Sandy clay
Loam, Gravelly clay loam, Loam to Sandy Clay Loam.
The higher portion of the catchment covered with
Loamy soils and a least area of soils are covered with
loam to sandy clay loam. Querying the attribute table
and identifying and selecting correct textures (by
making a link between the land type units and a
corresponding field in the attribute table) from such an
attribute table were difficult and time consuming. The
soil classes reveal that 38.31% of area covered under
HSG of D, and the lowest percent of area of
15.31covered under B type of HSG. The textural
classification shows that an area of 90 km2 covered
under loam sands, least area of 8.54 km2 covered under
loam to clay loam type of textural class.
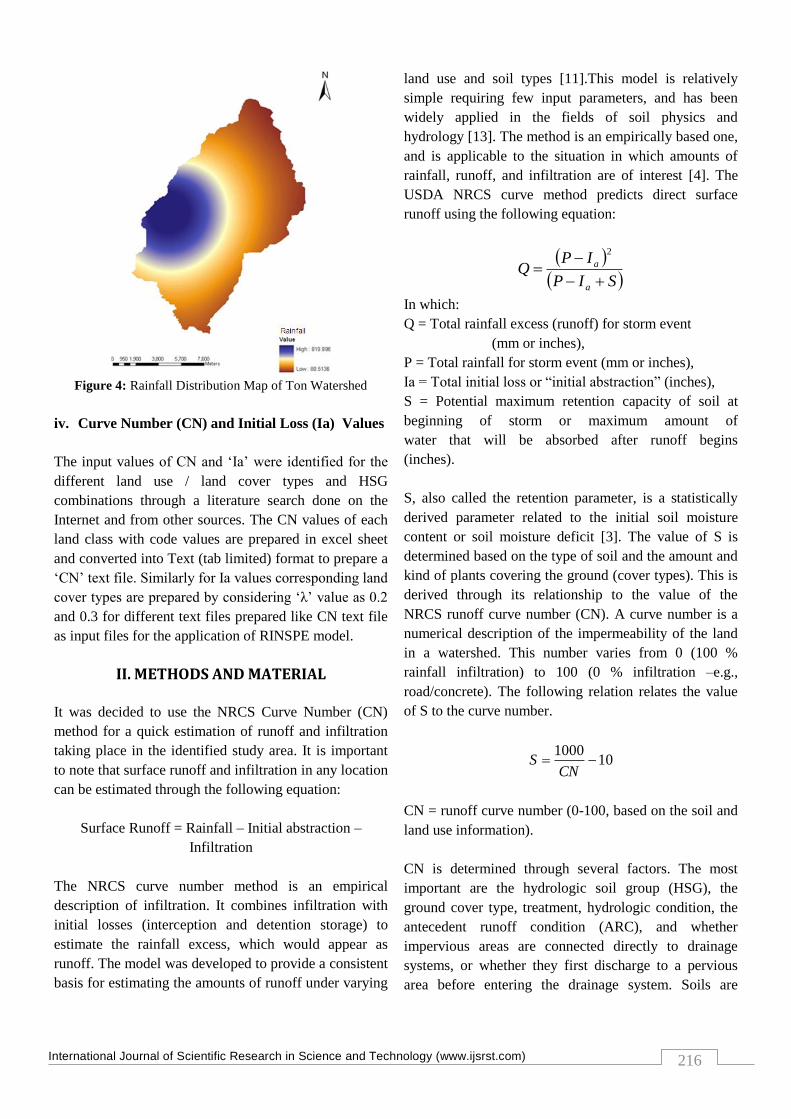
iii. Preparation of Rainfall distribution grid map
Daily rainfall data collected from a Self-recording rain
gauge available at Poanta Sahib Village which is
covered under Ton watershed for about 30 years from
1980 to 2009. In order to prepare Rainfall grid map,
IDW method used from spatial analyst tool available in
ArcGIS environment. The rain fall grid map of Ton
watershed is shown in Fig.4.
International Journal of Scientific Research in Science and Technology (www.ijsrst.com)
216
Figure 4: Rainfall Distribution Map of Ton Watershed
iv. Curve Number (CN) and Initial Loss (Ia) Values
The input values of CN and „Ia‟ were identified for the
different land use / land cover types and HSG
combinations through a literature search done on the
Internet and from other sources. The CN values of each
land class with code values are prepared in excel sheet
and converted into Text (tab limited) format to prepare a
„CN‟ text file. Similarly for Ia values corresponding land
cover types are prepared by considering „λ‟ value as 0.2
and 0.3 for different text files prepared like CN text file
as input files for the application of RINSPE model.
II. METHODS AND MATERIAL
It was decided to use the NRCS Curve Number (CN)
method for a quick estimation of runoff and infiltration
taking place in the identified study area. It is important
to note that surface runoff and infiltration in any location
can be estimated through the following equation:
Surface Runoff = Rainfall – Initial abstraction –
Infiltration
The NRCS curve number method is an empirical
description of infiltration. It combines infiltration with
initial losses (interception and detention storage) to
estimate the rainfall excess, which would appear as
runoff. The model was developed to provide a consistent
basis for estimating the amounts of runoff under varying
land use and soil types [11].This model is relatively
simple requiring few input parameters, and has been
widely applied in the fields of soil physics and
hydrology [13]. The method is an empirically based one,
and is applicable to the situation in which amounts of
rainfall, runoff, and infiltration are of interest [4]. The
USDA NRCS curve method predicts direct surface
runoff using the following equation:
SIP
IPQ
a
a
2
In which:
Q = Total rainfall excess (runoff) for storm event
(mm or inches),
P = Total rainfall for storm event (mm or inches),
Ia = Total initial loss or “initial abstraction” (inches),
S = Potential maximum retention capacity of soil at
beginning of storm or maximum amount of
water that will be absorbed after runoff begins
(inches).
S, also called the retention parameter, is a statistically
derived parameter related to the initial soil moisture
content or soil moisture deficit [3]. The value of S is
determined based on the type of soil and the amount and
kind of plants covering the ground (cover types). This is
derived through its relationship to the value of the
NRCS runoff curve number (CN). A curve number is a
numerical description of the impermeability of the land
in a watershed. This number varies from 0 (100 %
rainfall infiltration) to 100 (0 % infiltration –e.g.,
road/concrete). The following relation relates the value
of S to the curve number.
101000
CN
S
CN = runoff curve number (0-100, based on the soil and
land use information).
CN is determined through several factors. The most
important are the hydrologic soil group (HSG), the
ground cover type, treatment, hydrologic condition, the
antecedent runoff condition (ARC), and whether
impervious areas are connected directly to drainage
systems, or whether they first discharge to a pervious
area before entering the drainage system. Soils are
International Journal of Scientific Research in Science and Technology (www.ijsrst.com)
217
extremely important in determining the runoff curve
number. Soils are generally classified into four
Hydrological Soil Groups (HSG): A, B, C, and D,
according to how well the soil absorbs water after a
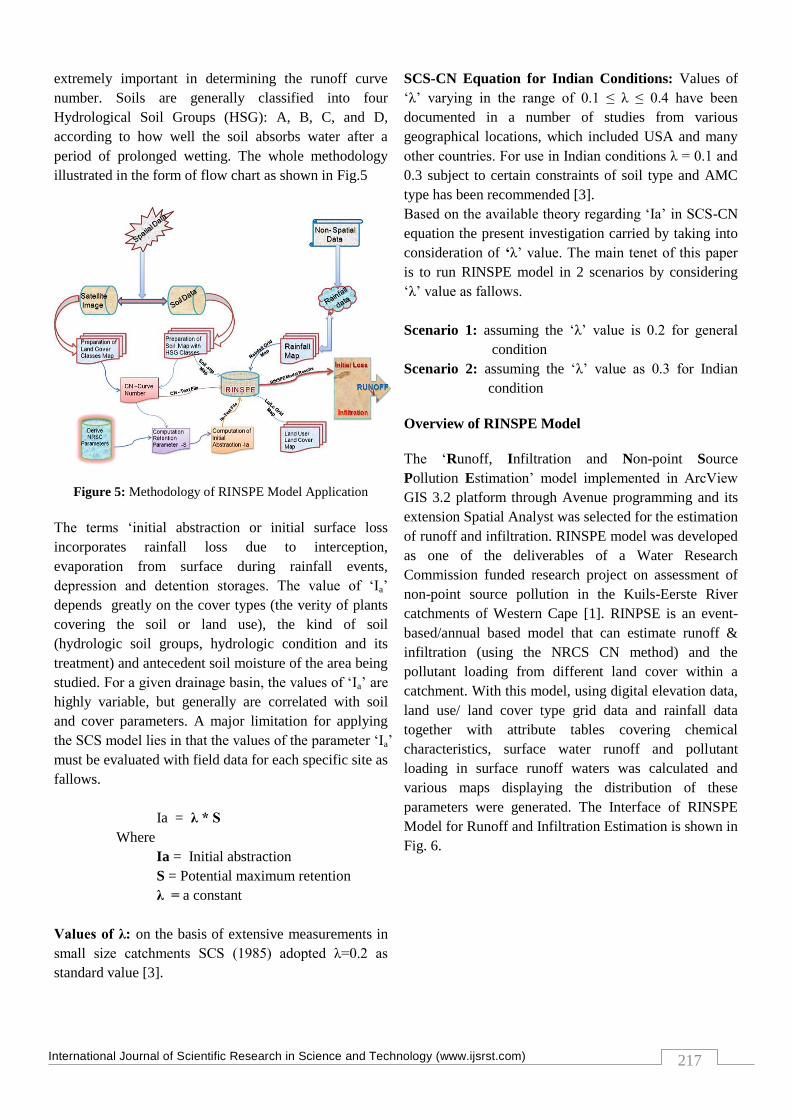
period of prolonged wetting. The whole methodology
illustrated in the form of flow chart as shown in Fig.5
Figure 5: Methodology of RINSPE Model Application
The terms „initial abstraction or initial surface loss
incorporates rainfall loss due to interception,
evaporation from surface during rainfall events,
depression and detention storages. The value of „Ia‟
depends greatly on the cover types (the verity of plants
covering the soil or land use), the kind of soil
(hydrologic soil groups, hydrologic condition and its
treatment) and antecedent soil moisture of the area being
studied. For a given drainage basin, the values of „Ia‟ are
highly variable, but generally are correlated with soil
and cover parameters. A major limitation for applying
the SCS model lies in that the values of the parameter „Ia‟
must be evaluated with field data for each specific site as
fallows.
Ia = λ * S
Where
Ia = Initial abstraction
S = Potential maximum retention
λ = a constant
Values of λ: on the basis of extensive measurements in
small size catchments SCS (1985) adopted λ=0.2 as
standard value [3].
SCS-CN Equation for Indian Conditions: Values of
„λ‟ varying in the range of 0.1 ≤ λ ≤ 0.4 have been
documented in a number of studies from various
geographical locations, which included USA and many
other countries. For use in Indian conditions λ = 0.1 and
0.3 subject to certain constraints of soil type and AMC
type has been recommended [3].
Based on the available theory regarding „Ia‟ in SCS-CN
equation the present investigation carried by taking into
consideration of ‘λ‟ value. The main tenet of this paper
is to run RINSPE model in 2 scenarios by considering
„λ‟ value as fallows.
Scenario 1: assuming the „λ‟ value is 0.2 for general
condition
Scenario 2: assuming the „λ‟ value as 0.3 for Indian
condition
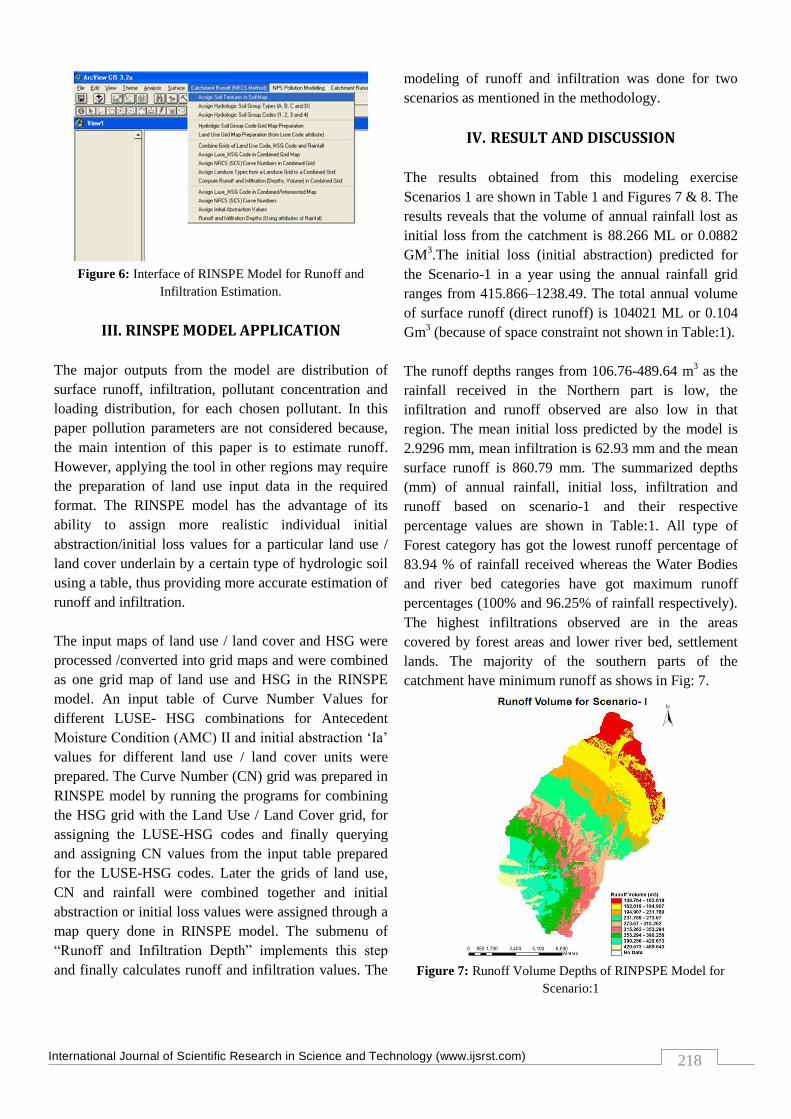
Overview of RINSPE Model
The „Runoff, Infiltration and Non-point Source
Pollution Estimation‟ model implemented in ArcView
GIS 3.2 platform through Avenue programming and its
extension Spatial Analyst was selected for the estimation
of runoff and infiltration. RINSPE model was developed
as one of the deliverables of a Water Research
Commission funded research project on assessment of
non-point source pollution in the Kuils-Eerste River
catchments of Western Cape [1]. RINPSE is an event-
based/annual based model that can estimate runoff &
infiltration (using the NRCS CN method) and the
pollutant loading from different land cover within a
catchment. With this model, using digital elevation data,
land use/ land cover type grid data and rainfall data
together with attribute tables covering chemical
characteristics, surface water runoff and pollutant
loading in surface runoff waters was calculated and
various maps displaying the distribution of these
parameters were generated. The Interface of RINSPE
Model for Runoff and Infiltration Estimation is shown in
Fig. 6.
International Journal of Scientific Research in Science and Technology (www.ijsrst.com)
218
Figure 6: Interface of RINSPE Model for Runoff and
Infiltration Estimation.
III. RINSPE MODEL APPLICATION
The major outputs from the model are distribution of
surface runoff, infiltration, pollutant concentration and
loading distribution, for each chosen pollutant. In this
paper pollution parameters are not considered because,
the main intention of this paper is to estimate runoff.
However, applying the tool in other regions may require
the preparation of land use input data in the required
format. The RINSPE model has the advantage of its
ability to assign more realistic individual initial
abstraction/initial loss values for a particular land use /
land cover underlain by a certain type of hydrologic soil
using a table, thus providing more accurate estimation of
runoff and infiltration.
The input maps of land use / land cover and HSG were
processed /converted into grid maps and were combined
as one grid map of land use and HSG in the RINSPE
model. An input table of Curve Number Values for
different LUSE- HSG combinations for Antecedent
Moisture Condition (AMC) II and initial abstraction „Ia‟
values for different land use / land cover units were
prepared. The Curve Number (CN) grid was prepared in
RINSPE model by running the programs for combining
the HSG grid with the Land Use / Land Cover grid, for
assigning the LUSE-HSG codes and finally querying
and assigning CN values from the input table prepared
for the LUSE-HSG codes. Later the grids of land use,
CN and rainfall were combined together and initial
abstraction or initial loss values were assigned through a
map query done in RINSPE model. The submenu of
“Runoff and Infiltration Depth” implements this step
and finally calculates runoff and infiltration values. The
modeling of runoff and infiltration was done for two
scenarios as mentioned in the methodology.
IV. RESULT AND DISCUSSION
The results obtained from this modeling exercise
Scenarios 1 are shown in Table 1 and Figures 7 & 8. The
results reveals that the volume of annual rainfall lost as
initial loss from the catchment is 88.266 ML or 0.0882
GM3.The initial loss (initial abstraction) predicted for
the Scenario-1 in a year using the annual rainfall grid
ranges from 415.866–1238.49. The total annual volume
of surface runoff (direct runoff) is 104021 ML or 0.104
Gm3 (because of space constraint not shown in Table:1).
The runoff depths ranges from 106.76-489.64 m3 as the
rainfall received in the Northern part is low, the
infiltration and runoff observed are also low in that
region. The mean initial loss predicted by the model is
2.9296 mm, mean infiltration is 62.93 mm and the mean
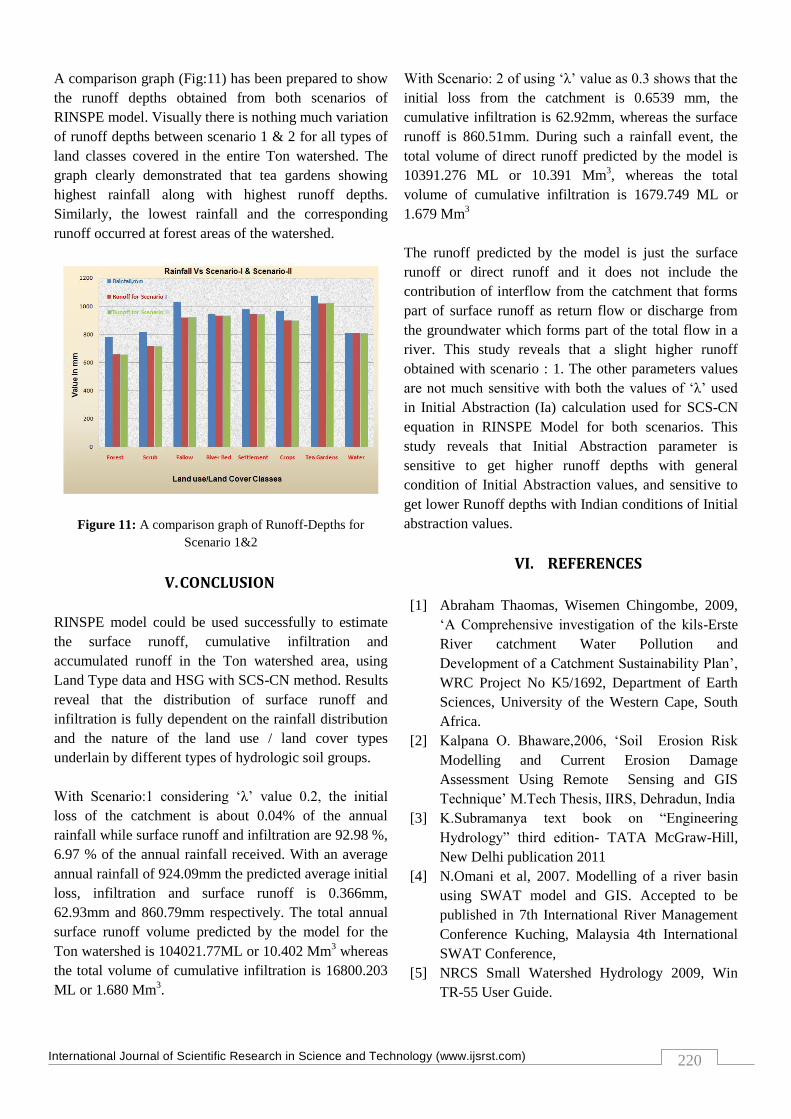
surface runoff is 860.79 mm. The summarized depths
(mm) of annual rainfall, initial loss, infiltration and
runoff based on scenario-1 and their respective
percentage values are shown in Table:1. All type of
Forest category has got the lowest runoff percentage of
83.94 % of rainfall received whereas the Water Bodies
and river bed categories have got maximum runoff
percentages (100% and 96.25% of rainfall respectively).
The highest infiltrations observed are in the areas
covered by forest areas and lower river bed, settlement
lands. The majority of the southern parts of the
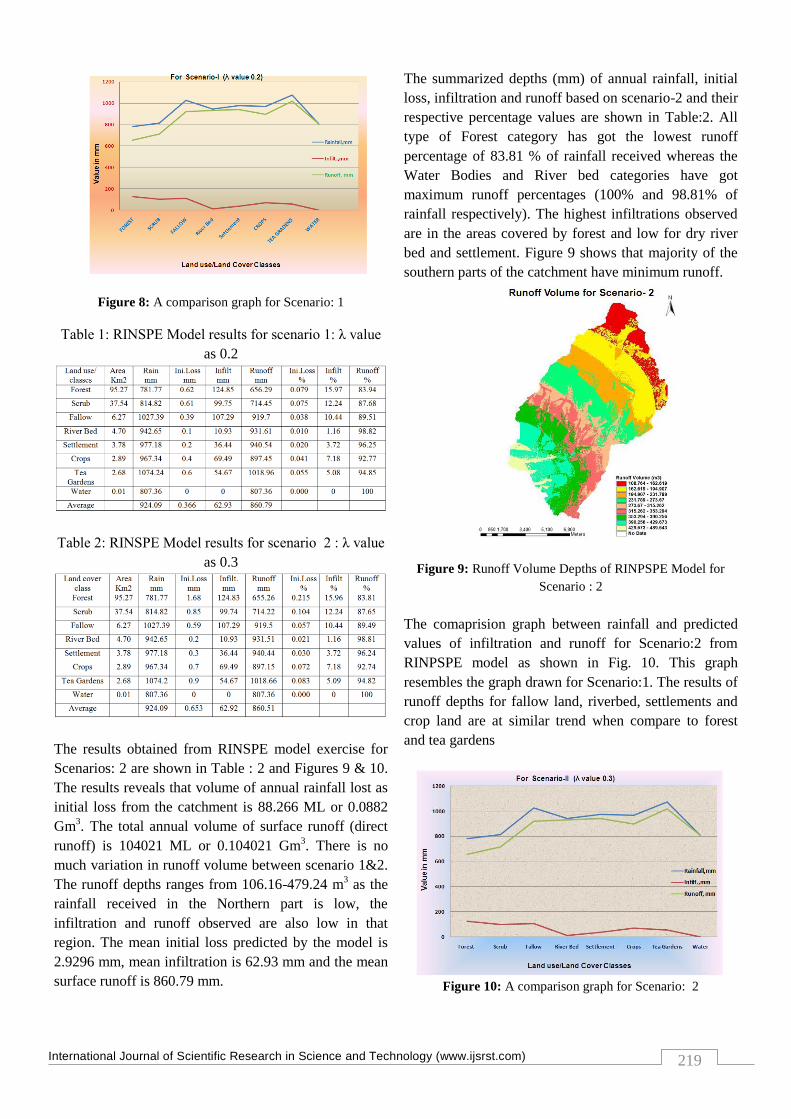
catchment have minimum runoff as shows in Fig: 7.
Figure 7: Runoff Volume Depths of RINPSPE Model for
Scenario:1
International Journal of Scientific Research in Science and Technology (www.ijsrst.com)
219
Figure 8: A comparison graph for Scenario: 1
Table 1: RINSPE Model results for scenario 1: λ value
as 0.2
Table 2: RINSPE Model results for scenario 2 : λ value
as 0.3
The results obtained from RINSPE model exercise for
Scenarios: 2 are shown in Table : 2 and Figures 9 & 10.
The results reveals that volume of annual rainfall lost as
initial loss from the catchment is 88.266 ML or 0.0882
Gm3. The total annual volume of surface runoff (direct
runoff) is 104021 ML or 0.104021 Gm3. There is no
much variation in runoff volume between scenario 1&2.
The runoff depths ranges from 106.16-479.24 m3 as the
rainfall received in the Northern part is low, the
infiltration and runoff observed are also low in that
region. The mean initial loss predicted by the model is
2.9296 mm, mean infiltration is 62.93 mm and the mean
surface runoff is 860.79 mm.
The summarized depths (mm) of annual rainfall, initial
loss, infiltration and runoff based on scenario-2 and their
respective percentage values are shown in Table:2. All
type of Forest category has got the lowest runoff
percentage of 83.81 % of rainfall received whereas the
Water Bodies and River bed categories have got
maximum runoff percentages (100% and 98.81% of
rainfall respectively). The highest infiltrations observed
are in the areas covered by forest and low for dry river
bed and settlement. Figure 9 shows that majority of the
southern parts of the catchment have minimum runoff.
Figure 9: Runoff Volume Depths of RINPSPE Model for
Scenario : 2
The comaprision graph between rainfall and predicted
values of infiltration and runoff for Scenario:2 from
RINPSPE model as shown in Fig. 10. This graph
resembles the graph drawn for Scenario:1. The results of
runoff depths for fallow land, riverbed, settlements and
crop land are at similar trend when compare to forest
and tea gardens
Figure 10: A comparison graph for Scenario: 2
International Journal of Scientific Research in Science and Technology (www.ijsrst.com)
220
A comparison graph (Fig:11) has been prepared to show
the runoff depths obtained from both scenarios of
RINSPE model. Visually there is nothing much variation
of runoff depths between scenario 1 & 2 for all types of
land classes covered in the entire Ton watershed. The
graph clearly demonstrated that tea gardens showing
highest rainfall along with highest runoff depths.
Similarly, the lowest rainfall and the corresponding
runoff occurred at forest areas of the watershed.
Figure 11: A comparison graph of Runoff-Depths for
Scenario 1&2
V. CONCLUSION
RINSPE model could be used successfully to estimate
the surface runoff, cumulative infiltration and
accumulated runoff in the Ton watershed area, using
Land Type data and HSG with SCS-CN method. Results
reveal that the distribution of surface runoff and
infiltration is fully dependent on the rainfall distribution
and the nature of the land use / land cover types
underlain by different types of hydrologic soil groups.
With Scenario:1 considering „λ‟ value 0.2, the initial
loss of the catchment is about 0.04% of the annual
rainfall while surface runoff and infiltration are 92.98 %,
6.97 % of the annual rainfall received. With an average
annual rainfall of 924.09mm the predicted average initial
loss, infiltration and surface runoff is 0.366mm,
62.93mm and 860.79mm respectively. The total annual
surface runoff volume predicted by the model for the
Ton watershed is 104021.77ML or 10.402 Mm3 whereas
the total volume of cumulative infiltration is 16800.203
ML or 1.680 Mm3.
With Scenario: 2 of using „λ‟ value as 0.3 shows that the
initial loss from the catchment is 0.6539 mm, the
cumulative infiltration is 62.92mm, whereas the surface
runoff is 860.51mm. During such a rainfall event, the
total volume of direct runoff predicted by the model is
10391.276 ML or 10.391 Mm3, whereas the total
volume of cumulative infiltration is 1679.749 ML or
1.679 Mm3
The runoff predicted by the model is just the surface
runoff or direct runoff and it does not include the
contribution of interflow from the catchment that forms
part of surface runoff as return flow or discharge from
the groundwater which forms part of the total flow in a
river. This study reveals that a slight higher runoff
obtained with scenario : 1. The other parameters values
are not much sensitive with both the values of „λ‟ used
in Initial Abstraction (Ia) calculation used for SCS-CN
equation in RINSPE Model for both scenarios. This
study reveals that Initial Abstraction parameter is
sensitive to get higher runoff depths with general
condition of Initial Abstraction values, and sensitive to
get lower Runoff depths with Indian conditions of Initial
abstraction values.
VI. REFERENCES
[1] Abraham Thaomas, Wisemen Chingombe, 2009,
„A Comprehensive investigation of the kils-Erste
River catchment Water Pollution and
Development of a Catchment Sustainability Plan‟,
WRC Project No K5/1692, Department of Earth
Sciences, University of the Western Cape, South
Africa.
[2] Kalpana O. Bhaware,2006, „Soil Erosion Risk
Modelling and Current Erosion Damage
Assessment Using Remote Sensing and GIS
Technique‟ M.Tech Thesis, IIRS, Dehradun, India
[3] K.Subramanya text book on “Engineering
Hydrology” third edition- TATA McGraw-Hill,
New Delhi publication 2011
[4] N.Omani et al, 2007. Modelling of a river basin
using SWAT model and GIS. Accepted to be
published in 7th International River Management
Conference Kuching, Malaysia 4th International
SWAT Conference,
[5] NRCS Small Watershed Hydrology 2009, Win
TR-55 User Guide.

International Journal of Scientific Research in Science and Technology (www.ijsrst.com)
221
[6] Pidwirny, M. (2006). "Introduction to Surface
Runoff". Fundamentals of Physical Geography,
2nd Edition. Date Viewed.13/11/08
http://www.physicalgeography.net/fundamentals/8
n.html.
[7] Thomas, Abraham, 2001. A Geographic
Information System Methodology For Modelling
Urban Groundwater Recharge And Pollution. Ph.
D. Thesis. The School of Earth Sciences, The
University of Birmingham, Birmingham, United
Kingdom.
[8] Thomas, A. and Tellam, J.H. 2004. Development
of an ArcView GIS Based Petrol Station BTEX
Pollution Model for Assessing Groundwater
Pollution from Small Scale Petrol Spills.
Proceedings of 32nd International Geological
Congress, Florence, Italy (Aug 20 - 28, 2004).
Abstract Vol., Part 1, Abstract 98-16, p. 437.
[9] Thomas, A. and Tellam, J.H. 2005. Development
of A GIS Model For Assessing Groundwater
Pollution From Small Scale Petrol Spills. Paper
accepted for publishing in the Matthias Eiswirth
Memorial Volume- the proceeding of the 32nd
International Geological Congress held at
Florence, Italy, August 20-28, 2004.
[10] Tindall, James A., and Kunkel, James R. 1999.
Unsaturated Zone Hydrology for Scientists and
Engineers. Prentice-Hall, Inc.
[11] US EPA, 1993. Natural Wetlands and Urban
Stormwater: Potential Impacts and Management.
Office of Wetlands, Oceans and Watersheds
Wetlands Division, United States Environmental
Protection Agency, Washington, D.C.
http://www.epa.gov/OWOW/wetlands/stormwat.p
df
[12] US EPA, 1998a. Estimation of Infiltration Rate in
the Vadose Zone: Compilation of Simple
Mathematical Models. Volume I. EPA/600/R-
87/128a, February 1998. United States
Environmental Protection Agency.
[13] US EPA, 1998b. Estimation of Infiltration Rate in
the Vadose Zone: Application of Selected
Mathematical Models. Volume II. EPA/600/R-
87/128b, February 1998. United States
Environmental Protection Agency.