SENSATA FOURTH QUARTER AND FULL YEAR 2018 ...SENSATA FOURTH QUARTER AND FULL YEAR 2018 EARNINGS...
35
SENSATA FOURTH QUARTER AND FULL YEAR 2018 EARNINGS PRESENTATION FEBRUARY 6, 2019
Transcript of SENSATA FOURTH QUARTER AND FULL YEAR 2018 ...SENSATA FOURTH QUARTER AND FULL YEAR 2018 EARNINGS...

SENSATA FOURTH QUARTER AND FULL
YEAR 2018 EARNINGS PRESENTATION
FEBRUARY 6, 2019
2Q4 AND FULL YEAR 2018 EARNINGS SUMMARY
Forward-Looking Statements and Non-GAAP Measures
Forward-Looking Statements
This earnings presentation contains "forward-looking statements" within the meaning of Section 27A of the Securities Act of
1933 and Section 21E of the Securities Exchange Act of 1934. Sensata believes that its expectations are based on
reasonable assumptions. No assurance, however, can be given that such expectations will prove to have been correct. A
number of factors could cause actual results to differ materially from the projections, anticipated results, or other expectations
expressed in this earnings presentation, including, without limitation, risks associated with regulatory, legal, governmental,
political, economic and military matters; adverse conditions in the automotive industry; competition in our industry, including
pressure from customers to reduce prices; supplier interruptions, which could limit access to manufactured components or
raw materials; business disruptions due to natural disasters; labor disruptions; difficulties with or failures integrating acquired
businesses; market acceptance of new products; fluctuations in foreign exchange rates; and our level of indebtedness.
Readers are cautioned not to place undue reliance on these forward-looking statements, which speak to results only as of the
date the statements were made; and we undertake no obligation to publicly update or revise any forward-looking statements,
whether to reflect any future events or circumstances or otherwise. See "Risk Factors" in the Company's 2018 Annual Report
on Form 10-K and other public filings and press releases. Copies of our filings are available from our Investor Relations
department or from the SEC website, www.sec.gov.
Non-GAAP Financial Measures
Where we have used non-GAAP financial measures, reconciliations to the most comparable GAAP measures are provided,
along with a disclosure on the usefulness of the non-GAAP measure, at the back of this presentation or in the “Investor
Relations” section of the Company’s website, www.investors.sensata.com.

3Q4 AND FULL YEAR 2018 EARNINGS SUMMARY
FY-2018 GAAP Results$ and shares outstanding in millions, except EPS FY-2018 FY-2017 Δ
Revenue $3,521.6 $3,306.7 6.5%
Gross Profit(% of revenue)
$1,254.835.6%
$1,167.835.3%
7.4%
R&D(% of revenue)
$147.34.2%
$130.13.9%
13.2%
SG&A(% of revenue)
$305.68.7%
$301.99.1%
1.2%
Profit from Operations(% of revenue)
$710.420.2%
$555.816.8%
27.8%
Net Income(% of revenue)
$599.017.0%
$408.412.3%
46.7%
Tax Rate (13.8%) (1.5%) NM
Diluted EPS $3.53 $2.37 48.9%
Diluted Shares Outstanding 169.9 172.2 (2.3)

4Q4 AND FULL YEAR 2018 EARNINGS SUMMARY
FY-2018: Solid year of secular growth and operational
performance despite year-end market softness
Organic revenue growth of 6.0% – growth driven by 15.5% organic
revenue growth in HVOR and 4.5% organic growth in Auto as a result of
strong performance in NA and China
Strong Secular growth – HVOR outgrows end market by 830 basis
points; auto outgrows end market by 520 basis points
Continued adjusted EBIT margin expansion – adjusted EBIT margin
expands by 60 basis points y/y
Double-digit adjusted EPS growth – adjusted EPS growth of 14% y/y
driven primarily by volume, operating leverage and cost initiatives
Value-creating capital deployment – finished re-domicile to the UK;
repurchased $400 million of stock, completed GIGAVAC acquisition

5Q4 AND FULL YEAR 2018 EARNINGS SUMMARY
Auto – Organic revenue growth: 4.5%
• Met revenue growth guidance despite volatile market
• Outgrew underlying market production by 520 basis points as a
result of secular performance in high-growth segments of auto
• NA delivers mid-single digit organic growth in a down market
• China delivers strong growth for the year, despite 15% end-
market decline in the fourth quarter
FY-18 Performance by End Market
HVOR – Organic revenue growth: 15.5%
• Every segment of business delivers double-digit organic
revenue growth and strong content gains in full year 2018
• After strong end-market growth in 2018, expect an end market
decline of 1%-2% in FY-19
• New business wins set foundation for sustained secular
growth
~16%
PERCENT OF REVENUES
~59%
Industrial & Other – Organic rev growth: 4.2%
• Aerospace delivers highest growth rate as a result of strong
market and content growth gains
• Greater than anticipated slowdown in China economy and
corresponding inventory reductions in Q4-18 somewhat offset
content growth for full year
~25%

6Q4 AND FULL YEAR 2018 EARNINGS SUMMARY
SHARP DECLINE IN AUTO PRODUCTION
CHINA PMI LOWEST IN THREE YEARS
-5%
-15%
Q3-18 Q4-18
48
49
50
51
52
53
Sharper than expected declines in China auto and industrial
end-markets lowered Q4-18 revenue growth
49.4
JAN ’16 DEC ’18
4.3%
~1560 bps
SENSATA PERFORMANCE Q4-18
Outgrew auto end
market production by
Overall China organic growth:
China Auto organic growth:
0.6%
7Q4 AND FULL YEAR 2018 EARNINGS SUMMARY
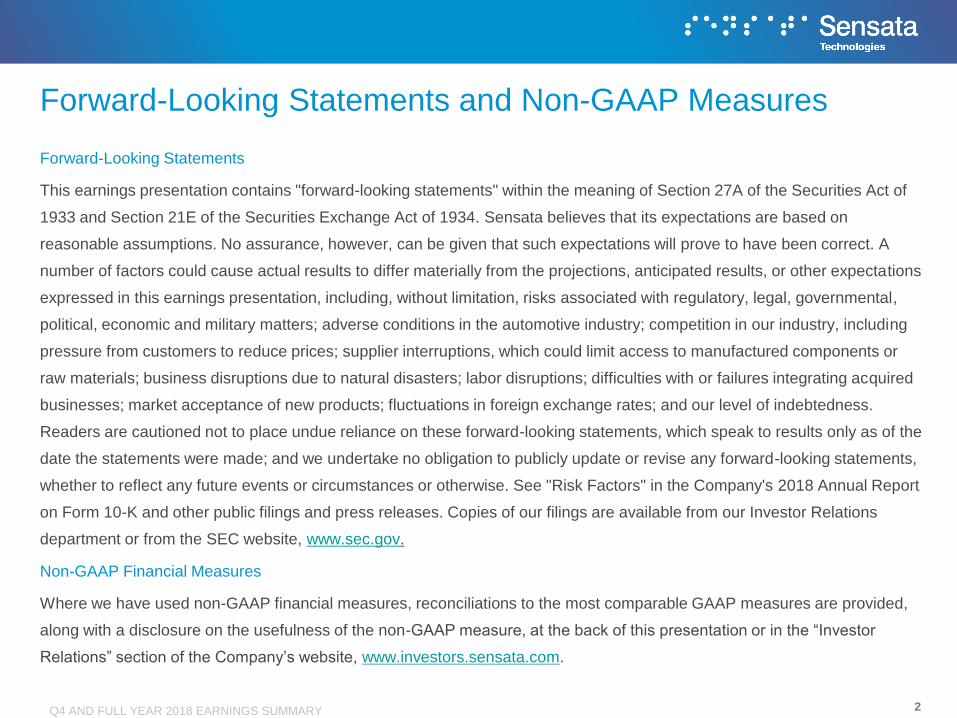
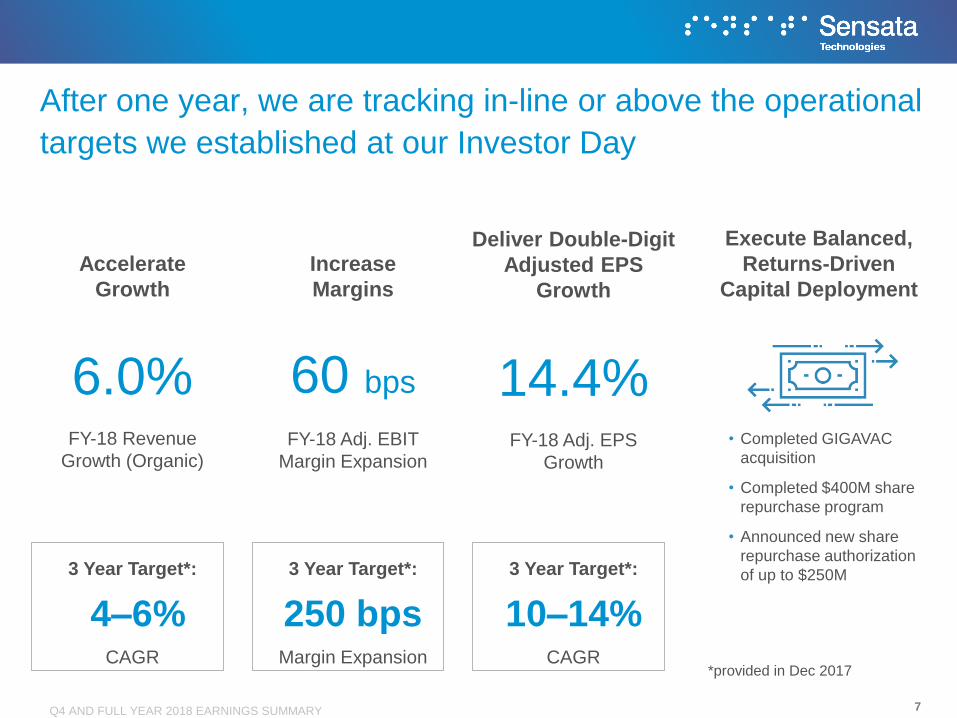
After one year, we are tracking in-line or above the operational
targets we established at our Investor Day
FY-18 Revenue
Growth (Organic)
6.0%FY-18 Adj. EBIT
Margin Expansion
60 bps
FY-18 Adj. EPS
Growth
14.4%• Completed GIGAVAC
acquisition
• Completed $400M share
repurchase program
• Announced new share
repurchase authorization
of up to $250M
Accelerate
Growth
Increase
Margins
Execute Balanced,
Returns-Driven
Capital Deployment
Deliver Double-Digit
Adjusted EPS
Growth
3 Year Target*:
4–6%CAGR
3 Year Target*:
10–14%CAGR
3 Year Target*:
250 bpsMargin Expansion
*provided in Dec 2017

8Q4 AND FULL YEAR 2018 EARNINGS SUMMARY
Significant exposure to high-growth auto will help to sustain
attractive outgrowth relative to end market production
• Intersecting high-growth segments of auto market that
will offset effects of weaker end-market
• Sensor-rich solutions for efficient, connected
subsystems
• Cleaner, more electrified vehicles
• Solutions for new energy vehicles
• Secured significant new business wins over past few
years that provide visibility into future secular growth
• Expect ~400-500 bps of outgrowth relative to
underlying auto production in FY-19E
50%
High-Growth
Auto
% of Sensata Revenue

9Q4 AND FULL YEAR 2018 EARNINGS SUMMARY
Strength of business model enables sustained profitability and
cash flow even in the face of weaker end markets
100% FIXED
100% VARIABLE
50/50
FIXED COSTS AS A % OF COGS
• Highly variable cost structure limits decremental margins
• Ability to quickly take costs out
• Industry-leading margins and cash flow
• Track record of expanding margins and generating
double-digit EPS growth in weak economic environments
Sensata
Auto Supplier
Peer Group*
*JP Morgan auto coverage

10Q4 AND FULL YEAR 2018 EARNINGS SUMMARY
$ in millions, except EPS Q4-2018 Q4-2017 Δ
Revenue $848 $841 1%
Adjusted EBIT% revenue
$209
24.7%
$20123.9%
4%
Adjusted Net Income% revenue
$15818.6%
$14917.8%
5%
Adjusted EPS $0.95 $0.87 9%
Q4-2018 Financial SummaryADJUSTED EBIT MARGINS EXPAND BY 80 BASIS POINTS
• Revenue growth of 0.9%
composed of:
• Organic revenue growth: 3.5%
• Net effect of acq./divestitures
decreases revenue by 1.9%
• Foreign exchange decreases
revenue by 0.7%
• Adjusted EBIT grows 4.2%
despite higher investment and
unfavorable impact from tariffs
• Adjusted EPS benefited $0.04
as a result of FY-18 share
buybacks
Q4-2017 Organic FX Acq/Div, net Q4-2018
$0.87$0.95
$0.10$0.02 ($0.04)
11Q4 AND FULL YEAR 2018 EARNINGS SUMMARY
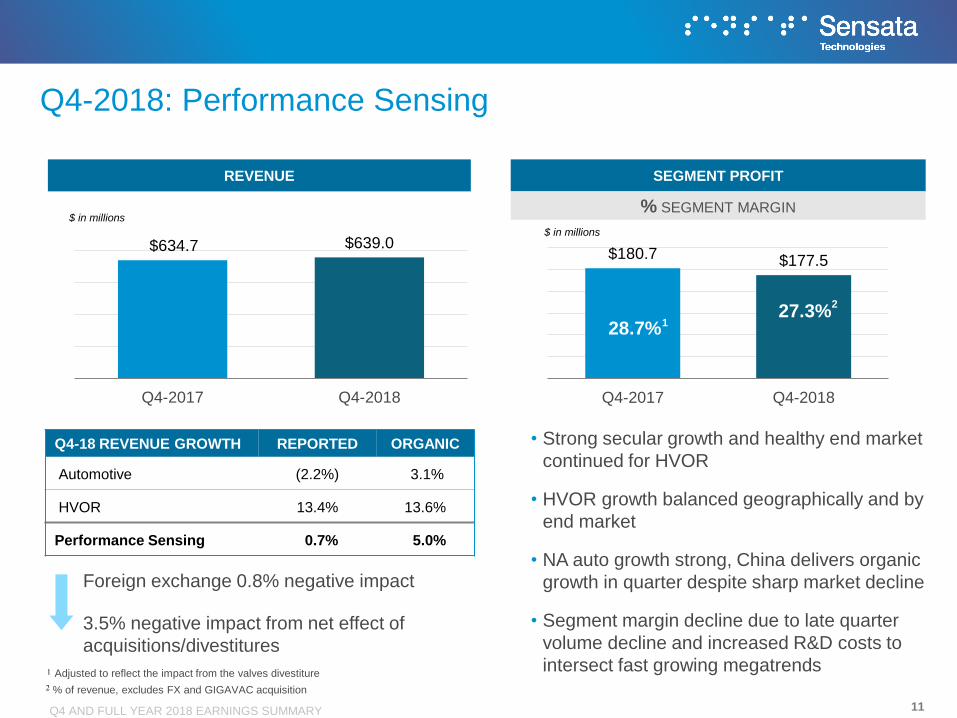
SEGMENT PROFITREVENUE
% SEGMENT MARGIN
Foreign exchange 0.8% negative impact
3.5% negative impact from net effect of
acquisitions/divestitures
• Strong secular growth and healthy end market
continued for HVOR
• HVOR growth balanced geographically and by
end market
• NA auto growth strong, China delivers organic
growth in quarter despite sharp market decline
• Segment margin decline due to late quarter
volume decline and increased R&D costs to
intersect fast growing megatrends
% of revenue, excludes FX and GIGAVAC acquisition
$634.7 $639.0
Q4-2017 Q4-2018
$ in millions
$180.7 $177.5
Q4-2017 Q4-2018
1
$ in millions
Q4-18 REVENUE GROWTH REPORTED ORGANIC
Automotive (2.2%) 3.1%
HVOR 13.4% 13.6%
Performance Sensing 0.7% 5.0%
28.7%27.3%
Q4-2018: Performance Sensing
Adjusted to reflect the impact from the valves divestiture
2
1
2
12Q4 AND FULL YEAR 2018 EARNINGS SUMMARY
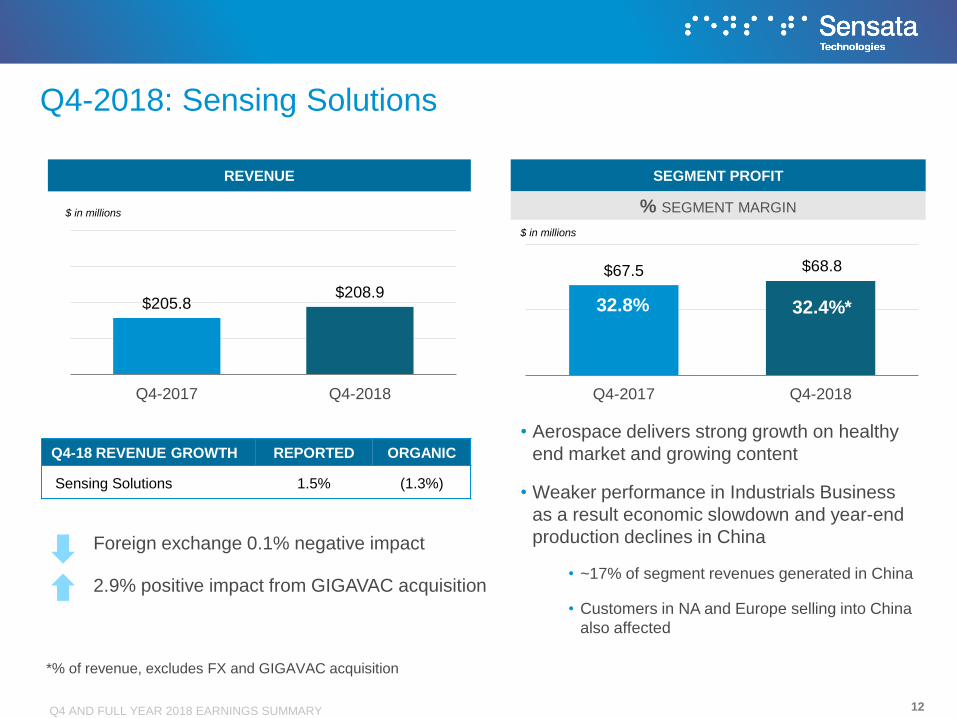
$67.5 $68.8
Q4-2017 Q4-2018
$ in millions
$205.8$208.9
Q4-2017 Q4-2018
$ in millions
Q4-2018: Sensing Solutions
SEGMENT PROFITREVENUE
% SEGMENT MARGIN
32.8% 32.4%*
• Aerospace delivers strong growth on healthy
end market and growing content
• Weaker performance in Industrials Business
as a result economic slowdown and year-end
production declines in China
• ~17% of segment revenues generated in China
• Customers in NA and Europe selling into China
also affected
*% of revenue, excludes FX and GIGAVAC acquisition
Q4-18 REVENUE GROWTH REPORTED ORGANIC
Sensing Solutions 1.5% (1.3%)
Foreign exchange 0.1% negative impact
2.9% positive impact from GIGAVAC acquisition

13Q4 AND FULL YEAR 2018 EARNINGS SUMMARY
Q4-2018 Non-GAAP Results$ in millions, except EPS Q4-2018 Q4-2017 Δ
Revenue $847.9 $840.5 0.9%
Adj. Gross Profit(% of revenue)
$312.636.9%
$306.336.4%
2.1%
R&D(% of revenue)
$35.54.2%
$33.13.9%
7.2%
Adj. SG&A(% of revenue)
$64.47.6%
$71.28.5%
(9.6%)
Adj. Other Opex1 $1.7 $2.6 (34.8%)
Adj. Other (Loss)/Gain, net ($2.0) $1.3 NM
Adj. EBIT(% of revenue)
$209.024.7%
$200.623.9%
4.2%
Adj. Tax Rate2 6.9% 6.8% 10 bps
Adj. Net Income(% of revenue)
$157.618.6%
$149.417.8%
5.5%
Adj. EPS $0.95 $0.87 9.2%
1 – Represents sum of adjusted amortization of intangible assets and adjusted restructuring and other charges, net
2 – Adjusted tax rate expressed as a % of adjusted EBIT; adjusted tax rate expressed as a % of Adjusted profit before tax was 8.3% in Q4 2018 and 8.4% in Q4 2017

14Q4 AND FULL YEAR 2018 EARNINGS SUMMARY
1 – Represents sum of adjusted amortization of intangible assets and adjusted restructuring and other charges, net
2 – Represents adjusted taxes divided by adjusted EBIT; adjusted tax rate expressed as a % of Adjusted profit before tax was 8.2% in FY-2018 and 8.2% in FY-2017
FY-2018 Non-GAAP Results$ in millions, except EPS FY-2018 FY-2017 Δ
Revenue $3,521.6 $3,306.7 6.5%
Adj. Gross Profit(% of revenue)
$1,275.536.2%
$1,188.135.9%
7.4%
R&D(% of revenue)
$147.34.2%
$130.13.9%
13.2%
Adj. SG&A(% of revenue)
$292.58.3%
$290.78.8%
0.6%
Adj. Other Opex1 $5.7 $18.5 (69.0%)
Adj. Other (Loss)/Gain,
net($8.5) $1.7 NM
Adj. EBIT(% of revenue)
$821.423.3%
$750.522.7%
9.5%
Adj. Tax Rate2 6.8% 6.6% 20 bps
Adj. Net Income$619.4
17.6%
$548.716.6%
12.9%
Adj. EPS $3.65 $3.19 14.4%
COMMENTS
• Strong EBIT growth of
9.5% despite loss of
valves business and
negative impact of tariffs
in 2H-18
• Higher R&D spend
relates to supporting
megatrends, previous
business wins and
addition of GIGAVAC
• Adjusted Net Income
margins improved by 100
bps
• Highly effective capital
deployment: adjusted
EPS benefited $0.05 from
share buybacks in FY-18

15Q4 AND FULL YEAR 2018 EARNINGS SUMMARY
2019 Financial Guidance
$ in millions, except EPS
FY-2018 FY-2019 GUIDANCE REPORTED ORGANIC
Revenue $3,521.6 $3,580 - $3,680 2% - 5% 2% - 5%
Adj. EBIT $821.4 $858 – $886 4% – 8% 3% – 6%
Adj. Net Income $619.4 $643 – $669 4% – 8% 3% – 6%
Adj. EPS $3.65 $3.94 – $4.10 8% – 12% 7% - 10%
ASSUMPTIONS
• FX expected to
decrease revenue by
~$16M
– Adjusted EPS: positive
impact from FX of
$0.14 - $0.17
• Adjusted tax rate:
~8%
• Diluted share count:
~$0.16 y/y benefit from
share repurchase
• Free cash flow of
$510M - $550M
– Capex: $165M - $185M
Market assumptions: global auto market: -1% to -2%; China auto: -3% to -4%; global HVOR market: -1% to -2%

16Q4 AND FULL YEAR 2018 EARNINGS SUMMARY
Q1-19 Financial Guidance
$ in millions, except EPS
Q1-18 Q1-19 GUIDANCE REPORTED ORGANIC
Revenue $886.3 $840 - $864 (5%) – (3%) (2%) - 0%
Adj. EBIT $197.1 $188 - $194 (5%) – (2%) (2%) - 0%
Adj. Net Income $147.0 $136 - $142 (8%) – (3%) (3%) - 0%
Adj. EPS $0.85 $0.83 - $0.87 (2%) - 2% 2% - 5%
COMMENTS
• Valves divestiture and
GIGAVAC acquisition
(net) expected to
decrease revenue by
~$12M
• FX expected to
decrease revenue by
~$14M
– Adjusted EPS: $0.00-
($0.01) impact from FX
• ~$0.04 benefit from
share repurchase
• Fill rate of 91%
APPENDIXSENSATA FOURTH QUARTER AND FULL YEAR 2018
EARNINGS SUMMARY

18Q4 AND FULL YEAR 2018 EARNINGS SUMMARY
Q4-2018 GAAP Results$ and shares outstanding in millions, except EPS Q4-2018 Q4-2017 Δ
Revenue $847.9 $840.5 0.9%
Gross Profit(% of revenue)
$304.435.9%
$301.835.9%
0.8%
R&D(% of revenue)
$35.54.2%
$33.13.9%
7.2%
SG&A(% of revenue)
$69.98.2%
$75.18.9%
(6.9%)
Profit from Operations(% of revenue)
$162.419.1%
$153.918.3%
5.5%
Tax Rate (112.8%) (46.5%) NM
Net Income(% of revenue)
$254.130.0%
$169.120.1%
50.2%
Diluted EPS $1.54 $0.98 57.1%
Diluted Shares Outstanding 165.3M 172.6M (7.3M)

19Q4 AND FULL YEAR 2018 EARNINGS SUMMARY
Q4-2018 Cash Flow Statement
$ in millions Q4-2018 Q4-2017 Δ
Net Income $254.1 $169.1 50.2%
Depreciation & Amortization $62.2 $66.8 (6.8%)
Changes in Working Capital $21.4 $12.8 66.9%
Other ($137.3) ($63.4) NM
Operating Cash Flow $200.4 $185.4 8.1%
Capital Expenditures ($48.5) ($41.0) (18.2%)
Free Cash Flow $151.9 $144.3 5.3%
Changes recalculated based on unrounded numbers. Certain amounts will not sum due to rounding.

20Q4 AND FULL YEAR 2018 EARNINGS SUMMARY
FY-2018 Cash Flow Statement
$ in millions FY-2018 FY-2017 Δ
Net Income $599.0 $408.4 46.7%
Depreciation & Amortization $245.3 $270.4 (9.3%)
Changes in Working Capital ($66.9) ($94.8) 29.4%
Other ($156.8) ($26.2) NM
Operating Cash Flow $620.6 $557.6 11.3%
Capital Expenditures ($159.8) ($144.6) (10.5%)
Free Cash Flow $460.8 $413.1 11.6%

21Q4 AND FULL YEAR 2018 EARNINGS SUMMARY
$ in millions DEC 31, 2018 DEC 31, 2017
Total Assets $6,797.7 $6,641.5
Working Capital1 $1,277.2 $1,218.8
Intangibles, Net & Other
Long-Term Assets$4,880.5 $4,793.2
$ in millions DEC 31, 2018 DEC 31, 2017
Cash & Equivalents $729.8 $753.1
Current Debt $14.6 $15.7
Net Cash $715.3 $737.4
Balance Sheet

22Q4 AND FULL YEAR 2018 EARNINGS SUMMARY
Sensata Peer Group
ST Peer Group Sector
1. Ametek Inc Industrial
2. Amphenol Corp Tech
3. Aptiv Auto
4. Delphi Technologies Auto
5. Fortive Industrial Tech
6. FLIR Systems Tech
7. Gentex Auto
8. Littelfuse Industrial
9. Rockwell Industrial
10. Roper Industrial
11. TE Connectivity Industrial Tech
12. Wabco Industrial

NON-GAAP FINANCIAL MEASURES

24Q4 AND FULL YEAR 2018 EARNINGS SUMMARY
Non-GAAP MeasuresWe supplement the reporting of our financial information determined in accordance with U.S. generally accepted accounting principles (“GAAP”) with certain non-GAAP financial measures. We use these non-GAAP financial
measures internally to make operating and strategic decisions, including the preparation of our annual operating plan, evaluation of our overall business performance, and as a factor in determining compensation for certain
employees. We believe presenting non-GAAP financial measures may be useful for period-over-period comparisons of underlying business trends and our ongoing business performance. We also believe presenting these non-
GAAP measures provides additional transparency into how management evaluates our business.
Non-GAAP financial measures should be considered as supplemental in nature and are not meant to be considered in isolation or as a substitute for the related financial information prepared in accordance with U.S. GAAP. In
addition, our non-GAAP financial measures may not be the same as or comparable to similar non-GAAP measures presented by other companies.
Within this presentation we refer to the below measures which are not determined in accordance with U.S. GAAP (i.e., non-GAAP measures). Reconciliations of each non-GAAP measure to the most directly comparable U.S. GAAP
financial measure are included within Appendix B.
Adjusted EBIT – represents net income, determined in accordance with U.S. GAAP, excluding interest expense, net, provision for/(benefit from) income taxes, and certain non-GAAP adjustments including: (1) restructuring related
and other, (2) financing and other transaction costs, (3) deferred losses/(gains) on other hedges, and (4) depreciation and amortization expense related to the step-up in fair value of fixed and intangible assets and inventory. We
believe that this measure is useful to investors and management in understanding our ongoing operations and in analysis of ongoing operating trends.
Adjusted EBIT margin – represents adjusted EBIT divided by net revenue. We believe that this measure is useful to investors and management in understanding our ongoing operations and in analysis of ongoing operating trends.
Adjusted EBITDA – represents net income, determined in accordance with U.S. GAAP, excluding interest expense, net, provision for/(benefit from) income taxes, depreciation expense, amortization of intangible assets, and certain
non-GAAP adjustments including: (1) restructuring related and other, (2) financing and other transaction costs, (3) deferred losses/(gains) on other hedges, and (4) amortization expense related to the step-up in fair value of inventory.
Adjusted EPS– represents ANI divided by the number of diluted weighted-average ordinary shares outstanding during the period. We believe that this measure is useful to investors and management in understanding our ongoing
operations and in analysis of ongoing operating trends.
Adjusted net income (“ANI”) – represents net income, determined in accordance with U.S. GAAP, excluding certain non-GAAP adjustments including:
(1) restructuring related and other - includes charges, net related to certain restructuring actions as well as other costs (or income), which we believe are either unique or unusual to the identified reporting period, and that we
believe impact comparisons to prior period operating results. Such amounts are excluded from internal financial statements and analyses that management uses in connection with financial planning, and in its review and
assessment of our operating and financial performance, including the performance of our segments. Restructuring related and other does not, however, include charges related to the integration of acquired businesses,
including such charges that are recognized as Restructuring and other charges, net in our condensed consolidated statements of operations.
(2) financing and other transaction costs – includes losses / (gains) related to debt financing transactions and third-party transaction costs, including for legal, accounting and other professional services that are directly related
to equity transactions, acquisitions or divestures
(3) deferred losses/(gains) on other hedges
(4) depreciation and amortization expense related to the step-up in fair value of fixed and intangible assets and inventory
(5) deferred income tax and other tax expense/(benefit) – includes adjustments for book-to-tax basis differences due primarily to the step-up in fair value of fixed and intangible assets and goodwill, the utilization of net
operating losses, and adjustments to our U.S. valuation allowance in connection with certain acquisitions. Other tax expense/(benefit) includes certain adjustments to unrecognized tax positions.
(6) amortization of debt issuance costs
We believe Adjusted net income is useful to investors and management in understanding our ongoing operations and in analysis of ongoing operating trends.
ANI margin – represents ANI divided by net revenue. We believe that this measure is useful to investors and management in understanding our ongoing operations and in analysis of ongoing operating trends.

25Q4 AND FULL YEAR 2018 EARNINGS SUMMARY
Non-GAAP Measures - continuedAdjusted taxes – represents provision for/(benefit from) income taxes, determined in accordance with U.S. GAAP, excluding certain non-GAAP adjustments recorded to provision for/(benefit from) income taxes in our U.S. GAAP
financial statements, such as deferred income tax and other tax expense/(benefit). We believe that this measure is useful to investors and management in understanding our ongoing operations and in analysis of ongoing operating
trends.
Adjusted tax rate – represents adjusted taxes divided by adjusted EBIT. We believe that this measure is useful to investors and management in understanding our ongoing operations and in analysis of ongoing operating trends.
Free cash flow – represents net cash provided by/(used in) operating activities less additions to property, plant and equipment and capitalized software. We believe free cash flow is useful to management and investors as a
measure of cash generated by business operations that will be used to repay scheduled debt maturities and can be used to, among other things, fund acquisitions, repurchase ordinary shares, and (or) accelerate the repayment of
debt obligations.
Net debt – represents total debt, capital lease and other financing obligations less cash and cash equivalents. We believe net debt is a useful measure to management and investors in understanding trends in our overall financial
condition.
Net leverage ratio – represents net debt divided by last twelve months (LTM) adjusted EBITDA. We believe net leverage ratio is a useful measure to management and investors in understanding trends in our overall financial
condition.
Organic growth (or decline) – in discussing trends in the Company’s performance, we refer to the percentage change of certain GAAP or non-GAAP financial measures in one period versus another, calculated on either a reported
or organic basis. Changes calculated on an organic basis exclude the period-over-period impact of foreign exchange rate differences as well as the impact of acquisitions, net of exited businesses for the first 12 months following the
transaction date. We believe that this measure is useful to investors and management in understanding our ongoing operations and in analysis of ongoing operating trends.
Segment margin (reported and constant currency basis) – on a reported basis, segment margin represents segment profit, as determined in accordance with U.S. GAAP, divided by segment net revenue. Segment margin on a
constant currency basis represents segment profit, measured on a constant currency basis with a comparison (e.g., prior year) period, divided by segment net revenue, also measured on a constant currency basis with the
comparison period. We believe that these measures are useful to investors and management in understanding our ongoing operations and in analysis of ongoing operating trends.

26Q4 AND FULL YEAR 2018 EARNINGS SUMMARY
Adjusted EBIT – Q4-2018Percentage amounts have been calculated based on unrounded numbers. Accordingly, certain amounts may not sum due to the effect of rounding.
$ in thousands Q4 2018 Q4 2017 Change
Total Sensata Amount Margin1 Amount Margin1 Amount Margin1
Net income $254,099 30.0% $169,129 20.1% 50.2% 990 bps
Interest expense, net 38,871 4.6% 39,183 4.7% (0.8%) (10 bps)
Provision for/(benefit from) income taxes (134,706) (15.9%) (53,675) (6.4%) (151.0%) (950 bps)
Earnings before interest and taxes ("EBIT") 158,264 18.7% 154,637 18.4% 2.3% 30 bps
Non-GAAP adjustments:
Restructuring related and other 9,764 1.2% 3,032 0.4% 222.0% 80 bps
Financing and other transaction costs 6,070 0.7% 4,729 0.6% 28.4% 10 bps
Deferred gain on other hedges (1,253) (0.1%) (2,124) (0.3%) 41.0% 20 bps
Depreciation and amortization expense related to the step-up in fair value of fixed and intangible
assets and inventory.36,170 4.3% 40,294 4.8% (10.2%) (50 bps)
Total adjustments 50,751 6.0% 45,931 5.5% 10.5% 50 bps
Adjusted EBIT $209,015 24.7% $200,568 23.9% 4.2% 80 bps
1 - Percentage of net revenue
Less year-over-year change due to:
Acquisition and divestiture, net (2.7%) (20 bps)
Foreign exchange rate differences 1.8% 60 bps
Organic growth 5.1% 40 bps

27Q4 AND FULL YEAR 2018 EARNINGS SUMMARY
Adjusted EBIT – FY-18Percentage amounts have been calculated based on unrounded numbers. Accordingly, certain amounts may not sum due to the effect of rounding.
$ in thousands FY 2018 FY 2017 Change
Total Sensata Amount Margin1 Amount Margin1 Amount Margin1
Net income $598,995 17.0% $408,357 12.3% 46.7% 470 bps
Interest expense, net 153,679 4.4% 159,761 4.8% (3.8%) (40 bps)
Provision for/(benefit from) income taxes (72,620) (2.1%) (5,916) (0.2%) (1127.5%) (190 bps)
Earnings before interest and taxes ("EBIT") 680,054 19.3% 562,202 17.0% 21.0% 230 bps
Non-GAAP adjustments:
Restructuring related and other 28,035 0.8% 21,331 0.6% 31.4% 20 bps
Financing and other transaction costs (40,344) (1.1%) 9,267 0.3% (535.4%) (140 bps)
Deferred loss/(gain) on other hedges 12,499 0.4% (7,365) (0.2%) 269.7% 60 bps
Depreciation and amortization expense related to the step-up in fair value of fixed and
intangible assets and inventory.141,193 4.0% 165,040 5.0% (14.4%) (100 bps)
Total adjustments 141,383 4.0% 188,273 5.7% (24.9%) (170 bps)
Adjusted EBIT $821,437 23.3% $750,475 22.7% 9.5% 60 bps
1 - Percentage of net revenue
Less year-over-year change due to:
Acquisition and divestiture, net (1.0%) (10 bps)
Foreign exchange rate differences 1.8% 10 bps
Organic growth 8.7% 60 bps

28Q4 AND FULL YEAR 2018 EARNINGS SUMMARY
Adjusted EBITDA
$ in thousands Period
Total Sensata LTM FY 2018 Q4 2018 Q3 2018 Q2 2018 Q1 2018 Q4 2017
Net income $598,995 $598,995 $254,099 $149,118 $105,288 $90,490 $169,129
Interest expense, net 153,679 153,679 38,871 38,058 38,321 38,429 39,183
Provision for/(benefit from) income taxes (72,620) (72,620) (134,706) 24,562 23,398 14,126 (53,675)
Depreciation expense 106,014 106,014 26,496 26,073 25,590 27,855 27,307
Amortization of intangible assets 139,326 139,326 35,752 33,911 34,594 35,069 39,472
Earnings before interest, taxes, depreciation, and amortization ("EBITDA") $925,394 $925,394 $220,512 $271,722 $227,191 $205,969 $221,416
Non-GAAP adjustments:
Restructuring related and other 28,035 28,035 9,764 9,268 2,339 6,664 3,032
Financing and other transaction costs (40,344) (40,344) 6,070 (54,173) 2,069 5,690 4,729
Deferred loss/(gain) on other hedges 12,499 12,499 (1,253) 4,553 3,137 6,062 (2,124)
Step-up inventory amortization 900 900 900 - - - -
Adjusted EBITDA $926,484 $926,484 $235,993 $231,370 $234,736 $224,385 $227,053

29Q4 AND FULL YEAR 2018 EARNINGS SUMMARY
ANI, Adjusted EPS, and ANI Margin – Q4-2018Per share and percentage amounts have been calculated based on unrounded numbers. Accordingly, certain amounts may not sum due to the effect of rounding.
$ in thousands Q4 2018 Q4 2017 Change
Total Sensata Amount EPS1 Margin2 Amount EPS1 Margin2 Amount EPS1 Margin2
Net income $254,099 $1.54 30.0% $169,129 $0.98 20.1% 50.2% 57.1% 990 bps
Non-GAAP adjustments:
Restructuring related and other 9,764 0.06 1.2% 3,032 0.02 0.4% 222.0% 200.0% 80 bps
Financing and other transaction costs 6,070 0.04 0.7% 4,729 0.03 0.6% 28.4% 33.3% 10 bps
Deferred (gain)/loss on other hedges (1,253) (0.01) (0.1%) (2,124) (0.01) (0.3%) 41.0% 0.0% 20 bps
Depreciation and amortization expense related to the step-up in fair
value of fixed and intangible assets and inventory36,170 0.22 4.3% 40,294 0.23 4.8% (10.2%) (4.3%) (50 bps)
Deferred income tax and other tax expense/(benefit) (149,044) (0.90) (17.6%) (67,343) (0.39) (8.0%) (121.3%) (130.8%) (960 bps)
Amortization of debt issuance costs 1,837 0.01 0.2% 1,713 0.01 0.2% 7.2% 0.0% 0 bps
Total adjustments (96,456) (0.58) (11.4%) (19,699) (0.11) (2.3%) (389.6%) (427.3%) 910 bps
Adjusted net income ("ANI") $157,643 $0.95 18.6% $149,430 $0.87 17.8% 5.5% 9.2% 80 bps
1 - Per diluted weighted-average ordinary shares outstanding
2 - Percentage of net revenue Less year-over-year change due to:
Acquisition and divestiture, net (4.1%) (4.6%) (50 bps)
Foreign exchange rate differences 2.5% 2.3% 60 bps
Organic growth 7.1% 11.5% 70 bps

30Q4 AND FULL YEAR 2018 EARNINGS SUMMARY
ANI, Adjusted EPS, and ANI Margin – FY-18Per share and percentage amounts have been calculated based on unrounded numbers. Accordingly, certain amounts may not sum due to the effect of rounding.
$ in thousands FY 2018 FY 2017 Change
Total Sensata Amount EPS1 Margin2 Amount EPS1 Margin2 Amount EPS1 Margin2
Net income $598,995 $3.53 17.0% $408,357 $2.37 12.3% 46.7% 48.9% 470 bps
Non-GAAP adjustments:
Restructuring related and other 28,035 0.17 0.8% 21,331 0.12 0.6% 31.4% 41.7% 20 bps
Financing and other transaction costs (40,344) (0.24) (1.1%) 9,267 0.05 0.3% (535.4%) (580.0%) (140 bps)
Deferred loss/(gain) on other hedges 12,499 0.07 0.4% (7,365) (0.04) (0.2%) 269.7% 275.0% 60 bps
Depreciation and amortization expense related to the step-up in fair value
of fixed and intangible assets and inventory.141,193 0.83 4.0% 165,040 0.96 5.0% (14.4%) (13.5%) (100 bps)
Deferred income tax and other tax (benefit)/expense (128,261) (0.76) (3.6%) (55,156) (0.32) (1.7%) (132.5%) (137.5%) (190 bps)
Amortization of debt issuance costs 7,317 0.04 0.2% 7,241 0.04 0.2% 1.0% 0.0% 0 bps
Total adjustments 20,439 0.12 0.6% 140,358 0.82 4.2% (85.4%) (85.4%) (360 bps)
Adjusted net income ("ANI") $619,434 $3.65 17.6% $548,715 $3.19 16.6% 12.9% 14.4% 100 bps
1 - Per diluted weighted-average ordinary shares outstanding
2 - Percentage of net revenue Less year-over-year change due to:
Acquisition and divestiture, net (1.5%) (1.6%) (20 bps)
Foreign exchange rate differences 2.4% 2.5% 20 bps
Organic growth 12.0% 13.5% 100 bps

31Q4 AND FULL YEAR 2018 EARNINGS SUMMARY
Adjusted Taxes and Adjusted Tax Rate
$ in thousands Q4 FY
Total Sensata 2018 2017 2018 2017
Provision for/(benefit from) income taxes ($134,706) ($53,675) ($72,620) ($5,916)
Non-GAAP adjustments:
Deferred income tax and other tax expense/(benefit) (149,044) (67,343) (128,261) (55,156)
Adjusted taxes (14,338) $13,668 $55,641 $49,240
Adjusted EBIT $209,015 $200,568 $821,437 $750,475
Adjusted tax rate 6.9% 6.8% 6.8% 6.6%

32Q4 AND FULL YEAR 2018 EARNINGS SUMMARY
Free Cash Flow
$ in thousands Q4 FY
Total Sensata 2018 2017 Change 2018 2017 Change
Net cash provided by operating activities $200,424 $185,367 8.1% $620,563 $557,646 11.3%
Additions to property, plant and equipment and capitalized software (48,512) (41,048) (18.2%) (159,787) (144,584) (10.5%)
Free cash flow $151,912 $144,319 5.3% $460,776 $413,062 11.6%

33Q4 AND FULL YEAR 2018 EARNINGS SUMMARY
Net Debt and Net Leverage Ratio
$ in thousands As of
Total Sensata 31-Dec-18 30-Sep-18 30-Jun-18 31-Mar-18 31-Dec-17
Current portion of long-term debt, capital lease and other financing obligations $14,561 $13,378 $11,044 $8,178 $15,720
Capital lease and other financing obligations 30,618 24,548 26,098 27,735 28,739
Long-term debt 3,219,762 3,220,401 3,221,039 3,221,676 3,225,810
Total debt, capital lease and other financing obligations 3,264,941 3,258,327 3,258,181 3,257,589 3,270,269
Less: Discount (15,169) (15,857) (16,545) (17,233) (14,424)
Less: Deferred financing costs (23,159) (24,308) (25,457) (26,607) (27,758)
Total gross indebtedness 3,303,269 3,298,492 3,300,183 3,301,429 3,312,451
Less: Cash and cash equivalents 729,833 811,394 863,380 828,266 753,089
Net debt $2,573,436 $2,487,098 $2,436,803 $2,473,163 $2,559,362
Adjusted EBITDA (LTM) $926,484 $917,544 901,536 $881,703 $ 853,626
Net leverage ratio 2.8 2.7 2.7 2.8 3.0

34Q4 AND FULL YEAR 2018 EARNINGS SUMMARY
Organic Revenue Growth
2018 versus 2017
0
Total Sensata Q4 FY
Reported net revenue (percentage) change 0.9% 6.5%
Less year-over-year change due to:
Acquisition and divestiture, net (1.9%) (0.8%)
Foreign exchange rate differences (0.7%) 1.3%
Organic revenue growth 3.5% 6.0%
Performance Sensing Q4 FY
Reported net revenue (percentage) change 0.7% 6.8%
Less year-over-year change due to:
Acquisition and divestiture, net (3.5%) (1.3%)
Foreign exchange rate differences (0.8%) 1.5%
Organic revenue growth 5.0% 6.6%
Sensing Solutions Q4 FY
Reported net revenue (percentage) change 1.5% 5.7%
Less year-over-year change due to:
Acquisition and divestiture, net 2.9% 0.7%
Foreign exchange rate differences (0.1%) 0.8%
Organic revenue (decline)/growth (1.3%) 4.2%
35Q4 AND FULL YEAR 2018 EARNINGS SUMMARY
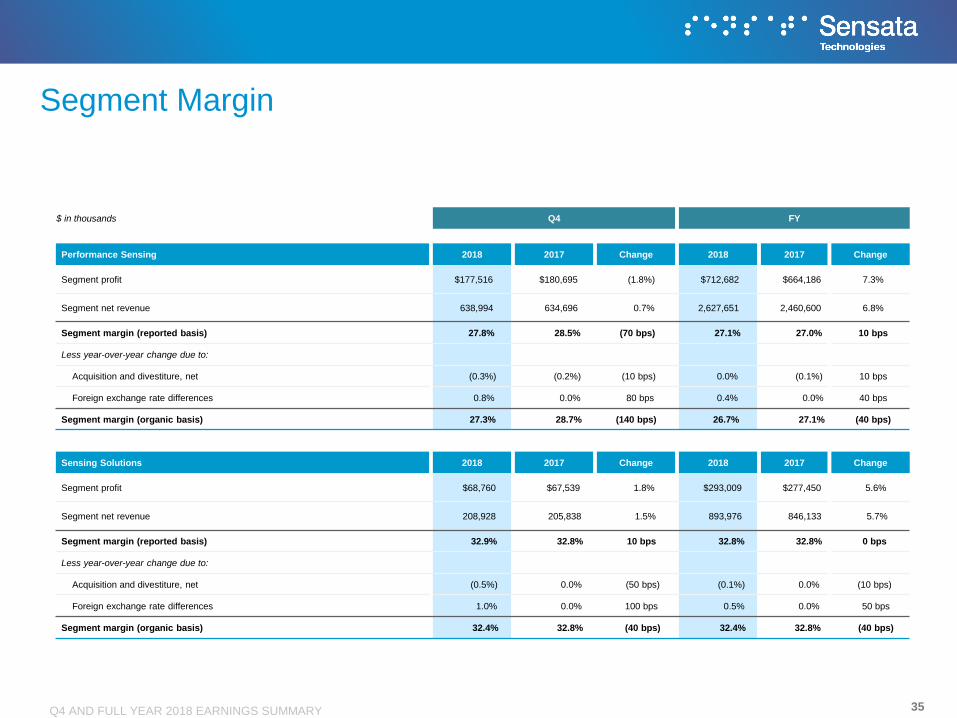
Segment Margin
$ in thousands Q4 FY
Performance Sensing 2018 2017 Change 2018 2017 Change
Segment profit $177,516 $180,695 (1.8%) $712,682 $664,186 7.3%
Segment net revenue 638,994 634,696 0.7% 2,627,651 2,460,600 6.8%
Segment margin (reported basis) 27.8% 28.5% (70 bps) 27.1% 27.0% 10 bps
Less year-over-year change due to:
Acquisition and divestiture, net (0.3%) (0.2%) (10 bps) 0.0% (0.1%) 10 bps
Foreign exchange rate differences 0.8% 0.0% 80 bps 0.4% 0.0% 40 bps
Segment margin (organic basis) 27.3% 28.7% (140 bps) 26.7% 27.1% (40 bps)
Sensing Solutions 2018 2017 Change 2018 2017 Change
Segment profit $68,760 $67,539 1.8% $293,009 $277,450 5.6%
Segment net revenue 208,928 205,838 1.5% 893,976 846,133 5.7%
Segment margin (reported basis) 32.9% 32.8% 10 bps 32.8% 32.8% 0 bps
Less year-over-year change due to:
Acquisition and divestiture, net (0.5%) 0.0% (50 bps) (0.1%) 0.0% (10 bps)
Foreign exchange rate differences 1.0% 0.0% 100 bps 0.5% 0.0% 50 bps
Segment margin (organic basis) 32.4% 32.8% (40 bps) 32.4% 32.8% (40 bps)