
Senate Bill 350 Study -...
90
Senate Bill 350 Study The Impacts of a Regional ISO-Operated Power Market on California PREPARED FOR PREPARED BY JULY 8, 2016
Transcript of Senate Bill 350 Study -...

Senate Bill 350 Study
The Impacts of a Regional ISO-Operated Power
Market on California
PREPARED FOR
PREPARED BY
JULY 8, 2016

Study Authors and Contributors
The California Independent System Operator:
Keith Casey Shucheng Liu
Mark Rothleder Xiaobo Wang
Deb Le Vine Yi Zhang
The Brattle Group:
Judy W. Chang David Luke Oates
Johannes P. Pfeifenberger Lauren Regan
Mariko Geronimo Aydin Peter Cahill
Cevat Onur Aydin Colin McIntyre
Kai Van Horn
Energy and Environmental Economics, Inc.:
Arne Olson Gerrit De Moor
Amber Mahone Nick Schlag
Ana Mileva
Berkeley Economic Advising and Research, LLC:
David Roland-Holst Drew Behnke
Samuel Evans Cecilia Han Springer
Sam Heft-Neal
Aspen Environmental Group:
Brewster Birdsall Heather Blair
Susan Lee Tracy Popiel
Emily Capello Scott Debauche
Fritts Golden Negar Vahidi
This report was prepared for the California Independent System Operator. All results and any errors are the
responsibility of the authors and do not represent the opinion of The Brattle Group, E3, BEAR, Aspen, or their
clients.
Acknowledgement: We acknowledge the valuable contributions of many individuals to this report and to the
underlying analysis, including members of Brattle, E3, BEAR, and Aspen for peer review. In particular, the
Brattle team would like to thank Metin Celebi for peer review and Naomi Giertych for analytical support.
Copyright © 2016 The Brattle Group, Inc., Energy and Environmental Economics, Inc.,
Berkeley Economic Advising & Research, LLC, and Aspen Environmental Group

Senate Bill 350 Study
The Impacts of a Regional ISO-Operated Power Market on California
List of Report Volumes
Executive Summary
Volume I. Purpose, Approach, and Findings of the SB 350 Regional Market Study
Volume II. The Stakeholder Process
Volume III. Description of Scenarios and Sensitivities
Volume IV. Renewable Energy Portfolio Analysis
Volume V. Production Cost Analysis
Volume VI. Load Diversity Analysis
Volume VII. Ratepayer Impact Analysis
Volume VIII. Economic Impact Analysis
Volume IX. Environmental Study
Volume X. Disadvantaged Community Impact Analysis
Volume XI. Renewable Integration and Reliability Impacts
Volume XII. Review of Existing Regional Market Impact Studies

I-i |
Volume 1: Table of Contents Executive Summary ........................................................................................................................... I-ii
Volume I. Purpose, Approach, and Findings of the SB 350 Regional Market Study .................... I-1
A. Purpose of the SB 350 Study ........................................................................................... I-1
B. SB 350 Study Approach .................................................................................................. I-2
1. Scope of the Regional Market ............................................................................... I-3
2. Baseline Scenarios .................................................................................................. I-4
3. Renewable Energy Portfolio Analysis .................................................................. I-6
4. Production Cost Analysis ...................................................................................... I-7
5. Environmental Study ............................................................................................. I-8
6. California Ratepayer Impact Analysis .................................................................. I-9
7. California Job and Economic Impact Analysis ................................................... I-10
8. Impact on Disadvantaged Communities ............................................................. I-11
9. Renewable Integration and Reliability Impacts ................................................. I-11
10. Review of Other Regional Market Studies ......................................................... I-12
C. Key Analytical Assumptions and Sensitivities............................................................. I-12
D. Portfolios to Meet California’s 50% Renewable Portfolio Standard .......................... I-15
E. Production Cost Simulations ........................................................................................ I-22
1. General Simulation Assumptions ........................................................................ I-22
2. Simulated Production Cost Results ..................................................................... I-23
3. Simulation Approach and Assumptions that Produce Conservatively Low
Production Cost Savings ...................................................................................... I-25
F. Impacts of a Regional Market on California and the Rest of the West ...................... I-27
1. Overall Impact on California Ratepayers ........................................................... I-28
2. Impact on Emissions of Greenhouse Gases and Other Air Pollutants .............. I-37
a. Impact on Coal Dispatch in WECC ........................................................... I-40
b. California CO2 Emissions Results .............................................................. I-44
c. WECC-Wide CO2 Emissions Results ........................................................ I-47
d. Sensitivity Analyses of CO2 Emissions ...................................................... I-49
e. NOx, SO2 and PM2.5 Emissions Results ................................................... I-50
3. Creation and Retention of Jobs and Other Benefits to the California Economy . I-
52
a. State Economic Impacts ............................................................................. I-53
b. Impact on California Jobs ........................................................................... I-53
4. Environmental Impacts in California and Elsewhere ........................................ I-54
a. Land Use Impacts ....................................................................................... I-57
b. Impacts on Biological Resources ................................................................ I-58
c. Water Use Impacts ..................................................................................... I-58
5. Impacts in California’s Disadvantaged Communities ........................................ I-59
6. Reliability and Integration of Renewable Energy Resources ............................ I-62
7. Survey of Existing Studies and Other Potential Impacts ................................... I-67
List of Acronyms .................................................................................................................... I-70

I-ii | brattle.com
Executive Summary
California’s Senate Bill No. 350—the Clean Energy and Pollution Reduction Act of 2015—
(“SB 350”) requires the California Independent System Operator (“CAISO,” “Existing ISO,” or
“ISO”) to conduct one or more studies of the impacts of a regional market enabled by governance
modifications that would transform the ISO into a multistate, regional entity (“Regional ISO” or
“regional market”). This report, comprising Volumes I through XII, responds to this legislative
requirement.
The ISO retained The Brattle Group (“Brattle”), Energy and Environmental Economics, Inc.
(“E3”), Aspen Environmental Group (“Aspen”), and Berkeley Economic Advising and Research,
LLC (“BEAR”) (together with the ISO, the “study team”) to evaluate the following impacts of a
Regional ISO as outlined by SB 350:
Overall benefits to California ratepayers;
Emissions of greenhouse gases and other air pollutants;
The creation or retention of jobs and other benefits to the California economy;
Environmental impacts in California and elsewhere;
Impacts in disadvantaged communities in California; and
Reliability and integration of renewable energy resources.
In addition, SB 350 requires that the modeling and all assumptions underlying the modeling are
made available for public review.1
The SB 350 study efforts include a stakeholder process, by which the study team has been
providing study assumptions, methodology, results, and detailed descriptions of all of the
relevant metrics used in the analyses. The stakeholder process began with the study team
presenting the initial framework of the approach and assumptions to be used in the analyses,
continued with providing stakeholders interim updates associated with the approach and study
assumptions, followed by providing detailed data and explanations of the preliminary results.
1 California Senate Bill 350, Clean Energy and Pollution Reduction Act of 2015, Article 5.5,
Section 359.5.(e)(1).

I-iii | brattle.com
This stakeholder process involved several days of formal stakeholder workshops, supplemental
webinars, data release, a review of study data by stakeholders, and written responses to numerous
stakeholder questions.
While this study is conducted in direct response to the California legislative requirement to
assess impacts on California and California electricity ratepayers, the study team hopes the
information and analyses provided herein and during the stakeholder process can be used by
stakeholders in California and in other states to perform their own analyses as they evaluate the
potential impacts of regional market participation.
More specifically, the stakeholder process consisted of:
February 8, 2016: stakeholder meeting to discuss proposed study framework,
methodology, and assumptions. Stakeholders submitted to the ISO their comments and
feedback, which the study team used to refine the study approach, study assumptions,
and the scenarios and sensitivities analyzed.
March 18, 2016: the study team responded to stakeholder comments from the February 8
stakeholder meeting.
March 30, 2016: additional detail on study assumptions and methodologies (“early release
material”) was posted on the CAISO website, in response to stakeholder requests.2
April 14, 2016: the study team hosted a webinar to discuss the early release materials with
stakeholders.
May 24–25, 2016: stakeholder meeting to present and discuss the preliminary study
results; stakeholder comments on preliminary study results were due by June 22, 2016.
2 Stakeholder materials are posted on the ISO’s website at:
https://www.caiso.com/informed/Pages/RegionalEnergyMarket/BenefitsofaRegionalEnergyMarket.aspx.
Certain analytical inputs contain detailed system information considered Critical Energy
Infrastructure Information under FERC law and must be accessed through a non-disclosure agreement
with the ISO. The instructions and NDA template can be found at:
http://www.caiso.com/informed/Pages/RegionalEnergyMarket/BenefitsofaRegionalEnergyMarket.aspx
under SB 350 Study Data. If you have any further questions, please contact

I-iv | brattle.com
June 3 and 10, 2016: detailed analytical inputs, assumptions, calculations, and results were
released for stakeholder review. Supplemental material, in response to ongoing
stakeholder requests, was released on June 14, 17, 21, and 22, 2016 and on July 5, 2016.
June 10, 15, 21, 22 and July 1 and 6 2016: released responses to stakeholder questions on
the analytical material released.
June 21, 2016: the study team hosted a webinar to discuss the details of the ratepayer
impact analysis, including TEAM calculations.
July 7, 2016: in response to stakeholder comments, the ISO reassessed the classification of
data files underlying the Senate Bill 350 preliminary study results. During that
assessment, the ISO determined that certain confidential files, including those containing
output calculations, could be reclassified as public information and are now available on
the ISO website.
July 12, 2016: the study team provided responses to stakeholder comments related to the
May 24–25 stakeholder meeting.
SB 350 requires the California Public Utilities Commission, the California Energy Commission,
and the California State Air Resource Board to jointly hold at least one public workshop where
the ISO presents the proposed governance modifications and the results of the study (“Joint
Agency Workshop”). The workshop is scheduled to be held on July 26, 2016 at the Secretary of
State, Auditorium at 1500 11th Street, First Floor, Sacramento, CA 95814 (enter at 11th and O
Streets).
The primary purpose of this report is to inform California policymakers and the California
legislature on the impacts to California of transforming the existing CAISO into a regional
organization that manages wholesale electricity markets and operations across a broader western
region. To undertake this analysis, the study team needed to make several foundational
assumptions:
The study team is not analyzing impacts associated with the ISO’s Energy Imbalance
Market (“EIM”).3 This study assumes the EIM may expand to the regional market
3 The Energy Imbalance Market is a real-time market and it does not incorporate day-ahead unit
commitment, day-ahead market dispatch, intra-day adjustments, or coordinated transmission
planning and generator interconnections.

I-v | brattle.com
footprint with or without implementation of the ISO-operated regional market. The
benefits estimated in this study are incremental to those achievable by a regional EIM.4
A number of plausible future renewables portfolios can help to meet California’s 50%
Renewable Portfolio Standard (“RPS”) by 2030 (“50% RPS portfolios”). The 50% RPS
portfolios used in the study illustrate how regional market impacts may influence
renewable generation development and vary across different renewable generation
portfolios. We analyze portfolios with California-focused procurement (2030 Current
Practice 1 scenario and 2030 Regional 2 scenario), a portfolio with more regionally-
focused procurement (2030 Regional 3 scenario), and a number of sensitivities. Each of
the sensitivity analyses of California renewables buildout results in a (at least slightly)
different 50% RPS portfolio. This study is focused on plausible portfolios for achieving
the 50% target under alternative assumptions for the sole purpose of assessing the benefits
of a regional market over a range of plausible renewable procurement scenarios. This
study does not endorse or provide any recommendations about the procurement
approach or the future composition of California’s 50% RPS portfolios.
The study uses a number of assumptions that reflect California policies associated with
reducing greenhouse gas (“GHG”) emissions from California’s electric sector. The policies
that are assumed to be in place and are reflected in the analytical assumptions include the
deployment of new energy efficiency, new (dispatchable) renewables, energy storage,
growth of electric vehicles, time-of-use rates, improved ancillary services, and some
fossil-fired generator retirements that reflect expected future policy decisions. In
addition, GHG emission allowance prices in California are assumed for each future
scenario analyzed. These assumptions do not take the place of policymakers’ decisions.
Instead, we expect that the California policymaking agencies and load-serving entities
will make a determination of how to meet the 50% RPS, how to expand energy efficiency
measures for the future, and how to reduce future GHG emissions as required by
Assembly Bill 32.
Assumptions reflect a range of the scope and conditions of a regional market. We analyze
bookends for the scope of a regional market: at one end, we analyze a regional market
that consists only of CAISO and PacifiCorp in 2020; and at the other end, we analyze an
4 Given that an expanded ISO-operated regional market also enhances real-time operations beyond
those that could be achieved through a regional EIM, our estimates will represent a conservative
estimate of actual benefits because these additional real-time impacts are not quantified in our study.
I-vi | brattle.com
expanded Regional ISO that includes most of the U.S. portion of the Western Electricity
Coordinating Council (“WECC”).5 The rest of the assumptions about market conditions
reflect both near-term year conditions (2020) with electric supply, demand, and fuel
prices similar to today’s, and longer-term conditions (2030) with significant changes in
electric supply, including more renewable generation and significantly less coal-fired
generating capacity in the entire Western Interconnection.
This study’s baseline scenarios do not include simulated GHG policies outside of
California, other than states’ existing RPS in the rest of WECC region. A sensitivity
analysis considers the impact of a modest price on GHG emissions on electricity sector
emissions in the rest of the U.S. WECC as a proxy for compliance with future
environmental regulations, such as the U.S. Environmental Protection Agency’s Clean
Power Plan.
Our five baseline study scenarios consist of the following two 2020 scenarios and three 2030
scenarios:
2020 Current Practice: reflects near-term market conditions. California has developed
the necessary resources to meet its 33% RPS. CAISO operates as-is, with no regional
expansion.
2020 CAISO+PAC: reflects near-term market conditions. California has developed
enough renewables to meet its 33% RPS. CAISO and PacifiCorp form a Regional ISO.
Up to 776 MW of energy transfers from CAISO to PacifiCorp and 982 MW of transfers
from PacifiCorp to CAISO (the amount of existing transmission capability between the
two areas) are free of economic and operational hurdles. CAISO and PacifiCorp resources
are committed and dispatched in a coordinated fashion to meet combined energy and
operating reserves requirements in advance of real-time operations. For any imports into
the CAISO region, all of PacifiCorp’s generators, including coal plants, are assumed to
face the same emissions cost as a generic natural gas combined-cycle generator (a
simplification because the simulations cannot identify unit-specific imports and assign
unit-specific allowance costs for imports into California). This scenario is compared to
the 2020 Current Practice scenario to evaluate the impacts of a very limited initial market
expansion.
5 The WECC region is also referred to as the “Western Interconnection.”

I-vii | brattle.com
2030 Current Practice (“Current Practice 1”):6 reflects longer-term market conditions.
California has developed enough renewables to meet its 50% RPS, with a current practice
(in-state) procurement focus. CAISO operates only its current footprint, without regional
expansion. Bilateral markets and trading frictions continue and limit the sales and net
exports of excess generation from the RPS portfolios of CAISO entities to 2,000 MW.
This means it is assumed that bilateral markets would accommodate the re-export of all
prevailing existing imports (averaging 3,000–4,000 MW) plus export/sell an additional
2,000 MW of (mostly intermittent) renewable resources.
2030 Expanded Regional ISO 2 (“Regional 2”): reflects longer-term market conditions.
California has developed enough renewables to meet its 50% RPS, with a continued (but
not exclusive) in-state renewables procurement focus. All of the U.S. WECC except for
the federal Power Marketing Agencies (“PMAs”) (BPA and WAPA) (“WECC without
PMAs”) is part of an expanded Regional ISO.7 All energy transfers among the Regional
ISO members are free of economic and operational hurdles. Regional ISO resources are
committed and dispatched in a coordinated fashion to meet combined energy and
operating reserves requirements. Oversupply from California’s renewables portfolio is
more readily absorbed by the regional marketplace, as reflected in a more relaxed
physical CAISO export limit (8,000 MW) in contrast to the more constrained bilateral
limit in Current Practice 1 (2,000 MW). This scenario is compared to the 2030 Current
Practice 1 scenario to evaluate the impacts of the broader regional market. The regional
market is assumed to have facilitated the development of additional low-cost renewable
generation resources beyond the western states’ RPS mandates.
2030 Expanded Regional ISO 3 (“Regional 3”): reflects longer-term market conditions.
California has developed enough renewables to meet its 50% RPS, with a more region-
6 This “Current Practice 1” scenario was previously referred to as “Case 1A”.
7 Specifically, the PMAs excluded for the purpose of this analysis are Bonneville Power Administration
(“BPA”) and Western Area Power Administration (“WAPA”)—Colorado-Missouri Region, Lower
Colorado Region and Upper Great Plains West. WAPA’s Sierra Nevada Region is included in the
Balancing Area of North California and, because it is not a separate balancing area, was included in the
analysis. The PMAs were excluded solely for providing a smaller than WECC-wide geographic
footprint. This choice does not reflect any suggestion that the PMAs would not be interested in
participating in a regional market. In fact, in the eastern interconnection, WAPA’s Upper Great
Plains Region has already joined the Southwest Power Pool.
I-viii | brattle.com
wide procurement focus than in Regional 2. All of the U.S. WECC without PMAs
participates in a Regional ISO. All energy transfers among the Regional ISO members are
free of economic and operational hurdles. Regional ISO resources are committed and
dispatched in a coordinated fashion to meet combined energy and operating reserves
requirements. Oversupply from California’s renewables portfolio is more readily
absorbed by the regional marketplace, as reflected in a more relaxed physical CAISO
export limit (8,000 MW) compared to the less flexible (2,000 MW) bilateral limit in
Current Practice 1. This scenario is compared to the 2030 Current Practice 1 scenario to
evaluate the impacts of the broader (but still not WECC-wide) regional market with more
WECC-wide procurement to meet California’s RPS. The regional market is assumed to
have facilitated the development of additional low-cost renewable generation resources
beyond the western states’ RPS mandate.
Numerous sensitivity analyses were also studied as summarized in Volume III. The sensitivity
analyses were used to test the impact of a variety of factors and alternative assumptions on the
study results. The sensitivities address high bilateral trading flexibility, the market’s geographic
scope, renewable generation costs, alternative RPS and energy efficiency targets, and the extent
to which a regional market would facilitate additional renewable generation development in the
rest of the U.S. WECC region. We have not analyzed sensitivities focused on alternative
assumptions for fuel prices, conventional plant retirements and additions, different weather and
load conditions, or different hydro conditions.
The key findings of the SB 350 analysis with respect to California ratepayer impact, greenhouse
gas and other emissions, economic and environmental impacts, and impacts on disadvantaged
communities are as follows:
Overall Benefits to California Ratepayers: We estimate an annual net benefit to California
ratepayers of $55 million a year in 2020 (assuming the regional market would only include
CAISO and PacifiCorp). That benefit grows to a baseline net benefit range of $1 billion to
$1.5 billion a year by 2030 (assuming a large regional footprint that includes all of U.S. WECC
without PMAs).8 The 2030 results, which would continue and likely grow in subsequent years,
8 When including the results of various sensitivity analyses (including higher bilateral flexibility and no
additional renewable development), annual 2030 California ratepayer savings range from
$767 million/year to $1.75 billion/year.

I-ix | brattle.com
reflect ratepayer savings in a renewables scenario that achieves California’s 50% RPS and meets
all existing RPS standards in the rest of the West. Figure ES-1 below summarizes these results
and shows that these net benefits to California’s ratepayer are composed of: (1) savings from
reduced capital investments for RPS-related procurement; (2) reduced production, purchase, and
sales costs for wholesale electricity; (3) reduced capital investments from regional load
diversification; and (4) reduced grid management charges for system and market operations.9
The reductions in RPS-related procurement costs stems from reduced renewable generation
capacity needs due to reduced curtailments and the ability to develop lower cost renewable
resources. Savings associated with wholesale productions, purchase and sales costs are driven
primarily by lower-cost imports (during periods when California is importing power) and higher
export sales revenues during oversupply conditions (when California would otherwise have to
curtail renewable generation or export power at a zero market price). The increased diversity of
peak loads in a larger market region reduces generation-related capital investments and the
larger geographic footprint reduces the average charge needed to recover the grid management
costs of the ISO operating the regional market.
Figure ES-1: Estimated Annual California Ratepayer Net Benefits
* The grid management charge is the ISO’s charge for recovering its annual operating costs.
Note that the “Current Practice 1” scenario has previously been referred to as “Case 1A”
9 A separate sensitivity analysis shows that 2020 California ratepayer benefits would be
$258 million/year in a market covering the larger regional footprint.

I-x | brattle.com
The ratepayer benefits are annual net benefits, estimated for the years 2020 and 2030. If the
regional market grows as assumed in this study, the $55 million/year savings in 2020 is expected
to grow to $1.5 billion/year in 2030. Since these ratepayer benefits are associated with true cost
reductions, they are expected to be sustained over the long-term, beyond 2030.
Emissions of Greenhouse Gases and Other Air Pollutants: The market simulations undertaken
for this effort show that California’s energy policy initiatives will substantially reduce the
emissions of GHGs associated with serving California electricity loads. Our analysis of GHGs
focuses on carbon dioxide, which accounts for 99 percent of all GHG emissions from electric
sector operations. Our estimate of electric-sector CO2 emissions10,11 includes emissions from all
simulated generation sources on the high-voltage grid, including biomass, geothermal, and other
sources that may not necessarily be included in the California Air Resources Board’s GHG
accounting under AB 32. Figure ES-2 shows that the estimated CO2 emissions associated with
serving California retail electricity loads (including CO2 emissions from imported power) will be
approximately 63.6 million metric tons by 2020 (well below recent historical levels of about
90 million metric tons per year in 2010–2013 and 107.5 million metric tons in 1990). These
emissions are projected to decrease further to 49.2 million metric tons by 2030, even under the
Current Practice 1 scenario, without implementing a regional market.12 Furthering California’s
GHG emissions reduction goals by implementing a regional market is estimated to decrease 2030
CO2 emissions associated with serving California loads from 49.2 million to 44.6–45.5 million
metric tons. These projected 2030 CO2 emissions levels are about 58% below California’s 1990
electric-sector CO2 emissions. They are also well below the CO2 emissions limits set by the U.S.
Environmental Protection Agency’s Clean Power Plan (“CPP”) for California’s power sector. We
have interpreted SB 350 as requiring a study of GHG and other air pollutant emissions from the
power sector. This study does not make any assumptions or analyze emissions from other
categories of sources in California, and it does not analyze the potential reactions from other
sectors of the economy when emissions from the power sector change.
10 Note that the emissions results presented in this final report differ slightly from preliminary results
presented on May 24, 2016; all cases were updated to: (1) include CO2 emissions during plant starts
and (2) exclude wheeling-through transactions in California emissions accounting.
11 Our estimates of future CO2 emissions are for all modeled electric generating sources on the high-
voltage grid, including biomass and geothermal.
12 The term “tonne” is meant to mean “metric ton” and two terms are used interchangeably.


I-xii | brattle.com
mandated under the CPP, we assess the potential impact of implementing a regional market
assuming a $15/metric ton carbon price is imposed on electric sector emissions across the western
states outside of California. That sensitivity analysis does not include any assumptions about
how each state might implement their emission reduction plans to comply with specific
environmental regulations, such as the CPP.13
The expanded regional market will also decrease electric-sector emissions of nitrogen oxides (in
part by reducing the need for extensive cycling of California natural gas plants), sulfur dioxide,
and particulate matter emissions within California and WECC-wide.14
The Creation or Retention of Jobs and Other Benefits to the California Economy: The impacts of
a Regional ISO-operated market are expected to create numerous and diverse jobs and economic
benefits to California households and enterprises. We estimate that a regional market, growing
from a CAISO plus PacifiCorp footprint in 2020 to the larger regional market by 2030, will create
9,900–19,300 additional jobs in California, compared to Current Practice, primarily due to
reduced cost of electricity. We estimate that, by 2030, the regional market will increase
statewide household real income, across all income brackets. We estimate statewide household
real disposable income to increase by between 0.1% and 0.2%, an increase in community
incomes equal to $290–550 per household annually by 2030. Moreover, the study results show
that a regional market would lead to higher California Gross State Product, real economic output,
real wages, and state revenue. A regional market with more California-focused renewables
procurement to meet the state’s RPS (instead of more out-of-state procurement) can yield even
greater economic benefits to the state, but there are potential tradeoffs among ratepayer benefits,
local employment, economic impact benefits, and environmental impacts as discussed next.
Environmental Impacts in California and Elsewhere: Our analysis for 2030 shows that
implementing a regional market increases the efficiency of investments in low-cost renewable
energy generation, including investments in new wind and solar resources to meet California’s
RPS. With a more efficient renewable resource expansion to meet the state’s RPS, implementing
a regional market also reduces impacts on land use, biological resources, and water use. The
land-use impact associated with building new wind and solar developments in California is
13 For the purpose of providing context to our results we do, however, compare our CO2 emissions
results to hypothetical mass-based state CO2 standard under the Clean Power Plan as discussed below.
14 Our analyses are subject to important limitations for the purpose of analyzing specific air quality
impacts as discussed further in footnote 23 of Volume I of this report.

I-xiii | brattle.com
reduced by 42,600 acres in Regional 2 and by 73,100 acres in Regional 3. The land use for
deploying new wind and solar outside of California to meet the state’s 50% RPS is reduced by
about 31,900 acres relative to the Regional 3 scenario, if California continues to focus on in-state
development for RPS as is assumed in the Regional 2 scenario.15 The environmental study
inherently reflects tradeoffs between in-state versus out-of-state development. With more of an
out-of-state renewables-procurement focus to meet California’s RPS, land use and impacts on
biological resources are shifted from California to out-of-state. New transmission builds to
support renewable resource development outside of California are likely to further increase out-
of-state land use. Due to a regional market’s more efficient dispatch of generating units across
the West, water use for thermal generators is reduced, specifically for natural gas-fired
combined-cycle units in California, and for natural gas-fired and coal-fired units in the rest of
WECC.
Impacts on Disadvantaged Communities: Our analysis shows that the regional market would
confer economic benefits on disadvantaged communities. We estimate that implementing a
regional market with CAISO plus PacifiCorp in 2020, and expanding to a larger Regional ISO by
2030, would stimulate real income and jobs growth in most of California’s disadvantaged
communities, particularly in the Inland Valley, Greater Los Angeles, and Central Valley
Competitive Renewable Energy Zones (“CREZs”). Real disadvantaged community incomes
would increase by an amount corresponding to $170 to $340 of existing real annual household
incomes, and total full-time employment would rise by 1,300 to 4,600 jobs between 2020 and
2030. A regional market mitigates construction-related adverse environmental impacts by
reducing renewable resource development needs to meet California’s RPS, particularly in the
Westlands area where solar resource development is reduced due to more efficient renewable
integration of a regional market (see the next finding and Volumes IV and XI). Reduced
generation from natural gas-fired generators in California decreases the amount of water used
during power production and provides benefits to disadvantaged communities by decreasing
power plant emissions in the San Joaquin Valley and South Coast air basins.
15 The higher land-use impact of the Regional 3 scenario (compared to Regional 2) relates to the
scenario’s higher share of wind resources and the fact that wind generation requires more land per
MWh of renewable energy than solar generation. Note, however, usually less than 10% of the acreage
within a typical wind site may be disturbed, while the remainder of the land remains undisturbed and
available for other uses (e.g., for range land and farming).

I-xiv | brattle.com
Reliability and Integration of Renewable Energy Resources: A regional market reduces the cost
of maintaining reliability by reducing the need for load-following resources, operating reserves,
and planning reserves. A regional market improves integration of renewables to achieve
California’s 50% RPS by reducing curtailments of renewable resources in a regional market
(relative to current practices based on bilateral trading) and therefore would allow California to
build less renewable generating capacity (megawatts) to meet the same goals. Regional pooling
of resources to meet flexibility reserves allows the region to balance the intermittent output of
wind and solar generation much more efficiently than operating individual balancing areas
independently. These aspects of reliability benefits are quantified in the load diversity analysis
(meeting the same resource adequacy level with less generating capacity) and nodal energy
market simulations (more optimized power flows, reduced curtailments, reduced need for load-
following and operating reserves) of our study. In addition, a regional market increases
operational reliability through a variety of factors, such as better real-time visibility of system
conditions in the larger regional footprint and improved management of unscheduled regional
power flows. Improved management of the existing grid and better regional transmission
planning will additionally reduce the transmission-related renewables integration and generator
interconnection costs. The liquidity and transparency of a regional market will attract renewable
generation investments beyond those needed to meet the RPS requirements of western states.
This means the quantified benefits are a conservatively low estimate in that they do not include
the monetary value of a variety of benefits related to system operations, planning, enhancing
reliability, and more efficiently integrating or interconnecting renewable energy resources in the
rest of the region. These additional operational reliability benefits are described and documented
in detail in Volume IX of this study.
A Regional ISO: Why Now? The analyses show that regional market benefits (1) significantly
depend on the size of the regional market; and (2) increase quickly with California renewable
generation mandate. Experience with the Energy Imbalance Market and other regional markets
show that it takes several years to set up a regional market. Additionally, it takes new
participants several years to obtain the regulatory approvals and undertake the necessary
preparations before they are able to achieve market participation. As a result, it will take a
number of years to achieve a regional market of sufficient size to provide the available regional
market benefits. Thus, the sooner a regional market of sufficient size can be developed, the
sooner California customers will be able to benefit from the investment and operating cost
savings a regional market can provide—particularly as RPS mandates increase over time.

I-1 | brattle.com
Volume I. Purpose, Approach, and Findings of the SB 350 Regional
Market Study
A. PURPOSE OF THE SB 350 STUDY
The purpose of this study is to respond to and comply with the requirements set out in
California’s Senate Bill No. 350—the Clean Energy and Pollution Reduction Act of 2015
(“SB 350”). As part of SB 350, the California Independent System Operator (“CAISO,” “Existing
ISO,” or “ISO”) is required to conduct one or more studies that would analyze the potential
impacts of transforming the Existing ISO into a multistate, regional organization (“Regional ISO”
or “regional market”) by revising the Existing ISO’s governance structure.
To comply with the legislative requirements, the ISO has retained The Brattle Group (“Brattle”),
Energy and Environmental Economics, Inc. (“E3”), Aspen Environmental Group (“Aspen”), and
Berkeley Economic Advising and Research, LLC (“BEAR”) (together with the ISO, the “study
team”) to evaluate the following impacts of a Regional ISO as outlined by SB 350:
Overall benefits to California ratepayers;
Emissions of greenhouse gases and other air pollutants;
The creation or retention of jobs and other benefits to the California economy;
Environmental impacts in California and elsewhere;
Impacts in disadvantaged communities in California; and
Reliability and integration of renewable energy resources.
In addition, SB 350 requires that the modeling and all assumptions underlying the modeling are
made available for public review.16
As part of the study effort, the CAISO developed a schedule that provided stakeholders
opportunities to review and provide input on the: (a) study scope; (b) proposed methodologies;
(c) schedule of the study; and (d) draft results and findings. The details of the stakeholder
16 California Senate Bill 350, Clean Energy and Pollution Reduction Act of 2015, Article 5.5, Section
359.5.(e)(1).

I-2 | brattle.com
engagement process are described in more detail in Volume II. Key modifications made to the
study scope and assumptions based on this stakeholder feedback include the following:
Refined renewable portfolio optimization and cost assumptions for the various renewable
generation technologies, including storage;
Revised the hypothetical regional footprint for 2020 to include only CAISO and
PacifiCorp, instead of a larger footprint previously proposed;
Revised the hypothetical regional footprint for 2030 to include the U.S. portion of the
Western Electricity Coordinating Council (“WECC”) region minus the Federal Power
Marketing Agencies (“PMAs”)—BPA and WAPA—instead of the previously-proposed
entire U.S. WECC;
Ensured that all analyses focused on California are performed for the entire state, not just
the current CAISO footprint;
Conducted various sensitivities as suggested by various stakeholders;
Ensured compliance with current Renewable Portfolio Standards (“RPS”) in the rest of
U.S. WECC (including Oregon’s new 50% RPS by 2040);
Incorporated additional announced coal-fired power plant retirements and renewable
and conventional plant additions from various utilities’ integrated resource plans;
Simulated California and the rest of U.S. WECC in a sensitivity that represents some form
of regional compliance with the EPA’s Clean Power Plan standard; and
Updated load growth, energy efficiency, various demand-side resource inputs, time-of-
use rates, and electric vehicle charging assumptions to be consistent with the California
Energy Commission’s 2015 Integrated Energy Policy Report results.
While this study is conducted in direct response to the California legislative requirement to
assess impact on California and California electricity ratepayers, the study team hopes that the
information and analyses provided will be useful for stakeholders in California and in other states
in conducting their own future analyses of regional market benefits.
B. SB 350 STUDY APPROACH
The study has been conducted jointly by the California ISO and four consulting firms. The
Brattle Group was engaged to lead the effort and to conduct the production cost simulations, a

I-3 | brattle.com
portion of the ratepayer impact analysis, the load diversity analysis, the renewable integration
analysis and, in coordination with the CAISO team, the assessment of reliability impacts. In
addition, The Brattle Group reviewed a large number of other market studies to provide a
reference point for the results of this study and inform a discussion of potential benefits not
quantified. The renewable procurement portfolio and a portion of the ratepayer analysis were
conducted by E3, the environmental study was conducted by Aspen, and the employment and
economic impact analyses were conducted by BEAR. Jointly, Aspen and BEAR also analyzed the
likely environmental and economic impacts on disadvantaged communities in California. For
the purpose of this report, the contributing staff of the California ISO and the four consulting
firm is referred to as the “study team.” The study team developed the study approach and
assumptions, presented the results, released the input data and study results to stakeholders, and
coauthored this report.
1. Scope of the Regional Market
The study approach starts with the geographic scope of the regional market analyzed. We
considered a broad range of potential footprints of a Regional ISO. In response to stakeholder
feedback, study scenarios were developed to analyze bookends for the geographic scope of a
regional market: for 2020, we analyze only CAISO and PacifiCorp (which had approached the
CAISO about becoming a market participant, which would expand the current ISO footprint) as
participants in the regional market; for 2030, we analyze an expanded Regional ISO that, but for
the federal Power Marketing Agencies, includes the rest of the U.S. portion of WECC.17
Similarly, the assumptions on market conditions reflect both a near-term year (2020) with
electric supply, demand, and fuel prices similar to today’s, and a longer-term year (2030) with
significant changes in electric supply, including more installed renewable generation and less
coal-fired generating capacity. The study’s assumed geographic regional footprint and range of
17 Specifically, we excluded the following federal power marketing agencies from the Regional ISO
footprint: Bonneville Power Administration (“BPA”) and Western Area Power Administration
(“WAPA”)—Colorado-Missouri Region, Lower Colorado Region and Upper Great Plains West. The
Sierra Nevada Region is included in the Balancing Area of North California and because it is not a
separate balancing area, was included in the analysis. The power marketing agencies were excluded
from the regional market footprint in response to stakeholder comments that including the entire U.S.
WECC system in the regional footprint was overly optimistic and would consequently overstate the
benefits of a regional market. The power marketing agencies were chosen for exclusion simply by
virtue of their unique operational and regulatory situation and not because of any indication that they
would not be interested in joining a regional market.

I-4 | brattle.com
market conditions are documented in more detail in Volume III. For both study years, the
regional market cases are compared to a Current Practice case that reflects CAISO operations and
bilateral markets in the rest of WECC as-is, without an expanded Regional ISO market.
Our analysis does not make any presumptions about whether or when any of the other Balancing
Authorities in the WECC might join the real-time Energy Imbalance Market (“EIM”). Instead,
by focusing only on day-ahead market simulations (without consideration of any forecasting and
real-time market uncertainties), our analyses exclude any impacts related to the EIM. This
means the benefits analyzed and quantified in our study do not include any that could be (or
would be) achieved by expanding the EIM to the geographic market footprint analyzed for 2030.
Given that an expanded ISO-operated regional market enhances real-time operations beyond
those that could be achieved through a regional EIM, our estimates represent a conservative
estimate of actual benefits because these additional real-time impacts are not quantified in our
study.
2. Baseline Scenarios
We defined five base scenarios, combining the assumed scope of a regional market and
procurement alternatives for achieving California’s 50% Renewable Portfolio Standard
(“50% RPS”):
2020 Current Practice: reflects near-term market conditions. California has developed
enough renewables to meet its 33% RPS. CAISO operates as-is, with no regionalization.
2020 CAISO+PAC: California has developed enough renewables to meet its 33% RPS.
CAISO and PacifiCorp form a Regional ISO. Up to 776 MW of energy transfers from
CAISO to PacifiCorp and 982 MW of transfers from PacifiCorp to CAISO are free of
economic and operational hurdles. CAISO and PacifiCorp resources are committed and
dispatched in a coordinated fashion to meet combined energy and operating reserves
requirements. For any imports into the CAISO region, all of PacifiCorp’s generators,
including coal plants, are assumed to face the same emissions cost as a generic natural gas
combined-cycle generator (a necessary simplification because the simulations cannot
identify unit-specific imports and assign unit-specific allowance costs for imports into
California). This scenario is compared to the 2020 Current Practice scenario to evaluate
the impacts of this very limited market expansion.

I-5 | brattle.com
2030 Current Practice (Current Practice 1): This scenario (previously referred to
“Case 1A” in the preliminary material shared with stakeholders) reflects longer-term
market conditions. California has developed enough renewables to meet its 50% RPS,
with a business-as-usual, in-state procurement focus. CAISO operates only its current
footprint (no regional market). Bilateral markets and trading frictions continue and limit
the sales and exports of excess generation from the RPS portfolios of CAISO entities to
2,000 MW. This means it is assumed in this Current Practice 1 scenario that bilateral
markets would accommodate the re-export/sale of all prevailing existing imports (ranging
from 3,000-4,000 MW per hour) plus achieve the export/sale of an additional 2,000 MW
of (mostly intermittent) renewable resources.
2030 Expanded Regional ISO (Regional 2): reflects longer-term market conditions.
California has developed enough renewables to meet its 50% RPS, with a continued (but
not exclusive) in-state renewables procurement focus. All of the U.S. WECC except for
the federal Power Marketing Agencies (BPA and WAPA) (“WECC without PMAs”) is
part of a Regional ISO.18 All energy transfers among the Regional ISO members are free
of economic and operational hurdles. Regional ISO resources are committed and
dispatched in a coordinated fashion to meet combined energy and operating reserves
requirements. Oversupply from California’s renewables portfolio is more readily
absorbed by the regional marketplace (reflected in a more relaxed 8,000 MW physical
CAISO export limit). This scenario is compared to the 2030 Current Practice (Scenario 1)
to evaluate the impacts of the broader (but still not WECC-wide) regional market with a
continued in-state focus to meet California’s RPS.
2030 Expanded Regional ISO (Regional 3): reflects longer-term market conditions.
California has developed enough renewables to meet its 50% RPS, with more of an out-
of-state procurement focus than in Regional 2. All of the U.S. WECC without PMAs
participates in a Regional ISO. All energy transfers among the Regional ISO members are
free of economic and operational hurdles. Regional ISO resources are committed and
dispatched in a coordinated fashion to meet combined energy and operating reserves
requirements. Oversupply from California’s renewables portfolio is more readily
18 Specifically, the PMAs being excluded for the analysis are Bonneville Power Administration (“BPA”)
and Western Area Power Administration (“WAPA”)—Colorado-Missouri Region, Lower Colorado
Region and Upper Great Plains West. WAPA’s Sierra Nevada Region is included in the Balancing
Area of North California and, because it is not a separate balancing area, was included in the analysis.
I-6 | brattle.com
absorbed by the regional marketplace (reflected in a more relaxed 8,000 MW physical
CAISO export limit). This scenario is compared to the 2030 Current Practice 1 scenario
to evaluate the impacts of the broader (but still not WECC-wide) regional market with
more WECC-wide procurement to meet California’s 50% RPS.
More detailed descriptions of the future scenarios are presented in Volume III. Renewable
portfolios assumed to be used to meet California’s Renewable Portfolio Standard is explained
further in Volume IV.
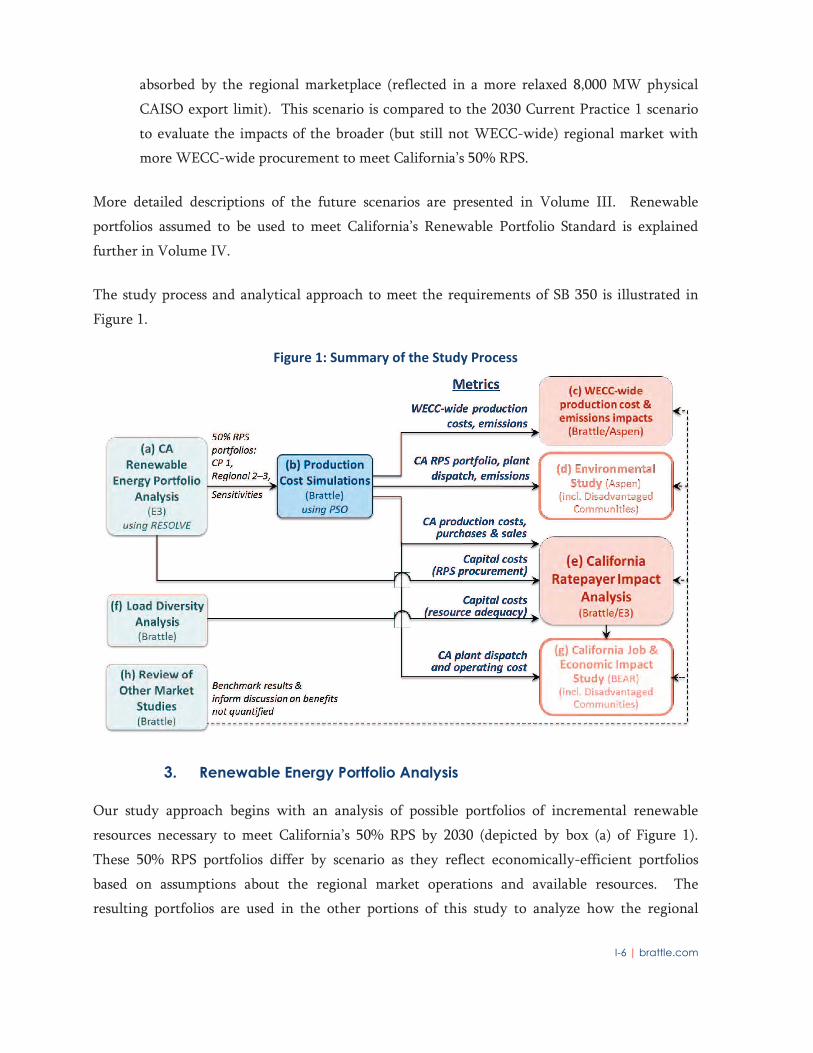
The study process and analytical approach to meet the requirements of SB 350 is illustrated in
Figure 1.
Figure 1: Summary of the Study Process
3. Renewable Energy Portfolio Analysis
Our study approach begins with an analysis of possible portfolios of incremental renewable
resources necessary to meet California’s 50% RPS by 2030 (depicted by box (a) of Figure 1).
These 50% RPS portfolios differ by scenario as they reflect economically-efficient portfolios
based on assumptions about the regional market operations and available resources. The
resulting portfolios are used in the other portions of this study to analyze how the regional

I-7 | brattle.com
market might affect the California. For the projection of plausible renewable generation
portfolios, we use a renewables capacity expansion model—the Renewable Energy Solutions
(“RESOLVE”) model developed by E3—to identify an optimal renewable resource portfolio to
meet California’s 50% RPS for each scenario. We analyze current-practices portfolios with
California-focused procurement (Current Practice 1 and Regional 2), a portfolio with more
regionally-focused procurement (Regional 3), and a number of sensitivities, each of which results
in a different RPS portfolio.
This study is focused on plausible portfolios for achieving the 50% RPS under alternative
assumptions; this study is not endorsing or providing any recommendations for the procurement
of any specific 50% RPS portfolio. The detailed RESOLVE analysis of California renewable
portfolios is presented in Volume IV of this report.
4. Production Cost Analysis
After the assumptions of the renewable portfolios were developed for each of the scenarios
analyzed we conducted detailed production cost simulations of the entire western power grid,
consisting of California and the rest of the WECC (“rest of WECC”)19 (depicted by box (b) of
Figure 1). The production cost simulation tool—Power Systems Optimizer (“PSO”), developed
by Polaris Systems Optimization Inc.—is a nodal, security-constrained least-cost unit
commitment and dispatch model, comparable to the production cost models utilities and RTOs
regularly use for regional transmission and generation resource planning.20 The production cost
simulations were conducted on a deterministic basis (consistent with simulating day-ahead
market conditions, without capturing the uncertainties between the day-ahead and real-time
market and therefore not capturing incremental benefits provided by a full regional real-time
energy imbalance market) for the study years 2020 and 2030 and for the five baseline scenarios
described above.
19 The term “WECC” is often generalized throughout the electric industry to refer to the entire western
electric grid’s physical system (also referred to as the “Western Interconnection”), stakeholders, and/or
markets. When discussing Balancing Authorities, WECC’s system studies, and WECC’s production
cost models we use the term’s specific meaning. Otherwise, we use the term’s more general meaning.
20 Other frequently-used nodal production cost simulation models include software tools such GridView,
Promod, GE-MAPS, Plexos, and Dayzer.

I-8 | brattle.com
The production cost simulations estimate hourly fuel use, production cost,21 generation, and CO2
emissions from each generating resource in California and the rest of WECC, which includes the
western Canadian (British Columbia and Alberta) and northern Mexican portions of the WECC.
To estimate impacts of regional market operations on WECC-wide production costs22 and on
CO2 emissions in California and in the rest of WECC, we compared the results for the Current
Practice scenarios to the results of regional market scenarios (depicted by box (c) of Figure 1).
Using results for unit-specific generation dispatch and generic emissions rates by technology, the
study team then estimated impacts on criteria pollutants and particulate matter in California and
the rest of WECC.
5. Environmental Study
The 50% RPS portfolios and the production cost results are used as an input for the
environmental study (depicted by box (d) of Figure 1).23 The power generated at each of the
21 Production costs include total system-wide operating costs associated with fuel burn, variable O&M,
and emissions allowances.
22 Although this metric is not a requirement of SB 350, it provides important context for the other
impacts we measure.
23 The production cost model does track unit-specific NOx and SO2 emissions. However, as with most
production cost models there are some limitations to interpreting absolute levels of unit-specific air
emissions, since the model does not mimic the precise accounting of emissions rates or control
equipment use found in actual historical data. This is because, absent a material emissions allowance
cost, such as for NOx, SO2, and PM2.5, emissions rates do not affect the models’ unit commitment or
dispatch results. Also, production cost models typically do not have the capability to decide when to
turn emissions control equipment on or off. In addition, our analyses have important limitations for
the purpose of analyzing specific air quality impacts. The production cost analysis conducted for the
SB 350 study was employed at a regional scale, with assumptions about how power may be traded
between California and the rest of the WECC under different market configurations. The production
cost analysis provides a potential dispatch profile for the generators in the region with a given set of
assumptions about the power plants. The SB 350 study involves an analysis of GHG and other air
pollutant emissions changes of the power sector. The study does not make any assumptions or analyze
emissions from other categories of sources in California, and it does not analyze the potential reactions
from other sectors of the economy when emissions from the power sector change. The SB 350 study
does not include an ambient air quality impact analysis of ambient ozone or PM2.5 levels or other air
pollutant concentrations. For the purposes of the Disadvantaged Communities analysis, the regional
modeling output for generators in specific communities was examined only at the air basin level. The
regional modeling utilizes general characteristics of each generator type in the state, not actual
generator specific data, which most of the time are proprietary to the owners of the generators. Thus,
there are limits to how well a regional model can discern specific activities at specific generators when
general characteristics about the generators are used in the simulations. For the Disadvantaged
Continued on next page

I-9 | brattle.com
different types of power plants is used as a basis for estimating air emissions and water-use
impacts. The 50% RPS renewable resource portfolios are used as a basis for estimating land-use
and biological impacts. The environmental study uses a variety of California and national
databases to analyze specific renewable development areas as well as areas that are biologically or
environmentally sensitive. The environmental study approach, assumptions, and detailed results
are presented in Volume IX.
6. California Ratepayer Impact Analysis
Our California ratepayer impact analysis (depicted by box (e) of Figure 1) is composed of several
analytical components: (1) savings associated with more efficient renewables procurement to
meet the state’s 50% RPS; (2) savings associated with a reduced cost of generating or procuring
electric energy to meet California loads; (3) load diversity benefits that reduce the generating
capacity needed to meet the state’s resource adequacy requirements; and (4) savings associated
with reduced Grid Management Charges (“GMC”) that need to be recovered from California
loads to cover the cost of expanded Regional ISO market operations.
Renewable procurement cost savings are value obtained through increased ability to: (a)
to procure lower-cost resources and (b) build less resources to meet the same RPS
requirement due to a reduction in the curtailment of renewable resources. The details of
these investment-related cost savings and the associated analyses are presented in
Volume IV.
Cost reductions from power production, purchases, and sales are based on the production
cost simulation results, utilizing the CAISO’s Transmission Economic Assessment
Methodology (“TEAM”) to estimate the impact on California ratepayers. The TEAM has
been developed by the CAISO to evaluate the potential impact of transmission projects on
California ratepayers. The analysis takes into account California’s use of utility-owned
and utility-contracted generation resources to serve California electricity customers,
while also considering the estimated costs and revenues of the California utilities’
Continued from previous page
Communities analysis, the results do not use any generator specific permit limits, as those are specific
to each source in each air district. Emissions are summed up by air basins. The Disadvantaged
Communities analysis results are based on these basin-wide totals, not emissions from generating
plants in or near the Disadvantaged Communities. Emissions given in this part of the report are for
the annual periods of the two study years and do not show the effect of summer NOx emissions on
ozone levels in Disadvantaged Communities.

I-10 | brattle.com
purchases and sales in the wholesale power market. The results reflect the estimated total
cost of wholesale electricity supplies that California ratepayers would pay for. The details
of the TEAM analysis of California production, purchase, and sales costs are provided in
Volume V.
Load diversity cost savings (depicted by box (f) of Figure 1) are generation procurement
cost savings associated with reducing the amount of generating capacity needed to meet
peak load and planning reserve margin requirements in a larger, more diversified regional
market. These procurement cost savings result from a reduction in capacity required to
serve the reduced joint coincident peak of the regional market area. The details of the
load diversity analysis and the associated annualized generation investment cost savings
are included in Volume VI.
Reduction in ISO operating costs paid by California customers: This portion of the
California ratepayer analysis includes the savings to California customers associated with
the reduction in the portion of the total ISO operating costs that need to be recovered
from California customers through the ISO’s Grid Management Charge. While the total
cost of ISO operations is expected to increase with an expanded regional market, the
higher costs can be spread across a much larger regional footprint, which reduces the
charges per MWh of load served in the region. The GMC-related assumptions and
calculations are presented in Section F of Volume VII.
7. California Job and Economic Impact Analysis
The 50% RPS portfolios, production cost results, and California ratepayer impacts are used as key
inputs to the California job and economic impact study (depicted by box (g) of Figure 3). Within
this analysis, we evaluate the potential employment and overall economic impact on California
associated with differences in renewables procurement and ratepayer costs across the scenarios
analyzed. BEAR used its own statewide economic model to measure how a regional power
market will impact California jobs and the California economy. The model is customized to
reflect California’s economy, and it includes detailed modules for high-level macroeconomic
trends, the transportation sector, the technology sector, and the electric sector. The model has a
detailed occupational component that tracks up to 95 occupations across 200 economic sectors.
The metrics of statewide economic indicators include Gross State Product, real economic output,
real state-wide income, state tax revenues, net number of jobs created, and household real
incomes. The detailed job and economic impact analysis is presented in Volume VIII.

I-11 | brattle.com
8. Impact on Disadvantaged Communities
Both the environmental study and the California job and economic impact study estimate the
impacts on California’s disadvantaged communities.24 The environmental study identifies air
basins that coincide with high concentrations of disadvantaged communities and evaluates the
likely changes in air emissions in those areas. The study identifies key renewable development
areas (Competitive Renewable Energy Zones) that coincide with high concentrations of
disadvantaged communities and evaluates environmental impacts of the 50% RPS portfolios in
those areas. For the job and economic impact study, the study disaggregates results to the
census-tract level to estimate the impacts specific to disadvantaged communities. For the
employment and economic impacts on disadvantaged communities, we focus on the net number
of jobs created and changes in the average household’s real income in disadvantaged
communities. The detailed analyses of impacts on disadvantaged communities are presented in
Volume X.
9. Renewable Integration and Reliability Impacts
The larger, more diversified regional market footprint reduces the cost of integrating renewable
generation resources, including the cost of balancing the intermittent output of these resources.
This, in turn, facilitates the development of renewable resources in the regional market area.
Implementing a Regional ISO-operated market, including a centralized day-ahead unit
commitment process, also increases the reliability of the western power system. Key aspects of
these renewable integration and reliability benefits are quantified in: (1) the load diversity
analysis, which assesses—based on subregional resource adequacy requirements estimated by
WECC with industry-standard loss of load probability analyses—how resource adequacy
requirements can be met with less generating capacity in a regional market (Volume VI of this
report); (2) the nodal market simulations, which simulate more optimized power flows on the
transmission grid, reduced curtailments, and reduced need for ramping, load-following, and
operating reserves at high levels of renewable resource development (Volume V); and (3) the
renewable investment optimization, which recognizes integration benefits when selecting the
renewable portfolios that can meet California’s 50% RPS (Volume IV). Additional operational
24 Disadvantaged communities are defined by the California Environmental Protection Agency, based on
a ranking of several indicators on pollution burden and population characteristics by census tract. All
census tracts (and population within) ranked within the top 25 percentile are considered
disadvantaged within a statewide context.

I-12 | brattle.com
and other aspects of renewable integration and reliability impacts of an expanded ISO-operated
regional market are discussed in Volume XI.
10. Review of Other Regional Market Studies
The study team reviewed a wide range of relevant existing studies of regional market impacts
similar or related to the scope of the SB 350 study requirements to ensure consistency in
methodology; to compare and contrast findings; and to leverage analyses of potential impacts that
are not specifically analyzed and quantified in this SB 350 study (depicted by box (h) of Figure 1).
The types of studies that the study team reviewed include: (a) studies analyzing the integration of
renewable resources in the western U.S.; (b) other U.S. regional market impact studies; and (c)
European experiences with regional market and renewable integration. A summary of this
review of other regional market studies in presented in Volume XII.
C. KEY ANALYTICAL ASSUMPTIONS AND SENSITIVITIES
We developed and applied a number of key assumptions that include data and input from
stakeholders in both California and the rest of the WECC. Based on SB 350 study stakeholder
comments and feedback, we updated projections of California electricity market fundamentals
and other modeling refinements that are necessary to answer questions posed in the SB 350
legislative requirements. Additional analytical assumptions have been included in our analyses
to create detailed representations of the California economy (for the job and economic impact
analyses) and the WECC-wide electricity system (for the renewable portfolio and production
cost simulations). The details about our modeling assumptions can be found in the other
volumes of this study. For the purpose of this study, the most relevant assumptions include:
The assumed scope of regionalization, as discussed above;
Wholesale electricity market fundamentals, including future supply characteristics,
demand, and fuel prices;
The degree to which current practices inhibit trading and more efficient use of system
resources within the WECC area, such as assumed hurdle rates among balancing areas
and the assumed limit on bilateral exports from California;
The degree to which a larger regional market enables more efficient new investments,
such as new renewable resource development needed to meet California’s 50% RPS, new

I-13 | brattle.com
regional transmission to access low-cost renewable generation areas, and renewable
generation investments beyond RPS mandates; and
Cost of GHG emissions, for within California and in the rest of WECC, including the
assumed administrative treatment of the imports into California from the rest of WECC
and the associated GHG emissions, including how those emissions are accounted for
under California’s cap-and-trade system.
In addition to the baseline scenarios discussed above, various sensitivities are used to test how
some study assumptions about future policies and electricity market fundamentals affect our
findings. Specifically, the sensitivity analyses focus on the California renewable generation
procurement costs, overall ratepayer impact, and the changes in emissions, since those results
rely most heavily on the study assumptions. The key categories of sensitivity analyses include:
Renewable portfolio sensitivities: An important question this study addresses is whether,
and by how much, an expanded regional market can benefit California ratepayers by
enabling more efficient and less costly renewable generation development to meet the
California’s future RPS mandates. A Regional ISO-operated market can provide two
benefits to California. First, an expanded market reduces renewable integration costs and
helps to offload the renewables that are surplus to California’s needs in any particular
time period. Second, reducing the operational and economic barriers among WECC’s
balancing areas can reduce curtailments of in-state renewable generation and improve
access to low-cost renewable resource areas and technologies in the rest of the WECC.
The impacts of renewable portfolio options on California ratepayers will be sensitive to
assumptions about the costs and geographic availability of various renewable resources
and technologies. The baseline regional market scenarios analyze the impacts of a mostly
in-state procurement focus (Regional 2) and a more out-of-state procurement focus
(Regional 3). In addition, the study team analyzed a number of sensitivities around the
composition of the renewable energy portfolios that could affect the estimated California
impacts. The renewable resource portfolio sensitivity analyses included evaluations of
the impacts of higher coordination and flexibility in the current bilateral markets, a
doubling of energy efficiency measures envisioned by SB 350, variations on the cost and
availability of renewable technologies, and further increases in the achieved future RPS
to 55%. The assumptions and results associated with these renewable procurement
sensitivities are discussed in more detail in Volume IV.

I-14 | brattle.com
Production cost sensitivities: An important component of the overall impacts to
California ratepayers is the cost of producing or procuring electricity and delivering that
electricity to serve electricity customers (“production cost”). Production costs mostly
consists of fuel, variable O&M, generating plant start-up costs, and emissions allowance
costs. The separate operations of individual balancing areas (of which there currently are
38 in the entire WECC) can create material operational inefficiencies and hurdles to
trading that limit how efficiently low-cost resources can be dispatched to serve the
collective needs of the larger WECC-wide power system. For example, under the current
bilateral market framework, it would be more difficult for California entities to schedule
and export power during oversupply conditions created by a high-renewable-generation
future. Bilateral trading inefficiencies can also prevent the higher utilization of lower-
cost resources to provide energy, system flexibility (load-following), operating reserves,
and other system services. By reducing such inefficiencies and trading barriers, an
expanded regional market can yield significant production cost savings to California and
across the WECC. These production cost impacts will be sensitive to both the magnitude
of system flexibility under current-practice system operations and the geographic size of
the regional market.
To assess the sensitivities around these assumptions, the study team analyzed five sets of
production-cost sensitivity analyses: (1) one that evaluates the potential impacts of lower
barriers in the bilateral trading market (i.e., “2030 Current Practice 1B,” representing
higher bilateral flexibility); (2) one that isolates the impact of regional market operations
while keeping the renewable portfolios the same in both the current practice and
regional market simulations (i.e., without changing the renewable portfolio assumptions);
(3) one that hypothetically assumes a larger regional market footprint even under near-
term market conditions (i.e. 2020 with an expanded WECC without PMA regional
market footprint); (4) one without the additional renewable resource developments
beyond RPS that are assumed to be facilitated by a regional market; and (5) one that
simulate GHG regulations in the rest of WECC region as a proxy for CPP compliance.
The assumptions and results associated with these production cost sensitivities are
presented in more detail in Volume V.
Air emissions sensitivities: One of the requirements under SB 350 is to analyze the
potential regional market impact on air emissions, particularly on GHG emissions, in
California and elsewhere. The study team interpreted the requirement to include an
analysis of how an expanded ISO-operated regional market could affect the air emissions

I-15 | brattle.com
from the electricity sector in California and the rest of WECC. Subject to carbon-related
penalties imposed on generators in California and elsewhere, and the extent of renewable
development across the region, a regional market will increase the efficient usage of
lower-cost generation. In this context, the study team analyzed two sensitivities to better
understand the extent to which regional market operations may affect GHG emissions in
California and across the WECC. One sensitivity assumes a $15/tonne CO2 emissions
allowance cost across the WECC outside of California; another sensitivity assumes that
higher renewables development beyond RPS does not materialize in the regional market.
The assumptions and results associated with these sensitivities are discussed in more
detail in Volumes V and IX.
These sensitivity analyses were developed in direct response to stakeholder feedback, capturing a
wide range of stakeholder suggestions. Stakeholders suggested that additional scenarios and
sensitivities be conducted, including (but not limited to): (a) alternative regional footprints to
consider, (b) alternative assumptions on renewables technology development costs and
availabilities, (c) alternative assumptions on electricity market fundamentals (e.g., load, electric
vehicle adoption, energy efficiency), and (d) the amount of renewable resources that would be
developed beyond the collective RPS requirements across WECC. Many of these additional
sensitivities are analyzed and presented in Volumes IV and V from a renewable procurement
portfolio and production cost perspective. A summary and description of all scenarios and
sensitivities analyzed is presented in Volume III.
D. PORTFOLIOS TO MEET CALIFORNIA’S 50% RENEWABLE PORTFOLIO STANDARD
The study team began the SB 350 study by developing plausible future renewable resource
portfolios that would cost-effectively satisfy California’s 50% RPS in 2030. To examine the
potential impact of expanded regional market operations across different renewable portfolios,
E3 used the RESOLVE production simulation and capacity expansion model. The model solves
for least-cost renewable portfolios based on different assumptions about operational friction and
the cost and magnitude of available renewable resources that California could procure from
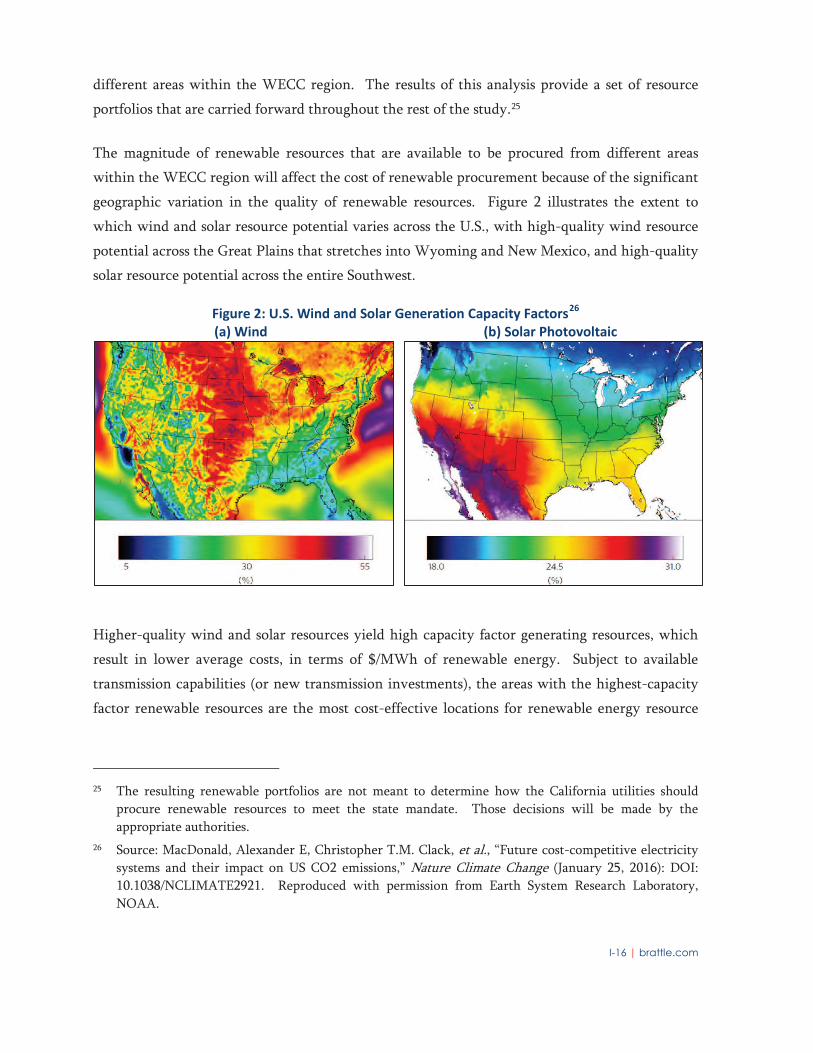
I-16 | brattle.com
different areas within the WECC region. The results of this analysis provide a set of resource
portfolios that are carried forward throughout the rest of the study.25
The magnitude of renewable resources that are available to be procured from different areas
within the WECC region will affect the cost of renewable procurement because of the significant
geographic variation in the quality of renewable resources. Figure 2 illustrates the extent to
which wind and solar resource potential varies across the U.S., with high-quality wind resource
potential across the Great Plains that stretches into Wyoming and New Mexico, and high-quality
solar resource potential across the entire Southwest.
Figure 2: U.S. Wind and Solar Generation Capacity Factors26
(a) Wind (b) Solar Photovoltaic
Higher-quality wind and solar resources yield high capacity factor generating resources, which
result in lower average costs, in terms of $/MWh of renewable energy. Subject to available
transmission capabilities (or new transmission investments), the areas with the highest-capacity
factor renewable resources are the most cost-effective locations for renewable energy resource
25 The resulting renewable portfolios are not meant to determine how the California utilities should
procure renewable resources to meet the state mandate. Those decisions will be made by the
appropriate authorities.
26 Source: MacDonald, Alexander E, Christopher T.M. Clack, et al., “Future cost-competitive electricity
systems and their impact on US CO2 emissions,” Nature Climate Change (January 25, 2016): DOI:
10.1038/NCLIMATE2921. Reproduced with permission from Earth System Research Laboratory,
NOAA.

I-17 | brattle.com
development for meeting the region’s RPS requirements and for meeting demand for renewable
generation from customers that goes beyond RPS mandates.
As discussed above, E3 used its RESOLVE model to select the least-cost portfolios of renewable
resources and integration solutions for meeting California’s 50% RPS in 2030 for each of the
various baseline scenarios and sensitivities. The model selects an optimal portfolio of solar, wind,
geothermal, biomass, and small hydroelectric generating resources based on assumed technology
costs and system constraints.27 In all scenarios and sensitivities, the model assumes cost-effective
renewable integration solutions are available, including: time-of-use retail rates, growth in
electric vehicles with workplace charging, new pumped storage and geothermal capacity, and
new energy storage resources. Resources are added to ensure 50% of the energy for load is met
by renewable resources despite curtailed output in the energy market. Renewable energy
resources are curtailed if the output cannot be consumed in California or be exported to
neighboring systems during periods of oversupply with insufficient flexibility in the bilateral or
regional markets to absorb the power.28 Additional renewable resources are added to the
portfolio if necessary to replace the curtailed output. This means that renewable curtailments are
valued at their replacement cost and thus the total cost of the portfolio increases with the level
and frequency of curtailments.
All scenarios start with the same portfolio of renewable resources (assumed under contract) to
meet a 33% RPS by 2020, based on the California Public Utility Commission’s (“CPUC’s”) RPS
Calculator (version 6.1; “RPS Calculator”). The 33% RPS portfolio assumes compliance with the
CPUC’s Storage Decision and significant growth in behind-the-meter solar photovoltaic (“PV”)
generation as projected by the CEC in its 2015 Integrated Energy Policy Report (“IEPR”).29
27 Geothermal, hydroelectric, and biomass were not originally chosen for the least-cost portfolio.
However, in the interest of providing a more diverse portfolio for the analysis we included an
additional 500 MW of geothermal and 500 MW of pump storage in all portfolios. Additional other
fuel-types could meet these requirements in the ultimate 2030 portfolios.
28 The simulated renewable contracts assume the seller of the renewable generation is fully compensated
for any curtailed output.
29 California Public Utilities Commission, Decision Adopting Energy Storage Procurement Framework
and Design Program, Decision 13-10-040, Rulemaking 10-12-007, decision issued October 21, 2013.
California Energy Commission, 2015 Integrated Energy Policy Report, CEC-100-2015-001-CMF, June
29, 2016.

I-18 | brattle.com
For 2030, the analysis assumed that all California load-serving entities procure enough
incremental renewable generation to meet the state’s 50% RPS. To do so, the study team
employed various assumptions about future resource availability, as summarized below. The
total in-state renewable potential, shown in Figure 3, is based on the RPS Calculator, with some
modifications to reflect tailored study areas defined by the environmental study team (discussed
in Section F.4 below). In the Current Practice 1 and Regional 2 scenarios (both focused on in-
state procurement), the out-of-state renewable generation potential for meeting California’s RPS
mandate is constrained to include only the out-of-state resources potential that is estimated to be
deliverable on the existing grid without requiring major new transmission investments.
Resources that would require major new interregional transmission projects are excluded. In the
Regional 3 scenario (with a more regional procurement focus), the portfolio considers both
renewable resources that can be delivered through existing transmission as well as those that
would require major new transmission investment. Figure 4 shows the assumed out-of-state
resource potential in each of these scenarios.
Figure 3: California Renewable Potential Considered in RESOLVE
Incremental to 33% Portfolio in CAISO
Resource Zone Potential (MW)
Geothermal Greater Imperial 1,384
Northern California 424
Subtotal 1,808
Solar PV Central Valley & Los Banos 1,000
Greater Carrizo 570
Greater Imperial 1,317
Kramer & Inyokern 375
Mountain Pass & El Dorado -
Northern California 1,702
Riverside East & Palm Springs 2,459
Solano 551
Southern California Desert -
Tehachapi 2,500
Westlands 1,450
Subtotal 11,924
Wind Central Valley & Los Banos 150
Greater Carrizo 500
Greater Imperial 400
Riverside East & Palm Springs 500
Solano 600
Tehachapi 850
Subtotal 3,000
Total California Renewable Potential 16,732

I-19 | brattle.com
Figure 4: Out-of-State Resource Potential Included in RESOLVE
Incremental to 33% Portfolio in CAISO
Resource Description Potential (MW)
Current
Practice 1
Regiona
l 2
Regiona
l 3
Arizona Solar PV High quality solar PV resource,
available for delivery on existing
transmission system
1,500 1,500 1,500
New Mexico
Wind 1
Highest quality wind resource,
requires new transmission
investment
- - 1,500
2
Medium quality wind resource,
requires new transmission
investment
- - 1,500
3
Lowest quality wind resource,
available for delivery on existing
transmission system
1,000 1,000 1,000
Oregon Wind Low quality wind resource,
available for delivery on existing
transmission system
2,000 2,000 2,000
Wyoming Wind
1
Highest quality wind resource,
requires new transmission
investment
- - 1,500
2
Medium quality wind resource,
requires new transmission
investment
- - 1,500
3
Lowest quality wind resource,
available for delivery on existing
transmission system
500 500 500
Total Out-of-State Resources Available 5,000 5,000 11,000
The assumptions on cost and performance for renewable technologies, transmission for
renewables, and storage, were all modified based on stakeholder feedback. These assumptions
are documented in detail in Volume IV.
RESOLVE is an investment and operational model designed to inform long-term planning
questions around renewables integration in California and other systems with high penetration
levels of renewable energy. RESOLVE co-optimizes investment and dispatch over a multi-year
horizon with one-hour dispatch resolution for a study area, in this case the CAISO footprint.
The model incorporates a geographically simplified representation of the neighboring regions in
the West to characterize and constrain flows into and out of the ISO footprint. RESOLVE
identifies the optimal investments in renewable resources, various energy storage technologies,
new natural gas plants and natural gas plant retrofits (if any were needed), subject to an annual
constraint on delivered renewable energy that reflects the RPS policy, a resource adequacy
constraint to maintain reliability, constraints on operations that are based on a linearized version
of zonal unit commitment and feedback from the ISO, and scenario-specific constraints on the

I-20 | brattle.com
ability to develop specific renewable resources in various areas. Informed by the RESOLVE
results for the CAISO area, E3 also selected a renewable portfolio for the rest of the state
independently to meet the 50% RPS mandate because the RESOLVE model only contained
information for load serving entities inside the CAISO and additional resource procurement
assumptions for the rest of California needed to be developed outside of the RESOLVE model.
The Resulting 50% RPS Portfolios. Figure 5 shows the resulting 50% RPS portfolios for
California for the three 2030 baseline scenarios. These portfolios are incremental to what has
been contracted to meet the state’s 33% RPS by 2020. These 2030 portfolios are used as key
inputs to the remainder of this SB 350 study:
Current Practice 1 (current practice, no regional market): Relative to the 33% RPS
starting point, California would need to procure 16,652 MW of renewable generation,
with about 2/3 in-state and 1/3 out-of-state using existing transmission. About half is
from utility-scale solar (8,601 MW) and half from wind (7,551 MW), with a small amount
of geothermal (500 MW). All resources are procured as a whole (i.e., energy, capacity,
and renewable energy credits), with the exception of 1,000 MW of northwest wind and
1,000 of southwest solar, which are assumed to be procured by California only for their
renewable energy credits.
Regional 2 versus Current Practice 1: In this regional market case with a continued focus
on in-state renewables, California procures slightly more in-state solar (+203 MW),
significantly less in-state wind ( 1,100 MW), less out-of-state wind from the Northwest
( 885 MW), and more southwest solar (+500 MW). Overall, California procures fewer
MW of renewable generation capacity ( 1,282 MW) to produce the same GWh of
renewable energy production as a result of reduced renewable generation curtailments
due to the expanded export constraints offered through regional market operations in the
Regional 2 scenario.
Regional 3 versus Current Practice 1: In this regional market case with a shift toward
relying on lower-cost renewable resources in the larger western region, California
procures significantly less in-state solar ( 4,161 MW) and in-state wind ( 1,100 MW),
more out-of-state wind (+1,644 MW), and more southwest solar (+500 MW). Overall,
California needs to procure much less renewable energy resource capacity ( 3,118 MW)
to meet the same GWh renewable energy production needs, due to reduced curtailment
and more of out-of-state procurement of high-capacity-factor wind in resources in
Wyoming and New Mexico in the Regional 3 scenario.
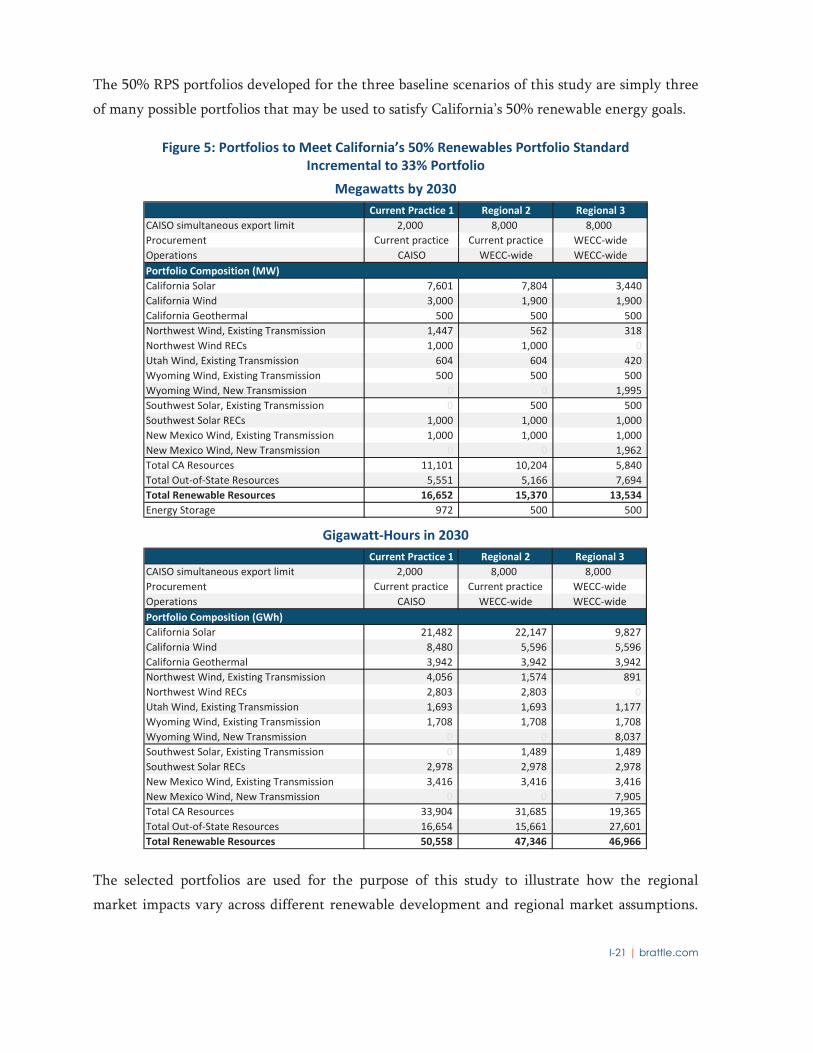
I-21 | brattle.com
The 50% RPS portfolios developed for the three baseline scenarios of this study are simply three
of many possible portfolios that may be used to satisfy California’s 50% renewable energy goals.
Figure 5: Portfolios to Meet California’s 50% Renewables Portfolio Standard
Incremental to 33% Portfolio
Megawatts by 2030
Gigawatt-Hours in 2030
The selected portfolios are used for the purpose of this study to illustrate how the regional
market impacts vary across different renewable development and regional market assumptions.
Current Practice 1 Regional 2 Regional 3
CAISO simultaneous export limit 2,000 8,000 8,000
Procurement Current practice Current practice WECC-wide
Operations CAISO WECC-wide WECC-wide
California Solar 7,601 7,804 3,440
California Wind 3,000 1,900 1,900
California Geothermal 500 500 500
Northwest Wind, Existing Transmission 1,447 562 318
Northwest Wind RECs 1,000 1,000 0
Utah Wind, Existing Transmission 604 604 420
Wyoming Wind, Existing Transmission 500 500 500
Wyoming Wind, New Transmission 0 0 1,995
Southwest Solar, Existing Transmission 0 500 500
Southwest Solar RECs 1,000 1,000 1,000
New Mexico Wind, Existing Transmission 1,000 1,000 1,000
New Mexico Wind, New Transmission 0 0 1,962
Total CA Resources 11,101 10,204 5,840
Total Out-of-State Resources 5,551 5,166 7,694
Total Renewable Resources 16,652 15,370 13,534
Energy Storage 972 500 500
Portfolio Composition (MW)
Current Practice 1 Regional 2 Regional 3
CAISO simultaneous export limit 2,000 8,000 8,000
Procurement Current practice Current practice WECC-wide
Operations CAISO WECC-wide WECC-wide
California Solar 21,482 22,147 9,827
California Wind 8,480 5,596 5,596
California Geothermal 3,942 3,942 3,942
Northwest Wind, Existing Transmission 4,056 1,574 891
Northwest Wind RECs 2,803 2,803 0
Utah Wind, Existing Transmission 1,693 1,693 1,177
Wyoming Wind, Existing Transmission 1,708 1,708 1,708
Wyoming Wind, New Transmission 0 0 8,037
Southwest Solar, Existing Transmission 0 1,489 1,489
Southwest Solar RECs 2,978 2,978 2,978
New Mexico Wind, Existing Transmission 3,416 3,416 3,416
New Mexico Wind, New Transmission 0 0 7,905
Total CA Resources 33,904 31,685 19,365
Total Out-of-State Resources 16,654 15,661 27,601
Total Renewable Resources 50,558 47,346 46,966
Portfolio Composition (GWh)

I-22 | brattle.com
This study is not meant to provide any recommendations or advice about the actual composition
of California’s future renewable procurement activities.
In addition to the baseline scenarios, the optimal procurement of renewable generation portfolios
were evaluated for the following sensitivities: high coordination under bilateral markets, high
energy efficiency, high flexible loads, low portfolio diversity, high rooftop photovoltaic solar,
high out-of-state availability, high RPS (55%), and lower solar cost.
E. PRODUCTION COST SIMULATIONS
The study’s production cost simulations provide estimates of how the western wholesale electric
system might respond to a regional ISO-operated market. Incorporating the 50% RPS portfolios
and a number of other assumptions, the production cost simulations estimate generator-specific
electricity production, fuel use, CO2 emissions, and production costs (cost of fuel, emissions, and
variable O&M) for the entire WECC region subject to available transmission capabilities,
transmission charges, and transactions costs related to bilateral trading. These results are inputs
to the ratepayer impact analysis, the economic and jobs analysis, and the air emissions analysis.
We simulated five baseline scenarios and six sensitivities using Power Systems Optimizer, a
software tool developed by Polaris Systems Optimization, Inc. PSO is a state-of-the-art
production cost simulation tool that simulates least-cost, security-constrained unit commitment
and economic dispatch with a full nodal representation of the entire regional transmission
system, similar to the unit commitment and dispatch performed during actual ISO operations.
1. General Simulation Assumptions
As a starting point to the simulations, we relied on the data contained in CAISO’s own
“Gridview” production cost model used for its 2015/16 Transmission Planning Process (“TPP”).
This ISO transmission planning model is based on the 2024 model developed by WECC’s
Transmission Expansion Planning Policy Committee (“TEPPC”) but contains a number of
refinements to the CAISO portion of the grid. Based on this model as the starting point, we
updated key assumptions on California loads, distributed solar, natural gas prices, California GHG
prices based on CEC’s 2015 IEPR data, and the transmission grid topology for 2020 and 2030.
We also updated transmission charges (“wheeling rates”) between WECC Balancing Authorities,
the representation of planned WECC transmission projects, the modeling of pumped storage
hydroelectric generators, and the unit-commitment and startup specifications for natural gas-

I-23 | brattle.com
fired generators. A more detailed description of PSO simulation assumptions is presented in in
Volume V.
The five baseline scenarios reflect a 2020 and 2030 western wholesale electricity market with
and without expanded ISO market operations, as described in Section I.B above. In the 2020
Current Practice and 2030 Current Practice 1 scenarios, we simulate a wholesale market that
operates similarly to today’s, with the CAISO-operated portion of California and the rest of the
WECC system, consisting of 37 other balancing areas. The production cost simulations include
economic and operational hurdles between WECC balancing areas, as well as limited sharing of
generating capacity to meet operating reserve and load-following requirements. California’s
ability to sell oversupply from wind and solar resources is limited by assumed bilateral trading
barriers. In the three regional market cases—2020 CAISO+PAC, 2030 Expanded Regional ISO 2
(Regional 2), and 2030 Expanded Regional ISO 3 (Regional 3)—we eliminate the economic and
operational trading hurdles among the areas within the assumed regional market footprint,
consistent with actual system operations in an ISO-operated regional market. We recognize that
the broader regional market footprint, which provides market access to the low-cost renewable
generation within the WECC region, will facilitate the development of more renewable
generation beyond states’ existing RPS than under current practices, consistent with the
comments recently provided by some of the renewable generation and environmental
stakeholders and the experience to date from other regional markets with access to low-cost
renewable generation. The specific assumptions for the five baseline scenarios are described in
more detail in Volumes III and V. The regional market experience with integration and
facilitation of renewable generation is discussed in Volumes XI and XII.
2. Simulated Production Cost Results
The market simulations show that the lower economic and operational hurdles of a regional
market reduce region-wide production costs. Cost reductions are driven by more sharing of
generating capacity to meet operating reserve requirements and better utilization of low-cost
resources compared to current practice operations by individual Balancing Authorities. The
additional wind and solar resources facilitated by a regional market, which have negligible
variable operating costs and no emissions associated with their generation output, further reduce
production costs, both on a WECC-wide basis and within California. We estimate the wholesale
production cost across the WECC to assess the impacts of regionalization on system-wide
operating costs. These impact the estimated cost reduction associated with lower fuel, variable
O&M, and start-up costs. Even though SB 350 does not specifically require the study to assess

I-24 | brattle.com
the changes on production cost across the entire West, this metric is useful to develop a better
understanding of how a Regional ISO would utilize and dispatch the resources on its system and
how that change in dispatch would affect WECC-wide production costs.
The results of the simulated regional electricity system show that the WECC-wide production
cost savings in 2020 are modest ($18 million per year) due to the very limited scope of the
regional market (CAISO+PAC) and the conservative modeling assumptions employed (such as
assumed optimal dispatch within existing balancing areas, normal system conditions, generic
plant and fuel cost assumptions, and no transmission outages). In 2030, the simulations show
significantly higher production cost savings, ranging from $883 million to $980 million per year
(4.5–5% of total production costs) under the larger regional footprint (U.S. WECC without
PMAs) and with the facilitation of additional renewable generation. These production cost
savings are merely the reduction in variable generation costs; they do not represent net WECC-
wide savings by themselves because they do not yet consider other benefits nor the cost of
additional resources built. Nonetheless, the production cost savings results for individual areas
within WECC are one component of ratepayer impacts in those areas. The estimated WECC-
wide production cost savings results for the three baseline scenarios (and two sensitivities
discussed below) are shown in Figure 6.
Figure 6: WECC-Wide Annual Production Cost Savings in 2020 and 2030
(Excludes emissions-related costs & incremental renewable investment costs)

I-25 | brattle.com
As shown by the blue circles in Figure 6, the two sensitivity analyses of these 2020 and 2030
baseline results show that: (1) estimated 2020 production cost savings for the larger regional
footprint (U.S. WECC without PMAs) are $171 million/year (1.1% of WECC-wide production
costs), which shows that regional-market savings grow significantly as the market size expands
beyond CAISO+PAC and more balancing areas are consolidated into a regional market; (2) 2030
regional market operations for Scenario 3 without the additional beyond-RPS renewables are
estimated to yield $335 million in annual savings (1.7% of WECC-wide production costs),
showing that the benefits of a large regional market more double as an increased amount of
renewable generation needs to be integrated and balanced in the system.
3. Simulation Approach and Assumptions that Produce Conservatively
Low Production Cost Savings
The estimated levels of production cost savings are conservatively low because of the simulation
approaches and assumptions employed. Similar to most other prospective market integration
studies, the limitations inherent in the simulations undertaken for this study will lead to
conservatively low estimates of production cost savings. These limitations include:
The production cost simulations are based on normal weather, normal hydrology, normal
load, and normal generation outages without considering additional benefits during
unusually challenging market conditions. Examples of such challenging conditions not
simulated include the recent California Aliso Canyon-related system constraints, extreme
weather patterns that could create large swings of power flows across a system, or
draught conditions, limiting the availability of hydro resources. These types and other
challenging conditions tend to significantly increase the benefit of larger regional
markets.
The simulations do not consider the additional transmission constraints on the power grid
during transmission-related outages. During transmission-related outages, the system
will be constrained, which means the greater flexibility provided by integrated regional
market operations yields higher cost savings and improved reliability.
We do not assess the benefits of improved management of uncertainties between day-
ahead and real-time operations, only some of which will be captured by the Energy
Imbalance Market. Having a larger regional market provides the system operator with a
larger pool of resources to manage unexpected changes of generation and load between
the day-ahead and real-time operations, thereby reducing costs, reducing the need for
I-26 | brattle.com
reserves and ramping capability, and increasing reliability, particularly when integrating
large amounts of variable generation.
We do not include the additional value associated with more efficient utilization of the
existing grid compared to current practices, which leave existing transmission capabilities
underutilized by between 5–25%. For example, the significant congestion experienced
on the California-Oregon border—historically causing congestion charges of
$60-150 million/year—is not visible in the current practices simulations.30 Such
congestion charges are associated with scheduling constraints that prevent the use of the
transmission system’s full physical capability. We do not simulate any such scheduling
constraints in the Current Practice scenarios. In a regional market, the constraints are
relieved, thereby increasing the efficient use of existing grid beyond the impacts captured
in our simulations.
We do not assume that the improved incentives would improve generator efficiency and
availability evident in regional markets.
Other than through trading margins and CAISO bilateral export limits, the simulations do
not fully capture inefficiencies of current trading practices in terms of less flexible
bilateral trading blocks (e.g., 16 hour blocks at 25 MW increments), contract path
scheduling, and congestion caused by unscheduled power flows.
The simulations do not capture any benefits achievable through improved regional
coordination and optimization of hydro power resources. We have left hydro dispatch
unchanged between the current practices and regional market cases, leaving out value
associated with allowing the hydro resources to be dispatched optimally by the regional
ISO (subject to their operating constraints) to reduce region-wide production costs.
The simulations conservatively assume perfectly optimized, security-constrained unit
commitment and dispatch within every individual WECC balancing area even under the
Current Practice scenario. This assumption alone is estimated to understate regional
market benefits by approximately 2% of total production costs, which would add
approximately $200 million/year to 2030 production cost savings.31
30 This will understate the inefficiencies measured in the current practices scenario and thus reduce the
estimated savings achievable in a more efficiently-dispatched regional market.
31 See Volume XII. For example, Wolak (2011) found that even moving from a zonal market design
(previous CAISO market design) to a security-constrained nodal market design offers benefits
Continued on next page

I-27 | brattle.com
Just as many other regional market studies have adopted similarly conservative modeling
assumptions, the magnitude of the estimated production cost savings in this study is within the
range of savings found in other market studies. For example, most of the market integration
studies relying on prospective analyses estimated production cost savings from implementing
regional energy markets at 1–3% of total production costs (including when starting from EIM-
type markets). In contrast, and as discussed further below and in Volume XII of this report,
most retrospective analyses of regional market benefits (analyzing regions and time periods with
more modest penetrations of intermittent renewable resources) have found production cost
savings in the range of 2–8% of total production costs.
The higher benefits measured in retrospective analyses of regional market integration confirm
the limitations and conservative nature of our estimated production cost savings. For example, a
2015 study by the Southwest Power Pool (SPP) analyzing the impact of moving from a region-
wide energy imbalance market with de-pancaked transmission rates to a system with full ISO-
operated regional market estimated incremental savings equal to 4.8% of total production costs,
well beyond the 3.2% savings already achieved by SPP’s prior region-wide imbalance market and
elimination of pancaked transmission charges.32
F. IMPACTS OF A REGIONAL MARKET ON CALIFORNIA AND THE REST OF THE WEST
This section summarizes the results responsive to the specific study requirements set out in
SB 350. These results show that a larger ISO-operated regional market can create significant
value to California ratepayers, decrease overall GHG emissions in and outside of California,
reduce environmental impact in California and elsewhere, increase jobs and economic activities
in California, and improve the conditions of California’s disadvantaged communities. These
impacts are estimated to be small in 2020, with a very small increase in GHG emissions for the
rest of WECC due to a slight increase in coal-fired generation outside of California. The benefits
of a regional market increase significantly with the expansion of the market footprint, reducing
emissions and the costs associated with the integration of larger amounts of renewable
Continued from previous page
approximately equal to 2.1% of production cost savings. A similar benefit has been documented for
moving from a zonal to nodal market design in Texas.
32 See Volume XII. Many aspects of SPP resemble the WECC (on a smaller scale), with major load
centers in one portion of the footprint (the southeast), distant areas with low-cost renewable
generation (the Great Plains), and significant reliance on natural gas and coal-fired generation.

I-28 | brattle.com
generation resources to meet California’s 50% RPS. These longer-term emissions and cost
reductions provide strong evidence that the creation and expansion of a regional ISO-operated
market can create significant value for California and the western power market as a whole.
1. Overall Impact on California Ratepayers
To assess the impact on California ratepayers, we analyzed the extent to which regional market
participation would affect annual cost of electricity supply for California customers. The analysis
focuses on four main categories of costs that will be affected by expanding ISO-operations to a
regional market:
Annual renewable procurement costs related to meeting California’s 50% RPS: These
costs are estimated through RESOLVE model simulations, reflecting renewable
investment and other fixed costs, including the costs of storage and transmission needed
to integrate these renewable resources;
California’s net costs associated with production, purchases, and sales of wholesale power:
These costs are estimated from production cost simulation results and by applying the
CAISO’s Transmission Economic Assessment Methodology (TEAM);
California’s capacity cost savings from regional load diversity: These costs are based on
an analysis of the diversity of historical hourly load patterns, and the associated cost
savings are based on the reduction in generating capacity needed to meet the lower
region-wide coincident peak load (compared to the sum of individual balancing areas’
peak loads); and
Reduction in Grid Management Charges (GMC) to California ratepayers: These costs are
estimated based on projected ISO revenue requirement for operating a regional market,
and the savings are driven by the lower average rates estimated for system operations and
market services in a larger footprint.
As summarized in Figure 7 below, the analysis of California ratepayer impacts from an expanded
regional market shows estimated annual net savings of $55 million/year (0.1% of retail rates) in
2020 under the CAISO+PAC scenario compared to the 2020 Current Practice baseline. These
annual net savings are projected to grow to $1.0–$1.5 billion/year (2–3% of retail rates) by 2030
for the expanded regional footprint (U.S. WECC without PMAs). The lower end of this range is
associated with a continued focus on in-state procurement of renewable resources to meet the
state’s 50% RPS (Regional 2), while the higher end of this range is associated with a renewable

I-29 | brattle.com
procurement approach that relies on more out-of-state resources (Regional 3). These estimated
ratepayer benefits are annual net benefits, estimated for the years 2020 and 2030. If the regional
market grows as assumed in this study, the $55 million/year annual savings in 2020 are expected
to grow over time to $1.5 billion/year in 2030. Since these annual ratepayer benefits are
associated with true cost reductions, they are expected to be sustained over the long-term,
beyond 2030.
Figure 7: Estimated Annual California Ratepayer Net Benefits
As shown in Figure 7 (the bottom portion of the 2030 bars), approximately $680–$800 million of
the estimated savings in 2030 are associated with the reduction in the annual capital investment
costs related to the renewable procurement necessary to meet California’s 50% RPS. The range
of the RPS-portfolio-related annualized investment costs savings depends on California’s
willingness and ability to rely on lower-cost renewables from outside of California (Regional 2
vs. 3) and the costs associated with building the transmission needed to deliver the resources to
the expanded regional market. Under the 2030 Current Practice 1 scenario, the annual costs of
procuring the necessary renewable resources increase as renewable curtailments increase and the
need to build more renewables to meet the RPS requirements increases with it. The costs of
procuring renewable resources decrease if California were able to export more of the oversupply
under the current practices bilateral trading model (as estimated for a high-flexibility Current
Practice 1B sensitivity, as discussed further below). Further details on underlying modeling
approach, key input assumptions, sensitivity analyses, and results are provided in Volume IV.

I-30 | brattle.com
As shown in the dark blue slices of the bars in Figure 7, we estimated that the expansion of the
regional market will create 2030 annual savings of $104–$523 million/year associated with
California’s net costs of production, purchases, and sales of wholesale power. This portion of the
2030 California ratepayer savings comes from: (a) lower production costs of owned and
contracted generation to meet load; (b) reduced purchase costs when load exceeds owned and
contracted generation (higher in Regional 2 with more REC-only purchases); and (c) higher
revenues when selling into the wholesale market during hours with excess owned and
contracted generation (we conservatively assume power is sold at no less than $0/MWh in these
baseline estimates). The production and purchase/sale cost impacts capture the increased
efficiency of trades due to de-pancaking of transmission charges, reduced operating reserves,
regionally optimized unit commitment, and economically-optimized dispatch of generation in
the day-ahead market, subject to the available transmission capabilities. Further details on
production cost simulations and the calculation of California costs associated with production,
purchases, and sales under the TEAM approach are provided in Volume V.
As shown by the third (sky blue) slice of the bars in Figure 7, the integration of existing
balancing areas into a broader ISO-operated regional market yields savings related to load
diversity, allowing for the reduction of investments in resources necessary to meet system-wide
and local resource adequacy requirements. These resource adequacy-related benefits of load
diversity can be assessed from either a reliability perspective (e.g., by holding generation
investments constant and analyzing the benefit of improved reliability) or from an investment-
cost perspective (e.g., by holding the level of reliability constant and analyzing the reduction in
generation investment needs). For this study, we estimated the likely benefits associated with
capturing the diversity of load patterns across a larger regional market by holding the reliability
requirements constant and estimating the reduction in generation capacity costs due to larger
regional market. Because each of the individual balancing area within the market region
experiences peak loads at different times, the coincident peak load for the combined region is
lower than the sum of the individual areas’ internal peak loads. Accordingly, the expanded
regional market is estimated to reduce California’s own resource adequacy capacity needs by
184 MW in the 2020 CAISO+PAC scenario with annual capacity cost savings of $6 million/year,
and by 1,594 MW in 2030 under the expanded regional footprint (U.S. WECC without PMAs),
with conservatively-estimated annual savings of $120 million/year. Further details on our load
diversity analyses, including data used, key assumptions, and findings are discussed in
Volume VI.

I-31 | brattle.com
The top grey slice of the bars shown in Figure 7 is the estimated California ratepayer benefits
associated with the cost of ISO operations. The total costs of grid management would increase
with the expansion of the regional market, but these costs would be paid by a much larger group
of customers within the expanded market region, resulting in reductions of the average GMC
rates paid by California and other regional market customers. The expansion of the regional
market is estimated to reduce the average GMC rates by 19% in 2020 under the CAISO+PAC
scenario (relative to the 2020 Current Practice scenario), creating $39 million of annual savings
for California ratepayers. These GMC savings increase to 39% in 2030 under the expanded
regional footprint (U.S. WECC without PMAs) with California ratepayers’ annual cost reductions
increasing to $103 million/year. Further details on the calculation of Grid Management Charges
and the associated California impact of a regional ISO-operated market are included in Section F
of Volume VII of this report.
The expansion of the CAISO into a larger regional market would also affect the allocation of
existing transmission costs and new transmission investments, both of which will depend on how
those allocations are negotiated as a part of the regional market design. For the purpose of this
study, we have assumed that: (1) existing transmission costs for each area will be recovered from
each area’s local load; and (2) the cost of additional transmission needed to achieve public policy
goals will be allocated to the areas with those public policy goals. Currently, California
customers pay for existing out-of-state transmission that is needed to support the prevailing
power imports and delivery of generation from joint-owned plants that they have purchased
(although some of those transmission costs may be bundled with power purchase costs). Such
transmission costs associated with imports from neighboring areas, currently paid for by
California, are offset in part by “wheeling” revenue associated with power exports to neighboring
areas. In a regional market, California would no longer need to pay for transmission associated
with imports from elsewhere in the regional market. However, the state would also no longer
benefit from revenues associated with exports that serve load in the larger regional footprint
(although California would still benefit from wheeling revenue for exports to areas outside the
regional footprint). Our analysis assumes that the benefits of reducing transmission costs
associated with imports would be fully offset (on average) by the wheeling revenues for

I-32 | brattle.com
California’s existing regional transmission facilities that exporters would continue to pay in the
Current Practice scenarios.33
With respect to imports of additional renewable resources developed to meet the 50% RPS
mandate (and as explained further in Volume IV), we assumed (and have reflected in the
estimated renewable procurement costs) that: (1) any costs associated with new transmission
needed to integrate these new resources would be allocated to California loads (particularly
relevant in the Regional 3 scenario with increased reliance on out-of-state resources); and (2)
California loads would benefit from a regional market’s de-pancaked regional transmission
charges only to the extent that the additional renewable resources can be delivered over the
existing transmission grid (without additional transmission upgrades). Renewable projects
developed beyond RPS needs are assumed to include in their contract prices with voluntary
buyers any transmission interconnection-related costs (to reach local transmission hubs) and
increased curtailment risks (to the extent the local and regional transmission grid cannot fully
accommodate their output without transmission upgrades).
The components of ratepayer impacts in both annual dollar amounts and average California retail
rates are tabulated in Figure 8. The overall savings from an expanded regional ISO-operated
market are estimated to decrease average California retail rates by 0.4–0.6 ¢/kWh or by 2.0–3.1%.
33 The production cost simulation results for 2030 show that California remains predominately a net-
importer in over 80% of all hours of the year and the average quantity of imports exceeds those of
exports, which further supports the assumption that foregone transmission wheeling revenues for
exports would be more than offset by avoided transmission costs for imports.

I-33 | brattle.com
Figure 8: Summary of California Ratepayer Impacts
These California ratepayer impacts were tested under alternative sets of assumptions to
understand the sensitivity of results to of some of the key drivers. These sensitivity analyses
include the following:
The “2020 Expanded Regional ISO” sensitivity shows that annual California ratepayer
benefits would be $258 million/year in 2020 for the expanded regional footprint (U.S.
WECC without PMAs). This is much higher than the $55 million/year estimated for the
smaller regional CAISO+PAC market scenario, but remains below the 2030 benefits due
to the limited benefits associated with procurement and integration of renewable
resources (with essentially all of the renewables to meet 33% RPS in 2020 are under
contract).
The “2030 Current Practice 1B” sensitivity assumes higher flexibility in bilateral markets
with CAISO’s net bilateral export capability increased from 2,000 MW to 8,000 MW.
This high-bilateral-flexibility case assumes that bilateral markets would accommodate the
re-export of all prevailing existing imports (ranging from 3,000 to 4,000 MW per hour)
plus export an additional 8,000 MW of (mostly intermittent) renewable resources. The
results for Sensitivity 1B shows that even when oversupply conditions can be managed
more flexibly without a regional =market, the 2030 annual California ratepayer benefits
of a regional market would still range from $767 million/year (for Regional 2) to
$1.4 billion/year (for Regional 3).
A sensitivity allowing for “Negative Bilateral Settlement Prices” captures the impact of
negative hourly prices during oversupply and renewable curtailment conditions. The
2020 2020 2030 2030 2030
Current
Practice
CAISO
+PAC
Current
Practice
1
Regional
2
Regional
3
Base Costs ($MM) $35,564 $35,564 $39,285 $39,285 $39,285
Incremental RPS-Portfolio Related Capital Investment ($MM) $0 $0 $3,292 $2,612 $2,492
Production, Purchase & Sales Cost (TEAM) ($MM) $7,752 $7,742 $8,066 $7,962 $7,544
Load Diversification Benefits ($MM) $0 ($6) $0 ($120) ($120)
Grid Management Charges Savings ($MM) $0 ($39) $0 ($103) ($103)
Cost of Electricity Supply to California Customers ($MM) $43,316 $43,262 $50,643 $49,636 $49,098
Impact of Regionalization ($MM) ($55) ($1,007) ($1,545)
(%) (0.1%) (2.0%) (3.1%)
Total Sales (GWh) 260,028 260,028 256,404 256,404 256,404
Average Cost to California Customers (cent/kWh) 16.7 16.6 19.8 19.4 19.1
Impact of Regionalization (cent/kWh) (0.0) (0.4) (0.6)
(%) (0.1%) (2.0%) (3.1%)

I-34 | brattle.com
baseline calculations assume power from California resources is exported and sold at no
less than $0/MWh. At a price of zero California would be giving power away for free, but
these sales to outside parties during oversupply conditions do not impose additional costs
on California ratepayers. If that oversupply needs to be sold at negative prices, California
would have to pay counterparties to take the power exported out of California. Such
negative prices are a likely future outcome, consistent with the recent experience in
CAISO during periods with high solar generation,34 at the Mid-Columbia trading hub
during high hydro and low load periods, and in other markets (such as ERCOT, MISO,
and SPP) that have been experiencing renewable generation oversupply conditions. The
sensitivity results show that experiencing negative $40/MWh prices during any
oversupply and renewable curtailment periods would increase California’s 2030 annual
regional market savings by $133–$209 million/year.
In response to stakeholder feedback, we also estimated California ratepayer impacts for a
“Scenario 3 without Beyond-RPS Renewables,” which eliminates the impact of the
assumed 5,000 MW of additional low-cost renewable generation investments facilitated
by a regional market beyond RPS mandates. Eliminating all of the 5,000 MW of assumed
beyond-RPS renewables from Regional 3 scenario increases regional market prices
slightly, which in turn increases the cost of California’s power purchases by a small
amount. The net effect is a reduction of annual ratepayer benefits from $1.545
billion/year to $1.522 billion/year.
Figure 9 below summarizes California ratepayer impacts for the three baseline scenarios and the
sensitivity analyses discussed above. As this figure shows, the overall benefits to California
ratepayers are robust, ranging from over $700 million/year to $1.7 billion/year by 2030.
34 Negative prices are already being experienced during real-time operations in the CAISO footprint.
For example, 7% of all 5-minute real-time pricing intervals have experienced negative prices during
the first quarter of 2016, reaching 14% of all pricing intervals in March 2016 due to high solar
generation and relatively low loads. Although some prices ranged between negative $30/MWh and
negative $150/MWh, in most of the periods, the negative prices remained above negative $30/MWh.
(See CAISO Internal Market Monitor “Q1 2016 Report on Market Issues and Performance.”)

I-35 | brattle.com
Figure 9: Estimated Annual California Ratepayer Benefits
in Baseline Scenarios and Sensitivities
These estimates of California ratepayer savings are understated because they do not include the
value of other regional-market-related benefits. Overall, the study relies on assumptions that err
on the side of showing lower benefits than will likely materialize in a regional market to ensure
that the estimated benefits are not overstated. The values that have not yet been quantified
include:
A wide range of reliability-related benefits offered by a regional market as discussed
further in Volume XI. These reliability benefits relate to improvements in regional
reliability operations, compliance, and planning, including reliability benefits from
improved real-time price signals, congestion management, unscheduled flow
management, regional unit commitment, system monitoring and visualization, backup
capabilities, operator training, performance monitoring, procedure updates standards
development, NERC compliance, regional planning, fuel diversity, and long-term
investment signals.
Improved use of the physical capabilities of the existing grid both on constrained WECC
transmission paths and within the existing WECC balancing areas.

I-36 | brattle.com
Improved regional and interregional transmission planning to increase efficiency and
cost-effectiveness of the transmission buildout across the West.
Improved risk mitigation from a more diverse resource mix and larger integrated market
that can better manage the economic impacts of transmission and major generation
outages and better diversify weather, hydro, and renewable generation uncertainties.
Long-term benefits from stronger generation efficiency incentives and better long-term
investment signals across a larger regional footprint.
The specific study assumptions that lead to conservatively low estimates of ratepayer benefits
include:
Understated Renewable Investment Cost Savings. In the development of the 50%
renewable resource portfolios, E3 employed a number of assumptions that, overall, tend
to understate the potential benefits of a regional market. For example, it is assumed that a
number of renewable integration solutions are in place under current practice by 2030,
despite the fact that some of these solutions are significantly more costly than a regional
market (which returns positive net benefits even before renewable integration is
considered). These integration solutions include time-of-use rates, 5 million electric
vehicles with near-universal access to workplace charging, 500 MW of new pumped
storage, 500 MW of geothermal are added to the portfolio in all scenarios, displacing
approximately 1,500 MW of wind or solar resources that would otherwise have been
needed, thereby reducing the renewable integration burden under Current Practice 1.
The study further assumes that (1) 5,000 MW of out-of-state renewable resources can be
delivered for meeting California RPS over existing transmission, providing diversity to
the portfolio and significantly reducing the renewable integration burden under Current
Practice 1; (2) energy-only resources are the dominant form of contract in future
renewable procurement, eliminating the need for any new transmission in California to
meet the 50% RPS under the Current Practice 1 scenario. These and other renewable-
portfolio-related study assumptions are discussed further in Volume IV.
Understated Production Cost Savings. As discussed in the Production Cost Simulation
section above, the simulations use data from a year with “normal” weather, hydroelectric
conditions, and loads for the entire WECC area. Under these “normal condition”
assumptions, the value of a regional market will be more modest. The value of a regional
market can be dramatically larger under challenging market conditions, such as heat
waves, cold snaps, transmission outages, or fuel supply disruptions (e.g., Aliso Canyon

I-37 | brattle.com
impacts). We have assumed that ISO-like optimized commitment and dispatch would
exist within each of the existing balancing areas even under current practices, when in
reality, most balancing areas do not employ such security-constrained optimal unit
commitment and dispatch. Moreover, and aside from the inefficiencies reflected in the
hurdle rates, the simulations assume that bilateral trading is perfectly efficient and the
scheduling and utilization of the transmission system is optimal, when in reality, much of
the transmission congestion recorded is due to scheduling inefficiencies that create
transmission congestion when the grid could be utilized more fully but for the imperfect
bilateral scheduling processes. Similarly, the study does not fully account for improved
regional optimization of hydro resources, which would further improve the renewable
integration benefits of a regional market. These and other production-cost-related
conservative study assumptions are discussed further in Volume V.
Understated Load Diversity Benefits. We do not estimate the financial value associated
with the reliability improvements due to load diversity in a larger regional market. We
do not consider the additional benefits that would accrue to California given the possible
retirement of additional existing generation in California, which would increase the
demand and value resource adequacy capacity and thereby increase the value of load
diversity. These and other load-diversity-related conservative study assumptions are
discussed further in Volume VI.
2. Impact on Emissions of Greenhouse Gases and Other Air Pollutants
The study team analyzed the impact of expanded regional ISO-operations on California’s and
WECC’s emissions of air pollutants by the electric sector. The estimates are based on detailed
fuel use and generating unit outputs simulated by the production cost model.35 The main
objective of this analysis was to measure a regional market’s overall impacts on annual CO2
emissions from the power section in California and in the rest of WECC, and to estimate
location-specific shifts in NOx, SO2, and PM2.5 emissions within California (including
emissions-related impacts on disadvantaged communities as discussed further below).
35 As noted earlier, the GHG analysis only considers emissions from power plant operations; it does not
consider other sectors of the economy or life-cycle effects from the manufacturing and construction of
renewable resources or transmission lines. It does, however, consider the effect of new generation on
the dispatch of all generating resources across WECC.
I-38 | brattle.com
Since the individual generating units modeled in the production cost simulations largely reflect
generic emissions rates and generic heat rate assumptions developed by WECC stakeholders in
the Transmission Expansion Planning Policy Committee, the accuracy of the resulting CO2
emissions are limited by the accuracy of the resource-specific input assumptions. For NOx, SO2,
and PM2.5 emissions, the study team developed emissions rates by fuel and generating unit type,
including during unit startup, based on industry studies and California generating unit air
permits.36,37
In general, the emissions results show that regional markets provide the operational mechanisms
for more efficient use of fossil fuels and facilitate accelerated renewable energy generation
investments beyond those needed to meet the region’s RPS mandates. As a result, an expanded
regional market is estimated to decrease over time the electric sector’s use of fossil fuels in
California and the rest of the WECC.38 A summary of these regional market scenarios’ impacts
on estimated generation dispatch is shown in Figure 10 below.
36 The production cost model does track unit-specific NOx and SO2 emissions. However, as with most or
all production cost models there are some limitations to interpreting absolute levels of unit-specific air
emissions as explained in footnote 23.
37 NREL (2013). The Western Wind and Solar Integration Study Phase 2. Technical Report. NREL/TP-
5500-55588. http://www.nrel.gov/docs/fy13osti/55588.pdf
38 This study is focused on the changes in emissions associated with the deployment and the operational
use of the power generation resources, and, accordingly, this study assesses the effects of regional
market on those uses. To the extent that less natural gas is used for electricity production due to
regional market, this study does not include an assessment of how such fuel use reductions might also
increase environmental benefits due to decreases in upstream methane emissions.

I-39 | brattle.com
Figure 10: Simulated California and WECC-Wide Generation by Type
(a) 2020 Current Practice versus CAISO+PAC
Total Generation Change in Generation
(b) 2030 Current Practice 1 versus Regional ISO 2
Total Generation Change in Generation
(c) 2030 Current Practice 1 versus Regional ISO 3
Total Generation Change in Generation

I-40 | brattle.com
a. Impact on Coal Dispatch in WECC
The simulations results for a regional market limited to only CAISO and PacifiCorp in the near-
term show a very small increase in coal-fired generation. In particular, our simulations show a
small 0.4% increase in coal-fired generation, as PacifiCorp’s coal fleet is assumed to face lower
economic and operational hurdles to meeting California loads within a regional market.
However, several factors need to be considered in the interpretation of these results, the sum of
which likely would more than offset this simulation result.
First, the increase in 2020 simulated coal plant dispatch is very small, resulting in only a 0.2%
increase in WECC-wide carbon emissions. It would only require the retirement of a single small
coal generating unit or the addition of 150-300 MW wind generation on a WECC-wide basis to
more than offset this effect.39 As discussed further below and in Volume XI of this report,
regional markets have shown to facilitate renewable generation investments at a substantially
faster rate than non-market regions. For example, the ISO-operated markets in Texas and the
Midwest have seen 24,000 MW of new wind generation investment over the last 5 years, most of
which has been added based on voluntary contracts beyond RPS mandates.
Second, the broader regional footprint would expose coal-fired generation in PacifiCorp (and in
the rest of the regional footprint) to more competition from regional renewable generation
(RPS-based and beyond-RPS) and efficient natural gas-fired generation. Regional markets with
access to low-cost renewable resources in the eastern part of the U.S. show that the markets
attract significant additional renewable resource investments, which in turn put downward
pressure on energy prices in the wholesale market and thereby increase the financial pressure on
coal-fired plants (which already face the economic challenge of competing with gas-fired power
plants due to low natural gas prices). Our 2030 results reflect that as an expanded Regional ISO
facilitates additional renewable generation development beyond RPS mandates, the increased
renewable generation decreases the dispatch of natural gas- and coal-fired generation—fully
consistent with the experience in regional markets in the eastern part of the U.S. For example, as
noted by SPP’s CEO, “…since wind and solar facilities do not have fuel costs like fossil fuel
plants, big increases in their generation shares would be expected to push down prices in the
39 The total 2020 simulated WECC-wide increase in coal-fired generation is about 900 GWh for the year,
or the equivalent of an approximately 80 MW coal plant. The range of wind generation needed to
displace the amount of CO2 output from the increased coal dispatch depends on the ratio of coal and
gas generation displaced by the additional amount of wind.

I-41 | brattle.com
day-ahead and real-time markets…. If and when that happens, prices could dip so low that
many of the larger fossil fuel plants would struggle to clear market auctions, pushing them
toward retirement.”40
Third, the small increase of coal-fired generation shown in the 2020 simulation results is in large
part related to modeling simplifications. PacifiCorp’s coal fleet is not assumed to be under
contract to meet California load. The additional dispatch of coal-fired generation in the 2020
regional market simulations is therefore assumed to be purchased in the spot market and
registered as an “unspecified” import according to the California Air Resources Board’s current
GHG accounting procedures. As an unspecified import, our simulations assume PacifiCorp’s coal
fleet faces a carbon cost to serving California load that is based solely on the generic emissions
rate of a natural gas-fired combined-cycle plant. In reality, however, the incremental dispatch of
the coal-fired generating units would be visible to the ISO (as it is under EIM operations) and,
therefore, the ISO would be in a position to assign the appropriate levels of CO2 costs to any
imports from these generating units. By assuming a natural gas-based carbon cost to all imports
that are not under contracts, the simulations understate the operating cost of coal-fired plants by
approximately $10/MWh. When unit-specific CO2 cost are applied to PacifiCorp’s coal fleet, as
would likely be the case when serving California load in the ISO-operated regional market, that
would significantly reduce (if not entirely eliminate) the small increase shown in our 2020
simulations.41
Moreover, the competitive pressures imposed by regional markets leads to another impact on
coal-fired plants that is not captured in our market simulations. The current practice of at least
some coal-fired plant owners is to operate them in a must-run fashion as “baseload” facilities,
dispatching them whenever physically available. These must-run operating preferences tend to
change significantly when exposed to the competitive pressures and pricing transparency of a
regional market and replacement purchases are available at regional market prices whenever
needed. For example, Great River Energy (a cooperative utility operating in the wind-
generation-rich MISO market) recently decided that it “would no longer keep [its] Stanton [coal
40 Gavin Blade, “SPP CEO: Regionalization, transmission help push renewables penetration near 50%,”
UtilityDive, May 26, 2016.
41 To analyze this question we tested a 2020 simulation with a carbon cost for unspecified import equal
to the average of a coal plant and a natural gas-fired combined cycle plant. This carbon import cost
based on a 50/50 coal/gas emissions rate reduced the small increase in the 2020 baseline cases by half.

I-42 | brattle.com
plant operating] as a must-run plant.”42 As the president of that North Dakota plant (which, like
many coal plants in the WECC, is fueled with coal from the Powder River Basin) explained: “We
felt like we were economically forced into this. We need to do what’s in the best interest of our
members, so we’re not operating the plant at a time when we’re not even getting paid for the
coal we’re burning…. We’re really affected by whether the wind blows.”43 Similarly, as SPP’s
CEO noted “SPP has seen some big changes in how its fossil fuels are deployed. Coal plants…are
being dispatched less often, while fast-ramping natural gas plants are taking up a larger portion of
the generation share to help compensate for the variability of wind power.”44
The market simulations do not capture the extent to which some of the western coal plants
would likely be operated as “baseload” or “must-run” plants by their owners under the 2020 or
2030 Current Practice scenarios. This will understate coal-fired plant dispatch and carbon
emissions in those 2020 and 2030 Current Practice cases and thus not fully capture the extent to
which competitive pressures and improved pricing transparency would lead some plant owners
to modify the baseload, must-run operations of their coal-fired plants.45
As a regional market facilitates the additional development of low-cost renewable resources, the
reduced market prices and coal-fired plant dispatch, particularly when must-run operations end,
would probably lead to additional coal retirements. This effect is likely to materialize given that
a significant portion of WECC-wide coal-fired generation is located in areas with significant low-
cost renewable resources that currently do not have access to a regional market. However, our
simulation assumptions do not change the coal plant retirement assumptions between the
current practice and regional market cases, which would underestimate the potential reduction
of GHG emissions associated with the ability of regional markets to help facilitate the retirement
42 Jessica Holdman, “Coal power struggles in competitive energy market,” Bismarck Tribune, April 16,
2016.
43 Id.
44 Gavin Blade, “SPP CEO: Regionalization, transmission help push renewables penetration near 50%,”
UtilityDive, May 26, 2016.
45 Possible candidates for such market-facilitated modifications of must-run operations are units that
were operated historically as baseload plants. In our 2020 Current Practice simulations, some large
coal plants that were historically dispatched at a 75-85% annual capacity factor are dispatched
economically only in the 0-50% range. While operations at such lower annual output levels would
likely require renegotiating the plants’ fuel contracts, participation in a regional market would: (1)
make the potential to reduce “out of market” cost of continued baseload operations more visible and
(2) make lower-cost replacement power (and operating reserves) more readily available.

I-43 | brattle.com
of coal generation. These effects have already become realities in eastern regional markets where
the increased economic pressure on coal-fired plants has forced, and is continuing to force, more
to retire—particularly in areas with significant renewable generation development and when
faced with additional costs, including retrofitting the plant to comply with environmental
regulations. This phenomenon has already been observed in the other regional markets even
without CO2 costs imposed by regulatory policies.
Figure 11 compares the simulated impact of the regional market on coal plant dispatch to: (1)
historical fluctuations of annual coal-fired generation across WECC; (2) the projected overall
trend of coal-fired generation in the region through 2030; and (3) the impacts of environmental
regulations, such as a modest carbon price that would allow the rest of the WECC region to
achieve CPP compliance. As the figure shows, the simulated 2020 levels of WECC-wide coal-
fired generation are substantially less than average historical levels. By 2030, the simulated
WECC coal-fired generation will be reduced even further. Importantly, Figure 11 shows that the
estimated 2020 increase of coal plant dispatch in the CAISO+PAC regional market case is very
small compared to both the projected long-term declines in coal-fired generation and the year-
to-year fluctuations caused by varying weather, hydrology, and other market conditions.
Figure 11: Historical WECC Coal Plant Generation and Simulated 2020 and 2030 Coal Generation
Despite the pressures on coal-fired plants created by expanding renewable generation in a
regional market, the primary drivers of changes in the overall output of coal plants likely are the

I-44 | brattle.com
relative prices of fuel (coal versus natural gas) and environmental regulations. As discussed
above, we did not make any assumptions about differences in coal plant operations between the
Current Practice and regional market scenarios (e.g., we don’t assume must-run operations under
the Current Practice scenarios), and we did not implement any additional coal plant retirements
due to the regional market. As a result, our regional market simulations do not show a
significant impact on the overall level of coal-fired generation. Further, because our simulation
holds the operational preferences and retirements of coal plants constant across all cases, the
policy drivers have a much greater effects on the total regional coal-fired generation than the
simulated impacts of regional market operations. For example, as the 2030 simulation results of a
modest $15/tonne carbon price sensitivity for the rest of WECC show, the impact of such
environmental regulations (the light grey bars on the right of Figure 11 above) show a much
more significant impact on simulated coal-fired generation across the WECC.
b. California CO2 Emissions Results
For California, we estimate CO2 emissions in 2020 to be approximately 64 million metric tons,
down from approximately 90 million tons in recent years. In terms of the simulated 2020
CAISO+PAC regional market impact, we find a small 0.2 million metric ton (0.3%) increase in
2020 CO2 emission from in-state generation and imports in this CAISO+PAC scenario relative to
the 2020 Current Practice scenario. The small increase, however, is not observed for CO2
emissions associated with serving California load, which is equal to 63.6 million metric tons for
both the 2020 Current Practice and CAISO+PAC scenario, after netting out small amounts of
exports of California generation to serve load elsewhere. These 2020 results, along with 2030
results, are shown below in Figure 12 (with historical CO2 emissions) and Figure 13 (with
accounting for exports to neighboring regions).
To put the 0.2 million metric ton increase in 2020 into perspective, even if that small amount of
CO2 emissions increase were to materialize due to an inability to track source-specific CO2
emissions associated with imports, the 0.3% increase is very small compared to the much larger
swings in the amount of California power sector-related CO2 emissions due to changes in
weather patterns and hydro availability from year to year. Figure 12 below shows this historical
pattern (on the left-hand side of the graph) in comparison to the 2020 and 2030 simulation
results for the baseline scenarios and various sensitivities. As shown, the year-to-year fluctuation
of electricity sector CO2 emissions due to variations in weather and hydro conditions can swing
by 10 to 20 million metric tons, which is very large compared to the 0.2 million metric ton

I-45 | brattle.com
simulated increase in 2020 California CO2 emissions. Further, even if the 0.2 million metric ton
increase in simulated 2020 California CO2 emissions were to materialize, that amount would be
more than offset by adding a small amount of renewable resource or by additionally retiring a
small coal plant associated with serving California loads or elsewhere in WECC.
Figure 12: Historical and Simulated California Electricity Sector CO2 Emissions
Note: In 1990, California electricity sector CO2 emissions were 107.5 million metric
tons. Compared to this historical benchmark, projected emission levels are
approximately 40% lower in 2020 and 55-60% lower in 2030.
As illustrated in Figure 12 above and Figure 13 below, the production cost simulations show
significant California electricity sector CO2 emissions reductions between 2020 and 2030, even
before considering the impacts of a regional market. These emissions reductions are associated
with: (a) the addition of renewable energy resources to meet California’s and other western
states’ RPS through 2030, (b) retirement of once-through-cooling gas generators, and (c)
increasing CO2 prices in California. The resulting 2030 CO2 emissions associated with serving
California electricity load are estimated to be range from 45-50 million metric tons, which is
approximately 55–60% below 1990 levels of 107.5 million metric tons.46,47
46 It is important to note that we only measure CO2 emissions impacts in the electric sector, and that a
decrease in electric sector CO2 emissions does not necessarily mean a decrease in the economy-wide
emissions covered under California’s greenhouse gas cap-and-trade system. We also note that,
although carbon emissions of power plant generation were estimated, the impacts on GHG emissions
Continued on next page

I-46 | brattle.com
Figure 13: Simulated California Electric Sector CO2 Emissions
Note: The higher value reflects the current CARB’s GHG accounting for GHG imports.
The lower value includes an adjustment to “credit” California for GHG impacts
associated with exports, which is not currently part of the CARB’s accounting.
In 2030, as shown in Figure 13 above, the expanded regional market would reduce California’s
CO2 emissions associated with serving the state’s electricity load by 4 to 5 million metric tons
(8%–10% of the state’s simulated total electricity sector emissions). As shown in the light blue
slices of the figure, the magnitude of CO2 emissions attributed to serving California load depends
in part on how emissions related to power exports are accounted for. If the CO2 reduction in the
rest of WECC caused by exports of California renewable resources during oversupply conditions
is taken into consideration as a credit, the net carbon emissions attributed to California loads are
reduced by approximately an additional 5 million metric tons in all simulated cases. While we
recognize that this export adjustment is not currently part of CARB’s administrative carbon
Continued from previous page
of manufacturing more or fewer renewable resources that would be needed in different scenarios (due
to differences in energy curtailments) and the construction of new transmission to support Scenario 3
were not examined separately. Our results do not include any such manufacturing and construction-
related GHG emissions.
47 As discussed further below, calculations for California assume CO2 emissions associated with imports
are charged, and exports are credited, based on a generic emissions rate for natural gas combined-cycle
plants. Crediting for exports is not currently part of the administrative accounting rules for
California’s greenhouse gas cap-and-trade system. We credit exports to better represent emissions
attributable to California loads. As shown below, even at the 50% RPS level achieved in 2030, the
credits for exports are relatively small, representing about 4-6 million metric tons compared to 45
million metric tons in 2030 statewide emissions.

I-47 | brattle.com
accounting, the current accounting framework was not developed under conditions where
California was expected to export significant quantities of renewable energy.48
c. WECC-Wide CO2 Emissions Results
Consistent with our discussion above regarding the long-term trends and impact of a regional
market on coal plant dispatch, a regional ISO-operated market will help reduce CO2 emissions
from the power sector in California and across the WECC by dispatching more efficient
generating units, facilitating the development of additional renewable resources (particularly in
regions with where they tend to displace more carbon-intensive coal-fired generation), and
facilitating the reduced dispatch and retirement of coal plants by providing increased pricing
transparency and competitively priced power to the utilities who own these coal plants.
Figure 14 below summarizes the simulation results for WECC-wide CO2 emission for the 2020
and 2030 baseline scenarios. As the figure shows, simulated emissions are 331.3 million metric
tons for the 2020 Current Practice scenario and 331.9 million metric tons for the 2020
CAISO+PAC scenario, before declining to a range of 295.9 to 307.3 million metric tons in 2030.
The 0.6 million metric tons (0.18%) WECC-wide increase in the 2020 CAISO+PAC scenario
compared to the 2020 Current Practice scenario relates to the coal plant dispatch issue discussed
above. As also discussed above, our simulations do not fully capture all of the effects that would
reduce CO2 emissions from the power sector in a regional market setting. Given that our
simulations do not reflect a number of emissions-reducing factors,49 we find the 0.18% increase
48 In 2030, exports are driven by renewable oversupply that cannot be used serve California's load.
Instead, the renewable exports displace generators that would need to run outside of California to
serve external load. Accordingly, they reduce the GHG emissions in the rest of WECC footprint.
GHG credits for exports are meant to recognize the "net" impact on global GHG emissions.
In addition, if California imported 1 MWh from one region in one hour and then exported 1 MWh to
the same region in the next hour, the overall emissions outcome would be similar to a case in which
California did not import or export any energy at all (assuming that marginal resources remain similar
between the two hours). Applying a cost on imports and an offsetting credit on exports (such that the
net cost is zero) would be more appropriate in this case regardless of whether the focus is on in-state
GHG emissions or global GHG emissions.
We further note that this (in our opinion appropriate) treatment of export-related carbon is consistent
with that applied in the CEERT/NREL Low Carbon Grid Study.
49 As discussed earlier, among other modeling simplifications, the small CO2 emission increase is due, in
large part, to the simulation approach that does not allow assigning a higher generator-specific CO2
Continued on next page

I-48 | brattle.com
in simulated 2020 CO2 emissions to be de minimus. Even if a portion of the simulated slight
increase were realized in the near term, it would be very small compared to the much more
significant long-term CO2 emission reduction across the WECC, including the long-term
emissions benefits of a regional market as shown in our 2030 simulations.
Figure 14: Simulated WECC-Wide Electric Sector CO2 Emissions
As summarized in Figure 14 above, these simulations show that the CO2 emissions from the
electricity sector in 2030 decrease by 24-36 million metric tons from 2020 levels, despite the
continued load growth assumed for the rest of WECC. The factors that drive these WECC-wide
decreases between 2020 and 2030, include: (a) the addition of renewables to meet California’s
and western states’ RPS; (b) coal plant retirements already considered in many utilities’ resource
plans (which are held constant across the current practice and regional market scenarios); (c)
increase of California’s CO2 costs, reducing the competitiveness of resources that must pay for
those CO2 costs to import into California; and (d) GHG reduction policies in other parts of the
WECC region (e.g., Alberta’s goal to retire all coal plants by 2030).
As also shown in Figure 14 above, the 2030 simulations show that an expanded regional market
would additionally reduce WECC-wide CO2 emissions by 10 to 11 million metric tons (~3.5% of
total) compared to the Current Practice 1. This longer-term regional market benefit on WECC-
wide emissions exceeds the small increase in our 2020 simulations by more than a factor of ten.
Continued from previous page
cost to any California imports from coal plants (thus allowing all imports from coal generators to pay
only the lower CO2 cost associated with a gas combined-cycle plant).

I-49 | brattle.com
d. Sensitivity Analyses of CO2 Emissions
Our simulation results show that California’s carbon regulations yield electricity sector CO2
emissions levels that are well below the targets set by EPA’s Clean Power Plan. This is not the
case for the rest of the WECC, and our analyses of the baseline scenarios do not include any
carbon constraints to address CPP compliance in the rest of the WECC. This is because: (a) the
implementation of CPP has been stayed by the Supreme Court at the time of this study, and (b)
specific state implementation plans have not yet been developed.
Nevertheless, in response to stakeholder feedback we conducted a sensitivity analysis that
simulates how the U.S. WECC system would operate under a modest $15/tonne CO2 emissions
cost in 2030 as a proxy for Clean Power Plan compliance. The results for this sensitivity shows
that the modest $15/metric ton CO2 price would be more than sufficient to achieve CPP
emission limits in the rest of the region as a whole. Based on these results, and given that the
focus of this study is on California impacts, we have not conducted additional sensitivity analyses
with even higher CO2 prices. The detailed results for the 2030 sensitivity analyses of a $15/ton
CO2 emissions price in the Rest of WECC are presented in Section C.2.e of Volume V.
Emissions were also evaluated for two other 2030 sensitivities: “Current Practice 1B” (which
reflects higher baseline coordination in bilateral markets) and “Regional 3 without renewables
beyond RPS.” Under the higher-flexibility Current Practice 1B, 2030 emissions from California’s
in-state natural gas fleet increases CO2 by 0.9% relative to the baseline Current Practice 1
scenario but decrease by 3.4% when accounting for the emissions impacts of imports and exports
associated with serving California load. The 2030 WECC-wide CO2 emissions in the Current
Practice 1B sensitivity are 0.3% lower than in the Current Practice 1 baseline scenario.
In a separate sensitivity analysis, Regional 3 without renewables beyond RPS results in a slight
0.6% increase in the dispatch of California’s in-state natural gas–fired fleet compared to Current
Practice 1. But this sensitivity would still avoid some of the excess startup emissions that would
occur under the Current Practice 1. When considering imports and exports, the CO2 emissions
associated with serving California loads decline by 4.3% in this Regional 3 sensitivity (compared
to Current Practice 1). The 2030 WECC-wide emissions for Regional 3 without renewables
beyond RPS decrease by 0.4% relative to Current Practice 1. These sensitivity results are
presented Volume V of this report.

I-50 | brattle.com
e. NOx, SO2 and PM2.5 Emissions Results
The analysis of NOx, SO2, and PM2.5 emissions for 2030 shows that a Regional ISO-operated
market would decrease these emissions from the electricity sector, both in California and in the
rest of WECC. However, the results for 2020 showed a slight increase in these emissions for the
rest of WECC due to the slight increase in coal dispatch discussed in the previous section.
Nonetheless, to put these results in perspective, we note that California’s electricity sector emits
only a small percentage of the state’s annual economy-wide inventory for NOx, SO2, and PM2.5
pollutants. Transportation and area-wide (non-stationary) sources, and other industries, are the
predominate emitters. Under any circumstances, a regional wholesale electricity market is likely
to have a negligible impact on California’s overall annual NOx, SO2, and PM2.5 inventories.
Figure 15 below shows the breakdown of electricity sector air emissions compared to the
emissions from other sectors in California.
Figure 15: Baseline for NOx, SOx, and PM2.5 Emissions in California
(a) NOx
(b) SOx
(c) PM2.5

I-51 | brattle.com
In California, a regional market is projected to reduce NOx and PM2.5 emissions in the persistent
non-attainment areas of the San Joaquin Valley, South Coast, and Mojave Desert air basins. In
addition, emissions in the Salton Sea air basin (which has relatively low emissions in any
scenario) drop to nearly zero in the regional market scenarios. Figure 16 below shows the
simulated results for NOx and PM2.5 air emissions in the most relevant air basins in California.
Figure 16: Simulated Electricity Sector NOx and PM2.5 Emissions in California
(a) San Joaquin Valley Air Basin
(b) South Coast Air Basin
(c) Mojave Desert Air Basin
The study also provides a separate presentation of average emissions rates from California’s
natural gas-fired resources over the three summer months for consideration of the effects on
ozone levels. Managing ambient levels of ozone across California is a major focus of air quality

I-52 | brattle.com
management activity in many of California’s air basins. Achieving reductions in NOx during the
summer months is especially beneficial because NOx is a strong precursor to ground-level ozone.
As explained in more detail in Volume IX of this report, the results show that the Regional 2 and
Regional 3 scenarios achieve similar levels of NOx emissions reductions (-5.9%) in the summer
season when compared with the 2030 Current Practice 1 scenario.
Emissions of NOx, SO2, and PM2.5 were also evaluated for two 2030 sensitivities: Current
Practice 1B (which reflects higher baseline coordination in bilateral markets) and Regional 3
without renewables beyond RPS. The emissions results for these sensitivities generally follow
the fossil-fired generation results already described above in the context of CO2 emissions.
Under Current Practice 1B, NOx, SO2, and PM2.5 emissions from California’s in-state natural gas
fleet are 1% to 2% higher than in the baseline Current Practice scenario.
Separately, Regional 3 without renewables beyond RPS results in a slight increase in the dispatch
of California’s natural gas–fired fleet and associated SOx and PM2.5 emissions compared to
Current Practice 1, but this sensitivity still results in a net decrease of NOx emission in California
by reducing the excess startups that would occur under the Current Practice 1.
3. Creation and Retention of Jobs and Other Benefits to the California
Economy
Our analysis shows that impacts of an ISO-operated regional market on California jobs and the
California economy are mostly driven by: (1) changes in investment in new electric supply
resources; (2) changes in investment in other wholesale power infrastructure, such as high-
voltage transmission; and (3) changes in customers’ retail electricity rates that reflect the cost
savings associated with supplying electricity to California. The first two drivers relate
specifically to the differences in renewable generation investments across various scenarios, and
the final driver stems from the ratepayer impact analysis previously presented in Section I.F.1. of
this Volume. The job and economic impact analyses quantify some of the inherent tradeoffs
between building new renewables resources in-state versus out-of-state, particularly when
compared to the potential environmental impacts associated with the location of the renewable
resources shown in the environmental analysis. More renewable generation development
outside of California in Regional 3 (compared to the Current Practice 1) will lessen the
environmental impacts within the state, but will reduce the number of direct jobs created
through the construction and operations of those new resources in California. However,
combined with the benefit of lower retail rates for electricity, due mostly to lower production

I-53 | brattle.com
costs and infrastructure investment costs, an expanded regional market will stimulate California’s
economy by increasing real incomes and thereby creating more jobs through consumer-
expenditure-shifting towards industries with a higher job intensity.
a. State Economic Impacts
The economic analysis focuses on impacts on California’s Gross State Product, real economic
output, real income, and state tax revenue. The implementation of a regional market increases
California’s economic activities and improves these economic metrics. Although the estimated
economic impacts are small relative to the magnitude of the entire California economy—Gross
State Product, for example, increases by less than 1% with regional market—the impacts are high
in absolute dollars terms. Gross State Product increases by between $1.2 billion to $1.7 billion
and the state’s real economic output increases by $2.3 billion to $2.7 billion annually if the
regional market is implemented. Annual statewide real income increases by $4.1 billion to $7.9
billion, or about $290 to $550 per household on average per year. State tax revenues increase by
$600 million to $1.6 billion in the regional market scenario compared to the Current Practice
scenario. Figure 17 below illustrates the regional market impact on these California economic
metrics.
Figure 17: Overall Impacts on the California Economy
Change Relative to Current Practice 1 ($B)
b. Impact on California Jobs
In 2030 Regional 2 scenario, the overall number of jobs in California increases by 19,300 by 2030,
mostly due to an increase in jobs (+26,800) indirectly created by lower retail electricity rates,
slightly offset by a decrease in jobs directly created from new resource development and
Regional 2
minus
Current
Practice 1
Regional 3
minus
Current
Practice 1
Gross State Product $1.7 $1.2
Real Output $2.7 $2.3
Employment (000) 19 10
Real Income $4.1 $7.9
State Revenue $0.6 $1.6


I-55 | brattle.com
potential, and relatively low environmental impact. Figure 19 shows a graph of the CREZs
analyzed in the environmental analysis.
Figure 19: Resource Zones in California for Portfolios and Environmental Study
Outside of California, the environmental impacts were analyzed for certain selected development
regions and on aggregate, for the rest of WECC as a whole. The environmental analysis
contained in this SB 350 study is not site-specific and therefore it is not a siting study for any
particular planned or conceptual renewable resource or transmission project.
The environmental study starts with the renewable portfolios, which are drawn from coarsely-
defined geographies inside California by the RESOLVE model based on estimates of location-
specific resource development costs, resource development potential, and resource performance
(e.g., capacity factors). The RESOLVE model distributes resources to certain development areas
outside of California, including the Southwest for solar resources, and the Northwest, Utah,
Wyoming, and New Mexico for wind resources. Within each of these areas, the Aspen team
“tailored” RESOLVE’s resource locations to smaller study areas that reflect the efforts of similar
previous studies and represent areas of opportunities for renewable development with the least
environmental impact. This tailoring of study areas, as shown in Figure 20 below, allows Aspen

I-56 | brattle.com
to identify specific biologically-sensitive or environmentally-stressed locations that might
realistically be impacted by the renewable portfolios and allows Aspen to better identify the
scope of disadvantaged communities that might be affected, which is discussed further in the
next section.
Figure 20: Tailored Study Areas for Environmental Study
(a) California Solar
(b) California Wind
(c) Southwest Solar
(d) Northwest Wind
(e) Utah Wind
(f) Wyoming Wind
(g) New Mexico Wind

I-57 | brattle.com
a. Land Use Impacts
Aspen analyzed the tailored renewable portfolio study areas for population density, agricultural
uses, and coincidence with—or proximity to—protected lands, to find potential land-use
incompatibilities. Although any conflicts in land use can be avoided or reduced on a case-by-
case basis during the state or local siting process, a broader regional location for the renewable
resource development reduces potential land-use incompatibilities. Within California, the
renewable portfolios under Regional 2 and Regional 3 reflect a decreased wind buildout in
California (compared to Current Practice 1), particularly in areas with medium or higher
potential for land use incompatibilities, such as the Solano area. The renewable portfolio under
Regional 3 reflects a decreased in-state solar buildout in areas with some potential for
incompatibilities. Outside of California, less wind resource development is used for California’s
RPS in the Northwest in Regional 2, which decreases any potential for incompatibilities in that
region. Although Regional 3 reflects a higher solar and wind buildout in the Southwest,
Wyoming, and New Mexico, the buildout is in areas with relatively little potential for land use
incompatibilities.
By enabling California to more efficiently build renewable resources to meet RPS, implementing
a regional market significantly decreases the overall amount of land use measured in terms of
acreages used.51 Land use decreases in California by 42,600 acres in Regional 2 and by 73,100
acres in the Regional 3 scenario. Outside of California, land use decreases by 31,900 acres in
Regional 2. Because larger sites are generally required for wind generation, land use increases by
at least 69,300 acres in Regional 3, due to wind and additional land use associated with the
necessary transmission rights-of-way to enable the renewable resource buildout to meet
California’s RPS. While the resource development footprint outside of California associated with
expanded regional market and the associated emphasis on wind resources is larger, the actual
ground disturbance would be much smaller; wind resources normally require only a portion of
the acreage to be disturbed. Usually less than 10% of the acreage within a typical wind site may
be disturbed, while the remainder of the land would remain undisturbed and available for other
uses.
51 One acre is about the size of a football field.

I-58 | brattle.com
b. Impacts on Biological Resources
Aspen used the Western Governors’ Crucial Habitat Assessment Tool (“CHAT”) and a variety of
other conservation planning and resource occurrence reports and studies,52 to compile an
inventory of biologically-sensitive and environmentally-stressed locations. Then, these locations
were compared to the tailored renewable portfolio study areas to identify potential impacts on
biological resources.
A regional market allows for lower impacts on biological resources overall compared to the
Current Practice scenarios, but the difference in results for Regional 2 and Regional 3 illustrates
the inherent tradeoff of building renewables in-state versus out-of-state to satisfy California’s
new 50% RPS mandate. For California, a regional market reduces the number of habitats
impacted by new solar resources from seven to five, the number of areas sensitive to avian and
bat mortality associated with new wind resources from six to four, and the potential for wildlife
movement constriction, particularly in the Riverside East and Palm Springs areas. Outside of
California, particularly in Regional 3 with more of an out-of-state renewables development
focus, the potential for avian and bat mortality from new wind resource developments increases
in Wyoming and New Mexico.
c. Water Use Impacts
California does not have groundwater regulations that limit the amount of groundwater
extracted by wells and pumps, but groundwater use is nonetheless a significant issue for the state.
Groundwater extraction and the drought of recent years have resulted in historically low
groundwater elevations in many regions of California. To address impacts on water use during
construction, Aspen compared the tailored renewable portfolio study areas to the California
Department of Water Resources’ Critically Overdrafted Groundwater Basins.53 Areas of
particular focus in the analysis include Greater Imperial, Riverside East and Palm Springs,
Tehachapi, and Westlands. Outside of California, Aspen reviewed data from the World
Resources Institute to assess relatively high-risk areas for groundwater use issues. The analysis
52 Western Association of Fish and Wildlife Agencies. 2016. West-wide Crucial Habitat Assessment Tool
(CHAT) Data. Available at: http://www.wafwachat.org/data/download .
53 California Department of Water Resources; available at:
http://www.water.ca.gov/groundwater/sgm/cod.cfm

I-59 | brattle.com
focuses on new solar resources in Arizona and new wind resources in Utah, Wyoming, and New
Mexico as they are typically partially or entirely located in the identified high-risk areas.
Within California, the renewable portfolio under Regional 2 slightly decreases water use
(compared to Current Practice 1) for construction in high-risk areas, and in Regional 3, the
renewable portfolio further decreases the amount of in-state water used for construction in high-
risk areas and in other areas of lower risk.
Aspen analyzed impacts on water consumption during operations for existing generating units
within California and in the rest of WECC, using estimates for water consumption by technology
type from the National Renewable Energy Laboratory.54 Limited regionalization in 2020 would
reduce the water use in California by facilitating a reduction in water used for electricity
generation by 1.5%. In 2030, the regional market would reduce the water used for electricity
generation in California by at least 4%, and would also modestly reduce the water used for
electricity generation outside California.
5. Impacts in California’s Disadvantaged Communities
The analyses of economic impacts, job impacts, and environmental impacts in California and
elsewhere include a more detailed examination of possible impacts on California’s disadvantaged
communities to respond to the legislative requirements under SB 350.
Disadvantaged communities in California are defined by the California Communities
Environmental Health Screening Tool (“CalEnviroScreen 2.0”). This tool evaluates and ranks
census tracts on 19 indicators for pollution burden and sensitive population and socioeconomic
characteristics. The figure below shows the CalEnviroScreen 2.0 combined ranking for all 19
indicators. Higher scores indicate relatively higher pollution burdens and more sensitive
populations within those communities. Disadvantaged communities are defined as the census
tracts that are in the top 25th percentile for greatest pollution burden and the lowest
socioeconomic conditions. Figure 21 below shows the census tracts with their relative scores on
the screening tool. The figure shows the disadvantaged communities in orange and red colors,
54 NREL (2011). A review of Operational Water Consumption and Withdrawal Factors for Electricity
Generating Technologies. Available at: http://www.nrel.gov/docs/fy11osti/50900.pdf.

I-60 | brattle.com
with most of the disadvantaged communities and populations concentrated in the Los Angeles,
Central Valley, and Inland Valley areas.
Figure 21: CalEnviroScreen 2.0 Combined Pollution Burden and Sensitive Population Scores
As part of the California economic and job impact analysis, the results are mapped to the
CalEnviroScreen 2.0 scores at the census tract level. That way, one can distinguish results for
disadvantaged and other communities.
From a job and economic impact perspective, a regional market creates more jobs and more
income in many disadvantaged communities, as shown in Figure 21. Real income increases by
about $180 to $340 per year, and net jobs increase by 800 to 2,800 between 2020 and 2030.
Because the disadvantaged communities are low-income communities, the job and income
increases disproportionately create more value for disadvantaged communities than in other
higher-income communities. Figure 22 below summarizes the results for job and economic
impacts on disadvantaged communities. More detail on these results, including results specific to
the Los Angeles, Central Valley, and Inland Valley areas, can be found in Volume X.

I-61 | brattle.com
Figure 22: Job and Economic Impacts on California’s Disadvantaged Communities
Regional 3 and Regional 2 Impacts, Relative to Current Practice 1
Employment Impacts: Regional 3 Minus Current Practice 1
Employment Impacts: Regional 2 Minus Current Practice 1
Income Impacts: Regional 3 Minus Current Practice 1
Income Impacts: Regional 2 Minus Current Practice 1
I-62 | brattle.com
As part of the environmental analysis of disadvantaged communities, we compare our results to
the CalEnviroScreen 2.0 scores for each tailored study area, air basin, and CREZ for the new
renewables needed to meet California’s 50% RPS. This allows us to determine the number of
disadvantaged communities in proximity to and potentially affected by new resource
development and air emissions from existing fossil-fired generating units.
The study results show that a regional market decreases community-scale construction-related
environmental impacts by decreasing renewable resource development in California, particularly
in the Westlands area where a significant amount of new solar development is avoided because
the additional solar generation is no longer needed to replace curtailed renewable resources in
California under the expanded regional ISO market in 2030. The regional market reduces the
use of natural-gas generators in California, which in turn reduces the amount of water used
during power production and decreases power plant emissions in the San Joaquin Valley and
South Coast air basins. More detail on these results, including results specific to the Westlands,
San Joaquin Valley, and South Coast areas, can be found in Volume X.
6. Reliability and Integration of Renewable Energy Resources
Regional market operations and planning will allow for more cost effective and reliable
integration and balancing of intermittent renewable resources.55 Some of these benefits of
increased renewable integration and reliability associated with closer regional coordination
across the many existing Balancing Areas in the WECC has been documented and recognized in
the context of the EIM.
A full “Day 2” regional market will magnify these EIM-related benefits by adding to the
coordination benefits achieved through regional market operations, which consist of: (1) a day-
ahead energy market; (2) day-ahead and intra-day system-wide forecasting of intermittent
renewable generation levels; (3) optimal economic and reliability-based commitment of
conventional generating units; and (4) region-wide, co-optimized markets for regulation
reserves, operating reserves, and flexible capacity for load-following reserves. In addition to
these operational benefits, a regional ISO-based market will benefit from reduced generation
capacity needs due to load diversity benefits of the larger footprint. It will also benefit from the
55 See Volume XI and the discussion of existing studies in Volume XII.

I-63 | brattle.com
integrated, region-wide operational, reliability, and transmission planning functions performed
by the larger ISO with its stakeholders.
Covered in other parts of the analysis, key aspects of reliability and renewable integration
benefits of a larger ISO-operated regional market already have been quantified in: (1) the load
diversity analysis, which assesses how resource adequacy requirements can be met with less
generating capacity (Volume VI); (2) the nodal market simulations, which simulate more
optimized power flows on the transmission grid, reduced curtailments, and reduced need for
ramping, load-following, and operating reserves at high levels of renewable resource
development (Volume V); and (3) the renewable investment optimization, which recognizes
integration benefits when selecting the renewable portfolios that can meet California’s 50% RPS
(Volume IV).
However, the estimation of the benefits associated with reliability and renewable integration
benefits captured in California ratepayer savings does not reflect other values of achieving more
reliable region-wide system operations. For example, expanding ISO operations to a larger
regional footprint will offer significant reliability benefits to both California and the larger
regional market area. Regional ISO operations and practices will offer various reliability benefits
over the standard operational practices of Balancing Authorities in the WECC footprint. Because
the WECC is a single interconnected power system, reliability events in neighboring WECC
areas affect California as well.56 Expanding CAISO operational practices consequently offer
reliability benefits to (a) the expanded regional footprint that, in turn, (b) increases reliability in
the ISO’s current California footprint. Reliability-related benefits will be particularly
pronounced during stressed system conditions, such as extreme weather, drought, and
unexpected outages.
As discussed in Volume XI, an ISO-operated, consolidated regional market and balancing area
offers important additional reliability benefits beyond the enhanced reliability benefits achieved
by EIM. These enhanced regional reliability-related benefits include:
Improved real-time awareness of system conditions;
56 Examples of WECC-wide reliability events that affected California include the October 6, 2014
Northwest RAS Event; the September 8, 2011 Arizona–Southern California Outage; and the
August 10, 1996 Western Interconnection (WSCC) System Disturbance.

I-64 | brattle.com
More timely, more efficient, and lower-cost congestion management and adjustments for
unscheduled flows;
Regionally-optimized, multi-stage unit commitment;
Enhanced systems and software for monitoring system stability and security;
Enhanced system backup;
Coordinated operator training that exceeds NERC requirements, more frequent review of
operator performance and procedures, and consolidated standards development and
NERC standards compliance;
More unified regional transmission planning to address long-term reliability challenges;
Broader fuel diversity to more effectively respond to reliability challenges associated with
changes in fuel availability or costs and hydro/wind/solar conditions; and
Better price signals for investment in new resources of the right type and in the right
geographic locations
More effective deployment and dispatch of resources and reserves that will enhance
reliability and recognizes system conditions across the entire regional foot print.
A larger regional ISO-operated wholesale power market will improve the integration and
balancing of renewable resources,57 thereby facilitating the development of lower-cost renewable
resources through:
A single regional energy market for selling the intermittent output of renewable
resources
Coordinated and centralized forecasting of renewable output to reduce balancing costs
and curtailments;
Market-based ancillary services and reduced reserves and load-following requirements in
a larger, more diversified region;
57 For example, SPP has recently announced that within its larger, consolidated balancing area it can
now manage wind generation of up to 60% of its load. As noted by SPP’s CEO, due to the larger
footprint, SPP can “forecast the wind rise and decline such that we can bring other resources to bear
against the variability of wind…[y]ou just couldn't have done that when we were operating as 20-plus
different balancing authorities.” (Source: Gavin Blade, “SPP CEO: Regionalization, transmission help
push renewables penetration near 50%,” UtilityDive, May 26, 2016.)

I-65 | brattle.com
Uniform region-wide generation interconnection and transmission planning processes;
Improved regional transmission planning to provide access to low-cost renewable areas
within the regional footprint;
Easier contracting of renewable power supplies for load-serving entities and commercial
and industrial customers; and
Improved financial hedging options and access to more liquid trading hubs.
The reduction of integration and balancing costs faced by renewable resources facilitates a more
rapid development and growth of renewable generation in the regional footprint, including
accelerated renewable development beyond the western states’ RPS requirements.
As shown in Figure 23, the regional markets in the Midwest and Texas (operated by MISO, SPP
and ERCOT) have shown significant growth of renewable resources, particularly resources
developed beyond RPS requirement. As discussed in more detail in Volume XI, these beyond-
RPS renewables developments are supported by voluntary purchases signed by load serving
entities and commercial and industrial customers. They have occurred almost exclusively in
regions that offer both (1) access to low-cost renewable resources that make voluntary purchases
economically attractive, and (2) ISO-operated regions that provide a ready market for
integrating, compensating, and balancing the intermittent energy produced by the renewable
resources.
As discussed further in Volume XI, a total of 7,700 MW of “beyond-RPS” wind generation
(equivalent to 6.9% of retail load) have been developed only over the last five years in Texas and
a total of 9,200 MW of beyond-RPS wind generation (equivalent to more than 3% of retail load)
have been developed over the last five years in the Midwest. Figure 23 below shows that much
less growth in voluntary wind generation development beyond-RPS mandates has occurred in
the WECC region, which contains areas with similarly low-cost wind resources but does not
currently offer access to ISO-operated wholesale power markets in those low-cost areas.
Recognizing these trends of renewable generation developments beyond RPS requirements in
other ISO-operated regional markets with access to low-cost renewable resources, our SB 350
study assumes that similar developments would occur in the regional market scenario by 2030.
Specifically, the market simulations assume that in the regional market scenarios (Regional 2 and
Regional 3), an additional 5,000 MW of beyond-RPS wind generation would be facilitated by the
regional market incrementally between 2020 and 2030 in the low-cost wind generation regions

I-66 | brattle.com
of Wyoming and New Mexico. As shown in Figure 23, this would be equivalent to 2.6% of the
regional market’s projected 2030 retail load—a level below those achieved in SPP, MISO, and
ERCOT over the last five years. Because the regional market in the West would offer access to
the country’s lowest-cost solar generation resources, adding only wind generation as the beyond-
RPS resource facilitated in the regional market scenarios is a conservatively low assumption. In
reality, a significant amount of solar resources beyond those needed to meet RPS will be
developed across the West. This trend in solar generation development is already evident in
Texas.
Figure 23: Wind Generation Development to Meet RPS and Beyond
West
Texas
Midwest
Notes and Sources: Historical RPS and beyond-RPS wind installations data and retail load
data provided by Dr. Galen Barbose of LBNL. Average 2012 wind capacity factors by
region used to estimate wind generation based on installed capacity. Assumed a 10%
overall loss factor when comparing wind generation and retail load.

I-67 | brattle.com
7. Survey of Existing Studies and Other Potential Impacts
We reviewed a large number of existing studies to inform and benchmark our analysis of a
regional market. Many of the studies we reviewed estimate the benefits of moving to organized
and centralized wholesale electricity markets and operations. Various “Day-2” market studies
evaluate the benefits of expanding from a de-pancaked transmission scheduling and energy
imbalance markets to centralized Day-2, or day-ahead, markets. Several older RTO studies
estimate the benefits and costs to an RTO, following the issuance of FERC’s 1999 landmark
Order No. 2000, which required transmission owners to consider and evaluate RTO formation
and membership. More recent RTO participation studies evaluate the benefits and costs to a
load-serving entity of joining an existing RTO. Energy imbalance market studies evaluate the
benefits of the Western EIM, or the benefits of a utility joining the EIM. We also reviewed
European market integration studies, which estimate the benefits of market integration in the
European context.
Other studies we reviewed focus on renewable resource development and integration into
system operations and markets. The renewable integration studies we reviewed discuss various
challenges of integrating higher penetrations of renewable resources. We reviewed studies that
analyze the role of markets in enabling renewables development beyond RPS mandates.
Volume XII includes additional detail and a bibliography of all of the studies we reviewed.
As discussed above, we find that most prospective studies estimated that regional market
integration would reduce production costs by 1%–3%. Most of these prospective studies
acknowledged the limitations associated with the analyses, because many of the benefits of
participating in a regional market are difficult to capture in simulation-based analyses. Given the
limitations of using simulation models to conduct prospective analyses, several system operators
analyzed the values provided by regional markets with a retrospective approach. The
retrospective studies find higher production cost savings than the prospective analyses, in the
2%–8% range. These savings reflect a relatively large step from a “no market” status quo (i.e.,
only bilateral trading among individual balancing areas with pancaked transmission charges as in
the non-CAISO portion of the WECC) to a full regional Day-2 marketplace with consolidated
balancing areas, de-pancaked transmission, nodal day-ahead and real-time energy markets, and
ancillary services markets. Estimated savings are smaller for more modest steps towards
centralized markets. For example, studies analyzing the benefits of moving from a region with
fully de-pancaked transmission charges and real-time imbalance markets to a Day-2 market
design with consolidated balancing areas and nodal energy markets offer incremental benefits of

I-68 | brattle.com
3–5%. This latter group of studies is most comparable to our SB 350 study results, which
estimate an approximately 5% in WECC-wide production cost savings from de-pancaked
transmission rates and centralized day-ahead markets and operations. Finally, studies analyzing
the CAISO’s and ERCOT’s previous move from a zonal Day-2 market design to a nodal Day-2
market design estimated incremental benefits of approximately 2% of total production costs or
wholesale power prices.
The studies we reviewed consider a wide variety of benefits other than production cost savings.
Expanded geographic coverage of regional markets allows taking advantage of greater load
diversity, which reduces the total generating capacity needed to meet resource adequacy
standards. Regional markets make it easier to reach low-cost renewable resources and reduce the
burden of integrating intermittent renewable resources, thus creating significant additional cost
savings. Based on the reviewed studies, the combination of these load diversity and renewable
access and integration cost savings would likely be the equivalent of a 2–6% additional reduction
in production costs even under today’s level of renewable energy development. These additional
benefits would be available to both California and market participants in the rest of the WECC.
Figure 24 below shows a summary of market integration benefits based on our literature review.
All savings in the figure are reported as the equivalent to a percentage of total production costs.
As the figure shows, the production cost savings captured by prospective production cost
simulations are likely understated and represent only a portion of the overall benefits of market
integration. The overall savings shown in the last row of the figure includes additional
production cost benefits not captured by prospective studies, investment cost savings, and
additional benefits under high renewables scenarios. Based on the results of this review of
existing market integration studies, the total benefits of a regional market (including investment-
related benefits) range from 6% to 13% of total production costs. Considering the additional
benefits related to the much higher 50% share of renewable generation that will have to be
achieved for serving California electricity loads, the benefit of expanding the CAISO into a larger
regional market in the WECC, and beyond an energy imbalance market, must be expected to
exceed the range of the regional market benefits achieved to date as documented in existing
studies.
Benefits not quantified in this SB 350 study include the value of increased reliability, the
competitive benefits of a larger regional market, improved scheduling and dispatch within
existing balancing areas, improved renewable generation forecasting, improved regional
transmission planning, facilitation of additional renewable generation development, improved


I-70 | brattle.com
LIST OF ACRONYMS
AAEE Additional Achievable Energy Efficiency (CEC EE projection)
AB32 California Assembly Bill 32 (regulates GHGs)
ATC Available Transmission Capacity
AWEA American Wind Energy Association and Interwest Energy Alliance
BAMx Bay Area Municipal Transmission Group
BPA Bonneville Power Administration
Brattle The Brattle Group
CAIR Clean Air Interstate Rule
CAISO California Independent System Operator
Calpine Calpine Corporation
CARB California Air Resources Board
CBE Communities for a Better Environment
CDWR California Department of Water Resources
CEC California Energy Commission (state regulator)
CED California Energy Demand forecast (CEC, biennial study)
CEII Critical Energy Infrastructure Information
CESA California Energy Storage Alliance
CfD Contracts for Differences
CLECA California Large Energy Consumers Association
CMUA California Municipal Utilities Association
CPP Clean Power Plan (EPA)
CPUC California Public Utilities Commission (state regulator)
CREZ California Renewable Energy Zones
CRR Congestion Revenue Rights
CSAPR Cross-State Air Pollution Rule
CWA Clean Water Act (federal)
DOE U.S. Department of Energy
DR Demand Response
Defenders Defenders of Wildlife
Diamond Diamond Generating Corporation
E3 Energy and Environmental Economics
EAP Energy Action Plan (CEC & CPUC, 3 reports)

I-71 | brattle.com
EE Energy Efficiency
EIA U.S. Energy Information Administration
EIM Energy Imbalance Market
EPSA Electrical Power Supply Association
ERCOT Electric Reliability Council of Texas
FERC Federal Energy Regulatory Commission
GHG Greenhouse Gas (primarily carbon or carbon dioxide)
GMC Grid Management Charges
GRE Great River Energy
GWSA California Global Warming Solutions Act of 2006 (AB32)
Greenling/APEN The Greenlining Institute and Asian Pacific Environmental Network
Gridview Simulation tool for system planning analyses
ICNU The Industrial Customers of Northwest Utilities
IID Imperial Irrigation District
IEPR Integrated Energy Policy Report (CEC, biennial report)
IOU Investor-Owned Utility (3 electric IOUs in California: SCE, SDG&E, and
PG&E)
IRP Integration Resource Plan
ISO Independent System Operator
LADWP Los Angeles Department of Water & Power
LBNL Lawrence Berkeley National Laboratory
LCGS Low Carbon Gris Study
LSA Large-Scale Solar Association
LS Power LS Power Development, LLC
LTPP Long-Term Procurement Plan (under CPUC docket, biennial cycles)
MID Modesto Irrigation District
MISO Midcontinent Independent System Operator
MMTCO2e Million Metric Tonnes of CO2 Equivalent
MW Megawatt (one million watts)
MWh Megawatt-hour
MegaWatt Storage MegaWatt Storage Farms, Inc.
NCI Navigant Consulting Inc.
NCPA Northern California Power Agency
NEC Northwest Energy Coalition
NERC North American Electric Reliability Corporation

I-72 | brattle.com
NRDC Natural Resources Defense Council (Western Grid Group, Western
Resource Advocates, Utah Clean Energy, Northwest Energy Coalition,
Islands Energy Coalition and Vote Solar)
NREL National Renewable Energy Laboratory
NRG NRG Energy, Inc.
NYISO New York Independent System Operator
ORA The Office of Ratepayer Advocates
OTC Once-Through Cooling
PacifiCorp PacifiCorp
PMA Power Marketing Agency
PPA Power Purchase Agreement
POU Publicly-Owned Utility
PPC Public Power Council
PTO Participating Transmission Owner
Peak Reliability Peak Reliability
PG&E Pacific Gas and Electric (1 of 3 IOUs in California)
PGP Public Generating Pool
Powerex Powerex Corp.
PPC Public Power Council
RAR Resource Adequacy Requirement
REBA Renewable Energy Buyers Alliance (REBA)
REC Renewable Energy Credit
RESOLVE Renewable Energy Solutions
RPS Renewable Portfolio Standard
RTO Regional Transmission Organization
SB-350 Clean Energy and Pollution Reduction Act of 2015
SCAQMD South Coast Air Quality Management District
SCE Southern California Edison
SCL Seattle City Light
SDG&E San Diego Gas and Electric (1 of 3 IOUs in California)
SONGS San Onofre Nuclear Generating Station
SPP Southwest Power Pool
Sierra Club Sierra Club
Six Cities Cities of Anaheim, Azusa, Banning, Colton, Pasadena, and Riverside,
California

I-73 | brattle.com
Stone Hill Stone Hill CP, LLC
SVP Silicon Valley Power
SWPG SouthWestern Power Group
TANC Transmission Agency of Northern California
TEAM Transmission Economic Assessment Methodology
TEPPC Transmission Expansion Planning Policy Committee (part of WECC)
TOR Transmission Ownership Rights
TPP Transmission Planning Process (CAISO, annual report)
TransCanyon TransCanyon, LLC
TransWest TransWest Express LLC
TURN The Utility Reform Network
UCS Union of Concerned Scientists on behalf of the Environmental Defense
Fund (“EDF”) and the Center for Energy Efficiency and Renewable
Technologies (“CEERT”)
USF Unscheduled flow
WAPA Western Area Power Administration
WCEA Western Clean Energy Advocates
WECC Western Electricity Coordinating Council
WGA Western Governors Association
WGG Western Grid Group
WRA Western Resources Advocates
WREZ Western Energy Renewable Zones
WSP Westlands Solar Park


![EX-PROTECTION - Wandfluh AG · 2017. 4. 3. · 25 40 80 150 15 40 25 100 6 6 60 25 25 25 Pmax [bar] 350 350 350 315 350 350 350 350 350 350 350 350 40 100 350 350 350 350 VALVES EX](https://static.fdocuments.in/doc/165x107/610826360cc123139028f4a3/ex-protection-wandfluh-ag-2017-4-3-25-40-80-150-15-40-25-100-6-6-60-25-25.jpg)

