
SEMI-ANNUAL REPORT April 30, 2016 · SEMI-ANNUAL REPORT April 30, 2016. Segall Bryant & Hamill...
56
Segall Bryant & Hamill Emerging Markets Fund (Class A: SBHEX) (Class I: SBEMX) Segall Bryant & Hamill International Small Cap Fund (Class A: SBHSX) (Class I: SBSIX) SEMI-ANNUAL REPORT April 30, 2016
Transcript of SEMI-ANNUAL REPORT April 30, 2016 · SEMI-ANNUAL REPORT April 30, 2016. Segall Bryant & Hamill...

Segall Bryant & Hamill Emerging Markets Fund (Class A: SBHEX) (Class I: SBEMX)
Segall Bryant & Hamill International Small Cap Fund
(Class A: SBHSX) (Class I: SBSIX)
SEMI-ANNUAL REPORT April 30, 2016

Segall Bryant & Hamill Emerging Markets Fund Segall Bryant & Hamill International Small Cap Fund
Each a series of Investment Managers Series Trust
This report and the financial statements contained herein are provided for the general information of the shareholders of the Segall Bryant & Hamill Funds. This report is not authorized for distribution to prospective investors in the Funds unless preceded or accompanied by an effective prospectus.
www.sbhfunds.com
Table of Contents Segall Bryant & Hamill Emerging Markets Fund
Schedule of Investments .......................................................................................................................... 1
Statement of Assets and Liabilities ......................................................................................................... 16
Statement of Operations ........................................................................................................................ 17
Statements of Changes in Net Assets ..................................................................................................... 18
Financial Highlights ................................................................................................................................. 19
Segall Bryant & Hamill International Small Cap Fund
Schedule of Investments ......................................................................................................................... 21
Statement of Assets and Liabilities ......................................................................................................... 34
Statement of Operations ........................................................................................................................ 35
Statements of Changes in Net Assets ..................................................................................................... 36
Financial Highlights ................................................................................................................................. 37
Notes to Financial Statements .................................................................................................................... 39
Expense Example ........................................................................................................................................ 51

Segall Bryant & Hamill Emerging Markets Fund SCHEDULE OF INVESTMENTS As of April 30, 2016 (Unaudited)
Number of Shares Value __________ ____________
COMMON STOCKS – 94.4%
BRAZIL – 4.9%
1,254 Banco Bradesco S.A. - ADR $ 9,367
13,700 Banco do Brasil S.A. 88,072
5,000 BM&FBovespa S.A. - Bolsa de Valores Mercadorias e Futuros 24,976
6,500 Braskem S.A. - ADR 92,625
700 Cia Energetica de Minas Gerais - ADR 1,372
700 Cielo S.A. 6,818
4,200 Cosan Ltd. - Class A 22,596
3,200 Cosan S.A. Industria e Comercio 29,625
1,600 CVC Brasil Operadora e Agencia de Viagens S.A. 8,839
20,700 Direcional Engenharia S.A. 37,015
1,000 EDP - Energias do Brasil S.A. 3,722
3,100 Eternit S.A. 1,496
400 Ez Tec Empreendimentos e Participacoes S.A. 1,942
41,400 JBS S.A. 108,817
2,500 MRV Engenharia e Participacoes S.A. 8,737
400 Multiplus S.A. 4,414
28,400 QGEP Participacoes S.A. 33,691
7,000 Qualicorp S.A. 30,326
2,600 Raia Drogasil S.A. 41,608
1,000 Rodobens Negocios Imobiliarios S.A. 1,556
1,300 Sao Martinho S.A. 16,907
1,300 Telefonica Brasil S.A. - ADR 16,016
10,000 TPI - Triunfo Participacoes e Investimentos S.A. 15,672
3,800 Tupy S.A. 15,082 ____________ 621,291 ____________ CHILE – 1.0%
38 Banco de Credito e Inversiones 1,634
6,329 E.CL S.A. 10,993
2,700 Enersis Americas S.A. - ADR 23,112
2,700 Enersis Chile S.A. - ADR * 17,199
156 Inversiones La Construccion S.A. 1,839
5,061,212 Itau Corp.Banca 46,002
10,186 Quinenco S.A. 20,043
15,707 Ripley Corp. S.A. 7,715
100 Sociedad Quimica y Minera de Chile S.A. - ADR 2,083
118,663 Vina San Pedro Tarapaca S.A. 1,169 ____________ 131,789 ____________ CHINA – 22.8%
50,000 361 Degrees International Ltd. 17,898
6,000 Agile Property Holdings Ltd. 3,407
127,000 Agricultural Bank of China Ltd. - Class H 45,836
8,000 Air China Ltd. - Class H 6,057
200 Alibaba Group Holding Ltd. - ADR * 15,388
1

Segall Bryant & Hamill Emerging Markets Fund SCHEDULE OF INVESTMENTS – Continued As of April 30, 2016 (Unaudited)
Number of Shares Value __________ ____________
COMMON STOCKS (Continued) CHINA (Continued) 28,000 AMVIG Holdings Ltd. $ 11,529
8,000 Anhui Expressway Co., Ltd. - Class H 6,370
308,000 Bank of China Ltd. - Class H 124,706
8,500 Bank of Chongqing Co., Ltd. - Class H 6,714
58,000 Bank of Communications Co., Ltd. - Class H 36,555
36,000 Baoye Group Co., Ltd. - Class H 23,702
1,500 Beijing Enterprises Holdings Ltd. 7,823
27,000 Boer Power Holdings Ltd. 15,144
48,000 Central China Real Estate Ltd. 9,207
2,000 Chaoda Modern Agriculture Holdings Ltd. * 43
45,000 China Aoyuan Property Group Ltd. 8,909
91,000 China Cinda Asset Management Co., Ltd. - Class H 29,799
51,000 China CITIC Bank Corp. Ltd. - Class H * 31,985
34,000 China Communications Services Corp. Ltd. - Class H 16,048
469,000 China Construction Bank Corp. - Class H 297,874
77,000 China Dongxiang Group Co., Ltd. 15,859
268,000 China Everbright Bank Co., Ltd. - Class H 121,526
17,000 China Harmony New Energy Auto Holding Ltd. 10,522
23,000 China High Speed Transmission Equipment Group Co., Ltd. * 17,825
58,000 China Lesso Group Holdings Ltd. 31,889
24,000 China Lilang Ltd. 15,343
68,000 China Lumena New Materials Corp. * 1 -
6,000 China Metal Recycling Holdings Ltd. * 1 -
22,000 China Mobile Ltd. 252,577
2,000 China Oriental Group Co., Ltd. * 1 -
12,000 China Petroleum & Chemical Corp. - Class H 8,456
66,000 China Power International Development Ltd. 28,170
6,000 China Resources Beer Holdings Co., Ltd. 13,184
22,000 China Resources Power Holdings Co., Ltd. 37,053
43,000 China SCE Property Holdings Ltd. 9,074
22,500 China Shenhua Energy Co., Ltd. - Class H 37,886
6,000 China Shineway Pharmaceutical Group Ltd. 6,857
6,000 China State Construction International Holdings Ltd. 9,346
406,000 China Suntien Green Energy Corp. Ltd. - Class H 46,190
96,000 China Telecom Corp. Ltd. - Class H 47,527
27,000 China Yongda Automobiles Services Holdings Ltd. 14,415
35,200 China Zhongwang Holdings Ltd. 17,529
130,000 Chongqing Machinery & Electric Co., Ltd. - Class H 15,385
22,000 Chongqing Rural Commercial Bank Co., Ltd. - Class H 11,563
44,000 CIFI Holdings Group Co., Ltd. 10,182
79,000 CNOOC Ltd. 97,591
330,000 Concord New Energy Group Ltd. 17,728
101,000 Country Garden Holdings Co., Ltd. 39,852
650,000 CP Pokphand Co., Ltd. 69,300
2

Segall Bryant & Hamill Emerging Markets Fund SCHEDULE OF INVESTMENTS – Continued As of April 30, 2016 (Unaudited)
Number of Shares Value __________ ____________
COMMON STOCKS (Continued) CHINA (Continued) 6,000 CSPC Pharmaceutical Group Ltd. $ 5,333
17,000 Dah Chong Hong Holdings Ltd. 7,037
84,000 Fantasia Holdings Group Co., Ltd. 11,114
663,000 GCL-Poly Energy Holdings Ltd. 98,806
18,000 Goldlion Holdings Ltd. 7,140
11,200 Guangzhou R&F Properties Co., Ltd. - Class H 15,619
50,000 Harbin Bank Co., Ltd. - Class H 2 14,151
56,000 Hengdeli Holdings Ltd. 5,827
68,000 Hua Han Health Industry Holdings Ltd. 7,073
7,000 Hua Hong Semiconductor Ltd. * 2 7,041
24,000 Huadian Power International Corp. Ltd. - Class H 12,306
48,000 Huaneng Power International, Inc. - Class H 34,237
3,000 Huishang Bank Corp. Ltd. - Class H 1,444
279,000 Industrial & Commercial Bank of China Ltd. - Class H 149,379
34,000 Ju Teng International Holdings Ltd. 15,262
11,500 Kingboard Chemical Holdings Ltd. 22,118
53,500 Kingboard Laminates Holdings Ltd. 27,351
13,000 KWG Property Holding Ltd. 8,411
21,000 Lee & Man Paper Manufacturing Ltd. 13,764
2,600 Legend Holdings Corp. - Class H * 2 6,282
16,000 Longfor Properties Co., Ltd. 22,447
52,000 MIE Holdings Corp. * 5,553
38,000 Modern Land China Co., Ltd. * 7,348
800 NetEase, Inc. - ADR 112,560
64,000 Peak Sport Products Co., Ltd. 17,760
46,000 Powerlong Real Estate Holdings Ltd. 9,930
62,000 Qingling Motors Co., Ltd. - Class H 20,104
11,000 Road King Infrastructure Ltd. 9,108
4,000 Shenzhen Investment Ltd. 1,613
2,500 Shimao Property Holdings Ltd. 3,450
25,500 Sinopec Engineering Group Co., Ltd. - Class H 23,652
40,000 Sinopec Shanghai Petrochemical Co., Ltd. - Class H * 19,621
7,600 Sinopharm Group Co., Ltd. - Class H 32,484
6,000 Skyworth Digital Holdings Ltd. 3,905
2,000 Sunac China Holdings Ltd. 1,279
16,900 Tencent Holdings Ltd. 343,887
8,000 Tianneng Power International Ltd. * 6,552
96,000 Trigiant Group Ltd. 16,292
9,000 Xingda International Holdings Ltd. 1,883
16,000 Xinyi Solar Holdings Ltd. 6,306
32,000 Youyuan International Holdings Ltd. 7,412
442,000 Yuanda China Holdings Ltd. 13,812
3

Segall Bryant & Hamill Emerging Markets Fund SCHEDULE OF INVESTMENTS – Continued As of April 30, 2016 (Unaudited)
Number of Shares Value __________ ____________
COMMON STOCKS (Continued) CHINA (Continued) 36,000 Yuzhou Properties Co., Ltd. $ 9,834 ____________ 2,884,310 ____________ COLOMBIA – 0.4%
384 Bancolombia S.A. 3,438
111,520 Empresa de Telecomunicaciones de Bogota 23,880
8,569 Interconexion Electrica S.A. ESP 26,170 ____________ 53,488 ____________ CZECH REPUBLIC – 0.0%
244 CEZ A.S. 4,765 ____________ EGYPT – 0.3%
6,573 Credit Agricole Egypt SAE 16,284
11,641 Egypt Kuwait Holding Co., S.A.E 5,343
5,472 Faisal Islamic Bank of Egypt 5,848
2,856 Housing & Development Bank 5,616
1,850 QNB Alahli Bank SAE * 7,302 ____________ 40,393 ____________ GREECE – 0.5%
2,032 Aegean Airlines S.A. 18,644
1,693 Bank of Greece 19,105
200 Danaos Corp. * 790
1,296 Hellenic Petroleum S.A. * 5,729
1,533 Motor Oil Hellas Corinth Refineries S.A. 17,484 ____________ 61,752 ____________ HUNGARY – 0.1%
3,568 Magyar Telekom Telecommunications PLC * 6,197
104 MOL Hungarian Oil & Gas PLC 6,355 ____________ 12,552 ____________ INDIA – 7.8%
26 Axis Bank Ltd. - GDR 935
2,451 Bajaj Holdings & Investment Ltd. - GDR 1 53,062
2,700 Dr Reddy's Laboratories Ltd. - ADR 123,120
11,597 Indiabulls Housing Finance Ltd. - GDR 121,206
21,724 Indiabulls Real Estate Ltd. - GDR * 22,156
6,100 Infosys Ltd. - ADR 114,680
409,961 Jain Irrigation Systems Ltd. 23,722
331 Larsen & Toubro Ltd. - GDR 6,316
16,233 Reliance Communications Ltd. - GDR * 13,754
4,465 Reliance Industries Ltd. - GDR 2 132,164
34,699 Tata Global Beverages Ltd. - GDR 62,802
3,500 Tata Motors Ltd. - ADR * 106,330
913 United Spirits Ltd. - GDR * 16,352
4

Segall Bryant & Hamill Emerging Markets Fund SCHEDULE OF INVESTMENTS – Continued As of April 30, 2016 (Unaudited)
Number of Shares Value __________ ____________
COMMON STOCKS (Continued) INDIA (Continued) 8,500 Vedanta Ltd. - ADR $ 53,380
11,300 Wipro Ltd. - ADR 137,295 ____________ 987,274 ____________ INDONESIA – 2.8%
503,300 Bank Bukopin Tbk 22,862
37,200 Bank Negara Indonesia Persero Tbk P.T. 12,880
471,800 Bank Pembangunan Daerah Jawa Barat Dan Banten Tbk P.T. 33,549
43,400 Bank Rakyat Indonesia Persero Tbk P.T. 33,916
267,800 Bank Tabungan Negara Persero Tbk P.T. 35,613
6,800 Gudang Garam Tbk P.T. 35,635
239,000 Indah Kiat Pulp & Paper Corp. Tbk P.T. 18,123
20,800 Indosat Tbk P.T. * 10,566
1,743,300 MNC Investama Tbk P.T. 22,293
162,000 Perusahaan Perkebunan London Sumatra Indonesia Tbk P.T. 18,772
98,700 Ramayana Lestari Sentosa Tbk P.T. 5,234
653,700 Sri Rejeki Isman Tbk P.T. 14,237
1,000 Telekomunikasi Indonesia Persero Tbk P.T. - ADR 53,370
32,600 United Tractors Tbk P.T. 36,904 ____________ 353,954 ____________ MALAYSIA – 3.4%
11,700 AEON Credit Service M Bhd 39,453
15,000 AirAsia Bhd 7,281
13,800 AMMB Holdings Bhd 15,983
9,700 Axiata Group Bhd 14,011
7,600 Boustead Holdings Bhd 7,568
2,000 Dayang Enterprise Holdings Bhd 669
79,500 Evergreen Fibreboard Bhd 21,950
1,700 Fraser & Neave Holdings Bhd 9,835
2,000 Heineken Malaysia Bhd 7,694
5,500 Hong Leong Industries Bhd 10,364
3,000 IGB Corp. Bhd 1,912
37,000 JCY International Bhd 6,240
20,300 Malayan Banking Bhd 46,345
1,300 Malaysian Pacific Industries Bhd 2,460
17,800 Matrix Concepts Holdings Bhd 11,437
97,400 Media Prima Bhd 35,155
15,200 MISC Bhd 32,879
2,800 MSM Malaysia Holdings Bhd 3,512
4,000 OSK Holdings Bhd 1,689
43,700 Star Media Group Bhd 27,183
51,900 Supermax Corp. Bhd 34,521
22,600 Ta Ann Holdings Bhd 27,711
19,700 Taliworks Corp. Bhd 6,648
5

Segall Bryant & Hamill Emerging Markets Fund SCHEDULE OF INVESTMENTS – Continued As of April 30, 2016 (Unaudited)
Number of Shares Value __________ ____________
COMMON STOCKS (Continued) MALAYSIA (Continued) 4,200 Top Glove Corp. Bhd $ 5,329
22,300 Tropicana Corp. Bhd 5,704
13,700 Unisem M Bhd 7,745
21,600 UOA Development Bhd 12,164
8,500 YTL Hospitality REIT 2,305
75,100 YTL Power International Bhd 28,837 ____________ 434,584 ____________ MEXICO – 4.0%
41,000 Alpek S.A.B. de C.V. 68,466
5,900 America Movil S.A.B. de C.V. - ADR 83,544
17,500 Credito Real S.A.B. de C.V. SOFOM ER 38,601
12,100 Fibra Shop Portafolios Inmobiliarios SAPI de C.V. - REIT 11,675
6,300 Gentera S.A.B. de C.V. 12,531
18,700 Grupo Aeromexico S.A.B. de C.V. * 42,650
21,400 Grupo Famsa S.A.B. de C.V. - Class A * 16,195
8,400 Grupo Herdez S.A.B. de C.V. 18,592
6,100 Grupo Industrial Maseca S.A.B. de C.V. - Class B 8,052
6,100 Grupo Sanborns S.A.B. de C.V. 8,438
14,900 Industrias Bachoco S.A.B. de C.V. 62,442
25,800 Kimberly-Clark de Mexico S.A.B. de C.V. - Class A 61,063
9,400 Mexico Real Estate Management S.A. de C.V. - REIT * 12,938
16,200 OHL Mexico S.A.B. de C.V. * 26,346
4,200 PLA Administradora Industrial S de RL de C.V. - REIT * 7,758
7,900 Prologis Property Mexico S.A. de C.V. - REIT * 12,444
6,900 Rassini S.A.B. de C.V. - Class A 15,633 ____________ 507,368 ____________ PERU – 0.3%
43,094 Ferreycorp S.A.A. 22,561
698 Intercorp Financial Services, Inc. 19,893 ____________ 42,454 ____________ PHILIPPINES – 1.5%
83,900 8990 Holdings, Inc. 14,293
7,390 Cebu Air, Inc. 14,020
117,100 Cosco Capital, Inc. 19,821
21,700 DMCI Holdings, Inc. 5,762
60,600 Filinvest Development Corp. 7,044
326,000 Filinvest Land, Inc. 12,717
40,800 Rizal Commercial Banking Corp. 26,950
30,500 San Miguel Corp. 43,583
6,150 San Miguel Pure Foods Co., Inc. 26,855
117,600 Vista Land & Lifescapes, Inc. 12,016 ____________ 183,061 ____________
6

Segall Bryant & Hamill Emerging Markets Fund SCHEDULE OF INVESTMENTS – Continued As of April 30, 2016 (Unaudited)
Number of Shares Value __________ ____________
COMMON STOCKS (Continued) POLAND – 1.3%
103 Asseco Poland S.A. $ 1,563
15,245 Bank Millennium S.A. * 19,970
146 CD Projekt Red S.A. * 974
4,216 Enea S.A. 13,034
3,249 Globe Trade Centre S.A. * 6,001
145 Lubelski Wegiel Bogdanka S.A. 1,736
8,976 PGE Polska Grupa Energetyczna S.A. 30,994
3,230 Polski Koncern Naftowy ORLEN S.A. 58,254
867 Powszechna Kasa Oszczednosci Bank Polski S.A. * 5,556
2,199 Powszechny Zaklad Ubezpieczen S.A. 19,903 ____________ 157,985 ____________ QATAR – 1.1%
548 Aamal Co. 1,936
1,025 Barwa Real Estate Co. 9,428
3,409 Doha Bank QSC 34,517
1,681 Ooredoo QSC 42,349
3,145 Qatar Industrial Manufacturing Co. QSC 33,736
2,997 United Development Co. QSC 15,798 ____________ 137,764 ____________ RUSSIA – 4.0%
14,900 Aeroflot - Russian Airlines PJSC * 17,846
8,150 Bank St Petersburg PJSC 6,595
290 Bashneft PAO 12,894
2,455 Cherkizovo Group PJSC 34,084
10,043 Etalon Group Ltd. - GDR 22,898
7,440 Gazprom Neft PAO 17,516
45,525 Gazprom PAO - ADR 236,548
893,000 Inter RAO UES PJSC 24,787
7,329 LSR Group PJSC - GDR 16,541
8,600 Nizhnekamskneftekhim PJSC 6,689
136,000 Novorossiysk Commercial Sea Port PJSC 8,378
86 PhosAgro OAO - GDR 1,333
6,700 Protek OJSC * 9,578
43,490 Sberbank of Russia PJSC 83,028 ____________ 498,715 ____________ SOUTH AFRICA – 7.5%
3,126 Accelerate Property Fund Ltd. - REIT 1,383
2,031 AECI Ltd. 13,710
33,015 Arrowhead Properties Ltd. - Class A - REIT 19,945
6,714 Astral Foods Ltd. 60,907
2,068 Barclays Africa Group Ltd. 20,941
2,185 Barloworld Ltd. 12,614
7
Segall Bryant & Hamill Emerging Markets Fund SCHEDULE OF INVESTMENTS – Continued As of April 30, 2016 (Unaudited)
Number of Shares Value __________ ____________
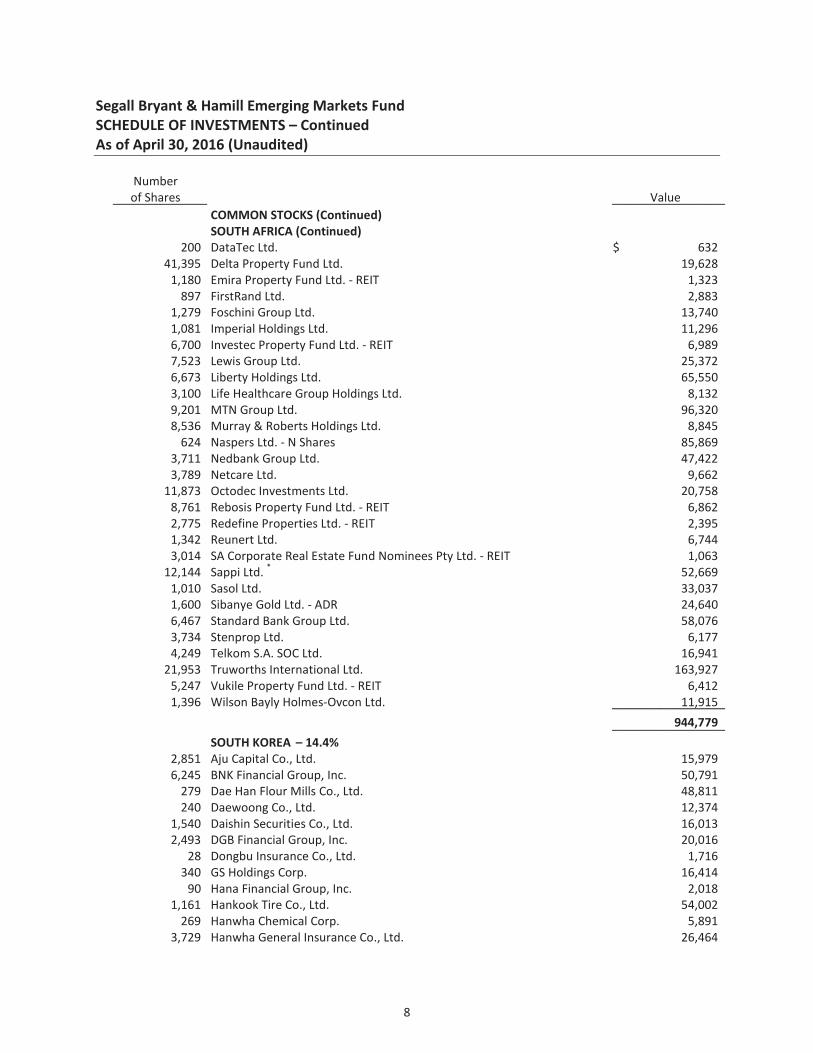
COMMON STOCKS (Continued) SOUTH AFRICA (Continued) 200 DataTec Ltd. $ 632
41,395 Delta Property Fund Ltd. 19,628
1,180 Emira Property Fund Ltd. - REIT 1,323
897 FirstRand Ltd. 2,883
1,279 Foschini Group Ltd. 13,740
1,081 Imperial Holdings Ltd. 11,296
6,700 Investec Property Fund Ltd. - REIT 6,989
7,523 Lewis Group Ltd. 25,372
6,673 Liberty Holdings Ltd. 65,550
3,100 Life Healthcare Group Holdings Ltd. 8,132
9,201 MTN Group Ltd. 96,320
8,536 Murray & Roberts Holdings Ltd. 8,845
624 Naspers Ltd. - N Shares 85,869
3,711 Nedbank Group Ltd. 47,422
3,789 Netcare Ltd. 9,662
11,873 Octodec Investments Ltd. 20,758
8,761 Rebosis Property Fund Ltd. - REIT 6,862
2,775 Redefine Properties Ltd. - REIT 2,395
1,342 Reunert Ltd. 6,744
3,014 SA Corporate Real Estate Fund Nominees Pty Ltd. - REIT 1,063
12,144 Sappi Ltd. * 52,669
1,010 Sasol Ltd. 33,037
1,600 Sibanye Gold Ltd. - ADR 24,640
6,467 Standard Bank Group Ltd. 58,076
3,734 Stenprop Ltd. 6,177
4,249 Telkom S.A. SOC Ltd. 16,941
21,953 Truworths International Ltd. 163,927
5,247 Vukile Property Fund Ltd. - REIT 6,412
1,396 Wilson Bayly Holmes-Ovcon Ltd. 11,915 ____________ 944,779 ____________ SOUTH KOREA – 14.4%
2,851 Aju Capital Co., Ltd. 15,979
6,245 BNK Financial Group, Inc. 50,791
279 Dae Han Flour Mills Co., Ltd. 48,811
240 Daewoong Co., Ltd. 12,374
1,540 Daishin Securities Co., Ltd. 16,013
2,493 DGB Financial Group, Inc. 20,016
28 Dongbu Insurance Co., Ltd. 1,716
340 GS Holdings Corp. 16,414
90 Hana Financial Group, Inc. 2,018
1,161 Hankook Tire Co., Ltd. 54,002
269 Hanwha Chemical Corp. 5,891
3,729 Hanwha General Insurance Co., Ltd. 26,464
8
Segall Bryant & Hamill Emerging Markets Fund SCHEDULE OF INVESTMENTS – Continued As of April 30, 2016 (Unaudited)
Number of Shares Value __________ ____________
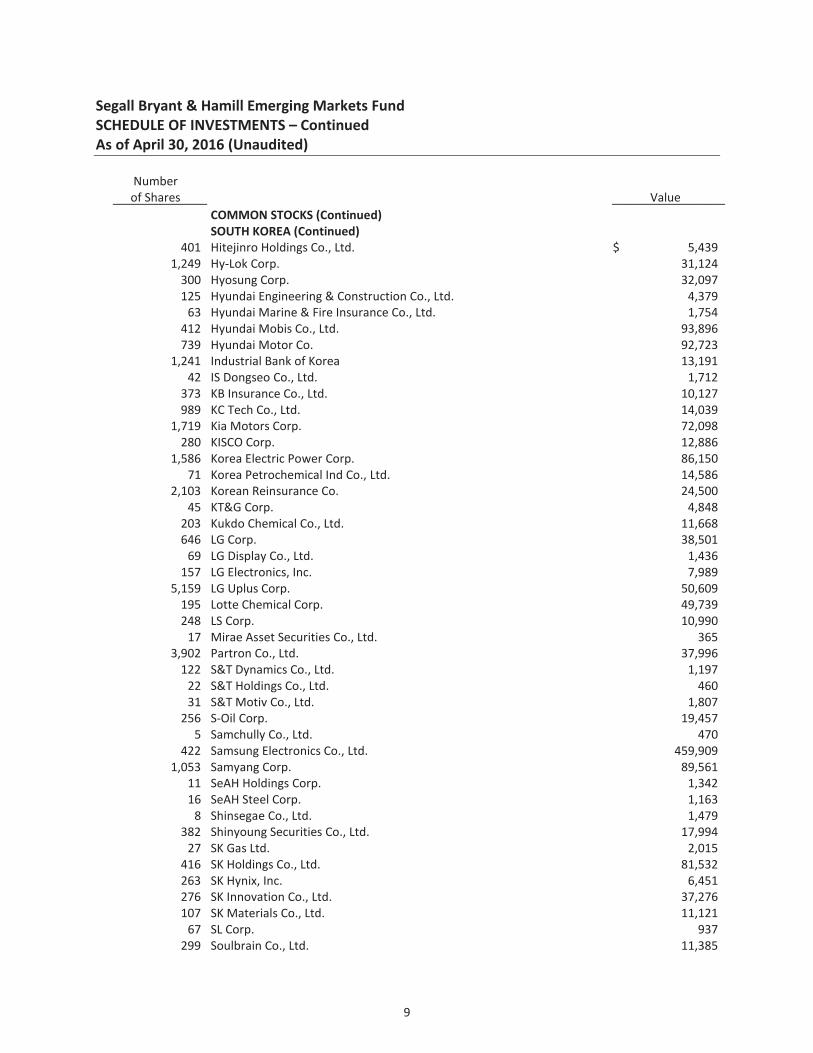
COMMON STOCKS (Continued) SOUTH KOREA (Continued) 401 Hitejinro Holdings Co., Ltd. $ 5,439
1,249 Hy-Lok Corp. 31,124
300 Hyosung Corp. 32,097
125 Hyundai Engineering & Construction Co., Ltd. 4,379
63 Hyundai Marine & Fire Insurance Co., Ltd. 1,754
412 Hyundai Mobis Co., Ltd. 93,896
739 Hyundai Motor Co. 92,723
1,241 Industrial Bank of Korea 13,191
42 IS Dongseo Co., Ltd. 1,712
373 KB Insurance Co., Ltd. 10,127
989 KC Tech Co., Ltd. 14,039
1,719 Kia Motors Corp. 72,098
280 KISCO Corp. 12,886
1,586 Korea Electric Power Corp. 86,150
71 Korea Petrochemical Ind Co., Ltd. 14,586
2,103 Korean Reinsurance Co. 24,500
45 KT&G Corp. 4,848
203 Kukdo Chemical Co., Ltd. 11,668
646 LG Corp. 38,501
69 LG Display Co., Ltd. 1,436
157 LG Electronics, Inc. 7,989
5,159 LG Uplus Corp. 50,609
195 Lotte Chemical Corp. 49,739
248 LS Corp. 10,990
17 Mirae Asset Securities Co., Ltd. 365
3,902 Partron Co., Ltd. 37,996
122 S&T Dynamics Co., Ltd. 1,197
22 S&T Holdings Co., Ltd. 460
31 S&T Motiv Co., Ltd. 1,807
256 S-Oil Corp. 19,457
5 Samchully Co., Ltd. 470
422 Samsung Electronics Co., Ltd. 459,909
1,053 Samyang Corp. 89,561
11 SeAH Holdings Corp. 1,342
16 SeAH Steel Corp. 1,163
8 Shinsegae Co., Ltd. 1,479
382 Shinyoung Securities Co., Ltd. 17,994
27 SK Gas Ltd. 2,015
416 SK Holdings Co., Ltd. 81,532
263 SK Hynix, Inc. 6,451
276 SK Innovation Co., Ltd. 37,276
107 SK Materials Co., Ltd. 11,121
67 SL Corp. 937
299 Soulbrain Co., Ltd. 11,385
9

Segall Bryant & Hamill Emerging Markets Fund SCHEDULE OF INVESTMENTS – Continued As of April 30, 2016 (Unaudited)
Number of Shares Value __________ ____________
COMMON STOCKS (Continued) SOUTH KOREA (Continued) 134 Sungwoo Hitech Co., Ltd. $ 1,092
143 Tongyang Life Insurance Co., Ltd. 1,325
258 Unid Co., Ltd. 10,629
36 Webzen, Inc. * 731
6,203 Woori Bank 56,993 ____________ 1,811,657 ____________ TAIWAN – 11.1%
5,000 Advanced Wireless Semiconductor Co. 9,117
38,000 AmTRAN Technology Co., Ltd. 23,481
6,000 AU Optronics Corp. 1,717
75,000 Capital Securities Corp. 19,750
4,000 Casetek Holdings Ltd. 17,963
6,000 Catcher Technology Co., Ltd. 41,993
14,000 Cathay Real Estate Development Co., Ltd. 6,197
61,000 Central Reinsurance Co., Ltd. 27,223
355 Chimei Materials Technology Corp. 193
64,000 China Bills Finance Corp. 24,400
45,000 China Synthetic Rubber Corp. 33,127
200 Chunghwa Telecom Co., Ltd. - ADR 6,820
76,000 Compal Electronics, Inc. 44,611
22,779 Elitegroup Computer Systems Co., Ltd. 13,937
16,000 EnTie Commercial Bank Co., Ltd. 6,880
6,000 Eva Airways Corp. * 2,970
76,000 Far Eastern International Bank 22,053
2,000 Far EasTone Telecommunications Co., Ltd. 4,510
7,000 Farglory Land Development Co., Ltd. 8,372
10,000 Feng Hsin Steel Co., Ltd. 14,094
19,040 Foxconn Technology Co., Ltd. 39,168
53,000 Fubon Financial Holding Co., Ltd. 64,200
8,000 Gintech Energy Corp. * 5,432
116,000 Goldsun Building Materials Co., Ltd. 29,887
3,000 Grand Pacific Petrochemical 1,556
59,000 Great Wall Enterprise Co., Ltd. 39,970
4,000 Hey Song Corp. 4,316
5,000 Hiroca Holdings Ltd. 19,628
600 Holy Stone Enterprise Co., Ltd. 615
64,729 Hon Hai Precision Industry Co., Ltd. 154,189
4,000 Huaku Development Co., Ltd. 7,055
31,171 Industrial Bank of Taiwan 7,538
3,000 King Yuan Electronics Co., Ltd. 2,640
9,000 King's Town Bank Co., Ltd. 6,262
61,000 Lien Hwa Industrial Corp. 37,965
43,000 Lite-On Technology Corp. 52,229
10

Segall Bryant & Hamill Emerging Markets Fund SCHEDULE OF INVESTMENTS – Continued As of April 30, 2016 (Unaudited)
Number of Shares Value __________ ____________
COMMON STOCKS (Continued) TAIWAN (Continued) 25,000 Long Chen Paper Co., Ltd. $ 10,443
6,000 Masterlink Securities Corp. 1,639
4,000 Novatek Microelectronics Corp. 13,938
22,000 Pegatron Corp. 46,347
19,000 Powertech Technology, Inc. 38,346
53,000 President Securities Corp. 19,993
26,000 Prince Housing & Development Corp. 9,503
8,000 Radiant Opto-Electronics Corp. 11,481
2,268 Ruentex Development Co., Ltd. 2,551
1,000 Shin Zu Shing Co., Ltd. 2,846
37,000 Shinkong Synthetic Fibers Corp. 9,792
9,000 Systex Corp. 15,107
6,000 Taishin Financial Holding Co., Ltd. 2,263
6,000 Taiwan Land Development Corp. 1,995
13,000 Taiwan Mobile Co., Ltd. 42,853
13,400 Taiwan Semiconductor Manufacturing Co., Ltd. - ADR 316,106
12,000 Test Rite International Co., Ltd. 7,265
5,000 Tong Yang Industry Co., Ltd. 7,602
115 TSRC Corp. 101
17,000 Tung Ho Steel Enterprise Corp. 10,895
9,000 Win Semiconductors Corp. 16,900
7,000 Wisdom Marine Lines Co., Ltd. * 8,109
475 Wistron Corp. 280
244 Wistron NeWeb Corp. 633 ____________ 1,399,046 ____________ THAILAND – 2.4%
58,330 AP Thailand PCL 10,000
1,400 Bangchak Petroleum PCL 1,240
10,386 Bangkok Expressway & Metro PCL 1,768
28,000 BJC Heavy Industries PCL 5,082
16,077 Cal-Comp Electronics Thailand PCL 1,387
5,200 Dhipaya Insurance PCL 5,542
17,400 GFPT PCL 6,314
306,000 IRPC PCL 44,587
109,800 Jasmine International PCL 13,681
5,500 Kiatnakin Bank PCL 6,528
36,600 Krung Thai Bank PCL 18,289
34,700 PTT Global Chemical PCL 61,849
6,500 Saha-Union PCL 6,839
25,100 Sansiri PCL 1,105
116,650 SC Asset Corp. PCL 10,071
300 Siam Cement PCL 4,184
9,400 SPCG PCL 5,617
11

Segall Bryant & Hamill Emerging Markets Fund SCHEDULE OF INVESTMENTS – Continued As of April 30, 2016 (Unaudited)
Number of Shares Value __________ ____________
COMMON STOCKS (Continued) THAILAND (Continued) 6,600 Sri Ayudhya Capital PCL $ 6,235
19,700 Star Petroleum Refining PCL * 2 6,196
17,700 Supalai PCL 10,375
38,900 SVI PCL * 5,443
21,500 Thai Oil PCL 40,554
10,500 Thanachart Capital PCL 10,430
2,500 Tipco Asphalt PCL 1,756
4,300 Tisco Financial Group PCL 5,348
15,200 Vanachai Group PCL 5,689 ____________ 296,109 ____________ TURKEY – 1.8%
2,551 Adana Cimento Sanayii TAS - Class A 6,984
2,608 Aksa Akrilik Kimya Sanayii A.S. 9,083
27,137 Albaraka Turk Katilim Bankasi A.S. 15,321
1,009 Bolu Cimento Sanayii A.S. 2,473
1,313 Eczacibasi Yatirim Holding Ortakligi A.S. 6,474
25,380 EIS Eczacibasi Ilac ve Sinai ve Finansal Yatirimlar Sanayi ve Ticaret A.S. 32,179
9,567 Is Gayrimenkul Yatirim Ortakligi A.S. - REIT 6,461
22,722 Is Yatirim Menkul Degerler A.S. 8,036
167 Nuh Cimento Sanayi A.S. 643
555 TAV Havalimanlari Holding A.S. 3,234
6,887 Torunlar Gayrimenkul Yatirim Ortakligi A.S. - REIT 12,684
1,445 Tupras Turkiye Petrol Rafinerileri A.S. 38,113
11,228 Turk Hava Yollari AO * 27,671
600 Turkcell Iletisim Hizmetleri A.S. - ADR 6,480
6,848 Turkiye Halk Bankasi A.S. 26,299
8,766 Turkiye Vakiflar Bankasi TAO 15,471
1,761 Yeni Gimat Gayrimenkul Ortakligi A.S. 8,962 ____________ 226,568 ____________ UNITED ARAB EMIRATES – 1.0%
12,620 Abu Dhabi Commercial Bank PJSC 22,589
60,493 DAMAC Properties Dubai Co. PJSC 42,167
10,801 Dubai Islamic Bank PJSC 17,047
3,583 Emirates Telecommunications Group Co. PJSC 18,437
453 NMC Health PLC 6,930
39,878 RAK Properties PJSC 6,069
18,691 Ras Al Khaimah Ceramics 16,856 ____________ 130,095 ____________
TOTAL COMMON STOCKS (Cost $11,533,846) 11,921,753 ____________
12

Segall Bryant & Hamill Emerging Markets Fund SCHEDULE OF INVESTMENTS – Continued As of April 30, 2016 (Unaudited)
Number of Shares Value __________ ____________
EXCHANGE-TRADED FUNDS – 0.0%
11 iShares MSCI Qatar Capped ETF $ 214 ____________
TOTAL EXCHANGE-TRADED FUNDS (Cost $240) 214 ____________
PREFERRED STOCKS – 3.0%
BRAZIL – 1.5%
4,677 Banco ABC Brasil S.A. 16,115
1,300 Banco do Estado do Rio Grande do Sul S.A. 3,217
1,300 Cia de Gas de Sao Paulo - COMGAS 15,206
15,400 Cia de Saneamento do Parana 19,165
700 Eletropaulo Metropolitana Eletricidade de Sao Paulo S.A. 1,746
41,940 Itausa - Investimentos Itau S.A. 105,603
5,900 Parana Banco S.A. 15,456
3,700 Suzano Papel e Celulose S.A. 14,125 ____________ 190,633 ____________ CHILE – 0.1%
4,200 Coca-Cola Embonor S.A. - Class B 7,743 ____________ COLOMBIA – 0.2%
2,548 Banco Davivienda S.A. 24,007 ____________ RUSSIA – 0.2%
48,300 Surgutneftegas OAO 31,313 ____________ SOUTH KOREA – 1.0%
74 LG Chem Ltd. 12,796
126 Samsung Electronics Co., Ltd. 115,074 ____________ 127,870 ____________
TOTAL PREFERRED STOCKS (Cost $336,421) 381,566 ____________
RIGHTS – 0.0%
BRAZIL – 0.0%
34 Cia de Gas de Sao Paulo - COMGAS * 1 14 ____________
TOTAL RIGHTS (Cost $—) 14 ____________
UNITS – 0.2%
BRAZIL – 0.2%
400 AES Tiete Energia S.A. 1,642
3,900 Sul America S.A. 18,994 ____________ 20,636 ____________
TOTAL UNITS (Cost $19,976) 20,636 ____________
13
Segall Bryant & Hamill Emerging Markets Fund SCHEDULE OF INVESTMENTS – Continued As of April 30, 2016 (Unaudited)
Number of Shares Value __________ ____________
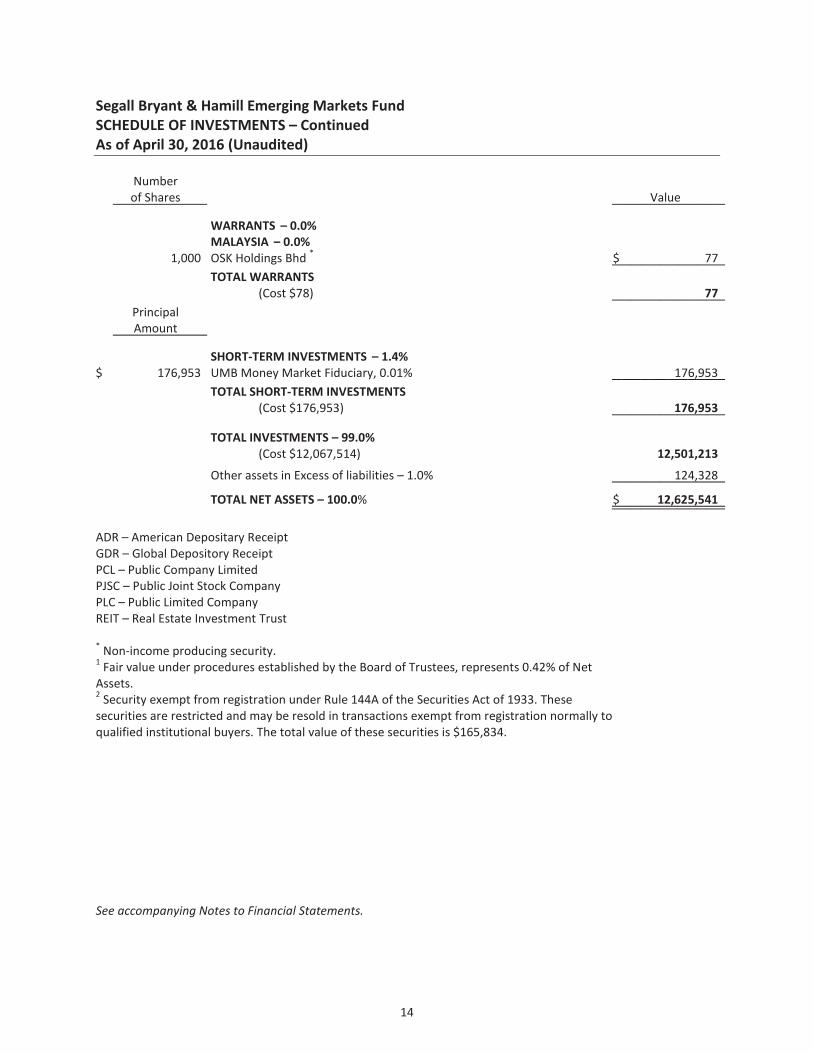
WARRANTS – 0.0%
MALAYSIA – 0.0%
1,000 OSK Holdings Bhd * $ 77 ____________
TOTAL WARRANTS (Cost $78) 77 ____________
Principal Amount __________
SHORT-TERM INVESTMENTS – 1.4%
$ 176,953 UMB Money Market Fiduciary, 0.01% 176,953 ____________
TOTAL SHORT-TERM INVESTMENTS (Cost $176,953) 176,953 ____________
TOTAL INVESTMENTS – 99.0% (Cost $12,067,514) 12,501,213
Other assets in Excess of liabilities – 1.0% 124,328 ____________ TOTAL NET ASSETS – 100.0% $ 12,625,541 ________________________ ADR – American Depositary Receipt GDR – Global Depository Receipt PCL – Public Company Limited PJSC – Public Joint Stock Company PLC – Public Limited Company REIT – Real Estate Investment Trust * Non-income producing security. 1 Fair value under procedures established by the Board of Trustees, represents 0.42% of Net Assets. 2 Security exempt from registration under Rule 144A of the Securities Act of 1933. These securities are restricted and may be resold in transactions exempt from registration normally to qualified institutional buyers. The total value of these securities is $165,834. See accompanying Notes to Financial Statements.
14

Segall Bryant & Hamill Emerging Markets Fund SUMMARY OF INVESTMENTS As of April 30, 2016 (Unaudited)
Security Type/Sector Percent of Total
Net Assets Common Stocks
Financials 26.1% Technology 17.1% Consumer Discretionary 9.4% Energy 9.1% Communications 7.9% Consumer Staples 7.8% Materials 7.4% Industrials 4.3% Utilities 3.6% Health Care 1.7% __________
Total Common Stocks 94.4% Exchange-Traded Funds 0.0% Preferred Stocks
Financials 1.3% Technology 0.9% Utilities 0.3% Energy 0.2% Materials 0.2% Consumer Staples 0.1% __________
Total Preferred Stocks 3.0% Rights 0.0% Units 0.2% Warrants 0.0% Short-Term Investments 1.4% __________Total Investments 99.0% Other assets in Excess of liabilities 1.0% __________Total Net Assets 100.0% ____________________
See accompanying Notes to Financial Statements.
15
See accompanying Notes to Financial Statements.
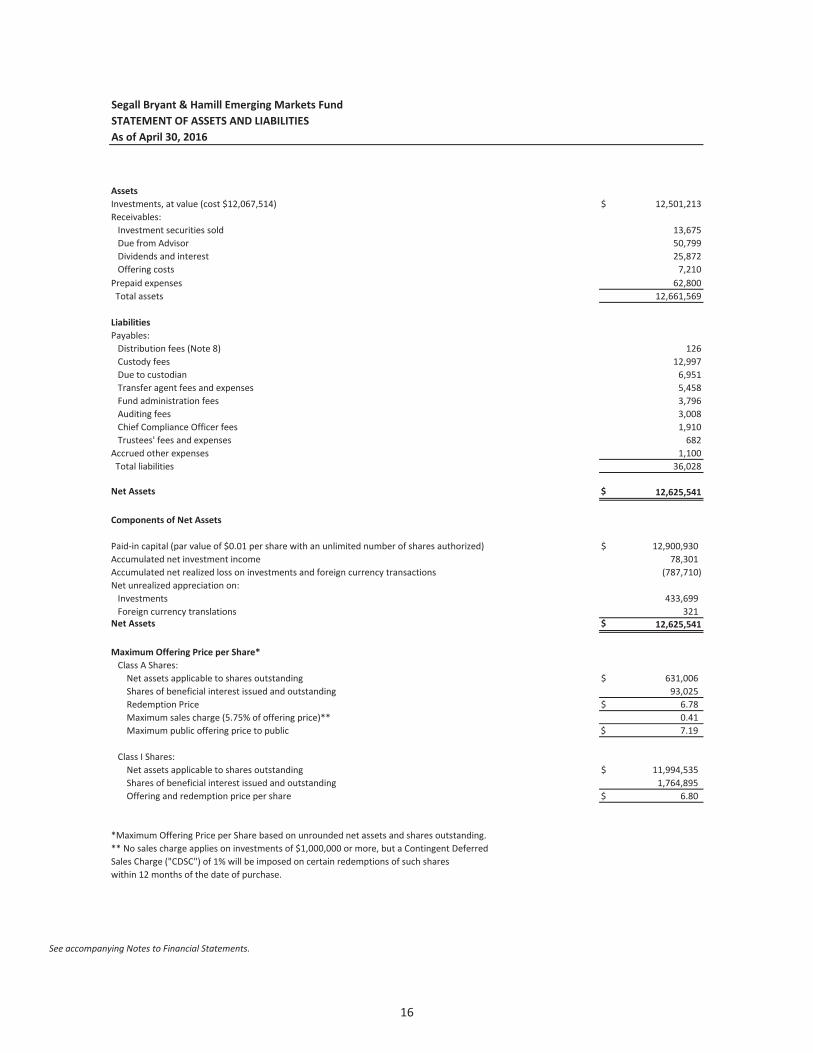
Segall Bryant & Hamill Emerging Markets FundSTATEMENT OF ASSETS AND LIABILITIESAs of April 30, 2016
AssetsInvestments, at value (cost $12,067,514) $ 12,501,213Receivables: Investment securities sold 13,675 Due from Advisor 50,799 Dividends and interest 25,872 Offering costs 7,210Prepaid expenses 62,800 Total assets 12,661,569
LiabilitiesPayables: Distribution fees (Note 8) 126 Custody fees 12,997 Due to custodian 6,951 Transfer agent fees and expenses 5,458 Fund administration fees 3,796 Auditing fees 3,008 Chief Compliance Officer fees 1,910 Trustees' fees and expenses 682Accrued other expenses 1,100 Total liabilities 36,028 Net Assets $ 12,625,541
Components of Net Assets
Paid-in capital (par value of $0.01 per share with an unlimited number of shares authorized) $ 12,900,930 Accumulated net investment income 78,301 Accumulated net realized loss on investments and foreign currency transactions (787,710) Net unrealized appreciation on: Investments 433,699 Foreign currency translations 321 Net Assets $ 12,625,541
Maximum Offering Price per Share* Class A Shares: Net assets applicable to shares outstanding $ 631,006 Shares of beneficial interest issued and outstanding 93,025 Redemption Price $ 6.78 Maximum sales charge (5.75% of offering price)** 0.41 Maximum public offering price to public $ 7.19
Class I Shares: Net assets applicable to shares outstanding $ 11,994,535 Shares of beneficial interest issued and outstanding 1,764,895 Offering and redemption price per share $ 6.80
*Maximum Offering Price per Share based on unrounded net assets and shares outstanding.** No sales charge applies on investments of $1,000,000 or more, but a Contingent Deferred Sales Charge ("CDSC") of 1% will be imposed on certain redemptions of such shares within 12 months of the date of purchase.
16

See accompanying Notes to Financial Statements.
Segall Bryant & Hamill Emerging Markets FundSTATEMENT OF OPERATIONSFor the Six Months Ended April 30, 2016
Investment IncomeDividends (net of foreign withholding taxes of $16,024) 129,080$ Interest 12
Total investment income 129,092
ExpensesFund accounting fees 68,279 Advisory fees 38,219 Custody fees 22,866 Fund administration fees 21,254 Auditing fees 19,744 Transfer agent fees and expenses 17,725 Miscellaneous 14,167 Offering Costs 9,605 Legal fees 7,972 Registration fees 7,138 Trustees' fees and expenses 3,732 Chief Compliance Officer fees 3,051 Shareholder reporting fees 2,391 Broker fees 817 Insurance fees 533 Distribution fees (Note 8) 453
Total expenses 237,946 Advisory fees waived (38,219) Other expenses absorbed (147,041)
Net expenses 52,686 Net investment income 76,406
Realized and Unrealized Gain (Loss) from Investments and Foreign CurrencyNet realized loss on:
Investments (87,830) Foreign currency transactions (20,819)
Net realized loss (108,649) Net change in unrealized appreciation/depreciation on:
Investments 531,801 Foreign currency translations 980
Net change in unrealized appreciation/depreciation 532,781 Net increase from payments by affiliates (Note 4) 1,684
Net realized and unrealized gain on investments and foreign currency 425,816
Net Increase in Net Assets from Operations 502,222$
17

See accompanying Notes to Financial Statements.
Segall Bryant & Hamill Emerging Markets FundSTATEMENTS OF CHANGES IN NET ASSETS
Operations
$ 76,406 $ 72,879 (108,649) (525,605)
532,781 (62,620) Net increase from payments by affiliates (Note 4) 1,684 -
502,222 (515,346)
From net investment income Class A (1,853) (358) Class I (40,925) (38,131) Total Distributions (42,778) (38,489)
Class A 597,500 - Class I 10,602,047 585,341 1
Reinvestment of distributions: Class A 1,853 358 1
Class I 18,801 36,957 1
Cost of shares redeemed: Class A (294) (86,278) 1
Class I2 (43,715) (6,981,019) 1
Net increase (decrease) in net assets from capital transactions 11,176,192 (6,444,641)
11,635,636 (6,998,476)
989,905 7,988,381 $ 12,625,541 $ 989,905
$ 78,301 $ 44,673
Capital Share Transactions Shares sold: Class A 91,634 - Class I 1,626,857 86,543 1
Shares reinvested: Class A 282 46 1
Class I 2,862 4,846 1
Shares redeemed: Class A (45) (11,530) 1
Class I (6,656) (883,880) 1
Net increase (decrease) from capital share transactions 1,714,934 (803,975)
2 Net of redemption fees of $312 and $0, respectively
1With the Plan of Reorganization with respect to Philadelphia International Emerging Markets Fund, Class I shareholders received Class A shares of the Acquiring Fund, Class IV shareholders received Class I shares of the Acquring Fund, respectively, effective as of the close of business on October 29, 2015. See Note 3 in the accompanying Notes to Financial Statements.
For the Year Ended
October 31, 2015
Six Months Ended
Capital Transactions
For the
(Unaudited)April 30, 2016
currency translations
Beginning of period End of period
Accumulated net investment income
Net realized loss on investments and foreign currency transactions Net change in unrealized appreciation/depreciation on investments and foreign
Net increase (decrease) in net assets resulting from operations
Distributions to Shareholders
Net proceeds from shares sold:
Total increase (decrease) in net assets
Net Assets
Increase (Decrease) in Net Assets from:
Net investment income
18

See accompanying Notes to Financial Statements.
Segall Bryant & Hamill Emerging Markets FundFINANCIAL HIGHLIGHTS Class A
For the For the PeriodPer share operating performance. Six Months Ended For the June 30, 2014* For a capital share outstanding throughout each Period. April 30, 2016 Year Ended through
Unaudited October 31, 2015 October 31, 2014Net asset value, beginning of period 6.91$ 8.43$ 9.40$ Income from Investment Operations:
Net investment income1 0.05 0.12 0.08 Net realized and unrealized loss on investments (0.15) (1.50) (0.50) Total from investment operations (0.10) (1.38) (0.42)
Less Distributions:From net investment income (0.03) (0.14) (0.13) From net realized gain - - (0.34) Tax return of capital - - (0.08) Total distributions (0.03) (0.14) (0.55)
Net asset value, end of period 6.78$ 6.91$ 8.43$
Total return2 (1.49)% 3 (16.47)% (4.49)% 3
Ratios and Supplemental DataNet assets, end of period (in thousands) 631$ 8$ 107$
Ratio of expenses to average net assets:Before fees waived and expenses absorbed 5.84% 4 5.76% 1.48% 4
After fees waived and expenses absorbed 1.48% 4 1.48% 1.48% 4
Ratio of net investment income (loss) to average net assets:
Before fees waived and expenses absorbed (2.80)% 4 (2.92%) 2.34% 4,5
After fees waived and expenses absorbed 1.56% 4 1.36% 2.34% 4
Portfolio turnover rate 44% 3 95% 131%
* Commencement of operations.1 Based on average shares outstanding for the period.2
3 Not annualized.4 Annualized.5 Unaudited.
Total returns would have been lower had expenses not been waived or absorbed by the Advisor. Returns shown do not reflect the deduction of taxes that a shareholder would pay on Fund distributions or the redemption of Fund shares. Returns shown do not include payment of sales load of 5.75% of offering price which is reduced on sales of $1,000,000 or more. If the sales charge was included total returns would be lower.
19

See accompanying Notes to Financial Statements.
Segall Bryant & Hamill Emerging Markets FundFINANCIAL HIGHLIGHTS Class I
For the For the PeriodPer share operating performance. Six Months Ended For the For the For the For the June 30, 2011* For a capital share outstanding throughout each Period. April 30, 2016 Year Ended Year Ended Year Ended Year Ended through
Unaudited October 31, 2015 October 31, 2014 October 31, 2013 October 31, 2012 October 31, 2011Net asset value, beginning of period 6.92$ 8.44$ 9.35$ 8.74$ 8.45$ 10.00$ Income from Investment Operations:
Net investment income1 0.06 0.13 0.20 0.22 0.15 0.09 Net realized and unrealized gain (loss) on investments (0.15) (1.49) (0.34) 0.65 0.20 (1.72) Total from investment operations (0.09) (1.36) (0.14) 0.87 0.35 (1.63)
Less Distributions:From net investment income (0.03) (0.16) (0.21) (0.19) (0.24) - From net realized gain - - (0.46) (0.08) - - Tax return of capital - - (0.10) - - - Total distributions (0.03) (0.16) (0.77) (0.27) (0.24) -
Purchase Premium - - - 0.01 0.18 0.08
Redemption fee proceeds1 - 2 - - 2 - 2 - -
Net asset value, end of period 6.80$ 6.92$ 8.44$ 9.35$ 8.74$ 8.45$
Total return3 (1.63)% 5 (16.19)% (1.44)% 4 10.49% 6.41% 4 (15.50)% 5
Ratios and Supplemental DataNet assets, end of period (in thousands) 11,995$ 982$ 7,882$ 52,245$ 41,272$ 2,151$
Ratio of expenses to average net assets:Before fees waived and expenses absorbed 5.59% 6 5.42% 1.12% 1.11% 1.92% 8.12% 6
After fees waived and expenses absorbed 1.23% 6 1.25% 1.12% 1.11% 1.25% 1.25% 6
Ratio of net investment income (loss) to average net assets:
Before fees waived and expenses absorbed (2.55)% 6 (2.59)% 2.21% 7 2.50% 7 1.04% 7 (3.89)% 6,7
After fees waived and expenses absorbed 1.81% 6 1.58% 2.21% 2.50% 1.71% 2.98% 6
Portfolio turnover rate 44% 5 95% 131% 97% 86% 19%
* Commencement of operations.1 Based on average shares outstanding for the period.2 Amount represents less than $0.01 per share.3
4
5 Not annualized.6 Annualized.7 Unaudited.
Total returns would have been lower had fees not been waived by the Advisor. These returns do not reflect the deduction of taxes that a shareholder would pay on the Fund distributions or redemption of Fund shares.
Includes adjustments in accordance with accounting principles generally accepted in the United States of America and as such, the net asset value for financial reporting purposes and the returns based upon those net asset values may differ from the net asset value and returns for shareholder transactions as shown in the management discussion and analysis and as otherwise reported to shareholders.
20

Segall Bryant & Hamill International Small Cap Fund SCHEDULE OF INVESTMENTS As of April 30, 2016 (Unaudited)
Number of Shares Value __________ ____________
COMMON STOCKS – 98.0%
AUSTRALIA – 6.0%
9,477 Altium Ltd. $ 44,107
24,061 BlueScope Steel Ltd. 117,473
36,593 Cleanaway Waste Management Ltd. 21,852
23,487 CSR Ltd. 60,641
195,500 Dick Smith Holdings Ltd. 1 -
54,056 ERM Power Ltd. 58,680
7,040 Evolution Mining Ltd. 10,635
166,493 GDI Property Group - REIT 109,502
137,364 Genworth Mortgage Insurance Australia Ltd. 248,074
316,511 MACA Ltd. 265,468
1,456 Matrix Composites & Engineering Ltd. 399
192,018 Metcash Ltd. * 255,630
13,621 Mount Gibson Iron Ltd. * 2,233
282,919 Myer Holdings Ltd. 221,461
19,507 Nine Entertainment Co. Holdings Ltd. 16,676
60,528 OZ Minerals Ltd. 268,717
110,532 Primary Health Care Ltd. 290,205
187,864 Programmed Maintenance Services Ltd. 208,504
176,858 Seven West Media Ltd. 141,492
27,705 Star Entertainment Grp Ltd. 118,298
57,970 STW Communications Group Ltd. 46,968
90,866 Thorn Group Ltd. 96,041
33,360 WorleyParsons Ltd. 175,312 ____________ 2,778,368 ____________ AUSTRIA – 1.4%
226 ams A.G. 5,988
22,059 Austria Technologie & Systemtechnik A.G. 305,535
15,241 EVN A.G. 182,870
4,893 S IMMO A.G. 48,026
2,419 Semperit A.G. Holding 86,838
35 Strabag S.E. 1,100 ____________ 630,357 ____________ BELGIUM – 1.3%
2,829 Bekaert S.A. 124,590
834 bpost S.A. 23,553
352 Cie d'Entreprises CFE 34,987
985 Cofinimmo S.A. - REIT 122,445
2,055 D'ieteren S.A. 91,159
7,994 Euronav N.V. 88,049
1,942 Gimv N.V. 107,920
12,920 Nyrstar N.V. * 10,208
21

Segall Bryant & Hamill International Small Cap Fund SCHEDULE OF INVESTMENTS – Continued As of April 30, 2016 (Unaudited)
Number of Shares Value __________ ____________
COMMON STOCKS (Continued) BELGIUM (Continued) 21 Tessenderlo Chemie N.V. * $ 723 ____________ 603,634 ____________ DENMARK – 1.6%
8,737 Dfds A/S 348,824
6,023 Matas A/S 114,906
2,435 NNIT A/S 2 66,310
7,130 PER Aarsleff A/S - Class B 197,048
114 Schouw & Co. 6,668 ____________ 733,756 ____________ FINLAND – 1.7%
10,953 Atria OYJ 112,252
310 Caverion Corp. 2,275
5,194 Cramo OYJ 104,084
11,269 HKScan OYJ - A Shares 40,647
41,356 Sanoma OYJ 202,447
61,363 Sponda OYJ 267,227
10,600 Technopolis OYJ 45,760
310 YIT OYJ 2,117 ____________ 776,809 ____________ FRANCE – 4.5%
5,774 Acanthe Developpement S.A. - REIT 3,641
8,393 Assystem 217,778
5,381 Cie des Alpes 93,658
24,497 Derichebourg S.A. 78,105
1,006 Eiffage S.A. 80,032
7,029 GL Events 134,823
2,636 Ipsen S.A. 159,374
5,419 IPSOS 161,591
13,227 Jacquet Metal Service 196,563
3,762 Manitou BF S.A. 65,392
7,435 Mersen 119,021
6,784 Neopost S.A. 166,190
32 Nexans S.A. * 1,489
3,829 Nexity S.A. 205,244
260 Rubis SCA 20,312
518 Saft Groupe S.A. 16,093
2,700 Seche Environnement S.A. 96,462
2,310 Sopra Steria Group 268,708 ____________ 2,084,476 ____________ GERMANY – 5.3%
3,026 Aareal Bank A.G. 107,729
111 Alstria Office REIT-AG * 1,559
22

Segall Bryant & Hamill International Small Cap Fund SCHEDULE OF INVESTMENTS – Continued As of April 30, 2016 (Unaudited)
Number of Shares Value __________ ____________
COMMON STOCKS (Continued) GERMANY (Continued) 5,096 Aurubis A.G. $ 276,956
7,100 Bauer A.G. 116,081
7,720 CENTROTEC Sustainable A.G. 127,739
6,597 Deutsche Pfandbriefbank A.G. * 2 69,623
2,542 Draegerwerk A.G. & Co. KGaA 154,718
5,258 Freenet A.G. 160,959
301 Gerresheimer A.G. 22,450
1,170 Gesco A.G. 97,761
300 Hornbach Baumarkt A.G. 9,306
416 KION Group A.G. 22,717
73 Kloeckner & Co. S.E. 852
241 MLP A.G. 939
2,920 Rheinmetall A.G. 228,780
8,139 RHOEN-KLINIKUM A.G. 253,227
7,916 Software A.G. 303,052
7,948 STADA Arzneimittel A.G. 337,943
1,346 Suedzucker A.G. 23,768
207 TLG Immobilien A.G. 4,385
8,940 Wacker Neuson S.E. 151,445 ____________ 2,471,989 ____________ HONG KONG – 2.4%
532,000 Century City International Holdings Ltd. 32,529
54,000 Champion REIT 28,904
56,000 CITIC Telecom International Holdings Ltd. 23,249
115,000 Emperor Entertainment Hotel Ltd. 35,608
701,100 Emperor International Holdings Ltd. 140,701
462,000 Haitong International Securities Group Ltd. 265,899
1,728,000 Hsin Chong Construction Group Ltd. 180,443
60,000 NewOcean Energy Holdings Ltd. 20,420
92,000 Paliburg Holdings Ltd. 27,991
8,000 Regal Hotels International Holdings Ltd. 3,857
483,000 Regal Real Estate Investment Trust - REIT 123,744
518,000 Samson Holding Ltd. 59,367
112,000 Texwinca Holdings Ltd. 108,916
261,400 VST Holdings Ltd. 59,782
44,000 Win Hanverky Holdings Ltd. 8,308 ____________ 1,119,718 ____________ IRELAND – 1.4%
45,436 Hibernia REIT PLC 67,064
679 Paddy Power Betfair PLC 91,257
4,534 Smurfit Kappa Group PLC 120,352
32,675 Total Produce PLC 57,994
23

Segall Bryant & Hamill International Small Cap Fund SCHEDULE OF INVESTMENTS – Continued As of April 30, 2016 (Unaudited)
Number of Shares Value __________ ____________
COMMON STOCKS (Continued) IRELAND (Continued) 37,120 UDG Healthcare PLC $ 332,436 ____________ 669,103 ____________ ISRAEL – 1.4%
6,316 Africa Israel Properties Ltd. 90,665
311 B Communications Ltd. 8,508
9,878 Clal Insurance Enterprises Holdings Ltd. * 122,049
24,585 Discount Investment Corp. Ltd. * 54,578
501 Energix-Renewable Energies Ltd. * 423
960 Harel Insurance Investments & Financial Services Ltd. 3,775
25,045 Jerusalem Economy Ltd. * 44,446
9,762 Matrix IT Ltd. 66,559
28,497 Phoenix Holdings Ltd. * 74,129
7,186 Reit 1 Ltd. - REIT 20,975
8,500 Shikun & Binui Ltd. 16,303
40,409 Shufersal Ltd. 137,035 ____________ 639,445 ____________ ITALY – 4.3%
116,263 A2A S.p.A. 166,187
3,475 ACEA S.p.A. 51,092
10,837 Ascopiave S.p.A. 29,633
43,307 Astaldi S.p.A. 212,603
20,193 ASTM S.p.A. 265,730
4,480 Brembo S.p.A. 241,039
11,336 ERG S.p.A. 147,792
46,077 Iren S.p.A. 85,327
5,834 Italmobiliare S.p.A. 187,987
35,627 Societa Cattolica di Assicurazioni SCRL 248,026
8,030 Societa Iniziative Autostradali e Servizi S.p.A. 83,990
818 Tod's S.p.A. 56,670
48,856 Unipol Gruppo Finanziario S.p.A. 209,762 ____________ 1,985,838 ____________ JAPAN – 30.5%
100 Accordia Golf Co., Ltd. 949
169,500 Achilles Corp. 216,543
25,800 Aisan Industry Co., Ltd. 191,043
73,300 Bank of Saga Ltd. 148,298
10,700 Cawachi Ltd. 250,612
3,300 Chiyoda Integre Co., Ltd. 65,981
10,100 Chudenko Corp. 198,738
600 Coca-Cola West Co., Ltd. 16,264
63,300 Daiken Corp. 179,700
7,900 Dainichiseika Color & Chemicals Manufacturing Co., Ltd. 32,600
24

Segall Bryant & Hamill International Small Cap Fund SCHEDULE OF INVESTMENTS – Continued As of April 30, 2016 (Unaudited)
Number of Shares Value __________ ____________
COMMON STOCKS (Continued) JAPAN (Continued) 82,000 Daiwabo Holdings Co., Ltd. $ 161,283
10,300 Denki Kogyo Co., Ltd. 45,981
300 Dunlop Sports Co., Ltd. 2,738
104,500 Eighteenth Bank Ltd. 246,708
60,000 Fuso Pharmaceutical Industries Ltd. 144,111
14,600 G-Tekt Corp. 153,179
140,000 Godo Steel Ltd. 254,569
12,700 Hakuto Co., Ltd. 106,296
6,000 Hanwa Co., Ltd. 26,814
297 Heiwa Real Estate REIT, Inc. 249,200
1,300 Hitachi Capital Corp. 27,765
110,100 Hokuetsu Bank Ltd. 188,945
21,000 Inabata & Co., Ltd. 204,546
247 Invesco Office J-Reit, Inc. 226,522
100 Itochu-Shokuhin Co., Ltd. 3,809
60,300 Japan Pulp & Paper Co., Ltd. 178,774
122 Japan Rental Housing Investments, Inc. - REIT 96,081
500 Joshin Denki Co., Ltd. 3,968
10,500 Kaga Electronics Co., Ltd. 124,142
8,600 Kamei Corp. 77,482
158,000 Kanematsu Corp. 237,939
15,300 Kasai Kogyo Co., Ltd. 146,703
115 Kenedix Retail REIT Corp. 303,275
18,500 Kohnan Shoji Co., Ltd. 315,544
18,400 Komori Corp. 216,352
7,700 Konoike Transport Co., Ltd. 89,740
132,000 Kurabo Industries Ltd. 231,888
11,300 Kuroda Electric Co., Ltd. 174,256
13,800 Macnica Fuji Electronics Holdings, Inc. 152,816
200 Mars Engineering Corp. 3,599
16,000 Maruzen Showa Unyu Co., Ltd. 59,478
1,900 Matsuda Sangyo Co., Ltd. 20,520
101 MCUBS MidCity Investment Corp. - REIT 342,739
116,000 Mie Bank Ltd. 216,712
12,200 Ministop Co., Ltd. 196,934
400 Mirait Holdings Corp. 3,506
8,000 Mitsubishi Shokuhin Co., Ltd. 206,475
82,000 Mitsubishi Steel Manufacturing Co., Ltd. 136,569
29,300 Mitsui Home Co., Ltd. 134,036
52,000 Mitsui Sugar Co., Ltd. 234,540
8,000 NEC Capital Solutions Ltd. 111,280
1,400 NEC Networks & System Integration Corp. 21,712
11,000 Nichirei Corp. 95,746
36,500 Nippon Beet Sugar Manufacturing Co., Ltd. 62,830
25

Segall Bryant & Hamill International Small Cap Fund SCHEDULE OF INVESTMENTS – Continued As of April 30, 2016 (Unaudited)
Number of Shares Value __________ ____________
COMMON STOCKS (Continued) JAPAN (Continued) 20,900 Nippon Flour Mills Co., Ltd. $ 161,351
45,400 Nippon Light Metal Holdings Co., Ltd. 80,117
43,700 Nippon Road Co., Ltd. 202,568
69,000 Nippon Steel & Sumikin Bussan Corp. 243,752
23,600 Nipro Corp. 229,898
14,000 Nishimatsu Construction Co., Ltd. 61,136
39,100 Nisshin Oillio Group Ltd. 166,177
20,200 Nisshinbo Holdings, Inc. 219,948
70,800 Nissin Corp. 201,002
59,600 North Pacific Bank Ltd. 151,098
4,000 Okumura Corp. 20,952
17,100 Okuwa Co., Ltd. 183,265
14,500 PALTAC Corp. 257,357
44,400 Press Kogyo Co., Ltd. 152,370
56,000 Ryobi Ltd. 203,148
9,100 Ryosan Co., Ltd. 218,033
29,300 Sakai Chemical Industry Co., Ltd. 80,629
20,400 Sanoh Industrial Co., Ltd. 111,642
18,600 Sanshin Electronics Co., Ltd. 153,563
76,000 Sanyo Shokai Ltd. 182,010
5,000 Sanyo Special Steel Co., Ltd. 22,756
28,400 Sekisui Plastics Co., Ltd. 90,624
59,000 Shikoku Bank Ltd. 114,726
44,200 Shindengen Electric Manufacturing Co., Ltd. 159,491
11,100 Shinko Electric Industries Co., Ltd. 61,653
10,800 Shinko Shoji Co., Ltd. 105,372
19,000 Showa Corp. 164,973
300 Showa Sangyo Co., Ltd. 1,337
45,000 Sinanen Holdings Co., Ltd. 172,874
1,100 Skylark Co., Ltd. 13,983
146,400 Sojitz Corp. 292,541
21,200 Taihei Dengyo Kaisha Ltd. 174,204
4,700 Taiho Kogyo Co., Ltd. 50,982
4,600 Toho Holdings Co., Ltd. 106,421
800 TOMONY Holdings, Inc. 2,276
61 Top REIT, Inc. 230,669
46,000 Topy Industries Ltd. 88,128
32,600 Tosei Corp. 228,271
27,000 Tosoh Corp. 123,411
2,300 Tsumura & Co. 59,186
8,900 TV Asahi Holdings Corp. 147,801
22,000 Ube Industries Ltd. 41,784
7,800 UKC Holdings Corp. 138,492
26,900 Vital KSK Holdings, Inc. 229,366
26

Segall Bryant & Hamill International Small Cap Fund SCHEDULE OF INVESTMENTS – Continued As of April 30, 2016 (Unaudited)
Number of Shares Value __________ ____________
COMMON STOCKS (Continued) JAPAN (Continued) 22,400 Yamanashi Chuo Bank Ltd. $ 82,953
21,200 Yokohama Reito Co., Ltd. 207,276
10,700 Yorozu Corp. 214,106 ____________ 14,144,502 ____________ NETHERLANDS – 1.4%
10,544 Accell Group 223,465
948 Arcadis N.V. 16,250
31,607 Delta Lloyd N.V. 161,245
2,343 Kendrion N.V. 57,441
30,205 NSI N.V. - REIT 143,561
2 Royal Imtech N.V. * -
1,701 SBM Offshore N.V. 22,785
407 Wereldhave N.V. - REIT 20,979 ____________ 645,726 ____________ NEW ZEALAND – 0.9%
76,324 Air New Zealand Ltd. 130,958
38,824 Chorus Ltd. 108,334
6,610 Metlifecare Ltd. 24,107
219 Mighty River Power Ltd. 462
32,438 Nuplex Industries Ltd. 119,177
17,724 Warehouse Group Ltd. 34,119 ____________ 417,157 ____________ NORWAY – 2.3%
15,202 Atea A.S.A. 142,626
42,017 Austevoll Seafood A.S.A. 353,489
20,140 Avance Gas Holding Ltd. 2 137,227
11,060 Prosafe S.E. 6,662
49,878 Selvaag Bolig A.S.A. 162,297
31,761 SpareBank 1 Nord Norge 148,709
21,916 Storebrand A.S.A. * 92,819
570 Wilh Wilhelmsen A.S.A. 3,040 ____________ 1,046,869 ____________ PORTUGAL – 0.3%
183,171 Pharol SGPS S.A. * 29,826
101,240 Sonae SGPS S.A. 112,438 ____________ 142,264 ____________ SINGAPORE – 1.6%
180,325 AIMS AMP Capital Industrial REIT 187,043
45,500 Ascendas Hospitality Trust - REIT 23,682
249,200 Cambridge Industrial Trust - REIT 100,873
27,800 China Merchants Holdings Pacific Ltd. 17,671
27

Segall Bryant & Hamill International Small Cap Fund SCHEDULE OF INVESTMENTS – Continued As of April 30, 2016 (Unaudited)
Number of Shares Value __________ ____________
COMMON STOCKS (Continued) SINGAPORE (Continued) 213,100 Chip Eng Seng Corp. Ltd. $ 112,389
2,000 Ho Bee Land Ltd. 3,282
79,060 k1 Ventures Ltd. 51,731
388,500 Lippo Malls Indonesia Retail Trust - REIT 93,883
600 Mapletree Industrial Trust - REIT 715
2,000 Metro Holdings Ltd. 1,501
213,400 Sabana Shari'ah Compliant Industrial Real Estate Investment Trust - REIT 97,584
2,000 Wheelock Properties Singapore Ltd. 2,308
81,100 Yanlord Land Group Ltd. 72,869 ____________ 765,531 ____________ SPAIN – 2.3%
1,533 Cia de Distribucion Integral Logista Holdings S.A. 33,802
16,312 CIE Automotive S.A. 295,161
6,129 Corp Financiera Alba S.A. 251,392
12,361 Ebro Foods S.A. 280,480
23,623 Faes Farma S.A. 74,445
113 Indra Sistemas S.A. * 1,327
22,235 Papeles y Cartones de Europa S.A. 137,934 ____________ 1,074,541 ____________ SWEDEN – 5.0%
14,361 B&B Tools A.B. - B Shares 288,989
7,399 Bilia A.B. - A Shares 177,207
11,885 Bure Equity A.B. 103,660
19,259 Capio A.B. * 2 102,938
11,369 Granges A.B. 83,942
23,032 Hemfosa Fastigheter A.B. 240,268
1,189 Holmen A.B. 41,000
5,494 Investment A.B. Oresund 154,250
46,729 KappAhl A.B. 194,154
111,506 Klovern A.B. - A Shares 131,518
73,971 Klovern A.B. - B Shares 86,931
9,672 Lifco A.B. - B Shares 250,958
5,310 NCC A.B. - B Shares 181,653
14,702 Peab A.B. 122,862
27,798 SAS A.B. * 79,652
3,000 SkiStar A.B. 41,654
3,183 Tethys Oil A.B. 22,831 ____________ 2,304,467 ____________ SWITZERLAND – 3.9%
233 Allreal Holding A.G. * 32,474
32 Banque Cantonale Vaudoise 22,095
5,879 BKW A.G. 255,555
28

Segall Bryant & Hamill International Small Cap Fund SCHEDULE OF INVESTMENTS – Continued As of April 30, 2016 (Unaudited)
Number of Shares Value __________ ____________
COMMON STOCKS (Continued) SWITZERLAND (Continued) 4,621 Bobst Group S.A. $ 252,414
143 Galenica A.G. 209,351
296 Helvetia Holding A.G. 159,423
2,526 Implenia A.G. 168,647
58 Intershop Holding A.G. 27,207
17,524 Kudelski S.A. 299,010
12,964 Logitech International S.A. 199,186
52 St. Galler Kantonalbank A.G. 21,520
80 Vetropack Holding A.G. 125,100
903 Vontobel Holding A.G. 39,157 ____________ 1,811,139 ____________ UNITED KINGDOM – 18.5%
1,150 Acacia Mining PLC 5,903
463 Anglo Pacific Group PLC 511
21,987 Avocet Mining PLC * 2,162
19,815 Barratt Developments PLC 154,305
11,634 Beazley PLC 55,450
12,358 Bellway PLC 442,501
6,305 Berkeley Group Holdings PLC 276,285
5,134 BGEO Group PLC 171,783
10,288 Britvic PLC 105,989
5,268 Cape PLC 17,684
64,518 Carillion PLC 277,690
2,212 Clinigen Group PLC 17,351
3,481 Computacenter PLC 42,463
21,627 Costain Group PLC 99,382
35,773 Crest Nicholson Holdings PLC 272,976
29,827 Dairy Crest Group PLC 246,278
226,336 Debenhams PLC 259,936
10,004 Devro PLC 40,819
12,635 DS Smith PLC 70,469
358,867 DX Group PLC 117,507
328,126 EnQuest PLC * 192,973
398,127 Ferrexpo PLC 218,144
13,328 Galliford Try PLC 249,148
52,341 Gem Diamonds Ltd. 103,627
25,318 Greene King PLC 303,002
1,404 Greggs PLC 21,236
156,876 Hansteen Holdings PLC - REIT 237,927
223,905 Highland Gold Mining Ltd. 310,797
33,323 Intermediate Capital Group PLC 299,561
38,311 Interserve PLC 239,393
12,494 John Wood Group PLC 114,295
29
Segall Bryant & Hamill International Small Cap Fund SCHEDULE OF INVESTMENTS – Continued As of April 30, 2016 (Unaudited)
Number of Shares Value __________ ____________
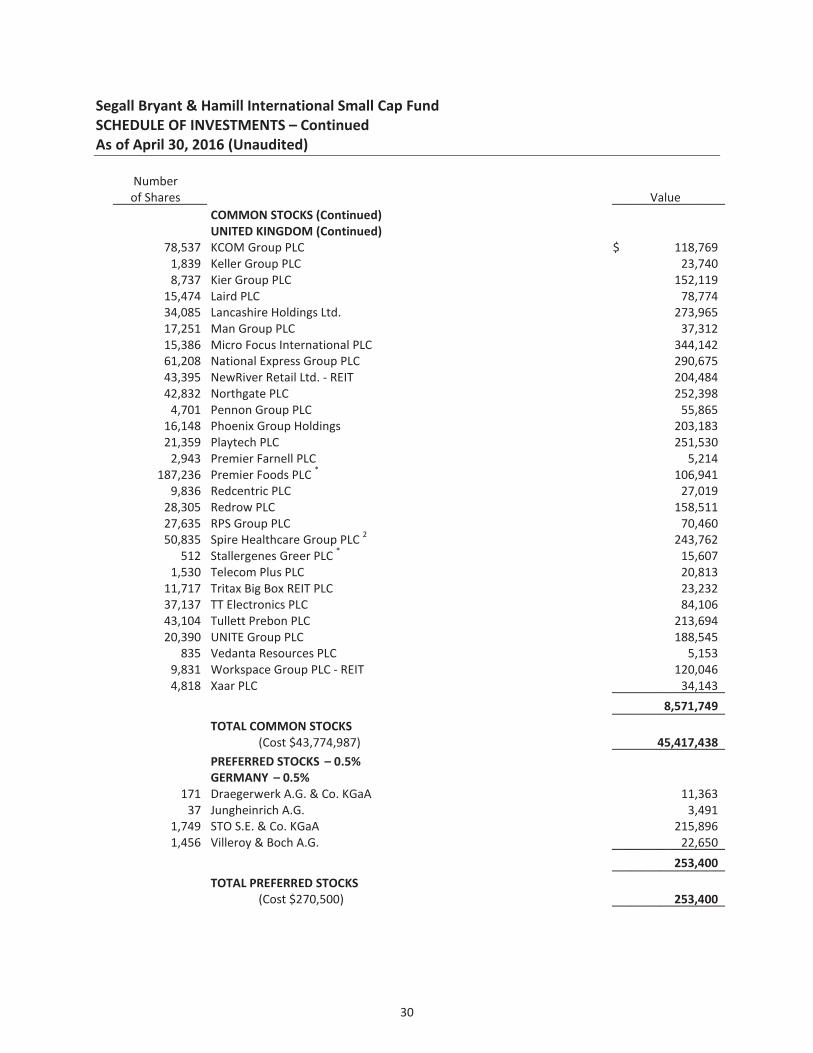
COMMON STOCKS (Continued) UNITED KINGDOM (Continued) 78,537 KCOM Group PLC $ 118,769
1,839 Keller Group PLC 23,740
8,737 Kier Group PLC 152,119
15,474 Laird PLC 78,774
34,085 Lancashire Holdings Ltd. 273,965
17,251 Man Group PLC 37,312
15,386 Micro Focus International PLC 344,142
61,208 National Express Group PLC 290,675
43,395 NewRiver Retail Ltd. - REIT 204,484
42,832 Northgate PLC 252,398
4,701 Pennon Group PLC 55,865
16,148 Phoenix Group Holdings 203,183
21,359 Playtech PLC 251,530
2,943 Premier Farnell PLC 5,214
187,236 Premier Foods PLC * 106,941
9,836 Redcentric PLC 27,019
28,305 Redrow PLC 158,511
27,635 RPS Group PLC 70,460
50,835 Spire Healthcare Group PLC 2 243,762
512 Stallergenes Greer PLC * 15,607
1,530 Telecom Plus PLC 20,813
11,717 Tritax Big Box REIT PLC 23,232
37,137 TT Electronics PLC 84,106
43,104 Tullett Prebon PLC 213,694
20,390 UNITE Group PLC 188,545
835 Vedanta Resources PLC 5,153
9,831 Workspace Group PLC - REIT 120,046
4,818 Xaar PLC 34,143 ____________ 8,571,749 ____________
TOTAL COMMON STOCKS (Cost $43,774,987) 45,417,438 ____________
PREFERRED STOCKS – 0.5%
GERMANY – 0.5%
171 Draegerwerk A.G. & Co. KGaA 11,363
37 Jungheinrich A.G. 3,491
1,749 STO S.E. & Co. KGaA 215,896
1,456 Villeroy & Boch A.G. 22,650 ____________ 253,400 ____________
TOTAL PREFERRED STOCKS (Cost $270,500) 253,400 ____________
30

Segall Bryant & Hamill International Small Cap Fund SCHEDULE OF INVESTMENTS – Continued As of April 30, 2016 (Unaudited)
Number of Shares Value __________ ____________
RIGHTS – 0.0%
SWEDEN – 0.0%
23,032 Hemfosa Fastigheter A.B. $ 8,317 ____________
TOTAL RIGHTS (Cost $—) 8,317 ____________
UNITS – 0.4%
IRELAND – 0.0%
262 Grafton Group PLC 2,649
SINGAPORE – 0.4%
31,000 Religare Health Trust 23,716
320,200 Accordia Golf Trust 153,565 ____________ 177,281 ____________
TOTAL UNITS (Cost $178,216) 179,930 ____________
WARRANTS – 0.0%
ISRAEL – 0.0%
Discount Investment Corp. Ltd.: — Exercise Price: $718.30, Expiration Date: December 21, 2016* —
— Exercise Price: $783.60, Expiration Date: December 21, 2017* —
— Exercise Price: $848.90, Expiration Date: December 21, 2018* — ____________ — ____________
TOTAL WARRANTS (Cost $—) — ____________
Principal Amount __________
SHORT-TERM INVESTMENTS – 0.3%
$ 115,050 UMB Money Market Fiduciary, 0.01% 115,050 ____________
TOTAL SHORT-TERM INVESTMENTS (Cost $115,050) 115,050 ____________
TOTAL INVESTMENTS – 99.2% (Cost $44,338,753) 45,974,135
Other assets in Excess of liabilities – 0.8% 353,554 ____________ TOTAL NET ASSETS – 100.0% $ 46,327,689 ________________________ PLC – Public Limited Company REIT – Real Estate Investment Trust
31
Segall Bryant & Hamill International Small Cap Fund SCHEDULE OF INVESTMENTS – Continued As of April 30, 2016 (Unaudited)
* Non-income producing security. 1 Fair value under procedures established by the Board of Trustees, represents 0.00% of Net Assets. 2 Security exempt from registration under Rule 144A of the Securities Act of 1933. These securities are restricted and may be resold in transactions exempt from registration normally to qualified institutional buyers. The total value of these securities is $619,860. See accompanying Notes to Financial Statements.
32

Segall Bryant & Hamill International Small Cap Fund SUMMARY OF INVESTMENTS As of April 30, 2016 (Unaudited)
Security Type/Sector Percent of Total
Net Assets Common Stocks
Financials 22.5% Consumer Discretionary 18.6% Industrials 14.7% Materials 9.6% Consumer Staples 9.6% Technology 9.6% Health Care 7.1% Communications 2.6% Utilities 2.3% Energy 1.4% __________
Total Common Stocks 98.0% Preferred Stocks
Materials 0.5% Consumer Discretionary 0.0% Health Care 0.0% Industrials 0.0% __________
Total Preferred Stocks 0.5% Rights 0.0% Units 0.4% Warrants 0.0% Short-Term Investments 0.3% __________Total Investments 99.2% Other assets in Excess of liabilities 0.8% __________Total Net Assets 100.0% ____________________
See accompanying Notes to Financial Statements.
33

See accompanying Notes to Financial Statements.
Segall Bryant & Hamill International Small Cap FundSTATEMENT OF ASSETS AND LIABILITIESAs of April 30, 2016 (Unaudited)
AssetsInvestments, at value (cost $44,338,753) $ 45,974,135Cash 24,835Receivables: Due from Advisor 19,459 Dividends and interest 327,477 Offering costs 6,909Prepaid expenses 27,897 Total assets 46,380,712
LiabilitiesPayables: Distribution fees (Note 8) 2,252 Custody fees 24,117 Fund administration fees 9,501 Transfer agent fees and expenses 6,597 Due to custodian 4,306 Auditing fees 2,886 Fund accounting fees 975 Chief Compliance Officer fees 517 Trustees' fees and expenses 449Accrued other expenses 1,423 Total liabilities 53,023 Net Assets $ 46,327,689
Components of Net AssetsPaid-in capital (par value of $0.01 per share with an unlimited number of shares authorized) $ 45,605,584 Accumulated net investment income 44,229 Accumulated net realized loss on investments and foreign currency transactions (971,758) Net unrealized appreciation on: Investments 1,635,382 Foreign currency translations 14,252 Net Assets $ 46,327,689
Maximum Offering Price per Share Class A Shares: Net assets applicable to shares outstanding $ 11,067,350 Shares of beneficial interest issued and outstanding 980,001 Redemption Price $ 11.29 Maximum sales charge (5.75% of offering price)* 0.69 Maximum public offering price to public $ 11.98
Class I Shares: Net assets applicable to shares outstanding $ 35,260,339 Shares of beneficial interest issued and outstanding 3,120,162 Offering and redemption price per share $ 11.30
* No sales charge applies on investments of $1,000,000 or more, but a Contingent Deferred Sales Charge ("CDSC") of 1% will be imposed on certain redemptions of such shares within 12 months of the date of purchase.
34

See accompanying Notes to Financial Statements.
Segall Bryant & Hamill International Small Cap FundSTATEMENT OF OPERATIONSFor the Six Months Ended April 30, 2016 (Unaudited)
Investment IncomeDividends (net of foreign withholding taxes of $80,876) 679,759$ Interest 16
Total investment income 679,775
ExpensesAdvisory fees 195,036 Fund accounting fees 86,166 Fund administration fees 27,319 Transfer agent fees and expenses 22,822 Auditing fees 19,264 Registration fees 16,856 Custody fees 14,846 Distribution fees (Note 8) 13,192 Offering costs 9,759 Legal fees 5,772 Shareholder reporting fees 5,651 Miscellaneous 5,027 Trustees' fees and expenses 4,132 Chief Compliance Officer fees 2,051 Insurance fees 542
Total expenses 428,435 Advisory fees waived (192,083)
Net expenses 236,352 Net investment income 443,423
Realized and Unrealized Gain (Loss) from Investments and Foreign CurrencyNet realized loss on:
Investments (729,052) Foreign currency transactions (15,561)
Net realized loss (744,613) Net change in unrealized appreciation/depreciation on:
Investments 1,048,048 Foreign currency translations 16,248
Net change in unrealized appreciation/depreciation 1,064,296 Net realized and unrealized gain on investments and foreign currency 319,683
Net Increase in Net Assets from Operations 763,106$
35

See accompanying Notes to Financial Statements.
Segall Bryant & Hamill International Small Cap FundSTATEMENTS OF CHANGES IN NET ASSETS
Increase (Decrease) in Net Assets from:Operations
$ 443,423 $ 993,653 (744,613) (8,965)
1,064,296 1,248,418 763,106 2,233,106
From net investment income Class A (175,420) (62,830) Class I (506,359) (808,063)
Class A (58,567) (378) Class I (164,493) (1,825,331) Total Distributions (904,839) (2,696,602)
Class A 784,967 12,372,637 1
Class I 1,863,886 2,796,194 1
Reinvestment of distributions: Class A 233,988 63,208 1
Class I 619,677 2,491,648 1
Cost of shares redeemed: Class A (1,767,195) (200,103) 1
Class I2 (2,560,033) (14,849,446) 1
Net increase (decrease) in net assets from capital transactions (824,710) 2,674,138
(966,443) 2,210,642
47,294,132 45,083,490 $ 46,327,689 $ 47,294,132
$ 44,229 $ 282,585
Capital Share Transactions Shares sold: Class A 72,652 1,060,936 1
Class I 183,816 249,889 1
Shares reinvested: Class A 21,099 5,449 1
Class I 55,877 228,584 1
Shares redeemed: Class A (163,510) (17,419) 1
Class I (232,838) (1,262,217) 1
Net increase (decrease) from capital share transactions (62,904) 265,222
2 Net of redemption fees of $0 and $0, respectively.
1With the Plan of Reorganization with respect to Philadelphia International Small Cap Fund, Class I shareholders received Class A shares of the Acquiring Fund, Class IV shareholders received Class I shares of the Acquring Fund, respectively, effective as of the close of business on October 29, 2015. See Note 3 in the accompanying Notes to Financial Statements.
For the
(Unaudited)April 30, 2016
Accumulated net investment income
Net realized loss on investments and foreign currency transactions
Total increase (decrease) in net assets
Net Assets Beginning of period End of period
Net change in unrealized appreciation/depreciation on investments and foreign
Net increase in net assets resulting from operations
Capital Transactions Net proceeds from shares sold:
Net investment income
currency translations
Distributions to Shareholders
From net realized gain
For theYear Ended
October 31, 2015
Six Months Ended
36
See accompanying Notes to Financial Statements.
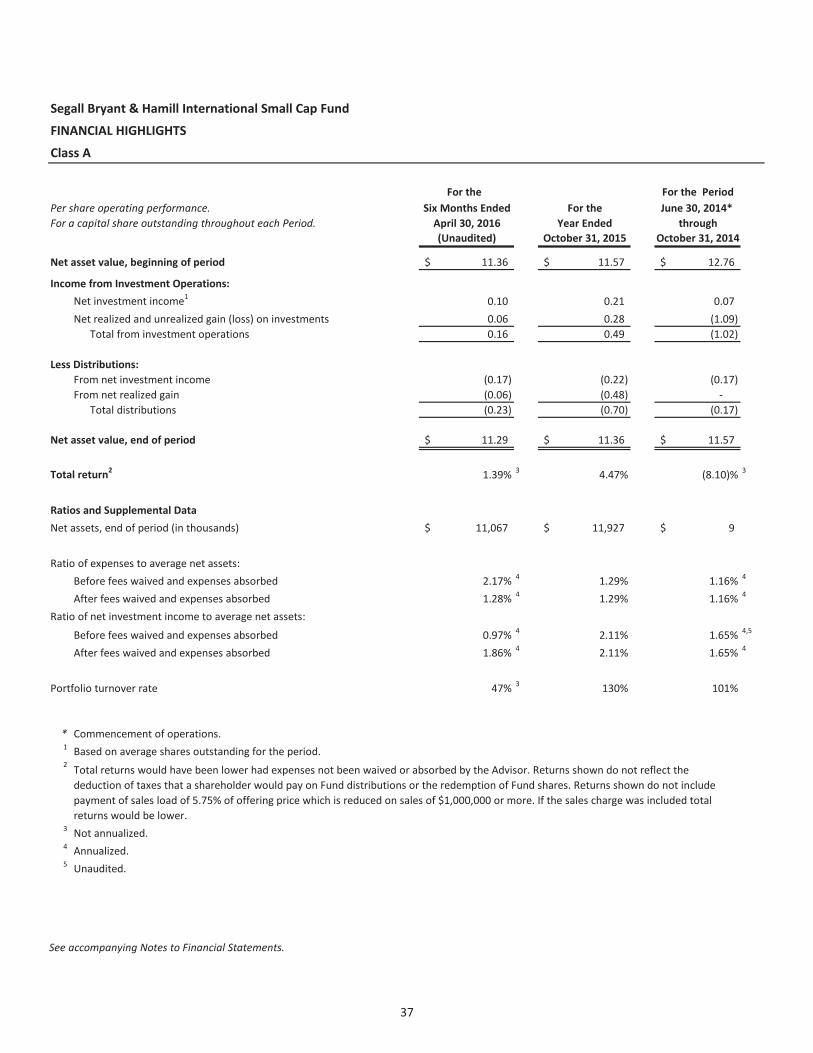
Segall Bryant & Hamill International Small Cap Fund
FINANCIAL HIGHLIGHTS
Class A
For the For the PeriodPer share operating performance. Six Months Ended For the June 30, 2014* For a capital share outstanding throughout each Period. April 30, 2016 Year Ended through
(Unaudited) October 31, 2015 October 31, 2014
Net asset value, beginning of period 11.36$ 11.57$ 12.76$
Income from Investment Operations:Net investment income1 0.10 0.21 0.07 Net realized and unrealized gain (loss) on investments 0.06 0.28 (1.09) Total from investment operations 0.16 0.49 (1.02)
Less Distributions:From net investment income (0.17) (0.22) (0.17) From net realized gain (0.06) (0.48) - Total distributions (0.23) (0.70) (0.17)
Net asset value, end of period 11.29$ 11.36$ 11.57$
Total return2 1.39% 3 4.47% (8.10)% 3
Ratios and Supplemental DataNet assets, end of period (in thousands) 11,067$ 11,927$ 9$
Ratio of expenses to average net assets:Before fees waived and expenses absorbed 2.17% 4 1.29% 1.16% 4
After fees waived and expenses absorbed 1.28% 4 1.29% 1.16% 4
Ratio of net investment income to average net assets:
Before fees waived and expenses absorbed 0.97% 4 2.11% 1.65% 4,5
After fees waived and expenses absorbed 1.86% 4 2.11% 1.65% 4
Portfolio turnover rate 47% 3 130% 101%
* Commencement of operations.1 Based on average shares outstanding for the period.2
3 Not annualized.4 Annualized.5 Unaudited.
Total returns would have been lower had expenses not been waived or absorbed by the Advisor. Returns shown do not reflect the deduction of taxes that a shareholder would pay on Fund distributions or the redemption of Fund shares. Returns shown do not include payment of sales load of 5.75% of offering price which is reduced on sales of $1,000,000 or more. If the sales charge was included total returns would be lower.
37

See accompanying Notes to Financial Statements.
Segall Bryant & Hamill International Small Cap FundFINANCIAL HIGHLIGHTS Class I
For the For the PeriodPer share operating performance. Six Months Ended For the For the For the For the May 31, 2011* For a capital share outstanding throughout each Period. April 30, 2016 Year Ended Year Ended Year Ended Year Ended through
(Unaudited) October 31, 2015 October 31, 2014 October 31, 2013 October 31, 2012October 31, 2011Net asset value, beginning of period 11.36$ 11.57$ 11.77$ 8.88$ 8.32$ 10.00$ Income from Investment Operations:
Net investment income1 0.11 0.27 0.30 0.26 0.27 0.11 Net realized and unrealized gain (loss) on investments 0.06 0.23 0.16 2 2.85 0.47 (1.65) Total from investment operations 0.17 0.50 0.46 3.11 0.74 (1.54)
Less Distributions:From net investment income (0.17) (0.23) (0.33) (0.25) (0.21) (0.14) From net realized gain (0.06) (0.48) (0.33) - - - Total distributions (0.23) (0.71) (0.66) (0.25) (0.21) (0.14)
Purchase Premium - - - 0.03 0.03 -
Redemption fee proceeds1 - - - 3 - 3 - -
Net asset value, end of period 11.30$ 11.36$ 11.57$ 11.77$ 8.88$ 8.32$
Total return4 1.52% 5 4.61% 3.96% 35.97% 9.41% (15.37)% 5
Ratios and Supplemental DataNet assets, end of period (in thousands) 35,260$ 35,367$ 45,074$ 22,049$ 6,800$ 2,924$
Ratio of expenses to average net assets:Before fees waived and expenses absorbed 1.92% 6 1.06% 0.97% 1.35% 2.75% 4.65% 6
After fees waived and expenses absorbed 1.03% 6 1.06% 0.97% 1.10% 1.10% 1.10% 6
Ratio of net investment income (loss) to average net assets:
Before fees waived and expenses absorbed 1.22% 6 2.34% 2.44% 7 2.30% 7 1.56% 7 (0.65)% 6,7
After fees waived and expenses absorbed 2.11% 6 2.34% 2.44% 2.55% 3.21% 2.90% 6
Portfolio turnover rate 47% 5 130% 101% 103% 85% 28%
* Commencement of operations.1 Based on average shares outstanding for the period.2
3 Amount represents less than $0.01 per share.4
5 Not annualized.6 Annualized.7 Unaudited.
The amount shown for a share outstanding does not correspond with the aggregate net realized and unrealized gain for the period due to the timing of purchases and redemptions of Portfolio shares in relation to the fluctuating net asset value per share of the Portfolio.
Total returns would have been lower had fees not been waived by the Advisor. These returns do not reflect the deduction of taxes that a shareholder would pay on the Fund distributions or redemption of Fund shares.
38

Segall Bryant & Hamill Funds NOTES TO FINANCIAL STATEMENTS April 30, 2016 (Unaudited)
Note 1 – Organization Segall Bryant & Hamill Emerging Markets Fund (the “Emerging Markets Fund”) and Segall Bryant & Hamill International Small Cap Fund (the “International Small Cap Fund”) (each a “Fund” and collectively the “Funds”) are organized as a diversified series of Investment Managers Series Trust, a Delaware statutory trust (the “Trust”) which is registered as an open-end management investment company under the Investment Company Act of 1940, as amended (the “1940 Act”). The Emerging Markets Fund’s primary investment objective is to seek long-term capital appreciation. The Fund currently offers two classes of shares: Class A and Class I. The Fund’s Class A shares commenced investment operations on June 30, 2014. The Fund’s Class I shares commenced investment operations on June 30, 2011. The Emerging Markets Fund (the “Successor Fund”) acquired the assets and liabilities of the Philadelphia International Emerging Markets Fund (the “Predecessor Fund”), a series of the Glenmede Fund Inc., on October 29, 2015. With respect to the Philadelphia International Emerging Markets Fund, Class I shareholders received Class A shares of the Successor Fund, and Class IV shareholders received Class I shares of the Successor Fund. As a result of the reorganization, the Fund is the accounting successor of the Predecessor Fund and accordingly, certain financial history of the Predecessor Fund is included in these financial statements. The International Small Cap Fund’s primary investment objective is to seek long-term capital appreciation. The Fund currently offers two classes of shares: Class A and Class I. The Fund’s Class A shares commenced investment operations on June 30, 2014. The Fund’s Class I shares commenced investment operations on May 31, 2011. The International Small Cap Fund (the “Successor Fund”) acquired the assets and liabilities of the Philadelphia International Small Cap Fund (the “Predecessor Fund”), a series of the Glenmede Fund Inc., on October 29, 2015. With respect to the Philadelphia International Small Cap Fund, Class I shareholders received Class A shares of the Successor Fund, and Class IV shareholders received Class I shares of the Successor Fund. As a result of the reorganization, the Fund is the accounting successor of the Predecessor Fund and accordingly, certain financial history of the Predecessor Fund is included in these financial statements. The shares of each class represent an interest in the same portfolio of investments of the Fund and have equal rights as to voting, redemptions, dividends and liquidation, subject to the approval of the Trustees. Income, expenses (other than expenses attributable to a specific class) and realized and unrealized gains and losses on investments are allocated to each class of shares in proportion to their relative shares outstanding. Shareholders of a class that bears distribution and service expenses under the terms of a distribution plan have exclusive voting rights to that distribution plan. Each Fund is an investment company and accordingly follows the investment company accounting and reporting guidance of the Financial Accounting Standards Board (FASB) Accounting Standard Codification Topic 946 “Financial Services—Investment Companies.” Note 2 – Accounting Policies The following is a summary of the significant accounting policies consistently followed by the Funds in the preparation of their financial statements. The preparation of financial statements in conformity with accounting principles generally accepted in the United States of America (“GAAP”) requires management to make estimates and assumptions that affect the reported amounts and disclosures in the financial statements. Actual results could differ from these estimates. (a) Valuation of Investments The Funds value equity securities at the last reported sale price on the principal exchange or in the principal over the counter (“OTC”) market in which such securities are traded, as of the close of regular trading on the NYSE on
39

Segall Bryant & Hamill Funds NOTES TO FINANCIAL STATEMENTS – Continued April 30, 2016 (Unaudited)
the day the securities are being valued or, if there are no sales, at the mean between the last available bid and asked prices on that day. Securities traded on the NASDAQ are valued at the NASDAQ Official Closing Price (“NOCP”). Debt securities are valued at the mean between the last available bid and asked prices for such securities, or if such prices are not available, at prices for securities of comparable maturity, quality and type. All other types of securities, including restricted securities and securities for which market quotations are not readily available, are valued at fair value as determined in accordance with procedures established in good faith by the Board of Trustees. Short-term securities with remaining maturities of sixty days or less are valued at amortized cost, which approximates market value. Fair value pricing may be applied to foreign securities held by the Funds upon the occurrence of an event after the close of trading on non-U.S. markets but before the close of trading on the NYSE when each Fund’s NAV is determined. If the event may result in a material adjustment to the price of the Fund’s foreign securities once non-U.S. markets open on the following business day (such as, for example, a significant surge or decline in the U.S. market), the Fund may value such foreign securities at fair value, taking into account the effect of such event, in order to calculate the Fund’s NAV. Other types of portfolio securities that the Fund may fair value include, but are not limited to: (1) investments that are illiquid or traded infrequently, including “restricted” securities and private placements for which there is no public market; (2) investments for which, in the judgment of the Advisor, the market price is stale; (3) securities of an issuer that has entered into a restructuring; (4) securities for which trading has been halted or suspended; and (5) fixed income securities for which there is not a current market value quotation. A Fund’s assets are valued at their fair market value. If a market quotation is not readily available for a portfolio security, the security will be valued at fair value (the amount which the Fund might reasonably expect to receive for the security upon its current sale) as determined in good faith by the Funds’ advisor, subject to review and approval by the Valuation Committee, pursuant to procedures adopted by the Board of Trustees. The actions of the Valuation Committee are subsequently reviewed by the Board at its next regularly scheduled board meeting. The Valuation Committee meets as needed. The Valuation Committee is comprised of all the Trustees, but action may be taken by any one of the Trustees. Foreign securities traded in countries outside the U.S. are fair valued by utilizing the quotations of an independent pricing service or from a brokerage firm. The pricing service or broker will use a statistical analyses and quantitative models to adjust local prices using factors such as subsequent movement and changes in the prices of indexes, securities and exchange rates in other markets in determining fair value as of the time the Fund calculates the NAVs. The Board reviews the independent third party fair valuation analysis report quarterly. (b) Investment Transactions, Investment Income and Expenses Investment transactions are accounted for on the trade date. Realized gains and losses on investments are determined on the identified cost basis. Dividend income is recorded net of applicable withholding taxes on the ex-dividend date and interest income is recorded on an accrual basis. Withholding taxes on foreign dividends are paid (a portion of which may be reclaimable) or provided for in accordance with the applicable country’s tax rules and rates and are disclosed in the Statement of Operations. Withholding tax reclaims are filed in certain countries to recover a portion of the amounts previously withheld. The Funds record a reclaim receivable based on a number of factors, including a jurisdiction’s legal obligation to pay reclaims as well as payment history and market convention. Discounts or premiums on debt securities are accreted or amortized to interest income over the lives of the respective securities using the effective interest method. Expenses incurred by the Trust with respect to more than one fund are allocated in proportion to the net assets of each fund except where allocation of direct expenses to each fund or an alternative allocation method can be more appropriately made.
40

Segall Bryant & Hamill Funds NOTES TO FINANCIAL STATEMENTS – Continued April 30, 2016 (Unaudited)
Offering costs incurred with the start up of the Funds are amortized on a straight line basis over a one-year period from October 29, 2015 (Plan of Reorganization). The Emerging Markets Fund incurred offering costs of approximately $17,011 and the International Small Cap Fund incurred offering costs of approximately $16,866. (c) Foreign Currency Translation The Funds’ records are maintained in U.S. dollars. The value of securities, currencies and other assets and liabilities denominated in currencies other than U.S. dollars are translated into U.S. dollars based upon foreign exchange rates prevailing at the end of the reporting period. The currencies are translated into U.S. dollars by using the exchange rates quoted at the close of the London Stock Exchange prior to when the Funds’ NAV is next determined. Purchases and sales of investment securities, income and expenses are translated on the respective dates of such transactions. The Funds do not isolate that portion of their net realized and unrealized gains and losses on investments resulting from changes in foreign exchange rates from the impact arising from changes in market prices. Such fluctuations are included with net realized and unrealized gain or loss from investments and foreign currency. Net realized foreign currency transaction gains and losses arise from sales of foreign currencies, currency gains or losses realized between the trade and settlement dates on securities transactions, and the differences between the amounts of dividends, interest, and foreign withholding taxes recorded on the Funds’ books and the U.S. dollar equivalent of the amounts actually received or paid. Net unrealized foreign currency translation gains and losses arise from changes in the value of assets and liabilities, other than investments in securities, resulting from changes in the exchange rates. (d) Federal Income Taxes The Funds intend to comply with the requirements of Subchapter M of the Internal Revenue Code applicable to regulated investment companies and to distribute substantially all of its net investment income and any net realized gains to its shareholders. Therefore, no provision is made for federal income or excise taxes. Due to the timing of dividend distributions and the differences in accounting for income and realized gains and losses for financial statement and federal income tax purposes, the fiscal year in which amounts are distributed may differ from the year in which the income and realized gains and losses are recorded by the Funds. Accounting for Uncertainty in Income Taxes (the “Income Tax Statement”) requires an evaluation of tax positions taken (or expected to be taken) in the course of preparing a Fund’s tax returns to determine whether these positions meet a “more-likely-than-not” standard that, based on the technical merits, have a more than fifty percent likelihood of being sustained by a taxing authority upon examination. A tax position that meets the “more-likely-than-not” recognition threshold is measured to determine the amount of benefit to recognize in the financial statements. The Fund recognizes interest and penalties, if any, related to unrecognized tax benefits as income tax expense in the Statement of Operations. The Income Tax Statement requires management of the Funds to analyze tax positions taken in the prior three open tax years, if any, and tax positions expected to be taken in the Funds’ current tax year, as defined by the IRS statute of limitations for all major jurisdictions, including federal tax authorities and certain state tax authorities. As of and during the open tax years ended October 31, 2012-2015, and as of and during the periods ended April 30, 2016, the Funds did not have a liability for any unrecognized tax benefits. The Funds have no examination in progress and are not aware of any tax positions for which it is reasonably possible that the total amounts of unrecognized tax benefits will significantly change in the next twelve months.
41

Segall Bryant & Hamill Funds NOTES TO FINANCIAL STATEMENTS – Continued April 30, 2016 (Unaudited)
(e) Distributions to Shareholders The Funds declare and pay dividends at least annually from net investment income and from net realized gains, if any. Distributions to shareholders are recorded on the ex-dividend date. The amount and timing of distributions are determined in accordance with federal income tax regulations, which may differ from GAAP. The character of distributions made during the year from net investment income or net realized gains may differ from the characterization for federal income tax purposes due to differences in the recognition of income, expense and gain (loss) items for financial statement and tax purposes. (f) Preferred Stocks Preferred stocks are a class of stock having a preference over common stock as to the payment of dividends and the recovery of investment in the event a company is liquidated, although preferred stock is usually subordinate to the debt securities of the issuer. Preferred stock typically does not possess voting rights and its market value may change based on changes in interest rates. If interest rates rise, the fixed dividend on preferred stocks may be less attractive, causing the price of preferred stocks to decline. Preferred stock may have mandatory sinking fund provisions, as well as call/redemption provisions prior to maturity, a negative feature when interest rates decline. Note 3 – Reorganization Information On June 30, 2015, Philadelphia International Advisors LP (“Philadelphia International”), the investment adviser to the Philadelphia International Emerging Markets Fund and the Philadelphia International Small Cap Fund (each a “Portfolio” and collectively, the “Portfolios”), sold certain of its assets (the “Transaction”), including those assets relating to the management of the Portfolios to Segall Bryant & Hamill, LLC (“Segall”), the portfolio management team that has managed the Portfolios joined Segall and continued to manage the Portfolios in the same capacity at Segall. On May 18, 2015, the Board of Directors (the “Board”) of The Glenmede Fund, Inc. approved an Interim Investment Advisory Agreements (the “Interim Advisory Agreements”), on behalf of each Portfolio, with Segall effective upon the closing of the Transaction. The fee rates under the Interim Advisory Agreements are the same as the prior investment advisory agreements with Philadelphia International. On May 18, 2015, the Board also approved proposed new investment advisory agreements with Segall, subject to shareholder approval (the “New Advisory Agreements”) prior to the expiration of the Interim Advisory Agreements. On May 18, 2015, the Board also approved an Agreement and Plan of Reorganization for each Portfolio relating to the reorganization of each Portfolio (each, a “Reorganization”) into a newly created series of the Investment Managers Series Trust (each an “Acquiring Fund”). Each Acquiring Fund will have substantially similar investment objectives, investment policies and restrictions as its corresponding Portfolio and will continue to be managed by the same investment management team that currently manages each Portfolio. Each Reorganization is subject to the completion of certain conditions, including approval by the applicable Portfolio’s shareholders. This tax-free reorganization was accomplished on October 29, 2015 (the “Closing Date”), by exchanging the assets and liabilities of the Philadelphia International Emerging Markets Fund and the Philadelphia International Small Cap Fund for shares of the Emerging Markets Fund and International Small Cap Value Fund, respectively. Class I and Class IV shares of the Philadelphia International Emerging Markets Fund were exchanged for 1,154 shares of Class A of the Emerging Markets Fund (valued at $7,950) and 141,832 shares of Class I of the Emerging Markets Fund (valued at $978,111), respectively. Class I and Class IV shares of the Philadelphia International Small Cap Fund were exchanged for 1,049,760 shares of Class A of the International Small Cap Fund (valued at $11,853,058) and 3,113,307 shares of Class I of the International Small Cap Fund (valued at $35,143,444), respectively.
42

Segall Bryant & Hamill Funds NOTES TO FINANCIAL STATEMENTS – Continued April 30, 2016 (Unaudited)
Note 4 – Investment Advisory and Other Agreements The Trust, on behalf of the Funds, entered into an Investment Advisory Agreement (the “Agreement”) with Segall (the “Advisor”). Under the terms of the Agreement, the Funds pay a monthly investment advisory fee to the Advisor at the annual rate of 0.90% of each Fund’s average daily net assets. The Advisor has contractually agreed to waive its fees and/or pay for operating expenses to ensure that total annual fund operating expenses (excluding any taxes, leverage interest, brokerage commissions, dividend and interest expenses on short sales, acquired fund fees and expenses as determined in accordance with Form N-1A, expenses incurred in connection with any merger or reorganization, and extraordinary expenses such as litigation expenses) do not exceed 1.48% and 1.23% of the average daily net assets of the Emerging Markets Fund’s Class A shares and Class I shares, respectively. The Advisor has contractually agreed to waive its fees and/or pay for operating expenses to ensure that total annual fund operating expenses (excluding any taxes, leverage interest, brokerage commissions, dividend and interest expenses on short sales, acquired fund fees and expenses as determined in accordance with Form N-1A, expenses incurred in connection with any merger or reorganization, and extraordinary expenses such as litigation expenses) do not exceed 1.28% and 1.03% of the average daily net assets of the International Small Cap Fund’s Class A shares and Class I shares, respectively. These agreements are in effect until October 23, 2017, and may be terminated before that date only by the Trust’s Board of Trustees. Prior to the close of business on October 29, 2015, investment advisory services were provided to the Predecessor Funds by Philadelphia International (the “Previous Advisor”), which received investment management fees for their services pursuant to the terms of the investment advisory agreements for each of the Predecessor Funds. The investment advisory fees, which were computed daily and paid monthly, were payable at the following annual rates for the Predecessor Funds, calculated as a percentage of each particular Fund’s average daily net assets: Philadelphia International Emerging Markets Fund, 0.65%; and Philadelphia International Small Cap Fund, 0.60%. The Advisor may recover from each Fund’s fees and/or expenses previously waived and/or absorbed if the Fund’s expense ratio, including the recovered expenses, falls below the expense limit at which they were waived. The Advisor is permitted to seek reimbursement from the Funds for a period ending three full fiscal years following the fiscal year in which such reimbursements occurred. The Advisor may recapture all or a portion of this amount no later than October 31, of the years stated below: From November 1, 2014 to the close of business on October 29, 2015, the Previous Advisor contractually agreed to waive a portion of its fees in amounts necessary to limit the Predecessor Funds’ operating expenses to an annual rate (as a percentage of the average daily net assets) as follows:
Emerging Markets Fund
International Small Cap Fund
2018 $ 1,387 $ 1,564 2019 185,260 192,083 Total 186,647 193,647
Predecessor Fund (Philadelphia International Emerging Markets Fund )
Predecessor Fund (Philadelphia International
Small Cap Fund ) Class I 1.48% 1.33% Class IV 1.25% 1.10%
43

Segall Bryant & Hamill Funds NOTES TO FINANCIAL STATEMENTS – Continued April 30, 2016 (Unaudited)
For the period November 1, 2014 through October 29, 2015, the Previous Advisor waived it advisory fees and absorbed other expenses totaling $190,845 and $0 for the Philadelphia International Emerging Markets Fund and Philadelphia International Small Cap Fund, respectively. IMST Distributors, LLC serves as the Funds’ distributor; UMB Fund Services, Inc. (“UMBFS”) serves as the Funds’ fund accountant, transfer agent and co-administrator; and Mutual Fund Administration, LLC (“MFAC”) serves as the Funds’ other co-administrator. UMB Bank, n.a., an affiliate of UMBFS, serves as the Funds’ custodian. Prior to the close of business on October 29, 2015, State Street served as the Predecessor Funds’ administrator, transfer agent, dividend-paying agent and custodian. Prior to the close of business on October 29, 2015, Quasar Distributors, LLC (“Quasar”) served as the Predecessor Funds’ distributor and principal underwriter. Certain trustees and officers of the Trust are employees of UMBFS or MFAC. The Funds do not compensate trustees and officers affiliated with the Funds’ co-administrators. For the six months ended April 30, 2016, the Funds’ allocated fees incurred to Trustees who are not affiliated with the Funds’ co-administrators are reported on the Statements of Operations. Dziura Compliance Consulting, LLC provides Chief Compliance Officer (“CCO”) services to the Trust. Prior to the close of business on October 29, 2015, Foreside Fund Officer Services, LLC (f/k/a Foreside Compliance Services, LLC) served as the Glenmede Fund, Inc.’s Chief Compliance Officer and each Predecessor Fund paid a portion of the CCO service fee. The advisor reimbursed the Emerging Markets Fund $1,684 for expenses related to the Plan of Reorganization. This amount is reported on the Fund’s Statement of Operations under the caption, “Net increase from payment by affiliates.” Note 5 – Federal Income Taxes At April 30, 2016, gross unrealized appreciation and depreciation on investments owned by the Funds, based on cost for federal income tax purposes were as follows:
Emerging Markets Fund International Small Cap
Fund Cost of investments $ 12,068,049 $ 44,419,813
Gross unrealized appreciation $ 903,573 $ 4,730,841 Gross unrealized depreciation (470,409) (3,176,519) Net unrealized appreciation/(depreciation) on investments $ 433,164 $ 1,554,322
The difference between cost amounts for financial statement and federal income tax purposes is due primarily to timing differences in recognizing certain gains and losses in security transactions.
44

Segall Bryant & Hamill Funds NOTES TO FINANCIAL STATEMENTS – Continued April 30, 2016 (Unaudited)
As of October 31, 2015, the components of accumulated earnings (deficit) on a tax basis were as follows:
Emerging Markets Fund
International Small Cap Fund
Undistributed ordinary income $ 44,801 $ 409,644 Undistributed long-term capital gains - 88,025 Accumulated earnings 44,801 497,669
Accumulated capital and other losses (606,174) (11,050) Other losses (74,036) - Unrealized appreciation/(depreciation) on investments (99,793) 379,216 Foreign currency translations 369 (1,997) Total accumulated earnings (deficit) $ (734,833) $ 863,838
As of October 31, 2015, the Funds had accumulated capital loss carryforwards as follows:
To the extent that a fund may realize future net capital gains, those gains will be offset by any of its unused capital loss carryforward. Future capital loss carryover utilization in any given year may be subject to Internal Revenue Code limitations. The tax character of distributions paid during the fiscal years ended October 31, 2015, and October 31, 2014 were as follows:
Emerging Markets Fund International Small Cap Fund 2015 2014 2015 2014
Distributions paid from: Ordinary Income $ 38,489 $ 1,952,970 $ 1,258,281 $ 1,478,814 Net long-term capital gains - 1,810,671 1,438,321 5,538 Return of capital - 571,519 - - Total distributions paid $ 38,489 $ 4,335,160 $ 2,696,602 $ 1,484,352 Note 6 – Redemption Fee The Funds may impose a redemption fee of 2.00% of the total redemption amount on all shares redeemed within 90 days of purchase. For the six months ended April 30, 2016, the Emerging Markets and International Small Cap Funds received $312 and $0, respectively, in redemptions fees. Note 7 – Investment Transactions For the six months ended April 30, 2016, purchases and sales of investments, excluding short-term investments, were as follows:
Not Subject to Expiration: Short-Term Long-Term Total Emerging Markets Fund $ 497,978 $ 108,199 $ 606,177 International Small Cap Fund 8,576 2,474 11,050
45

Segall Bryant & Hamill Funds NOTES TO FINANCIAL STATEMENTS – Continued April 30, 2016 (Unaudited)
Purchases Sales Emerging Markets Fund $ 14,665,681 $ 3,775,044 International Small Cap Fund 20,750,034 22,101,219
Note 8 – Distribution Plan The Trust, on behalf of the Funds, has adopted a Distribution Plan (the “Plan”) pursuant to Rule 12b-1 under the 1940 Act which allows each Fund to pay distribution fees for the sale and distribution of its Class A shares. The Plan provides for the payment of distribution fees at the annual rate of up to 0.25% of each Fund’s average daily net assets attributable to Class A shares, payable to IMST Distributors, LLC. Class I shares do not pay any distribution fees. For the six months ended April 30, 2016, distribution fees incurred by each Fund’s Class A shares are disclosed on the Statements of Operations. Note 9 – Indemnifications In the normal course of business, the Funds enter into contracts that contain a variety of representations which provide general indemnifications. The Funds’ maximum exposure under these arrangements is unknown, as this would involve future claims that may be made against the Funds that have not yet occurred. However, the Funds expect the risk of loss to be remote. Note 10 – Fair Value Measurements and Disclosure Fair Value Measurements and Disclosures defines fair value, establishes a framework for measuring fair value in accordance with GAAP, and expands disclosure about fair value measurements. It also provides guidance on determining when there has been a significant decrease in the volume and level of activity for an asset or a liability, when a transaction is not orderly, and how that information must be incorporated into a fair value measurement. Under Fair Value Measurements and Disclosures, various inputs are used in determining the value of each Fund’s investments. These inputs are summarized into three broad Levels as described below:
Level 1 – Unadjusted quoted prices in active markets for identical assets or liabilities that the Fund has the ability to access. Level 2 – Observable inputs other than quoted prices included in Level 1 that are observable for the asset or liability, either directly or indirectly. These inputs may include quoted prices for the identical instrument on an inactive market, prices for similar instruments, interest rates, prepayment speeds, credit risk, yield curves, default rates and similar data. Level 3 – Unobservable inputs for the asset or liability, to the extent relevant observable inputs are not available, representing the Fund’s own assumptions about the assumptions a market participant would use in valuing the asset or liability, and would be based on the best information available.
The availability of observable inputs can vary from security to security and is affected by a wide variety of factors, including, for example, the type of security, whether the security is new and not yet established in the marketplace, the liquidity of markets, and other characteristics particular to the security. To the extent that valuation is based on models or inputs that are less observable or unobservable in the market, the determination
46

Segall Bryant & Hamill Funds NOTES TO FINANCIAL STATEMENTS – Continued April 30, 2016 (Unaudited)
of fair value requires more judgment. Accordingly, the degree of judgment exercised in determining fair value is greatest for instruments categorized in Level 3. The inputs used to measure fair value may fall into different Levels of the fair value hierarchy. In such cases, for disclosure purposes, the Level in the fair value hierarchy within which the fair value measurement falls in its entirety, is determined based on the lowest Level input that is significant to the fair value measurement in its entirety. The inputs or methodology used for valuing securities are not an indication of the risk associated with investing in those securities. The following is a summary of the inputs used, as of April 30, 2016, in valuing the Funds’ assets carried at fair value: Emerging Markets Fund Level 1 Level 2 Level 3 Total Investments Common Stocks
Brazil $ 621,291 $ - $ - $ 621,291 Chile 120,796 10,993 - 131,789 China 135,296 2,749,014 - 2,884,310 Colombia 53,488 - - 53,488 Czech Republic - 4,765 - 4,765 Egypt 27,748 12,645 - 40,393 Greece 18,274 43,478 - 61,752 Hungary - 12,552 - 12,552 India 903,240 60,313 23,721 987,274 Indonesia 71,493 282,461 - 353,954 Malaysia 199,883 234,701 - 434,584 Mexico 507,368 - - 507,368 Peru 42,454 - - 42,454 Philippines 50,627 132,434 - 183,061 Poland 27,707 130,278 - 157,985 Qatar 42,349 95,415 - 137,764 Russia 42,187 456,528 - 498,715 South Africa 154,166 790,613 - 944,779 South Korea - 1,811,657 1,811,657 Taiwan 330,464 1,068,582 - 1,399,046 Thailand 13,074 283,035 - 296,109 Turkey 23,070 203,498 - 226,568 United Arab Emirates 25,367 104,728 - 130,095
Exchange-Traded Funds 214 - - 214 Preferred Stocks
Brazil 190,633 - - 190,633 Chile 7,743 - - 7,743 Colombia 24,007 - - 24,007 Russia - 31,313 31,313 South Korea - 127,870 - 127,870
Rights - 14 - 14Units 20,636 - - 20,636
47

Segall Bryant & Hamill Funds NOTES TO FINANCIAL STATEMENTS – Continued April 30, 2016 (Unaudited)
Warrants 77 - - 77 Short-Term Investments 176,953 - - 176,953 3Total Investments $ 3,830,605 $ 8,646,887 $ 23,721 $ 12,501,213
International Small Cap Fund Level 1 Level 2 Level 3* Total Investments Common Stocks
Australia $ 109,900 $ 2,668,468 $ - $ 2,778,368 Austria 87,938 542,419 - 630,357 Belgium 10,208 593,426 - 603,634 Denmark 530,040 203,716 - 733,756 Finland 198,659 578,150 - 776,809 France 592,311 1,492,165 - 2,084,476 Germany 226,439 2,245,550 - 2,471,989 Hong Kong 212,291 907,427 - 1,119,718 Ireland 125,058 544,045 - 669,103 Israel 44,869 594,576 - 639,445 Italy 268,712 1,717,126 - 1,985,838 Japan - 14,144,502 - 14,144,502 Netherlands 57,441 588,285 - 645,726 New Zealand - 417,157 - 417,157 Norway 311,007 735,862 - 1,046,869 Portugal - 142,264 - 142,264 Singapore 453,922 311,609 - 765,531 Spain 251,392 823,149 - 1,074,541 Sweden 41,654 2,262,813 - 2,304,467 Switzerland 589,170 1,221,969 - 1,811,139 United Kingdom 1,982,929 6,588,820 - 8,571,749
Preferred Stocks Germany 238,546 14,854 - 253,400 Rights 8,317 - - 8,317 Units -
Ireland - 2,649 - 2,649 Singapore 153,565 23,716 - 177,281
Warrants - - - - Short-Term Investments 115,050 - - 115,050 Total Investments $ 6,609,418 $ 39,364,717 $ - $ 45,974,135
* The Fund held level 3 securities valued at zero at period end. Transfers are recognized at the end of the reporting period. Transfers are recognized at the end of the reporting period. Transfers between Level 1 and Level 2 relate to the use of systematic fair valuation. When systematic fair valuation is used, securities whose primary market closes before the NYSE are classified as Level 2. The following is a reconciliation of transfers between Levels for the Funds from October 31, 2015 to April 30, 2016, represented by recognizing the April 30, 2016 market value of securities:
48

Segall Bryant & Hamill Funds NOTES TO FINANCIAL STATEMENTS – Continued April 30, 2016 (Unaudited)
Emerging Markets
Fund International Small Cap
Fund Transfers into Level 1 $ 121,206 $ 44,870 Transfers out of Level 1 (3,341,413) (31,745,681) Net transfers in (out) of Level 1 $ (3,220,207) $ (31,700,811)
Transfers into Level 2 $ 3,341,413 $ 31,745,681 Transfers out of Level 2 (121,206) (44,870) Net transfers in (out) of Level 2 $ 3,220,207 $ 31,700,811
The following is a reconciliation of assets in which significant unobservable inputs (Level 3) were used in determining value:
Emerging
Markets Fund International
Small Cap Beginning balance October 31, 2015 $ - $ - Transfers into Level 3 during the period 23,721 - Transfers out of Level 3 during the period - - Total realized gain/(loss) - - Total unrealized appreciation/(depreciation) - - Net purchases - - Net sales/Corporate actions - - Balance as of April 30, 2016 $ 23,721 $ - The following table presents additional information about valuation methodologies and inputs used for investments that are measured at fair value and categorized within Level 3 as of April 30, 2016:
Impact to Valuation
Fair Value from an April 30, Valuation Unobservable Input increase in
2016 Methodologies Input(1) Range/Value Input(2) International
Small Cap Fund - Common Stocks
$ - Fair Value Pricing Adjusted by management to reflect current
conditions
- Decrease
(1) The investment advisor considers relevant indications of value that are reasonably and timely available to it in
determining the fair value to be assigned to a particular security, such as the type and cost of the security; contractual or legal restrictions on resale of the security; relevant financial or business developments of the issuer; actively traded related securities; conversion or exchange rights on the security; related corporate actions; significant events occurring after the close of trading in the security; and changes in overall market conditions. The Fund’s use of fair value pricing may cause the net asset value of Fund shares to differ from the net asset value that would be calculated using market quotations. Fair value pricing involves subjective
49

Segall Bryant & Hamill Funds NOTES TO FINANCIAL STATEMENTS – Continued April 30, 2016 (Unaudited)
judgments and it is possible that the fair value determined for a security may be materially different than the value that could be realized upon the sale of that security.
(2) This column represents the directional change in the fair value of the Level 3 investments that would result from an increase to the corresponding unobservable input. A decrease to the unobservable input would have the opposite effect.
Note 11 – Recently Issued Accounting Pronouncements In May 2015, the FASB issued ASU No. 2015-07 Disclosure for Investments in Certain Entities that Calculate Net Asset Value per Share (or Its Equivalent). The amendments in ASU No. 2015-07 remove the requirement to categorize within the fair value hierarchy investments measured using the net asset value per share (“NAV”) practical expedient. The ASU also removes certain disclosure requirements for investments that qualify, but do not utilize, the NAV practical expedient. The amendments in the ASU are effective for fiscal years beginning after December 15, 2015, and interim periods within those fiscal years. Management is currently evaluating the impact these changes will have on the Fund’s financial statements and related disclosures. Note 12 – Events Subsequent to the Fiscal Period End The Funds have adopted financial reporting rules regarding subsequent events which require an entity to recognize in the financial statements the effects of all subsequent events that provide additional evidence about conditions that existed at the date of the balance sheet. Management has evaluated the Funds’ related events and transactions that occurred through the date of issuance of the Funds’ financial statements. There were no events or transactions that occurred during this period that materially impacted the amounts or disclosures in the Funds’ financial statements.
50

Segall Bryant & Hamill Funds EXPENSE EXAMPLES For the Six Months Ended April 30, 2016 (Unaudited)
Expense Examples As a shareholder of the Funds, you incur two types of costs: (1) transaction costs, and (2) ongoing costs, including management fees and other Fund expenses. The examples below are intended to help you understand your ongoing costs (in dollars) of investing in the Funds and to compare these costs with the ongoing costs of investing in other mutual funds. These examples are based on an investment of $1,000 invested at the beginning of the period and held for the entire period from October 1, 2015 to April 30, 2016. Actual Expenses The information in the row titled “Actual Performance” of the table below provides actual account values and actual expenses. You may use the information in these columns, together with the amount you invested, to estimate the expenses that you paid over the period. Simply divide your account value by $1,000 (for example, an $8,600 account value divided by $1,000 = 8.6), then multiply the result by the number in the appropriate row under the column titled “Expenses Paid During Period” to estimate the expenses you paid on your account during this period. Hypothetical Example for Comparison Purposes The information in the row titled “Hypothetical (5% annual return before expenses)” of the table below provides hypothetical account values and hypothetical expenses based on the Funds’ actual expense ratios and an assumed rate of return of 5% per year before expenses, which is not the Funds’ actual return. The hypothetical account values and expenses may not be used to estimate the actual ending account balance or expenses you paid for the period. You may use this information to compare the ongoing costs of investing in the Funds and other funds. To do so, compare these 5% hypothetical examples with the 5% hypothetical examples that appear in the shareholder reports of the other funds. Please note that the expenses shown in the table are meant to highlight your ongoing costs only and do not reflect any transaction costs, such as sales charges (load) or contingent deferred sales charges. Therefore, the information in the row titled “Hypothetical (5% annual return before expenses)” is useful in comparing ongoing costs only, and will not help you determine the relative total costs of owning different funds. In addition, if these transactional costs were included, your costs would have been higher.
Emerging Markets Fund
Beginning Account Value
Ending Account Value
Expenses Paid During Period*
11/1/15 4/30/16 11/1/15 – 4/30/16 Class A Actual Performance $ 1,000.00 $ 985.10 $ 7.30 Hypothetical (5% annual
return before expenses) 1,000.00 1,017.51 7.41 Class I Actual Performance 1,000.00 983.70 6.07 Hypothetical (5% annual
return before expenses) 1,000.00 1,018.82 6.17 * Expenses are equal to the Fund’s annualized expense ratio of 1.48% and 1.23% for Class A and Class I shares, respectively, multiplied by the average account value over the period, multiplied by 182/366 (to reflect the six month period). The expense ratios reflect an expense waiver. Assumes all dividends and distributions were reinvested.
51

Segall Bryant & Hamill Funds EXPENSE EXAMPLES - Continued For the Six Months Ended April 30, 2016 (Unaudited)
International Small Cap Fund
Beginning Account Value
Ending Account Value
Expenses Paid During Period*
11/1/15 4/30/16 11/1/15 – 4/30/16 Class A Actual Performance $ 1,000.00 $ 1,013.90 $ 6.41 Hypothetical (5% annual
return before expenses) 1,000.00 1,018.50 6.43 Class I Actual Performance 1,000.00 1,015.20 5.16 Hypothetical (5% annual
return before expenses) 1,000.00 1,019.74 5.17 * Expenses are equal to the Fund’s annualized expense ratio of 1.28% and 1.03% for Class A and Class I shares, respectively, multiplied by the average account value over the period, multiplied by 182/366 (to reflect the six month period). The expense ratios reflect an expense waiver. Assumes all dividends and distributions were reinvested.
52

Segall Bryant & Hamill Emerging Markets Fund
Segall Bryant & Hamill International Small Cap Fund Each a series of Investment Managers Series Trust
Investment Advisor Segall Bryant & Hamill
540 West Madison Street, Suite 1900 Chicago, Illinois 60661
Custodian UMB Bank, n.a.
928 Grand Boulevard, 5th Floor Kansas City, Missouri 64106
Fund Co-Administrator Mutual Fund Administration, LLC
2220 E. Route 66, Suite 226 Glendora, California 91740
Fund Co-Administrator, Transfer Agent and Fund Accountant UMB Fund Services, Inc.
235 W. Galena Street Milwaukee, Wisconsin 53212
Distributor IMST Distributors, LLC
Three Canal Plaza, Suite 100 Portland, Maine 04101
www.foreside.com

FUND INFORMATION
TICKER CUSIP Segall Bryant & Hamill Emerging Markets Fund - Class A SBHEX 46141Q 675 Segall Bryant & Hamill Emerging Markets Fund - Class I SBEMX 46141Q 667 Segall Bryant & Hamill International Small Cap Fund - Class A SBHSX 46141Q 659 Segall Bryant & Hamill International Small Cap Fund - Class I SBSIX 46141Q 642 Privacy Principles of the Segall Bryant & Hamill Funds for Shareholders The Funds are committed to maintaining the privacy of their shareholders and to safeguarding their non-public personal information. The following information is provided to help you understand what personal information the Funds collect, how we protect that information and why, in certain cases, we may share information with select other parties.
Generally, the Funds do not receive any non-public personal information relating to their shareholders, although certain non-public personal information of their shareholders may become available to the Funds. The Funds do not disclose any non-public personal information about their shareholders or former shareholders to anyone, except as permitted by law or as is necessary in order to service shareholder accounts (for example, to a transfer agent or third party administrator).
This report is sent to shareholders of the Segall Bryant & Hamill Funds for their information. It is not a Prospectus, circular or representation intended for use in the purchase or sale of shares of the Funds or of any securities mentioned in this report. Proxy Voting Policies and Procedures A description of the Funds’ proxy voting policies and procedures related to portfolio securities is available without charge, upon request, by calling the Funds at (866) 490-4999, or on the U.S. Securities and Exchange Commission’s (“SEC”) website at www.sec.gov. Proxy Voting Record Information regarding how the Funds voted proxies for portfolio securities, if applicable, during the most recent 12-month period ended June 30, is also available, without charge and upon request by calling (866) 490-4999 or by accessing the Funds’ Form N-PX on the SEC’s website at www.sec.gov. Form N-Q Disclosure The Funds file their complete schedule of portfolio holdings with the SEC for the first and third quarters of each fiscal year on Form N-Q. The Funds’ Form N-Q is available on the SEC website at www.sec.gov or by calling the Funds at (866) 490-4999. The Funds’ Form N-Q may also be viewed and copied at the SEC’s Public Reference Room in Washington, DC. Information on the operation of the Public Reference Section may be obtained by calling (800) SEC-0330.
Segall Bryant & Hamill Funds P.O. Box 2175
Milwaukee, WI 53201 Toll Free: (866) 490-4999


![INDEX [] · 2005-10-25 · 5 Bryant, John F, 27 Bryant, Levi Clinton, Sr, 109 Bryant, Lillie S, 101 Bryant, Linster, 101 Bryant, Litha L, 109 Bryant, Louisa M, 111 Bryant, Mary, 101](https://static.fdocuments.in/doc/165x107/5f4498e1f4a6be5e1a48d4d2/index-2005-10-25-5-bryant-john-f-27-bryant-levi-clinton-sr-109-bryant.jpg)


