SELF-STUDY MATERIAL FOR THE USERS OF EUROSTAT MICRODATA SETS
33
Self-study material for the users of Eurostat microdata sets Luxembourg 2016
-
Upload
- -
Category
Government & Nonprofit
-
view
54 -
download
0
Transcript of SELF-STUDY MATERIAL FOR THE USERS OF EUROSTAT MICRODATA SETS

Self-study material for the users of Eurostat microdata sets
Luxembourg 2016

2
Contents Preface .................................................................................................................................................... 4
Self-study material for the users of EU microdata sets ....................................................................... 5
Module 1 Introduction ........................................................................................................................ 5
Section 1.1 The value to society of researchers' access to microdata ............................................. 5
Section 1.2 The role of researchers in getting (and keeping) access to data ................................... 5
Section 1.3 Course aim ................................................................................................................... 6
Module 2 Perceptions about research use of data ............................................................................... 7
Section 2.1 The interest of government data collectors in data sharing .......................................... 7
Section 2.2 Perceptions of use of confidential data ........................................................................ 7
Section 2.3 Roles in data security ................................................................................................... 7
Module 3 Understanding restrictions on data access .......................................................................... 9
Section 3.1 Why is data access restricted? ...................................................................................... 9
Section 3.2 The 'intruder model' ..................................................................................................... 9
Section 3.3 The 'human model' ....................................................................................................... 9
Module 4 Thinking about data access ............................................................................................... 11
Section 4.1 Ways of providing data access ................................................................................... 11
Section 4.2 A framework for data access ...................................................................................... 11
Module 5 What things go wrong - an evidence-based analysis ........................................................ 13
Section 5.1 Introduction ................................................................................................................ 13
Section 5.2 Safe projects ............................................................................................................... 13
Section 5.3 Safe settings ............................................................................................................... 13
Section 5.4 Safe data ..................................................................................................................... 14
Section 5.5 Safe outputs ................................................................................................................ 15
Section 5.6 Safe people ................................................................................................................. 15
Module 6 Statistical disclosure control ............................................................................................. 17
Section 6.1 Introduction ................................................................................................................ 17
Section 6.2 Protection of tables..................................................................................................... 17
Section 6.3 How to avoid identification in frequency tables?....................................................... 18
Section 6.4 Class disclosure .......................................................................................................... 21
Section 6.5 How to avoid identification in magnitude tables? ...................................................... 22
Section 6.6 Protection of graphs ................................................................................................... 26

3
Section 6.7 Safe and unsafe statistics ............................................................................................ 27
Section 6.8 Dealing with unsafe statistics ..................................................................................... 28
Section 6.9 Software support ........................................................................................................ 28
Section 6.10 Summary of SDC ..................................................................................................... 29
Module 7 How can you help? ........................................................................................................... 30
Section 7.1 Reminder: use the 'five safes' to consider your behaviour ......................................... 30
Section 7.2 When to contact the support team .............................................................................. 30
Module 8 Reference material ............................................................................................................ 32
Section 8.1 Introduction ................................................................................................................ 32
Section 8.2 Legal background ....................................................................................................... 32
Section 8.3 Statistical guidance on disclosure control .................................................................. 32

4
Preface This document contains:
• A detailed guide to becoming a ‘safe researcher’ who is eligible to use Eurostat microdata1.
• Reference material in the last module of the guide; this is additional and background reading which researchers should be aware of.
After going through the self-study material you may take up the test. The test requires you to look through both the detailed guide and the reference material.
You should be familiar with Eurostat’s microdata access central web page:
• http://ec.europa.eu/eurostat/web/microdata/overview
You will find:
• An overview of datasets available; • Application forms for research organisations and for research proposals;
• The list of approved research organisations; • Description of different access methods.
The self-study material has been developed in collaboration with Felix Ritchie from GOPA Worldwide Consultants.
For any queries, the first point of contact is the Eurostat microdata access team; email [email protected].
1 By Eurostat confidential data/microdata we mean here the confidential data available for scientific purposes. These are data collected by national statistical authorities in the Member States and released by Eurostat.

5
Self-study material for the users of EU microdata sets
Module 1 Introduction
Section 1.1 The value to society of researchers' access to microdata
The need for evidence
High-quality evidence plays a key role in the well-being of modern societies, from good policy-making to understanding how the parts of our increasingly complex societies interact.
Evidence and policy
For example, many governments nowadays claim to use 'evidence-based policy-making': using objective independent evidence, as far as possible, to develop policies.
Studying society
Good evidence is also essential to evaluate or challenge policy; or, more widely to study trends in society. We are often interested in very detailed information; for example, how does access to health care or the minimum wage affect a particular ethnic group?
Confidential data
Confidential data means data allowing respondents (individual persons, households or business entities) to be identified thereby disclosing individual information.
Microdata Microdata consist of sets of records containing information on individual persons, households or business entities. High quality microdata can be derived from administrative or statistical data sources, and these are increasingly made available to researchers.
Confidential data versus microdata
Confidential data refer to individual information on people or business entities that should not be disclosed. 'Microdata' is a usual term for files containing confidential data.
In practice (and also in this tutorial) the two terms are often used as synonyms.
The value to the researcher
This increased access to confidential data benefits you as researcher by allowing you to increase the scope and detail of your research. Of course, not all microdata is confidential, and often it can be anonymised without losing too much of the detail. As drilling into the data becomes more and more important to academic research, being able to address the data at source becomes invaluable.
Section 1.2 The role of researchers in getting (and keeping) access to data
The good and bad of access to detailed microdata
Some of the most valuable research comes from detailed personal and business microdata; but the level of detail can also raise concerns about the sensitivity of the data. Some are concerned about the ethics of such research; others are nervous about data falling into the wrong hands. How much do you trust the people who look after your personal data?
Collective responsibility in data access
Luckily, the safe use of confidential data by academics is well studied: academics generally have a good track record; they respect the privilege of access. However, data security is a collective issue - one person behaving badly
6
or making mistakes can make things worse for everyone else. Every kind of data misuse or careless usage of confidential data can lead to confusion and reduces the trust of the society in statistical bodies handling their data seriously.
Why do we safeguard access to microdata?
A failure of data security risks all our access, as public opinion often does not see a difference between the unforeseeable, the incompetent, and the mischievous. The best way to maintain access to research data is to continually demonstrate that it is safe to do so, because the research community knows what it's doing and respondents can trust that their data is treated with the utmost care.
We, you and us While we all share the same aim, we all have different parts to play. To be clear, in this document we will use 'we' when we mean the government data providers who have prepared this document, 'you' when we mean you the individual researcher, and 'we all' or 'us all' when we mean everyone involved in microdata access collectively.
Section 1.3 Course aim
The aim of this document
The aim of this document is to help us all achieve continued safe access to sensitive data: by having everyone aware of what can go wrong, why it matters, and what can be done to prevent mistakes. Both data collectors and researchers share this goal, because if something goes wrong we all lose.
Course scope This course will focus on access to confidential data from government sources available via Eurostat, but the principles here apply to any data set made available by official statistics.
Learning objective
At the end of the course, we want you to understand which risks may occur when access to microdata is provided and what measures can be taken to deal with them.
The test To reinforce the learning, the course comes with a test. Please do it. You may take up the test as many times as you like.
7
Module 2 Perceptions about research use of data
Section 2.1 The interest of government data collectors in data sharing
Government data resources
Governments collect large amounts of data for administrative or statistical purposes. This data has great research potential.
Data sharing Legal gateways may allow data sharing for research use, but governments may consider it as something potentially risky and/or burdensome. In addition, if a statistical body lets researchers use the data, the researchers gain the benefit from academic journal articles; but if something goes wrong, it is often expected that the statistical organisation will get the blame even if the researcher is at fault. So, by sharing data the data collector gets little direct benefit but could face a significant cost.
Incentives for data sharing
First, governments have realised that allowing research access to data can improve their knowledge of their business or data; you are likely to use the data in different ways to those who collected it. Researchers can be a good source of new ideas.
Second, data collection is costly (particularly for surveys, but also for administrative data); allowing researchers to re-use data already collected allows data collectors to show that they are using public money efficiently.
Section 2.2 Perceptions of use of confidential data
Public concerns about use of confidential data
There is a lot of public concern about the use of confidential data. This is understandable. Most people do not think about data security in a structured way, or have knowledge of research environments; but they are affected by media reports of insecure practices. However, use of confidential data for academic research is generally acceptable to the public, assuming the data can be handled 'safely'.
Risks of data sharing
Years of experience in different settings tell us that scientific research use of confidential data is not a high-risk operation. But it is not zero-risk: things do go wrong, and the consequences can be out of proportion to any damage. If we or you make a mistake in handling confidential data, systems are likely to be reviewed, and such reviews usually lead to additional restrictions. Clearly, such failures can make everyone worse off, and so data safety is a collective responsibility.
Section 2.3 Roles in data security
The data collectors
Data collectors are those who collect the data (often national statistical institutes). They often don't have the freedom or resources to exploit their own data in the way that researchers do, and may welcome the chance to exchange experiences. Increasing the value of your research to data collectors increases the likelihood of its continuing availability.

8
Data access managers
The data access managers are inside the data collectors those responsible for determining how your data access is to be provided and under what conditions; they know the importance of active engagement by researchers, and so they want to make sure that we all work together.
Support team Support team is your day-to-day contact for getting access to the data; the support team works in close collaboration with the data access manager. They are there to support you!
Researchers As the user of the data, you also have a role: by acting appropriately, you reinforce the message that scientific research is a safe use of confidential data, increasing the chances of data continuing to be made available.
Data security is a group effort
Neither the researchers nor data collectors will be 100% pleased with any access solution, and data access managers have to balance the concerns of both sides. Remember this if something isn't working - data access managers and the support team (your direct contacts for research queries) are the best people to get things changed, and appreciate helpful suggestions.

9
Module 3 Understanding restrictions on data access
Section 3.1 Why is data access restricted?
Legal restrictions
There are often legal restrictions on who can share data with whom, particularly across national or federal borders. There are also specific regulations relating to EU institutions.
Perceived risks For many government bodies, there is limited experience of making data available to researchers. Evidence suggests that government bodies, in general, are less willing to take risky decisions. In the specific case of data sharing, we noted earlier that government bodies often don't have strong incentives, and the expectation is that they would be blamed if a (perceived) confidentiality breach occurred.
Consequences There are reasons why governments might be cautious about providing access to confidential data. This is reflected in the popularity of the so-called 'intruder model' of data security, where someone deliberately intends to breach data confidentiality. We will see below that human mistakes can also lead to security breaches.
Section 3.2 The 'intruder model'
Intruder The dominant model in the confidentiality literature is of the 'intruder' - someone who deliberately intends to breach data confidentiality (for example, to embarrass the data collector, to find out about a neighbour, or spy on a company for private profit).
Why the model is popular
This model is popular because it leads to cautious risk planning: if we can protect against these very clever intruders, then our data must be safe against more casual attacks and common mistakes.
The consequences for researchers
This perspective leads to risk-aversion and worst-case scenarios, meaning that, for example, higher levels of anonymisation are applied to a dataset even for distribution to the scientific community.
The evidence There is no evidence of this model being relevant for academic researchers. There is more evidence for the 'human model'.
Section 3.3 The 'human model'
Human model This view of the world recognises that you are human. However, being human, we know there is a significant chance of you making mistakes or misjudgements (such as avoiding procedures you find annoying), but without the intention to breach confidentiality.
Implications of this model
These human factors aren't well addressed by restricting the data; they are better addressed by designing systems well, and training researchers. If the systems and the training work, then you can get access to more detailed data than if you are treated with suspicion.

10
Intruders versus humans
The intruder model makes no distinction about different levels of trust for different users' types. The 'worst case' scenario is assumed to be covered by restricting the data. In contrast, the human model relies upon us all working together, with data restrictions being avoided if procedural solutions can be found. You are being allowed to demonstrate your ability to handle data safely before we consider the option of restricting the data; we'll only do that if you show yourself to be untrustworthy.
Are you an accidental intruder?
Within the intruder model the data intruder is assumed to match different data sources with the same underlying population to extend his prior knowledge. Data users could do the same by mistake in order to improve the analytical validity of data. This may be statistically well-intentioned; but if it is not allowed in the underlying research agreement, it shall not be done.
Why is your attitude important?
So, continually demonstrating good working practices is important for maintaining access to confidential data. You should remember about this when asking for access to confidential data.

11
Module 4 Thinking about data access
Section 4.1 Ways of providing data access
Data access routes
There are many different routes through which data access can be provided. The main differences are in whether the data are distributed, or whether access is distributed. There is also synthetic (created) data. The different routes of microdata access present different sets of risks.
Distributing data: licensing
Licensing gives the researcher great freedom to work with the data; hence it also implies a degree of trust that the data will be cared for. Often combined with anonymisation, where more detail comes with stricter licence terms.
Distributing data: anonymisation
Anonymisation changes or reduces the information content, to lower the chance of breach of confidentiality and/or impact of any breach. This allows the data to be distributed more widely.
Distributing access: research data centres
Research data centres offer access to very detailed data in return for practical operating restrictions - for example, requiring you to be in a specific building. Increasingly this is done via remote working environments. Many statistical offices have set up such facilities in the last decade, including Eurostat.
Distributing access: remote job submission
A 'remote job' means submitting statistical code and seeing only the statistical results. Typically there are restrictions on the type of commands and outputs, but not on the data. The Luxembourg Income Study's LISSY system is a good and popular example of this type of system.
Section 4.2 A framework for data access
The 'five safes' The 'five safes' is a way of thinking about data access, allowing you to consider what elements are under the control of the data access manager or the researcher, and where problems might occur.
What are the 'five safes'?
The 'five safes' relate to projects, settings, data, outputs and people. Each is a measure of risk, not a standard; so when we talk about 'safe data', we mean "what is the risk in this data, given all the other things that are happening?", not "is this data 'safe'?" in an absolute sense.
Using the 'five safes'
Data access managers use the 'five safes' to design data access strategies. We will use them in a slightly different way, from the researcher's perspective, and we will consider them as a series of questions.
(1) Safe project Is this project making appropriate and lawful use of the data? Are there issues you should make the data collectors aware of? Does a public benefit need to be identified?
(2) Safe setting How are you storing and accessing the data?
(3) Safe data Could an unauthorised person, given access to this data, breach confidentiality?

12
(4) Safe outputs Are the statistical outputs you produce (tables, regressions, odds ratios, indexes) likely to cause a breach of confidentiality?
(5) Safe people Are you acting appropriately to ensure the effective operation of the other elements?

13
Module 5 What things go wrong - an evidence-based analysis
Section 5.1 Introduction
Things going wrong
In this section we consider what tends to lead to breaches of procedures or confidentiality. We will use the 'five safes' as a structure, and we will focus on the risks that evidence shows as the most important, not the theoretical ones.
Breach of procedure or confidentiality?
For argument's sake, we will treat 'breach of confidentiality' (which is very rare) and 'breach of procedure' (which is much more common) as the same thing. This is done to simplify the discussion, we are aware of the difference.
Are breaches of procedure less important?
We treat breaches of procedure very seriously. They can be evidence of bad practice, negligence or lack of knowledge. They can also be due to badly designed systems. We do our best to prevent these breaches from happening. Note that every breach increases the risk the data access will be withdrawn.
Section 5.2 Safe projects
What is a 'safe project'?
As a general rule, laws require that use of specific data is for a specific purpose, for a specific period, for a specific group of people. All of these can go wrong.
Mistake 1: using data for the wrong purpose
A research project is by nature uncertain and dynamic. Your research might take you beyond the scope agreed in your project proposal. For example, you have access to data to look at low-income households, and then you decide to study health and well-being while you have the data. If this happens please inform the support team to make the necessary amendments.
Mistake 2: using data outside the project period
Academic publication takes a long time. There is an incentive to hold on to data longer than agreed in advance to allow for revisions, queries, et cetera. Again, please ask the support team to extend the project duration.
Mistake 3: unauthorised data linking
You may wish to combine your data with other data which was not part of the project proposal. Please make sure that it gets included in the research proposal. Be aware of the increased disclosure risks when the data are merged or linked.
Mistake 4: unauthorised data sharing
Your colleagues may wish to help out. Please make sure all researchers having access to the data are named in the research proposal.
In short We understand that your research project may drift. If you see this happening, talk to the support team – they will do everything to arrange things properly.
Section 5.3 Safe settings
What is a 'safe setting'?
Safe setting is a way of accessing the data. The microdata access settings are designed to ensure protection of confidential data.
Two access modes
Eurostat makes data available through two mechanisms. 'Scientific Use Files' (SUFs) contain de-identified and anonymised microdata files which are

14
distributed to researchers but are thought to present too great a disclosure risk to be released to the general public. 'Secure use files' (SecUFs) have more detail, and so can only be accessed in restricted environments, such as the Eurostat Safe Centre in Luxembourg. With SecUFs, the setting is set up by the facility manager to prevent accidental or deliberate misuse. For SUFs, you are given the data to look after and so there is more chance of something going wrong - particularly by mistake or lack of knowledge.
How secure are your servers?
Your university machines are probably safe from unauthorised hackers - but are you storing files where your colleagues (who may not be authorised users of your datasets) can see them? Please make sure that only authorized researchers have access to confidential data.
Data on personal machines
Are you storing data on machines which other people (such as your family) have access to? Please store and use the data only at the premises of your research organisation.
Portable media If you are using Eurostat microdata, it is not allowed to hold data on USB drives or on notebooks.
Email Email is great. Apart from being completely insecure. And crossing borders without you knowing. And not necessarily going to the right destination… Please protect the e-mail with decryption password and never send it any further.
In short Your access agreement should say what can be done with data - for example, Eurostat SUFs must not be copied to a USB drive, and all computer drives must be protected by a password. Even if you think you are following procedures, be careful - it is very easy to lose, or lose track of, electronic data. Finally, if in doubt, ask the support team.
Section 5.4 Safe data
What is 'safe data'?
Safe data are normally data that do not contain any confidential information and are safe to be made public. In the context of microdata access 'safe data' are the data prepared adequately to the access settings. The process of preparation of the data is often called 'anonymisation'.
Anonymisation The term "anonymisation" is used in three different ways. First definition indicates the process of removing direct identifiers (like name, ID and address) from the confidential data. Anonymisation is also defined as the set of methods applied to microdata in order to reduce the risk of identification of the statistical unit (second definition). Finally (third definition) it refers to methods that completely eliminate the risk of identification of the statistical unit (directly or indirectly). Believing that the removal of direct identifiers is sufficient to prevent disclosure is a common, but terrible, mistake.
Anonymised data
Secure use files are the data anonymised by means of removing direct identifiers (definition 1 above). Scientific use files are the result of anonymisation defined as methods aiming to reduce (but not eliminate completely) the risk of identification (definition 2). Public use files contain records anonymised in such a way that the statistical unit cannot be identified, either directly or indirectly (definition 3).

15
Direct and indirect identification
"Direct identification" means the identification of a statistical unit (usually respondent) from its name or address, or from a publicly accessible identification number. "Indirect identification" means the identification of a statistical unit by any other means than by way of direct identification, especially by combination of indirectly identifying variables like age, education, occupation.
Users of anonymised data
Different users have access to different types of anonymised data. Eligible researchers can get access to secure use files and scientific use files. Public use files are normally accessible to everyone.
Scientific use files
In case of scientific use files it is possible to re-identify people from combinations of variables, such as age, gender, job title, postcode etc. A common mistake is to assume that, if you can't re-identify a respondent, no-one can. A better assumption is that, if you can't re-identify a respondent, it's because you haven't tried hard enough.
Data summary Assume all data is confidential and identifiable, and treat it securely.
Section 5.5 Safe outputs
Why do you need to secure outputs?
Your reason for using confidential data is to be able to publish statistical outputs based on that data which the wider world can read. You have to make sure that your published results do not inadvertently identify respondents. You will find the guidance below how to ensure that your output is safe to be published (Statistical disclosure control module).
Will the statistical disclosure control (SDC) limit my outputs?
In theory, this may be the case; in practice, academic researchers should not find modern SDC rules restrictive. Most of the rules for SDC overlap with guidelines for statistical validity (such as having lots of observations, and many degrees of freedom). You will find guidelines for publication supplied with the dataset. They may contain, for example: country-specific restrictions, thresholds or dominance rules for producing tables etc. In case of doubts, the support team can help you find the alternative ways to get the statistical message across.
In short Make sure that you can demonstrate that you have taken all reasonable measures to publish output that is safe.
Section 5.6 Safe people
The common denominator
The common theme in many of the above cases is that the researcher has done something wrong: either deliberately or, more commonly, through carelessness or mistake. You can’t be continuously monitored. Hence, your trustworthiness is a central part of data security.
The need for self-policing
The most effective way to check on whether you are acting sensibly is to get you to check yourself. Our role in this training is to help you to do that effectively.
Your research entity
In order to get access to microdata you need to be affiliated with a recognized research entity. Your conduct has impact on the reputation of the entity therefore the research entity should promote the proper use of confidential data.

16
In short Make sure that your conduct enables us to trust you and your organisation and entrust you with confidential data.

17
Module 6 Statistical disclosure control
Section 6.1 Introduction
The need for SDC
This section covers statistical disclosure control (SDC) - steps you should take to make sure that your published results do not accidentally release information about respondents.
How this module is set up
For teaching purposes, in this module we assume that identifying a respondent as above is sufficient to breach confidentiality. We will reflect on this later, in the summary of SDC. As an example, we will show tables describing the characteristics of a named school. In practice, Eurostat files would not normally include names of specific organisations, but there will often be enough detail in the data (size, type, district) to allow you to identify them. As a general rule, assume that institutions can be identified fairly easily - we have simplified this in this module by giving the school its name.
Section 6.2 Protection of tables
Disclosure Disclosure is where confidential information can be inferred. In Example 1 it is clear that there is one child in the school who is a non-native speaker, female and who lives outside the town.
Identification This information may help you to 'identify' the respondent: for example, in this case, the information is likely to be known to the other children, teachers and so probably parents; so there is a high chance that all these persons reading this table could name that child. This is important, as knowing that a respondent is definitely in the data is the first stage to finding out individual information.
Indirect identification
This is called 'indirect identification': finding someone through a unique set of characteristics. This is very hard to spot, because you do not know what combination of characteristics might identify someone. In the example, knowing a child's gender, or where they live, or their native language, is not enough by itself to single out one person. All of them together are necessary.
Native speaker
Non-native speaker
Native speaker
Non-native speaker
Central district
78 9 76 11 174
Suburbs 99 16 102 15 232
Out of town 9 3 5 1 18
186 28 183 27 424
Example 1 - Simple primary disclosureNewton Primary School
Student population
Boys Girls

18
Breach of confidentiality
The information in Example 1 may be linked with other data (parent's income, for example). In combination with other data more information about an individual respondent can be disclosed, thus leading to the breach of confidentiality.
Section 6.3 How to avoid identification in frequency tables?
Frequency tables
Frequency tables are tables with counts of observations.
Methods to reduce disclosure risk
There are different methods that can be applied to reduce the risk of disclosure. The most frequently used method is suppression of the cells at risk. Table redesign or transformation of data are other alternatives.
Primary suppression
One could simply delete the problematic cells. Consider Example 2, where the problematic cell has been removed - in this case an 'X' replaces the original value. This is called 'primary suppression'.
Secondary disclosure
However, in Example 2 the totals have been left in. Clearly, the totals can be used to work out the missing value. This is called 'secondary disclosure' - using other information to help restore values in the missing cells.
Creating your own totals
If totals are a problem, then you could just publish without totals, or equivalently calculate totals from observed data - see Example 3. This seems to solve the problem - you cannot find out the blank cell from this table. Everything fine?
Native speaker
Non-native speaker
Native speaker
Non-native speaker
Central district
78 9 76 11 289
Suburbs 99 16 102 15 232
Out of town 9 3 5 X 18
186 28 183 27 424
Example 2 - Suppressing cellsNewton Primary School
Student population
Boys Girls

19
The problem of other information
However, suppose another researcher using the same data wants to publish the table in Example 4. Are you now confident that your previous solution was successful? Note that as a general rule the higher level aggregates should be preserved.
Secondary suppression
An alternative is to suppress more cells - see Example 5, where complementary cells have been replaced with 'X'. This 'secondary suppression' ensures the same totals across tables.
Native speaker
Non-native speaker
Native speaker
Non-native speaker
Central district
78 9 76 11 174
Suburbs 99 16 102 15 232
Out of town 9 3 5 X 17
186 28 183 26 423
Example 3 - Recalculating totalsNewton Primary School
Student population
Boys Girls
Native speaker
Non-native speaker
Boys 186 28 214
Girls 183 27 210
369 55 424
Example 4 - Secondary tablesNewton Primary School
Student population

20
Problem of secondary suppression
Secondary suppression removes useful (and non-confidential) information in the cell; for example, the additional cells removed in Example 5 do not by themselves pose a risk. More importantly, secondary suppression can still be breached by other tables which break down the data in different ways, or produce their own totals. There exist IT tools that identify secondary suppressions ensuring confidentiality while limiting the information loss. Tau-Argus and R based sdcTable are the two used by some statistical offices in the EU.
The unprovability of safety
It is impossible to prove there is no risk of secondary disclosure - you would have to know every other table that has been or will be produced from your dataset or related ones. If someone tells you that a table 'is completely safe', they are wrong. What they really mean is "we think this table is reasonably safe given the way we have managed low values and the other information that is likely to be produced from this data".
Threshold limits
Most data managers ask you to ensure that you produce tables with minimum cell counts - 'threshold limits'. In the academic literature a popular minimum is 3 units per cell.
Thresholds of 3 in theory
One respondent in a cell is visible to all. Two respondents in a cell are visible to each other (assuming each knows what they contributed). So three is often used as the theoretical minimum as, assuming there is no collaboration between contributors, none of the three contributors can identify two separately.
Using the higher threshold
In practice, most data managers put higher limits on. This is to deal with the uncertainty about what other tables are produced. Higher limits do not make disclosure impossible, but make it less likely.
Table redesign An efficient way to reduce the number of cells suppressed due to confidentiality is aggregation of certain categories of variables (table redesign), see Example 6.
Native speaker
Non-native speaker
Native speaker
Non-native speaker
Central district
78 X 76 X 174
Suburbs 99 16 102 15 232
Out of town 9 X 5 X 18
186 28 183 27 424
Example 5 - Secondary suppressionNewton Primary School
Student population
Boys Girls

21
Transforming the data
One could consider showing percentages rather than numbers of pupils (see example 7). Does this remove the identification risk? No - you can easily work out the numbers in each cell from the column totals (which are in this example directly in the table, but might also be in some other table), as the count must be a whole number: 4% x 27 => 1 pupil.
Section 6.4 Class disclosure
Be careful max and min values
Maximum (e.g. 100%) and minimum (e.g. 0%) scores are usually very disclosive. Consider Example 8. What does this tell you about every native speaker girl or boy living out of town? This is a specific example of class disclosure.
Native speaker
Non-native speaker
Central district
154 20 174
Suburbs 201 31 232
Out of town 14 4 18
369 55 424
Example 6 - Table redesignNewton Primary School
Student population
Native speaker
Non-native speaker
Native speaker
Non-native speaker
Central district
42% 32% 42% 41% 41%
Suburbs 53% 57% 56% 56% 55%
Out of town 5% 11% 3% 4% 4%100% 100% 100% 100% 100%
186 28 183 27 424
Newton Primary SchoolStudent population
Example 7 - Using percentages
Boys Girls

22
Class disclosure
'Class disclosure' is where all or almost all of the observations come in one category thereby disclosing information about all contributors to that category (see Example 9). What have you learnt about all non-native girls living out of town and living in suburbs? As a rule of thumb no cell shall contain more than 90 % of the total number of units in its row or column. Empty cells are not a problem as such, as long as the observations are distributed over several categories within the column and row.
Learn the rules for your data
You must follow the guidelines issued by the data managers, which may be specific to a dataset. For example, health or other sensitive data may have higher limits. Dataset-specific information will be sent to you when your access to a dataset is granted.
Section 6.5 How to avoid identification in magnitude tables?
Magnitude tables
The discussion above is about frequency tables – counts of observations. However, researchers often produce magnitude tables, such as totals or mean values.
Thresholds in Magnitude tables face the same threshold tests as frequency tables. Consider
Native speaker
Non-native speaker
Native speaker
Non-native speaker
Central district
94% 67% 97% 64% 92%
Suburbs 92% 63% 96% 73% 89%
Out of town 100% 67% 100% 0% 89%
93% 64% 97% 67% 91%
GirlsBoys
Example 8 - Ratios and percentagesNewtown Primary School
Pass rates
With learning
difficulties
Without learning
difficulties
Central district 4 7 11
Suburbs 14 1 15
Out of town 0 1 1
18 9 27
Example 9 - class disclosureNewton Primary School
Girls non native speakers
23
magnitude tables
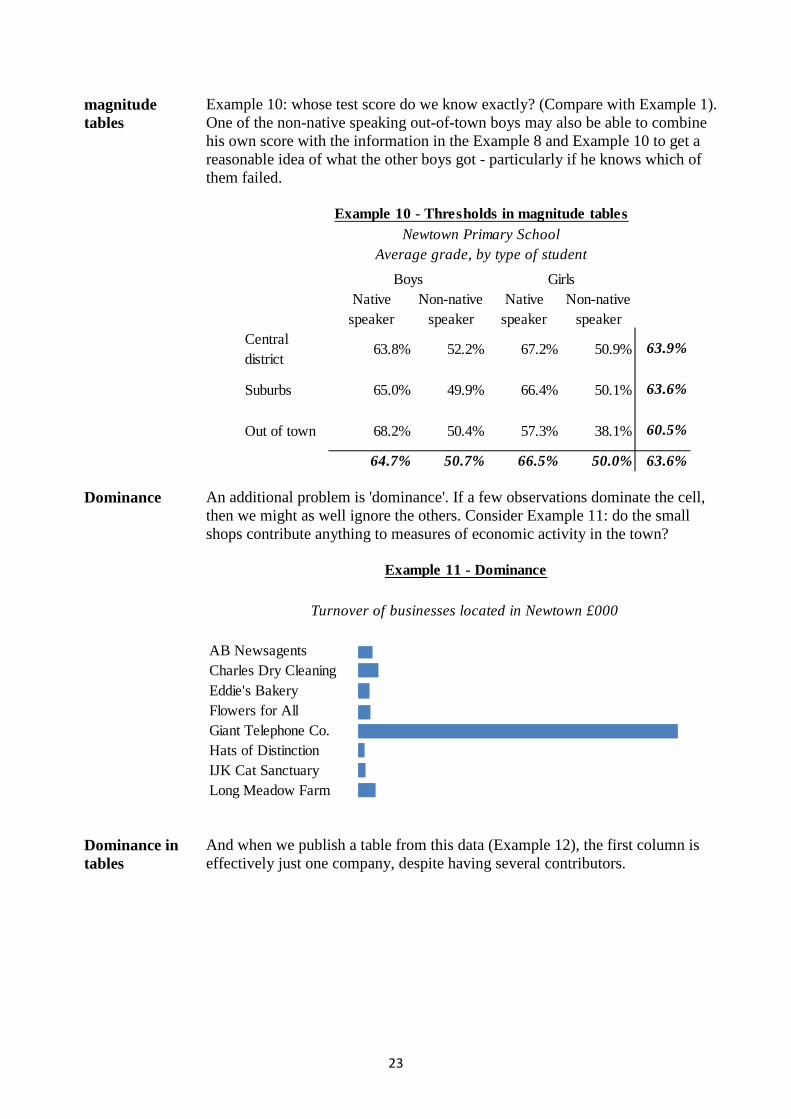
Example 10: whose test score do we know exactly? (Compare with Example 1). One of the non-native speaking out-of-town boys may also be able to combine his own score with the information in the Example 8 and Example 10 to get a reasonable idea of what the other boys got - particularly if he knows which of them failed.
Dominance An additional problem is 'dominance'. If a few observations dominate the cell, then we might as well ignore the others. Consider Example 11: do the small shops contribute anything to measures of economic activity in the town?
Dominance in tables
And when we publish a table from this data (Example 12), the first column is effectively just one company, despite having several contributors.
Native speaker
Non-native speaker
Native speaker
Non-native speaker
Central district
63.8% 52.2% 67.2% 50.9%63.9%
Suburbs 65.0% 49.9% 66.4% 50.1%63.6%
Out of town 68.2% 50.4% 57.3% 38.1%60.5%
64.7% 50.7% 66.5% 50.0% 63.6%
Example 10 - Thresholds in magnitude tablesNewtown Primary School
Average grade, by type of student
Boys Girls
AB NewsagentsCharles Dry CleaningEddie's BakeryFlowers for AllGiant Telephone Co.Hats of DistinctionIJK Cat SanctuaryLong Meadow Farm
Turnover of businesses located in Newtown £000
Example 11 - Dominance

24
The n,k rule Data managers therefore sometimes require what is called the '(n,k)' or dominance rule: the top n respondents must contribute less than k% of each cell total. This is to make sure that a few respondents do not dominate the cell totals, and thus their individual responses are visible in the same way as if the smaller respondents had not been included.
The p% rule An alternative rule is to require that the total of the bottom N-2 contributors account for at least p% of the size of the largest. This is to ensure that the second largest respondent has a degree of uncertainty about the values of the largest respondent (in theory, you could look at other firms in the distributions, but usually the assumption is that, if the second largest can't determine anything, then small respondents have even less chance).
Newtown Midburgh Westerly Northill TotalTurnover £m
16,372 2,843 8,917 12,167 40,299
Investment£m
237 26 69 87 419
Employment 3,887 820 2,449 3,358 10,514
Example 12 - Dominance in Magnitude TablesBusiness Activity in Central Regions

25
Is dominance a problem?
It is hard to spot dominance - you cannot tell just by looking at the figures in the table cells. It requires knowledge of the data, and application of the concentration measures, which also means it is unlikely to lead to a breach of confidentiality as readers of your work will not have exactly the same knowledge of the data as you. However, when thinking about dominance, you should not rely on having a unique knowledge of the data. A good starting point is to assume that others do have at least the same knowledge as you.
Dominance in practice
In practice, dominance occurs in specific situations, as it requires small numbers and very skewed distributions. Two things likely to lead to dominance problems are when you have low frequencies in (1) very small geographical areas (2) for business data, industry groups with very small and very large companies included.
Learn the rules for your data (again)
Some data collectors require formal checks for dominance, others require you to use your judgement - make sure you know what you are expected to do.
Alternatives to suppression
Suppressing cells may be a crude response to risk. There are alternatives; as a researcher, you know which might be most appropriate.
Suppressing direct identifiers (e.g. names)
One option is to hide information surrounding the data. In the example used above the problem is that the school name and county are identified; if these could be hidden, that would simplify the problem immensely. However, be careful about assuming direct identifiers can be suppressed effectively - how do you know that another report on the data has not listed it as one of the schools studied?
Table redesign in magnitude tables
As a researcher, the most relevant to you is to consider whether the table could be redesigned - for example, by collapsing categories in Example 12, leading to Example 13.

26
Other options Other methods developed by statisticians concerned about re-identification are ways of rounding, or adding noise to table cells. More information on these can be found in the reference material, but these are generally less useful for researchers.
Section 6.6 Protection of graphs
How do we deal with graphs?
Graphs should be considered as if they were tables, but presented in a different format. Hence, you should apply the same rule to each point on a graph or image as if it was a cell in a table. Consider Example 14, below, which is a typical box plot which SPSS might produce.
Westerly Northill TotalTurnover £m
19,215 8,917 12,167 40,299
Investment£m
263 69 87 419
Employment 4,707 2,449 3,358 10,514
Example 13 - Table RedesignBusiness Activity in Central Regions
Newt. & Midb.

27
Highlighting extreme values in graphs
This shows mean and ranges of earnings distributions by different types of education. However, it also highlights specific values; in this case, the wages of the highest earner amongst respondents with university-level qualifications. This is a single data point with some information allowing the identification of that person, and so we would be very cautious about publishing it.
Section 6.7 Safe and unsafe statistics
SDC in general For researchers, tables are only a part of published outputs. You are more likely to be publishing complex analyses such as odds ratios, regressions, survival functions, and so on. We need to introduce the concept of 'safe' and 'unsafe' statistics.
'Safe statistics' Outputs can be classified as either 'safe' or 'unsafe' statistics. This depends upon the mathematical form of the statistics, not the data.
Defining a 'safe' statistic
'Safe' statistics are those where there is very little inherent risk; for example, regression coefficients. Generally, you can publish these without further restrictions or checks. Complex multivariate or graphical analyses are usually 'safe' statistics.
Defining an 'unsafe' statistic
In contrast, 'unsafe' statistics generally present a high disclosure risk. All linear combinations of variables (such as tables of frequencies or totals, percentiles, or simple indexes) are 'unsafe', as are regression residuals, minima and maxima.
What can you publish?
In general, you can publish 'safe' statistics without restriction; however, for 'unsafe' statistics you should check to make sure that the specific instance is safe for publication.
Publishing an 'unsafe' statistic
Consider publishing deciles of a wage distribution. These are 'unsafe'. To publish them, you should be confident that the specific data you are using does not present a disclosure risk. This does not mean that a different breakdown of the same data is automatically acceptable. The choice of whether to publish an 'unsafe' statistic is always specific to the particular case.
The safe statistics decision tree
The decision tree shows how to decide whether something can be published or not.

28
Section 6.8 Dealing with unsafe statistics
Many observations
Having many observations is the best way to reduce the risk of disclosure, for both frequency and magnitude tables. It won't hurt the statistical qualities of your other outputs as well.
Limiting the output
Modern statistical software produces a lot of output. For example, the 'sum, detail' command in Stata produces lots of detail on maxima, minima, individual percentiles, boundaries etc. If you just copied this output into a published document (for example, as an appendix) this could cause significant problems. Any likely scenario is that you publish multiple tabulations of the same data, with different missing cells. It may be worth considering whether the output you are producing is strictly necessary.
Presenting things differently
It may be worth considering whether the data could be transformed in some way - for example, by converting levels into ratios.
Know your data!
The best protection against inadvertently breaching confidentiality is to know the structure of your data! This is particularly true when dealing with skewed distributions and potential dominance problems. Again, this contributes to good statistical practice, not just SDC.
Section 6.9 Software support
Available software
There are two software programmes that might be worth considering if you are producing repeated output or have a very complicated set of tables: tau-Argus (a stand-alone program) and sdcTable (this is an R module). Both are open-source and designed to simplify the production of very large, repeated or multiple tables.
29
When they are appropriate
Both programs offer the same basic functionality, but differ in the way they integrate with other code. In general, these programs require a substantial amount of information to explain how a table is set up. This is worthwhile when producing tables in three cases: very large complex multi-dimensional ones; multiple linked tables (where the data in one table is presented in a different format in another); and when producing a lot of similar or identical tables. They are however of limited value for researchers, who tend to produce different tables with each analysis.
Section 6.10 Summary of SDC
The purpose of SDC
SDC is designed to prevent you from disclosing information on an individual or a business in your publications. By being familiar with the principles of SDC you should reduce the chance of mistakes.
Are we worrying too much?
Is this realistic? Is it likely that your published results could breach confidentiality? The answer is 'not likely, but possible' because we know it has happened. However, breaches from published outputs are very rare, particularly from researchers. This is because researchers are more likely to produce 'safe' statistics such as multivariate analyses, and limit their production of 'unsafe' statistics to, for example, some summary descriptive statistics before the main analysis starts.
Mistakes This manual aims to prevent mistakes and to raise awareness about confidentiality issues. Mistakes can still occur. It's in all our interest to acknowledge them and deal with them. If you discover any mistake, please always inform the support team.
In summary SDC for researchers is an ongoing research topic - see the references below. However, most of the relevant ideas are straightforward and common-sense. Moreover, good SDC is often aligned with good statistical practice: for example, cells with few observations or one dominant observation tell you very little about empirical patterns. In short, good SDC on outputs is very rarely burdensome for genuine research outputs.

30
Module 7 How can you help?
Section 7.1 Reminder: use the 'five safes' to consider your behaviour
Projects Stick to what you've agreed; if you want to change anything contact the support team early. They will inform you how to proceed. Some modifications are possible within the project, for some others a new project is necessary.
Settings (distributed data)
Make sure that the data are used under the right settings. In case of questions, please consult the data manager or contact person in your institution.
Settings (distributed access – safe centre)
Follow the operating rules; if they don't work, suggest changes to the support team. Most operating environments change over time. Your input can be very helpful in making sure changes are positive.
Data Assume that the data is easily identifiable. It may not be easy in practice, but it keeps you cautious.
Outputs As an absolute minimum follow the SDC guidelines given above and follow the guidelines for publication attached to the data. You may also want to read the recommended papers below. If in doubt, your support team will be pleased to guide you.
People Be sensible. As an experiment, imagine the research data you have received contain your own individual record. Each research team member is fully responsible for protection of the data. Accidents may still happen but owning up to a mistake is better than being discovered covering one up.
In short Accept that some restrictions are the price you pay for privileged access to detailed data - 'privileged' because not everyone is allowed to use this data.
Section 7.2 When to contact the support team
Handling mistakes
Mistakes happen! What matters is how we deal with them. And if you have done something wrong, confess before it gets discovered. The support team will be grateful, because they can pro-actively manage the response, rather than reacting to a crisis.
Making changes
If any aspect of your project changes (who, what, why, for how long), talk to the support team - don't assume 'it will be all right'. It probably will be, but it's better to check before.
Closing the project
At the end of the research project inform the support team about publications issued using the research data and destroy the original data as indicated in the relevant agreements.
General feedback
The support team need input from you to see how the access environment can be improved. If it's not working efficiently, tell them constructively - can you see a way to make things better?

31
Big message of the course
Maintaining access to confidential data for research is an effort of all parties involved.
32
Module 8 Reference material
Section 8.1 Introduction
The reference section
The reference section contains information on the legal background to data access and pointers to specific SDC rules for particular datasets. The test going with this self-study material will also require you to look through the reference section and the linked documents.
Section 8.2 Legal background
Key regulations
The current regulation covering research access (and which is referenced in the test) is Commission Regulation (EU) No 557/2013 on access to confidential data for scientific purposes. This is the regulation covering research access to data. As a relatively modern piece of legislation, it reflects many of the principles discussed in the course, and it formalises the evidence-based, risk-managed approach to data access.
Background regulations
Background regulations are: Regulation (EC) No 223/2009 of the European Parliament and of the Council (general information on the production of European statistics, including the principles of access to data for research) and Regulation (EC) No 45/2001 of the European Parliament and of the Council. The latter covers the use of personal data, and includes many of the definitions necessary. Gaining researcher access to data does not mean you only need to abide by the access agreements; you also need to meet the requirements of this regulation for ‘fair and lawful’ processing. Sticking to your access agreement should ensure this is the case.
Section 8.3 Statistical guidance on disclosure control
Guidelines for output checking
For generalised output SDC, you should read: Brandt M., Franconi L., Guerke C., Hundepool A., Lucarelli M., Mol J., Ritchie F., Seri G. and Welpton R., Guidelines for Output Checking. These are the current Eurostat best-practice guidelines on SDC for outputs generally. It contains guidelines for a wide variety of statistical output, not just tables. It is written for data access managers rather than researchers, but the rules should be clear. Note the document discusses both the rules-based approach to SDC and the principles-based; unless you have been trained in the latter, you should take the guidelines specified as hard rules to be followed.
Handbook on SDC
Extensive detail on tabular output, and intruder models, can be found in: Hundepool A., Domingo-Ferrer J., Franconi L., Giessing S., Lenz R., Naylor J., Schulte Nordholt E., Seri G., de Wolf P-P., Handbook on Statistical Disclosure Control. This is the definitive guide to protection of tables, including alternative methods of dealing with unsafe cells. Researchers should be aware that it is technically complex, and that it takes the ‘intruder model’ as its starting point; hence the statements made are very cautious. Nevertheless, it provides extensive detail on the pros and cons of different tabular protection measures. If you are having difficulty producing tables that do not breach confidentiality rules, you may find

33
the answer in here.
Guidelines for publication
Eurostat produces dataset-specific guidelines for publication. This may contain, for example: country-specific restrictions, such as no sub-national breakdowns for very small countries; thresholds or dominance rules (values of n, k, p) for producing tables; or information on the dataset quality. This information is supplied with the dataset and should not be circulated outside your research team.
Feedback We welcome feedback on this training material. Please email your comments to [email protected]