Self Driving Vehicles and Transport Forecasting Futura October13
29
FORECASTING THE IMPACT OF SELF-DRIVING-CARS What to do about them in our models and forecasts
-
Upload
luis-willumsen -
Category
Business
-
view
290 -
download
0
Transcript of Self Driving Vehicles and Transport Forecasting Futura October13
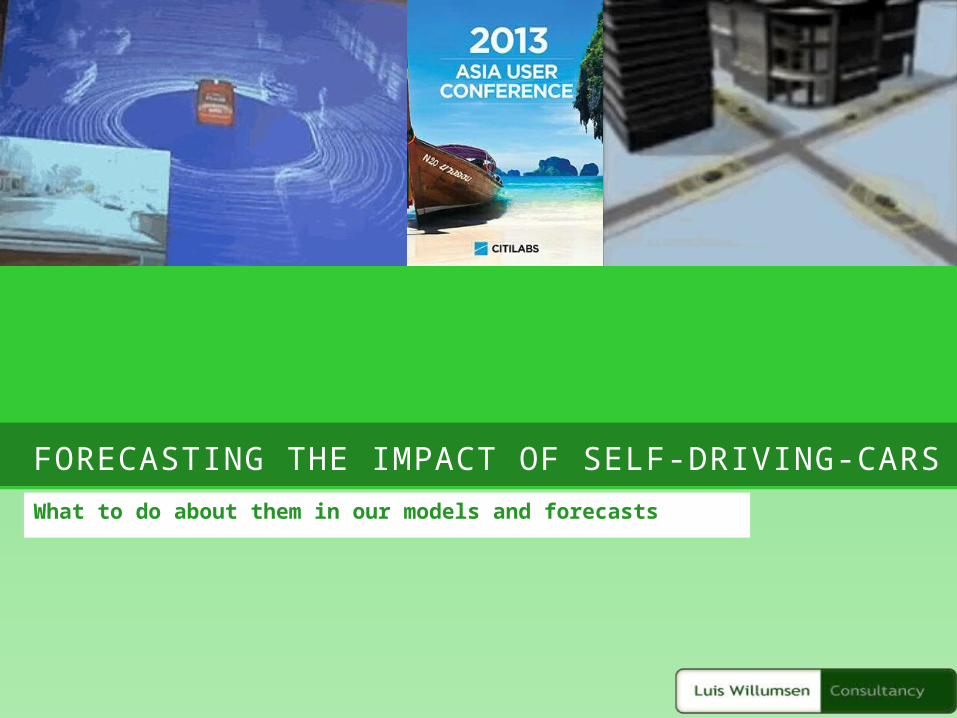
FORECASTING THE IMPACT OF SELF-DRIVING-CARSWhat to do about them in our models and forecasts

MO
TIVATION
Motivation
Cars have been cars for quite a long time We know how to model assignment, capacities, traffic
management Mode choice between car and other modes is reasonably
well known Public Transport policies are known (and stable)
It became clear during 2013 that we will be facing a new disruptive technology in the Self Driving Car or Autonomous Vehicles
THE D
ESIGN
OF CARS
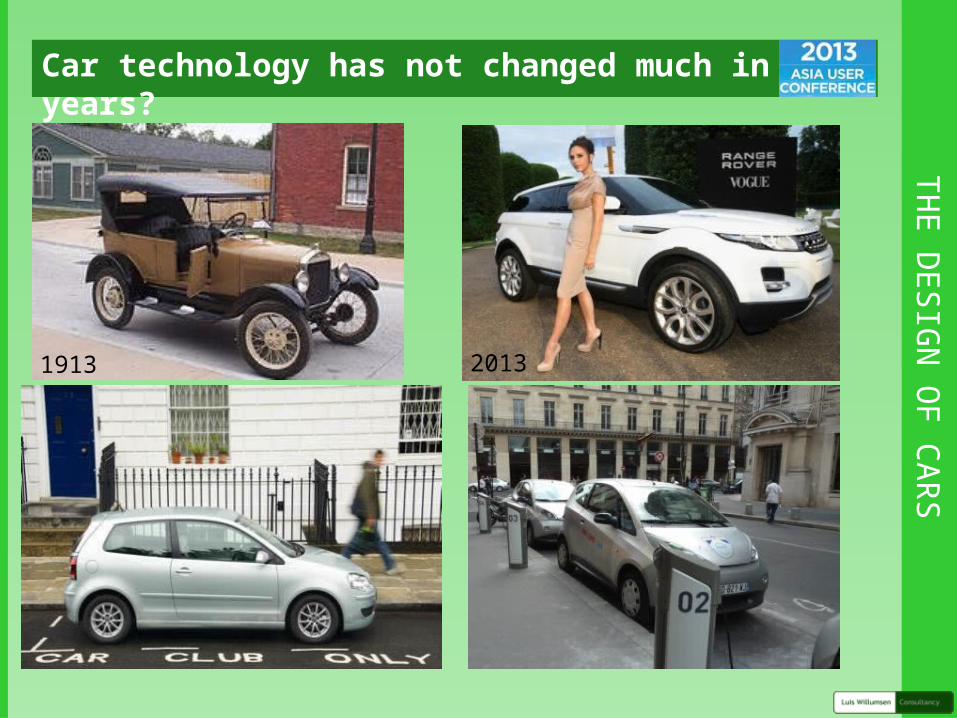
Car technology has not changed much in 100 years?
1913 2013
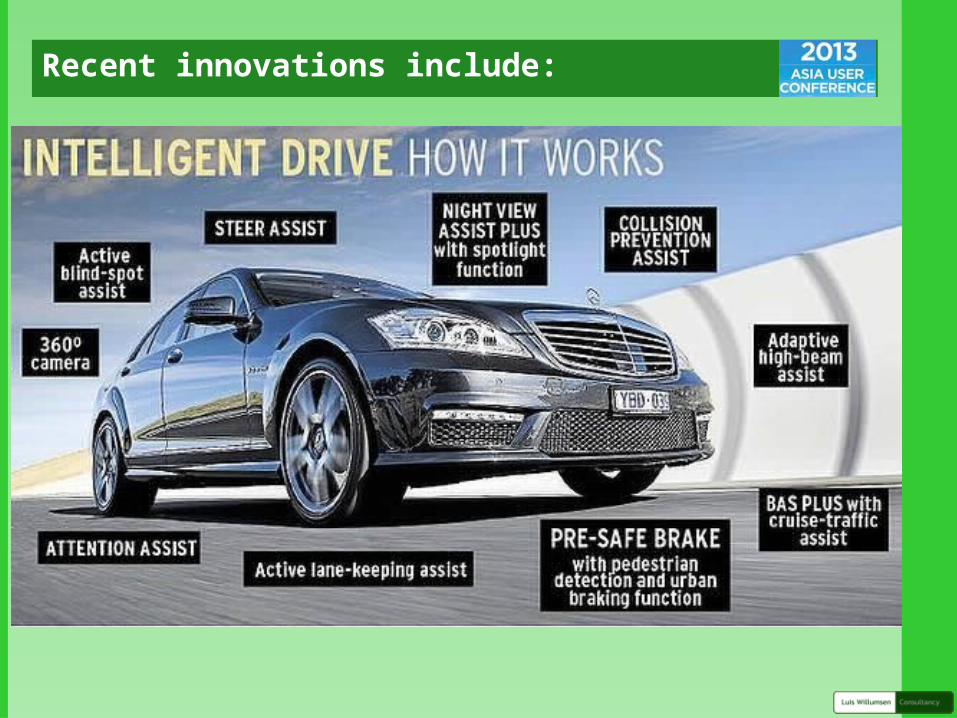
Recent innovations include:

DREAM
ING
ABOU
T THE FU
TURE
The unrealised dream

Origins
Autonomous vehicles have been a dream solution for some time
Japan (starting in 1977), Germany (Ernst Dickmanns and VaMP), Italy (the ARGO Project), European Union (EUREKA Prometheus Project), In the United States of America the main driver was military
The Defense Advanced Research Projects Agency (DARPA) launched in 2004 a challenge to complete a 150 mile off-road route: $ 1 and then $2 million
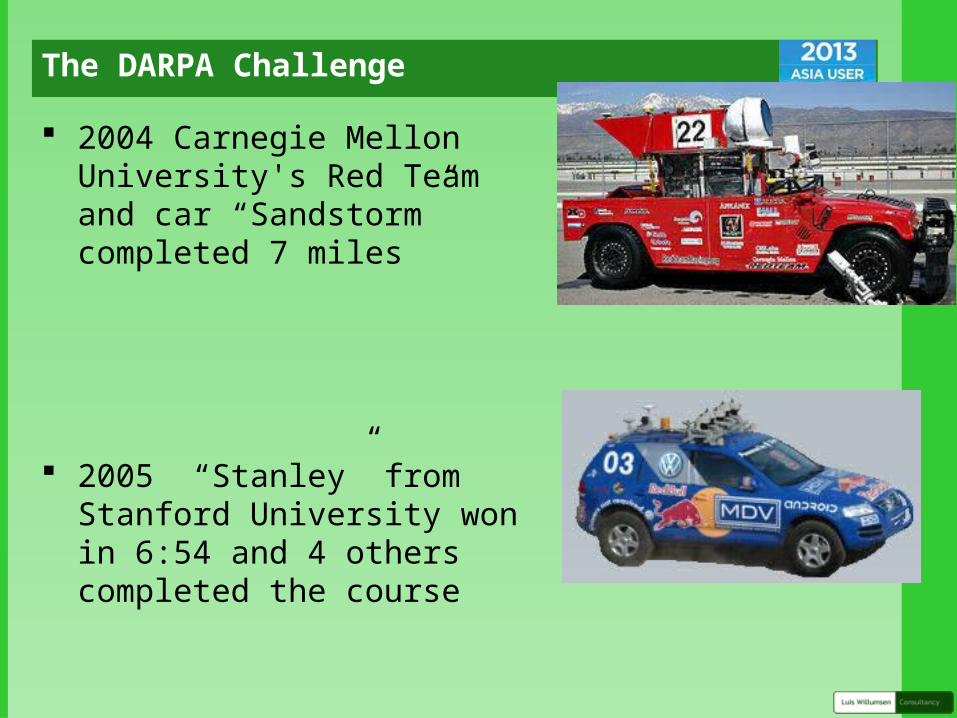
The DARPA Challenge
2004 Carnegie Mellon University's Red Team and car “Sandstorm” completed 7 miles
2005 “Stanley” from Stanford University won in 6:54 and 4 others completed the course
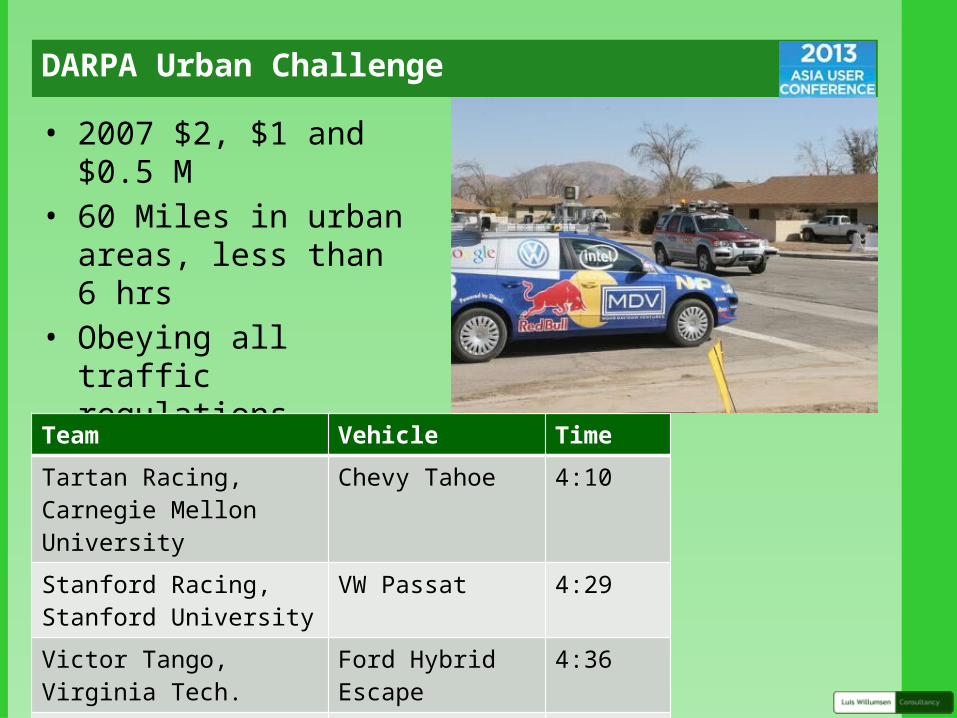
DARPA Urban Challenge
• 2007 $2, $1 and $0.5 M• 60 Miles in urban areas,
less than 6 hrs• Obeying all traffic
regulations
Team Vehicle Time
Tartan Racing, Carnegie Mellon University
Chevy Tahoe 4:10
Stanford Racing, Stanford University
VW Passat 4:29
Victor Tango, Virginia Tech. Ford Hybrid Escape 4:36
7 other teams finished the course
6 hours +

U.S. National Highway Traffic Safety Administration (NHTSA)
Defined Vehicle Automation levelsLevel 1 – Function-specific Automation: e.g. cruise control, lane guidance and automated parallel parking. Level 2 - Combined Function Automation: e.g. adaptive cruise control with lane centering. Drivers are responsible for monitoring the roadway. Level 3 - Limited Self-Driving Automation: Drivers can cede all safety-critical functions under certain conditions and rely on the vehicle to monitor for changes in those conditions that will require transition back to driver control. Level 4 - Full Self-Driving Automation: Vehicles can perform all driving functions and monitor roadway conditions for an entire trip, and so may operate with occupants who cannot drive and without human occupants.

GO
OG
LEAutonomous, self-driving-vehicles are coming!

360 VISION
360° vision and perception
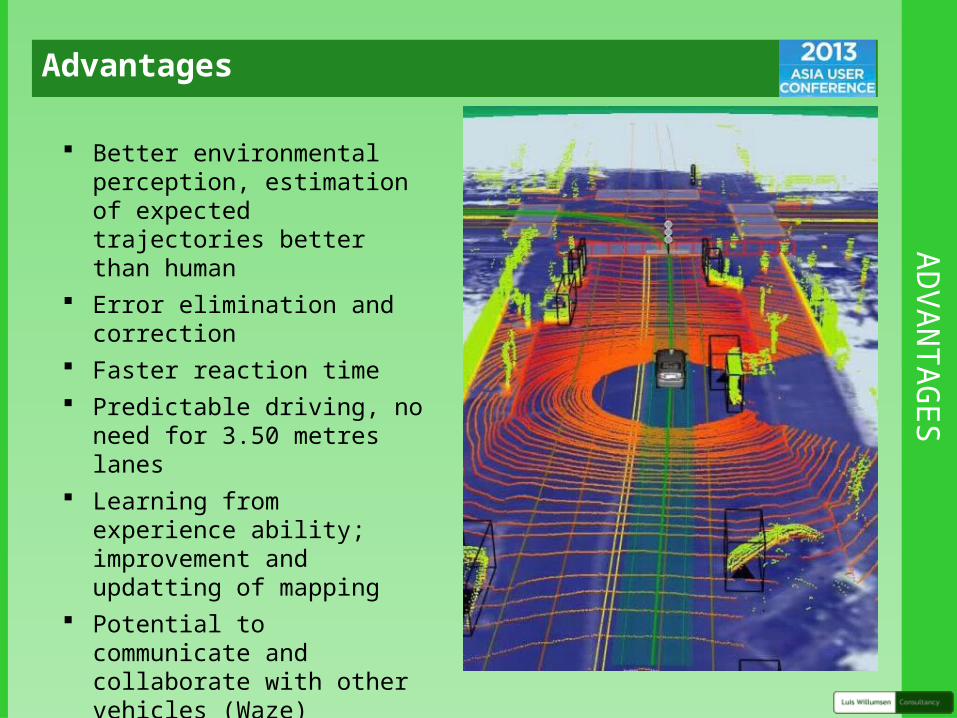
ADVANTAG
ESAdvantages
Better environmental perception, estimation of expected trajectories better than human
Error elimination and correction Faster reaction time Predictable driving, no need for
3.50 metres lanes Learning from experience ability;
improvement and updatting of mapping
Potential to communicate and collaborate with other vehicles (Waze)
No need to own it Civil responsibilty, insurance Changes in legislation

BMW
There are many initiatives under way e.g. BMW

AUD
I VOLKSW
AGEN
Audi

PLATOO
NS
Volvo
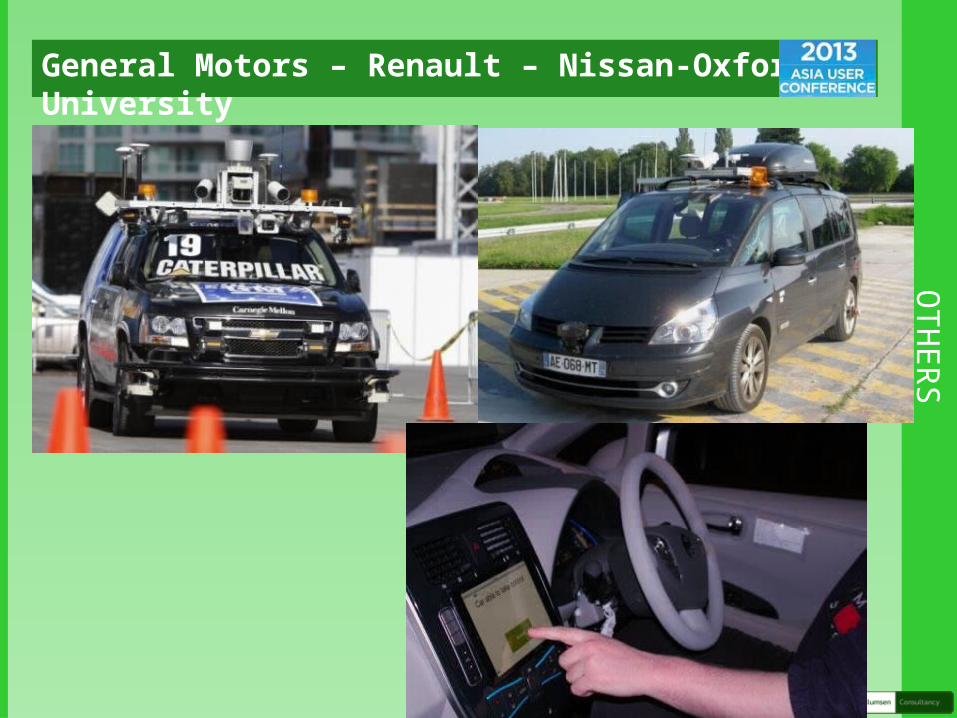
OTH
ERSGeneral Motors – Renault – Nissan-Oxford University
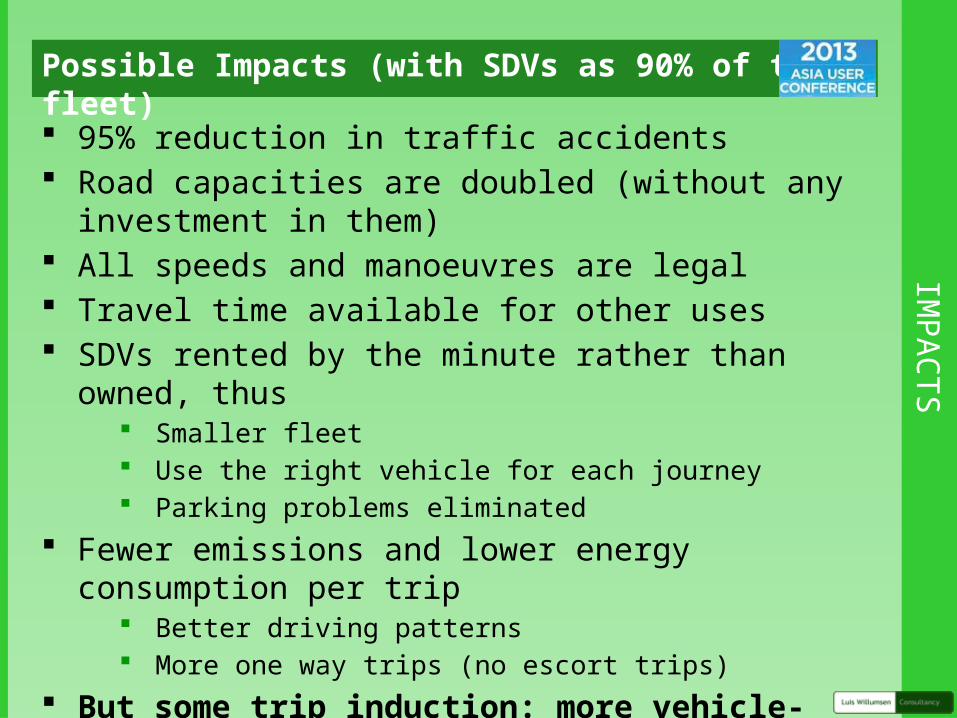
IMPACTS
Possible Impacts (with SDVs as 90% of the fleet)
95% reduction in traffic accidents Road capacities are doubled (without any investment in
them) All speeds and manoeuvres are legal Travel time available for other uses SDVs rented by the minute rather than owned, thus
Smaller fleet Use the right vehicle for each journey Parking problems eliminated
Fewer emissions and lower energy consumption per trip Better driving patterns More one way trips (no escort trips)
But some trip induction: more vehicle-miles

CON
GESTIO
N EFFECTS
Impact on roads
Highway Capacity Benefits from Using Vehicle-to-Vehicle Communication and Sensors for Collision Avoidance, by Patcharinee Tientrakool, Ya-Chi Ho, and Nicholas F. Maxemchuk from Columbia University

CON
GESTIO
N EFFECTS
Impact on roads
Highway Capacity Benefits from Using Vehicle-to-Vehicle Communication and Sensors for Collision Avoidance, by Patcharinee Tientrakool, Ya-Chi Ho, and Nicholas F. Maxemchuk from Columbia University

2018? 2020? 2025?How soon?
• When available at the showrooms?• How expensive?• Would we buy or rent them, or prefer to drive ourselves?
• When are we going to feel the impact on our roads?• How will they affect our Transport Plans?• Public Transport Modes?• Toll Roads?• Policies?
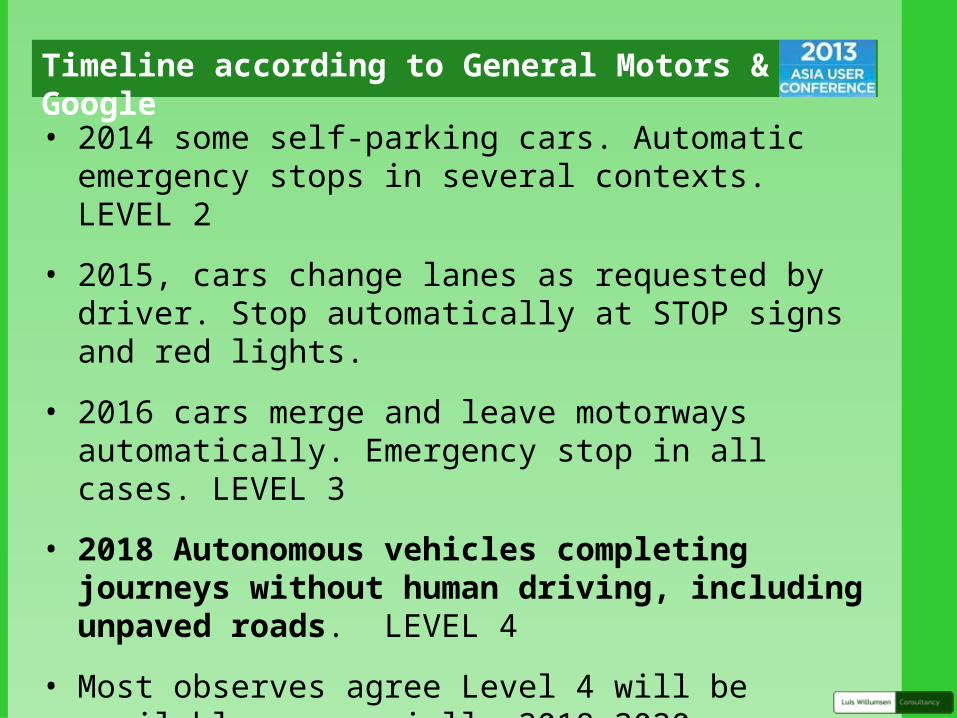
Timeline according to General Motors & Google
• 2014 some self-parking cars. Automatic emergency stops in several contexts. LEVEL 2
• 2015, cars change lanes as requested by driver. Stop automatically at STOP signs and red lights.
• 2016 cars merge and leave motorways automatically. Emergency stop in all cases. LEVEL 3
• 2018 Autonomous vehicles completing journeys without human driving, including unpaved roads. LEVEL 4
• Most observes agree Level 4 will be available commercially 2018-2020.

NAVIG
ANT RESEARCH
Recent Research Report on SDVs Navigant Research
Level 4 commercially available by 2020
SDVs will be 4% of fleet by 2025
Compound Annual Growth Rate 2025-2030 for main markets:
North America, Western Europe and Asia Pacific = 85%
Market penetration 41% in 2030 and 75% in 2035

NAVIG
ANT RESEARCH
Recent Research Report on SDVs Navigant Research

UN
IVERSITY OF TEXAS AT AU
STINENO Center for Transportation
Fagnant, D. and Kockelman, K. (2013) Preparing the Nation for Autonomous Vehicles; Opportunities, Barriers and Policy Recommendations.
https://www.enotrans.org/store/research-papers/preparing-a-nation-for-autonomous-vehicles-opportunities-barriers-and-policy-recommendations

UN
IVERSITY OF TEXAS AT AU
STINENO Center Report
Accepts estimate of incremental costs reducing from $10,000 to $3,000 in a few years
Very significant savings in accidents and their cost Reduced congestion: doubling capacity at 90% penetration Expect vehicle sharing, car clubs, short term rentals: each SDV
to replace 4-5 cars Induced traffic will increase Vehicle Miles Travelled up to 37%
off-setting fuel/emission savings off-peak Benefits also to non-SDVs (smoothing traffic, following SDV)
CBA for US market 10% 50% 90%
Additional cost for SDVs $ 10,000 $ 5,000 $ 3,000
Net discounted annual benefits $ per SDV $12,590 $ 23,070 $ 33,200
CIBGESTIO
N &
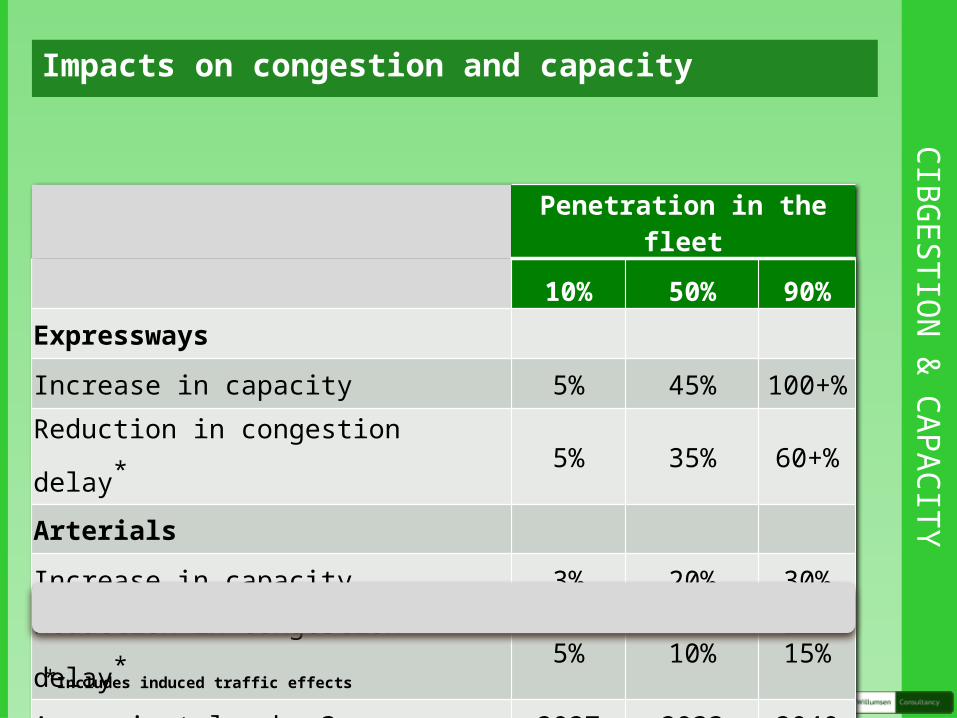
CAPACITYImpacts on congestion and capacity
Penetration in the fleet
10% 50% 90%Expressways
Increase in capacity 5% 45% 100+%
Reduction in congestion delay* 5% 35% 60+%
Arterials
Increase in capacity 3% 20% 30%
Reduction in congestion delay* 5% 10% 15%
Approximately when? 2027 2033 2040
*Includes induced traffic effects

LIKE THEM
?Apparently we are happy to use them: CISCO

Discussion topic: how do we incorporate SDV in our forecasts?
We can no longer ignore them if planning horizon is 10+ years
At least a source of uncertainty and part of Risk Analysis Assumptions about freeway capacity enhancements
10% a 2025? 50% a 2033? 100% a 2040?
Impact on Public Transport services and subsidies; which buses will survive? Would they become driver-less?
Sell any shares in Taxi and Limousine companies and consider divesting in rural and low frequency bus

Thanks … let’s discuss what we think we should do in our forecasts